the Creative Commons Attribution 4.0 License.
the Creative Commons Attribution 4.0 License.
 | 13 Jun 2024
A new multimethod approach for dating cave calcite: application to the cave of Trou du Renard (Soyons, France)
Julius Nouet
Arnaud Dapoigny
Gaëlle Barbotin
Fanny Claverie
Edwige Pons-Branchu
Jocelyn Barbarand
Christophe Pécheyran
Norbert Mercier
Fanny Derym
Bernard Gély
Hélène Valladas
A multimethod approach aimed at characterizing carbonate parietal deposits and at proposing a chronology for these carbonate crusts is described. Dating was performed by radiometric methods (C-14 for recent samples and U series) on samples that had been characterized beforehand using optical and cathodoluminescence microscopy and Fourier transform infrared microspectroscopy. For the U series, high precision on U–Th ages was achieved using liquid phase multicollector inductively coupled plasma mass spectrometry (ICP-MS) applied to large samples, while laser ablation single collector inductively coupled plasma sector field mass spectrometry (ICP-SFMS) provided information on the reliability of the sampling with a high spatial resolution. This methodology, based on the combination of these two techniques reinforced by the information obtained by the calcite characterization methods, was applied to carbonate deposits from the cave of Trou du Renard (Soyons, France). The ages obtained with the two U–Th dating techniques are comparable and illustrate that different laminae were deposited at different rates in the samples. In the future, this procedure, based on the mineralogical and geochemical characterization of the samples and their dating by radiometric methods, will be applied to the layers of parietal carbonates deposited on Palaeolithic decorated walls. When the crystallization is slow, the dating method by imaging technique is of interest, as well as that by multicollector ICP-MS in liquid phase. The development of robust dating methods on very small quantities of material will make it possible to define the chronological framework of cave rock art.
- Article
(10344 KB) - Full-text XML
- BibTeX
- EndNote


Establishing the chronology of cave art is a fundamental objective of studies on the cultural evolution of past societies. In Western Europe, and particularly in France, decorated caves are abundant, but most of them have yielded figures consisting of engravings or made with metal oxides that cannot be dated directly. Nevertheless, the fact that many decorations are covered with carbonate deposits that can be dated by radiometric methods opens a new field of investigation for research on cave art, since these deposits can, if they are not too old, be dated by the 14C method (Sanchidrian et al., 2017) but also by the U series method (Pike et al., 2012; Aubert et al., 2014; Hoffmann et al., 2017), as well as by a combination of the two (Valladas et al., 2017). However, with the U series method, the main difficulty lies in the possible opening of the geochemical system in the event of detrital contamination by the surrounding sediments during the carbonate formation or in the event of carbonate alteration accompanied by leaching of uranium (Perrin et al., 2014; Scholz et al., 2014; Pons-Branchu et al., 2020). In order to evaluate these phenomena that can affect carbonate deposits, and hence the U–Th ages, our objective here was to set up an experimental procedure combining different characterization and dating methods. We first tested this procedure on a cavity without any decorated elements where sampling could not deteriorate rock art.
The procedure must necessarily consider two important points. First, in the context of prehistoric cave art, which is subject to preservation imperatives, it is necessary to be able to minimize the impact of the study, and therefore to optimize the sampling, while seeking to obtain a maximum amount of information. Second, to ensure the reliability of the results, it is important to assess the geological and archaeological context, which requires knowledge of the nature of the carbonate mineral and its evolution over time. For this purpose, we undertook petrographic analysis, including optical and cathodoluminescence (CL) microscopy and Fourier transform infrared microspectroscopy (μ-FTIR).
To test the relevance of this approach, we sampled two fragments of carbonate covering the wall of the Pillar Room in the Trou du Renard cave (Caves of Soyons, France) and a fistula fragment from the same room. First, the petrography of each sample was determined. Second, quantitative multielement mapping, using a femtosecond laser ablation system coupled to a single collector sector field inductively coupled plasma mass spectrometry (fsLA–single collector–ICP-SFMS), was carried out. High spatial and temporal resolutions were achieved on several samples and subsamples, thus improving the understanding of calcite deposition on the cave walls. Subsequently, the carbonate samples were dated by the U series disequilibrium method (U–Th) using two techniques: (1) liquid phase multicollector ICP-MS (Liq-MC-ICP-MS) on dissolved and purified samples (following Pons-Branchu et al., 2020) and (2) a more recent approach based on U series disequilibrium imaging, using fsLA–single collector–ICP-SFMS (following Martin et al., 2022). The 14C dating method, using the accelerator mass spectrometry (AMS) technique, was also used for the most recent sample. This experimental procedure, combining the characterization of the nature of the carbonate itself and of its constitution, made it possible to obtain information on its temporal evolution to compare the dating results and to discuss their reliability. This approach thus highlights the contribution of each method, as well as the advantage offered by their combination.
2.1 From the sampling in situ to sample processing
The Trou du Renard cave, located in the southeast of France in the middle part and on the right bank of the Rhône valley, is composed of two main galleries: the double-borne network, where all the studied samples were taken from, and the Ursus network. It is part of a Jurassic Kimmeridgian karstic network presenting six other caves, including the Moula-Guercy cave (Cailhol and Audra, 2013), which is well known for the unearthing of the remains of cannibalized Neanderthals (Defleur et al., 1999). Although no human remains were found in the Trou du Renard cave, Palaeolithic fauna remains are present, as well as two Mousterian flint flakes discovered in the Ursus network (Argant, 2010).
Three calcite samples from the Trou du Renard cave were analysed. The first sample (SOY19-01) is a fistula fragment that fell naturally from the ceiling of the Pillar Room between 2009 and 2010 (Fig. 1a). The second and third samples, designated SOY19-02 and SOY19-03, respectively, are carbonate layers deposited on the wall of the Pillar Room. The sampling site corresponds to a place in the wall that is partially broken, where work has been undertaken to join a lower gallery (Fig. 1b). Sample SOY19-02 fell easily to the ground during sampling. Sample SOY19-03 was manually detached from the wall using a small electric saw, right next to the position of SOY-19-02. Given the proximity of these two samples (SOY19-02 and SOY19-03), they can be considered to represent the same depositional levels, and in each of them, two carbonate layers separated by a clay film were distinguished. The resulting subsamples were then designated as SOY19-02 Exo and SOY19-03 Exo for the external parts (surface side) and SOY19-02 Endo and SOY19-03 Endo for the internal part (Fig. 1c). We decided to concentrate our efforts on a single sample and to perform most of our investigations on SOY19-02 and only a few on SOY19-03 in order to compare the respective characteristics of the two samples. Sample SOY19-01 and the two subsamples of SOY19-02 were then split into several pieces to allow for the different analyses.
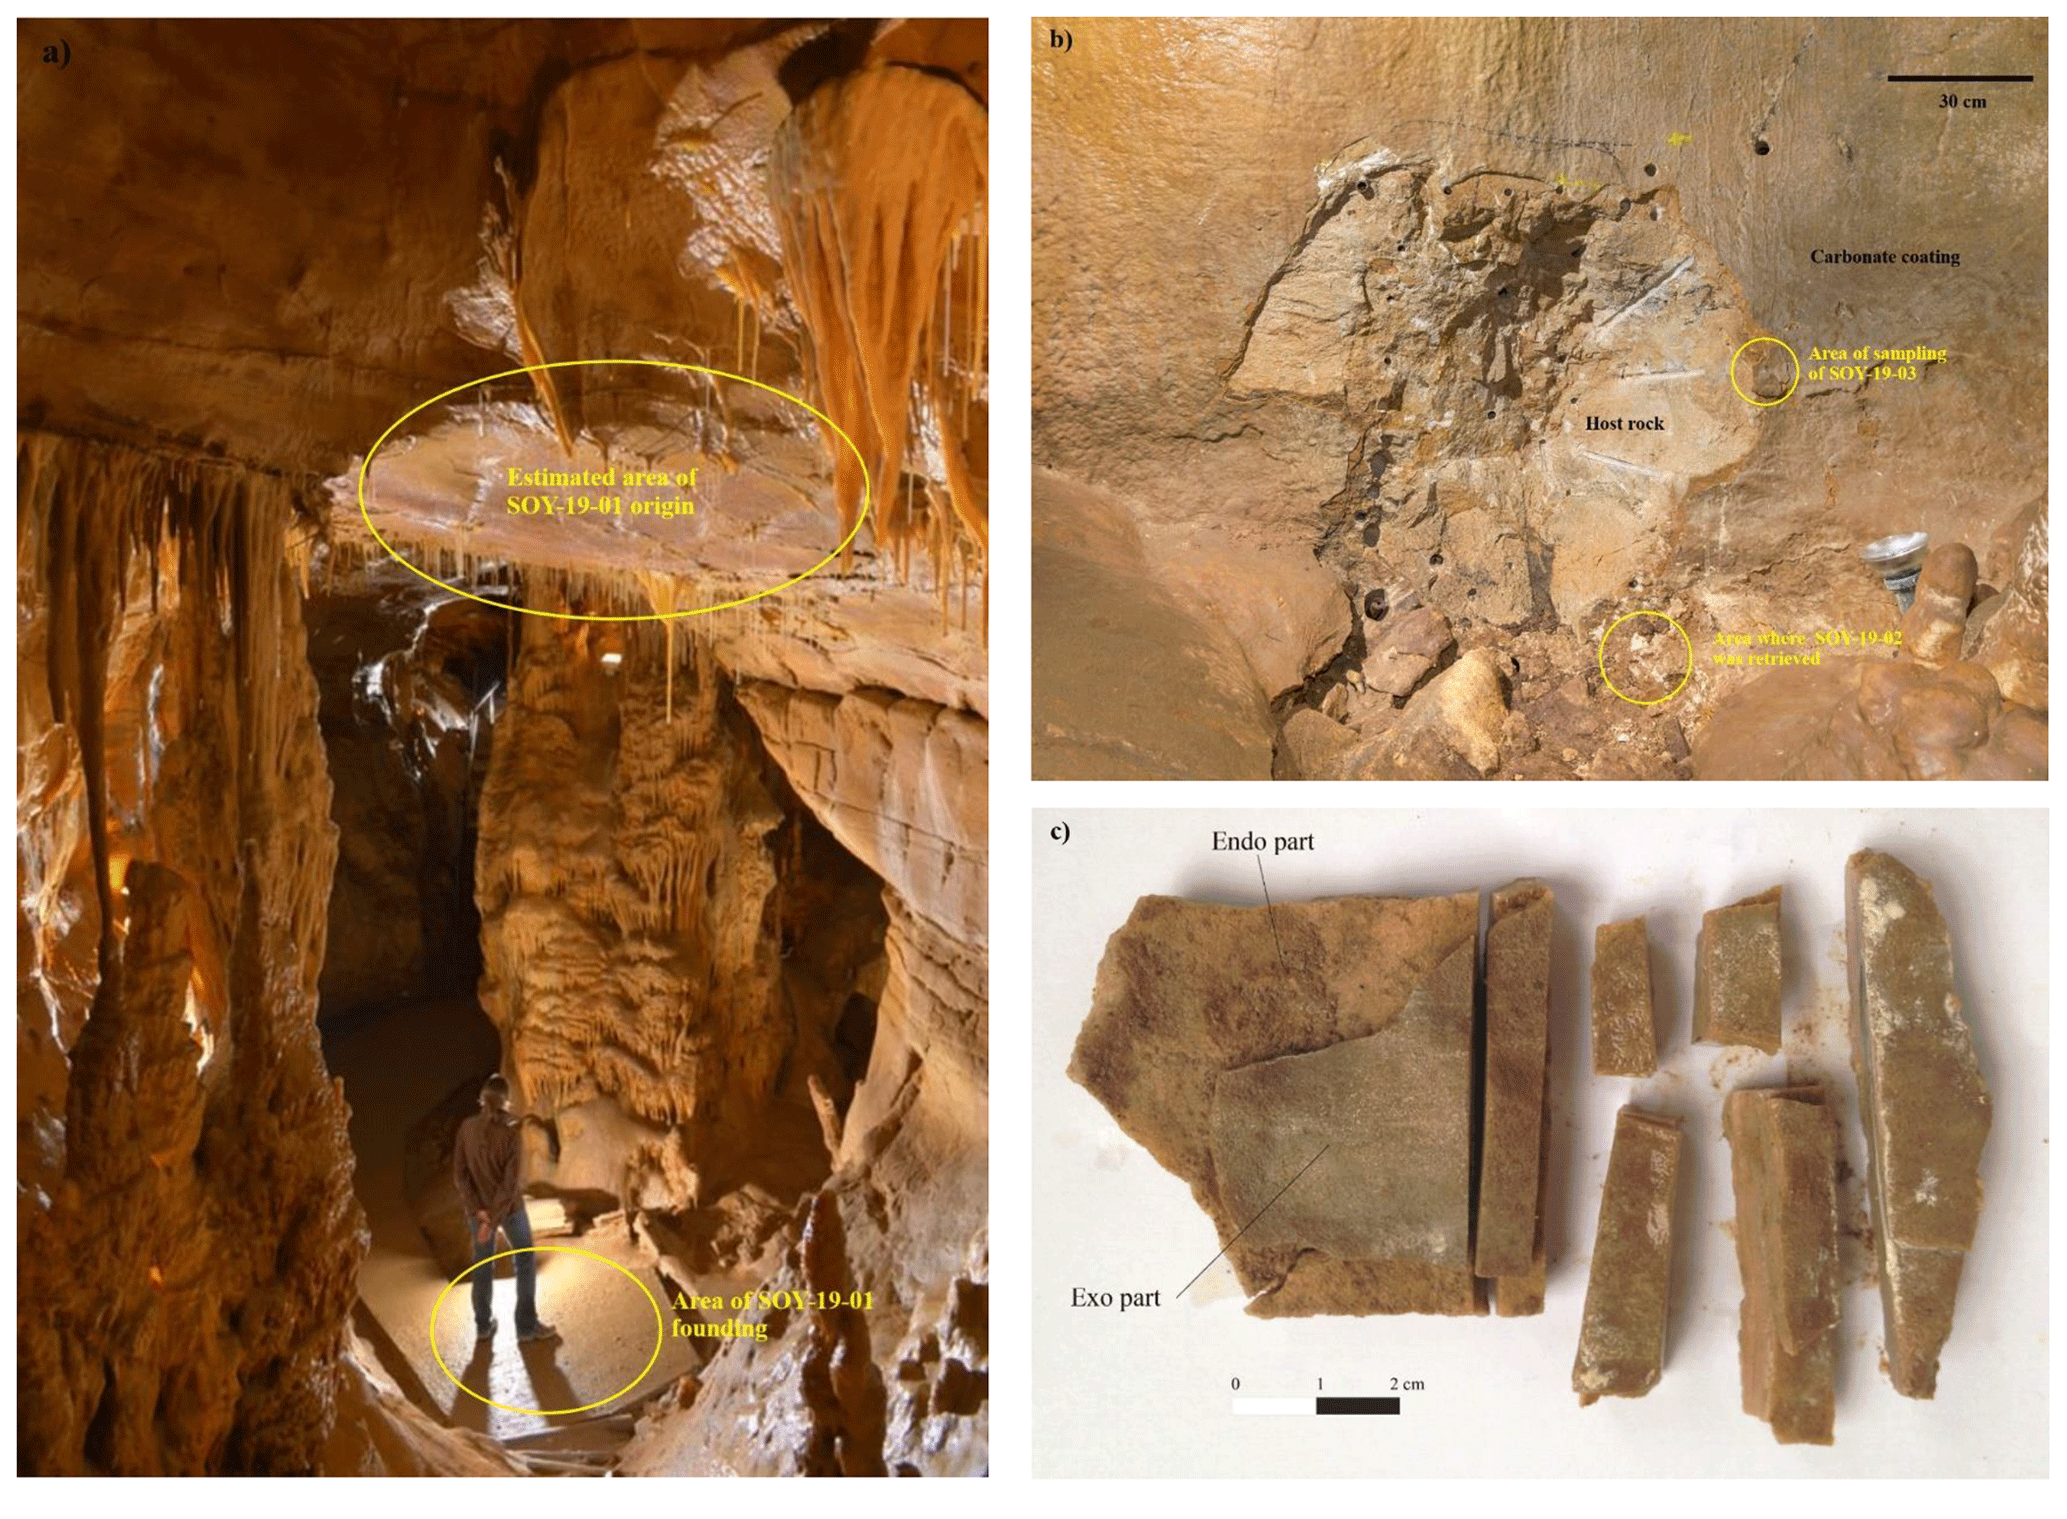
Figure 1Samples SOY-19-02 and SOY-19-03. View of the area where SOY-19-01 was found (photographs by Damien Butaeye; a). View of the sampling area of SOY-19-02 and SOY-19-03 (b). Preparation of sample SOY-19-02 for analyses. The white line indicates the limit between the Endo and Exo parts (c).
2.2 Petrographic analysis
Each sample was prepared for the realization of thin slides and epoxy resin blocks. Slides were observed by optical and cathodoluminescence microscopy, while resin blocks were used for Fourier transform infrared (FTIR) imaging after polishing. Microscopic images of the samples were acquired using a Leica microscope under plane-polarized light (PPL) at a magnification of ×25. Cathodoluminescence (CL) imaging was carried out using a NewTec cold-cathode system operating at ∼ 10 kV and ∼ 250 µA coupled to a BX41 Olympus microscope at a magnification of ×25. The images were modified using retouching software to enhance the contrast and colour.
FTIR images were acquired using a Spotlight 400 FTIR imaging system coupled with a Frontier IR spectrometer, both from PerkinElmer, in reflection mode on polished surfaces. Rapid scans of SOY19-02 and SOY19-03 confirmed the high similarity between these samples. High-resolution FTIR scans of the subsamples Endo and Exo of SOY19-02 were then performed. Four absorption bands are observable in carbonates: a broad high-intensity band (1500–1400 cm−1), two broad medium-intensity bands (1100–1000 and 900–800 cm−1), and a very weak absorption band near 700 cm−1 (Andersen and Brečević, 1992). The band at 900–800 cm−1 is called v2 and the band near 700 cm−1 is called v4. The v4 band and the band at 1500–1400 cm−1 are split into two smaller bands. The position of the v2 band distinguishes the different carbonate minerals, namely calcite (874–878 cm−1), aragonite (853–859 cm−1), dolomite (881 cm−1), and magnesite (887 cm−1) (Huang and Kerr, 1960; Andersen and Brečević, 1992, and references therein). The position of these bands is indicative as the data produced in this study correspond to reflection bands.
2.3 Mapping of elements
After petrographic analysis, the resin block samples were recut to fit the femtosecond laser ablation cell, and the sections were polished in order to obtain a flat surface for ablation. Elemental mappings via 238U, 232Th, 27Al, 24Mg, and 43Ca isotopes were obtained using high repetition rate 257 nm UV femtosecond laser ablation (Lambda 3, Nexeya SA/Amplitude System, Bordeaux, France) coupled to a single collector sector field inductively coupled plasma mass spectrometry (ICP-MS) fitted with a jet interface (Element XR™, Thermo Fisher Scientific™). The samples were ablated at a repetition rate of 1000 shots per second, using a combination of two simultaneous movements: on the one hand, a vertical back-and-forth laser beam movement of 50 µm at a speed of 1 mm s−1 provided by two galvanometric scanners fitted into the laser machine, and on the other hand, the movement of the x–y stage supporting the sample consisting of successive lines with 50 µm spacing at a speed of 50 µm s−1. The number of counts per mass was read per cycle of 1 s, resulting in a final reconstructed image of 50 µm square pixels. Image sizes ranged from 5.5 to 8.4 mm, and each took from 4 to 6 h for measurement. 238U was mapped in order to investigate the uranium distribution in the samples, while 232Th mapping was used to evaluate the potential detrital correction that needed to be applied to U series disequilibrium dating. The 27Al and 24Mg elements were considered to be proxies for clay or sediment deposit in the samples. 43Ca was measured as the proxy for carbonate in the sample.
2.4 U–Th dating methodology
2.4.1 Liq-MC-ICP-MS
The complete protocol used to prepare the samples, measure isotopic ratios and calculate ages is described in Pons-Branchu et al. (2014). Subsamples of SOY19-01 and SOY19-02 Exo and Endo were cut in the laboratory, using a rotary microsaw. The Endo and Exo parts were separated manually and their surface cleaned to remove clay deposits. Two samples (int and ext, respectively, corresponding to the first third and to the last third of the sample starting from the centre; see Fig. B1) were extracted from SOY 19-01 and two (Endo 1 and Endo 2, respectively, corresponding to the first third and to the last third of the sample starting from the base; see Fig. B2) from the SOY 19-02 Endo sample. A piece of SOY19-02 Exo, containing all the microlayers that are highlighted by the imaging methods, was retained without further subsampling and will be referred to as SOY19-02 Exo “bulk” in the results. The different subsamples were weighed (between 68 and 167 mg) in perfluoroalkoxy (PFA; Teflon™) beakers, where a known amount of 229Th–236U spike calibrated against the HU-1 uraninite assumed to be at secular equilibrium had been previously added. Then the separation of U and Th fractions was performed on UTEVA resin in nitric media. The isotopic ratios were measured with a Thermo Scientific™ NEPTUNE™ Plus fitted with a jet pump interface and an Aridus II desolvating system.
2.4.2 fsLA–single collector–ICP-SFMS
The resin indurated samples were used for direct U–Th dating by high-sensitivity and high-resolution fsLA–single collector–ICP-SFMS mapping of 238U, 234U, 230Th, and 232Th. The details of the dating protocol are described in Martin et al. (2022). Mappings of SOY19-01, SOY19-02 Endo, and SOY19-02 Exo were performed with sizes of 5.4×1.35, 4.2×4.8, and 2.79×3.3 mm2, respectively. This corresponds to a sample mass of approximately 1 to 3 mg per mapping. A 10 µm laser beam diameter delivered at a repetition rate of 1 kHz was continuously and rapidly moved (1 mm s−1), according to a vertical back-and-forth movement of 40 µm, while the sample was moved horizontally at a speed of 50 µm s−1, resulting in 50 µm wide ablation lines. The accumulated counts were read every 1 s. This resulted in mappings with a resolution of 50 µm in both x and y directions. Each mapping includes the measurement of a blank for 30 min before and after sample ablation. A high-resolution ICP-MS (Element XR, Thermo Fisher Scientific™) fitted with the jet interface was used for detection. The laser was coupled to the ICP-MS in a wet plasma configuration by means of a modified three-inlet cyclonic spray chamber that allows the dry aerosol from the ablation cell to be mixed axially upstream of the injector with the wet aerosol from the nebulization. The third inlet, tangential to the position of the nebulizer, was used to introduce a 10 mL nitrogen flow into the argon stream to obtain the best performance from the jet interface option. During ablation, a solution containing 2 % HNO3 diluted in ultrapure water was nebulized in the spray chamber, while during the mass bias calibration procedure, the laser was stopped, and the U standard solution (USS) was nebulized in the spray chamber. The fsLA–single collector–ICP-SFMS coupling was tuned daily with a National Institute of Standards and Technology (NIST) 612 glass sample in order to obtain the best sensitivity while ensuring complete atomization of the particles. This was achieved by checking that the value of the ratio measured on the NIST 612 corresponded to the reference value of 1.00 ± 0.05 at 95 % confidence level. As laser ablation is less efficient on glass than on calcite, it is assumed that the elemental fractionation was also negligible during calcite ablation. This stoichiometric detection of U and Th was checked prior to each image acquisition. fsLA allows the use of liquid standard for calibration. A USS of 0.02 µg L−1 was used for the calibration of the measurement. It was prepared from Institute for Reference Materials and Measurements (IRMM) 184 (Geel, Belgium) in 2 % HNO3 (ULTREX™, Baker) diluted in ultrapure water (Milli-Q, Millipore) with 0.1 % CaCO3 (Suprapur, Merck KGaA, Darmstadt, Germany). This solution contained a certified isotope ratio of (7.2631 ± 0.0011) × 10−3 at 95 % confidence level (Richter et al., 2022) and was used to correct mass bias. fractionation was tested with fsLA and found to be negligible (Martin et al., 2022). Spatial variations in 238U content and ratio were used to define several regions of interest (ROIs) on the SOY19-02 mappings, potentially corresponding to different periods of calcification. The isotope ratios used for U–Th dating were calculated for each of the ROIs.
2.4.3 Detrital corrections
Two approaches were used for U–Th age corrections. The first one was based on an a priori activity ratio for the detrital fraction, which is here an activity ratio of 1.50 ± 0.75 at 95 % confidence level. This value of 1.50 has been identified as the median value for the ()A0 of the detrital phase for the dating of speleothems (Hellstrom et al., 2006) and is a commonly used value for speleothem age correction (Martín-García., 2019; Genuite et al., 2022; Pons-Branchu et al., 2022). The second approach was used for the results obtained using fsLA–single collector–ICP-SFMS. Since this method enables several ages to be obtained on the same section, with clear stratigraphic positions, the corrected ages can be modelled using stratigraphic constraints; i.e. a large range of values for the detrital fraction is tested for age corrections, and the model keeps those that give ages in stratigraphic order after correction. Here we used the STRUTages routine (Roy-Barman and Pons-Branchu, 2016). The STRUTages routine consists of a script, available from their supplementary material in the initial article, that can be used with GNU Octave freeware (http://www.gnu.org/software/octave/, last access: 20 June 2023). Basically, this routine combines stratigraphical constraints as proposed by Hellstrom 2006 and coevality constraints as in the isochronal approach but without requiring a single ()A0 initial. This method tests a large range of corrections (Monte Carlo simulation) for detrital thorium and gives the best estimate of the initial ratio and the corrected age of each sample. With this routine, the variability in the )A0 can be fixed (details of the parameters fixed for the studied samples are given under the table of results).
2.5 14C dating
A subsample of SOY-19-01 of about 10 mg was taken using a rotating microsaw for 14C analysis. It was hydrolysed with H3PO4 to obtain CO2 and converted to graphite (Dumoulin et al., 2017) for measurement at the Artemis AMS French National facility (CEA Saclay, LMC14; Moreau et al., 2020). Carbon isotope ratios were corrected for isotopic fractionation, based on δ13C values measured on the AMS, following international recommendations (Mook and van der Plicht, 1999). The 14C results were calibrated using IntCal20 (Reimer et al., 2020), with no correction for the proportion of dead carbon (DCP) and with corrections for different DCP (5 %, 10 % and 20 %, which represents the common range of DCP within speleothems; see Table 2), following Sanchidrián et al. (2017). They are presented in Table 2.
3.1 Petrography and mapping results
The section of the fistula shows a radial structure with two homogeneous crystallization domains, namely a central dark domain and a peripheral main domain consisting of successive layers of carbonate (Appendix A; Fig. A1). The passage between the two domains is marked in CL by a red band, while the rest of the sample is non-luminescent. The mineralogy is homogeneous, with a position of the v2 band characteristic of poorly crystallized (full width at half-maximum, where FWHM > 10 cm−1) calcite (875–878 cm−1).
The carbonate levels sampled for SOY-19-02 and SOY-19-03 consist of thin layers that appear very dark under optical microscopy, alternating in places and mainly in the outer part with layers made of larger crystals (Fig. 2a and A2a; Appendix A). The growth is quite regular and shows well-developed carbonate veils. The CL image shows a high degree of homogeneity for the Endo sample, with luminescence in the blue hues characteristic of low-luminescent carbonates. The luminescence is more variable for the Exo subsample, showing some more luminescent levels, mainly towards the outside, with a red luminescent hue. These levels are relatively continuous and can be interpreted as the consequences of a change in the water chemistry or the incorporation of trace elements into the carbonates, such as Mn, which is the main activator of carbonate luminescence (Machel et al., 1991).
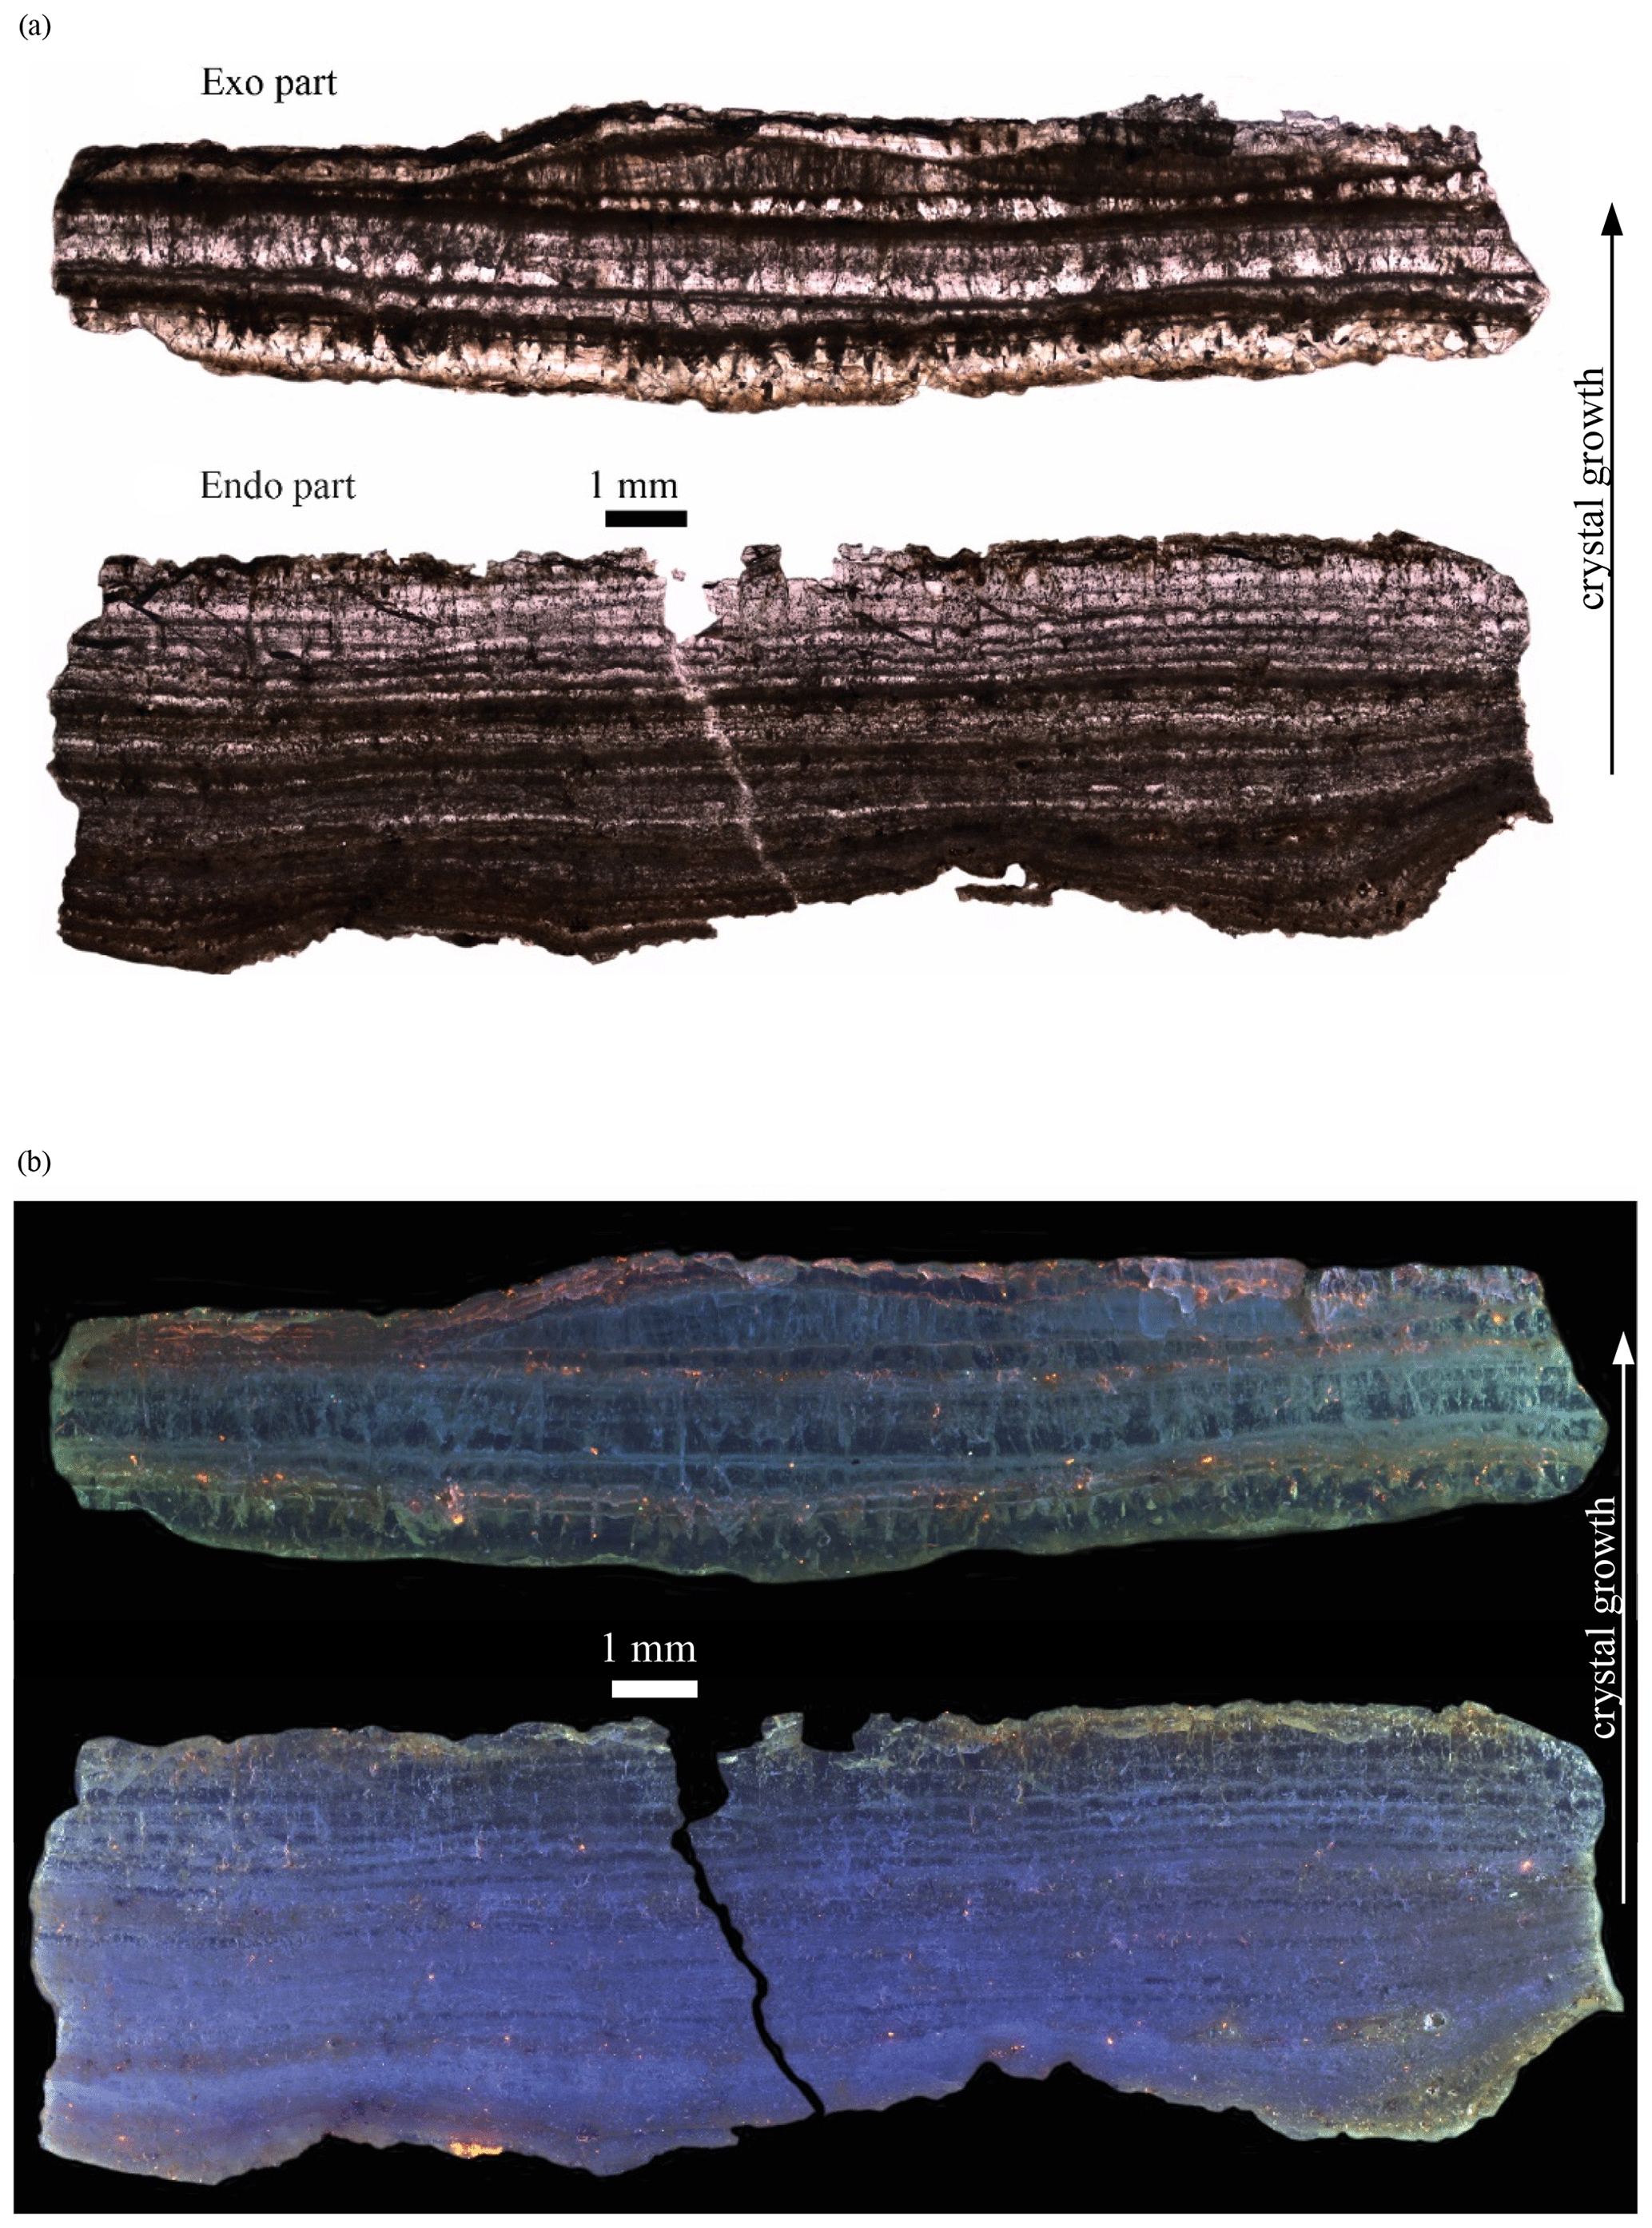
Figure 2Images of the SOY-19-02 sample in optical PPL microscopy (a) and CL microscopy (b). Magnification is ×25.
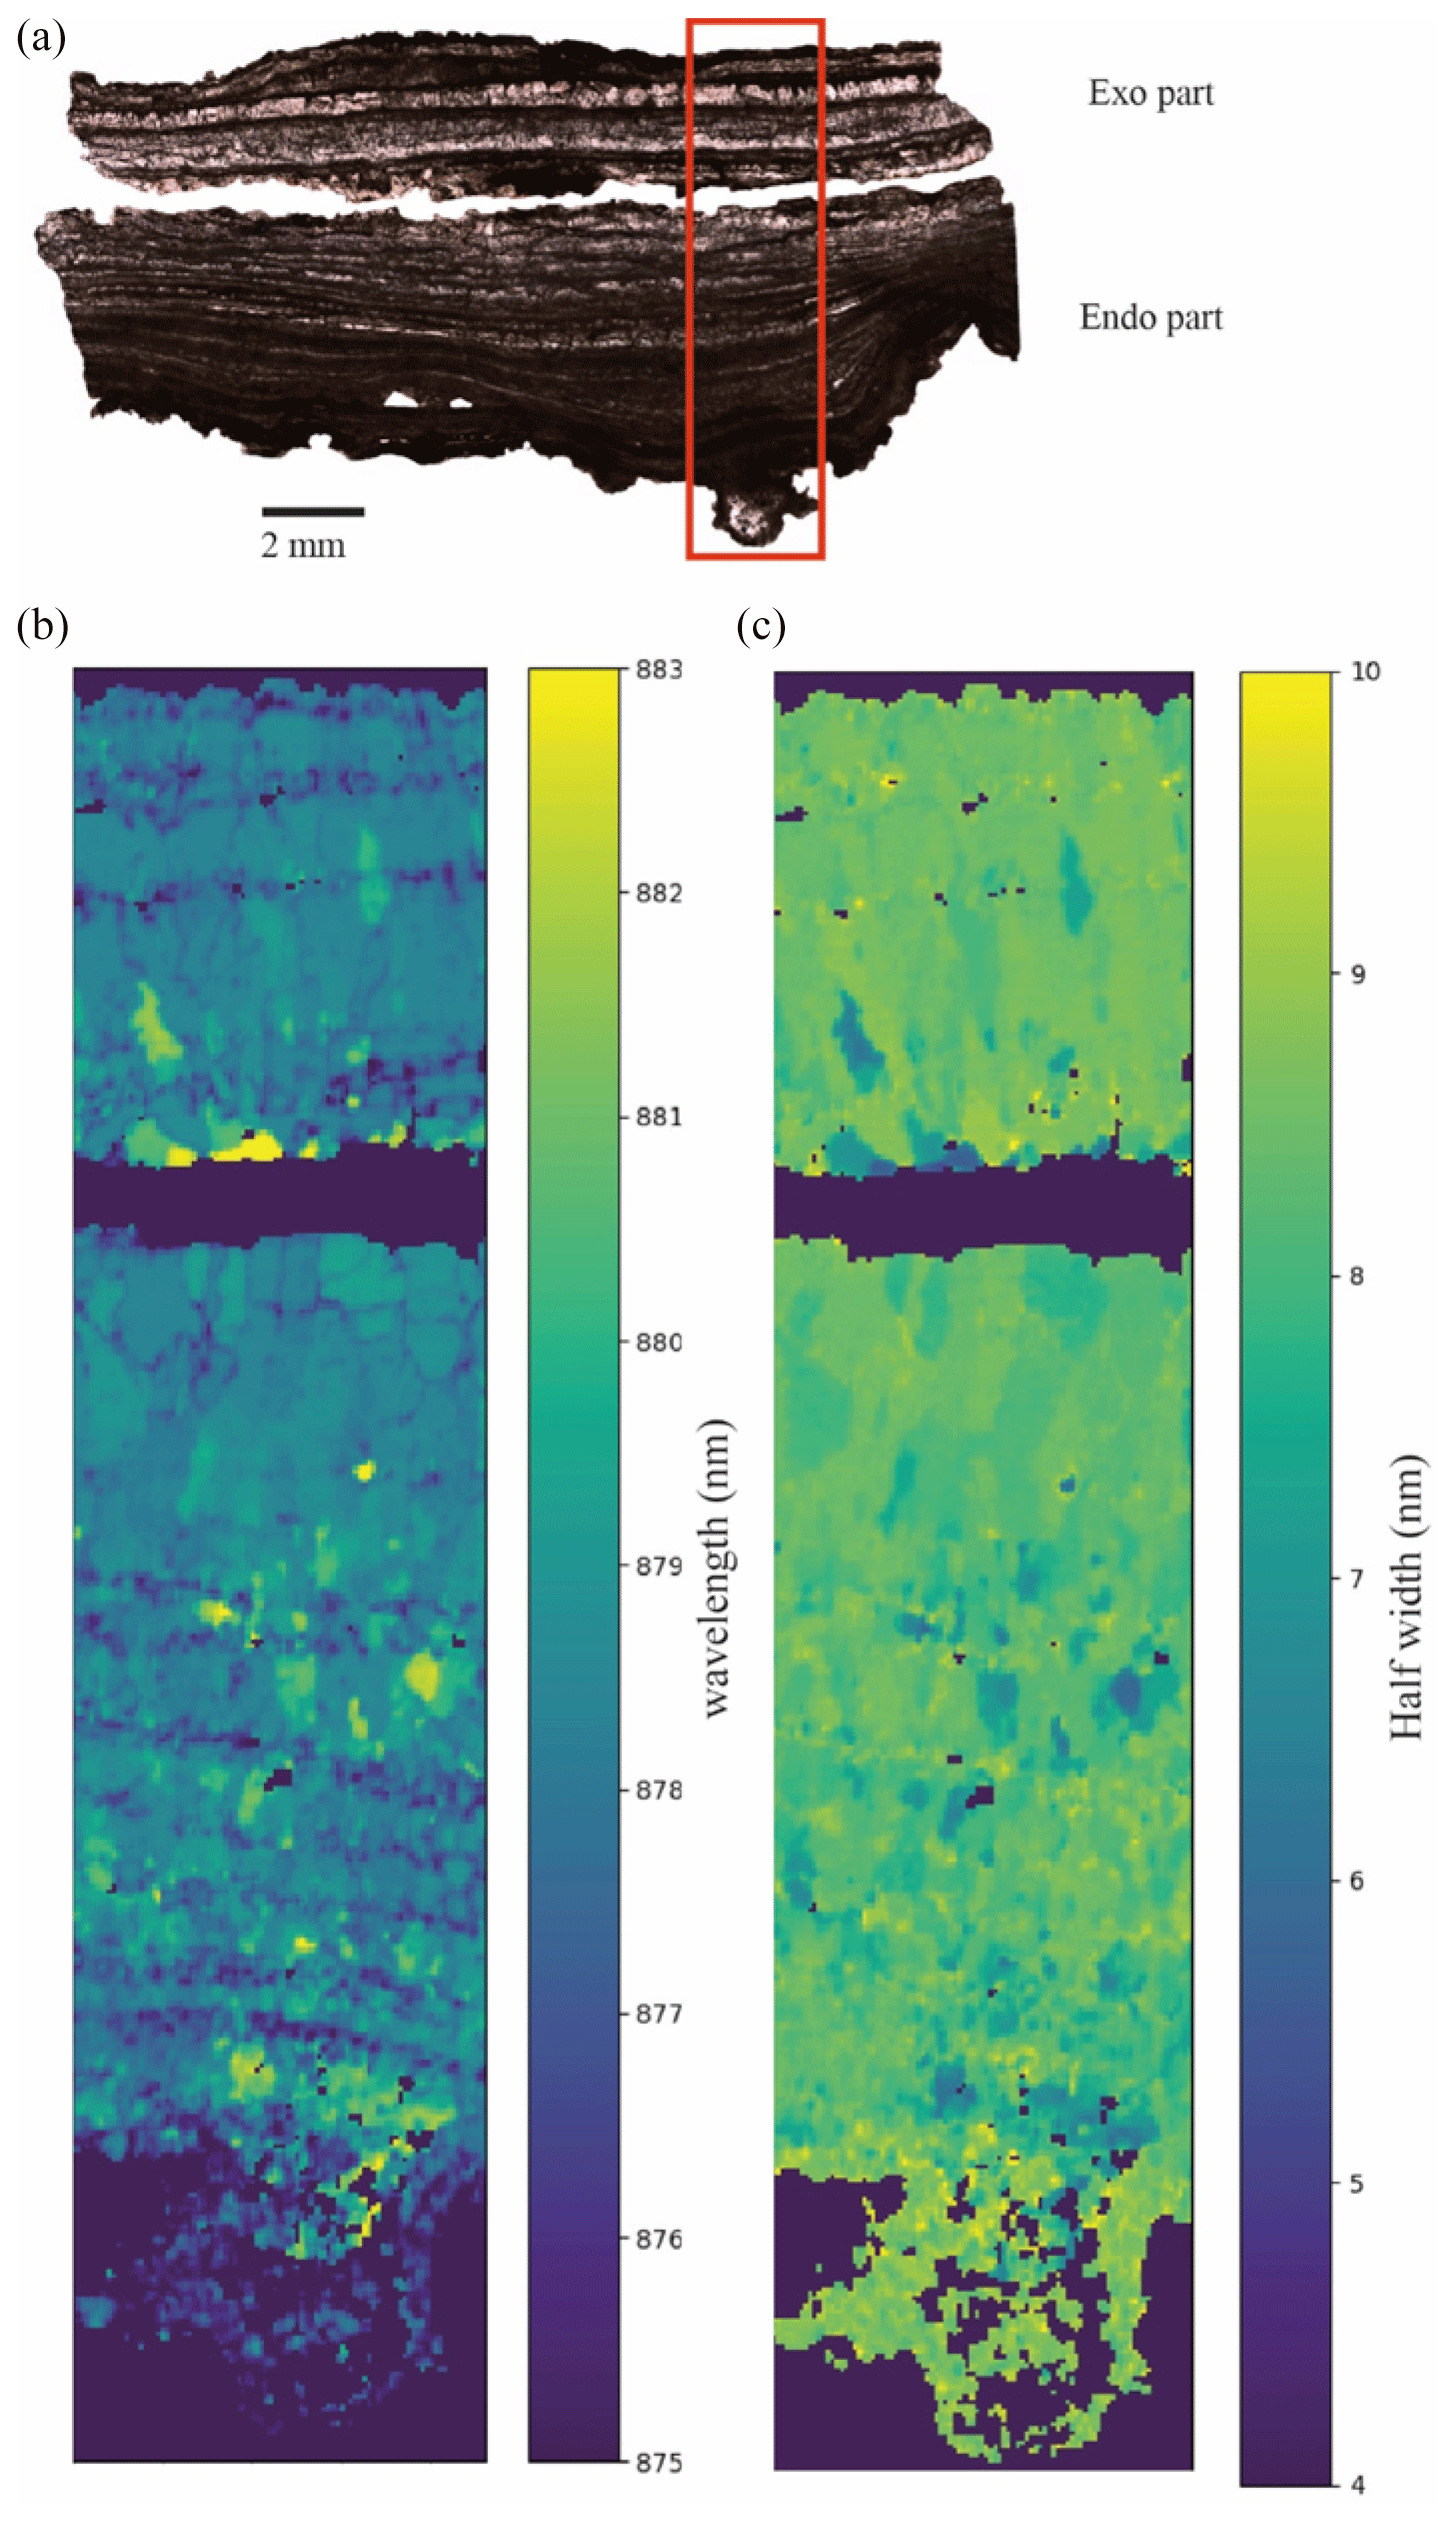
Figure 3FTIR analysis of SOY-19-03. The position of the v2 band is represented in panel (b), while the full width at half-maximum of the v2 band is in panel (c). The Exo part is in panel (a).
The FTIR image shows that most of the sample is very homogeneous and consists of calcite crystals (v2 band between 876 and 880 cm−1) which are well crystallized (FWHM < 10 cm−1) (Fig. 3). Some minor components show a different FTIR signal with a higher wavenumber, especially at the interface between the Endo and Exo subsamples (Fig. 3). This difference in spectroscopic signatures may be linked to divalent cation substitution. A similar but larger displacement of the v2 band is indeed interpreted as an increase in substituted Mg along the solid solution between calcite, dolomite, and magnesite (Huang and Kerr, 1960).
A large Al- and Mg-rich zone is noticeable at the root of SOY19-02 Endo (at the top of the images) on the fsLA–single collector–ICP-SFMS mappings, which corresponds to a piece of the limestone host rock mixed with calcite deposit. Apart from this basal part, the fsLA–single collector–ICP-SFMS mappings of SOY19-02 Endo indicate a significantly more homogeneous distribution of the chemical elements investigated (24Mg, 27Al, 238U, 232Th, and 43Ca) than SOY19-02 Exo, which shows standard deviations between pixel values that are 1.3 to 3 times higher than SOY19-02 Endo (Fig. 4). The mappings highlight the more pronounced presence of detrital layers between the calcite layers in SOY19-02 Exo, identified in particular by higher Al and Mg contents. The 238U and 232Th values show a good correlation with the presence of detrital layers. This was confirmed by the additional measurement of uranium and thorium isotopes required for U–Th dating and was considered by correcting the ages from the detrital 230Th fraction (Table 1; Fig. 6).
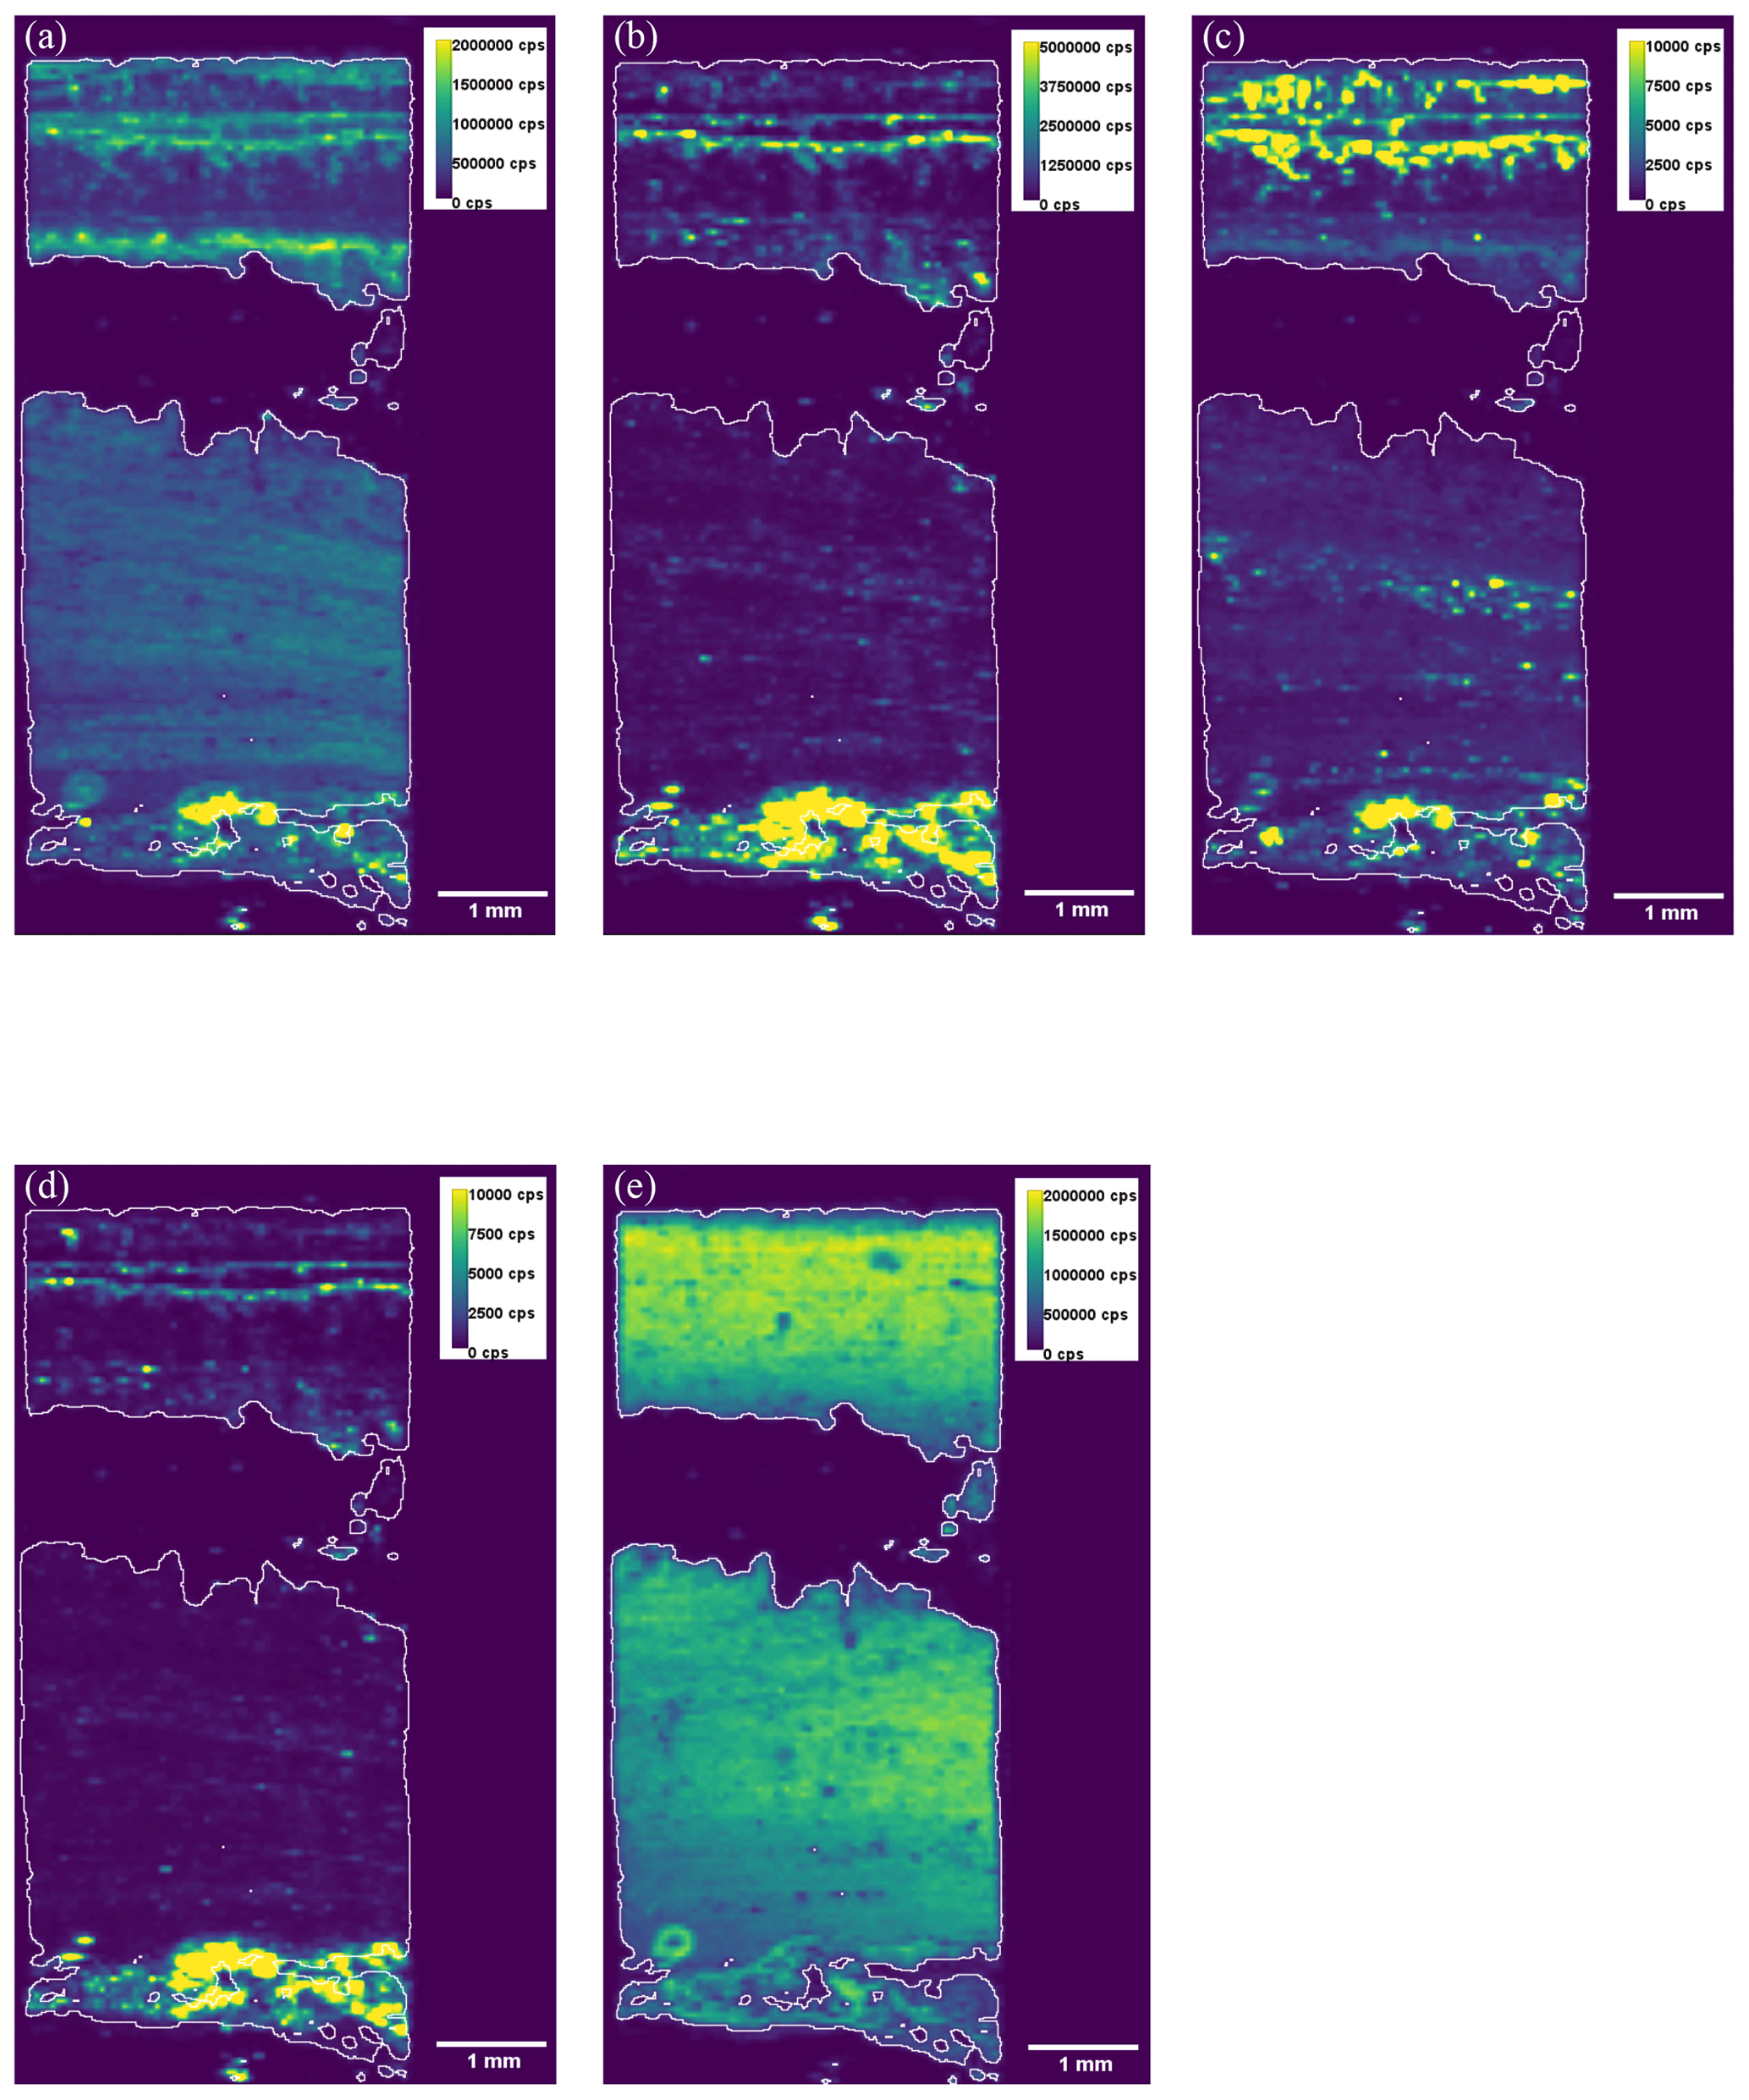
Figure 4The fsLA-quad-ICP-MS qualitative mappings of 24Mg (a), 27Al (b),238U (c), 232Th (d), and 43Ca (e) in sample SOY-19-02. Signals are in counts per second (cps). This slice presents the Endo part at the bottom and the Exo part at the top. The bottom part of the image corresponds to the Jurassic Kimmeridgian karst basal part. It can be easily identified by the highest signal area for 24Mg, 27Al, 238U, and 232Th, as well as a different texture on the 43Ca mapping. The white line delimits the carbonate part of the sample.
In conclusion, data from different analytical methods converge towards a coherent description of the samples. They all are composed of successive layers of pure calcite, without any evidence of diagenesis (Figs. 2 and 3). The detrital fraction, highlighted by the presence of Mg and Al in the fsLA–single collector–ICP-SFMS images, is significant and varies between the different layers (Fig. 4).
3.2 Dating results
The different U–Th ages obtained by Liq-MC-ICP-MS and by fsLA–single collector–ICP-SFMS imaging are presented in Table 1. 14C dating results of SOY-19-01 are given in Table 2. Figure 6 depicts all the chronological data obtained before and after the detrital correction of the U–Th ages. All results and ages are provided with uncertainties at 95 % confidence level.
3.2.1 Liq-MC-ICP-MS
238U contents range from 0.198 ± 0.002 to 0.953 ± 0.008 ppm (parts per million), with a median value of 0.495 ± 0.004 ppm. 232Th contents range from 0.257 ± 0.002 to 140 ± 1 ppb (parts per billion), with a median value of 39.4 ± 0.3 ppb. activity ratios range from 5.3 ± 0.2 to 39.9 ± 1.3, with a median value of 17.95 ± 0.05 and suggest that correction for detrital thorium is not negligible. The use of an a priori value for isotopic thorium composition of the detrital phase with a 50 % uncertainty led to the notable increase in the error bars for corrected ages. They range from 187.9 ± 5.3 to 1.4 ± 0.1 ka.
3.2.2 fsLA–single collector–ICP-SFMS
The fsLA–single collector–ICP-SFMS provided qualitative mappings of 230Th, 232Th, 234U, and 238U with relative variations. They confirmed the observation from sample characterization. SOY-19-02 Endo and SOY-19-01 appear relatively homogeneous, while distinct successive layers can be observed on SOY-19-02 Exo. Mappings of the 238U signal and the ratio for the different samples are presented in Appendix B. These mappings were used to define regions of interest (ROIs) corresponding to different calcite layers, according to Martin et al. (2022) and as shown in Fig. 5. The small variations in 238U content and ratio for sample SOY19-01 did not allow such ROIs to be defined, and therefore, only one age was calculated. No significant difference in raw age was observed for SOY-19-02 Endo, meaning that the duration of the formation of the sample is below the age resolution of the method. Consequently, only one U–Th age was calculated for this sample using fsLA–single collector–ICP-SFMS mapping. Depending on the size, 238U content, and age of the ROI, the number of 230Th counts ranged from about 3.3×10³ to 2.6×10⁵, and the number of 234U counts ranged from about 1.5×10⁴ to 1.0×10⁶.
The detrital-rich layers identified by their Al content correspond to higher raw ages before detrital correction (Fig. 6). In particular, layers 1, 3, and 7 of SOY-19-02 Exo present the highest 232Th/238U ratios (Fig. 5), and their uncorrected ages result in a chronological inversion with respect to the less detritus-rich layers, including the Endo part. However, when corrected for the detrital 230Th fraction, their ages are coherent with the order of deposition of these layers using correction with an a priori value of the detrital fraction and obviously using correction assuming stratigraphic constraints (Fig. 6). For age corrections using stratigraphic constraints (STRUTages routine by Roy-Barman and Pons-Branchu, 2016), we assumed that initial activity ratios of the detrital phase are not constant and can vary by 30 %. Note that the initial activity ratio for the detrital fraction as determined by the STRUTages routine is 1.72 ± 0.30, which is very close to the a priori value used (1.5 ± 0.75).
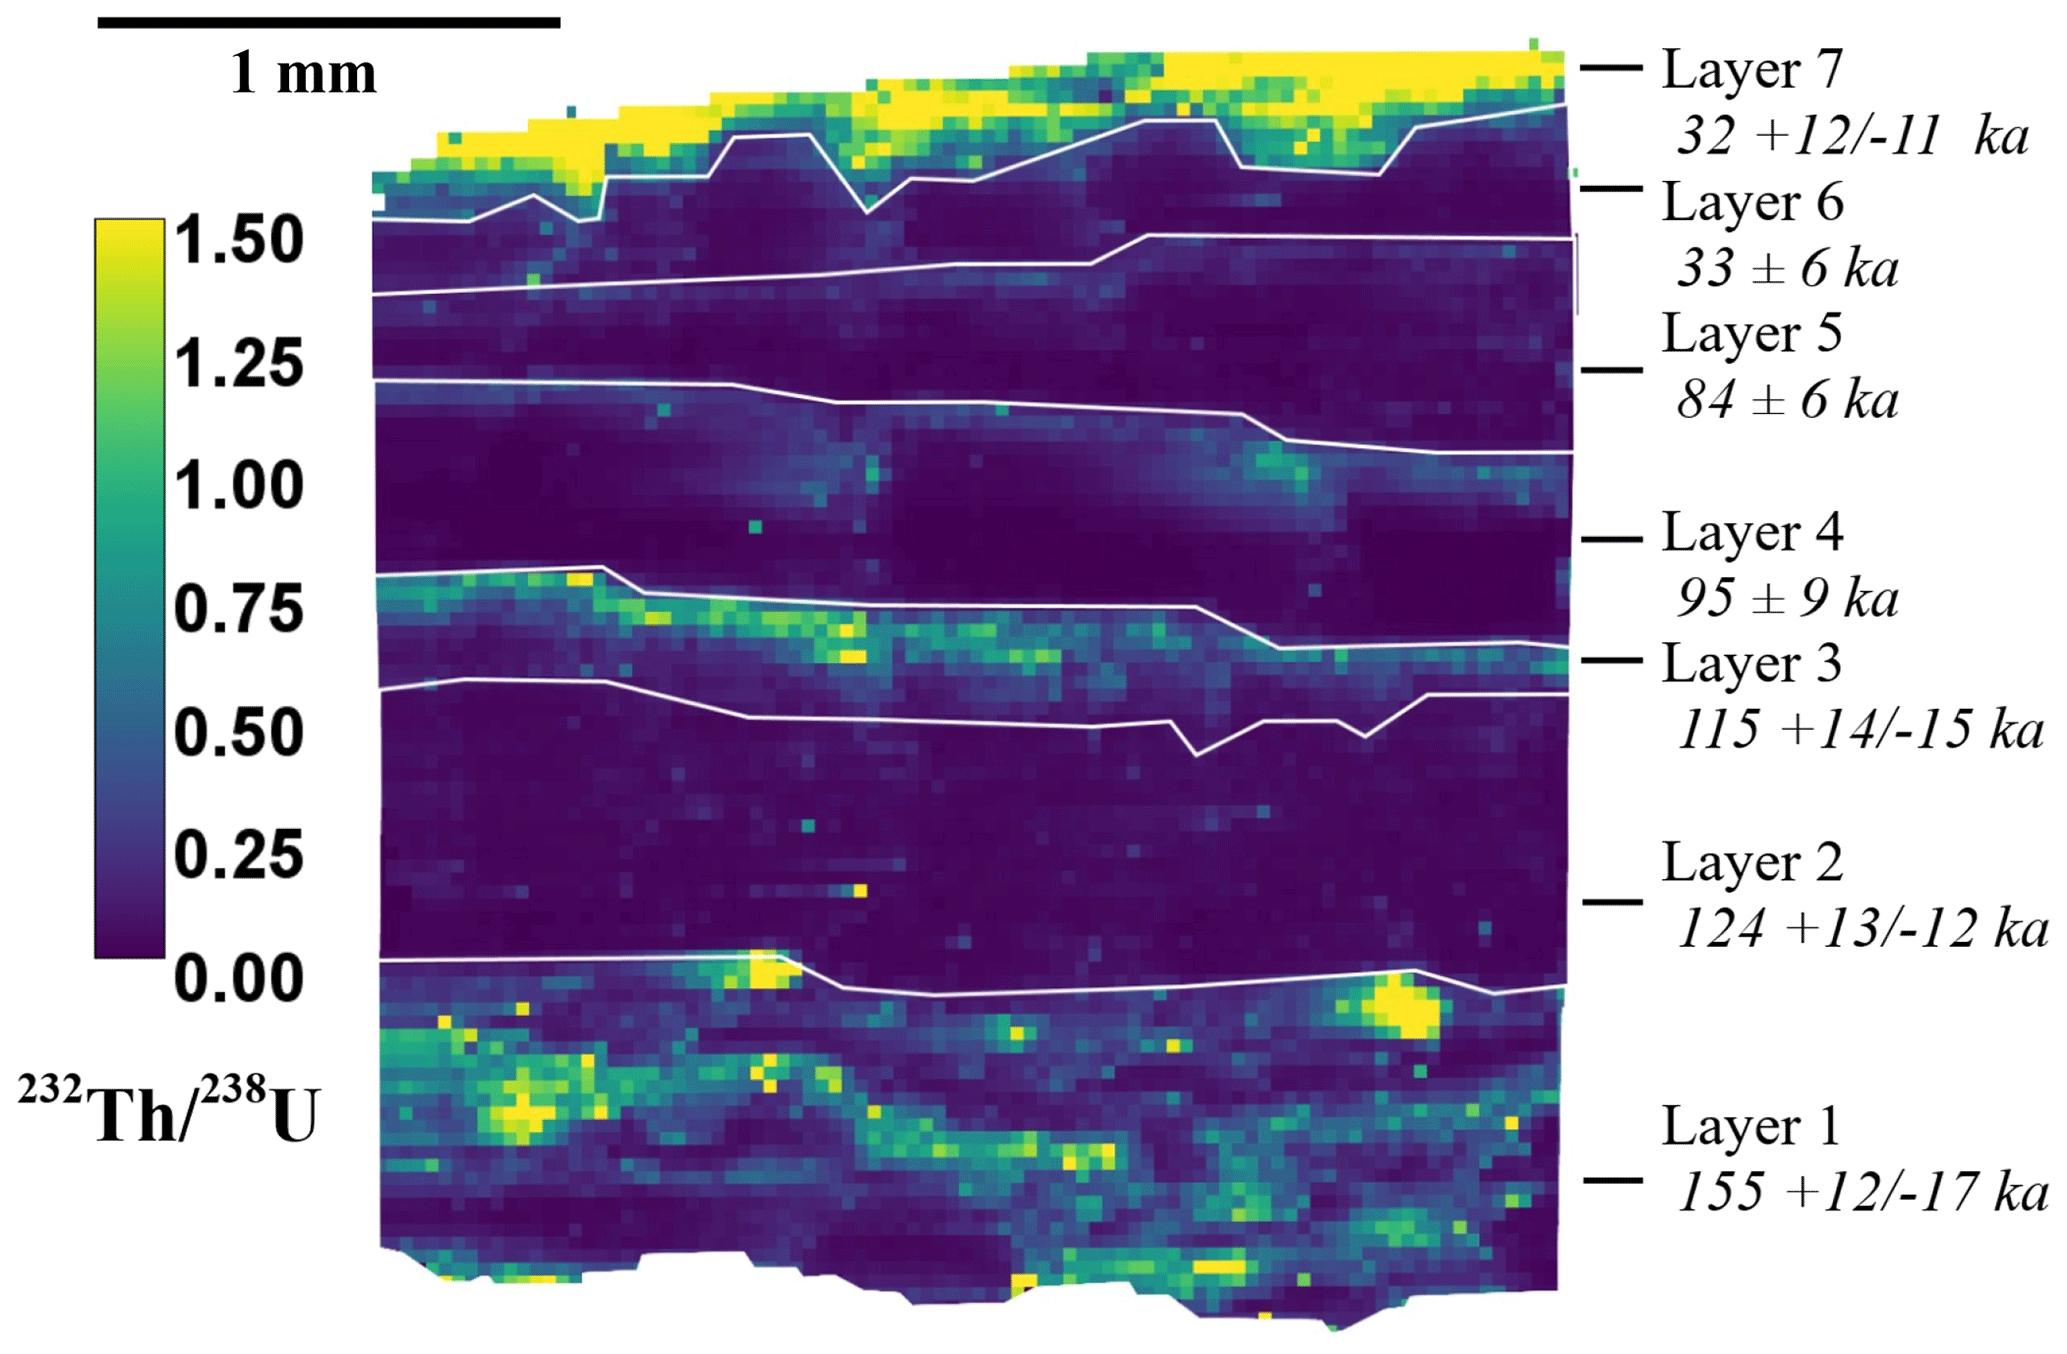
Figure 5Definition of the different layers of SOY-02 Exo on the ratio mapping obtained by fsLA–single collector–ICP-SFMS. The layer numbers are indicated on the figure, starting from 1 for the layer in contact with the Endo part to 7 for the surface layer. The ages on the right are the STRUTages computed according to Roy-Barman and Pons-Branchu (2016) and provided at 95 % confidence level.
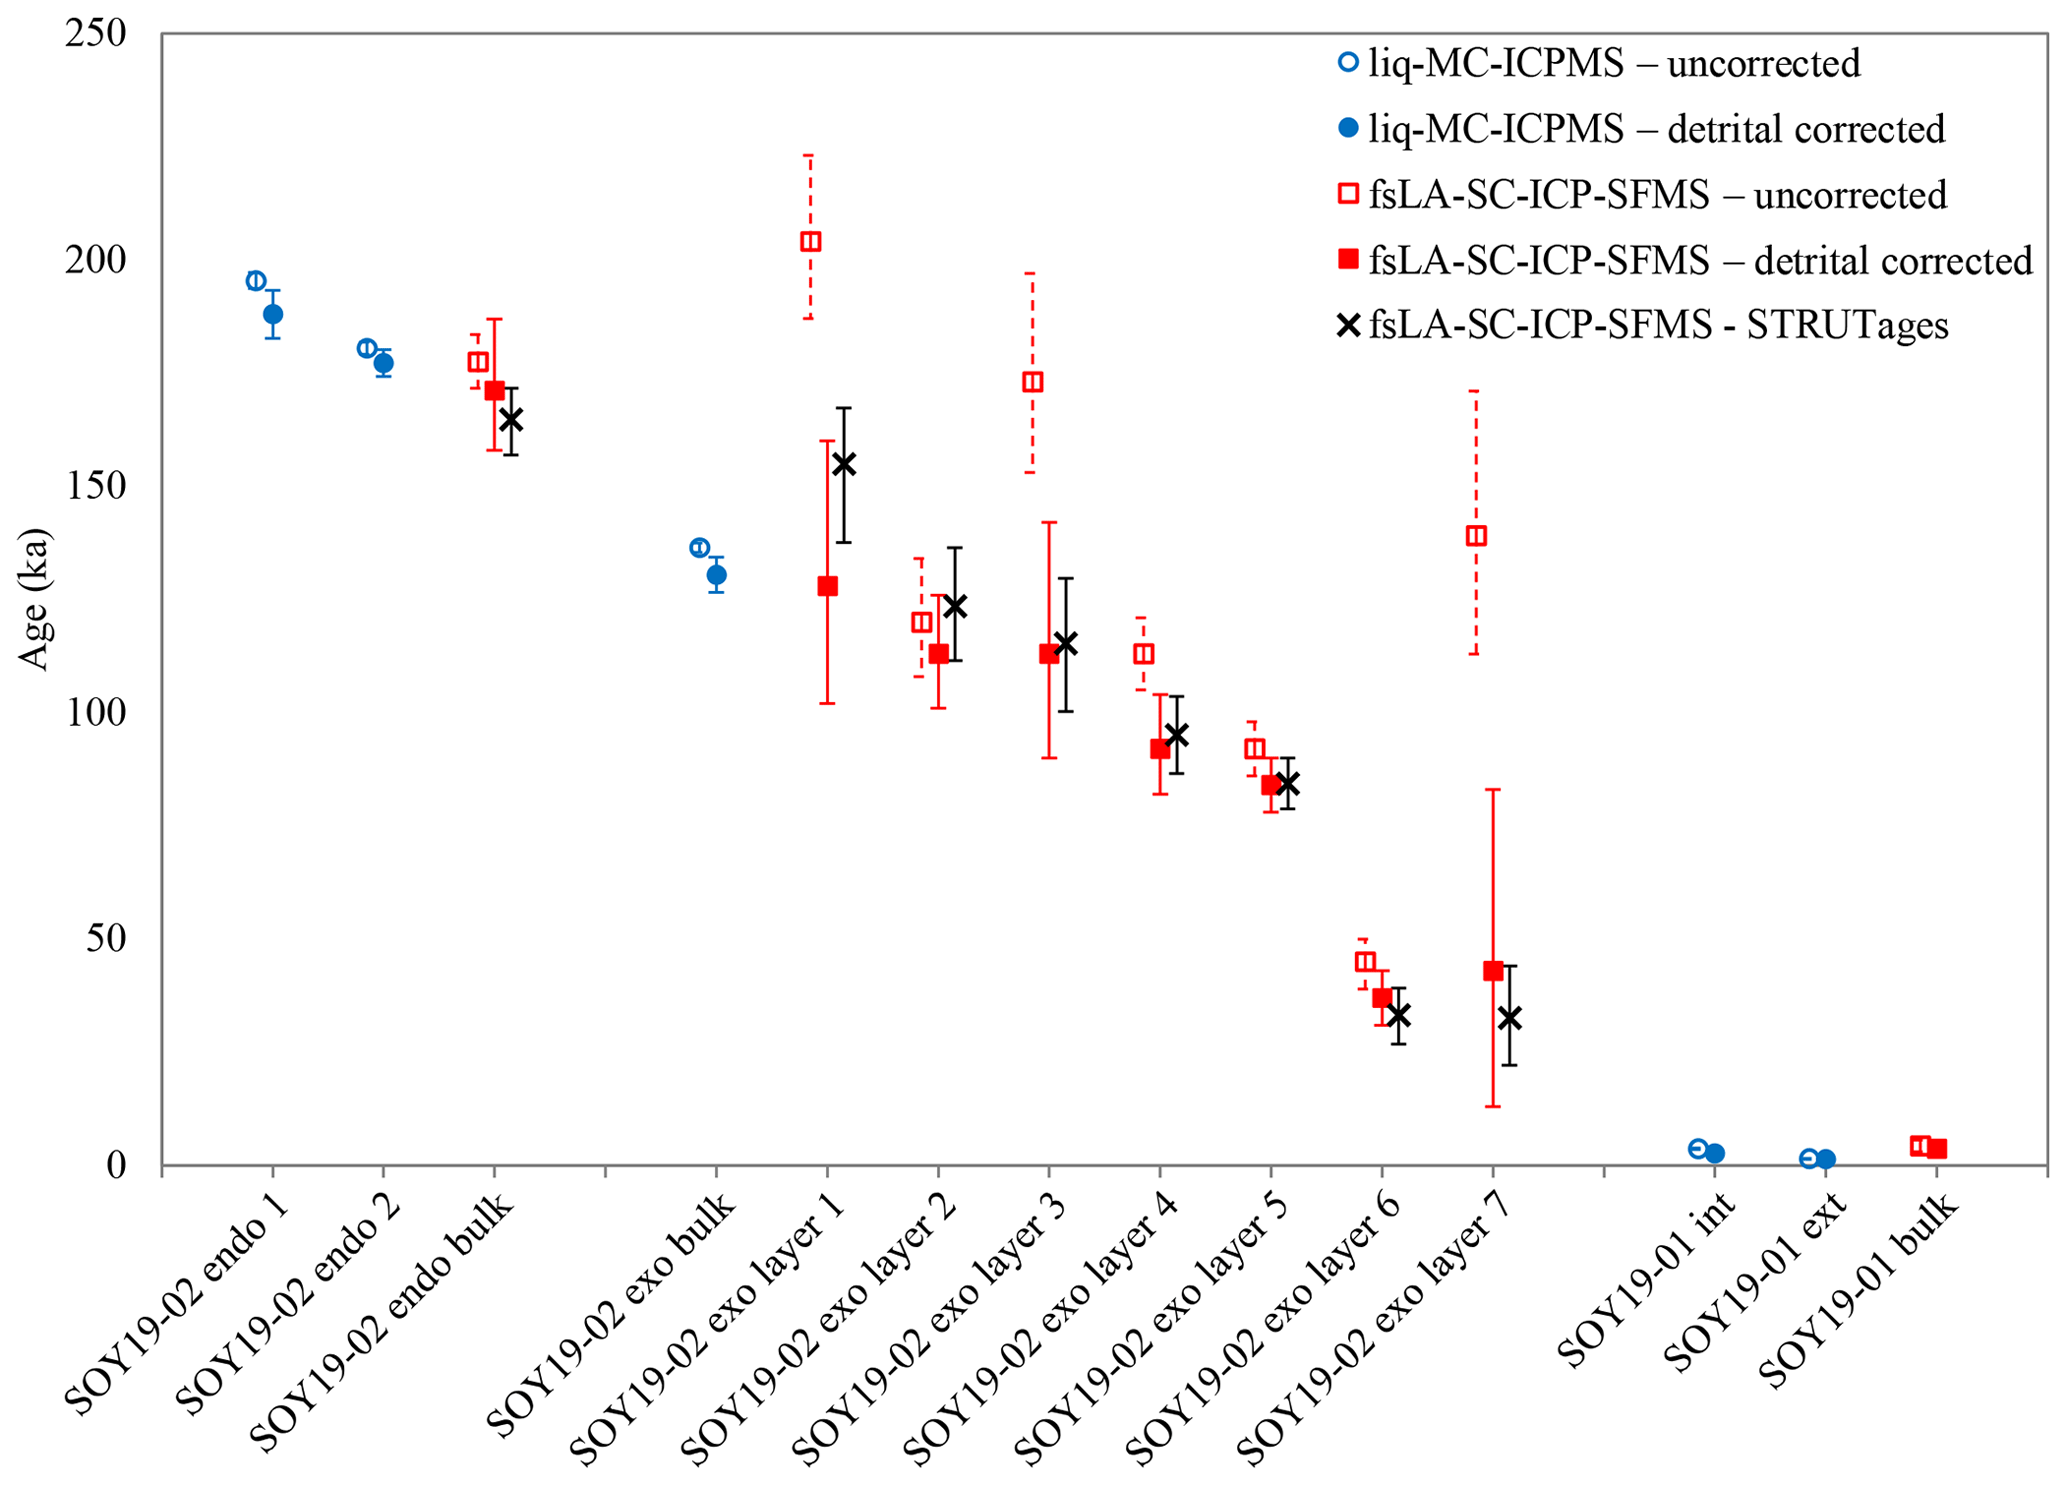
Figure 6Comparison of the U–Th ages obtained for samples SOY19-01 and SOY19-02 by the Liq-MC-ICP-MS and fsLA-SC-ICP-SFMS techniques. The error bars represent the uncertainties at 95 % confidence level.
Table 1U–Th dating results. All uncertainties are given at 95 % confidence level. The following half-lives were used for the calculation of ages: (4.4683 ± 0.0048) × 109 a for 238U (Jaffey et al., 1971); 245 620 ± 260 a for 234U; and 75 584 ± 110 a for 230Th (Cheng et al., 2013). The information in bold represents the results from Liq-MC-ICP-MS analysis. Note: counts per second is cps.
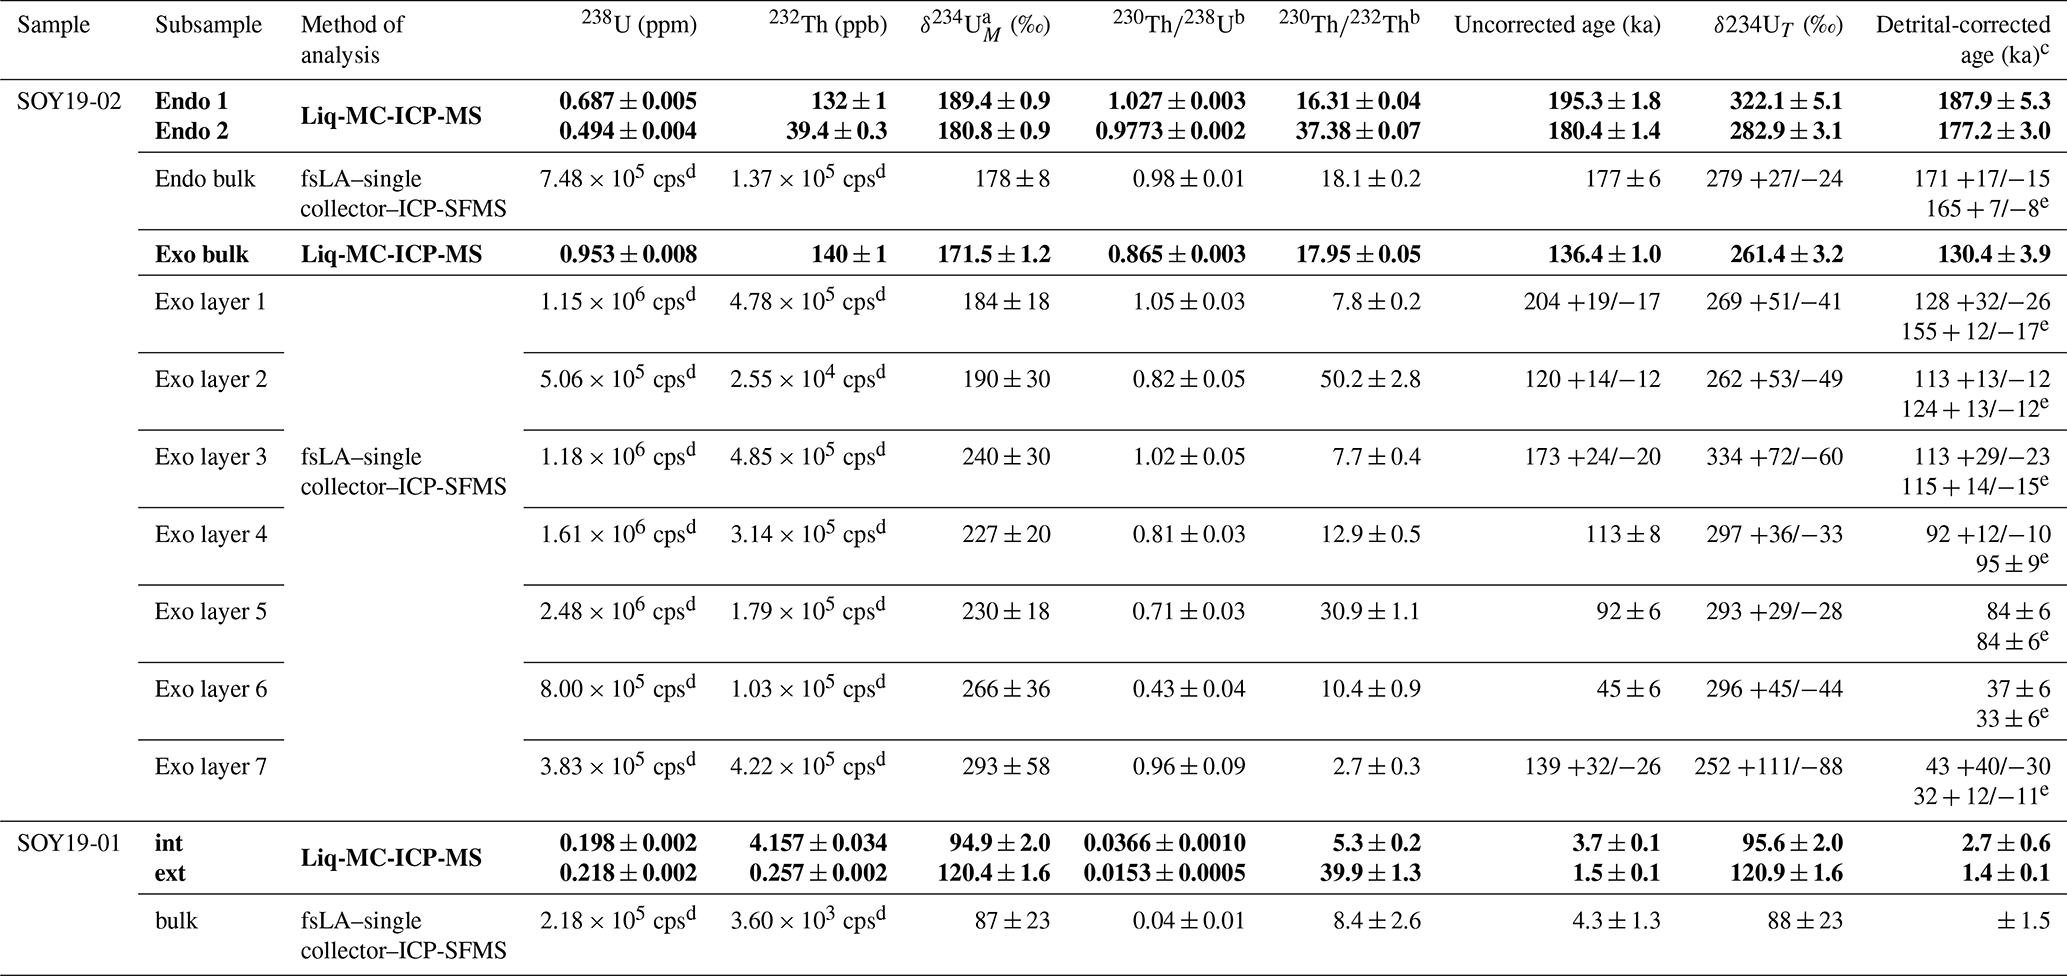
a δ234U = ([]activity−1) × 1000. b Activity ratio. c Expressed as years before 1950 (BP) with a detrital correction, assuming a activity ratio of 1.5 ± 0.75. d In counts per second, with a relative quantification assuming negligible a variation in the ablation rate. A quantification in mass proportion was not possible with the fsLA–single collector–ICP-SFMS protocol used. e STRUTages calculated ages (Roy-Barman and Pons-Branchu, 2016), according to stratigraphic constraints (with subsamples Endo bulk and Exo layers 1 to 7), using the STRUTages routine. Results are given for strict coeval constraints, with 30 % variability for Ri = ()det determined here at 1.72 ± 0.3.
Table 2Results of 14C analyses for sample SOY-19-01-int, presented as a percent of modern carbon (pMC), uncalibrated ages, and calibrated ages (assuming 0 % and 10 % of DCP), using IntCal20 atmospheric curves (Reimer et al., 2020) with OxCal 4.2 software (Bronk Ramsey, 1995). All uncertainties are given at 95 % confidence level.

3.3 Comparison of U–Th results obtained by the two techniques
All uncertainties in this section are given at 95 % confidence level.
3.3.1 The Endo part of SOY-19-02
Two levels (internal and external parts) were analysed in this thick sample, using Liq-MC-ICP-MS at 187.9 ± 5.3 and 177 ± 3.0 ka and hence a weighted mean at 179 ± 5 ka. Using fsLA–single collector–ICP-SFMS, a single age was calculated, since the sample is very homogenous (Fig. 4). The result, 163 +17/−15 or 165 +7/−8, depending on the correction used for the detrital fraction, is in agreement with the results obtained using the other technique (Table 1 and Fig. 6).
3.3.2 The Exo part of SOY-19-02
Liq-MC-ICP-MS gave a single age for the bulk sample of 130.4 ± 3.9 ka (corrected for the detrital content), whereas seven successive layers were identified and dated using fsLA–single collector–ICP-SFMS. The STRUTages obtained for layers 1 to 5 ranged from 155 +12/−17 to 84 ± 6 ka (Table 1 and Fig. 6). The chronological gap between layers 5 and 6 (33 ± 6 ka) may be due to drier conditions in the cave during this time interval. The small age difference between layers 6 and 7 may be due to a higher calcite deposition rate.
3.3.3 SOY-19-01 sample
Two levels were analysed in this thick sample, using Liq-MC-ICP-MS with corrected ages from 2.7 ± 0.6 and 1.4 ± 0.1 ka (mean age 2.1 +1.3/−0.8 ka). This mean age is consistent with the single value obtained using fsLA–single collector–ICP-SFMS at 3.6 ± 1.5 ka and with the 14C age (1.36–1.30 ky) of this sample, assuming a proportion of dead carbon of up to 10 % (Tables 1 and 2).
3.3.4 Detrital correction
The detrital correction has a significant impact on the final U–Th ages, especially for the spatially resolved fsLA–single collector–ICP-SFMS results of the SOY-19-02 Exo part; layers 1, 3, and 7 present considerable amounts of detrital Th associated with stratigraphic inversion of the uncorrected ages (Fig. 6; Table 1). We used two independent methods for detrital correction, namely a correction using an a priori value and the STRUTages model. It is noticeable that the results of these two methods agree within the uncertainties and provide ages in stratigraphical order (Fig. 6; Table 1). This seems to indicate that the results of the two correction methods are coherent.
The accuracy of the correction by an a priori value is discussed by Hellstrom et al. (2006) because the initial detrital Th ratio ()A0 of some samples can be beyond the range covered by the a priori value of 1.50 ± 0.75. However, this does not seem to be the case for the sample investigated here, as the correction provided coherent results and the STRUTages model calculated a compatible average value of ()A0 of 1.72 ± 0.30. Of course, this does not mean that this method of detrital Th correction is valid for every sample, as highlighted by Hellstrom et al. (2006); it only means that it is possible to check its relevance by comparing with other methods and that a multimethod approach is also advisable for detrital correction in order to ensure the reliability of the dating.
The STRUTages model provides a more precise detrital-corrected age than the correction by the a priori detrital value. This is made possible by the use of the stratigraphy by these models to constrain the results. Therefore, the use of this model with high spatial resolution analysis, such as fsLA–single collector–ICP-SFMS imaging, seems particularly appropriate and is likely to be developed further in future. It is noticeable that the results of the STRUTages model for layer 1 of SOY-19-02 Exo are significantly older than the detrital-corrected ages of layer 2 and almost incompatible, within the uncertainty, while the STRUTages result for SOY-19-02 Endo is significantly younger than the age determined by Liq-MC-ICP-MS for the Endo 2 part. This may be the result of a gap within the carbonate stratigraphy between SOY-19-02 Endo and SOY-19-02 Exo, corresponding to a period where the wall was covered by clay (as stated in Sect. 2.1, a clay layer is observed between the Endo and Exo part of SOY-19-02 and SOY-19-03), and no carbonate was deposited at its surface. However, other explanations, such as measurement errors or a detrital Th value beyond the usual range, cannot be completely dismissed, and more work is needed to determine the cause of this potential mismatch of ages.
Martin et al. (2022) took advantage of fsLA–single collector–ICP-SFMS imaging to refine another method of detrital Th correction, the isochronal method. This method was considered for this study as part of the multimethod approach; however, it was dismissed for several reasons. The SOY-19-02 Endo and SOY-19-01 detrital Th distributions were too homogeneous to provide accurate results with this method, and the areas of the same age as SOY-19-02 Exo were too small to obtain enough counting statistics to be able to calculate a sufficiently precise correction. This only led to an average value of ()A0 with 1.3 ± 0.8, which is compatible with the a priori value used and with the average value determined by STRUTages but cannot provide precise detrital-corrected ages. Although it is not appropriate for this sample, this method of detrital correction still presents a strong potential for more heterogeneous samples, or with an increase in measurement accuracy with fsLA–single collector–ICP-SFMS, by accumulating the counts over several successive images of the same area or sample for example, as done by Martin et al. (2022).
3.3.5 Summary of ages obtained by comparing the two techniques
Table 1 and Fig. 6 show that the precision of the measurements made with the Liq-MC-ICP-MS protocol is significantly better than those made with the fsLA–single collector–ICP-SFMS protocol. While the former is a well-established protocol (Pons-Branchu et al., 2014), the latter is more recent (Martin et al., 2022), and further experimental work is certainly needed to improve its precision. However, most of this difference is related to the mass sampled per analysis (68 to 167 mg for the Liq-MC-ICP-MS protocol compared to only 1 to 3 mg for the fsLA-SC-ICP-MS protocol) and to the multicollector system used for the Liq-MC-ICP-MS measurements, which offers greater counting statistics and hence greater precision in the determination of isotope ratios than a sequential system such as fsLA–single collector–ICP-SFMS. Note that the mass sample used for the Liq-MC-ICP-MS protocol can also be reduced; here, large pieces of samples were used because the U content was not known before the analysis. While the precision of the fsLA–single collector–ICP-SFMS ages could be increased by capturing additional images, which would therefore correspond to an increase in the mass analysed, the cost and time required to achieve the same level of precision as the Liq-MC-ICP-MS protocol would be very high.
The refinement of the chronology by the STRUTages method significantly improved the precision of the fsLA–single collector–ICP-SFMS U–Th ages, although the ages by Liq-MC-ICP-MS are still more precise. Combining a high spatial resolution of ages with stratigraphical constraints has a strong potential for improving the chronological data of cave deposits.
The spatial resolution of the fsLA–single collector–ICP-SFMS analysis also offers new insights into the dating of complex samples; the possibility of sampling individual layers and calculating their ages allows the rate of formation of the carbonate deposits to be estimated. On the contrary, it is noticeable that when successive layers with an age difference greater than the age resolution of the dating method are analysed in bulk, as in the case of sample SOY-19-02 Exo (Table 1 and Fig. 6), the apparent age obtained may not represent the average age of the layers but an average value weighted by the amounts of U series elements present in each layer of the subsample. Consequently, the thickest and most U-enriched layers will have a greater weight on the apparent age compared to the other layers. Considering this, it is not surprising that the bulk age for SOY-19-02 Exo obtained by Liq-MC-ICP-MS seems older than what would be the average age of the individual layers of SOY-19-02 Exo, as the oldest layers 1 and 2 are significantly thicker than the youngest layers 6 and 7 and therefore weigh more in the bulk age. The ability to identify the different layers for age calculation avoids this possible bias and thus improves the understanding of the calcite deposition process.
It is difficult to confirm the hypothesis that the different ROIs for U–Th dating from U and Th isotopic imaging, defined using significant variations in the ratio, correspond to different periods of calcification; in some cases, there is a significant age gap between successive ROIs (for example between SOY-19-02 Exo layer 5, dated at 84 ± 6 ka, and SOY-19-02 Exo layer 6, dated at 33 ± 6 ka), and in other cases, the ages of successive layers are indistinguishable within uncertainties at 95 % confidence level. This is the case for all the initial ROIs of SOY-19-02 Endo. The simplest explanation is that the method is not precise enough to resolve the age differences between some of the ROIs, which is likely, considering that some of the uncertainties can be greater than 10 ka. Improving the precision via additional analysis or methodological development could enable the resolution of their ages in future. Another possible explanation is that the real age of the ROI with similar U–Th ages is the same but that U and Th migrated within the calcite to form distinctive layers through diagenetic processes. However, no trace of diagenesis was observed in the petrographic analysis or in the U and Th isotopic mapping. Considering the very different chemical mobility of U and Th, such a migration process would likely have resulted in incoherent ages.
This last point highlights an advantage of mapping isotopes and isotope ratios for U–Th dating: they can be used to identify areas affected by detrital incorporation and to calculate an age correction or, alternatively, to check that the usual value for detrital correction is relevant. Uranium leaching can also be highlighted, and areas affected by these changes can be excluded from the age calculation (Martin et al., 2022). As mentioned above, no trace of U leaching was observed in this study, which further supports the accuracy of the ages obtained.
In sum, it appears that the two techniques (Liq-MC-ICP-MS and fsLA–single collector–ICP-SFMS) for U–Th dating are complementary, each with its own advantages and disadvantages.
For several years, the carbonated layers deposited on decorated walls have been dated by the method (Pike et al., 2012). Depending on their location above or below the parietal representation, their dating gives a terminus ante quem or a terminus post quem for the decoration, respectively. To ensure the validity of the dating results, we proposed in previous studies to use and 14C methods simultaneously on the same carbonated sample and to compare their respective results (Plagnes et al., 2003; Valladas et al., 2017; Pons-Branchu et al., 2020). We also proposed characterizing and studying the carbonate mineral and its geochemical evolution through time and multiplying the dating analysis to check the reliability of the results.
In this work, the differences between the two techniques represent a great potential to improve U–Th dating; isotope imaging and the resulting in situ dating could indeed be used to guide the microsampling for the Liq-MC-ICP-MS protocol. For example, for the Exo part of sample SOY-19-02, the isotope imaging indicated the need to increase the microsampling to better match the successive layers observed, unlike the Endo part, where there were small age differences between layers.
This study illustrates a case where the samples do not show evidence of major alteration and the ages obtained with the two U series techniques, and with 14C, agree. The control of the basic hypothesis on which the dating is based, such as the absence of diagenesis and the application of detrital correction, reinforces the reliability and robustness of the chronology. Even in the event of alteration or disagreement on the chronology (between two different chronometers or regarding stratigraphic correction), our approach would allow the effect of alteration and the possible origins of disagreement to be investigated. This would allow errors to be corrected when possible or would indicate if any further analysis was required.
In the present study, the initial size of the samples (a few centimetres) is not compatible with the preservation requirements for decorated caves. However, the total mass required for petrographic analysis and dating is only a fraction of this amount, less than 1 g. In the context of Trou du Renard cave, the initial sampling was carried out with the aim of having sufficient mass to develop a multimethod analysis and dating protocol. The development of this protocol and the data obtained now allow a more accurate assessment of the amount of sampling required to establish a reliable chronology, as well as to envisage a sampling strategy compatible with the imperative of the preservation of decorated caves. Similar analyses to this study can be carried out in non-decorated areas or on small pieces of calcite that have fallen naturally from the decorated area and for which partially destructive analyses can be envisaged. This would enable a chronology of calcite deposition in the cave to be established and would highlight any difficulties for dating methods, using petrography and fsLA–single collector–ICP-SFMS. These data could then be discussed with archaeologists, geologists, and conservation experts in order to identify a sampling method and the sampling points closest to the decoration that would maximize the chronological data for a minimum of sampled mass, while protecting the most sensitive area of the decorations. For example, 1 to 10 mg of sample taken with a high-precision microdrill tool could then be analysed by Liq-MC-ICP-MS protocol to achieve maximum precision on the age. Considering a cave with historic paintings, the analyses presented in this study could be performed on samples naturally detached from the wall or outside the decorated area. The first and most important information that this study brings is that the U–Th method is reliable for dating the calcite in this site, as there is no sign of diagenesis or uranium leaching. The results from Fig. 6 and Table 1 indicate that it is probably not worthwhile to drill deeper than SOY-19-02 Exo layer 5, dated as 84 ± 6 ka, because it is older than any cave painting discovered so far (if there are reasonable grounds for thinking that a painting is older, then the drilling could be pursued to deeper layers). A high-precision microdrill could be mounted on an automated arm for sampling every 200 µm, and the dust collected by a research grade dust collector. This would represent about 3 mg of matter for a 2.5 mm diameter drilling and up to 11 mg for 5 mm diameter drilling. These microsamples could be analysed on site by a µXRF to check that their contents in minor elements (Mg and Al) match those expected for the layer, according to elemental mapping (Fig. 4). The drilling would stop when the pigment is reached, and the microsamples would be prepared for U–Th dating by the Liq-MC-ICP-MS protocol to achieve maximum precision on the age. The age sequences from the microsamples, potentially improved by STRUTages (Roy-Barman and Pons-Branchu, 2016), could then be inserted into the longer age sequences obtained by fsLA–single collector–ICP-SFMS. This would provide a terminus post quem and a terminus ante quem for the painting, while ensuring the reliability of the ages.
Studies carried out on prehistoric art in order to determine the cultural evolution of Palaeolithic populations require the establishment of a reliable chronology. It is thus essential to be able to control the validity of dating results obtained on carbonate parietal deposits and to check that they were not subjected to diagenesis processes.
Dating of calcite layers from the Trou du Renard cave walls (France) by the U–Th and 14C methods revealed a long-term development of these deposits between 187.9 ± 5.3 and 1.4 ± 0.1 ka.
Both U–Th dating techniques – Liq-MC-ICP-MS and fsLA–single collector–ICP-SFMS – agree on the chronology but lead to different precisions and resolutions. The 14C age of the youngest sample is in agreement with the U–Th dating results. No evidence of diagenesis was detected from the petrographic (optical and cathodoluminescence microscopy and FTIR microspectroscopy) and geochemical mapping of selected chemical elements (Al, U, Th, and Mg contents). The detrital incorporation of 230Th was corrected for all U–Th ages, and the dead carbon fraction was taken into account for the 14C age.
More generally, the development of dating methods and associated technologies make it possible to use smaller sample sizes, as well as to improve the age precision and spatial resolution of analysis. These improvements allow for a better constraint and understanding of the chronology, while reducing the impact of sampling on the site. Imaging methods provide geological and chemical data on samples to support the chronology, controlling several parameters such as sample homogeneity, presence of detrital phase, and evidence of diagenesis (Spooner et al., 2016; Martin et al., 2022). U–Th dating using fsLA–single collector–ICP-SFMS imaging, while not reaching the precision of Liq-MC-ICP-MS U–Th dating, reveals information on the chronology of the deposits with a high spatial resolution. This could contribute to assessing the chronological relationship between dated calcite deposits and archaeological remains and to constraining their relative age when a calcite deposit over- or underlies them. Combining the high precision of Liq-MC-ICP-MS U–Th dating with imaging methods could achieve the objective of maximizing chronological information from a reduced sample size, which is a necessary condition for the most sensitive archaeological sites. This study aimed at demonstrating the feasibility and advantages of this association.
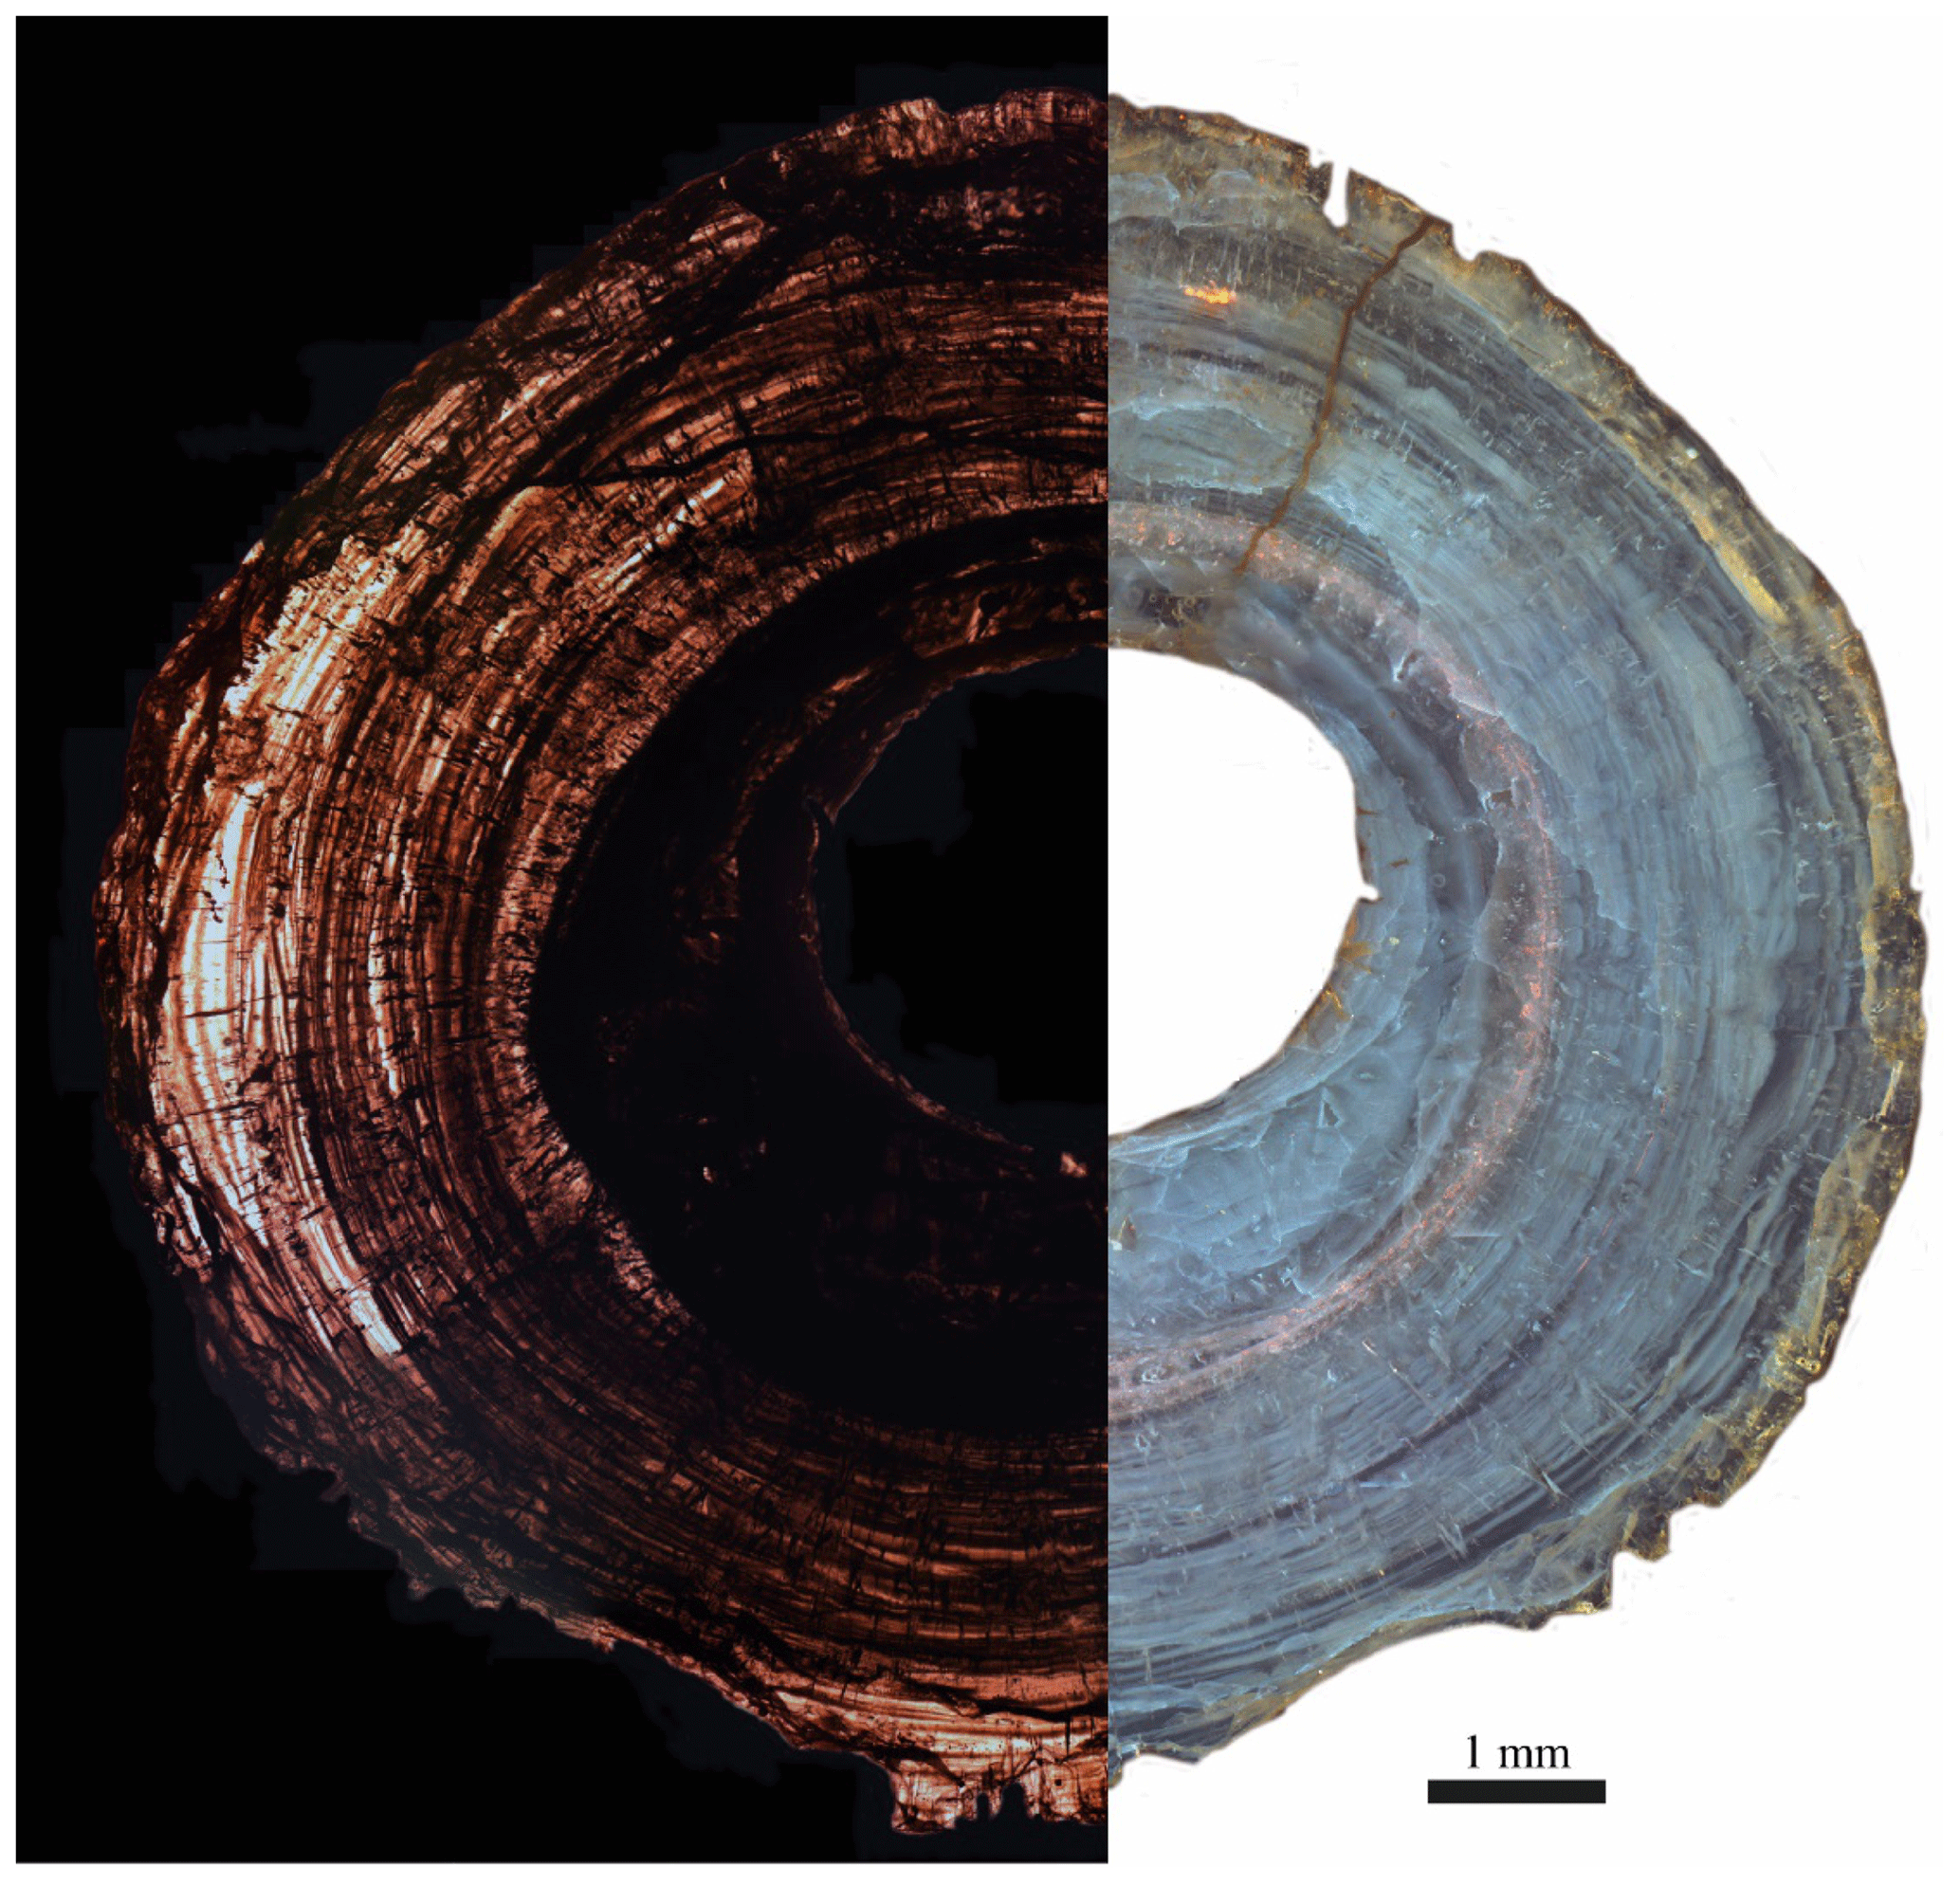
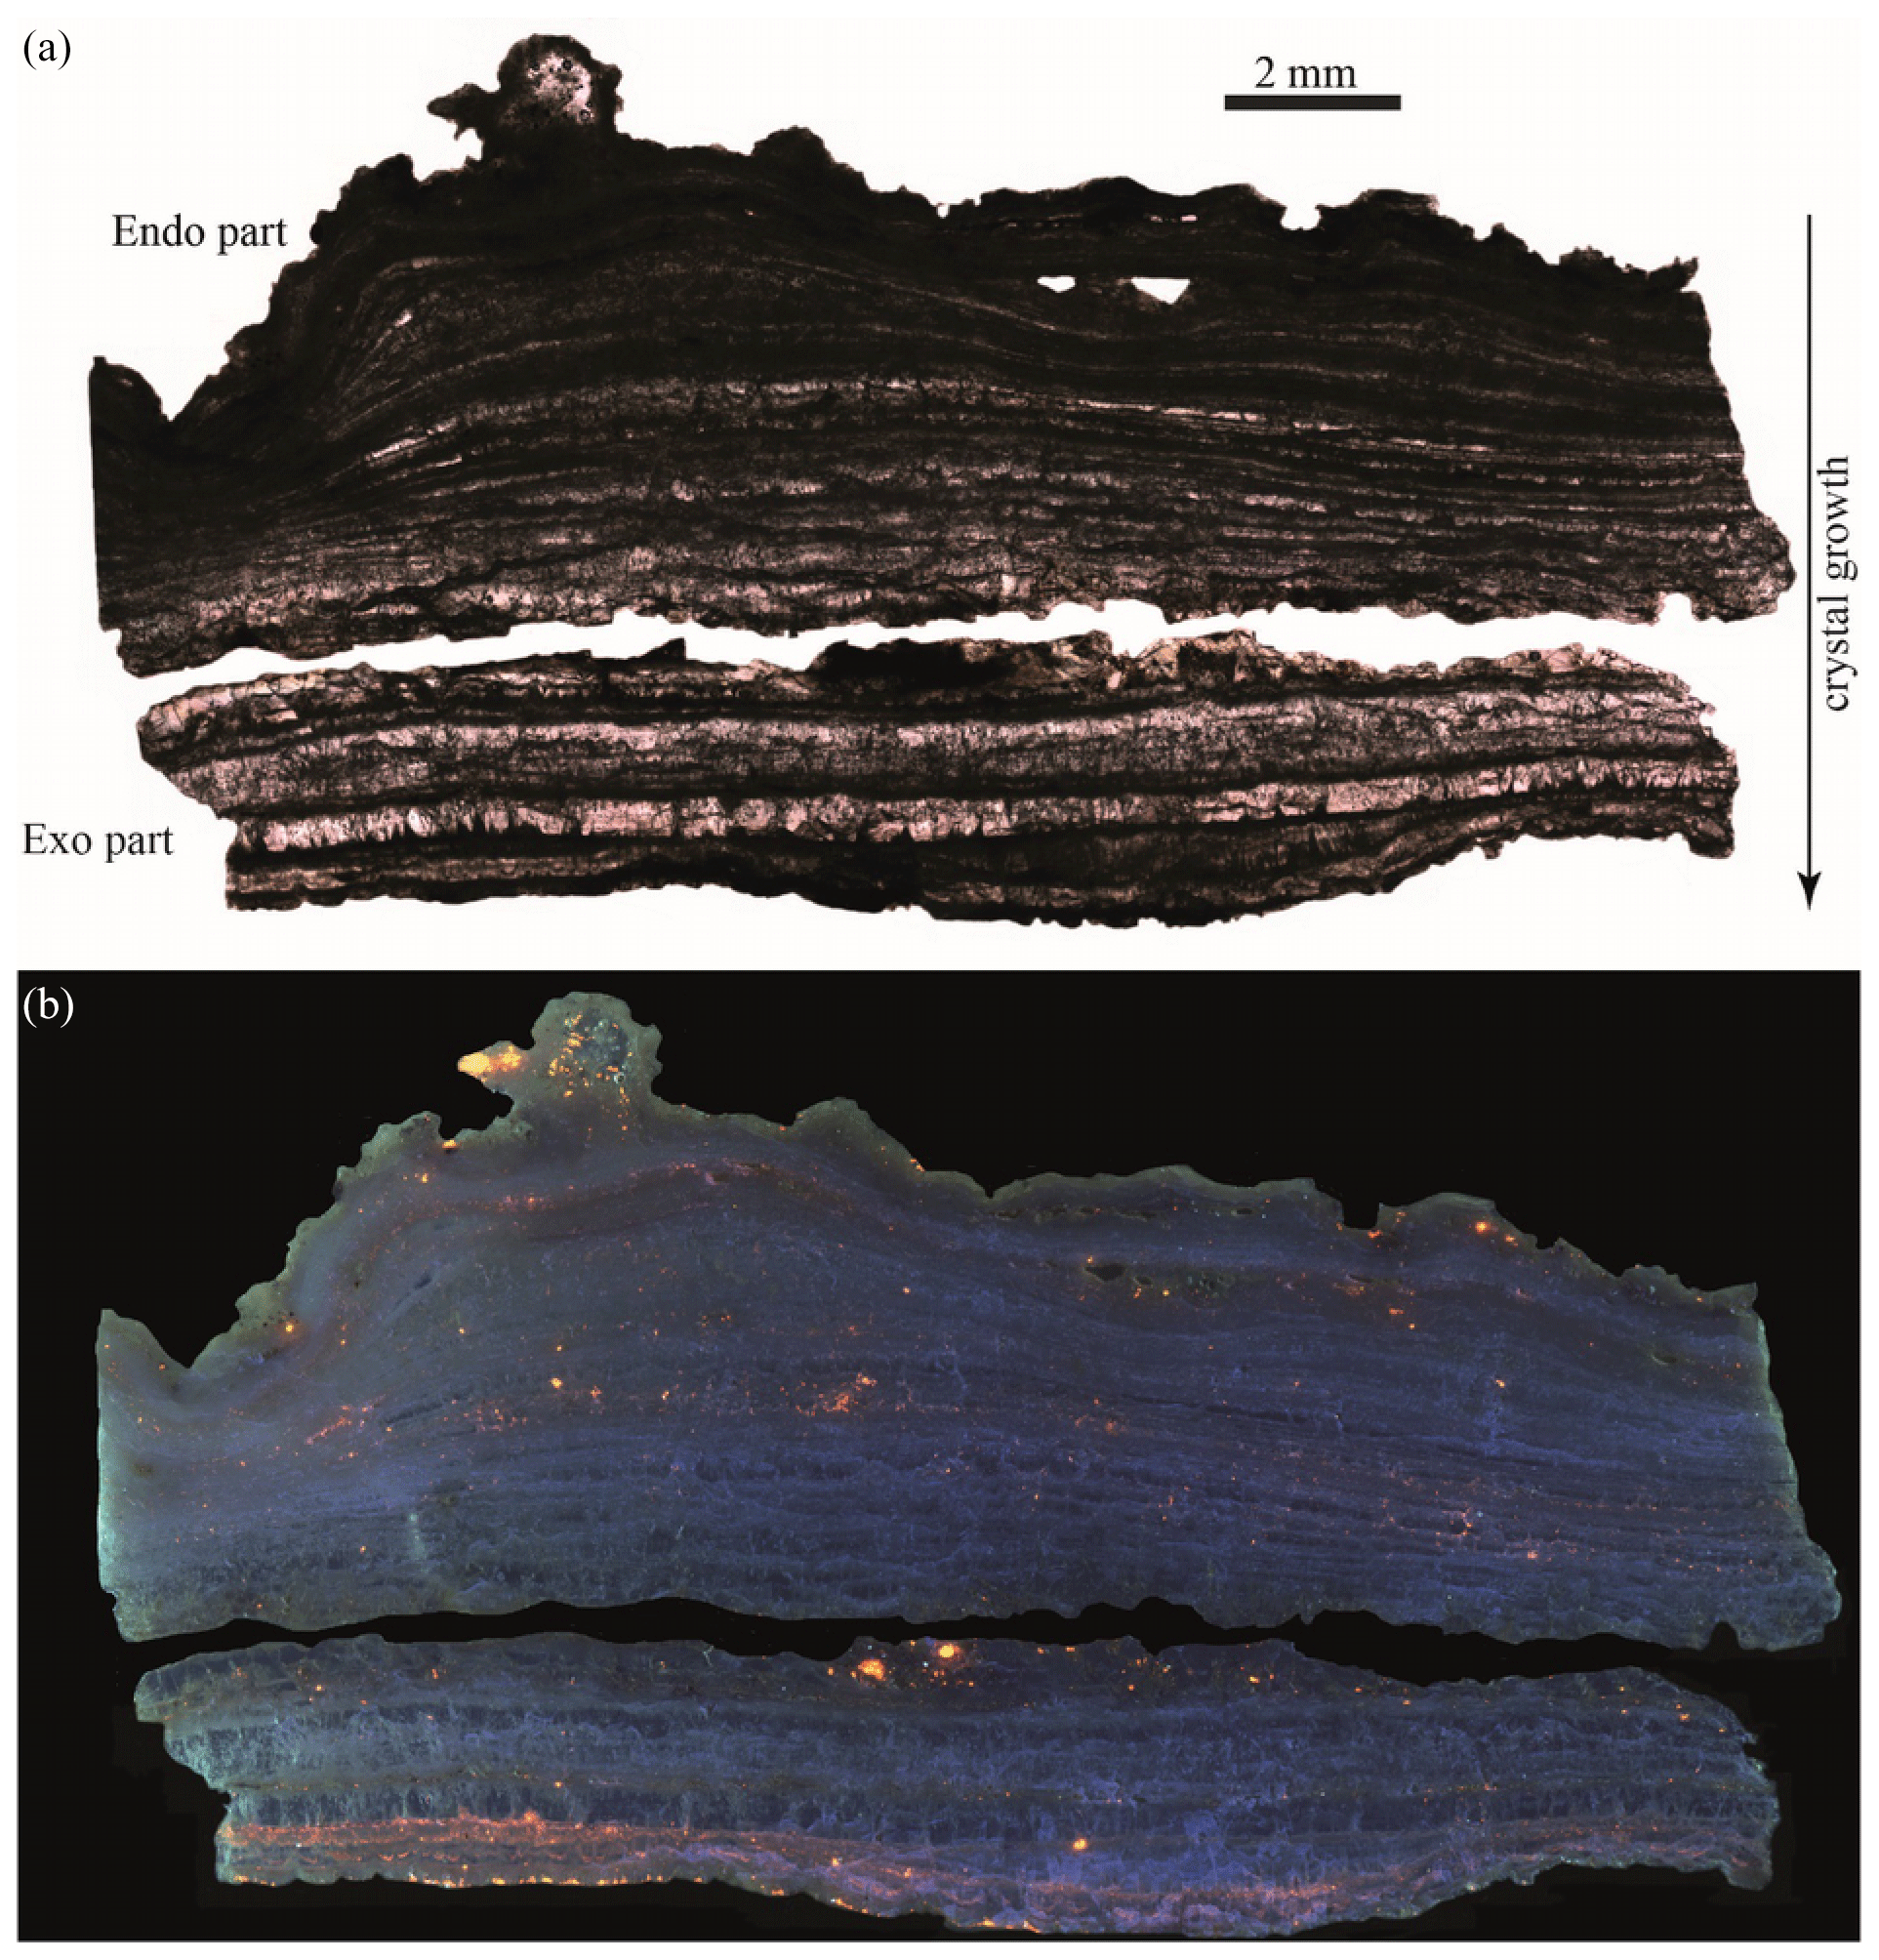
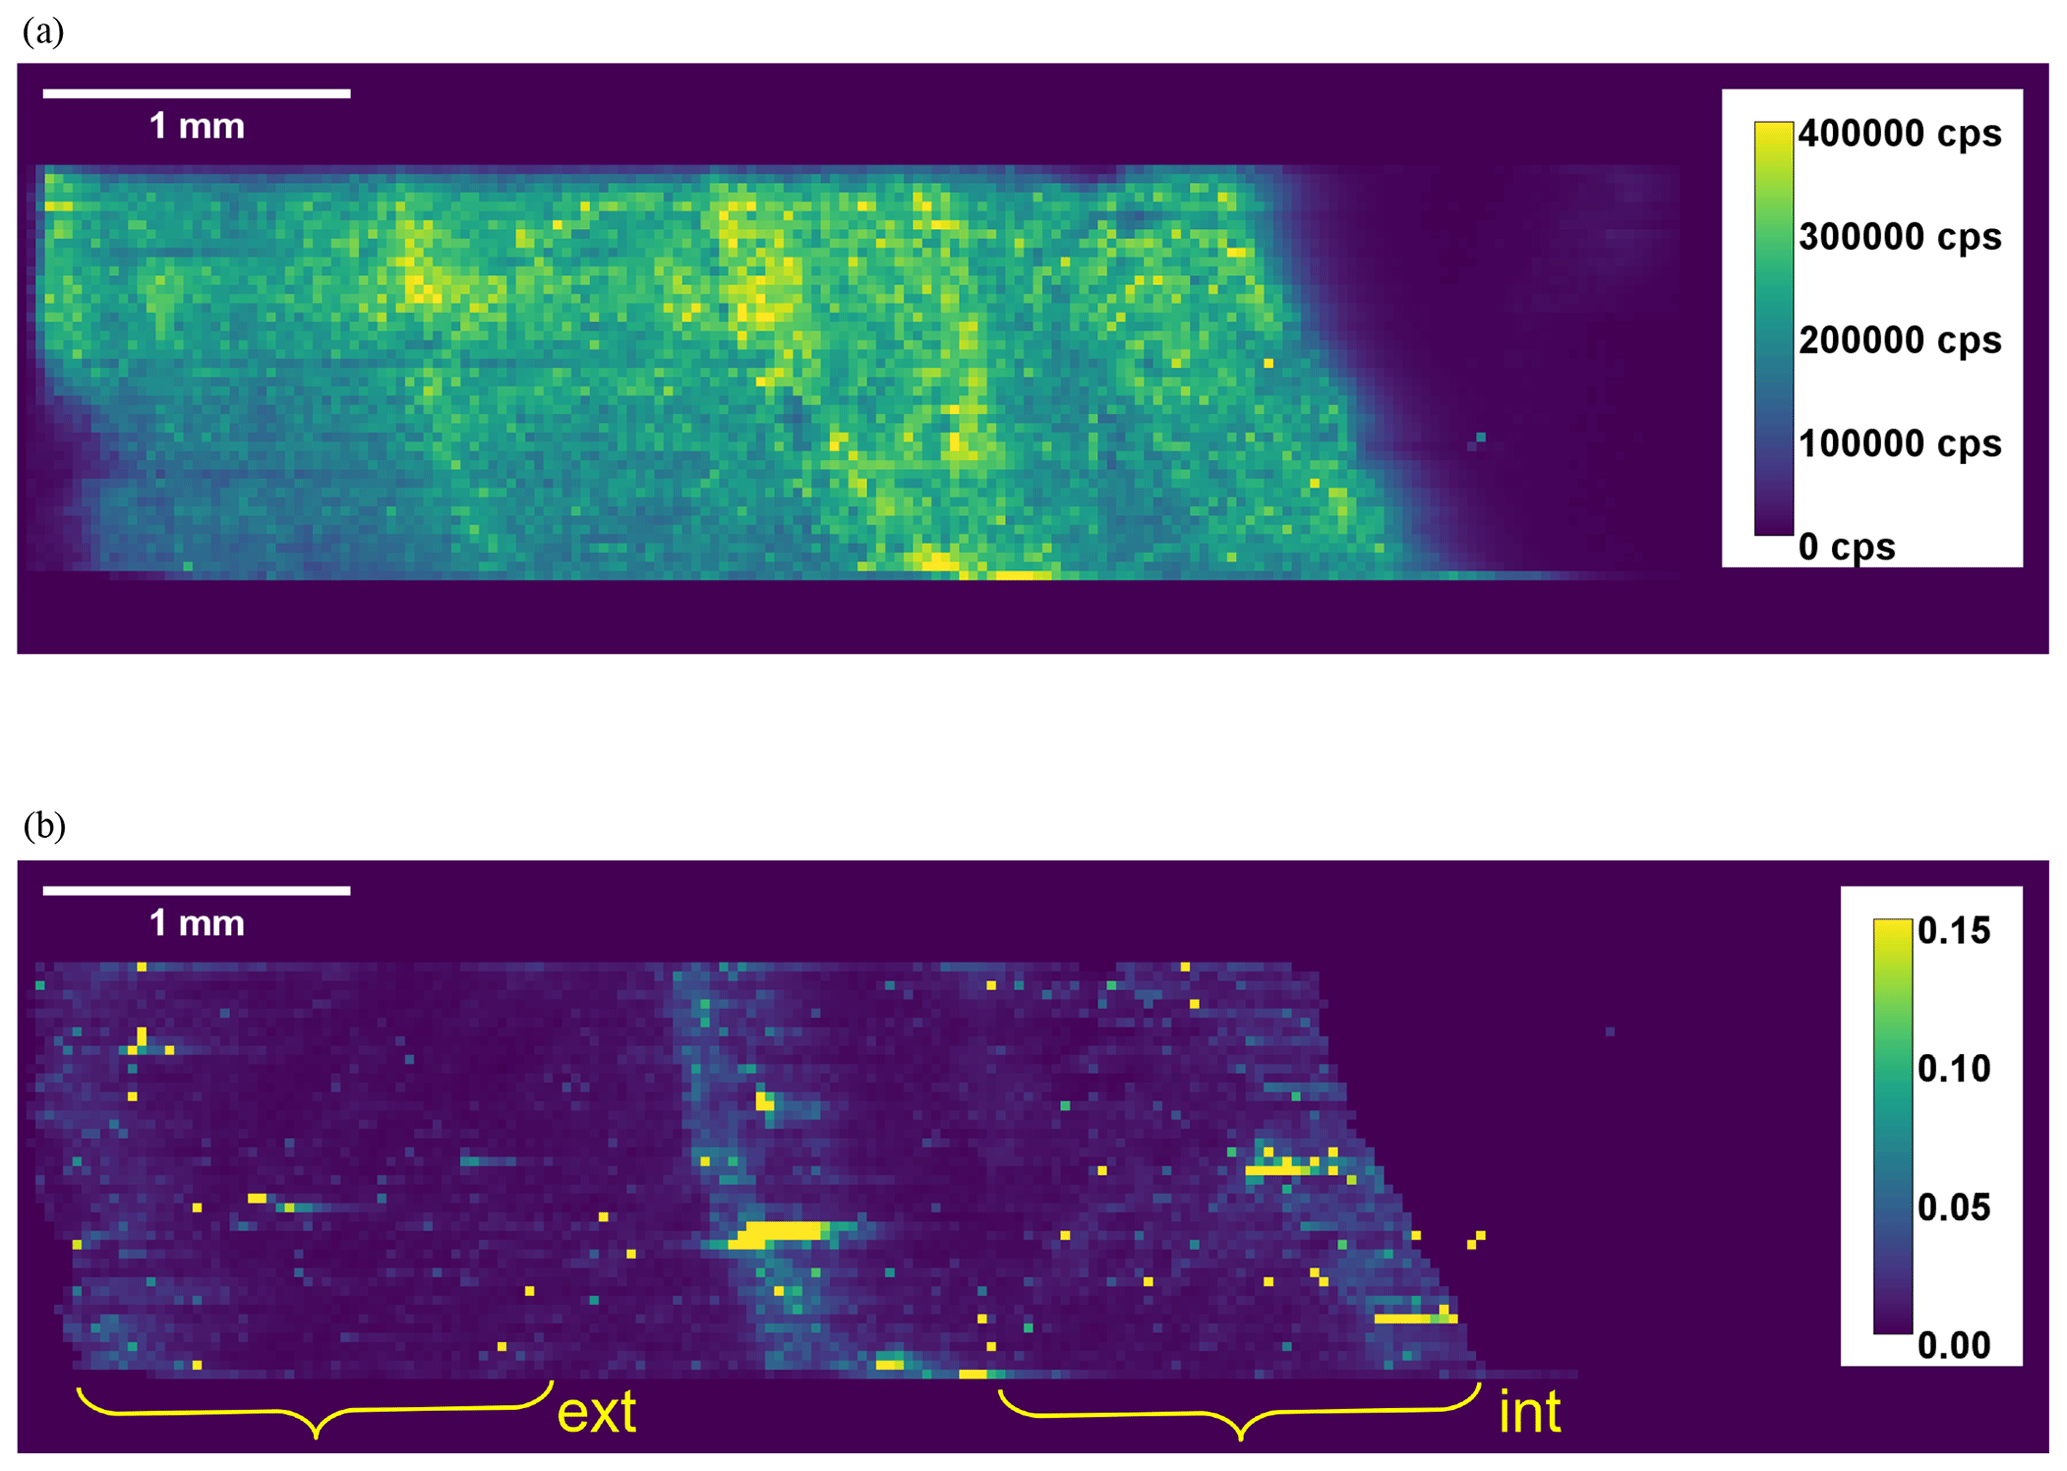
Figure B1Mappings of 238U signal (a) and of ratio (b) of sample SOY-19-01. The centre of the fistula is on the right of the images. The approximate positions of the subsampling for the Liq-MC-ICP-MS protocol are indicated in panel (b).
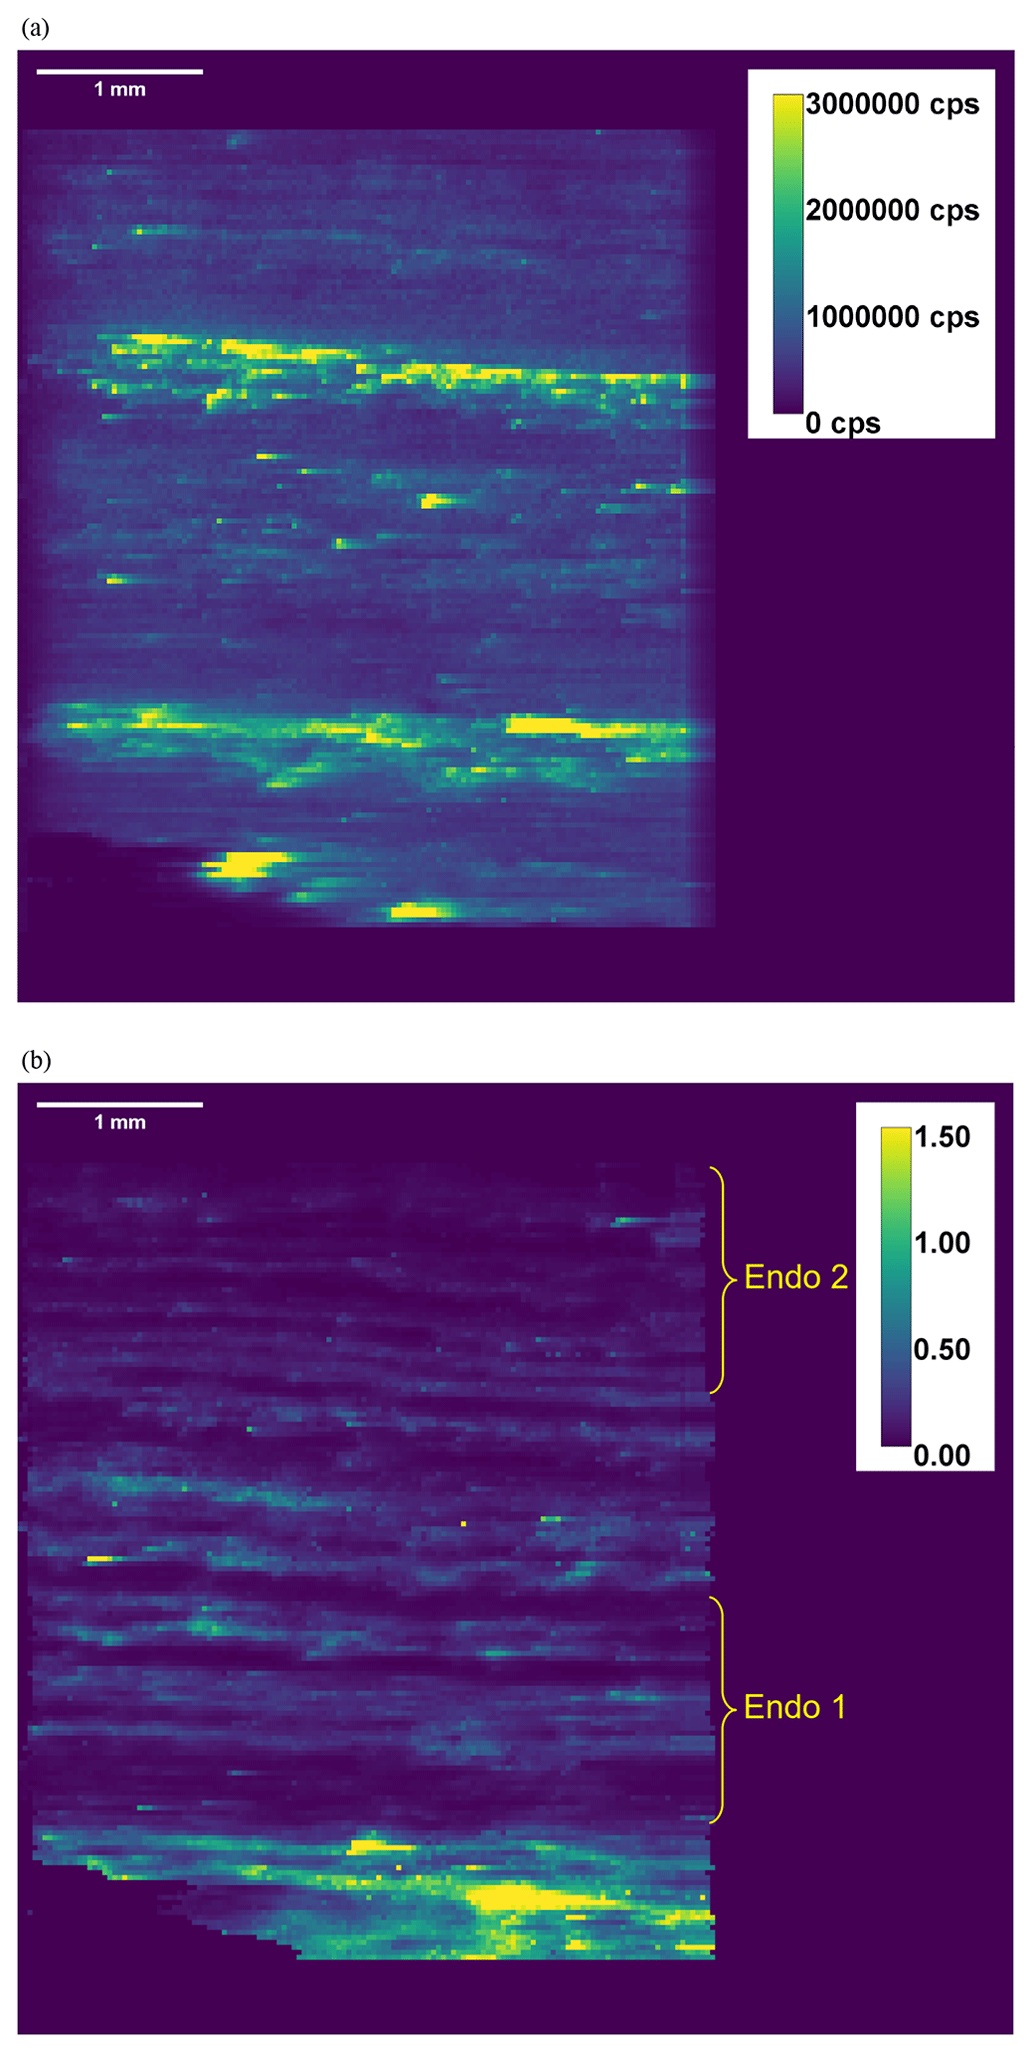
Figure B2Mappings of 238U signal (a) and of ratio (b) of sample SOY-19-02 (Endo part). The growth of the calcite is from the bottom of the image to the top. The bottom part of the image corresponds to the Jurassic Kimmeridgian karst basal part. It can be easily identified in panel (b) by the highest area. The approximate positions of the subsampling for the Liq-MC-ICP-MS protocol are indicated in panel (b).
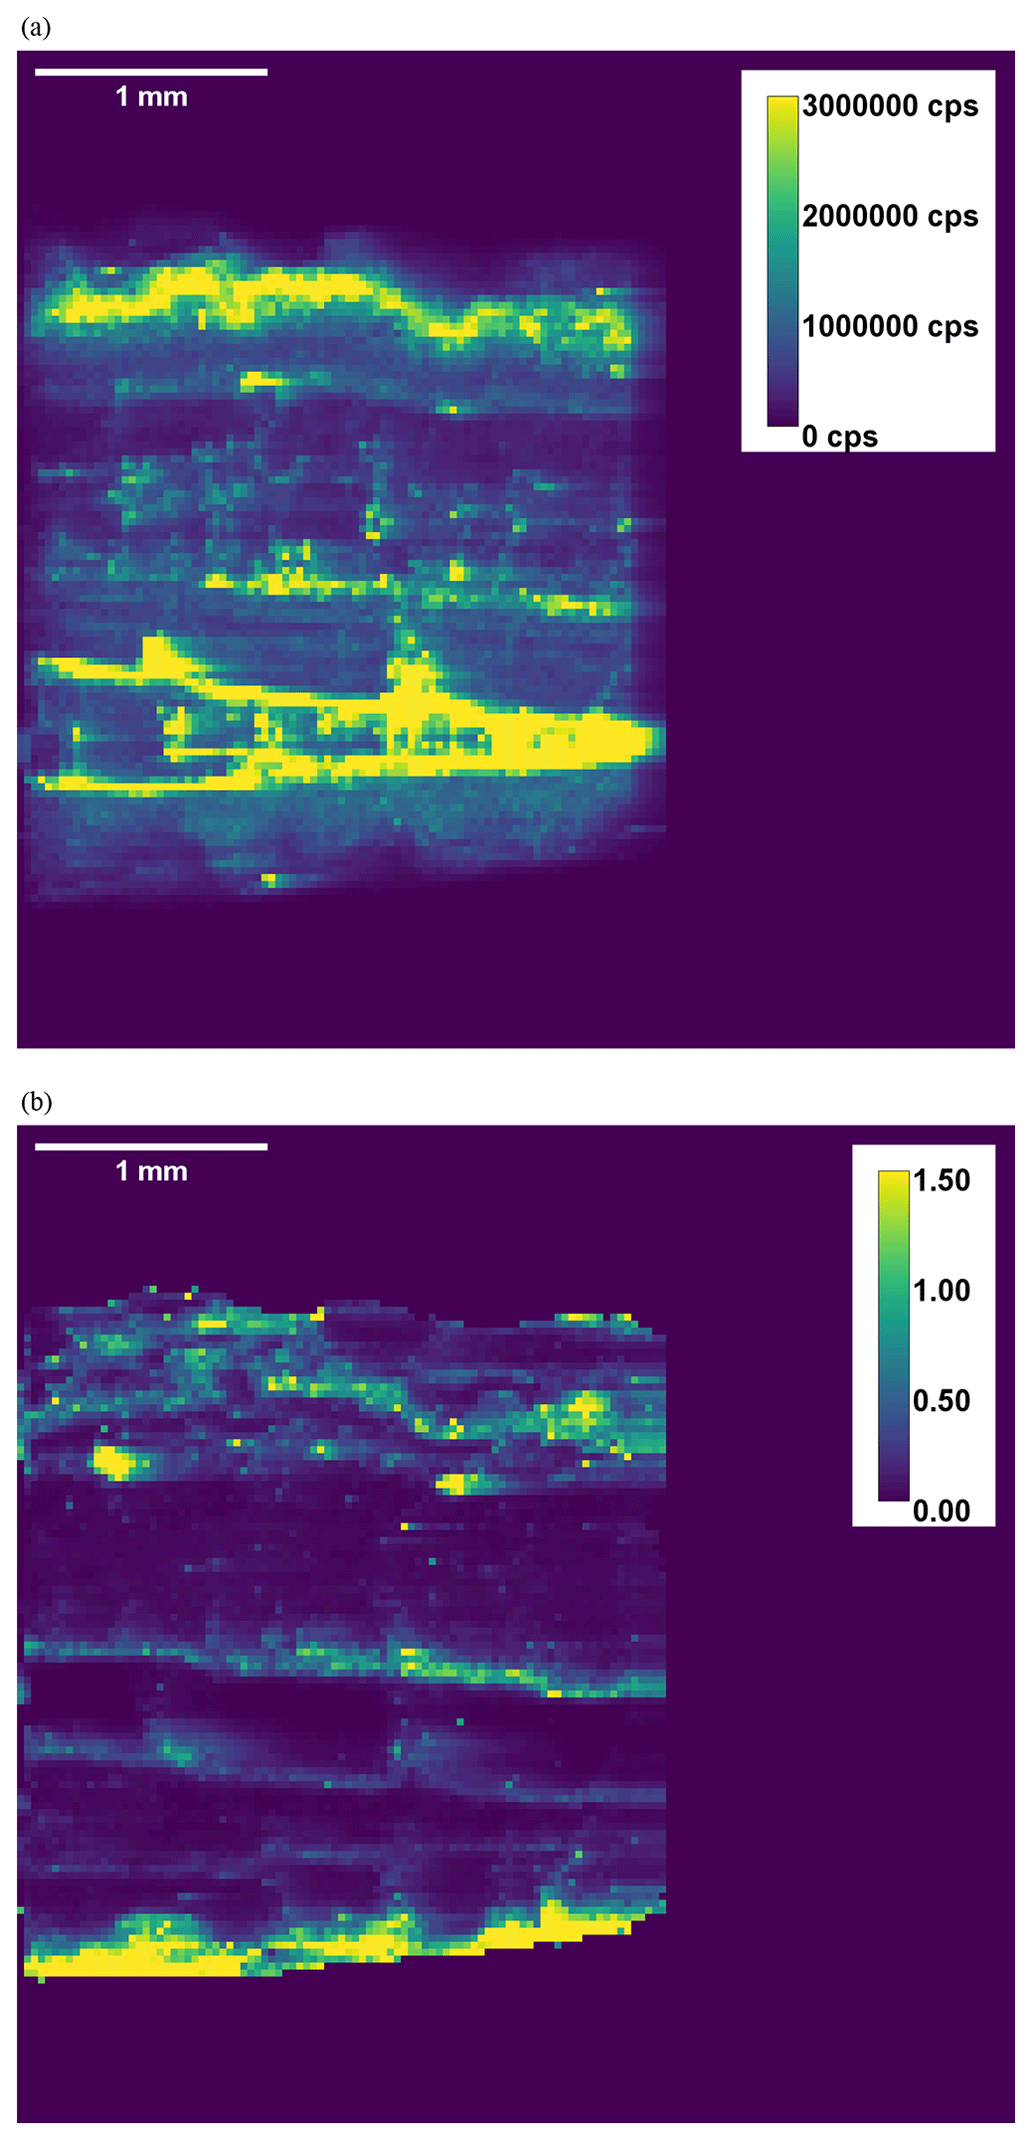
Figure B3Mappings of 238U signal (a) and of ratio (b) of sample SOY-19-02 (Exo part). The growth of the calcite is from the bottom of the image to the top.
The STRUTages code is available in Roy-Barman and Pons-Branchu (2016). The codes used for calculating U–Th ages from fsLA–single collector–ICP-SFMS imaging is provided in Martin et al. (2022). All codes will be made available upon request to the corresponding author.
The data can be found in Sects. 2 to 3, as well as in Appendix A and B. Any other data will be made available upon request to the corresponding author.
All remaining samples will be made available upon request to the corresponding author.
HV conceptualized the project, acquired funding for it, and supervised it. FD and BG provided the study material. JN and BJ conducted the petrographic analysis. AD and EPB conducted the Liq-MC-ICP-MS analysis. LM, GB, FC, and CP performed the fsLA–single collector–ICP-SFMS analysis under the supervision of CP. LM synthesized the data and prepared the original draft, which was reviewed and edited by JN, EPB, BJ, CP, NM, and HV.
The contact author has declared that none of the authors has any competing interests.
Publisher’s note: Copernicus Publications remains neutral with regard to jurisdictional claims made in the text, published maps, institutional affiliations, or any other geographical representation in this paper. While Copernicus Publications makes every effort to include appropriate place names, the final responsibility lies with the authors.
This study has been funded by the Agence Nationale de la Recherche through the APART project (grant no. ANR-18-CE27-0004-01). We thank Rachel Roche Héritier of the Musée Archéologique of Soyons for welcoming and guiding us through the cave. The authors thank the PANOPLY analytical platform.
This research has been supported by the Agence Nationale de la Recherche (grant no. ANR-18-CE27-0004-01).
This paper was edited by Noah M. McLean and reviewed by one anonymous referee.
Andersen, F. A. and Brečević, L.: Infrared spectra of amorphous and crystalline calcium carbonate, Acta Chem. Scand., 45, 1018–1024, https://doi.org/10.1002/chin.199209005, 1992.
Argant, A.: Rapport d'étude “Réseau Ursus” à Soyons (Ardèche), 12 pp., 2010.
Aubert, M., Brumm, A., Ramli, M., Sutikna, T., Saptomo, E. W., Hakim, B., Morwood, M. J., van den Bergh, G. D., Kinsley, L., and Dosseto, A.: Pleistocene cave art from Sulawesi, Indonesia, Nature, 514, 223–227, https://doi.org/10.1038/nature13422, 2014.
Bronk Ramsey, C: Radiocarbon calibration and analysis of stratigraphy: the OxCal program, Radiocarbon, 37, 425–30, https://doi.org/10.1017/S0033822200030903, 1995.
Cailhol, D. and Audra, P.: Contexte géomorphologique des grottes de Soyons (Ardèche), proceedings of the “23e Rencontre d'Octobre”, Le Châtelard, France, 12–13 October 2013, 2014.
Cheng, H., Lawrence Edwards, R., Shen, C.-C., Polyak, V. J., Asmerom, Y., Woodhead, J. D., Hellstrom, J., Wang, Y., Kong, X., Spötl, C., Wang, X., and Calvin Alexander, E.: Improvements in 230Th dating, 230Th and 234U half-life values, and U–Th isotopic measurements by multi-collector inductively coupled plasma mass spectrometry, Earth Planet. Sc. Lett., 371/372, 82–91, https://doi.org/10.1016/j.epsl.2013.04.006, 2013.
Defleur, A., White, T., Valensi, P., Slimak, L., and Crégut-Bonnoure, É.: Neanderthal Cannibalism at Moula-Guercy, ArdeÌche, France, Science, 286, 128–13, https://doi.org/10.1126/science.286.5437.128, 1999.
Dumoulin, J. P., Comby-Zerbino, C., Delqué-Količ, E., Moreau, C., Caffy, I., Hain, S., Perron, M., Thellier, B., Setti, V., Berthier, B., and Beck, L.: Status report on sample preparation protocols developed at the LMC14 Laboratory, Saclay, France: from sample collection to 14C AMS measurement, Radiocarbon, 59, 713–726, https://doi.org/10.1017/RDC.2016.116, 2017.
Genuite, K., Delannoy, J. J., Bahain, J. J., Gresse, M., Jaillet, S., Phillippe, A., Pons-Branchu, E., Revil, A., and Voinchet, P.: Dating the landscape evolution around the Chauvet-Pont d'Arc cave, Sci. Rep., 11, 8944, https://doi.org/10.1038/s41598-021-88240-5, 2021.
Hellstrom, J.: U-Th dating of speleothems with high initial 230Th using stratigraphical constraint, Quat. Geochronol., 1, 289–295, https://doi.org/10.1016/j.quageo.2007.01.004, 2006.
Hoffmann, D. L., Utrilla, P., Bea, M., Pike, A. W. G., García-Diez, M., Zilhão, J., and Domingo, R.: U-series dating of Palaeolithic rock art at Fuente del Trucho (Aragón, Spain), Quaternary Int., 432, 50–58, https://doi.org/10.1016/j.quaint.2015.11.111, 2017.
Huang, C. K. and Kerr, P. F.: Infrared study of the carbonate minerals, Am. Min., 45, 311–324, 1960.
Jaffey, A. H., Flynn, K. F., Glendenin, L. E., Bentley, W. C., and Essling, A. M.: Precision measurements of half-lives and specific activities of 235U and 238U, Phys. Rev. C, 4, 1889–1906, https://doi.org/10.1103/PhysRevC.4.1889, 1971.
Machel, H. G., Mason, R. A., Mariano, A. N., and Mucci, A.: Causes and emission of luminescence in calcite and dolomite, edited by: Barker, C. E. and Kopp, O. C., Luminescence microscopy: quantitative and qualitative aspects, Soc. Sediment. Geol., 25, ISBN electronic: 9781565761063, ISBN print: 0918985889, https://doi.org/10.2110/scn.91.25.0009, 1991.
Martin, L., Galy, A., Barbotin, G., Claverie1, F., Pons-Branchu, E., Tribolo, C., Mercier, N., and Pécheyran, C.: Isotopic Imaging using fs-LA HR-ICPMS for direct dating of small archaeological carbonates, Anal. Chem., 94, 3046–3055, https://doi.org/10.1021/acs.analchem.1c02241, 2022.
Martín-García, R., Alonso-Zarza, A. M., Frisia, S., Rodríguez-Berriguete, Á., Drysdale, R., and Hellstrom, J.: Effect of aragonite to calcite transformation on the geochemistry and dating accuracy of speleothems, An example from Castañar Cave, Spain, Sediment. Geol., 383, 41–54, https://doi.org/10.1016/j.sedgeo.2019.01.014, 2019.
Mook, W. G. and Van Der Plicht, J.: Reporting 14C activities and concentrations, Radiocarbon, 41, 227–239, https://doi.org/10.1017/S0033822200057106, 1999.
Moreau, C., Messager, C., Berthier, B., Hain, S., Thellier, B., Dumoulin, J. P., Caffy, I, Sieudat, M., and Beck, L.: ARTEMIS, The 14C AMS facility of the LMC14 National Laboratory: a status report on quality control and microsample procedures, Radiocarbon, 62, 1755–1770, https://doi.org/10.1017/RDC.2020.73, 2022.
Perrin, C., Prestimonaco, L., Servelle, G., Tilhac, R., Maury, M., and Cabrol, P.: Aragonite–calcite speleothems: identifying original and diagenetic features, J. Sediment. Res., 84, 245–269, https://doi.org/10.2110/jsr.2014.17, 2014.
Pike, A. W., Hoffmann, D. L., García-Diez, M., Pettitt, P. B., Alcolea, J., De Balbin, R., González-Sainz, C., de las Heras, C., Lasheras, J. A., Montes, R., and Zilhão, J.: U-series dating of Paleolithic art in 11 caves in Spain, Science, 336, 1409–1413, https://doi.org/10.1126/science.1219957, 2012.
Plagnes, V., Causse, C., Fontugne, M., Valladas, H., Chazine, J.-M. and Fage, L.-H.: Cross dating () of calcite covering prehistoric paintings in Borneo, Quaternary Res., 60, 172–179, https://doi.org/10.1016/S0033-5894(03)00064-4, 2003.
Pons-Branchu, E., Douville, E., Roy-Barman, M., Dumont, E., Branchu, E., Thil, F., Frank, N., Bordier, L., and Borst W.: A geochemical perspective on Parisian urban history based on U-Th dating, laminae counting and yttrium and REE concentrations of recent carbonates in underground aqueducts, Quat. Geochronol., 24, 44–53, https://doi.org/10.1016/j.quageo.2014.08.001, 2014.
Pons-Branchu, E. Sanchidrian, J. L., Fontugne, M., Medina-Alcaide, M. A., Quiles, A., Thil, F., and Valladas H.: U-series dating at Nerja cave reveal open system. Questioning the Neanderthal origin of Spanish rock art, J. Archaeol. Sci., 117, 105120, https://doi.org/10.1016/j.jas.2020.105120, 2020.
Reimer, P. J., Austin, W. E. N., Bard, E., Bayliss, A., Blackwell, P. G., Ramsey, C. B., Butzin, M., Cheng, H., Edwards, R. L., Friedrich, M., Grootes, P. M., Guilderson, T. P., Hajdas, I., Heaton, T. J., Hogg, A. G., Hughen, K. A., Kromer, B., Manning, S. W., Muscheler, R., Palmer, J. G., Pearson, C., van der Plicht, J., Reimer, R. W., Richards, D. A., Scott, E. M., Southon, J. R., Turney, C. S. M., Wacker, L., Adophi, F., Büntgen, U., Capano, M., Fahrni, S., Fogtmann-Schulz, A., Friedrich, R., Köhler, P., Kudsk, S., Miyake, F., Olsen, J., Reinig, F., Sakamoto, M., Sookdeo, A., and Talamo, S.: The IntCal20 Northern Hemisphere radiocarbon calibration curve (0–55 kcal BP), Radiocarbon, 62, 725–757, https://doi.org/10.1017/RDC.2020.41, 2020.
Richter, S., Hennessy, C., Jakobsson, U., Aregbe, Y., and Hexel, C. : Re-Certification of the IRMM-183–187 series of uranium nitrate solution reference materials, Publications Office of the European Union, https://doi.org/10.2760/312568, 2022.
Roy-Barman, M. and Pons-Branchu, E.: Improved U-Th dating of carbonates with high initial 230Th using stratigraphical and coevality constraints, Quat. Geochronol., 32, 29–39, https://doi.org/10.1016/j.quageo.2015.12.002, 2016.
Sanchidrián, J. L., Valladas, H., Medina-Alcaide, M. A., Pons-Branchu, E., and Quiles A.: New perspectives for 14C dating of parietal markings using CaCO3 thin layers: an example in Nerja cave (Spain), J. Archaeol. Sci. Rep., 12, 74–80, https://doi.org/10.1016/j.jasrep.2017.01.028, 2017.
Scholz, D., Tolzmann, J., Hoffmann, D. L., Jochum, K. P., Spötl, C., and Riechelmann, D. F.: Diagenesis of speleothems and its effect on the accuracy of -ages. Chem. Geol., 387, 74–86, https://doi.org/10.1016/j.chemgeo.2014.08.005, 2014.
Spooner, P. T., Chen, T., Robinson, L. F., and Coath, C. D.: Rapid uranium-series age screening of carbonates by laser ablation mass spectrometry, Quat. Geochronol., 31, 28–39, https://doi.org/10.1016/j.quageo.2015.10.004, 2016.
Valladas, H., Pons-Branchu, E., Dumoulin, J.-P., Quiles, A., Medina-Alcaide, M. A., and Sanchidrain J.-L.: and C-14 cross dating of parietal calcite deposits: application to Nerja cave (Andalusia, Spain) and future perspectives, Radiocarbon, 59, 1955–1967, https://doi.org/10.1017/RDC.2017.120, 2017.
- Abstract
- Introduction
- Materials and methods
- Results
- Implication for rock art studies
- Conclusion and prospective strategy
- Appendix A: Images of the SOY-19-01 and SOY-19-03 samples in optical microscopy (plane-polarized light) and cathodoluminescence (CL) microscopy
- Appendix B: fsLA–single collector–ICP-SFMS mappings of 238U signal and of the 232Th/238U ratio for the different samples
- Code availability
- Data availability
- Sample availability
- Author contributions
- Competing interests
- Disclaimer
- Acknowledgements
- Financial support
- Review statement
- References