the Creative Commons Attribution 4.0 License.
the Creative Commons Attribution 4.0 License.
 | 18 Jan 2021
Novel method for determining 234U–238U ages of Devils Hole 2 cave calcite (Nevada)
Kathleen A. Wendt
Yuri Dublyansky
Gina E. Moseley
Christoph Spötl
R. Lawrence Edwards
Uranium–uranium (234U–238U) disequilibrium dating can determine the age of secondary carbonates over greater time intervals than the well-established 230Th–234U dating method. Yet it is rarely applied due to unknowns in the initial δ234U (δ234Ui) value, which result in significant age uncertainties. In order to understand the δ234Ui in Devils Hole 2 cave, Nevada, we have determined 110 δ234Ui values from phreatic calcite using 230Th–234U disequilibrium dating. The sampled calcite was deposited in Devils Hole 2 between 4 and 590 ka, providing a long-term look at δ234Ui variability over time. We then performed multi-linear regression among the δ234Ui values and correlative δ18O and δ13C values. The regression can be used to estimate the δ234Ui value of Devils Hole calcite based upon its measured δ18O and δ13C values. Using this approach and the measured present-day δ234U values of Devils Hole 2 calcite, we calculated 110 independent 234U–238U ages. In addition, we used newly measured δ18O, δ13C, and present-day δ234U values to calculate 10 234U–238U ages that range between 676 and 731 ka, thus allowing us to extend the Devils Hole chronology beyond the 230Th–234U-dated chronology while maintaining an age precision of ∼ 2 %. Our results indicate that calcite deposition at Devils Hole 2 cave began no later than 736 ± 11 kyr ago. The novel method presented here may be applied to future speleothem studies in similar hydrogeological settings, given appropriate calibration studies.
- Article
(1806 KB) - Full-text XML
-
Supplement
(623 KB) - BibTeX
- EndNote


The mid-20th century discovery of 234U–238U disequilibrium in natural waters (Cherdyntsev, 1955; Isabaev et al., 1960; Thurber, 1962) unlocked a new geochronometer for sediments in marine and freshwater settings. The greatest limitation of the 234U–238U dating method, however, lies in the uncertainty of the initial δ234U (δ234Ui), as shown in Eq. (1):
where δ234Up refers to the present δ234U value, δ234Ui refers to the δ234U value at the time of deposition, λ234 is the decay constant of 234U, and T refers to the time elapsed since deposition. In marine settings, δ234Ui can be approximated using the known excess 234U activity in seawater. Ku (1965) was the first to test the 234U–238U geochronometer in marine sediments. Although this method has been applied successfully in marine-sourced secondary carbonates (Veeh, 1966; Bender et al., 1979; Ludwig et al., 1991), it has largely been limited by the potential mobility of U following deposition, as observed in mollusks (Kaufman et al., 1971) and corals (Bender et al., 1979; Gallup et al., 1994).
In freshwater settings, constraining the δ234Ui of secondary carbonates is further complicated by the fact that, in contrast to seawater, terrestrial surface and groundwaters exhibit a wide spatial and temporal variability in δ234U. Uncertainties in determining past δ234Ui result in 234U–238U age uncertainties that are orders of magnitude greater than those common for 230Th–234U disequilibrium dating. 230Th–234U dating has thus remained the preferred method for determining the age of secondary carbonates that have been deposited between the modern day and ∼ 600 ka, at which secular equilibrium between 230Th and 234U has been nearly restored. However, with a firm understanding of past source-water δ234Ui, the 234U–238U disequilibrium method is a powerful geochronometer that can reach deeper in time than 230Th–234U disequilibrium dating (e.g., Gahleb et al., 2019).
The Devils Hole (DH) and neighboring Devils Hole 2 (DH2) caves are ideal settings for the study of groundwater δ234Ui variations over time. The walls of both steep fractures are coated with thick (up to ∼ 90 cm) layers of calcite deposits that have precipitated subaqueously at a rate of approximately 1 mm per 1000 years (Ludwig et al., 1992; Moseley et al., 2016). Small variations in calcite δ234Ui (1851 ‰–1616 ‰) over the last 500 kyr have been precisely determined by Ludwig et al. (1992) and Wendt et al. (2020). Due to the high initial 234U excess in DH and DH2 calcite (mean δ234Ui=1750 ‰), the 234U–238U disequilibrium method can theoretically determine the age of DH and DH2 calcite as old as 2.5 Ma.
Ludwig et al. (1992) were the first to calculate 234U–238U ages from DH calcite. To do so, they derived the δ234Ui value from 21 230Th–234U ages between 60 and 350 ka. From this dataset, they calculated the median δ234Ui value (1750 ‰) and associated uncertainty (±100 ‰); the latter was derived from the range of δ234Ui over the selected time period. Using this δ234Ui value, 18 234U–238U ages were calculated. The ages ranged between 385 and 568 ka with mean uncertainties of 20 kyr (3 %–5 % relative uncertainty) (Ludwig et al., 1992).
Building upon the pioneering work of Ludwig et al. (1992), we aim to decrease the uncertainties of DH and DH2 δ234Ui in order to improve the precision of 234U–238U ages. A negative correlation between DH δ234Ui and δ18O, and a positive correlation between δ234Ui and δ13C, is observed over the last 500 kyr (Ludwig et al., 1992). Similar correlative patterns were obtained over the last 200 kyr using separate drill cores from DH2 (Moseley et al., 2016) and were shown to be independent of U concentrations (Fig. S1; Wendt et al., 2020). In this study, we show that by accounting for changes in δ234Ui with respect to δ18O and δ13C, we can reduce the uncertainty in δ234Ui by 40 %, thereby reducing the uncertainty in 234U–238U ages to about ± 13 kyr within a several-hundred-thousand-year range. We then use this method to calculate the age of calcite that was deposited in DH2 prior to (older than) the limit of 230Th–234U disequilibrium dating (∼ 600 ka). Doing so allows us to extend the radiometric chronology and determine the time at which calcite first deposited in DH2.
1.1 Regional setting
The DH and DH2 caves are located 100 m apart in a detached area of Death Valley National Park in southwest Nevada (36∘25′ N, 116∘17′ W; 719 m above sea level). Bedrock of the study area is composed of carbonates from the Bonanza King Formation of middle and late Cambrian age (Barnes and Palmer, 1961). The caves follow a pair of deep, planar, steeply dipping fault-controlled open fissures roughly 5 m wide, 15 m long, and at least 130 m deep (Riggs et al., 1994). Evidence for the tectonic origin of these caves includes the spreading and the orientation of their planar opening, which is perpendicular to the northwest–southeast principal stress direction that has prevailed in this part of the Great Basin for the last 5 Myr (Carr, 1974). Parts of these extensional fractures were later modified by condensation corrosion (Dublyansky and Spötl, 2015).
DH and DH2 both intersect the water table of the Ash Meadows Groundwater Flow System (AMGFS), which is a large (∼ 12 000 km2) aquifer hosted in Paleozoic limestone (Winograd and Thordarson, 1975). The AMGFS is primarily recharged by infiltration of snowmelt and rainfall in the upper elevations of the Spring Mountains (∼ 500 mm a−1; Winograd and Thordarson, 1975; Thomas et al., 1996; Winograd et al., 1998; Davisson et al., 1999). Quaternary extensional tectonics in this area has produced an underground network of open fractures which contribute to the high transmissivity of the aquifer. Previous studies suggest groundwater transit times of <2000 years from the Spring Mountains to DH/DH2 caves (Winograd et al., 2006). Due to the long flow path (>60 km) and prolonged residence time, the groundwater flowing southwest through both caves is very slightly supersaturated with respect to calcite (SI of 0.2; Plummer et al., 2000). The caves are <1.5 km upgradient from a line of springs that represent the primary discharge area of the AMGFS.
Calcite has been continuously depositing as dense mammillary crusts on the submerged walls of DH and DH2 over much of the last 1 Myr at a very slow rate of roughly 1 mm kyr−1 (Ludwig et al., 1992; Winograd et al., 2006; Moseley et al., 2016). The thickness (≤90 cm) of mammillary calcite crusts implies a long history of calcite-supersaturated groundwater. Regional groundwater transmissivity is maintained despite calcite precipitation due to active extensional tectonics (Riggs et al., 1994).
A 670 mm long core was drilled from the hanging wall of DH2 cave at +1.8 m relative to the modern water table (r.m.w.t.). The first 654 mm of the core consist of calcite; the last 16 mm of the core consist of bedrock. The core consists of two types of calcite: mammillary calcite and folia. For a full description of the petrographic and morphological differences between both forms of calcite, see Wendt et al. (2018). Briefly, mammillary calcite precipitates subaqueously, while folia forms at the water table in a shelf-like formation. The presence of folia in the core is an indicator of the paleo-water table near +1.8 m r.m.w.t. at the time of deposition.
The selected core was cut longitudinally and polished. The core was surveyed for growth hiatuses and features indicative of changing deposition mechanisms and rates (such as folia). Folia was identified at 77.7–97.4 mm (as reported in Moseley et al., 2016), 171.4–199.2, 209.4–229.0, and 305.0–323.0 mm (distances are reported from top of the calcite sequence). In addition, a growth hiatus was discovered between 587.4 and 589.0 mm (Fig. S2).
The mammillary calcite portions of the core were 230Th–234U dated at regular intervals (n=110). As described in Moseley et al. (2016), folia calcite cannot be reliably dated. Results for the first 91 230Th–234U ages were published by Moseley et al. (2016) and Wendt et al. (2020). Nine additional 230Th–234U ages were measured between 351.0 and 562.0 mm using identical methodology to the aforementioned publications. The purpose of additional 230Th–234U ages is to extend the DH2 chronology to the near limit of 230Th–234U dating (about 600 ka). Between 608.2 and 652.0 mm, 10 new δ234U measurements were collected for this study. To do so, calcite powders were hand drilled at approximately 1 cm intervals and spiked following the 230Th–234U dating method cited above. The U aliquots were then extracted and measured following the methods described in Cheng et al. (2013). Chemical blanks were measured with each set of 10–15 samples and were found to be negligible (<50 ag for 230Th, <100 ag for 234U, and <1 pg for 232Th and 238U).
Samples for stable isotope measurements were micromilled continuously at 0.1–0.2 mm intervals along the core axis between 0 and 158 mm and presented by Moseley et al. (2016). The values of two to three stable isotope measurements (0.1–0.2 mm in width) were averaged in order to pair with 230Th–234U subsamples, which averaged 0.3 to 0.5 mm in width. Between 169.8 and 652.0 mm, 66 new stable isotope samples were micromilled at the location of each 230Th–234U and δ234U measurement published by Wendt et al. (2020). Similarly, two to three stable isotope measurements were averaged to encompass the width of U isotope subsamples. Calcite powders were analyzed using a Delta V plus isotope ratio mass spectrometer interfaced with a Gasbench II. Values are reported relative to Vienna Pee Dee Belemnite (VPDB) with 1σ precisions of 0.06 ‰ and 0.08 ‰ for δ13C and δ18O, respectively.
A statistical model was built to predict δ234Ui values based on the correlation observed between measured δ234Ui and stable isotope values from 4 to 590 ka. To calculate the correlation analysis for unevenly spaced time series, we chose the Fortran 90 program PearsonT3, which can provide the 95 % calibrated confidence intervals (Olafsdottir and Mudelsee, 2014). OriginPro software (version 2015) was used to conduct the regression analyses (Moberly et al., 2018; see detailed description in the Supplement). Several types of models fitted with linear, quadratic, and cubic regression methods were built. The model that provided the best estimate of the measured δ234Ui values was selected. Using this model, a statistically derived (SD) δ234Ui value can be generated based on known δ18O and δ13C values. The SD δ234Ui and measured δ234Up can then be used to calculate 234U–238U ages (Eq. 1). The 234U decay constant of 2.82206 ± 0.00302×10⁻⁶ a−1 (Cheng et al., 2013) was used. We validated our methodology and uncertainty estimates by comparing 230Th–234U and 234U–238U dates obtained for samples younger than 590 ka.
Using this dataset, we calculated 120 234U–238U ages for samples in total. With these ages as input, we calculated an age model using the OxCal version 4.2 Bayesian statistical software (Bronk Ramsey and Lee, 2013). Age models were calculated under deposition sequence “P” with the k parameter set to 0.1 (Bronk Ramsey and Lee, 2013). The positions of growth hiatuses, including folia calcite, were incorporated into the age model as growth boundaries.
The new 230Th–234U disequilibrium ages (denoted in subsequent text as 230Th ages for simplicity) are in stratigraphic order within uncertainties. 238U and 232Th concentrations fall within the range of previous data published by Moseley et al. (2016) and Wendt et al. (2020). The time–depth consistency and reproducibility of ages argue against open-system processes. The existence of an approximately 67 kyr growth hiatus between 587.4 and 589.0 mm is supported by 234U–238U ages (see the Supplement).
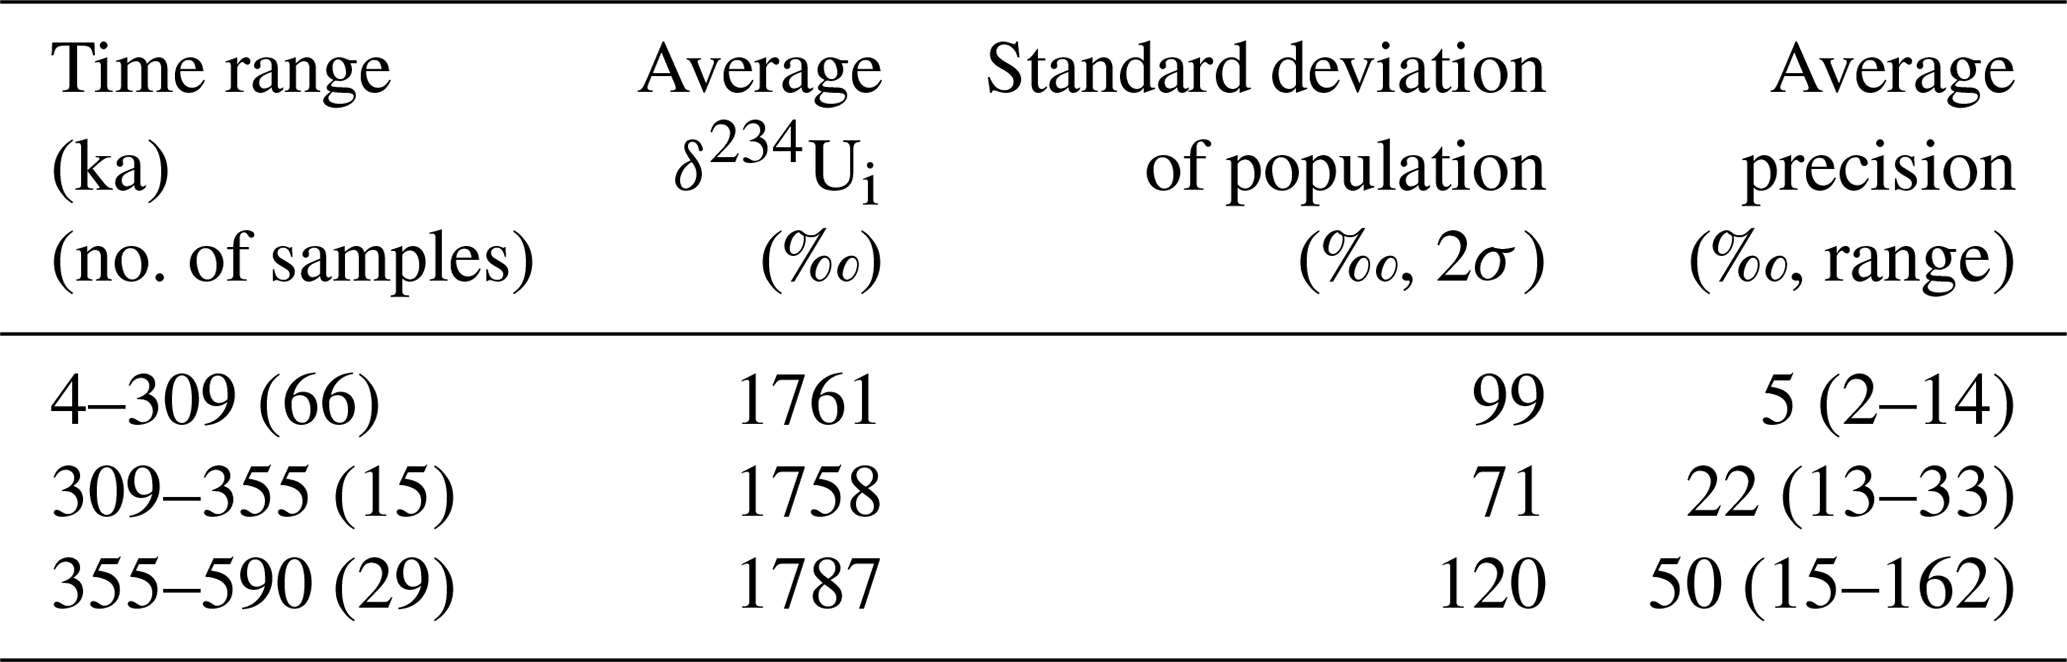
In this study, we split the δ234Ui dataset into three sections (4–309, 309–355, and 355–590 ka). The sections were divided according to the level of uncertainty in δ234Ui derived from 230Th ages (see Tables 1 and S4). The average δ234Ui was the same within uncertainties regardless of how we grouped the data, implying no detectable trend in δ234Ui with time.
Table 1Statistics of δ234Ui with different temporal groupings.
DH2 oxygen isotope values reveal a negative correlation with δ234Ui over the last 590 kyr (0–578 mm along the core axis; with the 95 % confidence interval of [−0.81; −0.06]), whereas carbon isotopes reveal a positive correlation (r=0.71 with the 95 % confidence interval of [0.57; 0.81]; Fig. 1 and Table 2). The interpretation of δ18O and δ13C in DH and DH2 calcite has been extensively discussed in Winograd et al. (1988, 1992, 2006), Coplen et al. (1994), and Moseley et al. (2016). DH/DH2 δ18O is a reflection of meteoric precipitation at the principal recharge zones of the AMGFS. Modern meteoric δ18O varies seasonally by >10 ‰ in southern Nevada (Ingraham et al., 1991). Winter precipitation (−12 ‰ to −14 ‰ Vienna Standard Mean Ocean Water; VSMOW) is sourced from the Pacific and provides the dominant fraction (∼ 90 %) of aquifer recharge, while summer precipitation (0 ‰ to −3 ‰ VSMOW) is sourced from monsoonal systems from the gulfs of Mexico and California (see Winograd et al., 1998, for details). We interpret past variations in DH/DH2 δ18O to be the result of (i) changes in temperature and variations in the path length of moisture transport through Rayleigh fractionation processes, (ii) changes in δ18O values at moisture source regions, and (iii) changes in the relative contributions of summer versus winter precipitation (see Moseley et al., 2016, for details). Past DH/DH2 δ13C variations have been argued to reflect the extent and density of vegetation in the recharge zones of AMGFS, such that δ13C minima correspond to periods of maximum vegetation (Coplen et al., 1994).
Table 2Correlation coefficient (r) with the 95 % calibrated confidence intervals (in brackets) for pairs of δ18O, δ13C, and δ234Ui.
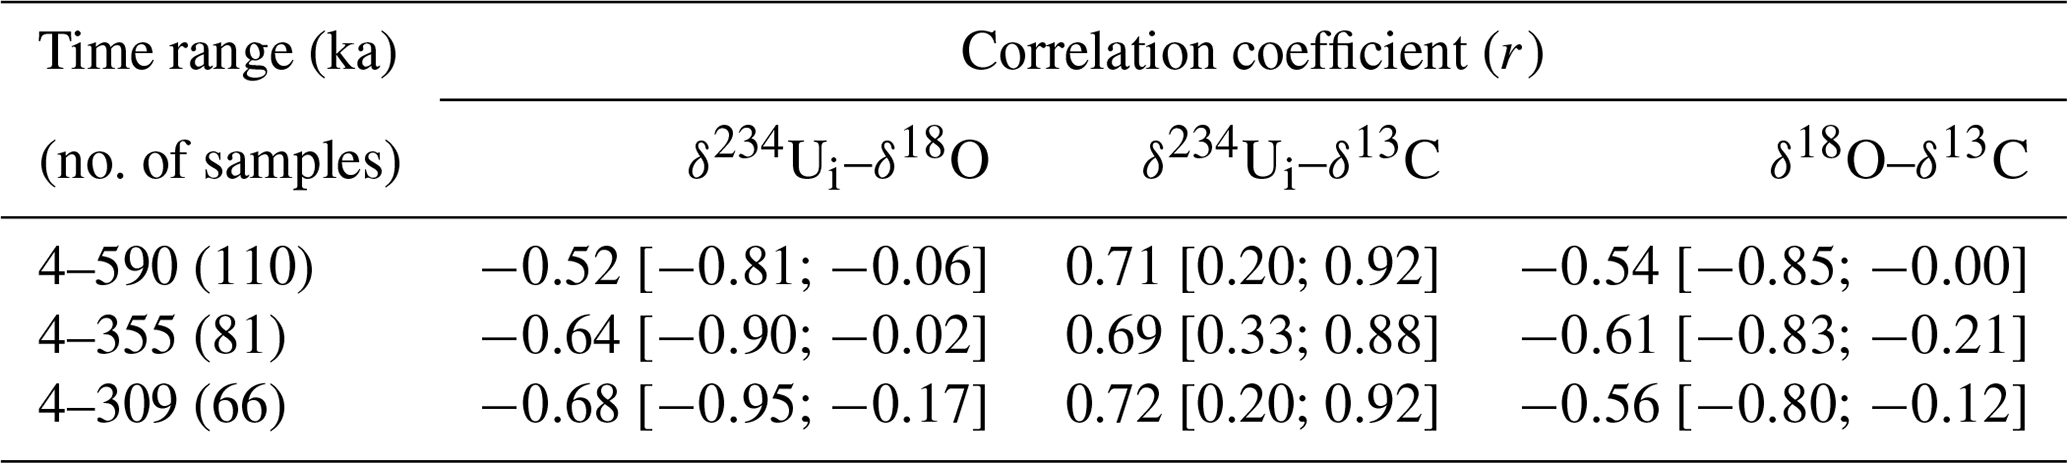
Note that all the 95 % confidence intervals do not cross zero, indicating that all the r values are significant.
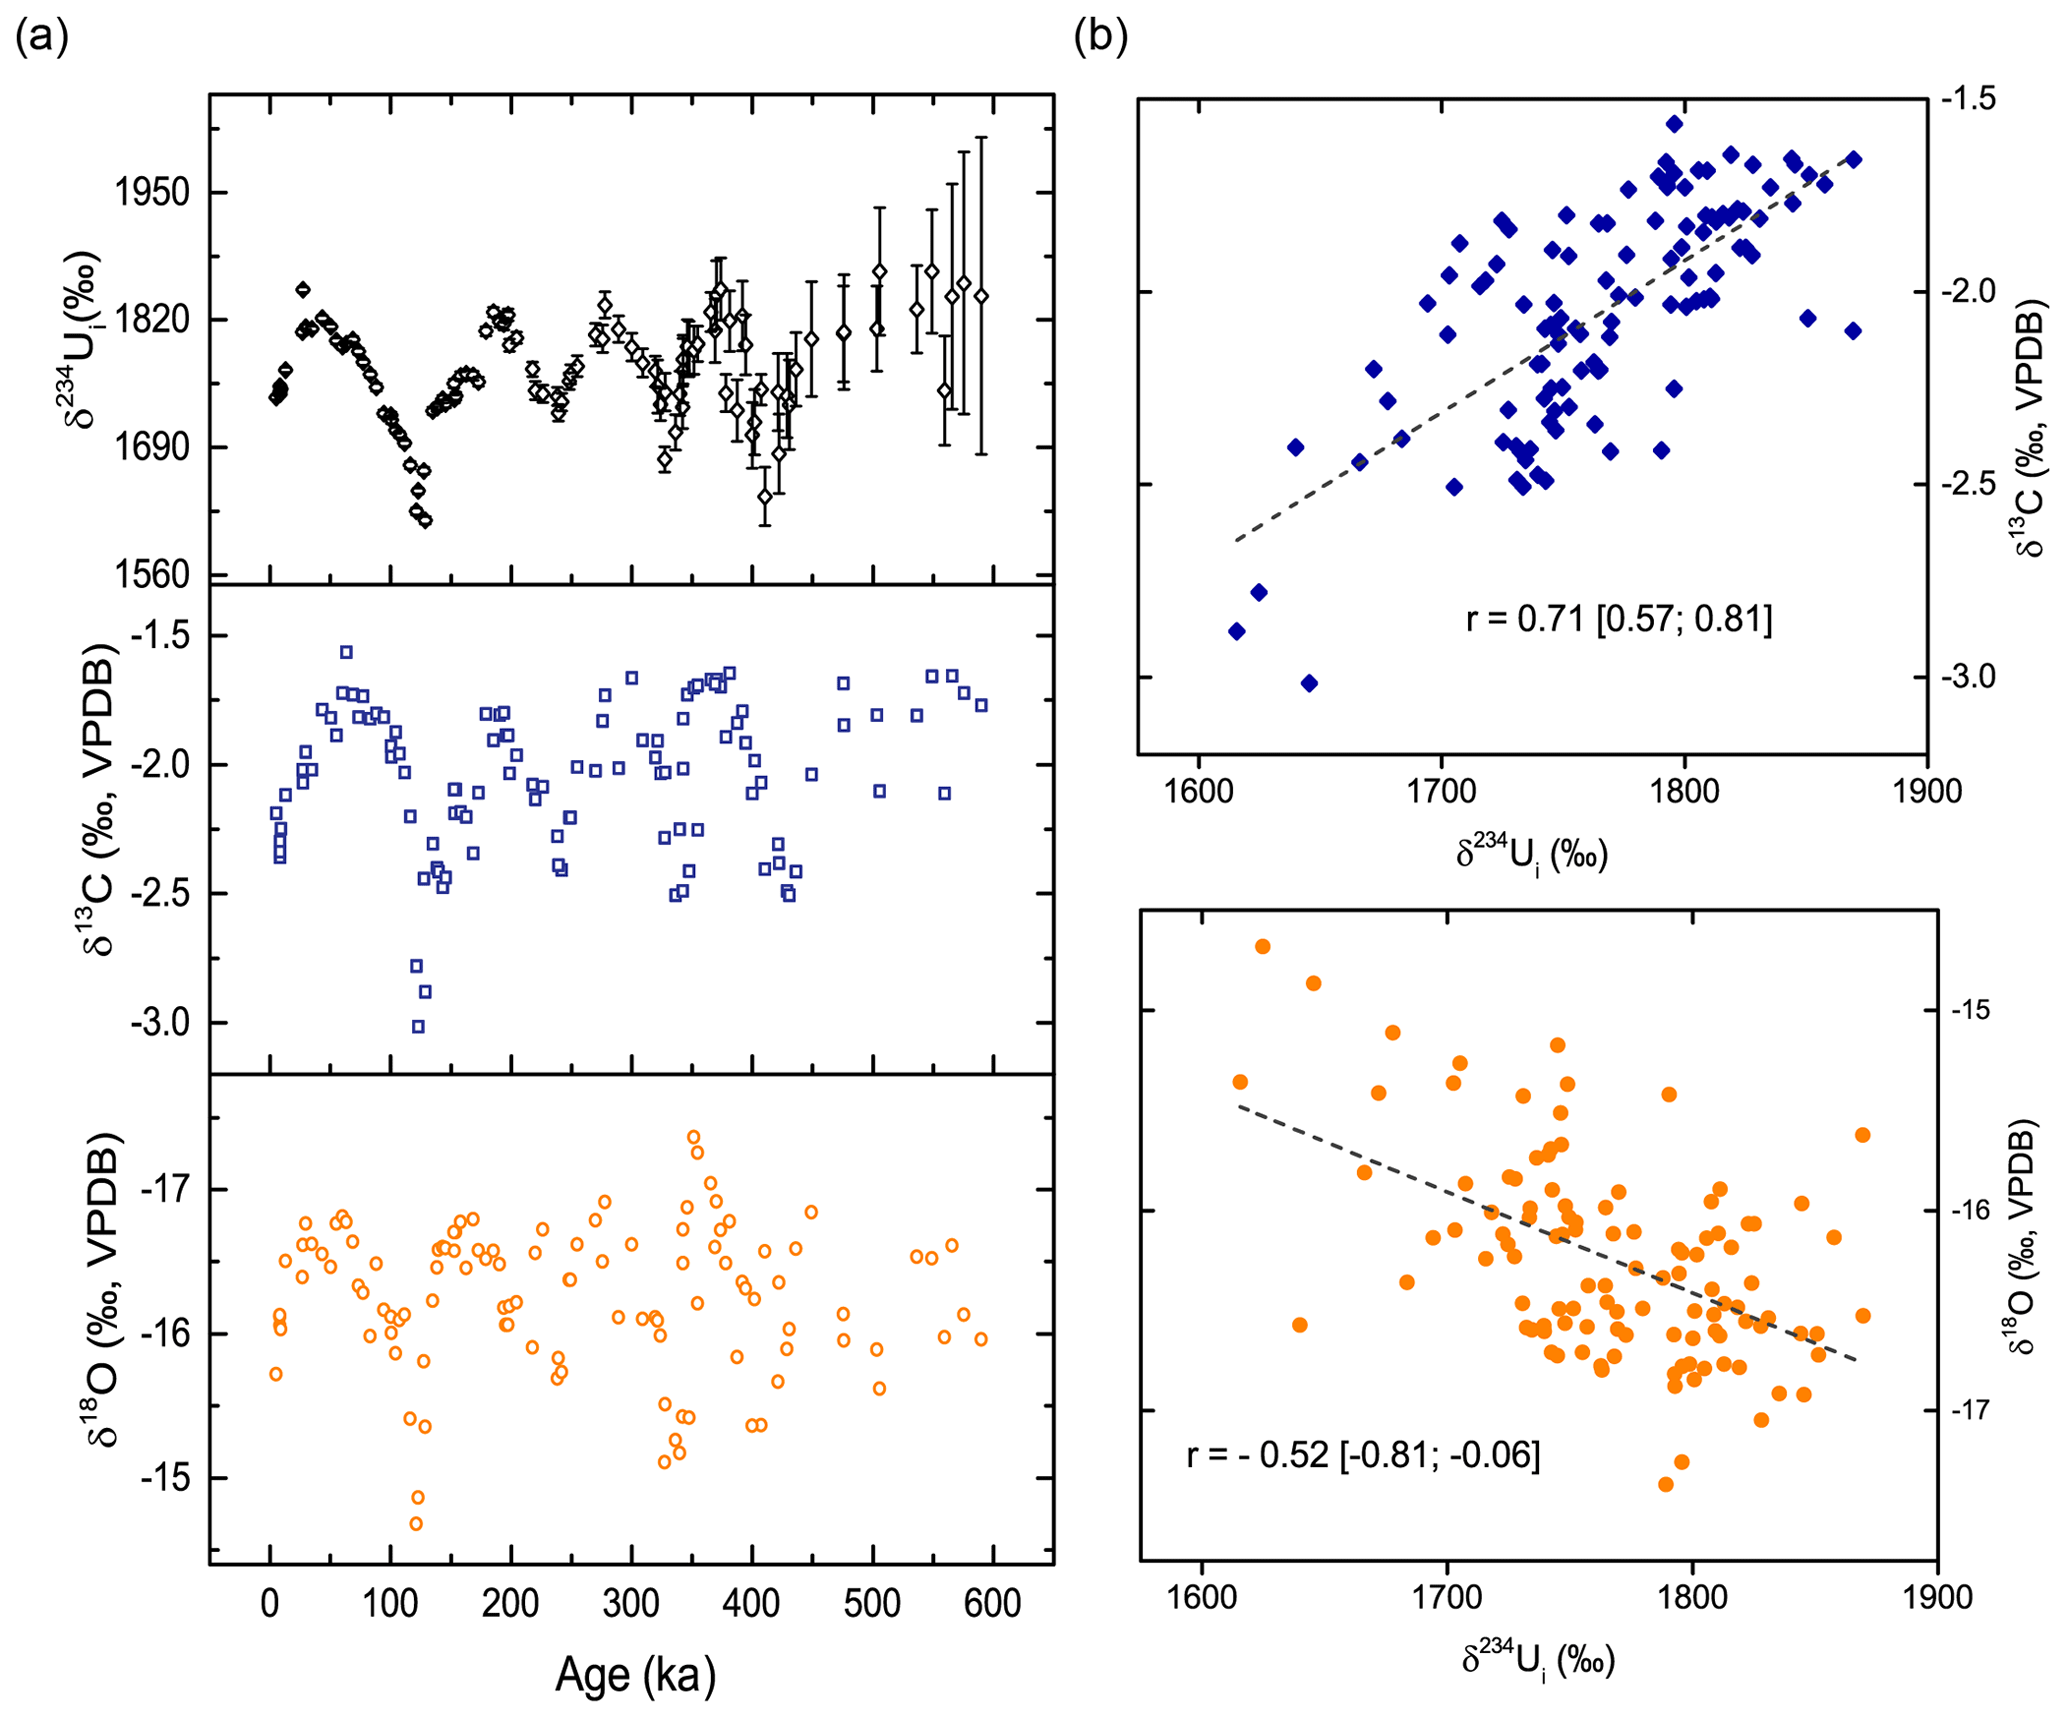
Figure 1(a) Plots of DH2 230Th-derived δ234Ui, δ13C, and δ18O over the last 590 kyr; (b) scatter plots between DH2 230Th-derived δ234Ui and δ13C, and 230Th-derived δ234Ui and δ18O, respectively. Correlation coefficients (r) with 95 % calibrated confidence intervals and fitting curve (dashed lines) are shown.
The linear relationships presented here are consistent with results from Moseley et al. (2016) and Ludwig et al. (1992) in the DH2 and DH caves, respectively. The anti-correlation between δ18O and δ234Ui is consistent with the interpretation presented in Wendt et al. (2020) such that periods of increased regional moisture availability (due to cooler, wetter conditions favoring depleted δ18O values) are associated with increased DH δ234Ui values. A full list of correlation calculations among δ234Ui, δ18O, and δ13C is presented in Table 2. The linear relationship between δ13C and δ234Ui is closer than that between δ18O and δ234Ui for the same period. This is likely due to the fact that δ13C and δ234Ui are forced by local processes, including changes in vegetation density at the principal recharge zone and groundwater interaction with bedrock in the aquifer. Since changes in the local environmental and hydrological regime are closely interconnected, we expect similar trends in the timing and pattern of δ13C and δ234Ui signals. In contrast, DH/DH2 δ18O reflects the δ18O of meteoric precipitation, which is sensitive to regional atmospheric temperatures and changes in moisture source (Winograd et al., 1998; Moseley et al., 2016). Evidence suggests no secular temperature changes in the local aquifer over the last several glacial–interglacial cycles (Kluge et al., 2014); thus, DH/DH2 δ18O is expected to be minimally influenced by aquifer-related processes. Overall, we expect a greater scatter in the δ18O vs. δ234Ui regression due to the compounding forcings that influence δ18O on a much larger spatial scale.
From Table 2, we can see that the modulus value for δ18O and δ234Ui is greatest in the 4–309 ka dataset, which represents the time span with the highest precision δ234Ui values. In contrast, the values for δ13C and δ234Ui are similar regardless of δ234Ui precision. We therefore explored various time ranges and types of regressions in order to determine the most precise predictor of δ234Ui based upon δ18O and/or δ13C.
3.1 Regression analysis
We evaluated the linear and polynomial (quadratic and cubic) regression methods primarily by calculating the coefficient of determination (COD), i.e., R2. The R2 value represents the percentage of variation of the SD δ234Ui in terms of the total of observed δ234Ui. To further compare the robustness between different models, we adjusted the R2 values from the different numbers of predictors, i.e., the degree of freedom (DF) of the predictors. The adjusted R2 (adj. R2) values is shown in Table 3. All models were calculated without considering the analytical uncertainty of δ234Ui values (see the Supplement for more information).
Table 3Adjusted R2 values for different models with various regression analysis methods.
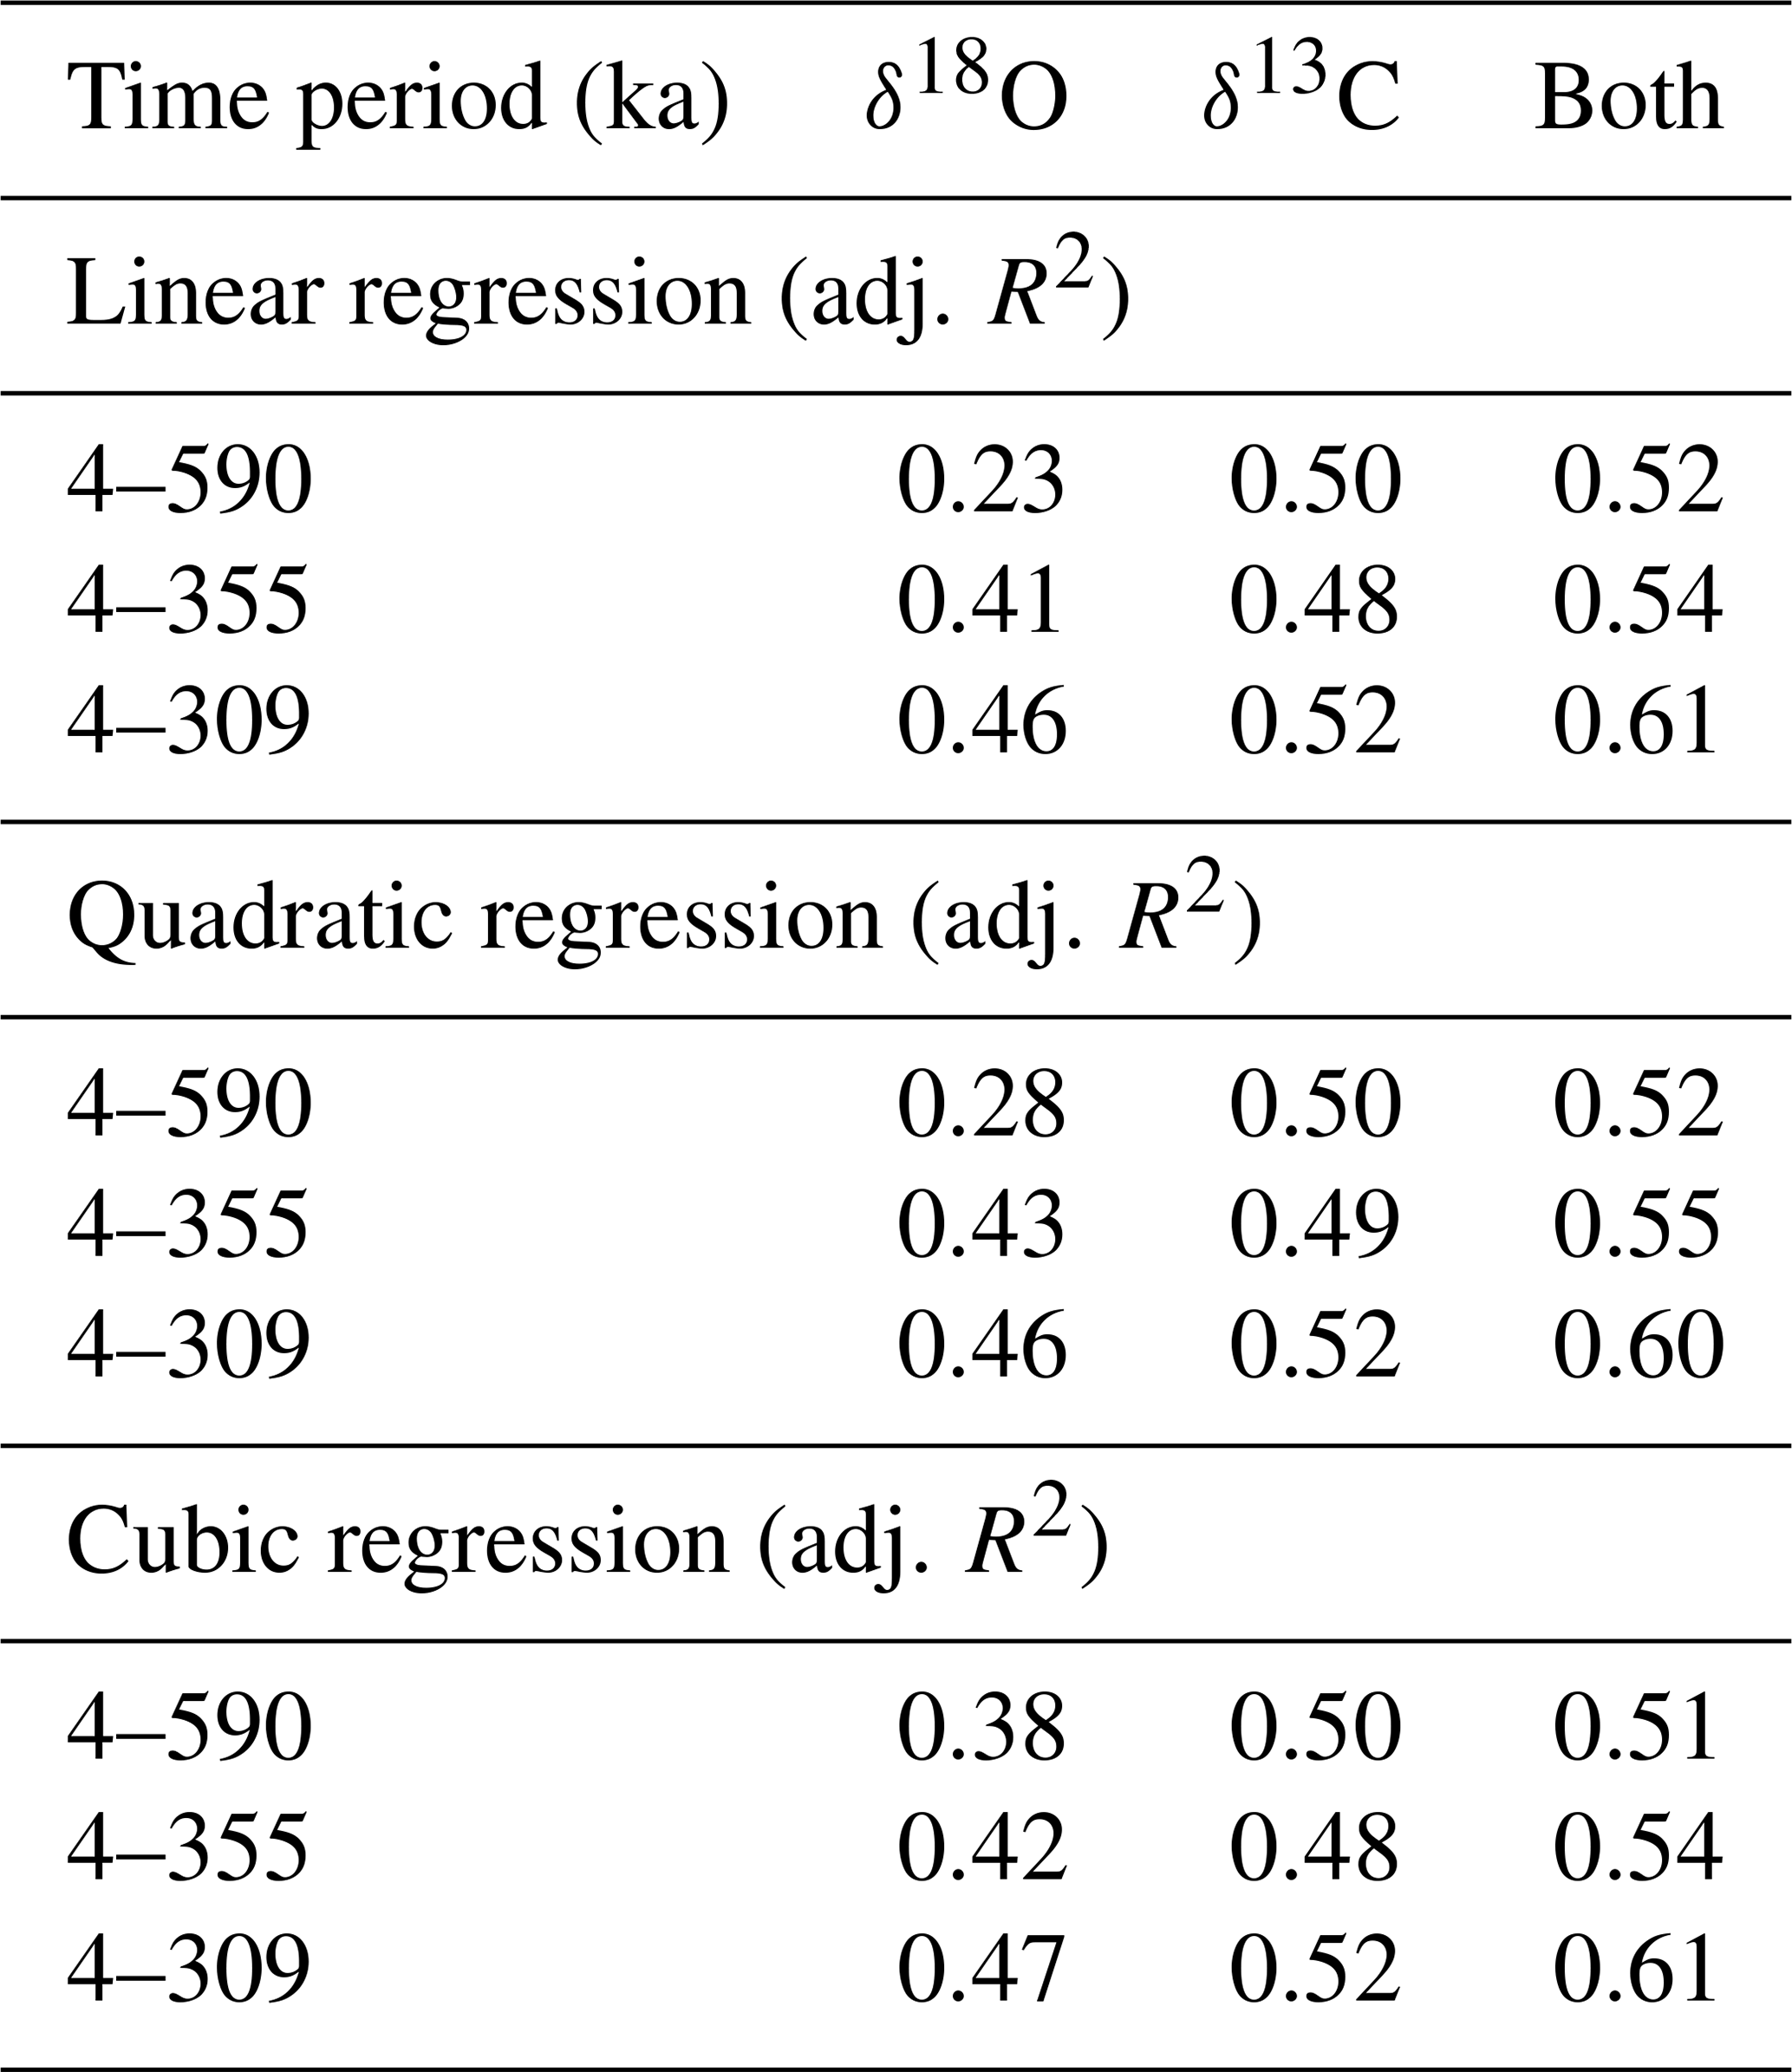
Note that the robustness of the regression model can be evaluated by the coefficient of determination (COD), R2, which is defined as R2=1 − (residual sum of squares, RSS)∕(total sum of squares, TSS). Adj. R2=1 − (RSS∕(DF of residual))∕(TSS∕(DF of total predictors)).
Among the various models, multiple linear regression (MLR) for the time period 4–309 ka in terms of both δ18O and δ13C yielded the highest adj. R2 value of 0.613 (rounded to 0.61), such that over this time span the model accounts for 61 % of the δ234Ui variability (Table 3). The corresponding equation is as follows (Table 4):
Table 4A t test table of the multiple linear regression model for 4–309 ka.
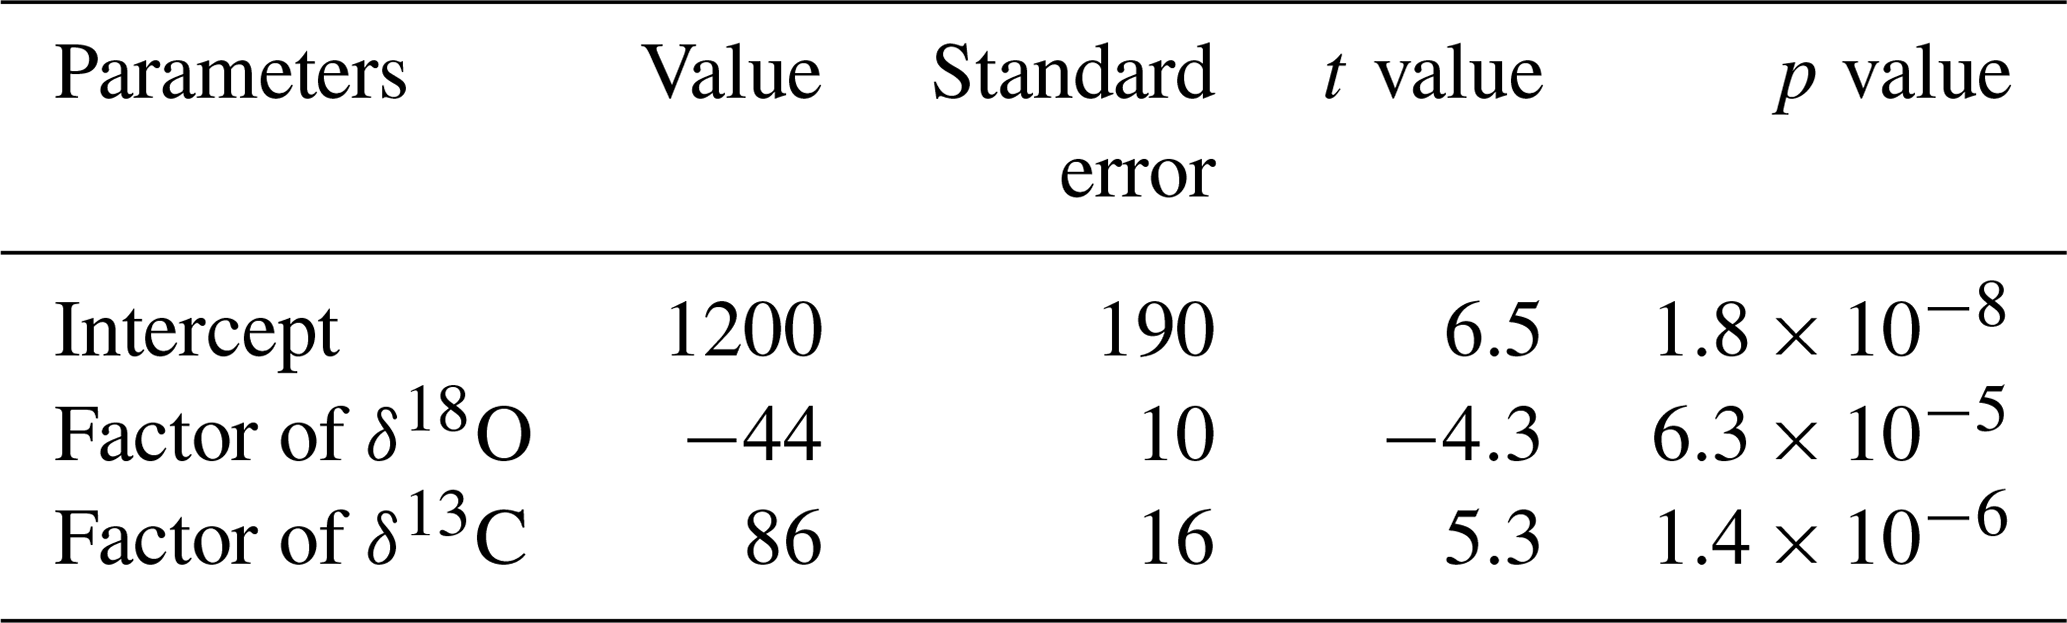
Note that (1) the standard error of fitting parameters was calculated based on the standard deviation of the residual from the model and used only for the t test; (2) a smaller p value represents a decreased likelihood that the parameter is equal to zero.
We then applied statistical methods to test the robustness of the chosen model, starting with the F test. The F value is the ratio of the mean square of the fitted model to the mean square of the residual. A ratio that deviates greatly from 1 indicates that the model differs significantly from the “y = constant” model. The test returned F equal to 52.5, far larger than the critical value of the F test at a significance level of α=0.01 (DF of the numerator is equal to 2; DF of the denominator is equal to 65; Fcrit is 4.95), indicating that the model is tenable. Additional confidence in the robustness of the chosen model is derived from the autocorrelation results (see the Supplement).
Second, we performed a t test to check if every term in the MLR for 4–309 ka is significant. The t value is the ratio of the fitted value to its standard error. As shown in the Table 4, all the fitted values (coefficients and intercept) are significant at a significance level of α=0.001. Thus, we conclude the regression model to be robust.
3.2 Residual analysis
We now estimate the uncertainty of the SD δ234Ui values over the past 309 kyr by analyzing the residuals, which are defined as the differences between the observed and predicted values. Figure 2 reveals that the residuals are approximately normal in distribution. Thus, we conclude that the regression model captures the dominant characteristic of variability in the observed values. The estimate of the residuals yields an uncertainty of ±61 ‰ (95 % confidence interval) with an average of essentially zero (<10−12). We take the ±61 ‰ value to represent a constant uncertainty for all the SD δ234Ui values, amounting to a ∼ 40 % reduction in δ234Ui uncertainties (the original estimate of uncertainty from Ludwig et al. (1992) was 100 ‰). The analytical uncertainty of 230Th-derived δ234Ui is combined with (i) uncertainty of measured δ234Up, which is incorporated into the 234U–238U ages (see the following section), and (ii) the uncertainty of 230Th ages which is negligible relative to uncertainty of the model over the past 309 kyr (see Tables 1 and S4 for details). Therefore, we do not take this analytical uncertainty into account.
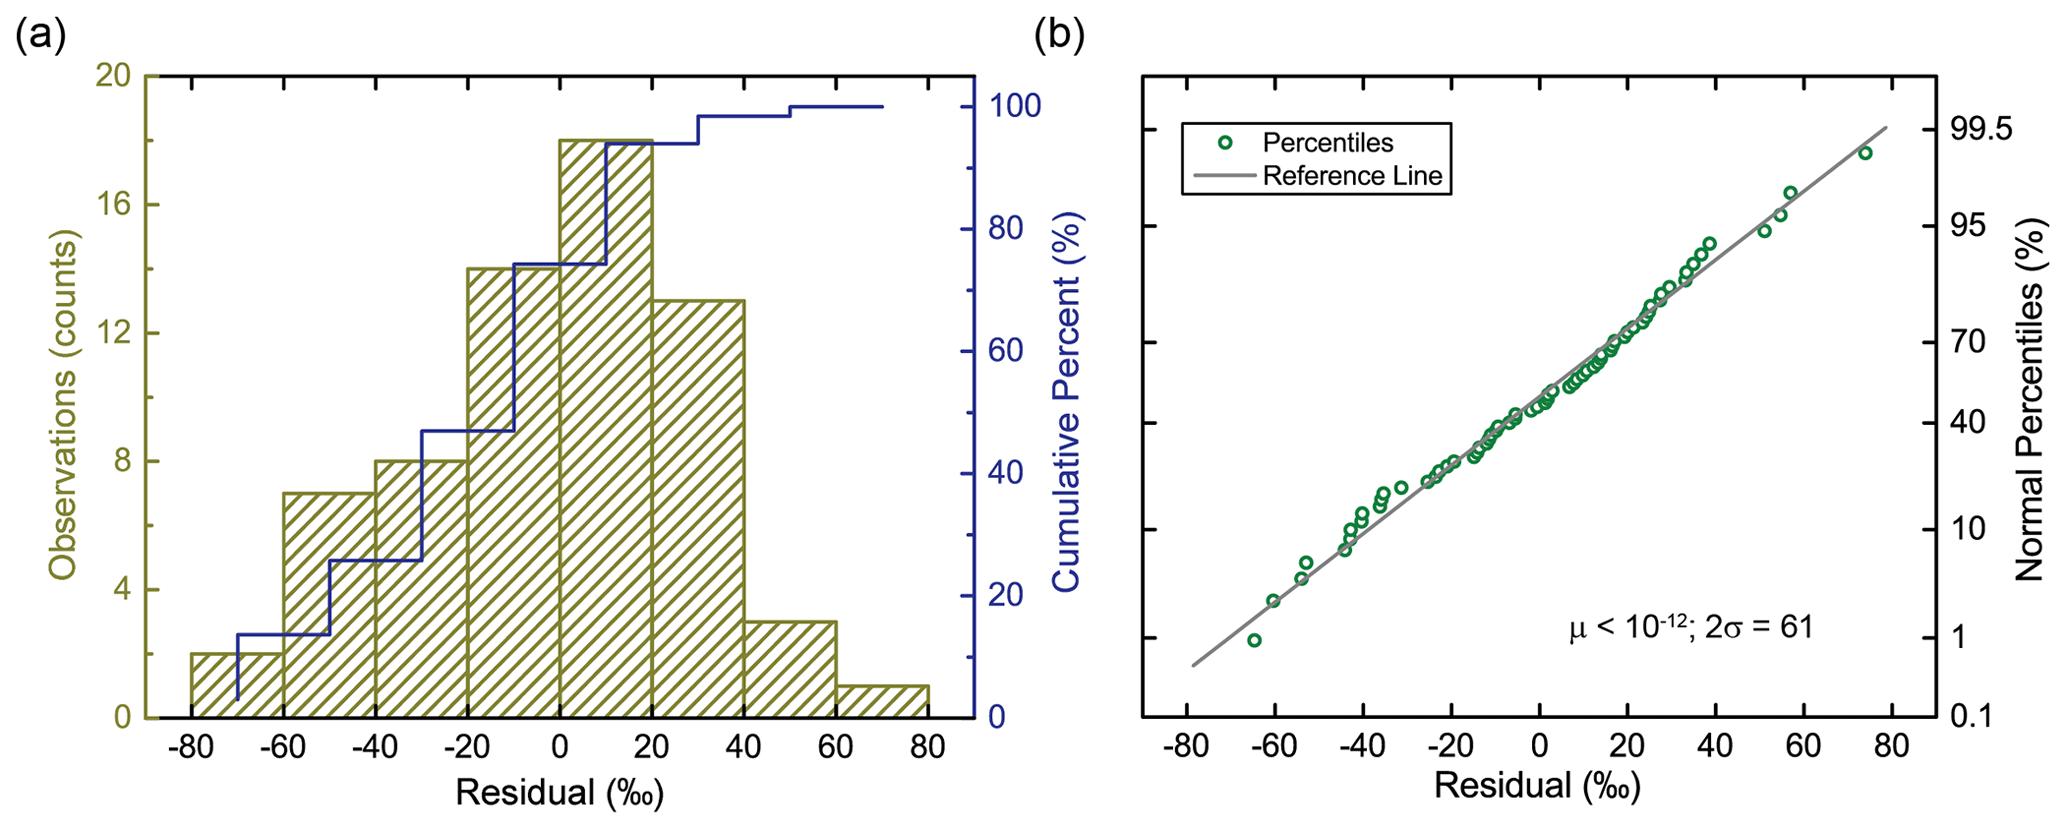
Figure 2Histogram (a) and normal percentile plot (b) of the residuals. The reference line in panel (b) refers to the line of standard normal distribution.
3.3 234U–238U ages
Using Eqs. (1) and (2), we then calculated the 234U–238U disequilibrium ages (denoted in subsequent text as 234U ages for simplicity) for each data point for which δ234Up, δ18O and δ13C are measured. The final uncertainty of 234U ages comes from two sources: (i) the uncertainty of the model and (ii) the uncertainty in determination of δ234Up. Combined, the final uncertainty of 234U ages before 590 ka is approximately ± 13 kyr (2σ; Table S4), which represents a 35 % improvement relative to previously reported 234U ages from DH (±20 kyr; Ludwig et al., 1992).
The 234U and 230Th ages between 4 and 590 ka are consistent within uncertainties (Fig. 3), with the exception of four ages (out of 110) at 27, 348, 410, and 503 ka. Since uncertainties are reported at the 95 % confidence level, we would expect this number of statistical outliers and conclude that our analysis is overall internally consistent. Alternately, there may be some unknown underlying process not captured by our analysis which may be consistent with the variability of the residuals (see Fig. S3).
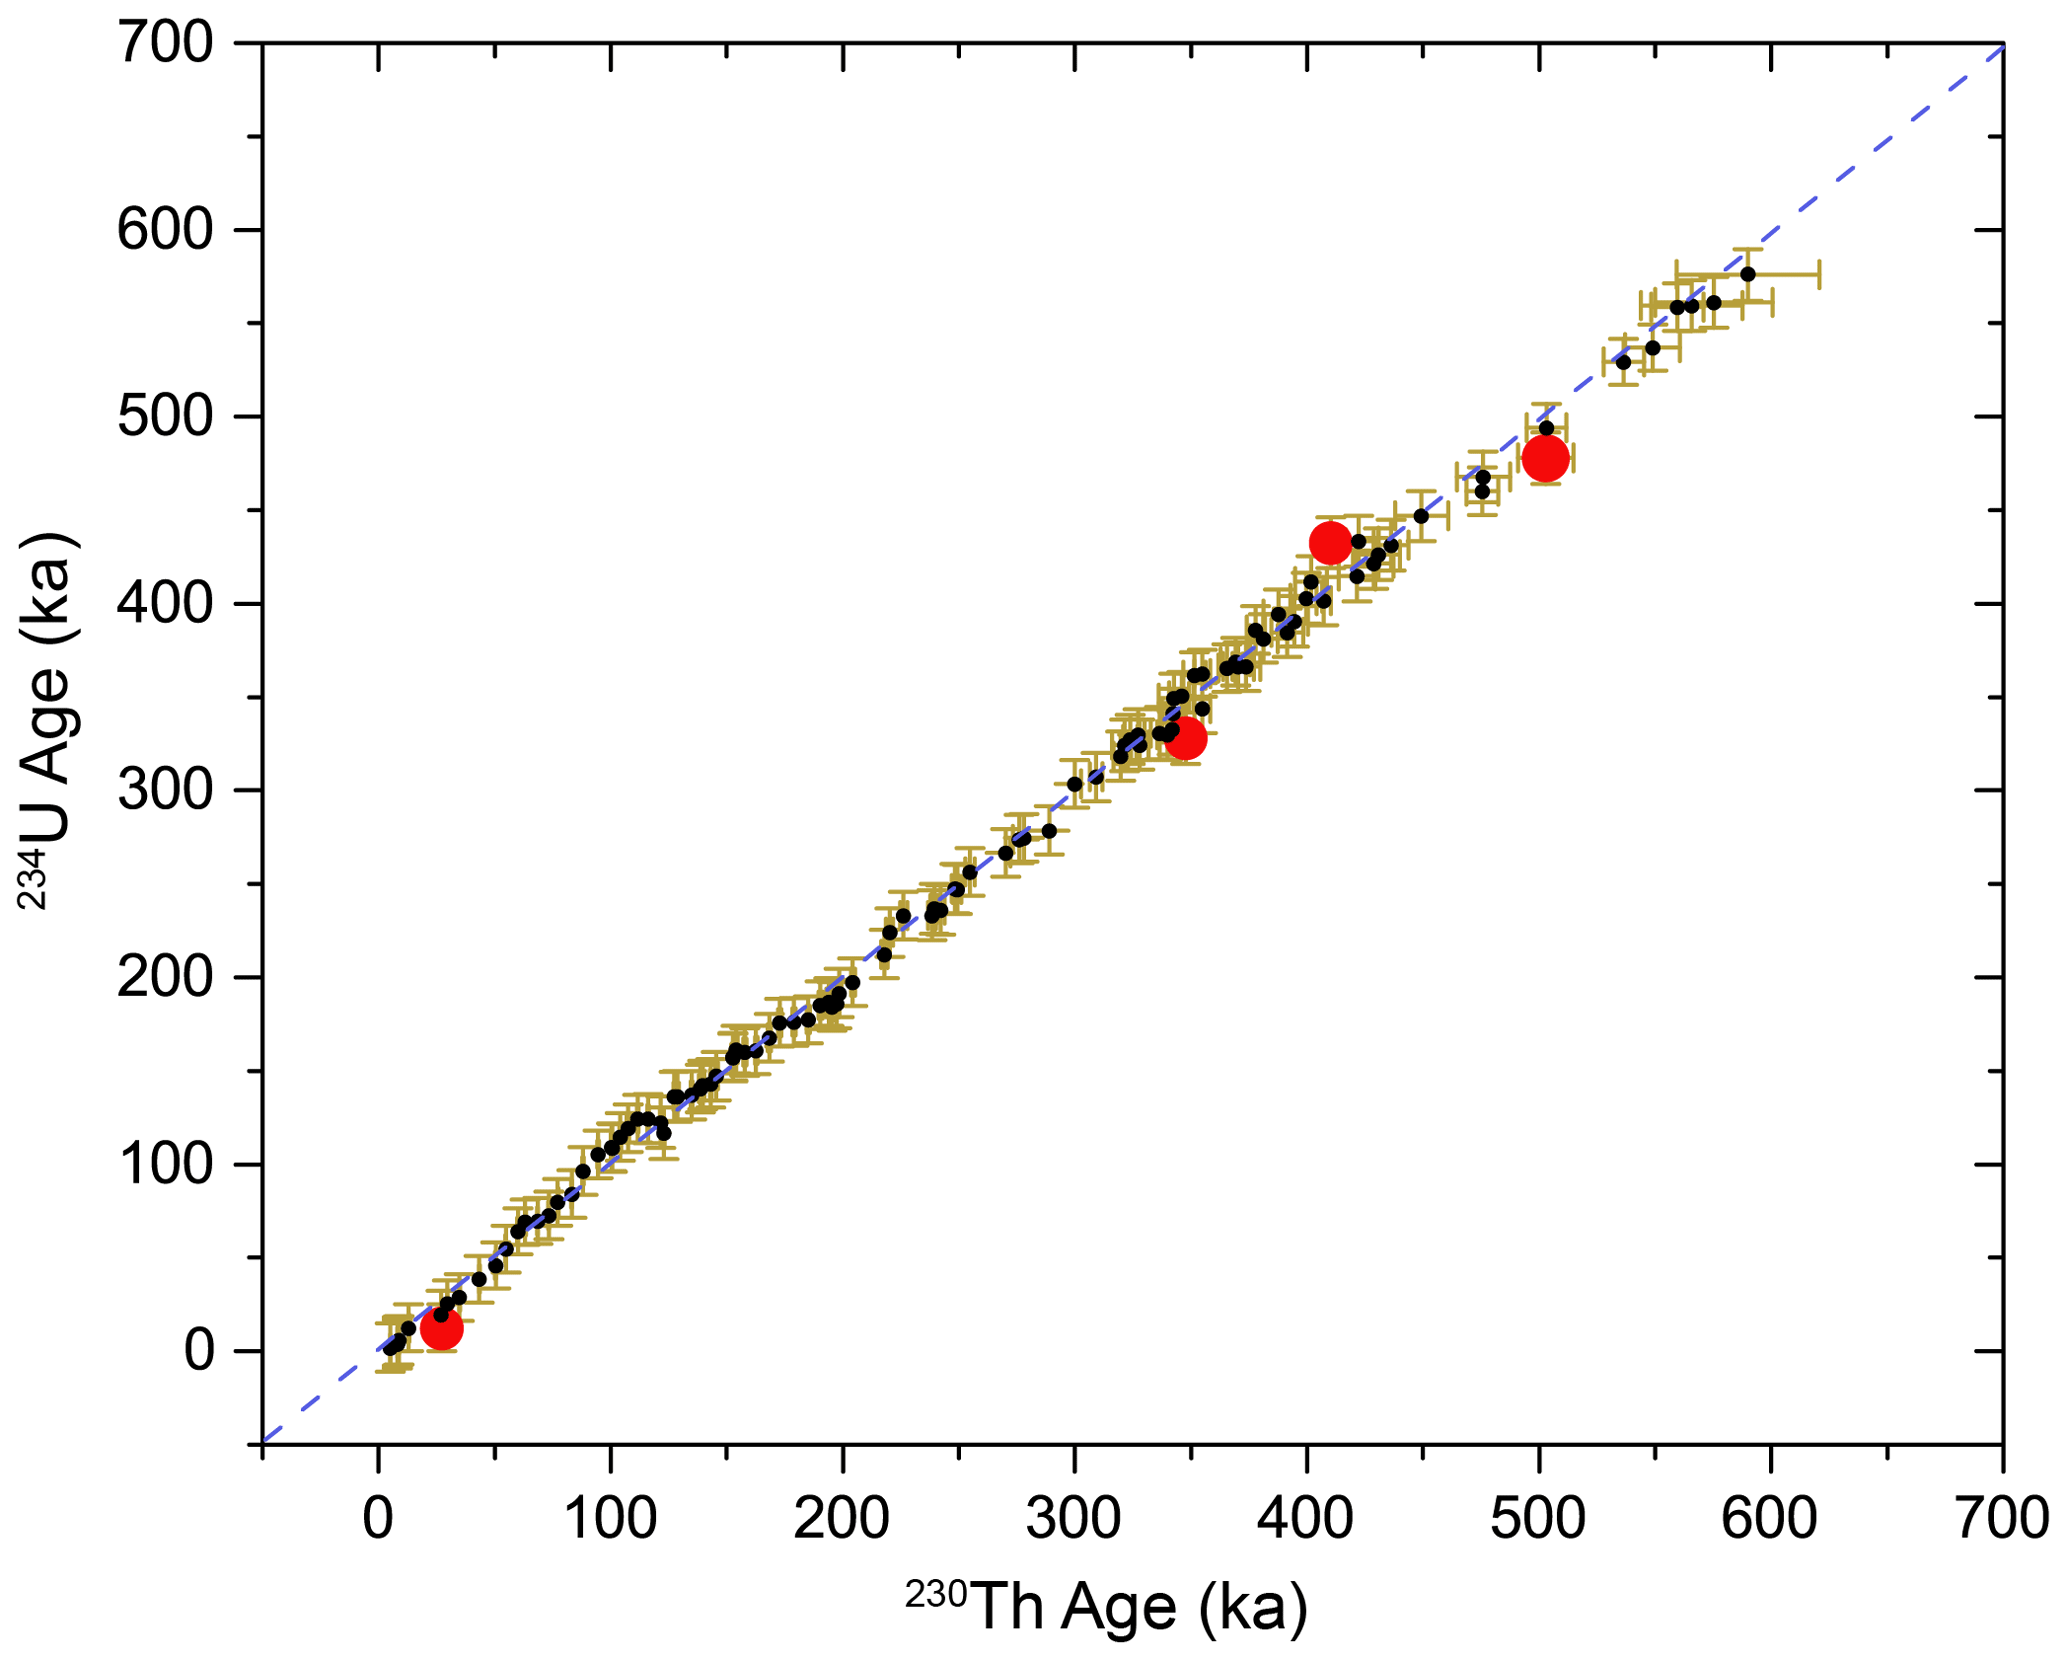
Figure 3Plot of 234U ages against 230Th ages between 4 and 590 ka. The 2σ uncertainty shown by brown error bars. The dashed blue line is the 1:1 line, and the red dots refer to four samples inconsistent with this relationship.
3.4 234U ages beyond 230Th–234U secular equilibrium
The consistency between 234U and 230Th ages within the time range of 4–590 ka suggests that it is reasonable to utilize this model to calculate ages that are close to or beyond 230Th–234U secular equilibrium in DH/DH2. Using measured δ234Up, δ18O, and δ13C values, we calculated 10 234U ages for DH2 cave deposits older than 600 ka over the depth of 608 to 652.0 mm (Table 5). The 234U ages are in stratigraphic order within uncertainty.
Table 5SD δ234Ui and calculated 234U ages from calcite deposited prior to 600 ka and the corresponding depth, δ18O, δ13C, and δ234Up values.

4.1 Uncertainties of 234U ages
Due to the high initial δ234U values (1760 ± 61 ‰), DH/DH2 calcite can theoretically be dated up to 2.5 Ma, assuming that measured δ234Up values have about 1 ‰ absolute uncertainty. By including all the uncertainty described above, we obtain the following age uncertainty (2σ): ∼ 13 kyr uncertainty for a sample <500 ka, 16 kyr at 1.0 Ma, 26 kyr at 1.5 Ma, 70 kyr at 2.0 Ma, and 290 kyr at 2.5 Ma. The rapid increase in uncertainty after 2.5 Ma (Fig. 4) is due to the fact that ≥ 10 half-lives of the 234U will have elapsed and the δ234Up values increasingly approach the uncertainty of their measurement.
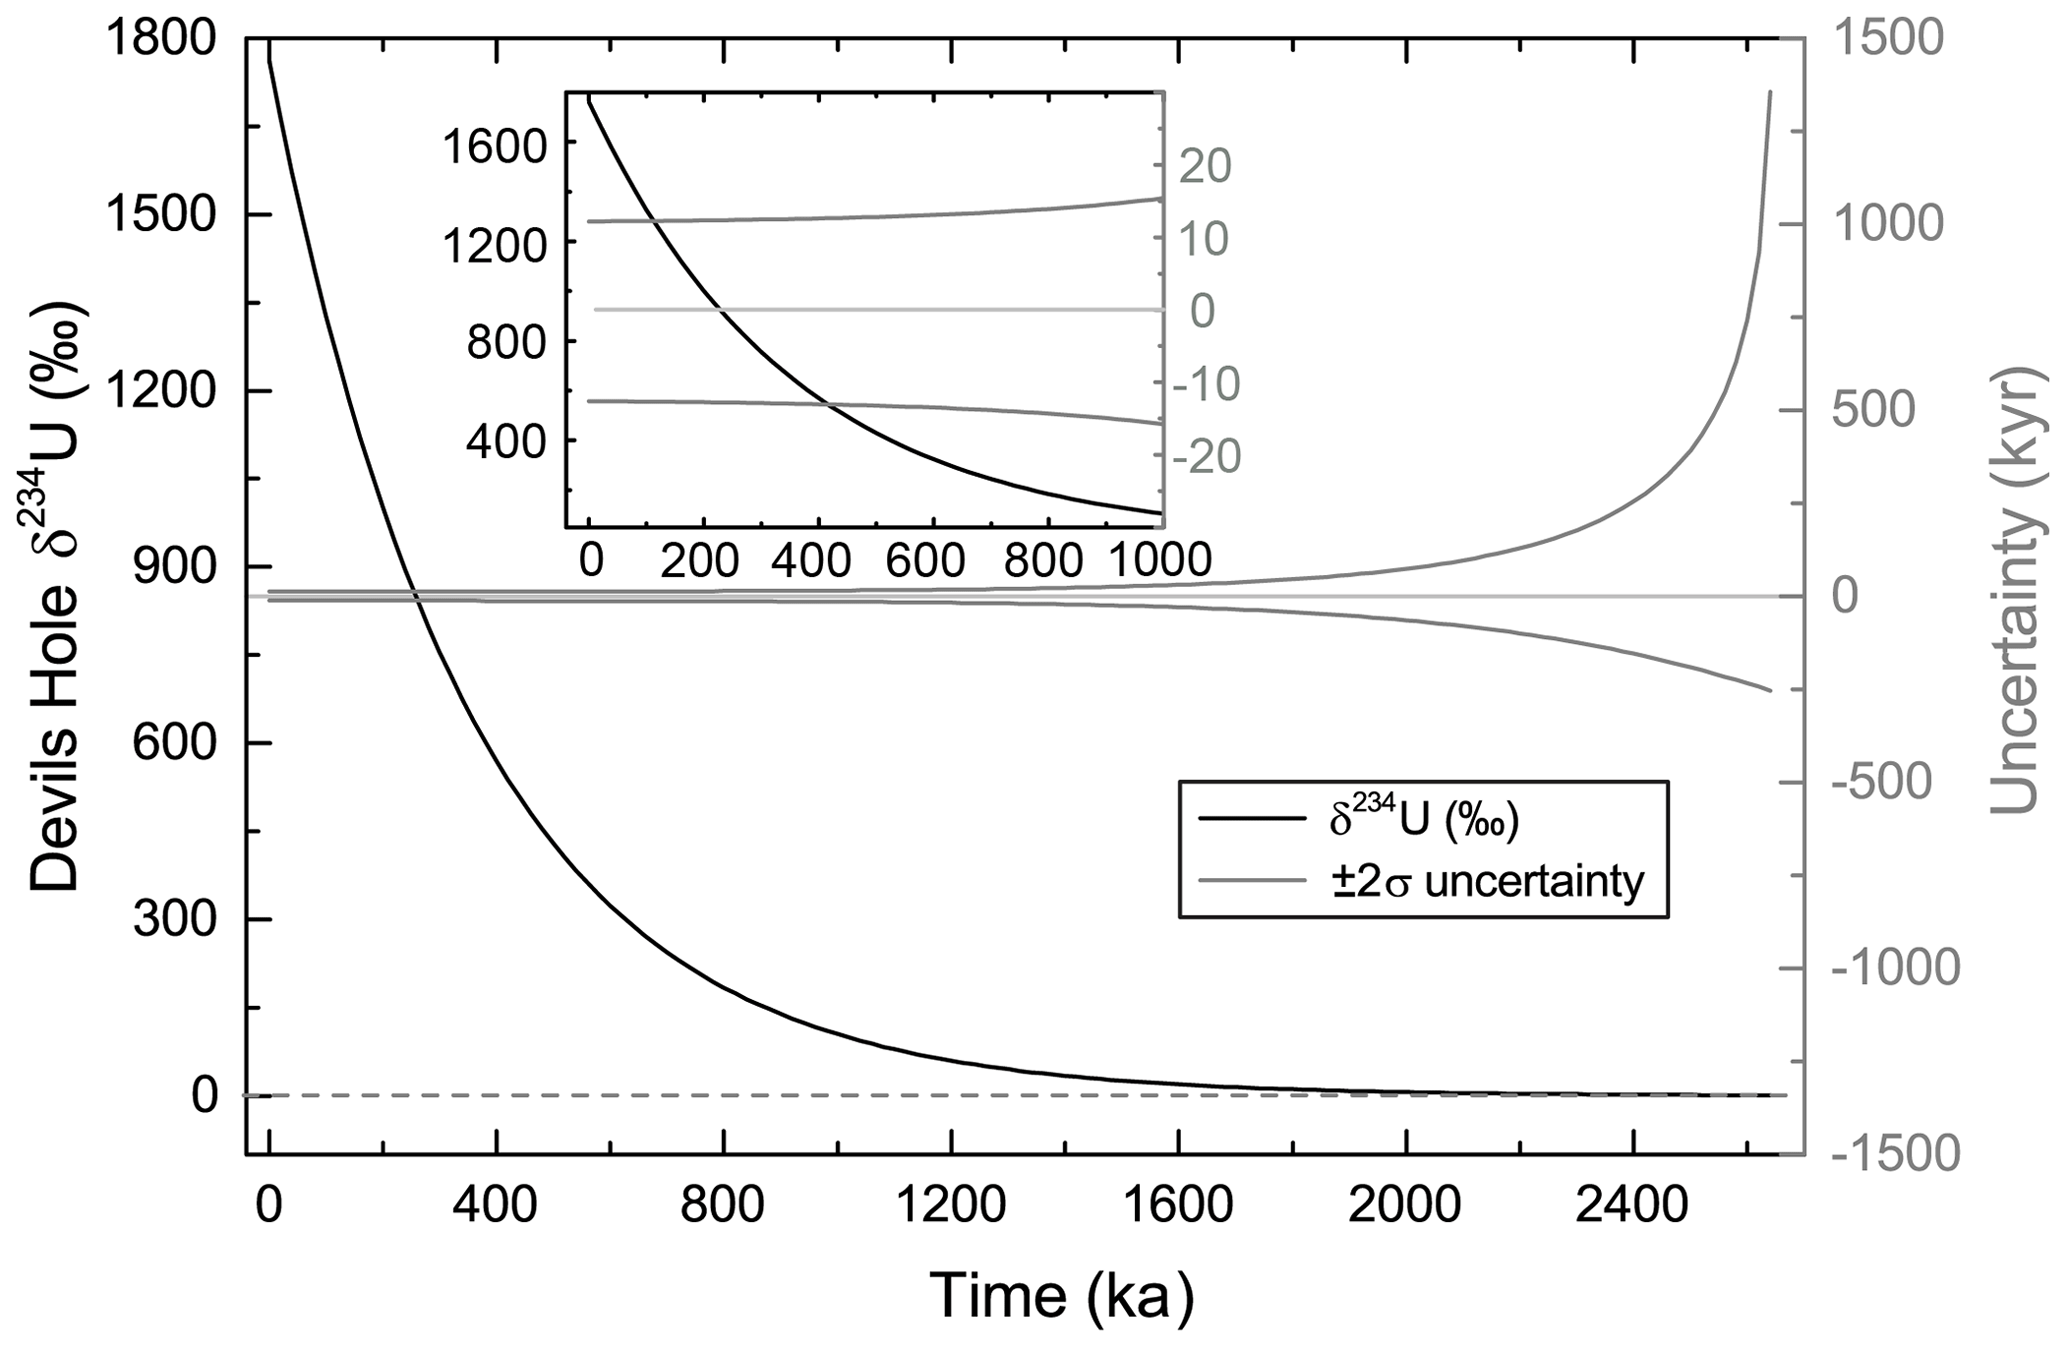
Figure 4Evolution of δ234U (black line) and corresponding uncertainties of 234U ages (grey lines) with time. The insert plot shows the δ234U evolution during the period of 0–1 Ma. The dashed grey line indicates where δ234U is 0.
4.2 Timing and rate of calcite deposition
Figure 5 shows an OxCal-derived age model with 95 % confidence intervals plotted over depth using all 234U ages with their 2σ uncertainties. Locations of folia and a growth hiatus are highlighted. Two lines of evidence suggest that the resulting time series is reasonable. Firstly, the average growth rate during the whole period is at 0.9 ± 0.3 mm kyr−1 (1σ uncertainty; Fig. 6), which is consistent with growth rates reported by Moseley et al. (2016). Secondly, all 234U ages are in stratigraphic order within uncertainties and fall within the 95 % confidence interval of our age model, implying no major outliers.
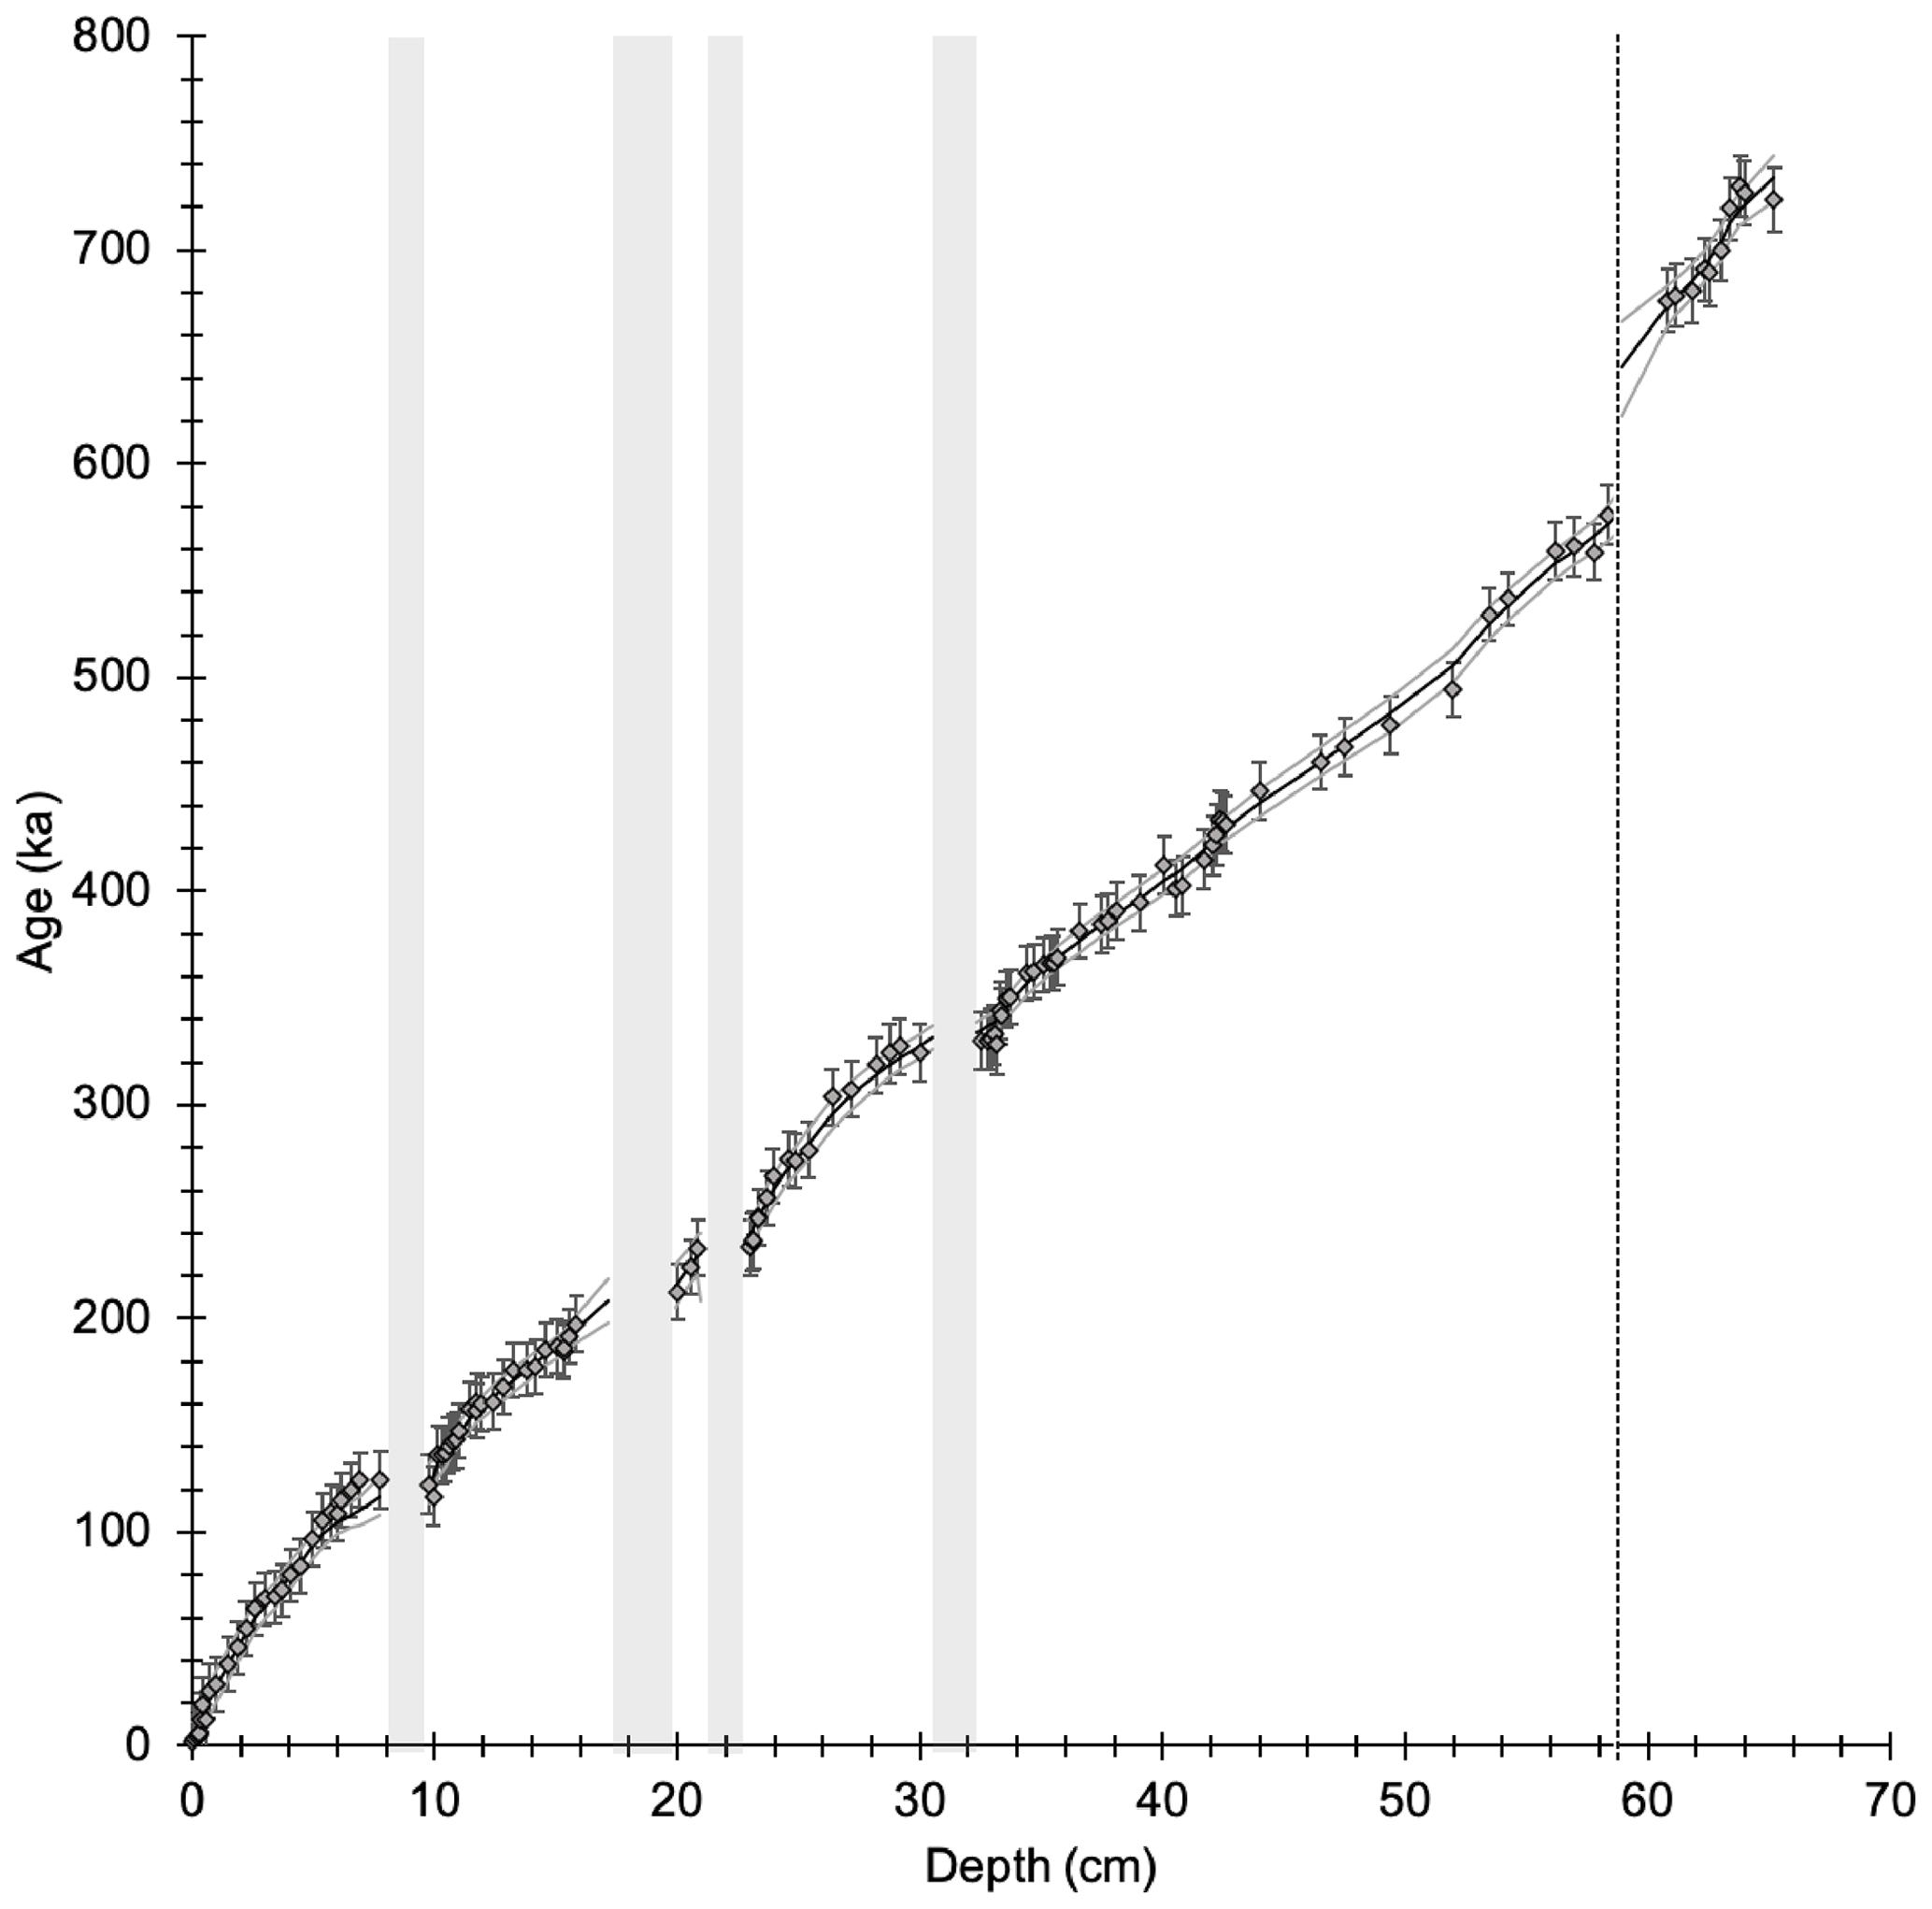
Figure 5234U ages (diamonds) and associated 2σ uncertainties along the length of the core penetrating the calcite crust. OxCal age model (black line) and 95 % confidence limits (grey lines) were derived from 234U ages. Locations of folia (grey bars) and a growth hiatus (dashed black line) are indicated.
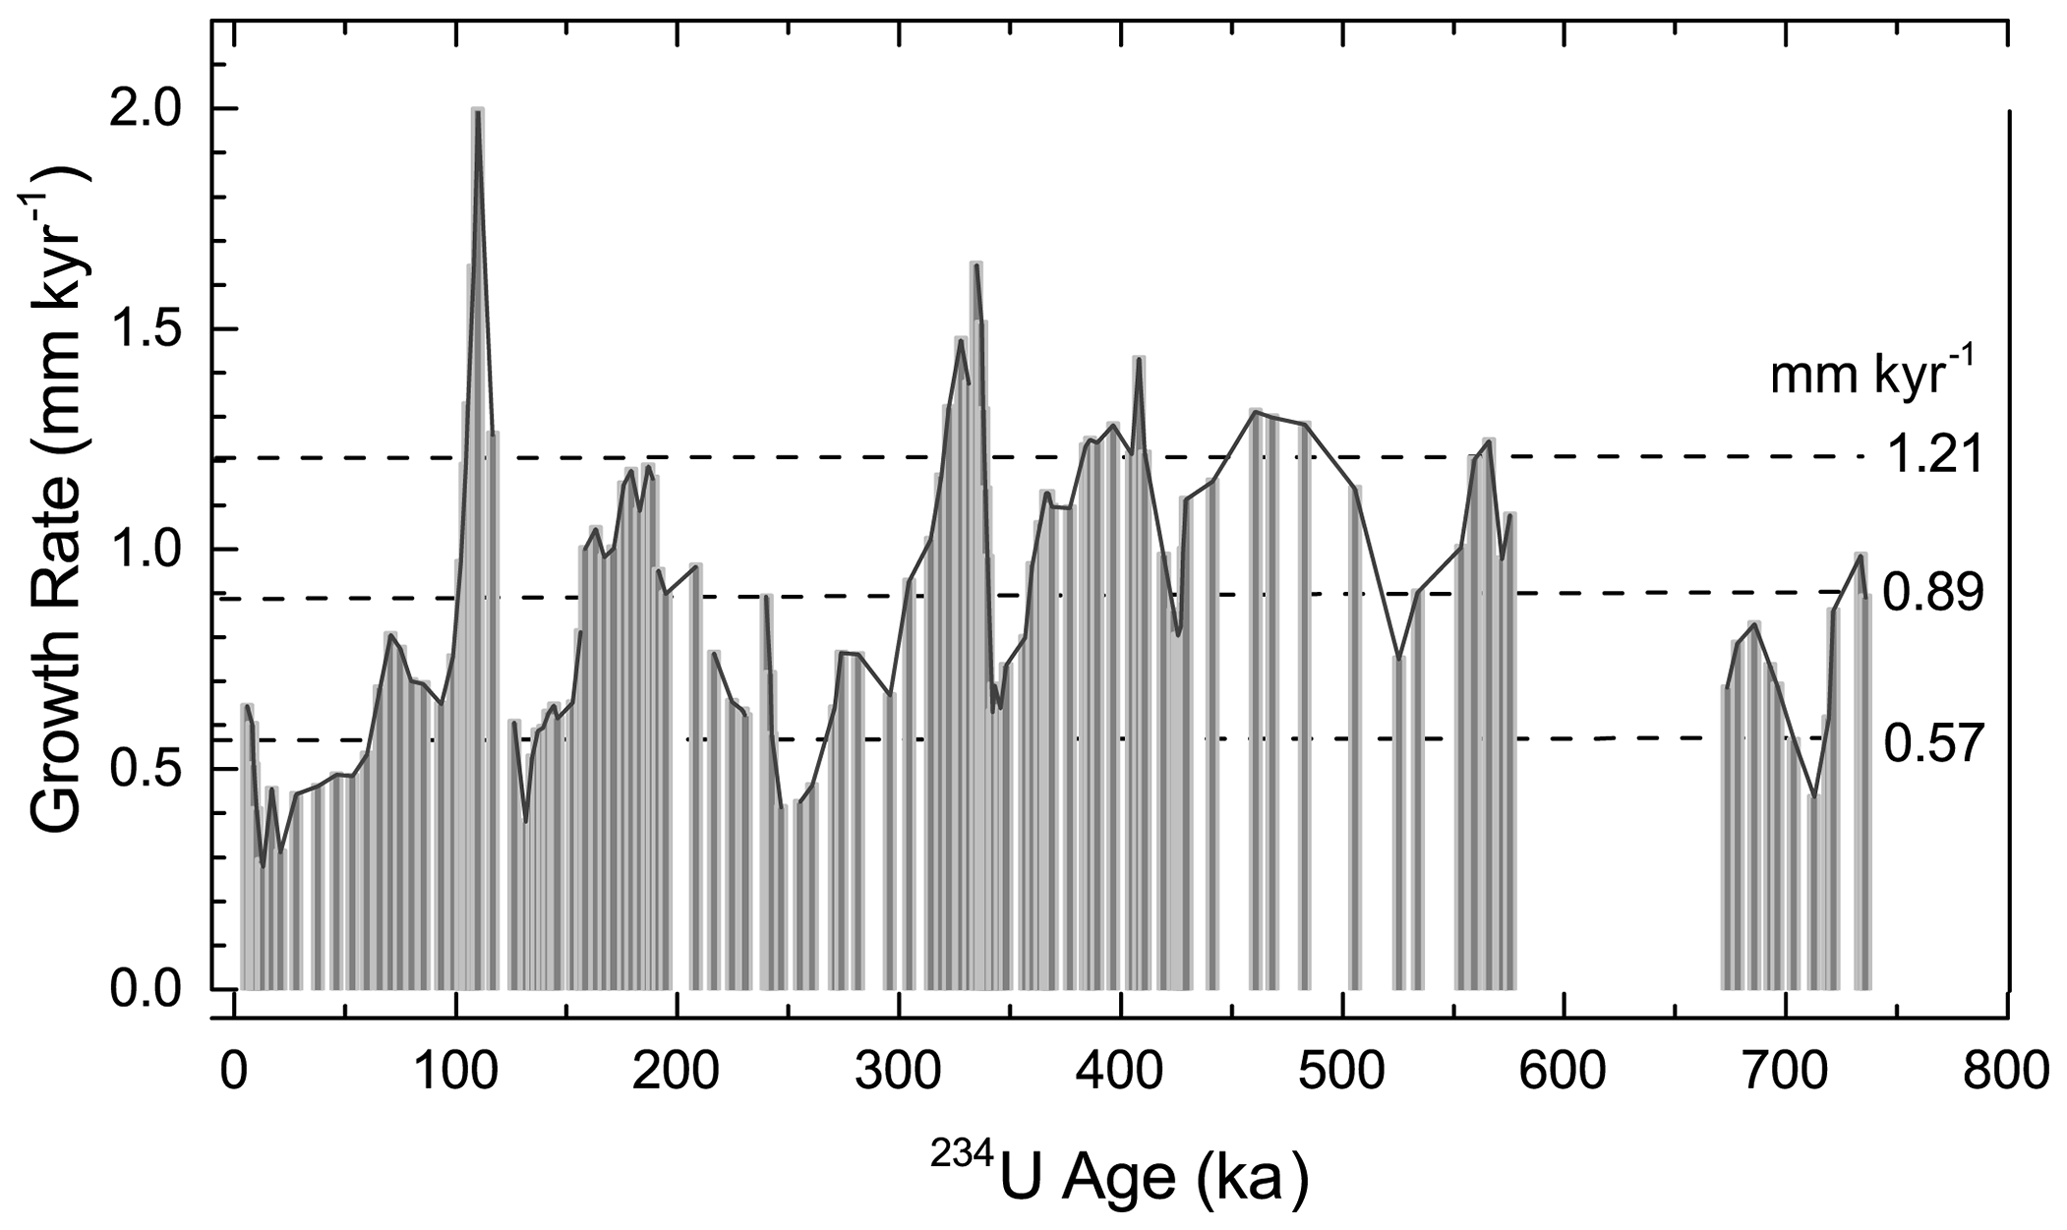
Figure 6Growth rate of DH2 mammillary calcite based on the OxCal age model (Fig. 5). The dashed lines indicate the average value and 1 standard deviation above and below the average.
Previous investigations revealed that the DH2 cave opened to the surface at approximately 4 ka (Moseley et al., 2016), likely due to surface collapse processes (Riggs et al., 1994). The timing at which the main subsurface fissure opened, however, remains largely unknown. By 234U dating, the oldest calcite in our studied core (at the calcite–bedrock boundary), we can determine the earliest-possible timing at which the DH2 fissure existed (without which calcite cannot precipitate). 234U ages in the last 170 mm of the core are in stratigraphic order within uncertainties (Fig. 7), yet due to the slight scatter of ages we utilize the OxCal age model to extrapolate the age at the calcite–bedrock boundary. In doing so, we determine the earliest calcite in this core (+1.8 m r.m.w.t.) to 736 ± 11 ka (Fig. 7).
The onset of calcite deposition in the DH2 cave is in agreement with the recent geologic history of this region. The orientation of DH and DH2 is in accordance with the principal northwest-southeast stress direction in this part of the Great Basin that has prevailed over the last 5 Myr (Carr, 1974), suggesting that one or both fissures formed after 5 Ma. Abundant calcareous and siliceous spring and marsh deposits in Ash Meadows and the Amargosa Desert of Pliocene age (2.1 to 3.2 Ma; Hay et al., 1986) and groundwater-deposited calcite veins in alluvium and colluvium of Pleistocene age (500 to 900 ka; Winograd and Szabo, 1988) indicate that groundwater in the discharge zone of AMGFS has been continuously supersaturated with respect to calcite for at least the last 3 Myr. Our results, which suggest that the DH2 fissure opened no later than 736 ka, are therefore in agreement with the modern understanding of the AMGFS' geological history.
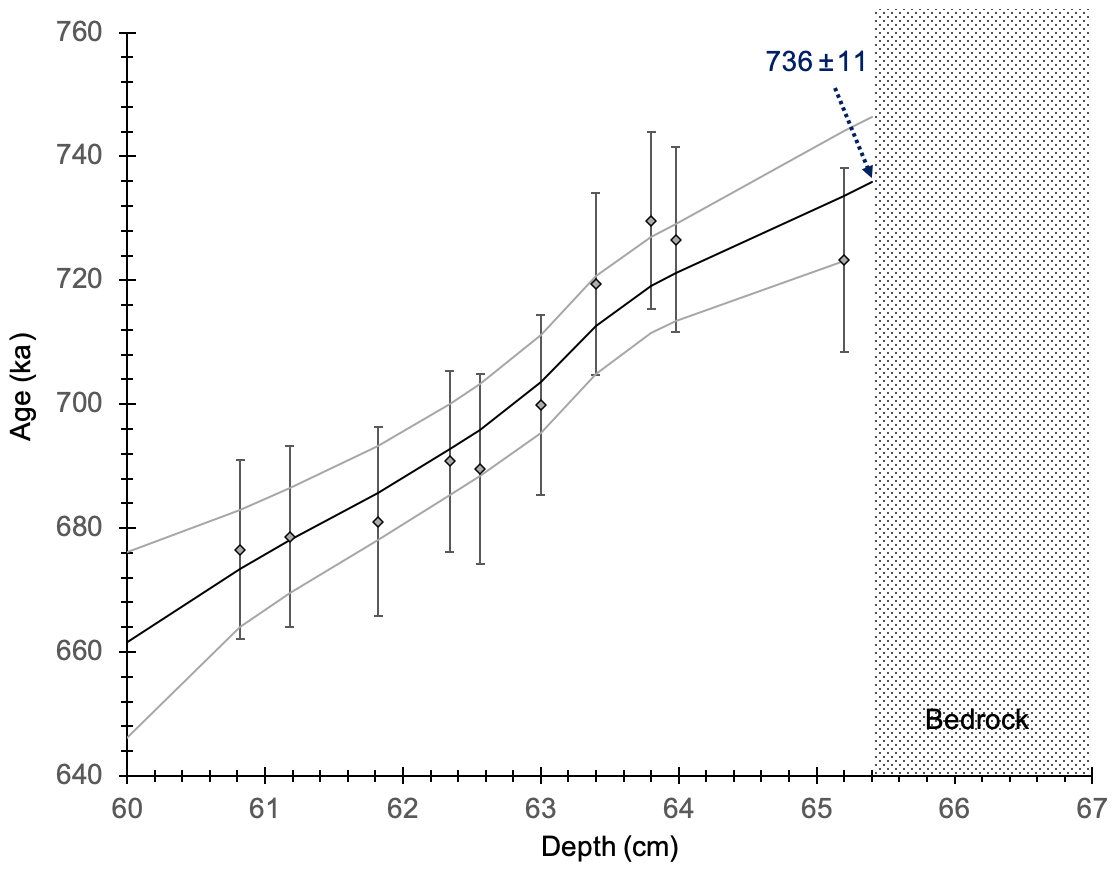
Figure 7OxCal-derived age model (black line), 95 % confidence limits (grey lines), and 234U ages (diamonds) with 2σ uncertainties for the lowest 17 cm of the core. The time series indicates that the initiation of calcite growth in DH2 occurred at 736±11 ka.
We have developed a novel method to determine the δ234Ui values in DH/DH2 calcite. We established a robust multiple linear regression model between δ234Ui, δ18O, and δ13C values of DH2 calcite deposited between 4 and 309 ka. We applied this model to estimate the δ234Ui of DH2 calcite using the respective δ18O and δ13C values. We refer to the statically derived initial values as SD δ234Ui. Uncertainty associated with SD δ234Ui is ±61 ‰, thereby improving precision by 40 % relative to Ludwig et al. (1992). We then calculated 120 234U ages by determining the δ234Up and SD δ234Ui at each age location. Average relative 234U age uncertainties are 2 %. The concordance between the 234U and the 230Th ages younger than 600 ka indicates that the DH2 calcite behaves as a closed system. Overall, 10 of the 120 234U ages are located in the oldest portion of the studied DH2 calcite core and range from 676 to 730 ka. Thus, the 234U ages allow us to extend the DH2 chronology beyond the limits of 230Th dating (>600 ka). Using our time series, we determined that calcite at the base of the studied core was deposited at 736 ± 11 ka. We argue that this age marks the earliest possible time at which the DH2 fissure existed.
All the data used in this paper are available in the Supplement.
The supplement related to this article is available online at: https://doi.org/10.5194/gchron-3-49-2021-supplement.
RLE conceptualized the project and XL carried it out. KAW, XL, and RLE prepared the manuscript with contributions from all co-authors. XL conducted the formal analysis. CS and YD provided the cave samples. KAW and GEM conducted the 230Th dating work and contributed to stable isotope measurements. All authors discussed the results and provided input to the manuscript and technical aspects of the analyses.
The authors declare that they have no conflict of interest.
This research was conducted under research permit nos. DEVA-2010-SCI-0004 and DEVA-2015-SCI-0006 issued by the Death Valley National Park. We thank K. Wilson for assistance in the field and M. Wimmer for assistance in the laboratory. Finally, we would like to thank two anonymous reviewers for their insightful comments on the manuscript.
This research has been supported by the National Science Foundation (NSF) (project no. 1602940) (to R. Lawrence Edwards) and the Austrian Science Fund (FWF) (project nos. P263050 and P327510) (to Christoph Spoetl).
This paper was edited by Norbert Frank and reviewed by two anonymous referees.
Barnes, H. and Palmer, A. R.: Revision of stratigraphic nomenclature of Cambrian rocks, Nevada Test Site and vicinity, Nevada, U.S. Geological Survey Professional Paper, 424-C, 100–103, 1961.
Bender, M. L., Fairbanks, R. G., Taylor, F. W., Matthews, R. K., Goddard, J. G., and Broecker, W. S.: Uranium-series dating of the Pleistocene reef tracts of Barbados, West Indies, Geol. Soc. Am. Bull., 90, 577–594, https://doi.org/10.1130/0016-7606(1979)90<577:UDOTPR>2.0.CO;2, 1979.
Bronk Ramsey, C. and Lee, S.: Recent and planned developments of the program OxCal, Radiocarbon, 55, 720–730, https://doi.org/10.2458/azu_js_rc.55.16215, 2013.
Carr, W. J.: Summary of tectonic and structural evidence for stress orientation at the Nevada Test Site, U.S. Geological Survey Open-File Report, 74–176, https://doi.org/10.3133/ofr74176, 1974.
Cheng, H., Edwards, R. L., Shen, C.-C., Polyak, V. J., Asmerom, Y., Woodhead, J., Hellstrom, J., Wang, Y., Kong, X., Spötl, C., Wang, X., and Alexander, E. C.: Improvements in 230Th dating, 230Th and 234U half-life values, and U-Th isotopic measurements by multi-collector inductively coupled plasma mass spectrometry, Earth Planet. Sci. Lett., 371–372, 82–91, https://doi.org/10.1016/j.epsl.2013.04.006, 2013.
Cherdyntsev, V. V.: Transactions of the third session of the commission for determining the absolute age of geological formations, Izv Akad Nauk SSSR, Moscow, 175–182, 1955.
Coplen, T. B., Winograd, I. J., Landwehr, J. M., and Riggs, A.C.: 500,000-year stable carbon isotopic record from Devils Hole, Nevada, Science, 263, 361–365, https://doi.org/10.1126/science.263.5145.361, 1994.
Davisson, M. L., Smith, D. K., Kenneally, J., and Rose, T. P.: Isotope hydrology of southern Nevada groundwater: Stable isotopes and radiocarbon, Water Resour. Res., 35, 279–294, https://doi.org/10.1029/1998WR900040, 1999.
Dublyansky, Y. and Spötl, C.: Condensation-corrosion speleogenesis above a carbonate-saturated aquifer: Devils Hole Ridge, Nevada, Geomorphology, 229, 17–29, https://doi.org/10.1016/j.geomorph.2014.03.019, 2015.
Gallup, C., Edwards, R. L., and Johnson, R.: The timing of high sea levels over the past 200,000 years, Science, 263, 796–800, https://doi.org/10.1126/science.263.5148.796, 1994.
Ghaleb, B., Falguères, C., Carlut, J., Pozzi, J. P., Mahieux, G., Boudad, L., and Rousseau, L.: Timing of the Brunhes-Matuyama transition constrained by U-series disequilibrium, Sci. Rep.-UK, 9, 6039, https://doi.org/10.1038/s41598-019-42567-2, 2019.
Hay, R. L., Pexton, R. E., Teague. T. T., and Kyser, T. K.: Spring-related carbonate rocks, Mg clays, and associated minerals in Pliocene deposits of the Amargosa Desert, Nevada and California, Geol. Soc. Am. Bull., 97, 1488–1503, https://doi.org/10.1130/0016-7606(1986)97<1488:SCRMCA>2.0.CO;2, 1986.
Issbaev, E. A., Usatov, E. P., and Cherdyntsev, V. V.: Isotopic composition of Uranium in nature, Radiokhimiya (Engl. Transl.), 2, 94–97, 1960.
Kaufman, A., Broecker, W. S., Ku, T.-L., and Thurber, D. L.: The status of U-series methods of mollusk dating, Geochim. Cosmochim. Ac., 35, 1155–1183, https://doi.org/10.1016/0016-7037(71)90031-7, 1971.
Kluge, T., Affek, H. P., Dublyansky Y., and Spötl, C.: Devils Hole paleotemperatures and implications for oxygen isotope equilibrium fractionation, Earth Planet. Sci. Lett., 400, 251–260, https://doi.org/10.1016/j.epsl.2014.05.047, 2014.
Ku, T. L.: An evaluation of the U234/U238 method as a tool for dating pelagic sediments, J. Geophys. Res., 70, 3457–3474, https://doi.org/10.1029/JZ070i014p03457, 1965.
Ludwig, K. R., Szabo B. J., Moore J. G., and Simmons K. R.: Crustal subsidence rate off Hawaii determined from 234U/238U ages of drowned coral reefs, Geology, 19, 171–174, https://doi.org/10.1130/0091-7613(1991)019<0171:CSROHD>2.3.CO;2, 1991.
Ludwig, K. R., Simmons, K. R., Szabo, B. J., Winograd, I. J., Landwehr, J. M., Riggs, A. C., and Hoffman, R. J.: Mass spectrometric 230Th-234U-238U dating of the Devils Hole calcite vein, Science, 258, 284–287, https://doi.org/10.1126/science.258.5080.284, 1992.
Moberly, J. G., Bernards, M. T., and Waynant, K. V.: Key features and updates for Origin 2018, J. Cheminformatics, 10, 5, https://doi.org/10.1186/s13321-018-0259-x, 2018.
Moseley, G. M., Edwards, R. L., Wendt, K. A., Cheng, H., Dublyansky, Y., Lu, Y., Boch, R., and Spötl, C.: Reconciliation of the Devils Hole climate record with orbital forcing, Science, 351, 165–168, https://doi.org/10.1126/science.aad4132, 2016.
Olafsdottir, K. B. and Mudelsee, M.: More accurate, calibrated bootstrap confidence intervals for estimating the correlation between two time series, Math. Geosci., 46, 411–427, https://doi.org/10.1007/s11004-014-9523-4, 2014.
Plummer, L. N., Busenberg, E., and Riggs, A. C.: In-situ growth of calcite at Devils Hole, Nevada: Comparison of field and laboratory rates to a 500,000 year record of near-equilibrium calcite growth, Aquatic Geochem., 6, 257–274, https://doi.org/10.1023/A:1009627710476, 2000.
Riggs, A. C., Carr, W. J., Kolesar, P. T., and Hoffman, R. J.: Tectonic speleogenesis of Devils Hole, Nevada, and implications for hydrogeology and the development of long, continuous paleoenvironmental records, Quaternary Res., 42, 241–254, https://doi.org/10.1006/qres.1994.1075, 1994.
Thomas, J. M., Welch, A. H., and Dettinger, M. D.: Geochemistry and isotope hydrology of representative aquifers in the Great Basin region of Nevada, Utah, and adjacent states, U.S. Geological Survey Professional Paper, 1409-C, https://doi.org/10.3133/pp1409C, 1996.
Thurber, D. L.: Anomalous U234/U238 in nature, J. Geophys. Res., 67, 4518–4520, https://doi.org/10.1016/0079-6611(65)90016-9, 1962.
Veeh, H. H.: Th230/U238 and U234/U238 ages of Pleistocene high sea level stand, J. Geophys. Res., 71, 3379–3386, https://doi.org/10.1029/JZ071i014p03379, 1966.
Wendt, K. A., Dublyansky, Y. V., Moseley, G. E., Edwards, R. L., Cheng, H., and Spötl, C.: Moisture availability in the southwest United States over the last three glacial-interglacial cycles, Sci. Adv., 4, 10, https://doi.org/10.1126/sciadv.aau1375, 2018.
Wendt, K. A., Pythoud, M., Moseley, G. E., Dublyansky, Y. V., Edwards, R. L., and Spötl, C.: Paleohydrology of southwest Nevada (USA) based on groundwater 234U/238U over the past 475 k.y., Geol. Soc. Am, Bull., 132, 793–802, https://doi.org/10.1130/B35168.1, 2020.
Winograd, I. J. and Thordarson, W.: Hydrogeologic and hydrochemical framework, south-central Great Basin, Nevada-California, with special reference to the Nevada Test Site, U.S. Geological Survey Professional Paper, 712-C, https://doi.org/10.3133/pp712C, 1975.
Winograd I. J. and Szabo B. J.: Water table decline in the south-central Great Basin during the Quaternary: Implications for toxic waste disposal, in: Geologic and Hydrologic Investigations of a Potential Nuclear Waste Disposal Site at Yucca Mountain, Southern Nevada, edited by: Carr, M. D. and Yount, J. C., Geol. Surv. Bull., 1790, 47–152, 1988.
Winograd, I. J., Coplen, T. B., Landwehr, J. M., Riggs, A. C., Ludwig, K. R., Szabo, B. J., Kolesar, P. T., and Revesz, K. M.: Continuous 500,000-year climate record from vein calcite in Devils Hole, Nevada, Science, 258, 255–260, https://doi.org/10.1126/science.258.5080.255, 1992.
Winograd, I. J., Riggs, A. C., and Coplen, T. B.: The relative contributions of summer and cool-season precipitation to groundwater recharge, Spring Mountains, Nevada, USA, Hydrogeol. J., 6, 77–93, https://doi.org/10.1007/s100400050135, 1998.
Winograd, I. J., Landwehr, J. M., Coplen, T. B., Sharp, W. D., Riggs, A. C., Ludwig, K. R., and Kolesar, P. T.: Devils Hole, Nevada, δ18O record extended to the mid-Holocene, Quat. Res., 66, 202–212, https://doi.org/10.1016/j.yqres.2006.06.003, 2006.