the Creative Commons Attribution 4.0 License.
the Creative Commons Attribution 4.0 License.
 | 29 Oct 2021
Erosion rates in a wet, temperate climate derived from rock luminescence techniques
Rachel K. Smedley
David Small
Richard S. Jones
Stephen Brough
Jennifer Bradley
Geraint T. H. Jenkins
A new luminescence erosion meter has huge potential for inferring erosion rates on sub-millennial scales for both steady and transient states of erosion, which is not currently possible with any existing techniques capable of measuring erosion. This study applies new rock luminescence techniques to a well-constrained scenario provided by the Beinn Alligin rock avalanche, NW Scotland. Boulders in this deposit are lithologically consistent and have known cosmogenic nuclide ages and independently derived Holocene erosion rates. We find that luminescence-derived exposure ages for the Beinn Alligin rock avalanche were an order of magnitude younger than existing cosmogenic nuclide exposure ages, suggestive of high erosion rates (as supported by field evidence of quartz grain protrusions on the rock surfaces). Erosion rates determined by luminescence were consistent with independently derived rates measured from boulder edge roundness. Inversion modelling indicates a transient state of erosion reflecting the stochastic nature of erosional processes over the last ∼4.5 kyr in the wet, temperate climate of NW Scotland. Erosion was likely modulated by known fluctuations in moisture availability and to a lesser extent temperature, which controlled the extent of chemical weathering of these highly lithified rocks prior to erosion. The use of a multi-elevated temperature, post-infra-red, infra-red stimulated luminescence (MET-pIRIR) protocol (50, 150 and 225 ∘C) was advantageous as it identified samples with complexities that would not have been observed using only the standard infra-red stimulated luminescence (IRSL) signal measured at 50 ∘C, such as that introduced by within-sample variability (e.g. surficial coatings). This study demonstrates that the luminescence erosion meter can infer accurate erosion rates on sub-millennial scales and identify transient states of erosion (i.e. stochastic processes) in agreement with independently derived erosion rates for the same deposit.
- Article
(7633 KB) - Full-text XML
-
Supplement
(1123 KB) - BibTeX
- EndNote


Rock erosion is dependent upon a variety of internal (e.g. mineralogy, grain size, porosity, structures) and external (e.g. temperature, moisture availability, snow cover, wind, aspect) factors. Chemical and/or physical weathering of rocks (or rock decay; Hall et al., 2012) breaks down the surficial materials, making them available for transportation (i.e. erosion), where the rates and processes of degradation is primarily controlled by the rock lithology (e.g. Twidale, 1982; Ford and Williams, 1989). For boulders with similar lithologies, the erosion rate is conditioned by weathering principally caused by moisture availability but also temperature and in some cases biological factors (Hall et al., 2012). It is widely reported that warmer temperatures increase most rates of chemical activity, while sub-zero temperatures arrest chemical activity on a seasonal basis. However, cold temperatures alone do not preclude chemical weathering (Thorn et al., 2001). As such, rock erosion rates will be sensitive to changing climate (moisture availability, temperature) such as that experienced throughout the Late Holocene (i.e. last 4 kyr) (e.g. Charman, 2010), in addition to that forecast for the future due to anthropogenic climate change (e.g. Stocker et al., 2013).
Measuring erosion rates over shorter (≤103 yr) and longer (≥104 yr) integration times is advantageous as each targets a different phenomenon of erosion. Longer timeframes will inform on how landscapes respond to changing large-scale climatic and tectonic conditions (e.g. Herman et al., 2010), whereas shorter timeframes assess local or regional responses to shorter-lived environmental conditions (e.g. climate fluctuations). A number of techniques can constrain long-term, landscape erosion rates on ≥104 yr timeframes, such as cosmogenic nuclides (e.g. Lal, 1991; Braun et al., 2006; Balco et al., 2008) or thermochronology (Reiners and Brandon, 2006). While observational measurements on very short timeframes ≤102 yr are performed with both direct contact (e.g. Hanna, 1966; High and Hanna, 1970; Trudgill et al., 1989) and non-contact (e.g. Swantesson, 1989; Swantesson et al., 2006) techniques. However, until now it has been difficult to constrain erosion rates on 102 to 103 yr timeframes due to a lack of techniques with the required sensitivity and resolution.
The luminescence signal within mineral grains (quartz and feldspar) is reset when a rock surface is exposed to sunlight for the first time (e.g. Habermann et al., 2000; Polikreti et al., 2002; Vafiadou et al., 2007). With continued exposure the luminescence signal resetting in the mineral grains propagates to increasing depths (i.e. the luminescence depth profile is a function of time). Improved understanding of this fundamental principle has led to the development of new applications of luminescence; constraining the timing of rock exposure events (Laskaris and Liritzis, 2011; Sohbati et al., 2011; Lehmann et al., 2018) and rock surface erosion rates (Sohbati et al., 2018; Lehmann et al., 2019a, b). Brown (2020) combines these phenomena within model simulations to explore different sample histories of exposure and burial, informing geomorphological interpretations of luminescence depth profiles measured in samples collected from the natural environment. Here, we investigate erosion rates, rather than weathering rates, as the luminescence technique specifically measures the light penetration into a rock surface after the removal of material (i.e. erosion), occurring after the in situ rock breakdown (i.e. weathering). Luminescence depth profiles are a product of the competing effects of time (which allows the bleaching front to propagate to greater depths) and erosion (which exhumes the bleaching front closer to the surface). Existing studies have suggested that rock luminescence exposure dating is only feasible for very short timeframes (e.g. <300 yr; Sohbati et al., 2018) as light penetrates faster than the material can be removed and/or in settings where erosion rates are <1 mm kyr−1 (Lehmann et al., 2018). Beyond this, the dominant control on the luminescence depth profile is erosion rather than time, and hence if time can be parameterised, then erosion can be determined (and vice versa). Recent findings from erosion simulations compared with measured data have shown that the erosion rates derived from luminescence depth profiles can be accurate even where stochastic erosion was experienced in nature (Brown and Moon, 2019).
New luminescence techniques have the potential to derive 102 to 103 a scale erosion rates because of two important characteristics: (1) measurable luminescence depth profiles can develop in a rock surface over extremely short durations of sunlight exposure (e.g. days; Polikreti et al., 2003, or years; Lehmann et al., 2018), and (2) luminescence depth profiles are sensitive to millimetre-scale erosion. Conversely, cosmogenic nuclides are sensitive to metre-scale erosion, depending on the density (e.g. Lal, 1991). Therefore, the new luminescence erosion meter has the potential to provide a step-change in capabilities of measuring erosion rates on currently impossible 102 to 103 yr timeframes. However, its application has been limited to few studies (e.g. Sohbati et al., 2018; Lehmann et al., 2019b) validated against long-term erosion rates of landscape evolution from global or regional datasets rather than local, independently constrained erosion rates derived from the same rock type.
This study tests the accuracy and applicability of rock erosion rates inferred from luminescence techniques in a new latitudinal (57∘ N) and climate (wet, temperate) setting with independently constrained erosion rates. The Beinn Alligin rock avalanche in NW Scotland (Fig. 1) provides a well-constrained test scenario as (1) the boulders were sourced from a single fault-bounded failure scarp occurring within sandstones of the Torridonian group (i.e. the rocks are likely to be lithologically consistent), (2) all boulder samples share an identical exposure history as they were deposited by a single, instantaneous event (Ballantyne and Stone, 2004), (3) independent cosmogenic exposure ages constrain the timing of the rock avalanche (Ballantyne and Stone, 2004), and (4) independently derived erosion rates over the last ∼4 kyr for the boulders of the Beinn Alligin rock avalanche uniquely provide constraints on erosion rates (Kirkbride and Bell, 2010).
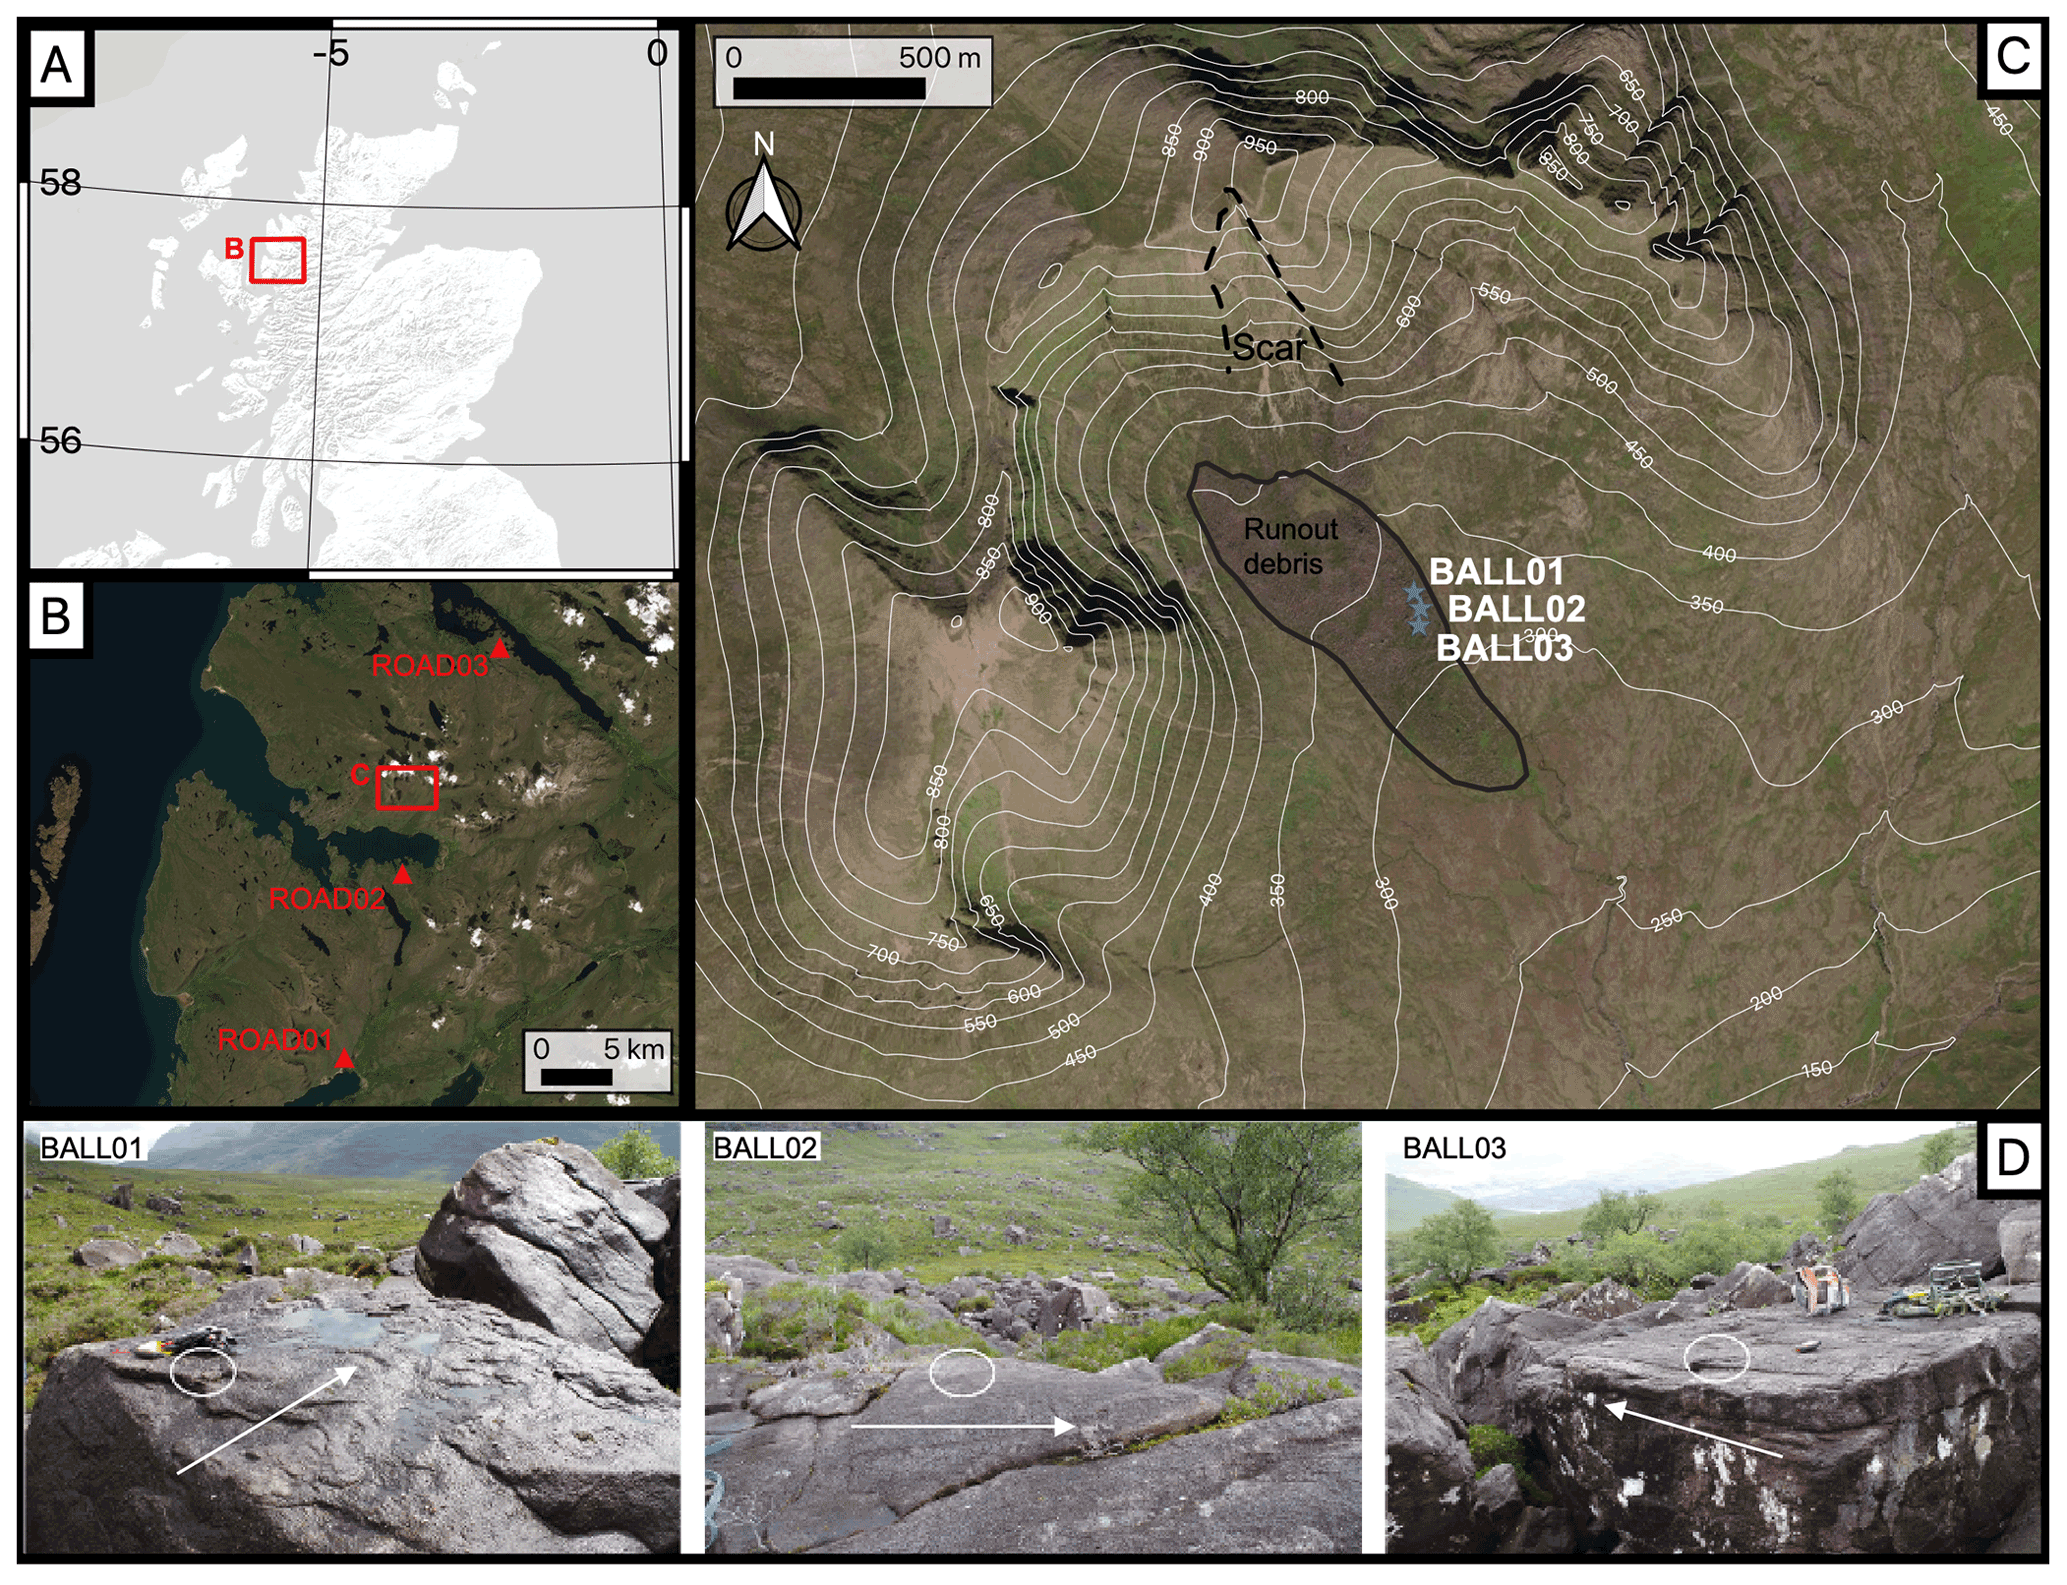
Figure 1Location of the Beinn Alligin rock avalanche (57∘35′ N, 05∘34′ W) and road-cut sections in NW Scotland (a, b). Sample sites on the rock avalanche deposit (c). Photographs of flat-topped boulders sampled and the general rock avalanche flow direction (white arrow) for BALL01, BALL02 and BALL03 (d). The backgrounds used are ESRI World Terrain Base (a) and ESRI World Imagery (b, c). Contains OS data © Crown copyright and database right (2021). Scar and run-out debris locations mapped in (c) follow Ballantyne and Stone (2004).
The propagation of a bleaching front (i.e. the depth at which the luminescence signal has been reduced by 50 %) into a rock surface can be described by a double exponential function (Eq. 1), where Lx is the luminescence measured with depth (x) from the rock surface, L0 is the saturation limit for this sample (determined experimentally), t is the exposure time, is the intensity of light of a specific wavelength at the rock surface and μ is the light attenuation coefficient. To determine the exposure time (t) of a rock surface (and also erosion rates), it is necessary to parameterise μ and , which are likely unique to any specific rock lithology and natural sunlight conditions (e.g. latitude, cloudiness) of the sample being dated, respectively. Therefore, to provide accurate luminescence exposure ages (and also erosion rates), μ and must be calibrated using samples of known-age with the same lithology and natural sunlight conditions (e.g. a nearby road cutting).
Studies have applied rock luminescence techniques (mostly exposure dating) to a variety of lithologies including granites, gneisses (Lehmann et al., 2018, 2019a, b; Meyer et al., 2018), sandstones (Sohbati et al., 2012b; Chapot et al., 2012; Pederson et al., 2014), quartzites (Gliganic et al., 2019) and carbonate limestone (Brill et al., 2021). These studies showed that μ is highly dependent upon the rock lithology, where mineralogy has a strong control on the rock transparency. This is supported by direct measurements of μ for a variety of lithologies (greywacke, sandstone, granite, and quartzite) using a spectrometer (Ou et al., 2018). In addition to mineralogy, it has also been shown that the precipitation of dark Fe-hydroxides (Meyer et al., 2018) and rock varnishing (or weathering crusts) (e.g. Luo et al., 2019) can influence μ by changing the rock transparency principally at the rock surface. Mineralogy is broadly a constant variable over time. However, the formation of precipitates or rock varnishing can be time variable due to changing environmental factors external to the rock; thus, we should consider the possibility that μ may be time variable. Consequently, investigating the rock opacity of each sample is important to assess whether the known-age samples used to parameterise μ and were consistent with the unknown-age samples used for exposure dating or erosion rates.
Since the introduction of the new rock luminescence techniques, most studies on K feldspar (except Luo et al., 2019) have only utilised the IR50 signal as it bleaches more efficiently with depth into rock surfaces compared to higher-temperature post-IR infra-red stimulated luminescence (IRSL) signals (e.g. Luo et al., 2018; Ou et al., 2018). However, electron multiplying charged coupled device (EMCCD) measurements of four rock types (quartzite, orthoclase and two different granites) have shown that the post-IR IRSL signals of rock slices were dominated by K feldspars, while Na-rich feldspars can contribute towards the IR50 signal (Thomsen et al., 2018). It is possible that the different IRSL signals will have different luminescence characteristics (e.g. bleaching rates, fading rates, saturation levels, light attenuation, internal mineral composition) that could be exploited during measurements. Luo et al. (2019) used the post-IR IRSL signals with a multiple elevated temperature (MET; Li and Li, 2013) protocol (50, 110, 170, 225 ∘C) to demonstrate that all the IRSL signals provide luminescence depth profiles, but the lower-temperature signals penetrated further into the rock with depth. The authors fit the four IRSL signals to improve the accuracy of their parameterisation of μ and . However, no study has yet used the MET-post IR IRSL protocol to exploit the differing luminescence characteristics of the successively-measured IRSL signals to provide an internal quality control check on the reliability of the measured data; i.e. the luminescence depth profile will penetrate deeper in to the rock for the IR50 signal than the post-infra-red, infra-red (pIRIR)150 signal, which in turn will penetrate deeper than the pIRIR225 signal. However, all three signals should determine the same erosion rates if the model parameterisation (i.e. μ and ) is accurate. To maximise the potential information that could be derived from the samples, this study applied a MET-post IR IRSL protocol (50, 150 and 225 ∘C).
For determining erosion rates for rock surfaces of known exposure age, Sohbati et al. (2018) used a confluent hypergeometric function to provide an analytical solution but assuming only steady-state erosion. Lehmann et al. (2019a) provide a numerical approach that exploits the differential sensitivities to erosion of the luminescence (short-term) and cosmogenic nuclide (longer-term) techniques to erosion to infer erosion histories (steady state and transient over time) for rock surfaces. This approach uses the experimental data from the luminescence depth profiles and the 10Be concentrations for each sample. Modelling of the luminescence depth profiles accounts for the electron trapping dependent upon the environmental dose rate and D0 but does not consider a thermal loss of the signal (i.e. anomalous fading) as it has been demonstrated to have a negligible impact upon the luminescence depth profiles (Lehmann et al., 2019a). Modelling of the 10Be concentrations assumes no inheritance of cosmogenic nuclides from prior exposure and that the 10Be concentrations have been corrected for sample depth, density and topographical shielding. The luminescence depth profiles and cosmogenic nuclide concentrations are solved simultaneously for two unknowns: the exposure duration and the erosion history as defined by a step function (e.g. zero erosion for an initial period of time followed by an instant increase to a constant erosion rate). Forward modelling is used to simply simulate a projected outcome, and here it is used to calculate all of the possible luminescence depth profiles for these synthetic erosion and exposure histories. Inversion modelling matches measured data with the outcome of simulations to determine best fit of the raw data. Here, inversion modelling was used to validate the luminescence depth profile and cosmogenic nuclide concentration data against the synthetic erosion and exposure histories to determine the combinations with the highest likelihood. Throughout these modelling experiments, a forbidden zone is defined by combinations of erosion rate and duration that are not possible given the measured 10Be concentrations; these solutions are excluded from the parameter ranges used for the inversion model. For example, the forbidden zone identified in the inversion model profile shown in Fig. 7a is restricted to ranges from ca. 104 mm kyr−1 for durations of ca. 100 yr to ca. 103 mm kyr−1 for ca. >3000 yr.
The approach of Lehmann et al. (2019a) can model synthetic erosion histories in both steady and transient states. Steady-state erosion is defined as a constant erosion rate over a portion of the total duration of surface exposure. Transient erosion is typical of shorter exposure histories where a steady state of erosion has not yet been reached and the erosion rate varies over time. In the approach of Lehmann et al. (2019a), transient erosion is defined by erosion rates that decrease linearly with increased timing of erosion onset within the parameter space, ultimately reaching steady state (i.e. a constant erosion rate). An illustration of this is provided by Fig. 7a where transient erosion rates of ca. 104 mm kyr−1 were inferred for a minimum duration of ca. ≤1 yr, and extending up to ca. 103 mm kyr−1 for durations up to ca. 50 yr. Beyond ca. 50 yr, a steady state of erosion was reached at a constant erosion rate of ca. 103 mm kyr−1, represented by the flattening of the profile with the highest likelihood. Alternatively, a profile indicative of a transient state of erosion where no steady state has been established is illustrated by Fig. 7d where transient erosion rates of between ca. 102 mm kyr−1 were inferred for a minimum duration of ca. ≤1 yr, and extending up to ca. 101 mm kyr−1 for durations beyond ca. 200 yr. This numerical approach (Lehmann et al., 2019a) allows erosion history to be considered as non-constant in time (i.e. transient), in addition to steady state, and so it is more indicative of the stochastic erosional processes (driven by temperature, precipitation, snow cover, wind) in nature.
Today, average winter and summer temperatures in NW Scotland are 7 and 18 ∘C, respectively, while average annual precipitation (mostly rainfall) is high (ca. 2300 mm yr−1) (Met Office, 2021). The Beinn Alligin rock avalanche (57∘35′ N, 05∘34′ W) is a distinct, lobate deposit of large boulders that is 1.25 km long and covers an area of 0.38 km2 (Fig. 1). It has previously been ascribed various origins, including a rockslide onto a former corrie glacier (e.g. Ballantyne, 1987; Gordon, 1993) and a former rock glacier (Sissons, 1975, 1976). However, on the basis of cosmogenic exposure dates that constrain its deposition to the Late Holocene it is now widely accepted to have been deposited by a rock-slope failure that experienced excess run-out (e.g. a rock avalanche). The source is a distinct, fault-bounded failure scar on the southern flank of Sgùrr Mòr, the highest peak of Beinn Alligin (Ballantyne, 2003; Ballantyne and Stone, 2004). The rock avalanche is comprised of large, poorly sorted boulders and is calculated to comprise a total volume of 3.3–3.8×10⁶ m3, equivalent to a mass of 8.3–9.5 Mt (Ballantyne and Stone, 2004). The source lithology is Late Precambrian Torridonian sandstone strata. The Torridonian sandstones are reddish or reddish-brown terrestrial sedimentary rocks deposited under fluvial or shallow lake conditions (Stewart, 1982). The sandstones maintained a common origin throughout deposition (Stewart, 1982) and are thus largely consistent in mineralogy (dominated by quartz, and alkali and plagioclase feldspar), although there are some local variations in grain size (Stewart and Donnellan, 1992).
The 10Be concentrations of three boulders used for cosmogenic nuclide exposure dating were internally consistent, evidencing a single, catastrophic mass movement event that occurred at 4.54±0.27 ka (re-calculated from Ballantyne and Stone, 2004). Consequently, the boulders were very unlikely to have previously been exposed to cosmic rays or sunlight prior to transport and deposition. Moreover, the large size of the flat-topped boulders ( m) and lack of finer sediment matrix within the rock avalanche deposit, suggested that post-depositional movement or exhumation is unlikely. The Torridonian sandstones are hard, cemented rocks (Stewart, 1982; Stewart and Donnellson, 1992) susceptible to granular disintegration (e.g. Ballantyne and Whittington, 1987). Given its inland location, salt weathering is likely negligible. Kirkbride and Bell (2010) estimated edge-rounding rates of ∼3.3 mm kyr−1 for a suite of Torridonian sandstone boulder samples from a range of sites in NW Scotland under the warmer, wetter climates of the Holocene. A notably higher erosion rate of 12 mm kyr−1 was specifically determined for the Beinn Alligin rock avalanche. Kirkbride and Bell (2010) suggest that this higher erosion rate, in comparison to the other sites, is likely due to inherited rock roundness caused by abrasion during the high-magnitude depositional event. Additionally, minor differences in lithology cannot be ruled out (e.g. Twidale, 1982; Ford and Williams, 1989). Consequently, we consider the range ∼3.3 to 12 mm kyr−1 as a reasonable estimation of the Holocene erosion rate of the Torridonian sandstone boulders that comprise the Beinn Alligin rock avalanche.
A total of six rock samples were taken from the Torridonian sandstones in NW Scotland (Fig. 1). Three samples were taken from three different road cuttings of known age to calibrate the values of μ and : ROAD01 (0.01 a), ROAD02 (57 a; Fig. S1a in the Supplement), ROAD03 (44 a; Fig. S1b). Three further samples were taken from flat-topped, angular boulders that were part of the Beinn Alligin rock avalanche deposit: BALL01, BALL02 and BALL03 (Fig. 1d). Portions of the original boulder or bedrock sample were collected in the field in daylight and immediately placed into opaque, black sample bags. All samples were taken from surfaces perpendicular to incoming sunlight to ensure that the daylight irradiation geometry was similar between calibration and dating samples (cf. Gliganic et al., 2019).
4.1 Luminescence measurements
To calculate the environmental dose rate throughout burial for each sample (Table 1), U, Th and K concentrations were measured for ca. 80 g of crushed bulk sample using high-resolution gamma spectrometry. Internal dose rates were calculated assuming an internal K content of 10±2 % (Smedley et al., 2012) and internal U and Th concentrations of 0.3±0.1 and 1.7±0.4 ppm (Smedley and Pearce, 2016), in addition to the measured average grain sizes for each sample. Cosmic dose rates were calculated after Prescott and Hutton (1994). For measuring the luminescence depth profiles, sample preparation was performed under subdued-red lighting conditions to prevent contamination of the luminescence signal. Rock cores ∼7 mm in diameter and up to 20 mm long were drilled into the rock surface using an Axminster bench-top, pillar drill equipped with a water-cooled, diamond-tipped drill bit (∼9 mm diameter). Each core was sliced at a thickness of ∼0.7 mm using a Buehler IsoMet low-speed saw equipped with a water-cooled, 0.3 mm diameter diamond-tipped wafer blade. All slices were then mounted in stainless steel cups for luminescence measurements.
Table 1Luminescence results for the rock slices analysed in this study. Environmental dose rates were determined using high-resolution gamma spectrometry. The dose rates were calculated using the conversion factors of Guerin et al. (2011) and alpha (Bell, 1980) and beta (Guérin et al., 2012) dose rate attenuation factors. An internal K content of 10±2 % (Smedley et al., 2012) and internal U and Th concentrations of 0.3±0.1 and 1.7±0.4 ppm (Smedley and Pearce, 2016) were used to determine the internal alpha and beta dose rates. An a value of 0.10±0.02 (Balescu and Lamothe, 1993) was used to calculate the alpha dose rates. Cosmic dose rates were determined after Prescott and Hutton (1994). Dose rates were calculated using the Dose Rate and Age Calculator (DRAC; Durcan et al., 2015). Grain size was measured by randomly selecting grains in the rock slices for each sample and calculating ±1 standard deviation around the mean grain size.
Luminescence measurements were performed on a Risø TL/OSL reader (TL-DA-15) with a beta irradiation source. Heating was performed at 1 ∘C s−1, and the rock slices were held at the stimulation temperature (i.e. 50, 150 and 225 ∘C) for 60 s prior to IR stimulation to ensure all of the disc was at temperature before stimulating (cf. Jenkins et al., 2018). IRSL signals were detected in blue wavelengths using a photo-multiplier tube fitted with Schott BG-39 (2 mm thickness) and Corning 7-59 (2 mm thickness) filters. A MET-post-IR IRSL sequence (Table S1 in the Supplement) was used to determine IRSL signals at three different temperatures (50, 150 and 225 ∘C) successively, hereafter termed the IR50, pIRIR150 and pIRIR225 signals. Luminescence depth profiles were determined for each core by measuring the natural signal (Ln) normalised using the signal measured in response to a 53 Gy test dose (Tn), hereafter termed the signal. The IRSL signal was determined by subtracting the background signal (final 20 s, 40 channels) from the initial signal (0–3.5 s, 7 channels). The large test dose (53 Gy) was used to reduce the impact of thermal transfer or incomplete resetting of the IRSL signal between measurements (after Liu et al., 2016).
De values were determined for the shallowest disc and the deepest disc from one core of each sample to quantify the natural residual dose and saturation limit (L0, Eq. 1), respectively. Fading rates (g values, Aitken, 1985) were determined for three discs of each sample and normalised to a tc of 2 d (Huntley and Lamothe, 2001). The weighted mean and standard error of the g values for all discs were 3.7±0.4 % per decade (IR50), 1.0±0.5 % per decade (pIRIR150) and 1.0±0.5 % per decade. (pIRIR225). The large uncertainties on the individual g values measured were derived from uncertainty in the fit of the data, which is typical of fading measurements (e.g. Smedley et al., 2016). The fading rates were in line with previous measurements of IRSL signals (e.g. Roberts, 2012; Trauerstein et al., 2014; Kolb and Fuchs, 2018). Lehmann et al. (2019a) performed sensitivity tests of the shape of the luminescence depth profiles (IR50) with a high and low g value endmembers and these simulations demonstrated that athermal loss of signal has a minimal impact upon the IRSL depth profile shape; thus, athermal loss (i.e. fading rates) was not considered in calculations.
Previous studies have shown that the IR50 signal bleached faster than the pIRIR signals (Smedley et al., 2015). To test the inherent bleaching rates of the feldspars in our samples, artificial bleaching experiments were performed on seven discs from all six samples (note that these experiments do not test for variations in light attenuation with depth). All previously analysed discs were given a 105 Gy dose and then subjected to different exposure times in a solar simulator (0, 1, 10, 30 m, and 1, 4, 8 h) and the normalised luminescence signals (IR50, pIRIR150 and pIRIR225) were measured (Fig. S2). The results show some variations after 1 m of solar simulator exposure. However, luminescence signals reduced to 2 %–6 % (IR50), 6 %–11 % (pIRIR150) and 14 %–22 % (pIRIR225) of the unexposed light levels after 1 h and 1 %–2 % (IR50), 2 %–3 % (pIRIR150) and 4 %–7 % (pIRIR225) after 8 h. This indicates that within our samples the minerals emitting the IRSL signals (i.e. K feldspar) have similar inherent bleaching rates when exposed to longer durations of time (i.e. >8 h in the solar simulator).
4.2 Rock composition
After luminescence measurements were performed, each rock slice (e.g. Fig. 2) was analysed to investigate potential changes in rock composition with depth (inferred by opacity and grain size). The average down-core grain size of each sample was measured under an optical microscope using Infinity Analyze. For each rock slice of an example core per sample, 10 randomly selected grains were measured and the mean and standard deviation grain size were calculated per core and plotted against the core depths (Fig. 3b). Down-core red–green–blue (RGB) values were determined for each sample to investigate whether there was any colour variation within the sample and externally between samples, thus providing a semi-quantitative tool to detect variability in rock opacity (Meyer et al., 2018). Raster images of RGB were obtained for each rock slice using an EPSON Expression 11000XL flatbed scanner at 1200 dpi resolution (e.g. Fig. S3). Mean and standard deviations of the RGB values (e.g. Fig. 3a) for each rock slice were calculated using the raster package in R (version 2.9-23; Hijmans, 2019).
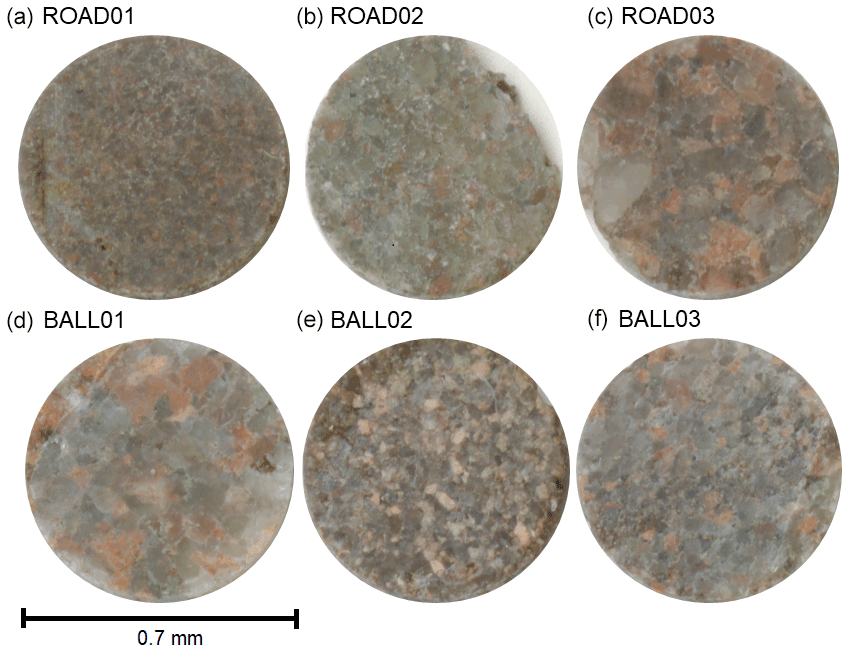
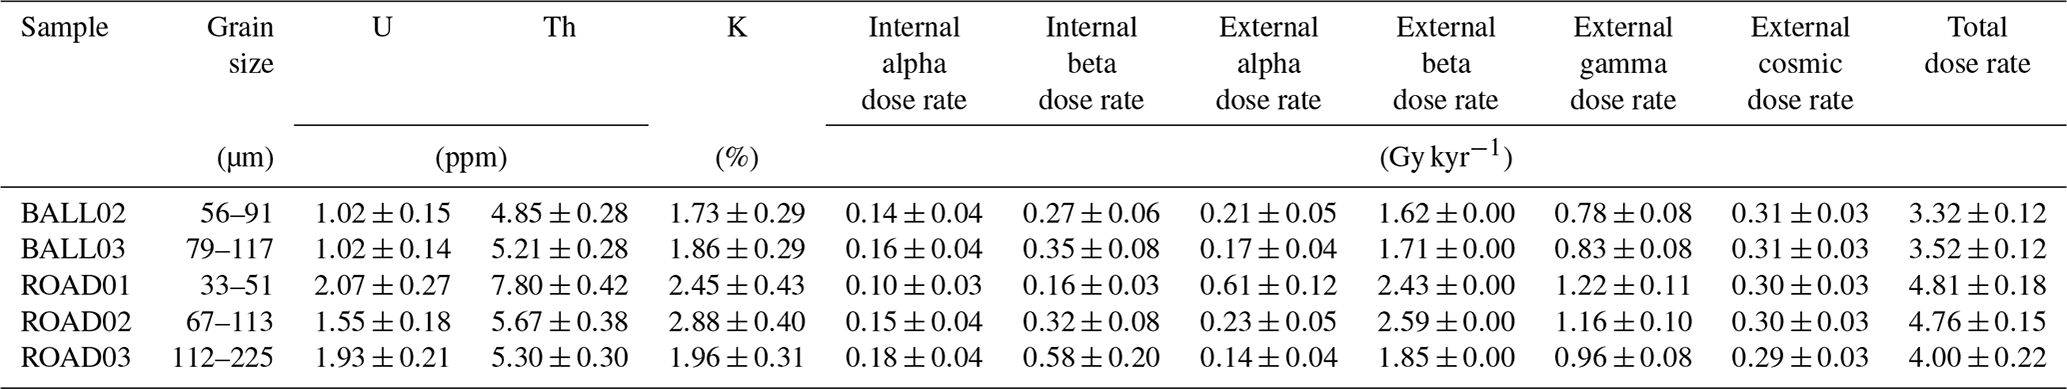
Figure 2Images of example rock slices (0.7 mm diameter) for each sample taken using the EPSON Expression 11000XL flatbed scanner.
Figure 3(a) RGB values (0= black; 255= white) and (b) grain size for each sample, calculated as the mean (± standard deviation) of the slices at each depth in all of the replicate cores analysed. Note that the RGB values and grain size measurements were not derived from exactly the same cores but example cores for each sample.
5.1 Luminescence depth profiles
The luminescence depth profiles (IR50, pIRIR150 and pIRIR225) (Fig. 4) record bleaching fronts caused by sunlight exposure for all of the known-age samples. The luminescence depth profile measured for core 3 of sample ROAD02 (Fig. 4g, h, j) was inconsistent with cores 1 and 2, giving high standard deviation values for the IR50 (1.2), pIRIR150 (1.1) and pIRIR225 (0.9) signals; thus, core 3 was removed from subsequent analysis (likely sample preparation issues related to drilling preservation of the weathered surface). The luminescence depth profiles for the remaining replicate cores for all three samples were broadly consistent within each rock sample with mean standard deviations ranging from 0.2 to 0.8.
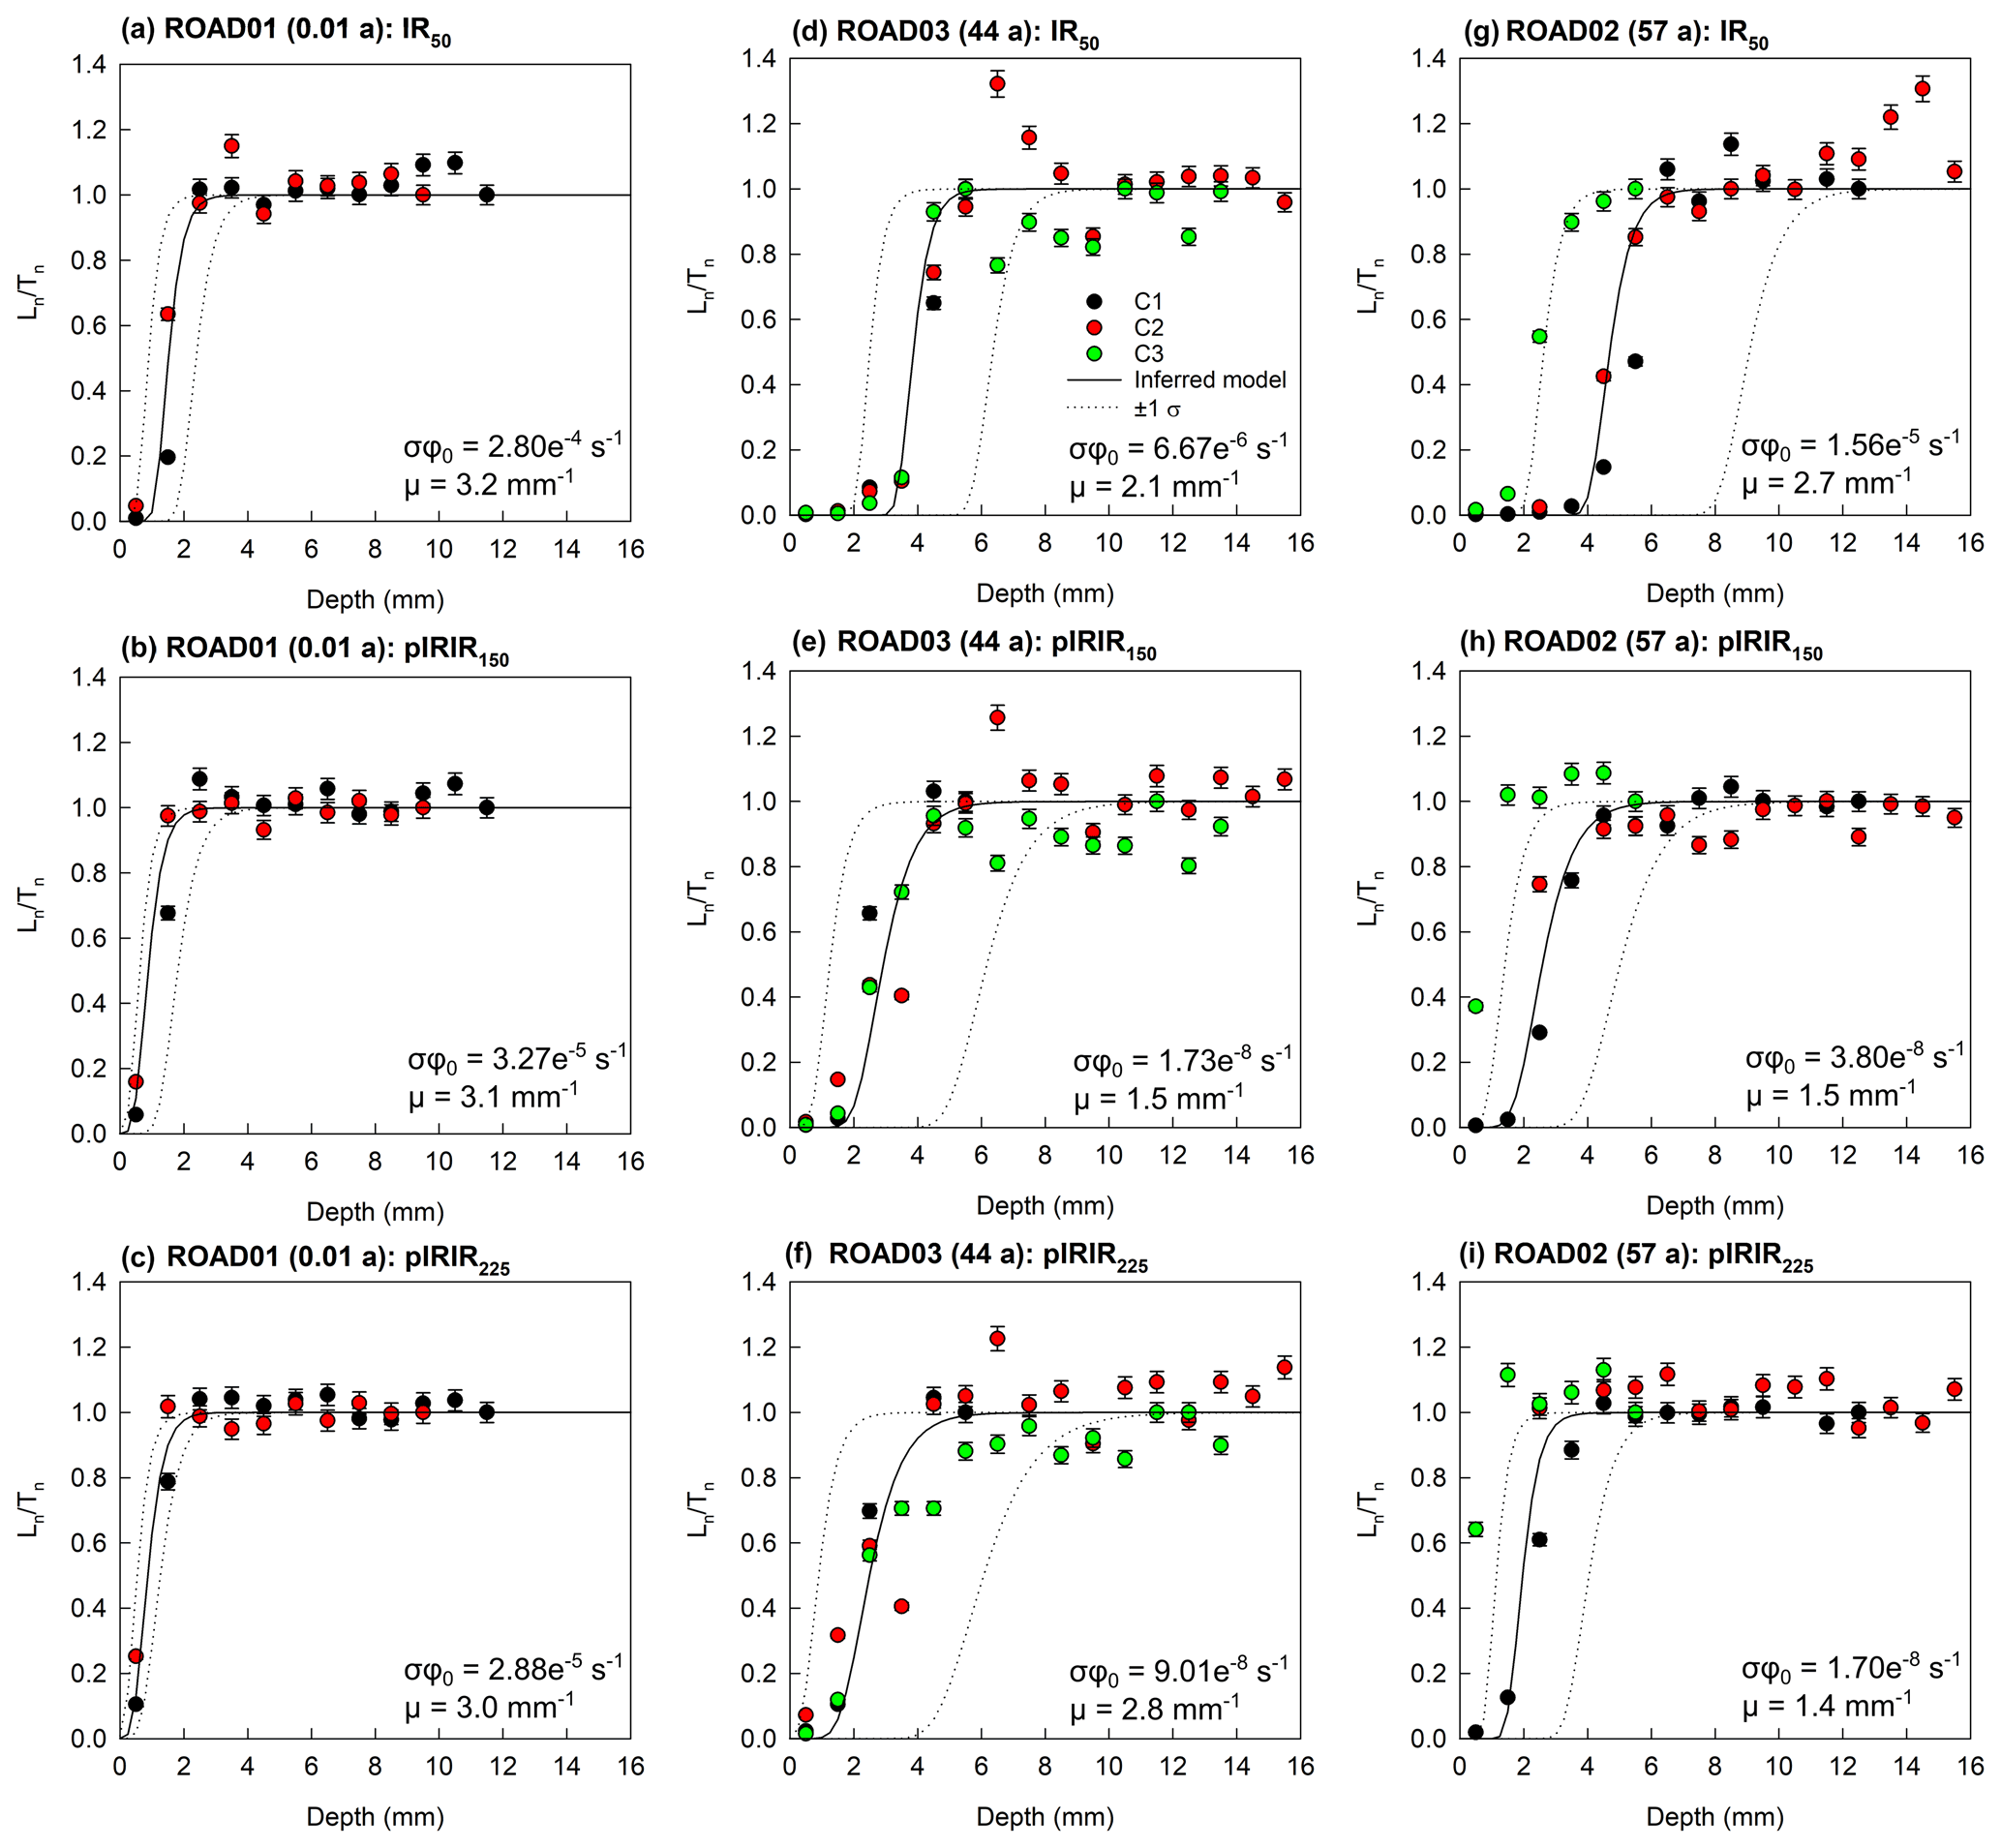
Figure 4Presented in age order are the IRSL depth profiles for each of the three replicate cores analysed per sample using the IR50 (a, d, g), pIRIR150 (b, e, h) and pIRIR225 (c, f, i) signals for samples ROAD01 (0.01 a; a–c), ROAD03 (44 a; d–f) and ROAD02 (57 a; g–i). All of the raw data presented in this figure (Tables S2–S4) were normalised individually for each core, and subsequent analysis uses the data in this format. The black line shown is the best fit of the inferred model that was fitted to derive the corresponding and μ values included in each panel. The dotted lines show the corresponding fits modelled using the and μ values (Table 2). Note that core 3 of ROAD02 was not considered for fitting.
The luminescence depth profiles (Fig. 4) for the IR50 signal were consistent with the increasing sunlight exposure ages for ROAD01 (0.01 a), ROAD03 (44 a) and ROAD02 (57 a), with bleaching fronts at 0.75, 4.00 and 4.75 mm, respectively (Fig. S5a). This indicated that the depth of the IR50 bleaching front was dominated by exposure duration for the known-age samples as expected. Similarly, the pIRIR150 and pIRIR225 bleaching fronts were shallower in sample ROAD01 (0.75 mm) compared to ROAD02 and ROAD03 (2.00–3.00 mm), reflecting the younger exposure duration of ROAD01. However, the pIRIR150 and pIRIR225 bleaching fronts were at similar depths (2.75 and 3.00 mm and 2.00 and 2.50 mm, respectively) for both ROAD02 (57 a) and ROAD03 (44 a). This suggests that either another factor is influencing light penetration with depth in these rocks (e.g. small differences in the orientation of the sampled rock faces; Fig. S1) or that the pIRIR signals cannot resolve between a 57 and 44 a exposure history (difference of only 13 a). Note that the inferred models shown in Fig. 4 were fitted using the and μ values included in each figure. See Sect. 5.2 for further explanation of the estimation of the model parameters.
The luminescence depth profiles measured for the unknown-age samples BALL02 and BALL03 using the IR50, pIRIR150 and pIRIR225 signals (Fig. 5) recorded bleaching fronts caused by sunlight exposure. Conversely, the luminescence depth profile for sample BALL01 had saturated IRSL signals throughout the core and did not display any evidence of IRSL signal resetting with depth (Fig. 5a–c). A luminescence depth profile measured for a core drilled into the bottom surface (Bottom C1; Fig. 5a–c) confirmed that the bottom surface of BALL01 was also saturated. The lack of a bleaching front in sample BALL01 is difficult to explain as the sample was taken in daylight and had seemingly identical characteristics to samples BALL02 and BALL03 (i.e. no lichen cover or coatings preventing light penetration in the rock). Although all the samples were similar in colour and opacity (Fig. 3a), the surface of sample BALL01 was coarser in grain than BALL02 and BALL03 (Figs. 2; 3b). Studies have shown that coarser grain sizes are more susceptible to mechanical weathering via grain detachment induced by chemical weathering (Israeli and Emmanuel, 2018). Thus, although care was taken when sampling to mark the surface of the rock and to measure the length of the rock cores before and after slicing, it is possible that the luminescence depth profile (likely <10 mm based on BALL02 and BALL03) was lost during sampling and/or sample preparation due to the presence of a fragile weathering crust, potentially with a sub-surface zone of weakness (e.g. Robinson and Williams, 1987). Furthermore, field observations showed the presence of a rock pool on the surface of the boulder sampled for BALL01, which is not present on BALL02 and BALL03 (Fig. 1d); thus, there is also potential that the surface sampled for BALL01 had experienced enhanced chemical weathering via trickle paths draining the rock pool. These are commonly linked to a greater density of micro-cracks in the uppermost millimetres of the rock (Swantesson, 1989, 1992). Consequently, we did not derive exposure ages or erosion rates from BALL01. Where rock pools are likely on boulders, the highest rock surface should be sampled for luminescence techniques to avoid the potential for pooling or trickle paths.
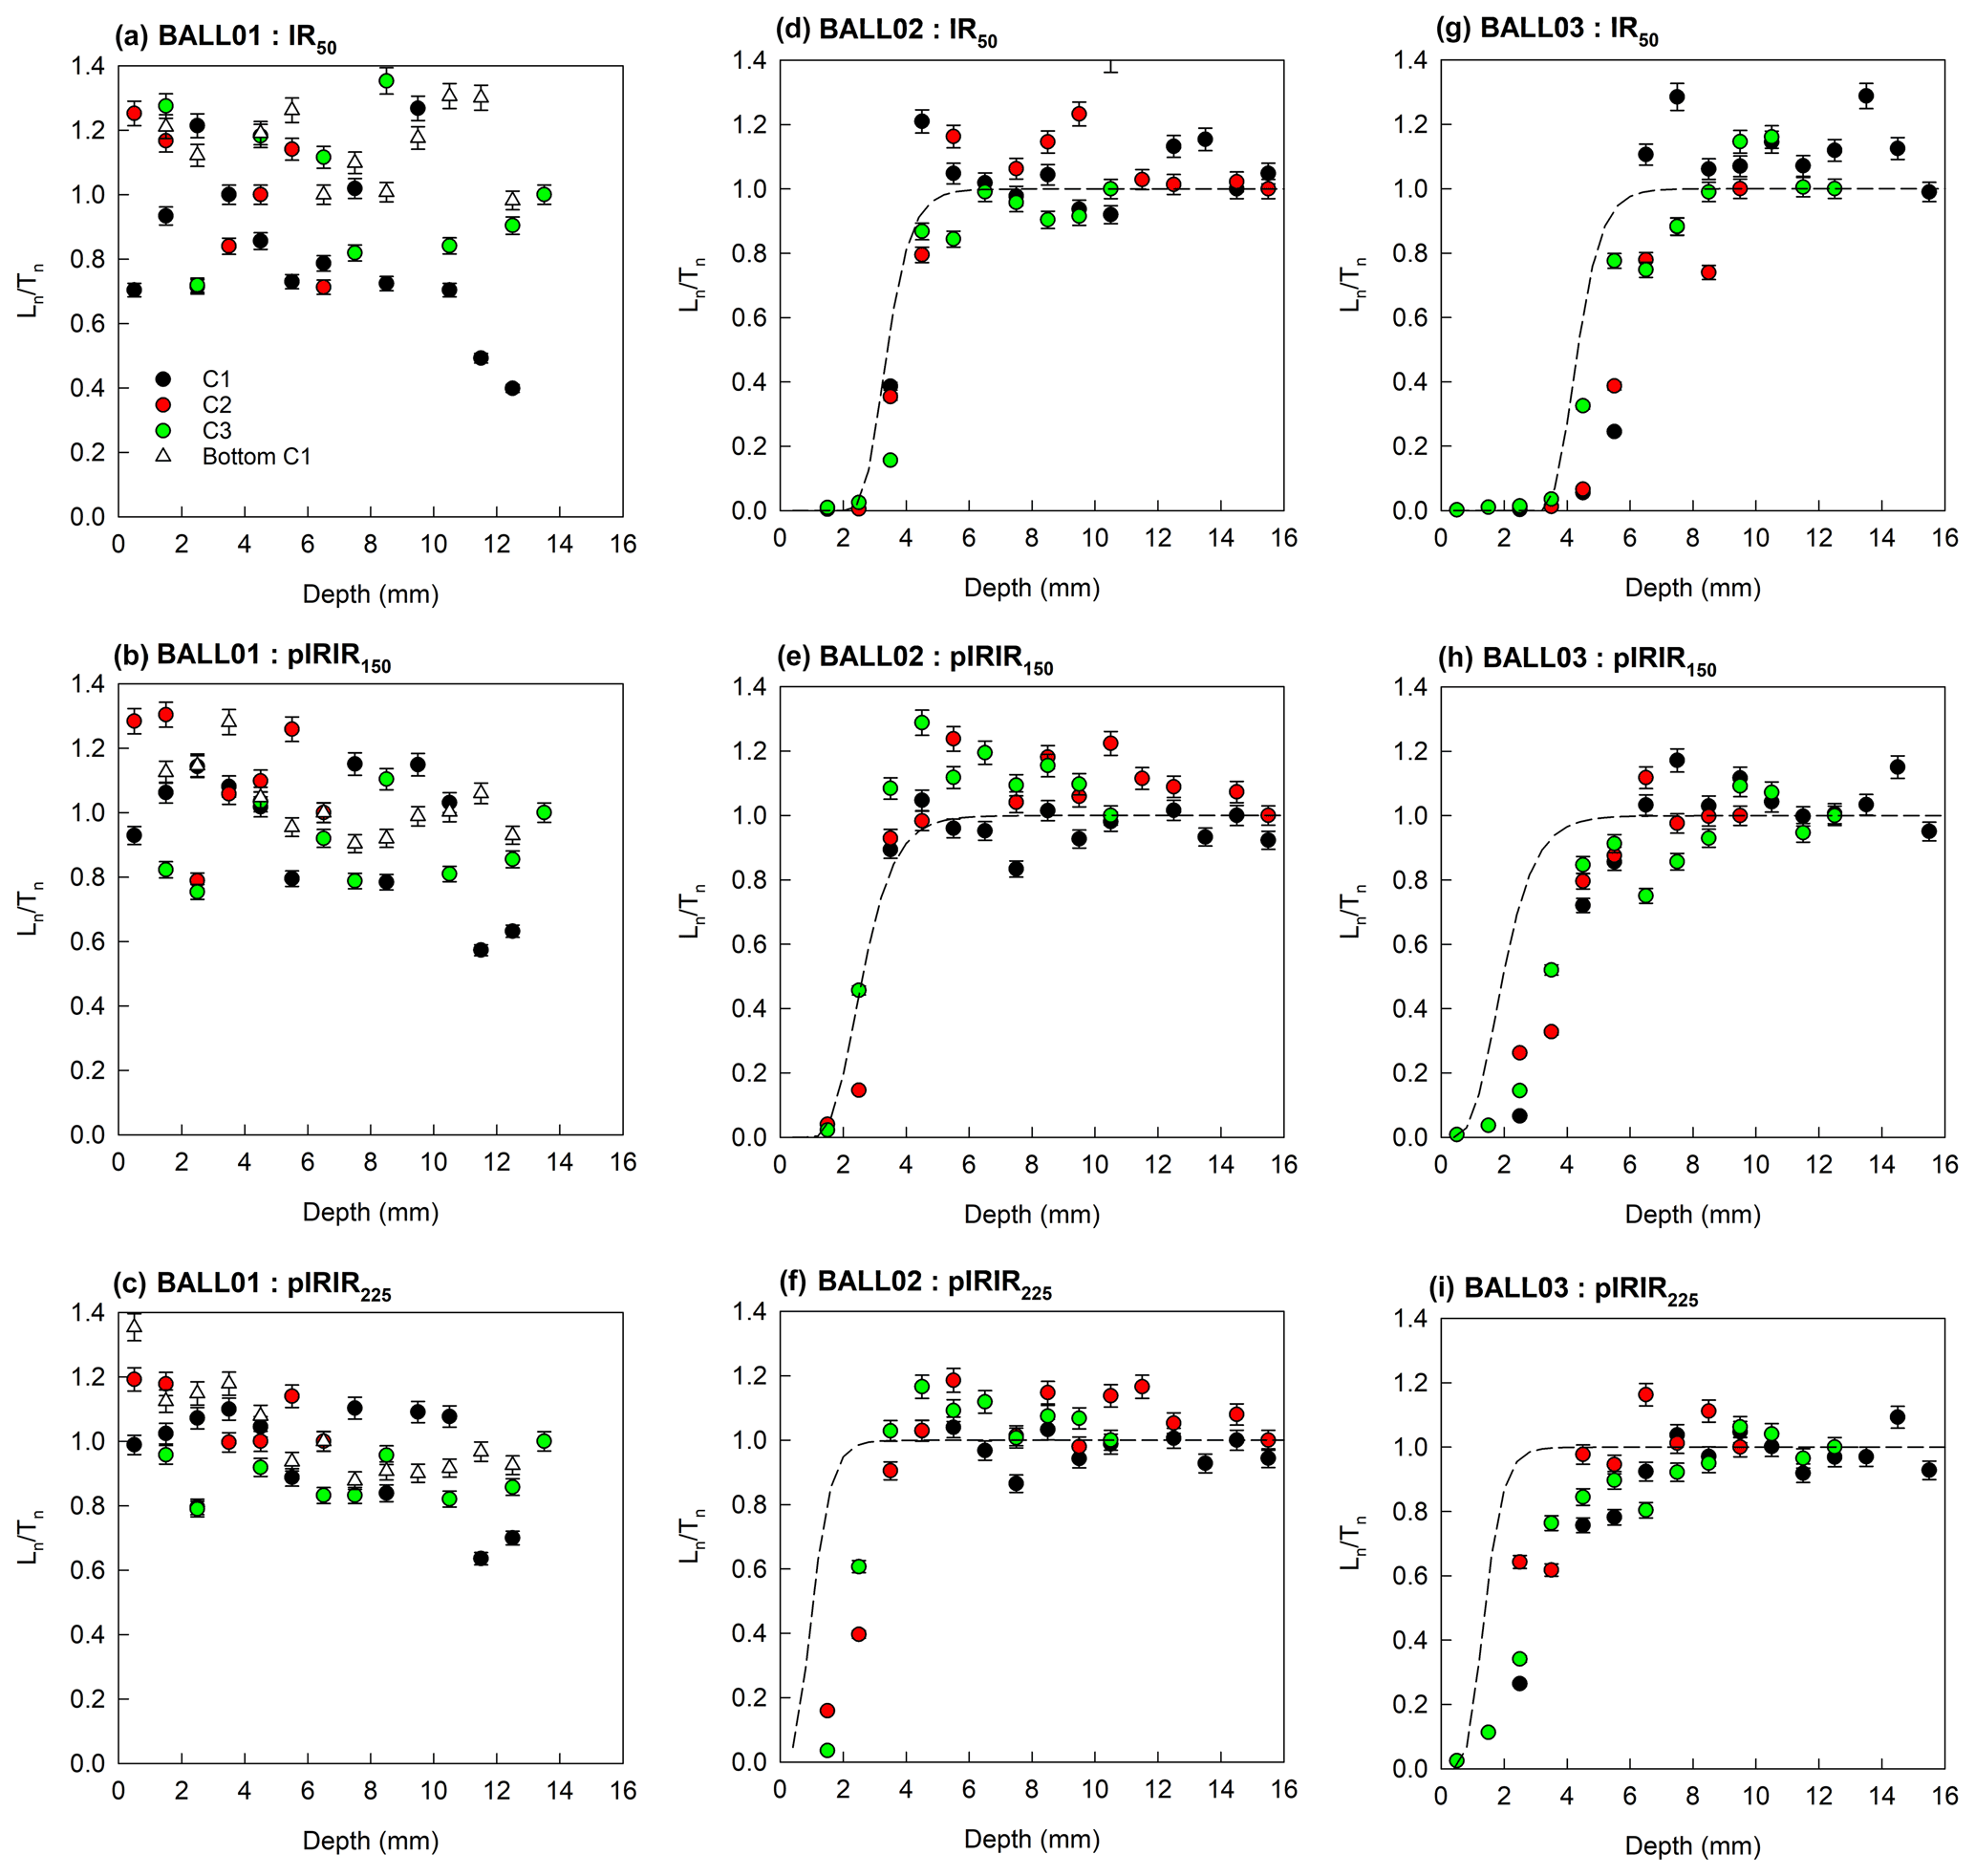
Figure 5IRSL depth profiles for each of the replicate cores analysed using the IR50 (a, d, g), pIRIR150 (b, e, h) and pIRIR225 (c, f, i) signals for samples BALL01 (a–c), BALL02 (d–f) and BALL03 (g–i). All of the raw data (Tables S5–S7) were normalised individually for each core, and subsequent analysis uses the data in this format. The dashed line is the best fit of the inferred erosion model for each luminescence depth profile derived from the probability distributions shown in Fig. 7, where erosion rates are included in Table 3.
5.2 Estimation of model parameters
To determine an apparent exposure age or erosion rate from the measured luminescence depth profiles, the variables that control the evolution of a luminescence depth profile in a rock surface must be parameterised; specifically, the dose rate () (see Sect. 4.1), saturation level (D0), and μ. D0 was determined experimentally from saturated dose response curves measured for the deepest rock slices of each sample. and μ were calibrated using Eq. (1) and the known-age samples (ROAD01, ROAD02 and ROAD03) of similar, suitable rock composition as determined by the down-core profiles of RGB and grain size (Sect. 4.2). Note that () is not considered in Eq. (1) but is used to determine an apparent exposure age or erosion rate and so needs to be measured for each sample (see Sect. 2). Down-core RGB values for all samples were internally consistent (Fig. 3a) as indicated by the relative standard deviation (RSD) range between 8 % and 12 %. The down-core RGB values were also externally consistent between all samples (Fig. 3a), with the exception of the slightly darker-coloured sample ROAD01. However, measurements of grain size (Fig. 3b) showed that the known-age sample ROAD02 (90±23 µm) had a similar grain size to the unknown-age samples BALL02 (73±18 µm) and BALL03 (98±19 µm), whereas ROAD01 (42±9 µm) and ROAD03 (168±56 µm) were finer and coarser grained, respectively. Given the similarity in colour and grain size, it was considered most appropriate to calibrate and μ for the unknown age samples (BALL02 and BALL03) using known-age sample ROAD02.
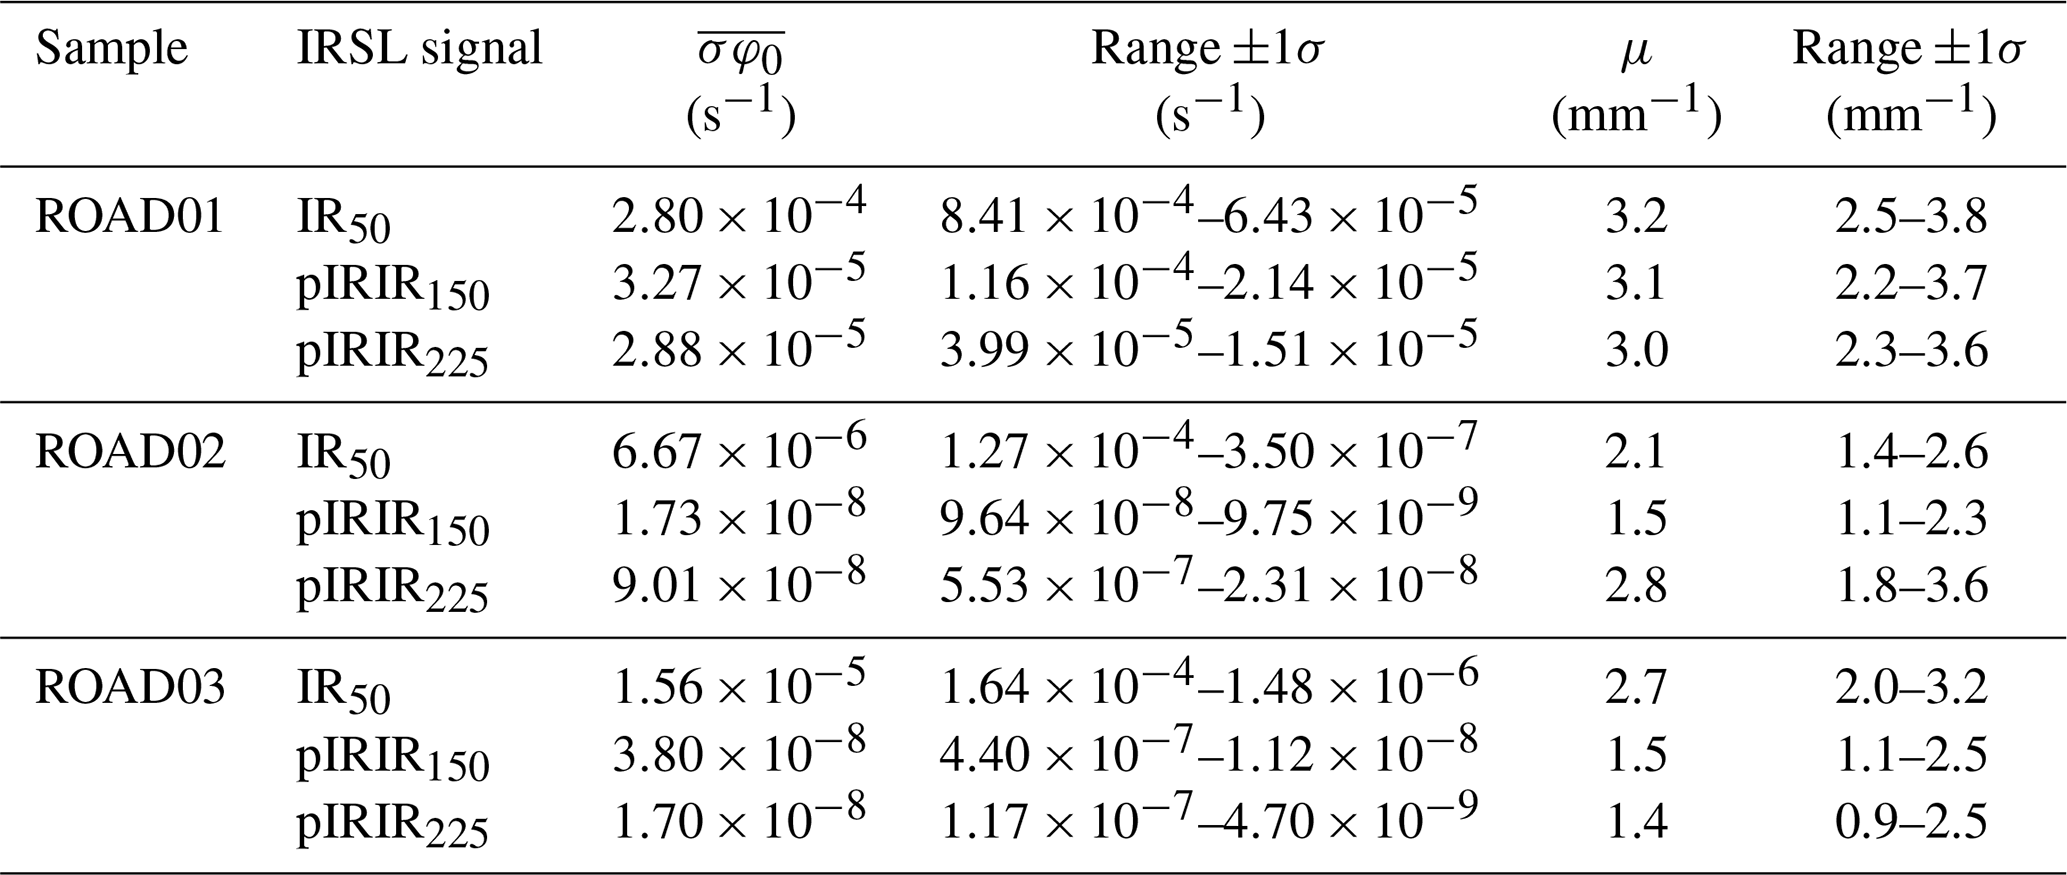
The values of and μ were determined by fitting Eq. (1) using the approach of Lehmann et al. (2019a). The inferred model (Eq. 1) had a good fit to the measured data for all samples and signals (Fig. 4), and μ and were calculated (Table 2; Fig. 6). For ROAD01, the parameters determined using the IR50 (μ=3.2 mm−1, s−1), pIRIR150 (μ=3.1 mm−1, s−1) and pIRIR225 (μ=3.0 mm−1, s−1) signals were broadly consistent. For ROAD02, the parameters differed between the IR50 (μ=2.1 mm−1, s−1), pIRIR150 (μ=1.5 mm−1, s−1) and pIRIR225 (μ=2.8 mm−1, s−1) signals, but the values for each signal were broadly similar to the equivalent values determined for ROAD03 using the IR50 (μ=2.7 mm−1, s−1), pIRIR150 (μ=1.5 mm−1, s−1) and pIRIR225 (μ=1.4 mm−1, s−1) signals. Given the similarity of and μ determined using all three IRSL signals for ROAD02 and ROAD03 and the difference in grain sizes (Fig. 3b), it suggests that grain size has a minimal impact upon the attenuation of light into a rock surface in comparison to other factors (e.g. mineralogy, surficial coatings). The μ values for samples ROAD01, ROAD02 and ROAD03 determined using the IR50 signal in this study were comparable to μ values in existing literature for sandstones using K feldspar e.g. 3.06 mm−1 (Ou et al., 2018). For sample ROAD01, μ and were similar for all three IRSL signals with large uncertainties (Fig. 6a–c), which is likely related to the shorter exposure age of this sample (0.01 a). The finer grain size and darker rock opacity of sample ROAD01 in comparison to ROAD02 and ROAD03 likely explained the larger values of μ (i.e. greater light attenuation with depth into the rock surface).
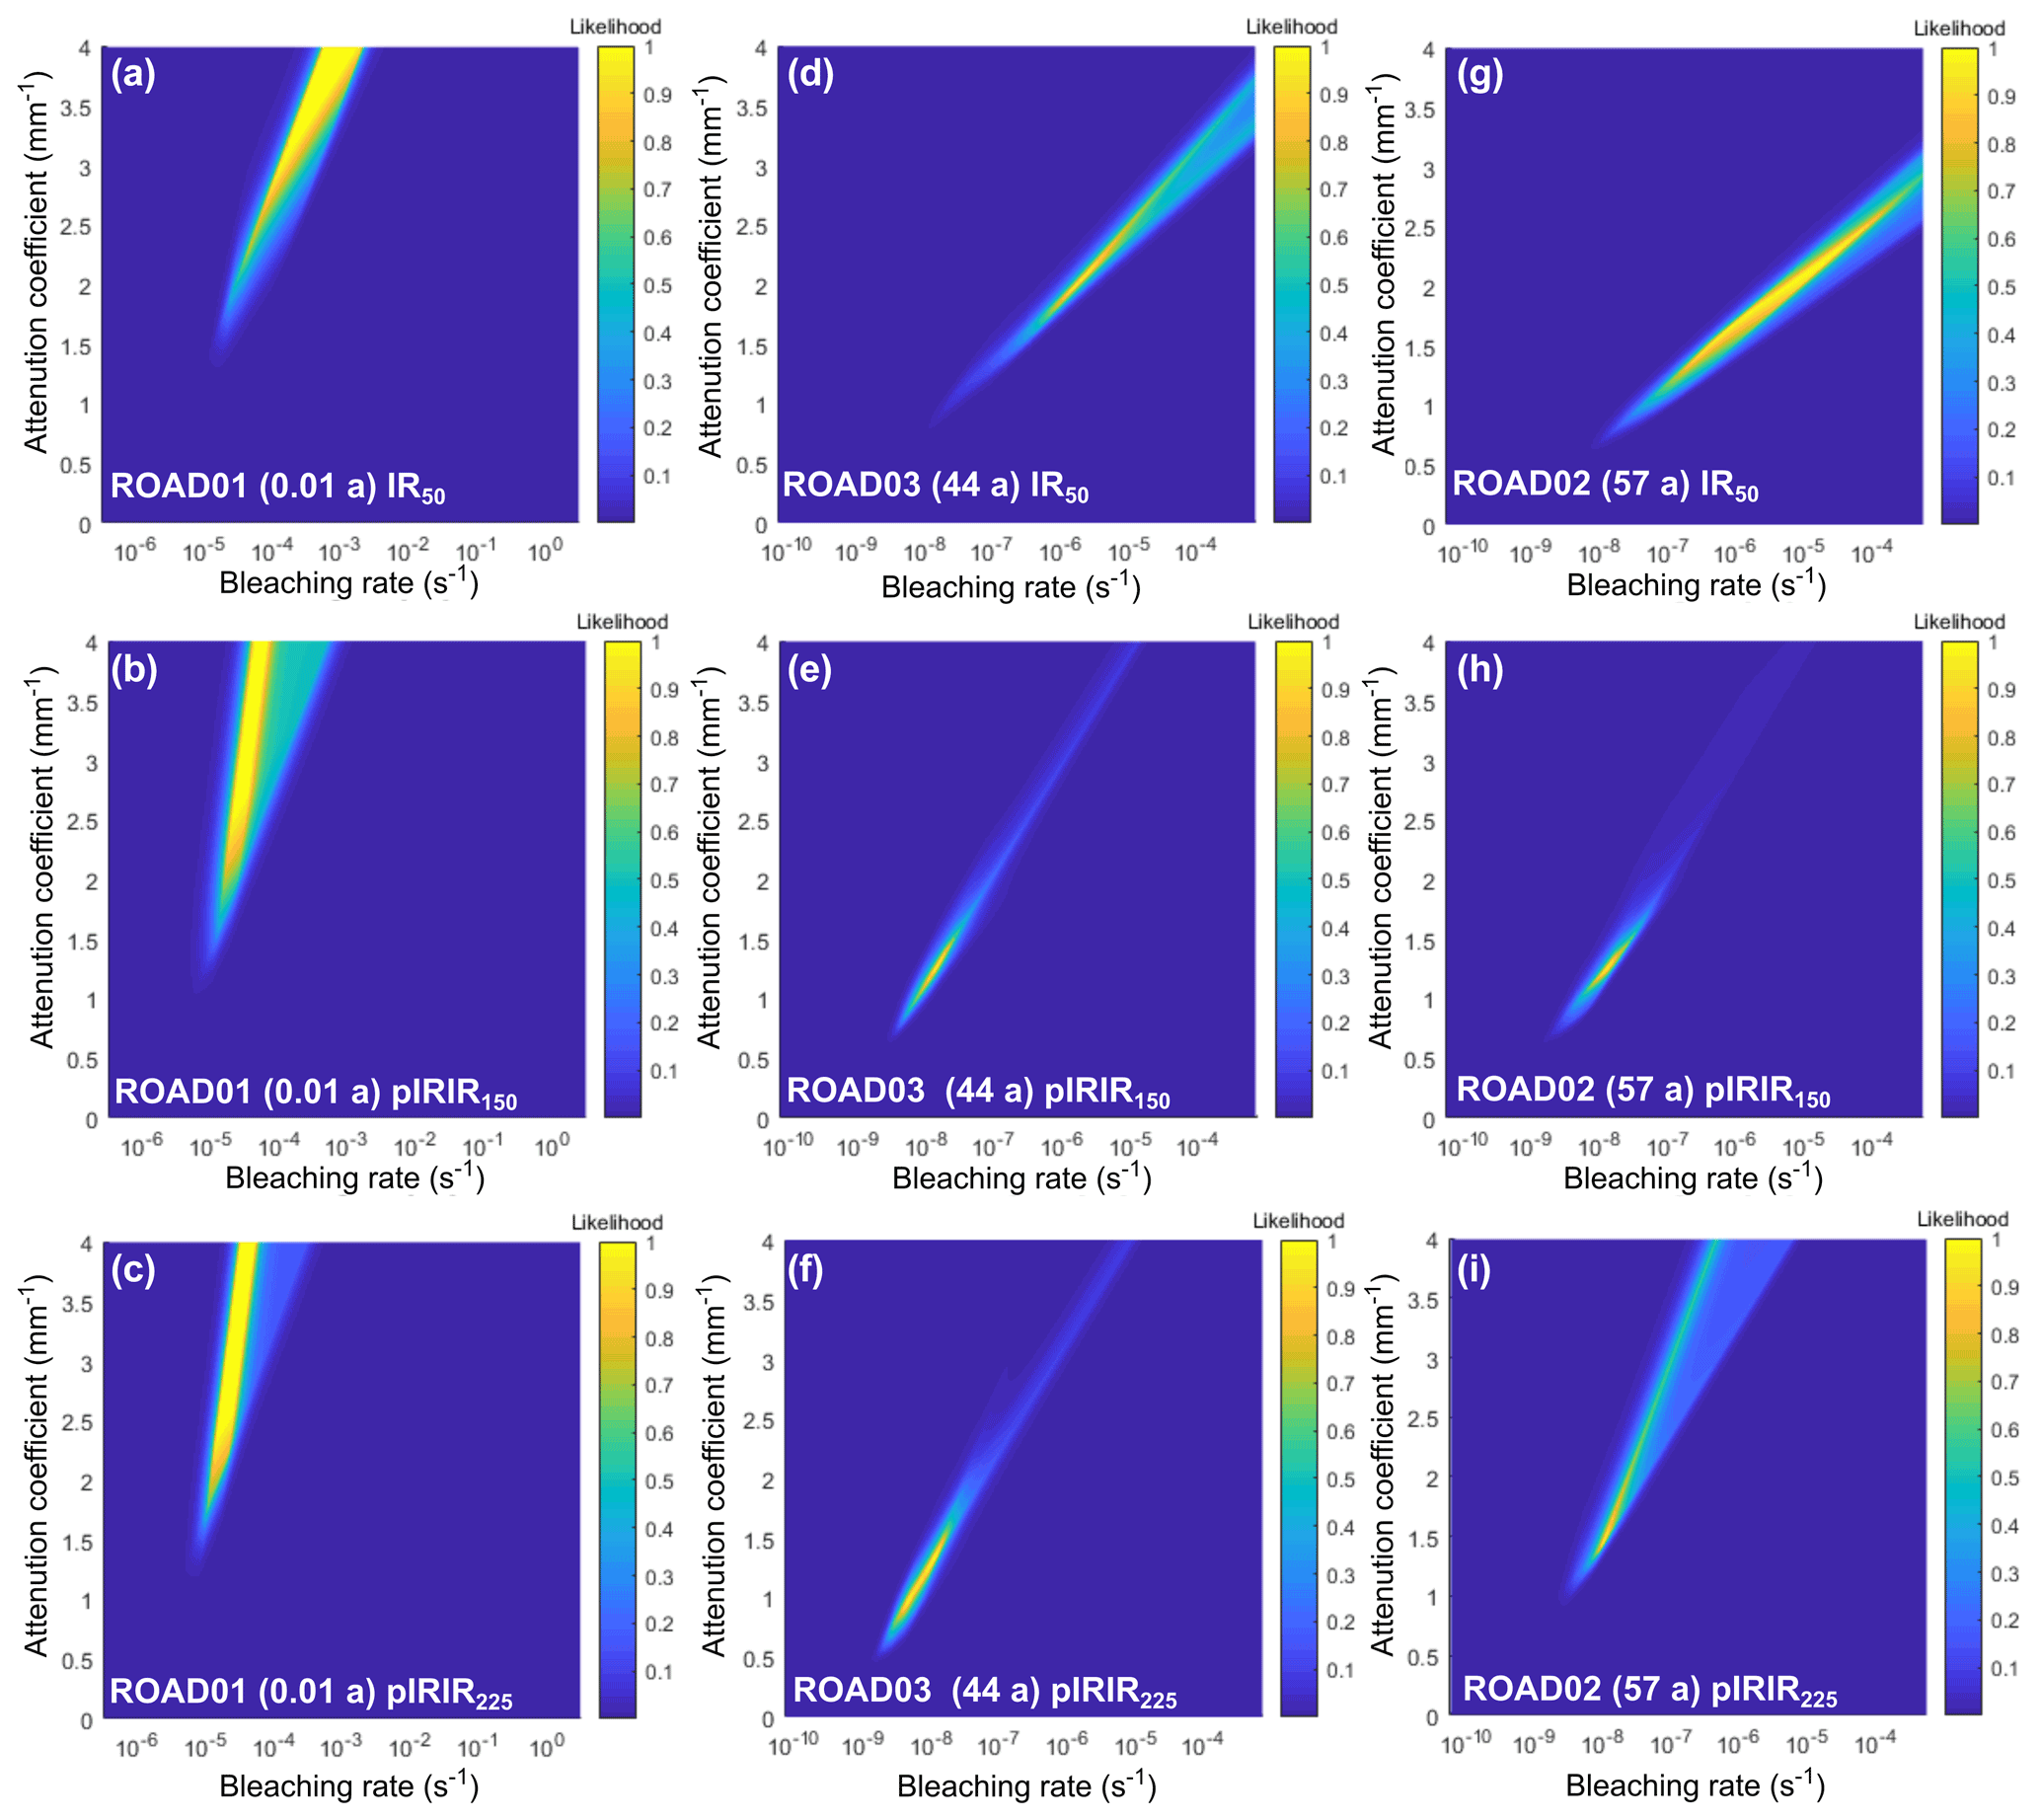
Figure 6Presented in age order is the relationship between and μ parameters for ROAD01 (a–c), ROAD03 (d–f) and ROAD02 (g–i) using the IR50 (a, d, g), pIRIR150 (b, e, h) and pIRIR225 (c, f, i) signals using the approach of Lehmann et al. (2018).
Table 2Calibration factors determined by fitting depth profiles. Note that values presented are median values.
5.3 Apparent exposure ages and erosion rates
Luminescence exposure ages were determined from the luminescence depth profiles using μ and derived from sample ROAD02 for each of the IRSL signals (Table 3). For BALL03, the IR50 (387±103 a), pIRIR150 (296±54 a) and pIRIR225 (362±49 a) signals all gave luminescence exposure ages in agreement within uncertainties. For BALL02, the three signals were inconsistent with one another. The pIRIR225 signal (263±30 a) was consistent with BALL03, but the IR50 (8±2 a) and pIRIR150 (66±16 a) signals for BALL02 were younger than BALL03. All apparent exposure ages based on the different luminescence signals were at least one order of magnitude younger than the apparent exposure age based cosmogenic nuclide dating (4.54±0.27 ka; Ballantyne and Stone, 2004). This was likely because erosion over time in this wet, temperate climate has removed material from the surface of the rock and created shallower luminescence depth profiles in comparison to a non-eroding profile; thus, the luminescence depth profile is dependent upon both exposure age and the erosion rate (Sohbati et al., 2018; Lehmann et al., 2019a).
Table 3Luminescence exposure ages and erosion rates determined using the approach of Lehmann et al. (2018, 2019a), respectively. The values of and μ were determined from known-age sample ROAD02 (57 a).
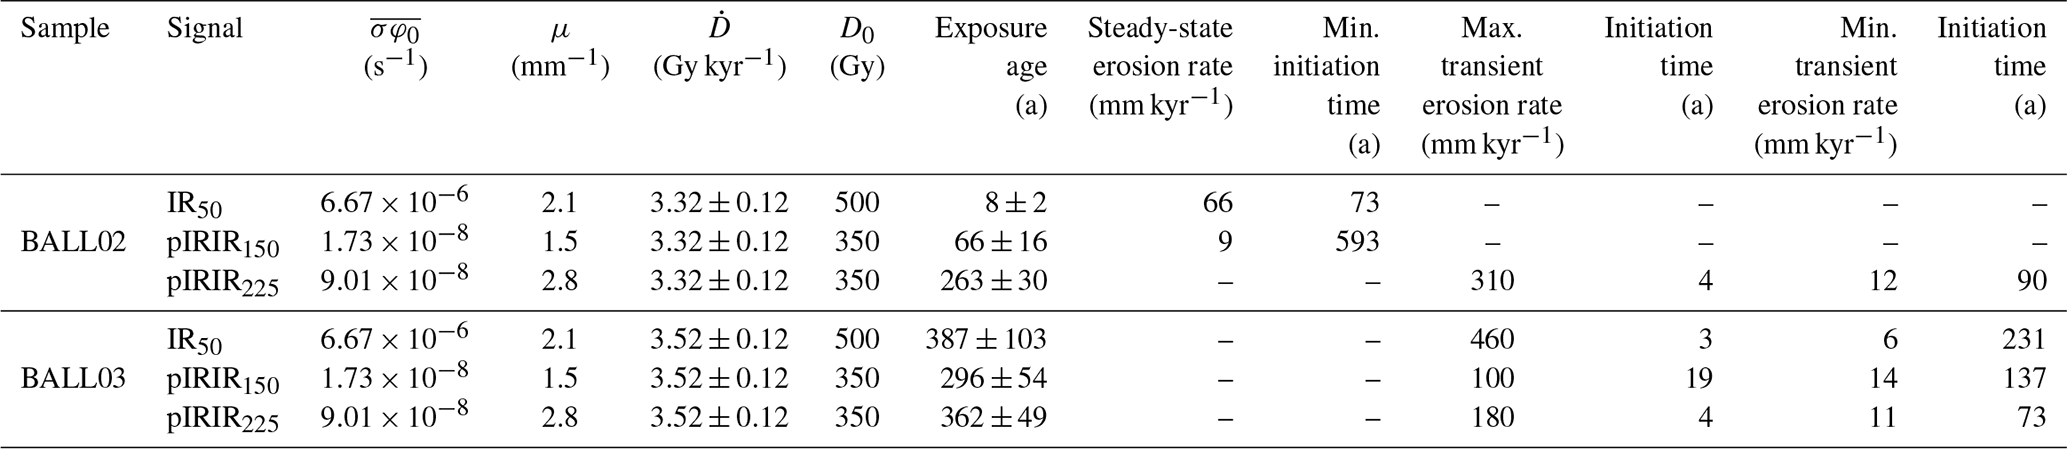
To test whether erosion rates could be determined for the Beinn Alligin boulders from the luminescence depth profiles, we performed erosion rate modelling following the inversion approach of Lehmann et al. (2019a) and constrained by the re-calculated cosmogenic nuclide age (Ballantyne and Stone, 2004). This approach defines an erosion history that follows a step function with an initial period of zero erosion, followed by an immediate increase to a constant erosion rate at a defined time. It attempts to recover parameter combinations (erosion rate and timing of erosion initiation) that are both consistent with the cosmogenic nuclide concentration and produce modelled luminescence profiles that match observations. For BALL02, both the IR50 and pIRIR150 signals suggested that the system had approached a steady-state with erosion rates of 66 mm kyr−1 (IR50) and 9 mm kyr−1 (pIRIR150) applied over time periods >73 and 593 yr, respectively. However, the pIRIR225 signal suggested a transient erosion state, where the luminescence signal could be derived from numerous pairs of erosion rates and initiation times from a maximum erosion rate of 310 mm kyr−1 over a minimum time interval of 4 yr to a minimum erosion rate of 12 mm kyr−1 over a minimum time interval of 90 yr. All three IRSL signals from sample BALL03 consistently suggested a system undergoing a transient response to erosion, which was consistent with the pIRIR225 signal of BALL02 (Fig. 7, Table 3). The IR50 signal for BALL03 derived a maximum erosion rate of 460 mm kyr−1 over a minimum time interval of 3 yr and a minimum erosion rate of 6 mm kyr−1 over a minimum time interval of 231 yr. The pIRIR150 signal for BALL03 derived a maximum erosion rate of 100 mm kyr−1 over minimum time interval of 19 yr and a minimum erosion rate of 14 mm kyr−1 over a minimum time interval of 137 yr. The pIRIR225 signal for BALL03 derived a maximum erosion rate of 180 mm kyr−1 over a minimum time interval of 4 yr and a minimum erosion rate of 11 mm kyr−1 over a minimum time interval of 73 yr.
Figure 7Probability distributions inverted from the respective plots of luminescence depth profiles derived from the inversion results (using the approach of Lehmann et al., 2019a) for samples BALL02 (a–c) and BALL03 (d–f) using the IR50 (a, d), pIRIR150 (b, e) and pIRIR225 (c, f) signals. The x axis plots the time interval of the erosion rate initiation. Forbidden zones define the range of solutions with high erosion rates and durations that are not feasible within the bounds of the experimental 10Be and luminescence data.
At face value, the fit of the inferred erosion model to the experimental data for BALL02 using the IR50 (Fig. 5d) and pIRIR150 (Fig. 5e) signals is better than the equivalent fits for BALL02 using the pIRIR225 signal (Fig. 5f) and BALL03 using the IR50 (Fig. 5g), pIRIR150 (Fig. 5h) and pIRIR225 (Fig. 5i) signals. In the latter cases, the inferred erosion model is shallower than the experimental data. This could suggest that the and μ values were inaccurate, i.e. that the attenuation of light with depth into the rock surface was lower in BALL02 (pIRIR225 signal) and BALL03 (IR50, pIRIR150 and pIRIR225 signals) than estimated by ROAD02. A possible explanation for this is that the surface of the road cut sampled by ROAD02 (Fig. S1a) was orientated slightly differently to the Beinn Alligin rock avalanche boulders sampled by BALL02 and BALL03 (Fig. 1d), relative to the incoming sunlight (e.g. Gliganic et al., 2019). However, if the orientation of the known-age road cut samples was even slightly inconsistent with the unknown samples, we would expect these inconsistencies to manifest similarly in all three MET signals for BALL02 and BALL03, which was not observed here. A factor that is common to the less well-fitting profiles is that they derive transient erosion states. This suggests that these surfaces experienced complex erosional histories over time whereby the erosion rate was time varying. Consequently, it is possible that surficial weathering products may have changed in thickness and composition over time, which in turn could slightly vary the attenuation of light (Meyer et al., 2018; Luo et al., 2018), meaning that the calibration of and μ from ROAD02 here introduced uncertainty into the inferred erosion model as it was not time varying. It is also possible that sample-specific measurements of and μ (e.g. Ou et al., 2018), rather than calibration from known-age samples, could reduce the uncertainty introduced by time-varying light attenuation. However, further investigation is required into the physical mechanisms of time-varying light attenuation in the context of surficial weathering and subsequent erosion and the impacts upon inferred transient erosion rates.
6.1 Luminescence depth profiles for the Beinn Alligin rock avalanche
Despite the similarity in rock opacity, grain size, aspect and exposure history, the luminescence depth profiles for samples BALL02 and BALL03 from the Beinn Alligin rock avalanche were inconsistent (Fig. 5). We consider it unlikely that this lack of consistency was caused by local variations in erosion rates (e.g. due to microclimate, aspect, etc.; Hall et al., 2005, 2008) as there were discrepancies between all three IRSL signals of BALL02. We would expect local erosion rate variations between samples to be consistently recorded across each of the IRSL signals, assuming the model parameterisation (μ and ) were accurate. Specifically, and with all other things being equal, a locally variable erosion rate would translate the bleaching front(s) closer to the rock surface by a proportionally consistent amount for each signal of a given sample.
Analysis of the rock opacity with depth (Sect. 4.2; Meyer et al., 2018) showed that sample BALL02 was more positively skewed towards darker colours than ROAD02 and BALL03 (Figs. S3, S4), with higher surficial values caused by Fe staining. Fe staining can occur on rock surfaces with seasonal rock pools and trickle paths (Swantesson, 1989, 1992). The presence of a thin Fe coating (<1 mm) on the rock surface would have changed the intensity and wavelength of the net daylight flux received by individual grains (e.g. Singhvi et al., 1986; Parish, 1994) and likely increased light attenuation with depth (e.g. Meyer et al., 2018; Luo et al., 2018). Consequently, the parameterisation of μ and derived from sample ROAD02 would be inaccurate for BALL02. Interestingly, the similarity between BALL02 and BALL03 for the pIRIR225 signal suggests that the presence of an Fe-coating altered the attenuation of the IR50 and pIRIR150 signals to a lesser extent than the pIRIR225 signal, but the reasons for this requires further investigation. The application of the MET-pIRIR rather than just the stand-alone IR50 signal protocol provided a major advantage as it identified samples where the parameterisation of μ and from known-age samples was complicated by factors such as surficial weathering coatings. Beyond this, it is possible that the MET-pIRIR protocol may be useful in identifying complex burial or exposure histories of rocks, similar to those that have been reported in previous studies but solely using the IR50 signal (e.g. Freiesleben et al., 2015; Brill et al., 2021). There is also potential to explore whether the different temperature IRSL signals of the MET protocol record different states of erosion (i.e. steady or transient states) within the same rock surface, whereby the post-IR IRSL signals that are attenuated greater would be more susceptible to transient states of erosion in comparison to the lower temperature signals, which measure luminescence depth profiles to greater depths within the rock surface.
The boulders from the Beinn Alligin rock avalanche have been subject to a temperate climate for the last ∼4 kyr. The luminescence depth profiles from the boulders demonstrated that on these timeframes and under these climatic conditions the technique was an erosion meter, rather than a chronometer, as expected (Sohbati et al., 2018; Lehmann et al., 2019a). Lehmann et al. (2019a) noted that two of their samples, uncorrected for erosion, gave apparent luminescence exposure ages of ca. 640 and <1 yr compared to apparent cosmogenic nuclide ages of ca. 16.5 and 6.5 kyr, respectively. It has thus been inferred that erosion rates >1 mm kyr−1 can make interpretation of luminescence depth profiles in terms of an exposure age difficult without accurately constraining the erosion rate (Sohbati et al., 2018; Lehmann et al., 2018). This is consistent with the underestimation of luminescence exposure ages measured here for the Beinn Alligin rock avalanche (Table 3), which have been independently dated to 4.54±0.27 ka using cosmogenic nuclides (Ballantyne and Stone, 2004). Consequently, luminescence depth profiles for the Beinn Alligin rock avalanche can only be inferred in terms of erosion rates.
6.2 Luminescence as an erosion meter
The numerical approach of Lehmann et al. (2019a) exploits the different sensitivities of the luminescence (short term) and cosmogenic nuclide (longer term) techniques to erosion to infer erosion histories (steady state and transient over time) for rock surfaces. Their modelling shows that the higher erosion rates (>100 mm kyr−1) can only be sustained over shorter time durations (up to decadal) while at the same time being consistent with cosmogenic nuclide measurements. For BALL03, transient erosion rates were derived using the IR50 (6–460 mm kyr−1), pIRIR150 (14–100 mm kyr−1) and pIRIR225 (11–180 mm kyr−1) signals. These modelled transient erosion rates were broadly comparable to erosion rates inferred from luminescence depth profiles over comparable timeframes in previous studies: (i) rates between and 1.72±0.04 mm kyr−1 for glacial boulders and landslides (granite gneiss, granodorite and quartzite) in the Eastern Pamirs, China (Sohbati et al., 2018), and (ii) between 3.5±1.2 and 4300±600 mm kyr−1 for glacially-modified, granitic bedrock in the French Alps (Lehmann et al., 2019b). This latter study modelled higher erosion rates (>100mm kyr−1) over timescales from 101 to 103 yr and lower erosion rates (<100 mm kyr−1) over longer timescales of 103 to 104 yr. However, this comparison between modelled erosion rates does not account for the primary role that lithology has on weathering (e.g. Twidale, 1982; Ford and Williams, 1989). The sampled boulders in our study were composed of Torridonian sandstone, which has been reported to undergo granular disintegration (e.g. Ballantyne and Whittington, 1987), particularly around edges, and thus may have experienced higher erosion rates than the crystalline rocks (e.g. gneiss, granite) used in the studies of Sohbati et al. (2018) and Lehmann et al. (2019b).
A major advantage of applying this new erosion meter technique to boulders of the Beinn Alligin rock avalanche was the existing constraints on Holocene erosion rates (∼3.3 to 12 mm kyr−1) for Torridonian sandstones in NW Scotland inferred from boulder edge roundness measurements (Kirkbride and Bell, 2010). The long-term erosion rates inferred from luminescence depth profiles were consistent with the estimates provided by measuring the boulder edge roundness when considering the differing approaches and assumptions of each method. Firstly, the sampling approach for the luminescence depth profiles targeted the flat-top surface of the boulders where granular disintegration would have been reduced relative to the boulder edges and corners. Thus, the boulder edge roundness-based erosion rates provided an upper constraint on the long-term erosion rate experienced by the boulders. Finally, the boulder edge roundness measurements assumed steady-state erosion and could not identify the potential for a transient state of erosion, whereas the approach of Lehmann et al. (2019a, b) inferred some transient state of erosion (Table 3). Consequently, it is notable that the lower range of the transient erosion rates derived here using the IR50 (6–460 mm kyr−1), pIRIR150 (14–100 mm kyr−1) and pIRIR225 (11–180 mm kyr−1) signals were broadly consistent with the steady-state erosion rate derived from boulder edge roundness measurements for the Torridonian sandstones (in the range of ca. 3.3 to 12.0 mm kyr−1). Lehmann et al. (2019b) noted that their modelled steady-state erosion rates were 1 to 2 orders of magnitude higher than suggested by a global compilation of bedrock surface erosion rates based on 10Be (Portenga and Bierman, 2011) and measurements of upstanding, resistant lithic components (ca. 0.2–5.0 mm kyr−1) in crystalline rock surfaces in Arctic Norway (André, 2002). The authors inferred that shorter-term erosion rates derived from luminescence measurements were higher than the longer-term averages due to the stochastic nature of weathering impacting upon shorter-term erosion rates, this is also suggested by the data presented here. These stochastic processes (i.e. varying over time) will be controlled by the in situ weathering rates, which provided the material for erosion. For bare rock surfaces in wet, temperate climates, weathering rates are primarily driven by rock type and moisture availability (i.e. precipitation) (Hall et al., 2012; Swantesson, 1992). The Torridonian sandstones are hard, cemented rocks (Stewart, 1984; Stewart and Donnellson, 1992) susceptible to granular disintegration (e.g. Ballantyne and Whittington, 1987), which may have been stochastic in nature due to changing moisture availability for chemical weathering over time (Hall et al., 2012; Swantesson, 1992). Although Torridonian sandstones are unlikely to be prone to frost shattering due to their low permeability and porosity (Lautridou, 1985; Hudec, 1973, in Hall et al., 2012), cracks, faults and joints in the rock may have facilitated stochastic physical weathering (Swantesson, 1992; Whalley et al., 1982), but little field evidence of this was preserved.
The modelled erosion histories that we have calculated here using the luminescence erosion meter for samples BALL02 and BALL03 would have had a minimal effect upon the cosmogenic nuclide exposure age (4.54±0.27 ka; Ballantyne and Stone, 2004). Only the steady-state erosion rate of 66 mm kyr−1 inferred for BALL02 using the IR50 signal, when applied for durations exceeding 1 kyr, would increase the exposure age to any great degree. For example, when the steady-state erosion rate of 66 mm kyr−1 was applied for 0.1 kyr, the corrected cosmogenic nuclide exposure age would have been 4.58 kyr, and when the same erosion rate was applied for 1 kyr it would have been 4.99 kyr; these corrected ages were consistent within ±2σ uncertainties of the uncorrected age of 4.54±0.27 ka (reported at 1σ: Ballantyne and Stone, 2004). The higher, transient erosion rates inferred for BALL03 were all applied for such a short period of time (e.g. Table 3) that they had a minimal effect on the cosmogenic nuclide exposure age.
Based on the long-term erosion rates derived here, the boulder sampled for BALL02 would have lost a total of 300 mm (IR50), 41 mm (pIRIR150) and 54 mm (pIRIR225) from the surface over 4.54 kyr, while the long-term erosion rates determined for BALL03 suggested that the boulder surface would have lost 27 mm (IR50), 64 mm (pIRIR150) and 50 mm (pIRIR225). All of these values (except for the IR50 signal of BALL02) were broadly consistent with field observations of quartz protrusions on the surface of boulders m that were densely distributed within the rock avalanche feature (Fig. 1). Alternatively, the maximum (shorter-term) erosion rate end members of the transient erosion histories would have removed 1407 mm (BALL02, pIRIR225), 2088 mm (BALL03, IR50), 454 mm (BALL03, pIRIR150) and 817 mm (BALL03, pIRIR225) from the boulder surface over 4.54 kyr. These large values were inconsistent with field evidence and are thus indicative of the transient state of erosion where high erosion rates were only sustained over short periods of time.
6.3 Late Holocene erosion history
The transient state of erosion inferred by the rock luminescence measurements reflected the stochastic nature of erosion over the last 4 kyr, where a lower time-averaged erosion rate was interrupted by discrete intervals of higher time-averaged erosion rates. Rock weathering would have been dependent upon a variety of factors, primarily rock type and climate (Merrill, 1906). The main constituents of the Torridonian sandstones are quartz, alkali and plagioclase feldspar (mostly albite), with precipitated quartz cementing the rock being resistant to chemical weathering (Stewart and Donnellan, 1992). However, the red colouring of the sandstones represents the presence of Fe within the rock (Stewart and Donnellsan, 1992), which is prone to chemical weathering via oxidation and reduction. Field evidence of quartz grain protrusions on the rock surfaces (Fig. 1) indicated that granular disintegration, rather than flaking or shattering, was the likely weathering process that produced material for erosion on these hard boulders (e.g. Swantesson, 1992). This is also supported by a lack of shattered material surrounding the large sampled boulders (and in fact on much of the Beinn Alligin rock avalanche deposit), despite the presence of dense, low-level vegetation surrounding the boulders (e.g. Fig. S6). Granular disintegration has been reported as being responsible for much of the general micro-weathering in the temperate climate of southern and central Sweden during the Holocene (e.g. Swantesson, 1992).
Given the coupling between precipitation, temperature and erosion (e.g. Reiners and Brandon, 2006 Portenga and Bierman, 2011), the stochastic processes producing transient erosion can relate to varying environmental conditions (Hall et al., 2012; Swantesson, 1992; Whalley et al., 1982). In an environment where moisture is abundant due to high precipitation rates (e.g. for NW Scotland, annual precipitation rates between 1981 and 2010 were ca. 2300 mm yr−1; Met Office, 2021), chemical weathering dominates; this is also reported for Holocene weathering processes in Sweden (Swantesson, 1989, 1992). Moisture availability, rather than temperature, is the limiting factor, as studies have reported the presence of chemical weathering in natural settings subject to sub-zero temperatures (e.g. northern Canada, Hall, 2007; Antarctica, Balke et al., 1991). Proxy evidence from across the British Isles records variability in temperature and precipitation rates over the last 4.5 kyr, where key increases in precipitation occurred at 2750, 1650 and 550 a BP correlated to Bond cycles (Charman, 2010). Thus, the transient erosion rates measured from boulders of the Beinn Alligin avalanche were potentially a representation of the fluctuations in moisture availability experienced over the last 4.5 kyr. Such processes can only be inferred from luminescence depth profiles as they are sensitive to changing erosion on shorter timeframes than all other techniques.
This study applies new rock luminescence techniques to a well-constrained test scenario provided by flat-topped boulders from the Beinn Alligin rock avalanche in NW Scotland (a wet, temperate climate) that are lithologically consistent (Torridonian sandstones), have known-age road cuts for parameterisation of μ and , have known cosmogenic nuclide exposure ages (4.54±0.27 ka), and have independently derived Holocene erosion rates (ca. 3.3 to 12.0 mm kyr−1). Applying the rock luminescence techniques for exposure dating underestimated the cosmogenic nuclide ages for the Beinn Alligin rock avalanche expected due to high erosion rates (as supported by field evidence of quartz grain protrusions on the rock surfaces). Alternatively, the erosion rates determined were consistent with expected rates that were independently measured in the field from boulder edge roundness when considering the relative timescales of the time-averaged erosion rates. The findings show that the luminescence erosion meter has the resolution and sensitivity required to detect transient erosion of boulders over the last 4.5 kyr. The transient erosion rates reflect the stochastic nature of erosional processes in the wet, temperate region of NW Scotland, likely in response to the known fluctuations in moisture availability (and to a lesser extent temperature), which control the extent of chemical weathering. This study demonstrates that the luminescence erosion meter has huge potential for inferring erosion rates on sub-millennial scales for both steady-state and transient states of erosion (i.e. stochastic processes), which is currently impossible with other techniques. Larger sample populations and careful sampling of rock surfaces (avoiding the potential for rock pools and trickle paths) will likely be key for accurate measurements of landscape-scale erosion, and the use of a MET-pIRIR protocol (50, 150 and 225 ∘C) is advantageous as it can identify samples suffering from complexities that would not have been observed using only the standard IRSL signal measured at 50 ∘C, such as that introduced by within-sample variability (e.g. surficial coatings).
The underlying software code used in this study is provided by Lehmann et al. (2019a).
The underlying research data are provided in the Supplement.
The supplement related to this article is available online at: https://doi.org/10.5194/gchron-3-525-2021-supplement.
RKS, DS and RSJ were involved in project conception. RKS, DS, RSJ and SB performed the field sampling. RS, DS, JB and GTHJ performed the measurements, analysis and interpretations. All authors contributed to the writing of the manuscript, including the preparation of figures.
The authors declare that they have no conflict of interest.
Publisher’s note: Copernicus Publications remains neutral with regard to jurisdictional claims in published maps and institutional affiliations.
Field and laboratory work was funded by Durham University Department of Geography Research Development Fund to David Small. The rock luminescence equipment in the Liverpool Luminescence Laboratory was funded by a Royal Society Research Grant (RG170194) to Rachel K. Smedley. David Small is supported by a NERC Independent Research Fellowship NE/T011963/1. We thank Benjamin Lehmann, an anonymous reviewer and the associate editor Jim Feathers for their constructive comments that improved this paper.
The rock luminescence equipment in the Liverpool Luminescence Laboratory was funded by a Royal Society Research Grant (RG170194) to Rachel K. Smedley. David Small is supported by a NERC Independent Research Fellowship NE/T011963/1.
This paper was edited by James Feathers and reviewed by Benjamin Lehmann and one anonymous referee.
Aitken, M. J.: Thermoluminescence dating: Past progress and future trends, Nucl. Tracks Rad. Meas., 10, 3–6, 1985.
André, M.-F.: Rates of postglacial rock weathering of granite roches moutonnées in northern Scandinavia (Abisko-Riksgrånsen area, 68∘ N), Geogr. Ann., 64A, 139–150, 2002.
Balco, G., Stone, J. O., Lifton, N. A., and Dunai, T.: A complete and easily accessible means of calculating surface exposure ages or erosion rates from 10Be and 26Al measurements, Quat. Geochronol., 3, 174–195, 2008.
Balescu, S. and Lamothe, M.: Thermoluminescence dating of the Holsteinian marine formation of Herzeele, northern France, J. Quaternary Sci., 8, 117–124, 1993.
Balke, J., Haendel, D., and Krüger, W.: Contribution to the weathering-controlled removal of chemical elements from the active debris layer of the Schirmacher Oasis, East Antarctica, Z. Geol. Wissenschaft., 19, 153–158, 1991.
Ballantyne, C. K.: The Beinn Alligin “rock glacier”, in: Wester Ross Field Guide, edited by: Ballantyne, C. K. and Sutherland, D. G., Quaternary Research Association, Cambridge, 134–137, 1987.
Ballantyne, C. K.: A Scottish sturzstrom: The Beinn Alligin rock avalanche, Wester Ross, Scot. Geogr. J., 119, 159–167, 2003.
Ballantyne, C. K. and Whittington, G.: Niveo-aeolian sand deposits on An Teallach, Wester Ross, Scotland, Earth and Environmental Science Transactions of The Royal Society of Edinburgh, 78, 51–63, 1987.
Ballantyne, C. K. and Stone, J. O.: The Beinn Alligin rock avalanche, NW Scotland: cosmogenic 10Be dating, interpretation and significance, The Holocene, 14, 448–453, 2004.
Bell, W. T.: Alpha dose attenuation in quartz grains for thermoluminescence dating, Ancient TL, 12, 4–8, 1980.
Braun, J.: Recent advances and current problems in modelling surface processes and their interaction with crustal deformation, Geological Society, London, Special Publications, 253, 307, https://doi.org/10.1144/GSL.SP.2006.253.01.16, 2006.
Brill, D., May, S. M., Mhammdi, N., King, G., Lehmann, B., Burow, C., Wolf, D., Zander, A., and Brückner, H.: Evaluating optically stimulated luminescence rock surface exposure dating as a novel approach for reconstructing coastal boulder movement on decadal to centennial timescales, Earth Surf. Dynam., 9, 205–234, https://doi.org/10.5194/esurf-9-205-2021, 2021.
Brown, N. D.: Which geomorphic processes can be informed by luminescence measurements, Geomorphology, 367, 107296, https://doi.org/10.1016/j.geomorph.2020.107296, 2020.
Brown, N. D. and Moon, S.: Revisiting erosion rate estimates from luminescence profiles in exposed bedrock surfaces using stochastic erosion simulations, Earth Planet. Sc. Lett., 528, 115842, https://doi.org/10.1016/j.epsl.2019.115842, 2019.
Chapot, M. S., Sohbati, R., Murray, A. S., Pederson, J. L., and Rittenour, T. M.: Constraining the age of rock art by dating a rockfall event using sediment and rock-surface luminescence dating techniques, Quat. Geochronol., 13, 18–25, 2012.
Charman, D.: Centennial climate variability in the British Isles during the mid–late Holocene, Quaternary Sci. Rev., 29, 1539–1554, 2010.
Durcan, J. A., King, G. E., and Duller, G. A. T.: DRAC: Dose Rate and Age Calculator for trapped charge dating, Quat. Geochronol., 28, 54–61, 2015.
Esri: World Imagery, basemap, ArcGIS, available at: https://services.arcgisonline.com/ArcGIS/rest/services/World_Imagery/MapServer (last access: 11 February 2021), 2009.
Esri: World Topographic Map, basemap, ArcGIS, available at: https://www.arcgis.com/home/item.html?id=30e5fe3149c34df1ba922e6f5bbf808f (last access: 11 February 2021), 2013.
Ford, D. and Williams, P.: Karst Geomorphology and Hydrology, Unwin Hyman, London, 601 pp., 1989.
Freiesleben, T., Sohbati, R. Murray, A., Jain, M., al Khasawneh, S., Hvidt, S., and Jakobsen, B.: Mathematical model quantifies multiple daylight exposure and burial events for rock surfaces using luminescence dating, Radiat. Meas., 81, 16–22, 2015.
Gliganic, L. A., Meyer, M. C., Sohbati, R., Jain, M., and Barrett, S.: OSL surface exposure dating of a lithic quarry in Tibet: Laboratory validation and application, Quat. Geochronol., 49, 199–204, 2019.
Gordon, J. E.: Beinn Alligin, in: Quaternary of Scotland, edited by: Gordon, J. E. and Sutherland, D. G., Chapman and Hall, London, 118–122, 1993.
Guerin, G., Mercier, N., and Adamiec, G.: Dose-rate conversion factors: update, Ancient TL, 29, 5–8, 2011.
Guérin, G., Mercier, N., Nathan, R., Adamiec, G., and Lefrais, Y.: On the use of the infinite matrix assumption and associated concepts: A critical review, Radiat. Meas., 47, 778–785, 2012.
Habermann, J., Schilles, T., Kalchgruber, R., and Wagner, G. A.: Steps towards surface dating using luminescence, Radiat. Meas., 32, 847–851, 2000.
Hall, K.: Evidence for freeze-thaw events and their implications for rock weathering in northern Canada, II: the temperature at which water freezes in rock, Earth Surf. Proc. Land., 32, 249–259, 2007.
Hall, K., Arocena, J. M., Boelhouwers, J., and Zhu, L.: The influence of aspect on the biological weathering of granites: observations from the Kunlun Mountains, China, Geomorphology, 67, 171–188, 2005.
Hall, K., Guglielmin, M., and Strini, A.: Weathering of granite in Antarctica II: thermal data at the grain scale, Earth Surf. Proc. Land., 33, 475–493, 2008.
Hall, K., Thorn, C., and Sumner, P.: On the persistence of “weathering”, Geomorphology, 149–150, 1–10, 2012.
Hanna, F. K.: A technique for measuring the rate of erosion of cave passages, Proceedings University of Bristol Spelaeology Society, 11, 83–86, 1966.
Herman, F., Rhodes, E. J., Braun, J., and Heiniger, L.: Uniform erosion rates and relief amplitude during glacial cycles in the Southern Alps of New Zealand, as revealed from OSL-thermochronology, Earth Planet. Sc. Lett., 297, 183–189, 2010.
High, C. J. and Hanna, F. K.: A method for the direct measurement of erosion on rock surfaces. British Geomorphological Research Group Technical Bulletin, 5, 1–25, 1970.
Hijmans, R. J.: raster: Geographic Data Analysis and Modeling, R package version 2.9-23, available at: https://CRAN.R-project.org/package=raster (last access: 1 December 2020), 2019.
Hudec, P. P.: Weathering of rocks in arctic and subarctic environments, in: Proceedings of the Symposium on the Canadian Arctic, edited by: Aitken, J. D. and Glass, D. J., University of Waterloo, Waterloo, Ontario, 313–335, 1973.
Huntley, D. J. and Lamothe, M.: Ubiquity of anomalous fading in K-feldspars and the measurement and correction for it in optical dating, Can. J. Earth Sci., 38, 1093–1106, 2001.
Israeli, Y. and Emmanuel, S.: Impact of grain size and rock composition on simulated rock weathering, Earth Surf. Dynam., 6, 319–327, https://doi.org/10.5194/esurf-6-319-2018, 2018.
Jenkins, G. T. H., Duller, G. A. T., Roberts, H. M., Chiverrell, R. C., and Glasser, N. F.: A new approach for luminescence dating glaciofluvial deposits – High precision optical dating of cobbles, Quaternary Sci. Rev., 192, 263–273, 2018.
Kirkbride, M. P. and Bell, C. M.: Edge-roundness of boulders of Torridonian Sandstone (northwest Scotland): applications for relative dating and implications for warm and cold climate weathering rates, Boreas, https://doi.org/10.1111/j.1502-3885.2009.00131, 2010.
Kolb, T. and Fuchs, M.: Luminescence dating of pre-Eemian (pre-MIS 5e) fluvial terraces in Northern Bavaria (Germany) – Benefits and limitations of applying a pIRIR225-approach, Geomorphology, 321, 16–32, 2018.
Lal, D.: Cosmic ray labeling of erosion surfaces: in situ nuclide production rates and erosion models, Earth Planet. Sc. Lett., 104, 424–439, 1991.
Laskaris, N. and Liritzis, I.: A new mathematical approximation of sunlight penetrations in rocks for surface luminescence dating, J. Lumin., 131, 1874–1884, 2011.
Lautridou, J.-P.: Le cycle periglaciaire Pleistocene en Europe du nordouest et plus particulierement en Normandie. Thesis, Caen Univ. Centre de Geomorphologie edit, 908 pp., 1985.
Lehmann, B., Valla, P. G., King, G. E., and Herman, F.: Investigation of OSL surface exposure dating to reconstruct post-LIA glacier fluctuations in the French Alps (Mer de Glace, Mont Blanc massif), Quat. Geochronol., 44, 63–74, 2018.
Lehmann, B., Herman, F., Valla, P. G., King, G. E., and Biswas, R. H.: Evaluating post-glacial bedrock erosion and surface exposure duration by coupling in situ optically stimulated luminescence and 10Be dating, Earth Surf. Dynam., 7, 633–662, https://doi.org/10.5194/esurf-7-633-2019, 2019a.
Lehmann, B., Herman, F., Valla, P. G., King, G. E., Biswas, R. H., Ivy-Ochs, S., Steinemann, O., and Christl, M.: Postglacial erosion of bedrock surfaces and deglaciation timing: New insights from the Mont Blanc massif (western Alps), Geology, 48, 139–144, https://doi.org/10.1130/G46585.1, 2019b.
Li, B. and Li, S.-H.: Luminescence dating of K-feldspar from sediments: A protocol without anomalous fading correction, Quat. Geochronol., 6, 468–479, 2011.
Liu, J., Murray, A., Sohbati, R., and Jain, M.: The effect of test dose and first IR Stimulation temperature on post-IR IRSL measurements of rock slices, Geochronometria, 43, 179–187, 2016.
Luo, M., Chen, J., Liu, J., Qin, J., Owen, L., Han, F., Yang, H. Wang, H., Zhang, B., Yin, J., and Li, Y.: A test of rock surface luminescence dating using glaciofluvial boulders from the Chinese Pamir, Radiat. Meas., 120, 290–297, 2018.
Merrill, G. P.: A Treatise on Rocks. Rock-Weathering and Soils, Macmillan, New York, 400 pp., 1906.
Met Office: UK Climate averages (1981–2010): Kinlochewe Met station (57.613∘ N, −5.308∘ W), available at: https://www.metoffice.gov.uk/research/climate/maps-and-data/uk-climate-averages/gfhpz0nu4, last access: 18 January 2021.
Meyer, M. C., Gliganic, L. A., Jain, M., and Schmidmair, D.: Lithological controls on light penetration into rock surfaces – Implications for OSL and IRSL surface exposure dating, Radiat. Meas., 120, 298–304, 2018.
Ou, X. J., Roberts, H. M., Duller, G. A. T., Gunn, M. D., and Perkins, W. T.: Attenuation of light in different rock types and implications for rock surface luminescence dating, Radiat. Meas., 120, 305–311, 2018.
Parish, R.: The influence of feldspar weathering on luminescence signals and the implications for luminescence dating of sediments, in: Rock weathering and landform evolution, edited by: Robinson, D. A. and Williams, R. B. G., Wiley, Chichester, 1994.
Pederson, J. L., Chapot, M. S., Simms, S. R., Sohbati, R., Rittenour, T. M., Murray, A. S., and Cox, G.: Age of Barrier Canyon-style rock art constrained by cross-cutting relations and luminescence dating techniques, P. Natl. Acad. Sci. USA, 111, 12986–12991, 2014.
Polikreti, K., Michael, C. T., and Maniatis, Y.: Authenticating marble sculpture with thermoluminescence, Ancient TL, 20, 11–18, 2002.
Polikreti, K., Michael, C. T., and Maniatis, Y.: Thermoluminescence characteristics of marble and dating of freshly excavated marble objects, Radiat. Meas., 37, 87–94, 2003.
Portenga, E. W. and Bierman, P. R.: Understanding Earth's eroding surface with 10Be, GSA Today, 21, 4–10, 2011.
Prescott, J. R. and Hutton, J. T.: Cosmic ray and gamma ray dosimetry for TL and ESR, Nucl. Tracks Rad. Meas., 14, 223–227, 1994.
Reiners, P. W. and Brandon, M. T.: Using thermochronology to understand orogenic erosion, Annu. Rev. Earth Pl. Sc., 34, 419–466, https://doi.org/10.1146/annurev.earth.34.031405.125202, 2006.
Roberts, H. M.: Testing Post-IR IRSL protocols for minimising fading in feldspars, using Alaskan loess with independent chronological control, Radiat. Meas., 47, 716–724, 2012.
Robinson, D. A. and Williams, R. B. G.: Surface crusting of sandstones in southern England and northern France, in: International Geomorphology 1986, edited by: Gardner, V., Wiley, Chichester, 2, 623–635, 1987.
Singhvi, A. K., Deraniyagala, S. U., and Sengupta, D.: Thermoluminescence dating of Quaternary red-sand beds: a case study of coastal dunes in Sri Lanka, Earth Planet. Sc. Lett., 80, 139–144, 1986.
Sissons, J. B.: A fossil rock glacier in Wester Ross, Scot. J. Geol., 11, 83–86, 1975.
Sissons, J. B.: A fossil rock glacier in Wester Ross. Reply to W.B. Whalley, Scot. J. Geol., 12, 178–79, 1976.
Smedley, R. K. and Pearce, N. J. G.: Internal U and Th concentrations of K-feldspar grains: implications for luminescence dating, Quatern. Geochronol., 35, 16–25, 2016.
Smedley, R. K., Duller, G. A. T., Pearce, N. J. G., and Roberts, H. M.: Determining the K-content of single grains of K-feldspar for luminescence dating, Radiat. Meas., 47, 790–796, 2012.
Smedley, R. K., Duller, G. A. T., and Roberts, H. M.: Assessing the bleaching potential of the post-IR IRSL signal for individual K-feldspar grains: implications for single-grain dating, Radiat. Meas., 79, 33–42, 2015.
Smedley, R. K., Glasser, N. F., and Duller, G. A. T.: Luminescence dating of glacial advances at Lago Buenos Aires (∼46∘ S), Patagonia, Quaternary Sci. Rev., 134, 59–73, 2016.
Sohbati, R., Murray, A. S., Jain, M., Buylaert, J. P., and Thomsen, K. J.: Investigating the resetting of OSL signals in rock surfaces, Geochronometria, 38, 249–258, 2011.
Sohbati, R., Murray, A. S., Buylaert, J. P., Almeida, N. A. C., and Cunha, P. P.: Optically stimulated luminescence (OSL) dating of quartzite cobbles from the Tapada do Montinho archaeological site (east-central Portugal), Boreas, 41, 452–462, 2012a.
Sohbati, R., Murray, A. S., Chapot, M. S., Jain, M., and Pederson, J.: Optically stimulated luminescence (OSL) as a chronometer for surface exposure dating, J. Geophys. Res., 117, B09202, https://doi.org/10.1029/2012JB009383, 2012b.
Sohbati, R., Liu, J., Jain, M., Murray, A. S., Egholm, D., Pairs, R., and Guralnick, B.: Centennial- to millennial-scale hard rock erosion rates deduced from luminescence-depth profiles, Earth Planet. Sc. Lett., 493, 218–230, 2018.
Stewart, A. D.: Late Proterozoic rifting in NW Scotland: the genesis of the “Torridonian”, Journal of Geological Society of London, 139, 413–420, 1982.
Stewart, A. D. and Donnellson, N. C. B.: Geochemistry and provenance of red sandstones in the Upper Proterozoic Torridon Group in Scotland, Scot. J. Geol., 28, 143–153, 1992.
Stocker, T. F., Qin, D., Plattner, G.-K., Alexander, L. V., Allen, S. K., Bindoff, N. L., Bréon, F.-M., Church, J. A., Cubasch, U., Emori, S., Forster, P., Friedlingstein, P., Gillett, N., Gregory, J. M., Hartmann, D. L., Jansen, E., Kirtman, B., Knutti, R., Krishna Kumar, K., Lemke, P., Marotzke, J., Masson-Delmotte, V., Meehl, G. A., Mokhov, I. I., Piao, S., Ramaswamy, V., Randall, D., Rhein, M., Rojas, M., Sabine, C., Shindell, D., Talley, L. D., Vaughan, D. G., and Xie, S.-P.: Technical Summary, in: Climate Change 2013: The Physical Science Basis. Contribution of Working Group I to the Fifth Assessment Report of the Intergovernmental Panel on Climate Change, edited by: Stocker, T. F., Qin, D., Plattner, G.-K., Tignor, M., Allen, S. K., Boschung, J., Nauels, A., Xia, Y., Bex, V., and Midgley, P. M., Cambridge University Press, Cambridge, United Kingdom and New York, NY, USA, 2013.
Swantesson, J. O. H.: Weathering phenomena in a cool temperate climate, Göteborgs University, Naturgeogr. Inst., Guni. Rapport, Vol. 28, 1989.
Swantesson, J. O. H.: Recent microweathering phenomena in Southern and Central Sweden, Permafrost Periglac., 3, 275–292, 1992.
Swantesson, J. O. H., Moses, C. A., Berg, G. E., and Jansson, K. M.: Methods for measuring shore platform micro-erosion: a comparison of the micro-erosion meter and laser scanner, Z. Geomorpholology, 144, 1–17, 2006.
Thomsen, K. J., Murray, A. S., Jain, M., and Bøtter-Jensen, L.: Laboratory fading rates of various luminescence signals from feldspar-rich sediment extracts, Radiat. Meas., 43, 1474–1486, 2008.
Thomsen, K. J., Murray, A. S., and Jain, M.: Stability of IRSL signals from sedimentary K-feldspar samples, Geochronometria, 38, 1–13, 2011.
Thomsen, K. J., Kook, M., Murray, A. S., and Jain, M.: Resolving luminescence in spatial and compositional domains, Radiat. Meas., 15, 260–266, 2018.
Thorn, C. E., Darmody, R. G., Dixon, J. C., and Schlyter, P.: The chemical weathering regime of Kärkevagge, arctic-alpine Sweden, Geomorphology, 41, 37–52, 2001.
Trauerstein, M., Lowick, S. E., Preusser, F., and Schlunegger, F.: Small aliquot and single grain IRSL and post-IR IRSL dating of fluvial and alluvial sediments from the Pativilca valley, Peru, Quat. Geochronol., 22, 163–174, 2014.
Trudgill, S. T., Viles, H., Inkpen, R. J., and Cooke, R. U.: Remeasurement of weathering rates, St. Paul's Cathedral, London, Earth Surf. Proc. Land., 14, 175–196, 1989.
Twidale, C. R.: Granite Landforms, Elsevier, Amsterdam, 372 pp., 1982.
Vafiadou, A., Murray, A. S., and Liritzis, I.: Optically stimulated luminescence (OSL) dating investigations of rock and underlying soil from three case studies, J. Archaeol. Sci., 34, 1659–1669, 2007.
Whalley, W. B., Douglas, G. R., and McGreevy, J. P.: Crack propagation and associated weathering in igneous rocks, Z. Geomorphologie, 26, 33–54, 1982.