the Creative Commons Attribution 4.0 License.
the Creative Commons Attribution 4.0 License.
 | 14 Apr 2022
Technical note: Quantifying uranium-series disequilibrium in natural samples for dosimetric dating – Part 1: gamma spectrometry
Paul J. Nolan
Sumia Abdualhadi
Peter G. Appleby
Dosimetric dating techniques rely on accurate and precise determination of environmental radioactivity. Gamma spectrometry is the method of choice for determining the activity of 238U, 232Th, and 40K. With the aim to standardize gamma-spectrometric procedures for the purpose of determining accurate parent nuclide activities in natural samples, we outline the basics of gamma spectrometry and practical laboratory procedures here. This includes gamma radiation and instrumentation, sample preparation, finding the suitable measurement geometry and sample size for a given detector, and using the most suitable energy peaks in a gamma spectrum. The issue of correct efficiency calibration is highlighted. The procedures outlined are required for estimating contemporary parent nuclide activity. For estimating changing activities during burial specific data analyses are required, and these are also highlighted.
-
Please read the editorial note first before accessing the article.
-
Article
(4918 KB)
-
Please read the editorial note first before accessing the article.
- Article
(4918 KB) - Full-text XML
- BibTeX
- EndNote


Dosimetric dating is a method for determining the age of objects from the absorbed dose to their constituent crystals caused by exposure to radiation, typically from natural radionuclides such as uranium, thorium, and 40K present in most soils and sediments. It is of critical importance to the dating technique that the quantity of the radiation dose is estimated accurately, and this is usually the case when its rate is constant. Because of radioactive decay the dose rate will in many situations vary over time, and the most important source for this variation is the 238U-series radionuclides, in particular the short-lived daughters of the intermediate radionuclide 226Ra. Resolution of any initial disequilibrium between 226Ra and its parents will normally take place on millennial timescales and therefore result in significant changes to the dose rate over time. The simplest and most straightforward method for determining activities of 226Ra, its parents, and its short-lived daughters is gamma spectrometry (e.g. Murray and Aitken, 1988). Although the initial set-up can be quite demanding, because of its operational simplicity this is increasingly the method of choice (e.g. Murray et al., 2015), particularly where there is evidence of radiometric disequilibrium.

Figure 1Typical gamma spectra of a natural sample showing the numbers of counts (photon interactions) per channel at energies ranging from (a) 20 to 2000 keV and (b) 20 to 100 keV. The dispersion is two channels per keV. Peaks in the spectrum identify emissions from specific radionuclides.
Despite operational simplicity, the interlaboratory comparison (Murray et al., 2015) reveals discrepancies between laboratories that are of great concern. While the exact reasons are unknown, we suspect that problems arise from data analysis, peak interference and self-absorption, and the use of suitable reference material (e.g. Murray et al., 2018) for efficiency calibration. We address these problems in the first part of our paper wherein we outline the basic principles of gamma spectrometry for estimating contemporary dose rates. We show how the degree of isotopic fractionation can be quantified using the approach published in Abdualhadi et al. (2018). For estimating the historical dose rate the radioactive decay equations (the Bateman equations) for the intervening period must be solved (e.g. Degering and Degering, 2020). Analytical solutions of these equations, as well as software procedures for calculating historical dose rates, will be the subject of the second part of our paper.
Ionizing radiation from atoms undergoing radioactive decay includes both subatomic particles (alpha rays, beta rays) and electromagnetic waves from the higher end of the energy spectrum (gamma rays, X-rays). Gamma rays are emitted when the decay product undergoes de-excitation from a higher energy level to a lower one or to the ground state and are characterized by photon energies in the range 20 keV to 3 MeV. Most of the radionuclides relevant for dosimetric dating emit gamma rays of energies <1 MeV. Gamma rays can penetrate material objects typically to a depth of several centimetres depending on the photon energy and characteristics of the material (in particular its attenuation coefficient), though with an intensity that attenuates exponentially with distance. For example, the intensity of a 1 MeV photon penetrating SiO2 is reduced to 50 % at a penetration depth of 4.7 cm; the intensity is reduced to 63 % at 6.8 cm. Values of the attenuation coefficients at other photon energies or for other materials or mixtures can be found in the literature or from online databases (for details see Appendix A).
Although gamma rays make only a small contribution to the radiation dose compared to alpha and beta particles, they play an important role in determining the source and strength of the dose. In contrast to beta particles, gamma photon energies are discrete and specific to particular nuclides. This allows determination of gamma-emitting radionuclides contained within a source from peaks in a gamma-ray energy spectrum (Fig. 1) obtained from that source.
Gamma-ray emissions from environmental samples are readily analysed using semiconductor gamma detectors. Electrons displaced by photons traversing the crystal at the heart of the detector are gathered using an applied high voltage and the total charge collected related to the photon energy. These devices are most commonly constructed using crystals made of high-purity germanium (HPGe). Nearly perfect single crystals of Ge can be produced in a range of different sizes and configurations suitable for analysing environmental samples (for details see Gilmore, 2008). Ge detectors are operated at low temperature to reduce the background current, i.e. charge carriers that are generated due to the relatively low band gap (0.7 eV) of germanium. The typical installation of an HPGe detector includes the detector and preamplifier within the cryostat housing and the nitrogen dewar (Fig. 2A), the shield surrounding the cryostat (Fig. 2B), the amplifier, and the multichannel analyser; the latter two are currently being increasingly replaced by a digital system. The energy range is typically 10–2600 keV.
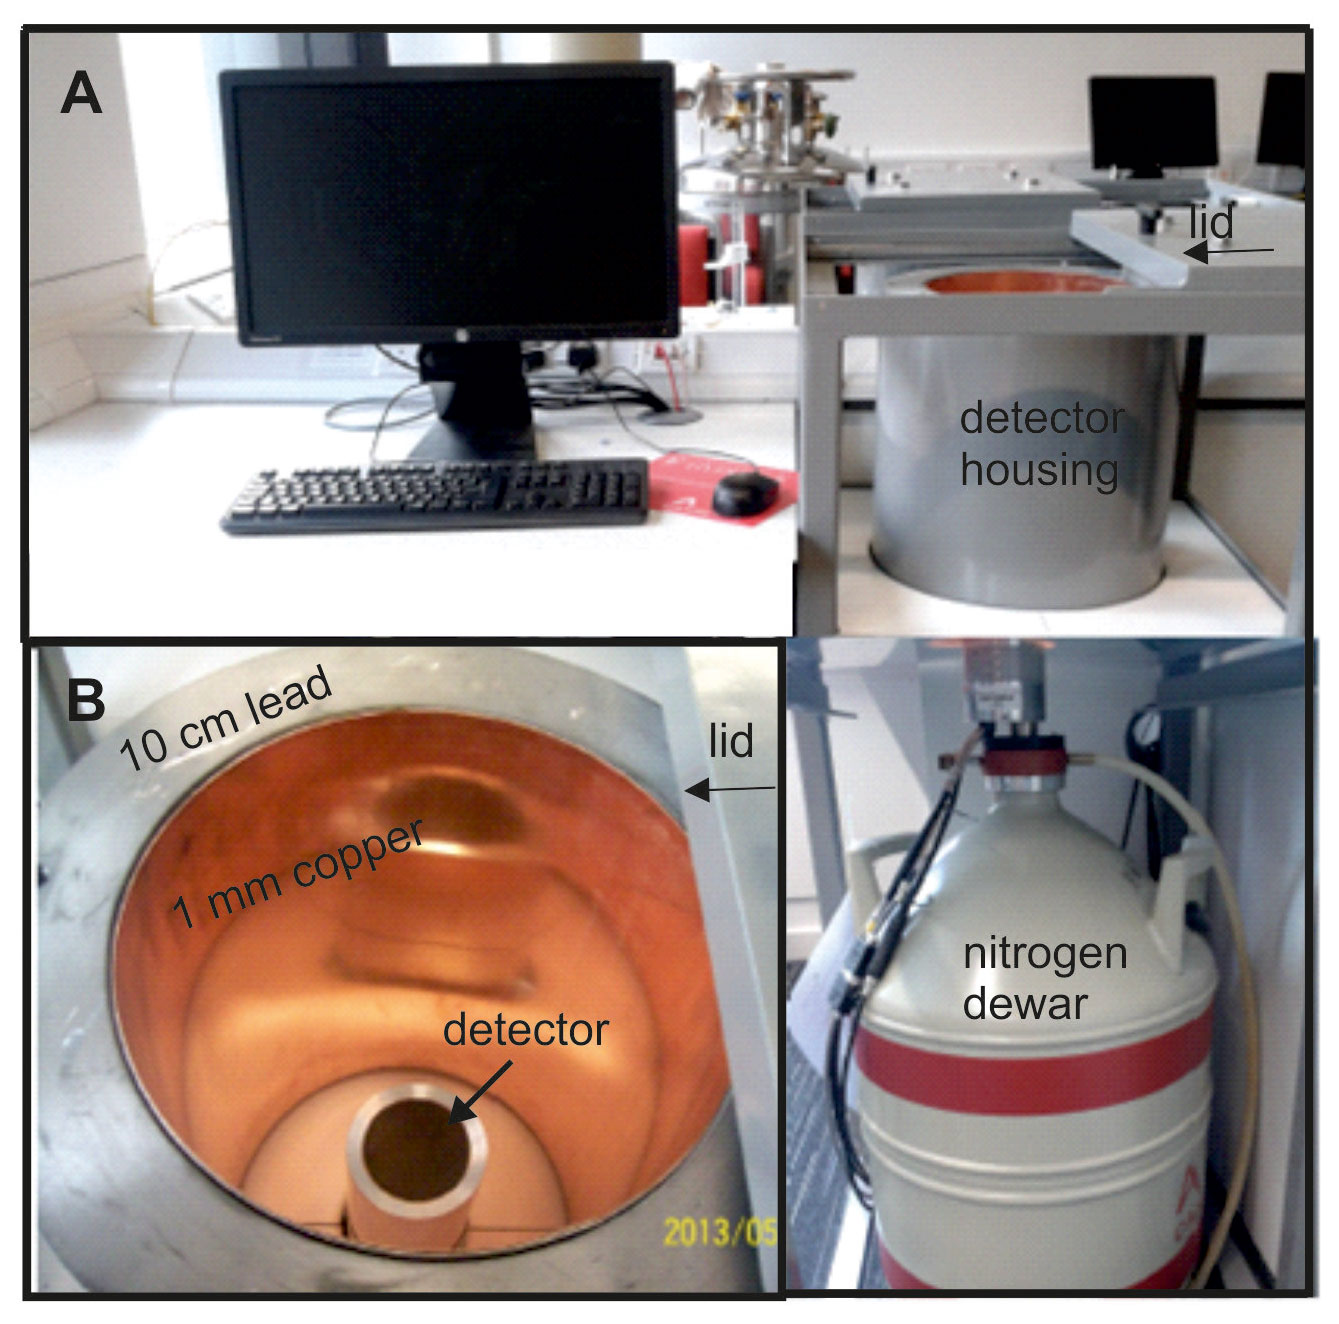
Figure 2Typical configuration of a gamma spectrometer with (a) detector housing, nitrogen dewar, and PC. (b) View in the detector housing; the shield is composed of 10 cm low-activity lead, 1 mm tin (not visible), and 1 mm copper. Amplifier and preamplifier not shown (adopted from Abdualhadi, 2016).
Table 1 compares detector specifications. The BEGe (broad-energy germanium) detector has a short length and a different electrode geometry compared to the n- and p-type coaxial detectors. It ensures good charge collection and excellent low-energy resolution. On all detectors types, samples are placed close to the end cap to ensure good interception of gamma emissions from the sample. At low energy (<200 keV; Abdualhadi et al., 2018) they have a similar efficiency for the same detector diameter, though the better energy resolution of the BEGe detector allows a more precise determination of the peak areas than the coaxial detector. This is important when the low-energy gamma rays are a vital part of the analysis. At higher energies the coaxial detector has a significantly better efficiency due to its longer length. The BEGe detector, on the other hand, typically has a lower Compton background in the spectrum as there is less material to scatter high-energy gamma rays such as 1461 keV from 40K and 2614 keV from the thorium decay series.
Table 1Properties of commonly used Ge detectors in terms of diameter, length, and peak resolution. FWHM: full width half-maximum of energy peak. The efficiency is relative to a sodium–iodide (3×3 in.) detector taken at 25 cm.

3.1 Interaction between detector and sample
There are interactions occurring between the detector and the sample's gamma rays that are independent of detector configuration and measurement geometry but disturb the recording of the sample's activity. These interactions occur across the energy range of interest with variable significance depending on the average atomic number (Z) of a given sample. In the low-energy region a photon may be absorbed, and its energy ejects an electron from its host atom (photoelectric effect). In the intervening energy region the incoming photon is scattered by an electron, resulting in a decrease in the photon's energy (Compton scattering). Photons with energies of 1022 keV can cause the formation of an electron and a positron (pair production).
3.2 Full-energy peak efficiency
Gamma photons entering the detector crystal may be fully absorbed, partially absorbed, or escape interaction altogether. Only those photons that are fully absorbed will contribute to the relevant photopeak. Full-energy peak efficiency is defined as the ratio of the number of counts detected in a peak to the number emitted by the source. Its value for any given photon energy will depend on the properties of the detector and the configuration of the sample. Figure 3 shows plots of efficiency versus photon energy for two of the detectors listed in Table 1. These were determined using standard sources of known activity. While both detectors have similar efficiency at low energy, the coaxial detector has a significantly higher efficiency as the gamma-ray energy increases due to its longer length. In both detectors, the practical efficiency at low gamma-ray energies can be reduced by other effects such as self-absorption of photons within the sample (see Sect. 6.2).
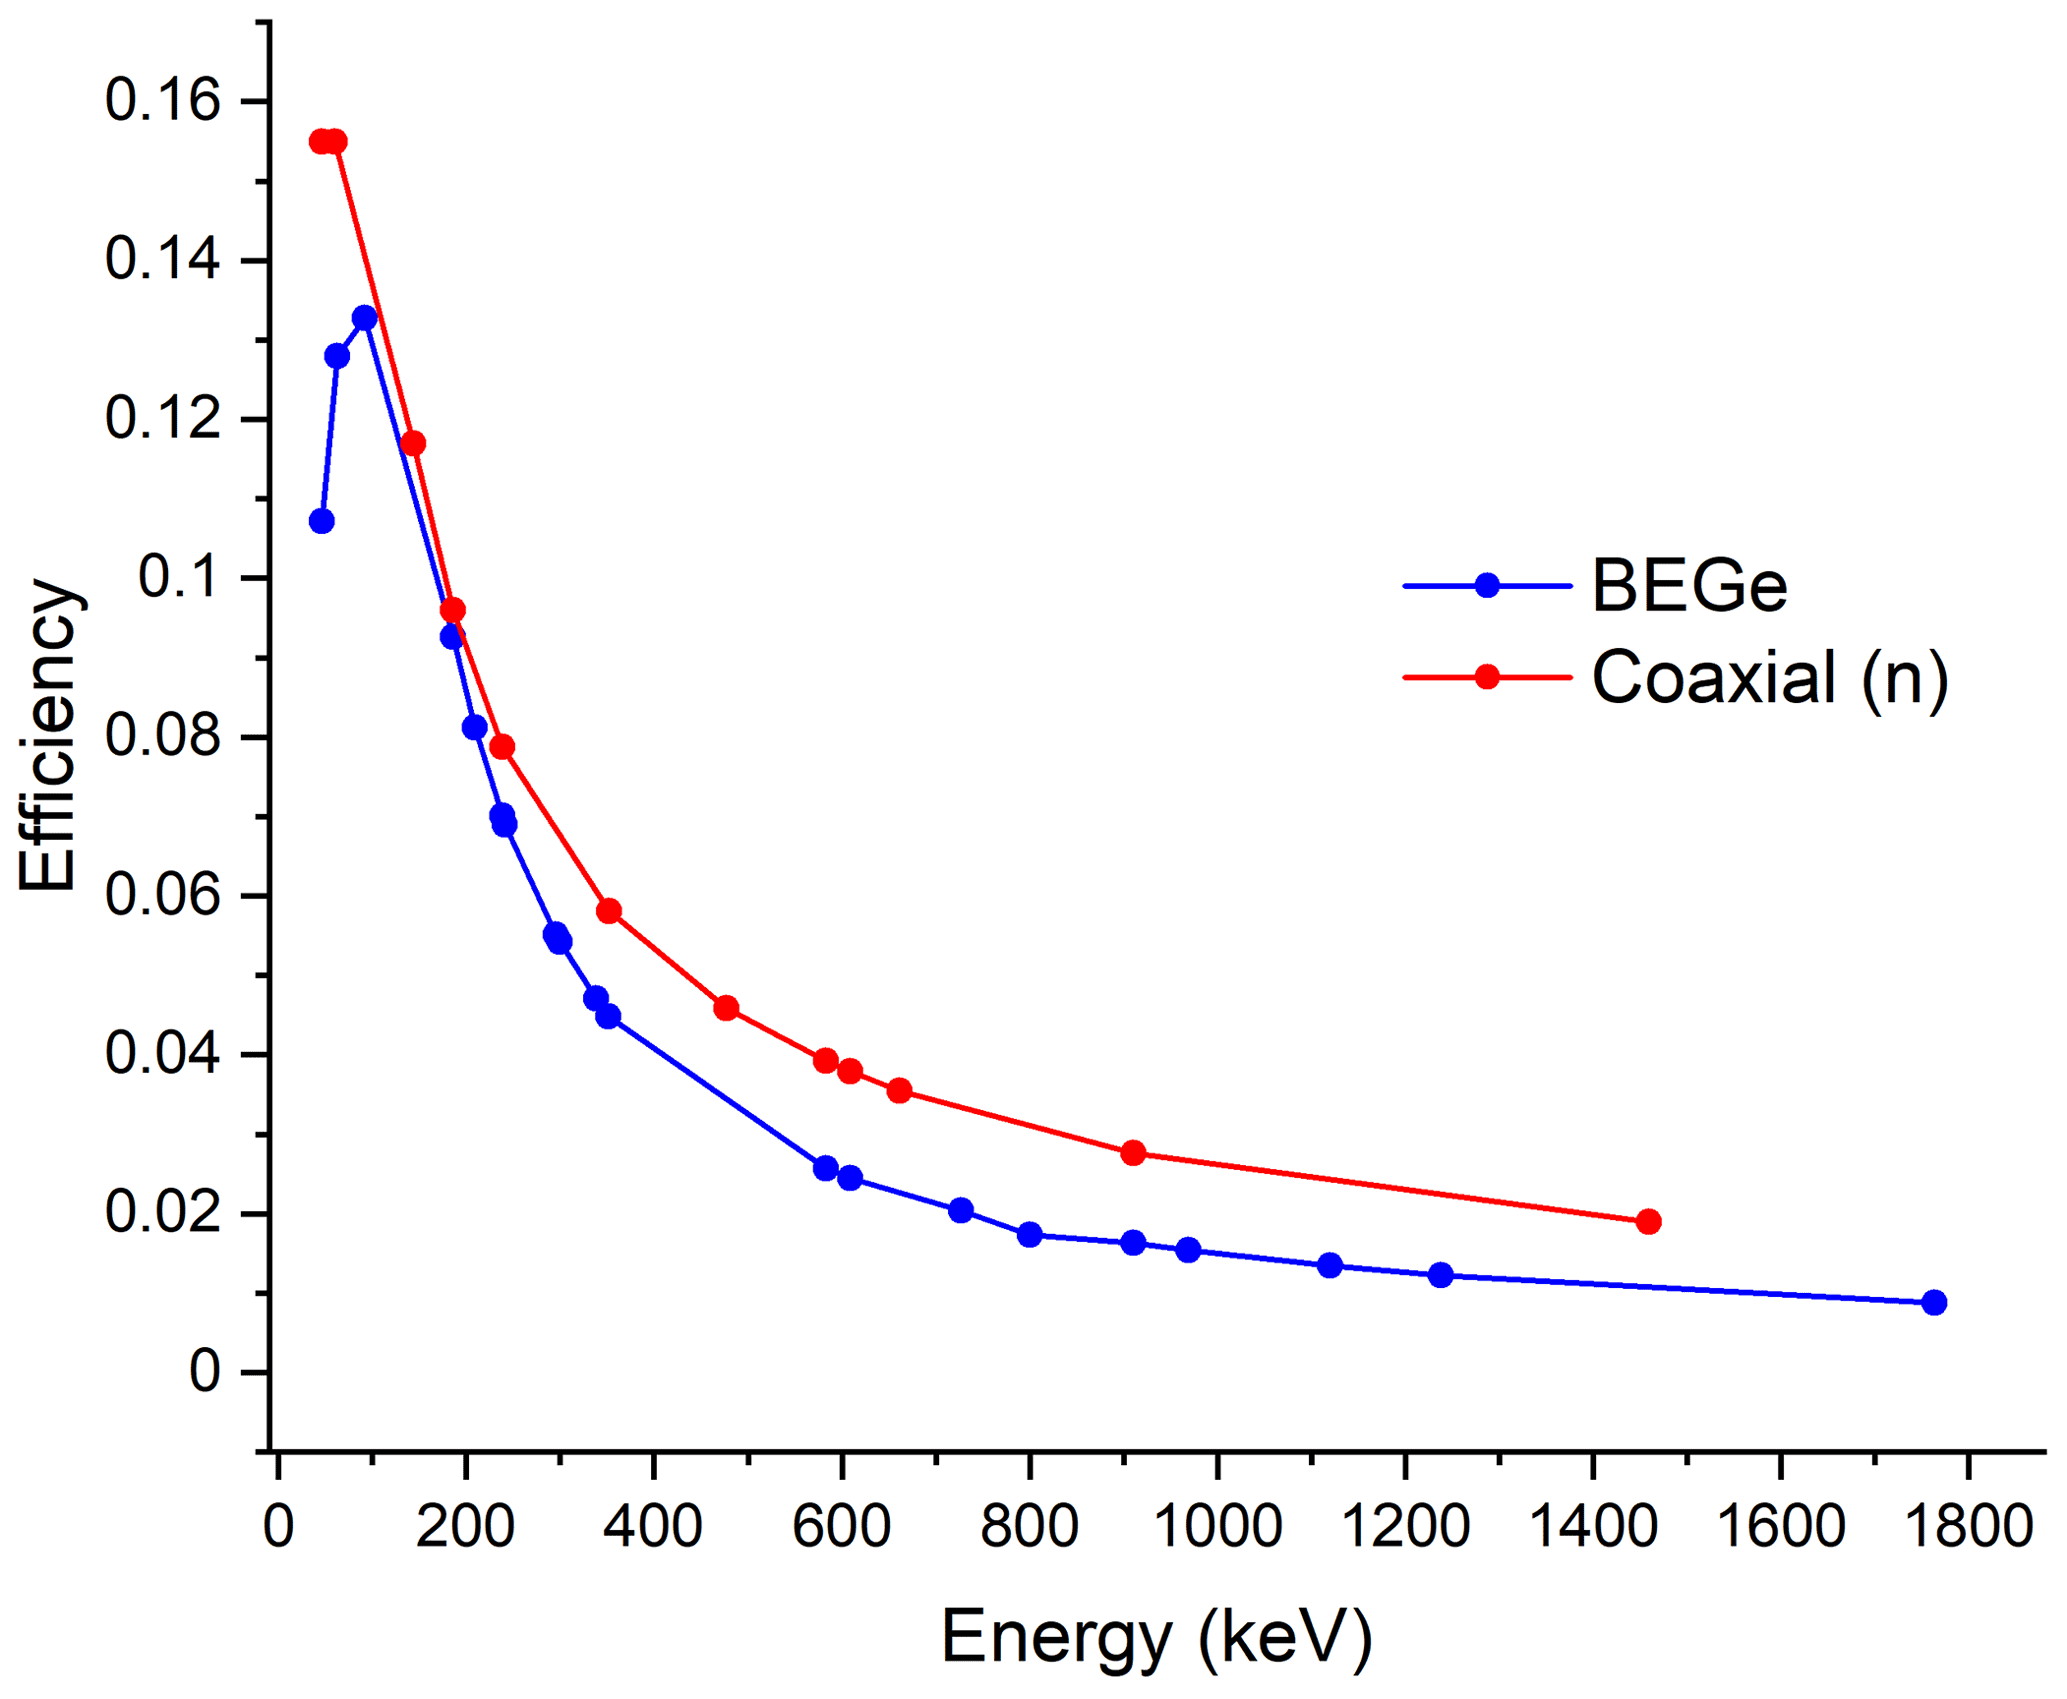
Figure 3Typical efficiency data for two detectors with diameters close to 60 mm. Data were determined with samples in the form of discs covering the front face of the detector. Samples have a diameter of 60 mm and a thickness of 13 mm. Data were normalized at low energy to account for the small difference in diameter of the two detectors. See Table 1 for a description of BEGe and coaxial (n) of this study.
Samples are normally dried and then placed in a suitable sample holder. There are three common measurement geometries: Marinelli beaker, cylindrical pot, and in the case of a well-type detector, sample tubes designed to fit snugly in the well (see Appendix B, Fig. B1). To obtain the texture suitable for the relevant measurement geometry samples can be pulverized, homogenized, and placed in a geometry that matches that of the standards used to calibrate the detector. One method for achieving this is to mix the dried and powdered sample with wax before casting it in a shape matching the required geometry (Fig. B2). Since some radionuclides may be preferentially selected by certain components within the sample, any treatment should carefully maintain the original composition. Removing a component, for instance organic matter, may generate inaccurate data because different components may be in different stages of equilibrium depending on their geochemical history during burial. If 226Ra is being determined via its short-lived daughter 214Pb, samples will need to be sealed to prevent escape of the intermediate radionuclide 222Rn (e.g. Tudyka et al., 2021) and stored for ∼25 d to ensure 226Ra–222Rn–214Pb radioactive equilibrium.
In practice, the sample configuration will be dictated by the detector type, the amount of available material, and the need to minimize self-absorption (see Sect. 6.2). Although near 4π geometry makes Marinelli beakers (ca 300 ml volume; see Fig. B1c) the preferred configuration, this will only be practicable when there is sufficient material to completely fill the beaker. When the amount of material is limited (<100 g), for a coaxial or BEGe detector the most suitable geometry will be cylindrical32 (Fig. B1a), with a diameter comparable to that of the detector. Well-type tubes (Fig. B1b) can normally only accommodate very small samples, typically no more than a few grams, and are only suitable for use on well-type detectors and when larger amounts of material are not available.
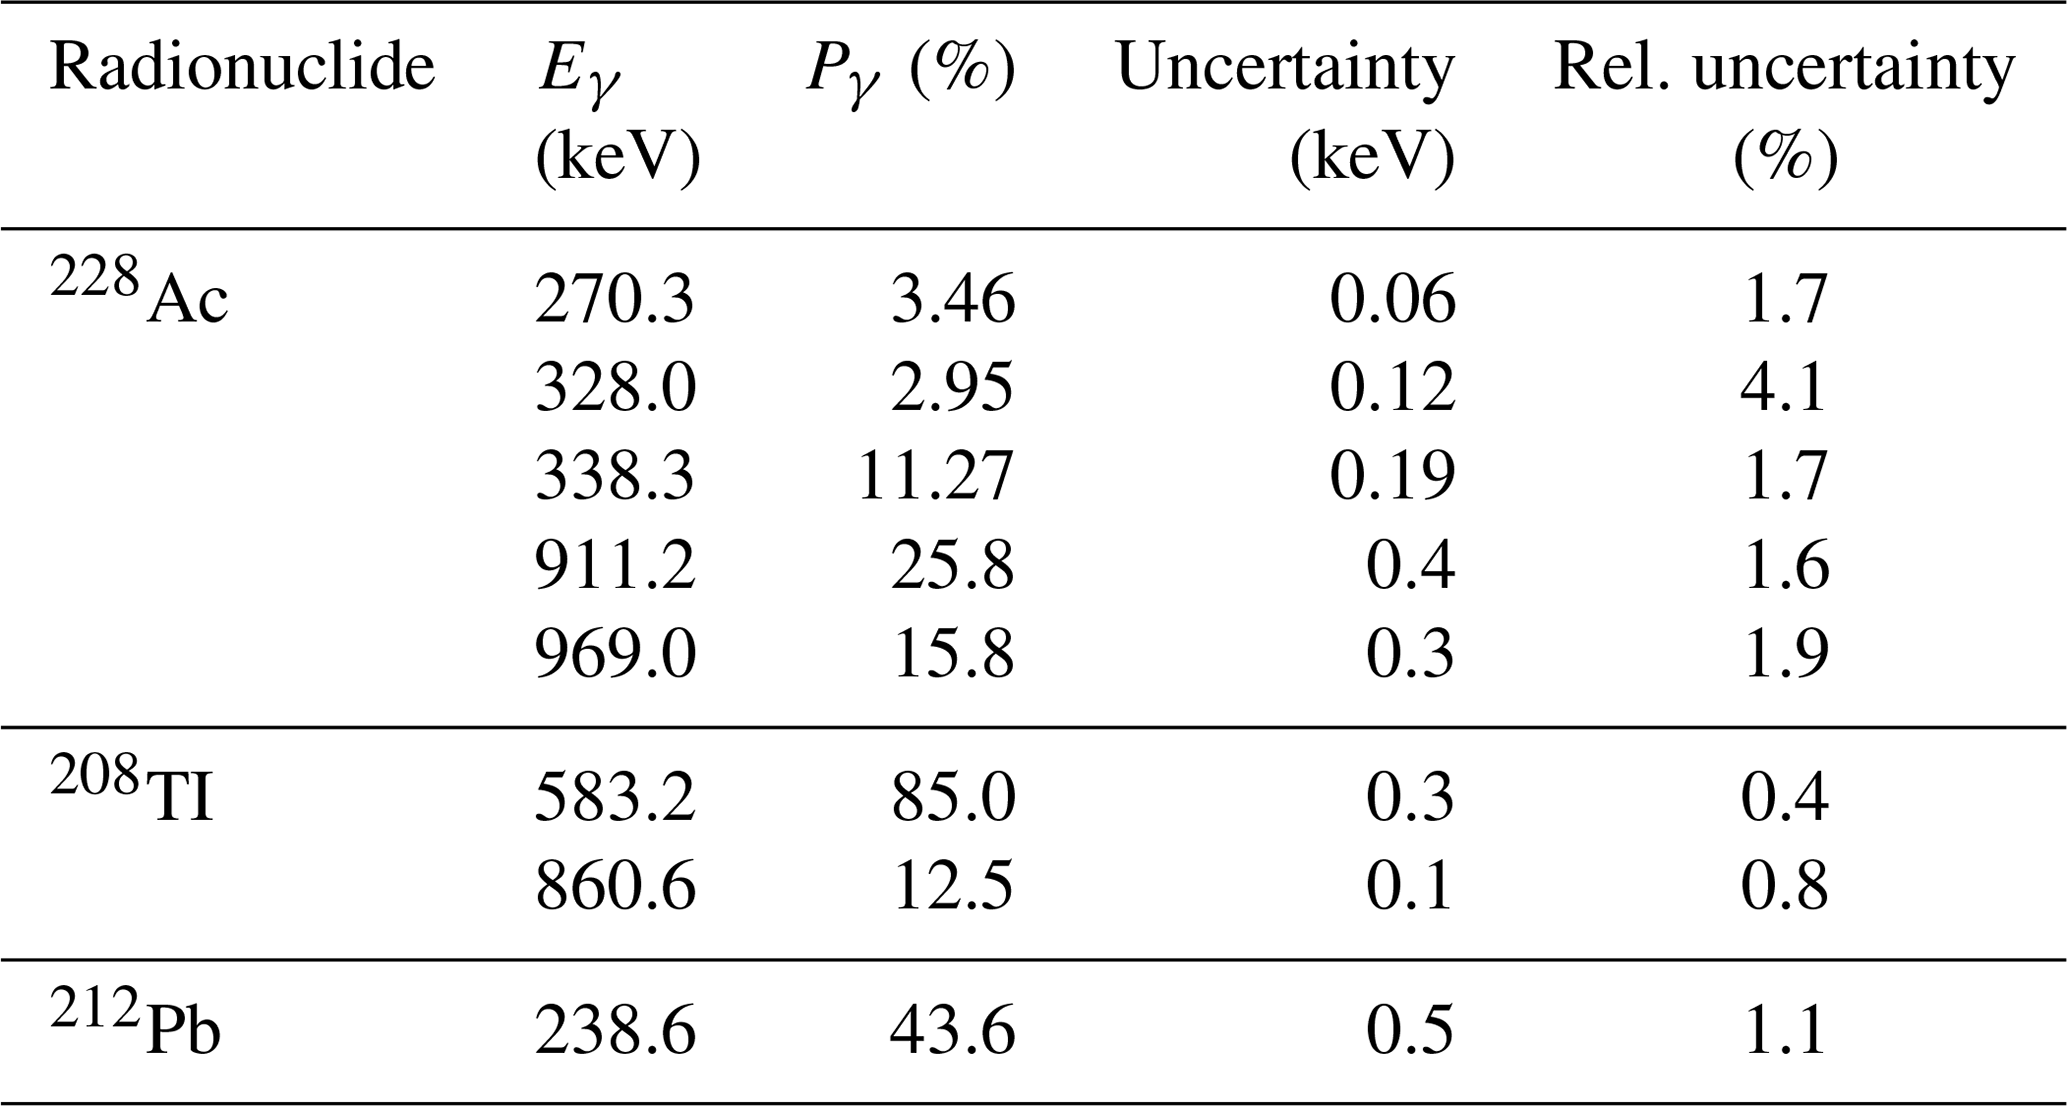
Calculations of radionuclide activities need to take into account emission probabilities (see Table 2 for values of 238U-series radionuclides and Table 3 for the 232Th series), full-energy peak efficiency (e.g. Fig. 3), geometry-dependent true coincidence summing (see Gilmore, 2008, for details), background characteristics of the detector (see Appendix C for details on background), interactions between sample and detector, and measurement geometry. Table 2 lists photon energies and emission probabilities for key members of the 238U series (see Guibert et al., 1994, for comparison). Table 3 lists corresponding values for key members of the 232Th series. For radionuclides with multiple energy lines, a best value of the activity may be obtained by using a weighted sum of activities determined from each of the most suitable lines. The other main natural source, 40K, emits 1460.8 keV photons with a probability of 10.66±0.16 %. The peak area given by most software will include background counts as well as those due to emissions from the sample itself. The number of counts in a peak is most easily measured when the peak is well resolved, stands alone free from the interference of any neighbouring peak, and has a small background contribution. Methods for calculating the peak area may include a simple summation of counts in channels within the region of interest or a procedure such as the Levenberg–Marquardt non-linear least squares fit algorithm for fitting the peak to a prescribed shape.
Table 2Key gamma-emitting 238U-series radionuclides, their emission energies (Eγ), and emission probabilities (Pγ). The 234Th peak at 63.3 keV is a doubleton that includes emissions at two different energy levels, 62.9 keV (0.016 %) and 63.3 keV (3.7 %). The peak at 92.6 keV includes emission at three different energy levels: 92.3 keV (0.017 %), 92.4 keV (2.12 %), and 92.8 keV (2.10 %). Data are from the National Nuclear Data Centre (https://www.nndc.bnl.gov/, last access: 10 August 2021).
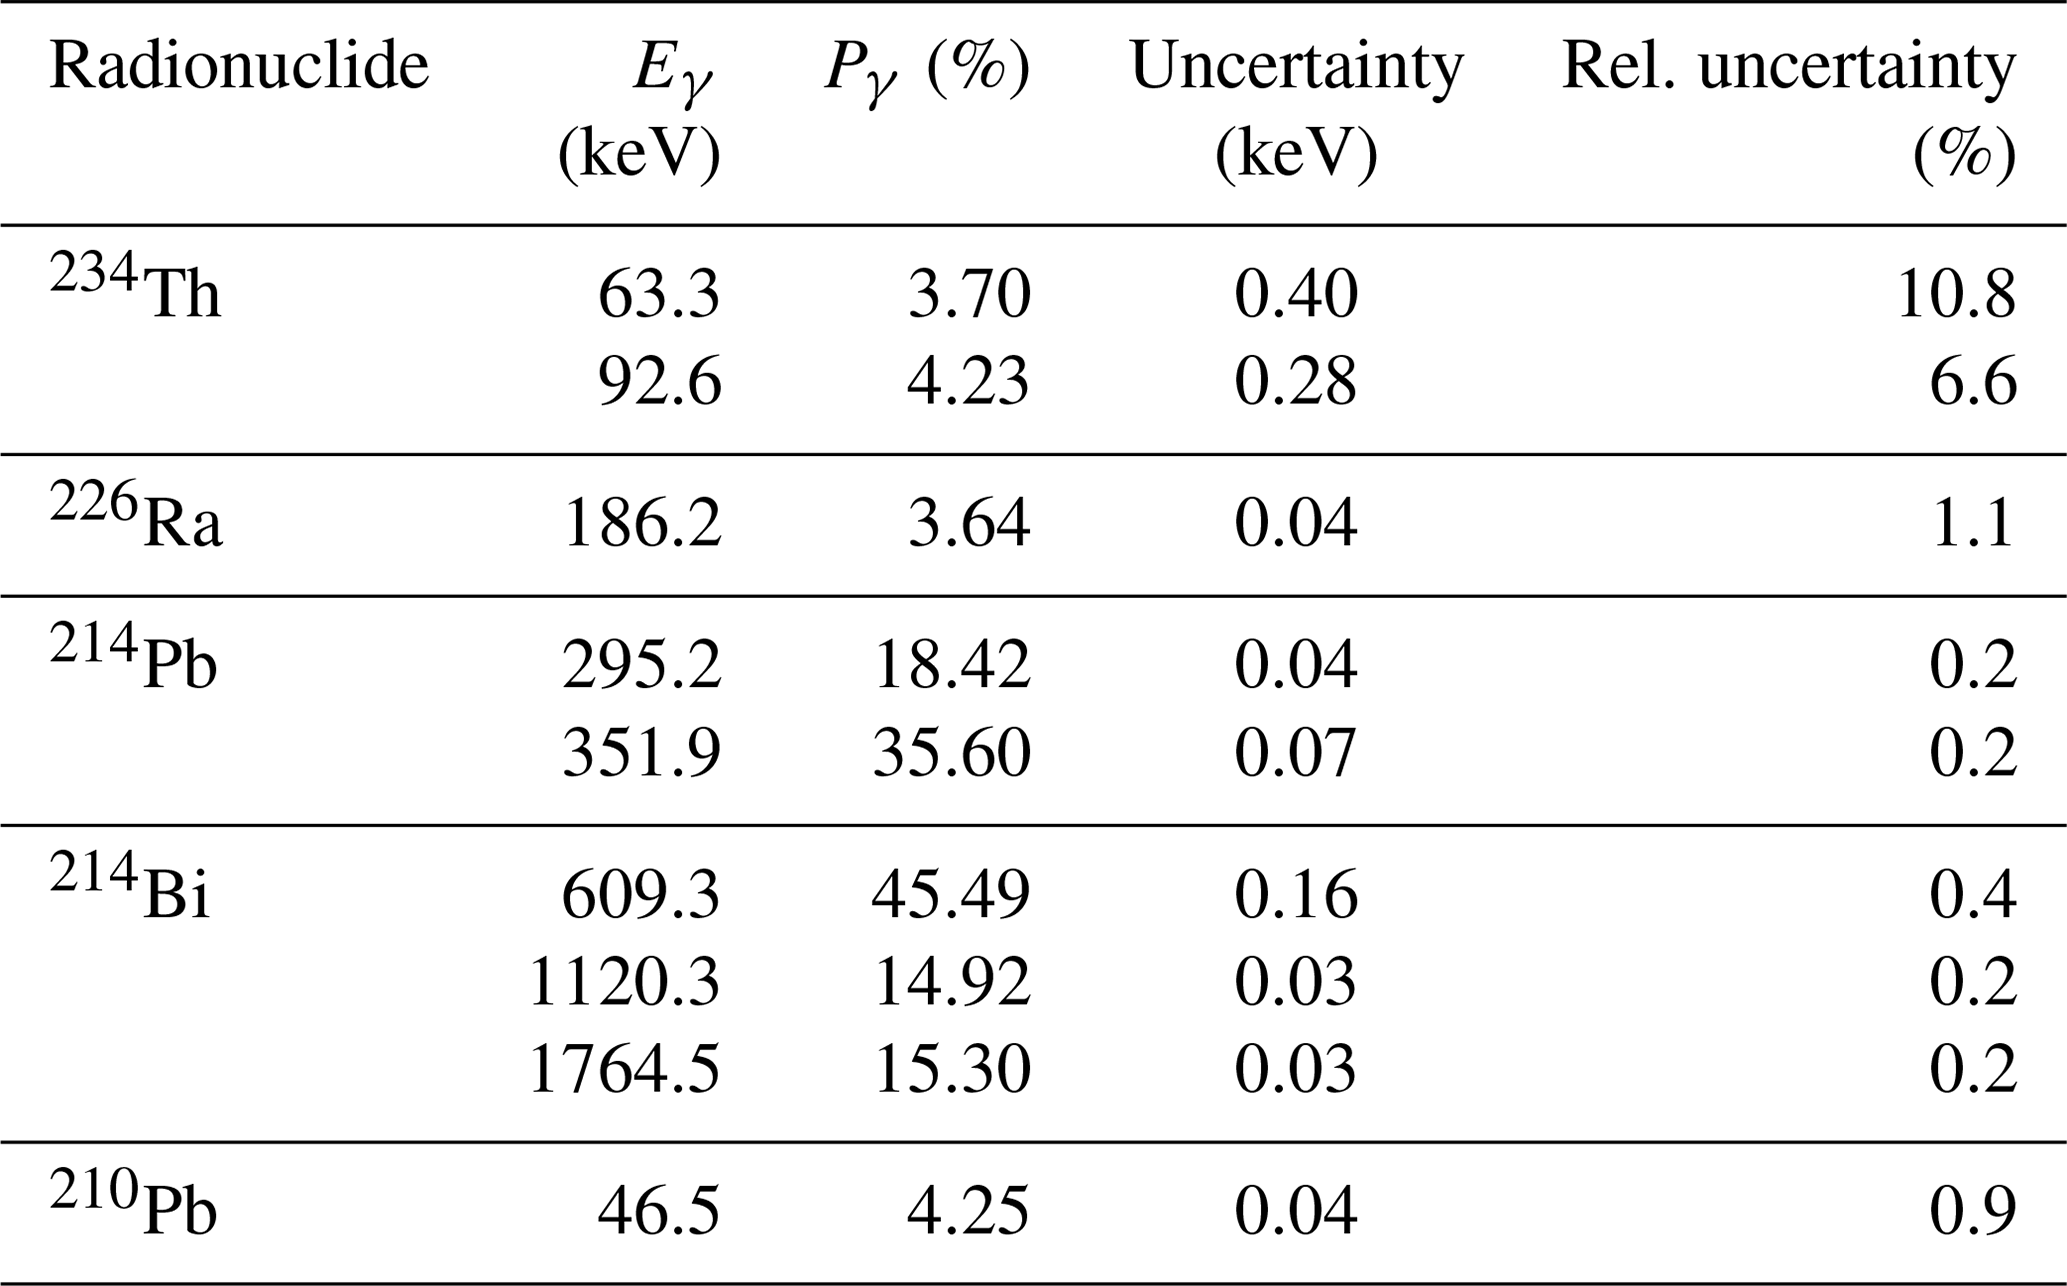
Table 3Radioisotopes suitable for determining the 232Th activity, their emission energies (Eγ), and emission probabilities (Pγ). Data are from the National Nuclear Data Centre (https://www.nndc.bnl.gov/, last access: 10 August 2021).
In routine measurements peak interferences and non-linear peak efficiencies due to self-absorption can be minimized by (i) limiting sample size (i.e. height of fill in the sample holder, Fig. B1), (ii) using a reference material of known activity (see Sect. 5.1 and Appendix C) having exactly the same geometry as the unknown sample and similar self-absorption characteristics, and (iii) using the most reliable energy lines for determining activities (Tables 2 and 3).
5.1 Efficiency calibration
For environmental samples the calibration method of choice is comparing the unknown sample with a sample of known activity concentration. It is of vital importance that known and unknown samples are similar in terms of atomic number, mass, and density and that the measurement geometry is kept constant. This straightforward approach is compromised insofar as available certified reference material (e.g. IAEA, NRCAN; Murray et al., 2018) is typically not ideal in terms of its properties. As a consequence, non-certified internal standard material specifically established for dosimetric dating is often in use (e.g. De Corte et al., 2007; Preusser and Kasper, 2001). Alternatively, certified material is deployed in concert with a number of variables that account for emission probability, full-energy peak efficiency, and, eventually, density or chemical composition. This procedure is specific to the detector and can be established through a series of experiments, or it is carried out through software packages provided by the manufacturer (e.g. LabSOCS, ANGLE). For details see Appendix C.
The interlaboratory comparison study published by Murray et al. (2015) shows considerable differences for gamma-spectrometric results obtained for 238U and 232Th. Because U and Th constitute around 30 % of the total annual dose rate (Aitken, 1985), these differences are of great concern. While some of the differences may arise from procedures carried out in individual laboratories, the efficiency calibration is an issue affecting all laboratories. An empirical study (Mauz et al., 2021) suggests that the calibration method contributes <10 % difference for the activity data of 238U, 232Th, and 40K when unsuitable energy peaks (e.g. 186 keV) are excluded.
5.2 Uncertainties
The uncertainty in the overall result depends on a range of factors. These include counting statistics, detection efficiency, nuclear decay data, sample composition, and geometry-defined true coincidence summing.
For the typical activities to be measured and the sample sizes used the uncertainty arising from counting statistics is typically 2 %–5 % for a counting time of around 1 d. This depends on the intensities of the various gamma rays used in the analysis. The detection efficiency depends on the counting geometry and the detector used, and it also varies with gamma-ray energy. By using a series of different reference materials to fully characterize the systems used an uncertainty of 2 %–3 % can be achieved. The emission probabilities obtained from the nuclear decay data have uncertainties. Tables 2 and 3 show that the majority of these are small. The exception is the decay of 234Th. Here the two gamma rays have relatively large uncertainties. If both can be used in the analysis then the uncertainty for 234Th is around 5 %. The sample composition can lead to self-absorption, particularly for low-energy gamma rays. When the density of the sample is known as is its elemental composition, the amount of self-absorption can be determined accurately with an uncertainty of only a few percent. The effect of true coincidence summing also needs to be taken into account. This depends on the decay scheme of the nuclei involved and the detection efficiency of the system being used. For most of the nuclei in the uranium and thorium decay chains this effect is very small for the efficiencies that are used in the majority of counting geometries, and it is not a major contributor to uncertainty. For more details see Abdualhadi (2016). Overall, uncertainties of 3 %–6 % can be achieved.
In samples that have effectively been sealed for long periods of time, members of the 238U series will all be in radioactive equilibrium: that is, they will all have the same activity. In this case the activity can in principle be determined using any of the nine photopeaks listed in Table 2. In practice, mobilization of intermediate members is likely to result in the U series being in disequilibrium. When this involves short-lived daughters, disequilibrium with the nearest long-lived parent will also be short-lived. For example, 226Ra will usually be in equilibrium with its short-lived daughters 214Pb and 214Bi. Disequilibria between long-lived members such as 230Th (half-life 75380 years) and 226Ra (half-life 1600 years) will take many thousands of years to resolve. In these cases the activity must be measured using photopeaks from the radionuclide itself or its short-lived daughters. Because secular disequilibrium is typically caused by the mobilization of 234U and 226Ra, the following energies are key to detect radioactive disturbance: 63 and 92 keV (to infer 234U through 234Th), 186 keV (to quantify 226Ra), and 46 keV (to quantify the endmember 210Pb). There are non-trivial issues associated with these photopeaks that need to be solved in order to determine the activity of 234Th, 226Ra, and 210Pb (see Sect. 6.1 and 6.2). A major obstacle in determining the complete 238U series is the absence of significant gamma emissions from 230Th. In samples that have been isolated on timescales of tens of thousands of years, 230Th will be in secular equilibrium with its daughter radionuclide 226Ra and can thus be determined via the 226Ra emission. On shorter timescales, potential disequilibria between 230Th and 226Ra are a significant source of uncertainty.
6.1 Correcting peak interference
At 92 keV the gamma peak of 234Th is interfered by X-rays and by other gamma peaks including the 93.3 keV thorium line (Huy and Luyen, 2005; see Appendix D for details). In addition, for Ge detectors there is a contribution below the photopeak from multiple Compton scattering whereby the interaction probability ratio for the photoelectric effect and Compton scattering is detector-dependent. There is also background from Comptons from higher-energy peaks so that, effectively, the background at 92–93 keV is a continuum with a small step at each peak (Fig. 4). It is good practice to first collect some spectra from Th-rich samples to define the position and characteristics of the peaks near 92 keV so that energies and FWHMs can be fixed when deconvoluting the peak region (Fig. 4). All these non-trivial issues may rule out the use of the 92 keV peak for quantifying 234Th, leaving us with its 63 keV peak that, however, overlaps with a 232Th decay peak at 63.8 keV (Pγ=0.263 %; see also https://www.nndc.bnl.gov/, last access: 10 August 2021). For the purpose of data robustness both peaks are, ideally, analysed and compared (Fig. 5). This process can be more straightforward if a detector with excellent low-energy resolution is used.
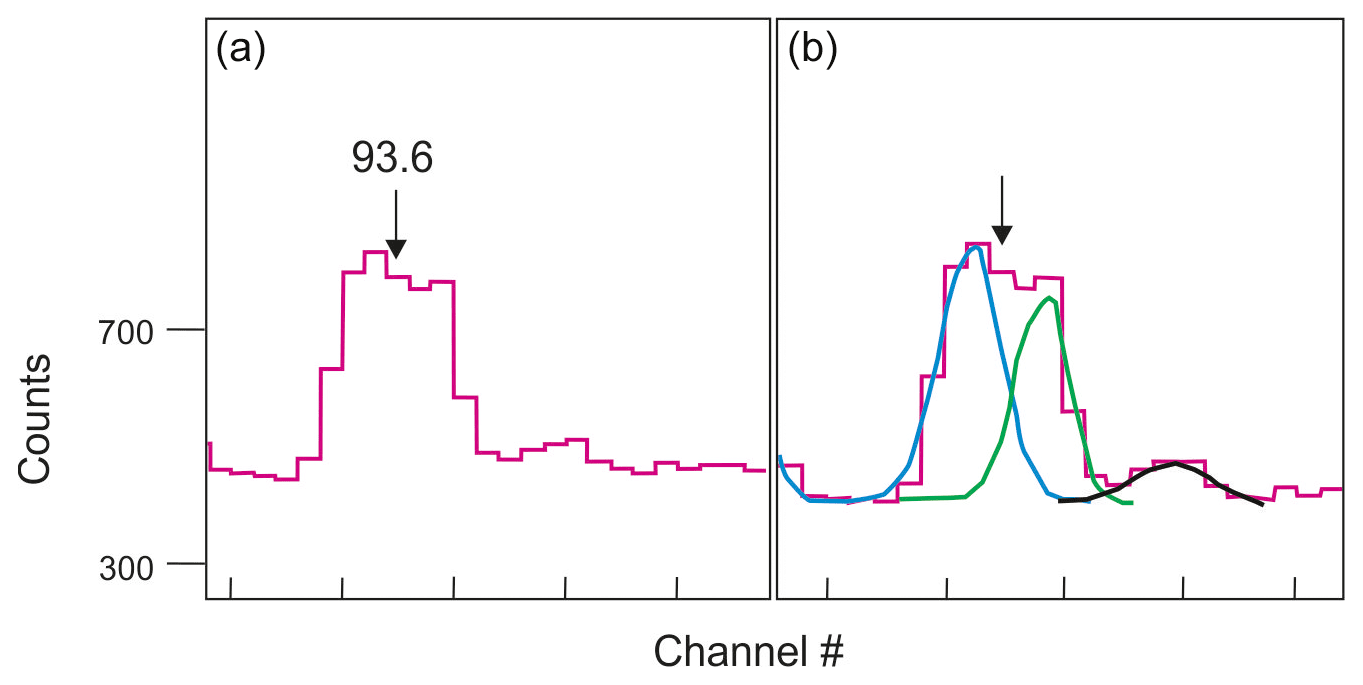
Figure 4Fitting the 92–93 keV energy peak using the g3 software (see Appendix D for details). (a) Typical 93 keV peak; (b) deconvolution of peak resulting in three different peak functions (blue, green, black). Figure adapted from Abdualhadi (2016).
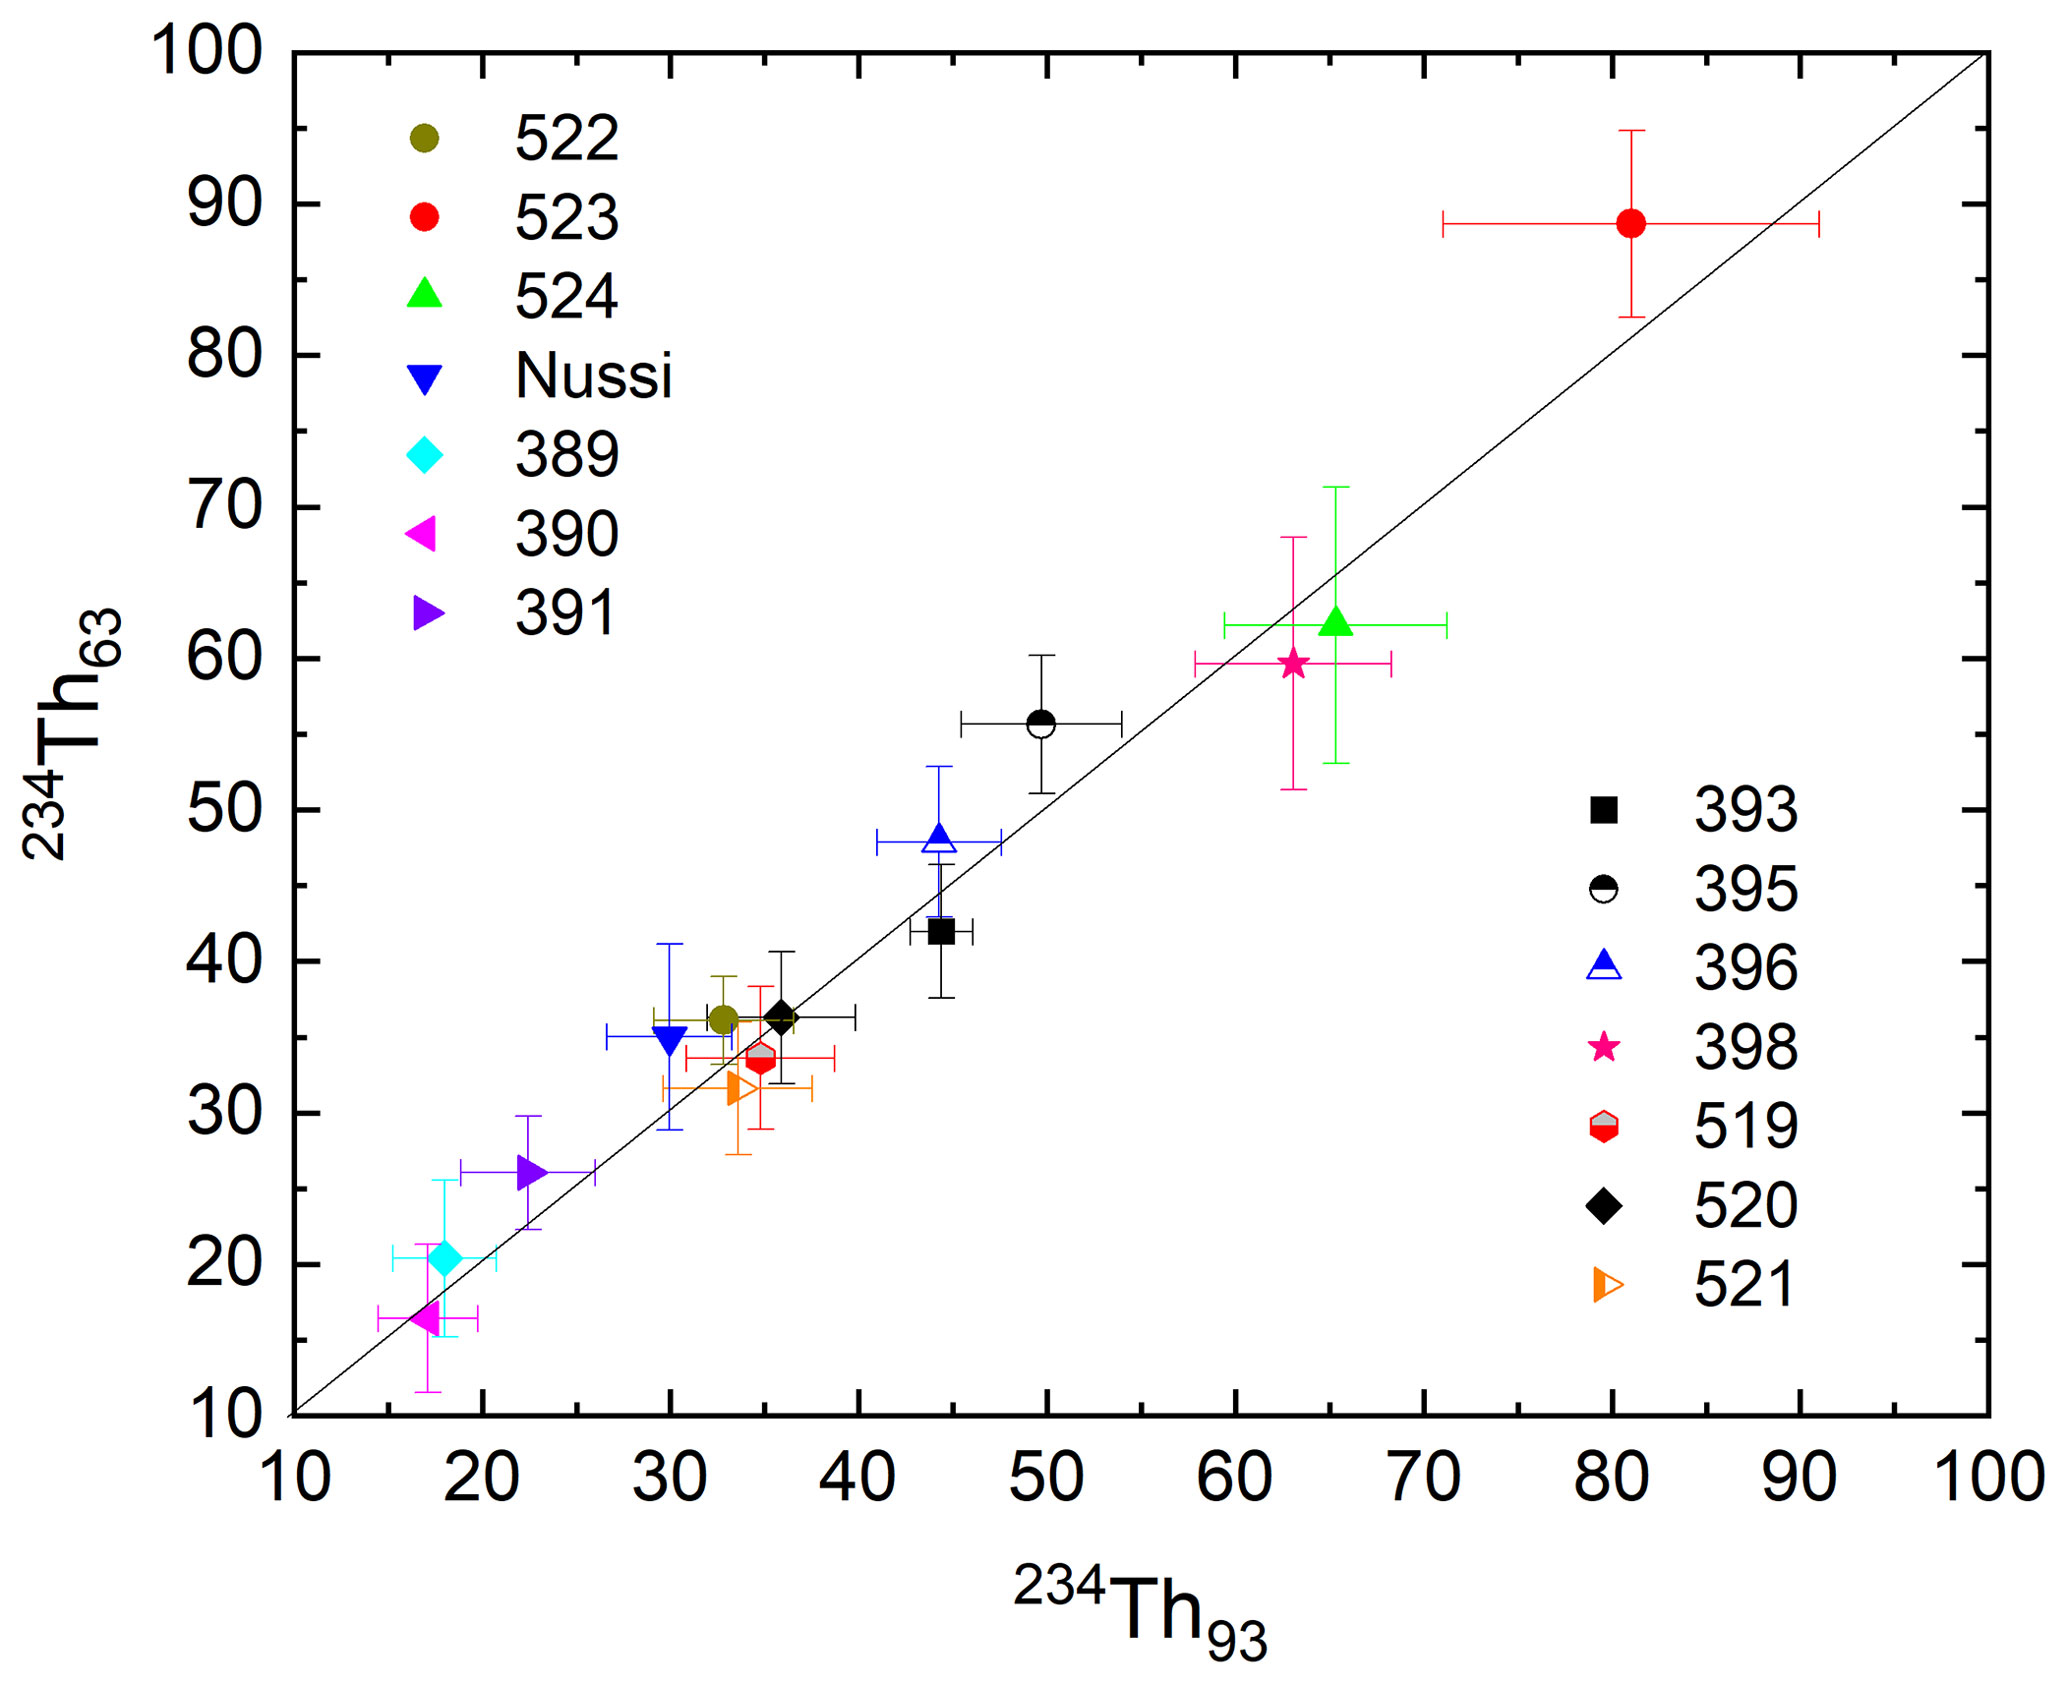
Figure 5Testing the correction of the 63 and 92 keV energy lines. Symbols represent sample codes of 14 samples originating from different geographical regions and environments. Figure adapted from Abdualhadi et al. (2018).
At 186 keV the gamma peaks of 226Ra and 235U overlap. There are three ways to handle this.
- (1)
The first is subtracting the 235U portion from the total activity deduced from the 186 keV peak. This is achieved by calculating the natural isotopic ratio of 238U and 235U by taking into account atomic mass, Avogadro constant, decay rate, and half-life of each radionuclide. This results in 58 % of the counts in the 186 keV peak emitted by 226Ra and 42 % emitted by 235U. Assuming secular equilibrium between 238U and 226Ra these percentages are constant and can be used as a nominal factor to correct the interference at 186 keV.
- (2)
The second is calculating the 226Ra activity by including other gamma peaks (e.g. de Corte et al., 2005). With this method the 235U activity is directly inferred from its peak at 144 keV or indirectly from the 234Th peak at 63 keV. The method requires correction of peak interference at 63 keV and of true coincidence summing as well as adoption of the natural isotopic ratio of 238U and 235U. Its advantage is that secular equilibrium is assumed only between 238U and its immediate daughter 234Th.
- (3)
The third is bypassing correction procedures by sealing the sample against 222Rn escape (as indicated in Sect. 4) and determining 226Ra via the emissions from its short-lived daughters 214Pb (352 keV) and/or 214Bi (609 keV). Note, however, that 214Bi emissions can be significantly affected by coincidence summing.
We have compared approaches (2) and (3). The results are ambiguous (Fig. C1), suggesting that correction (2) is insufficient to accurately determine the 226Ra activity (see Appendix D for details).
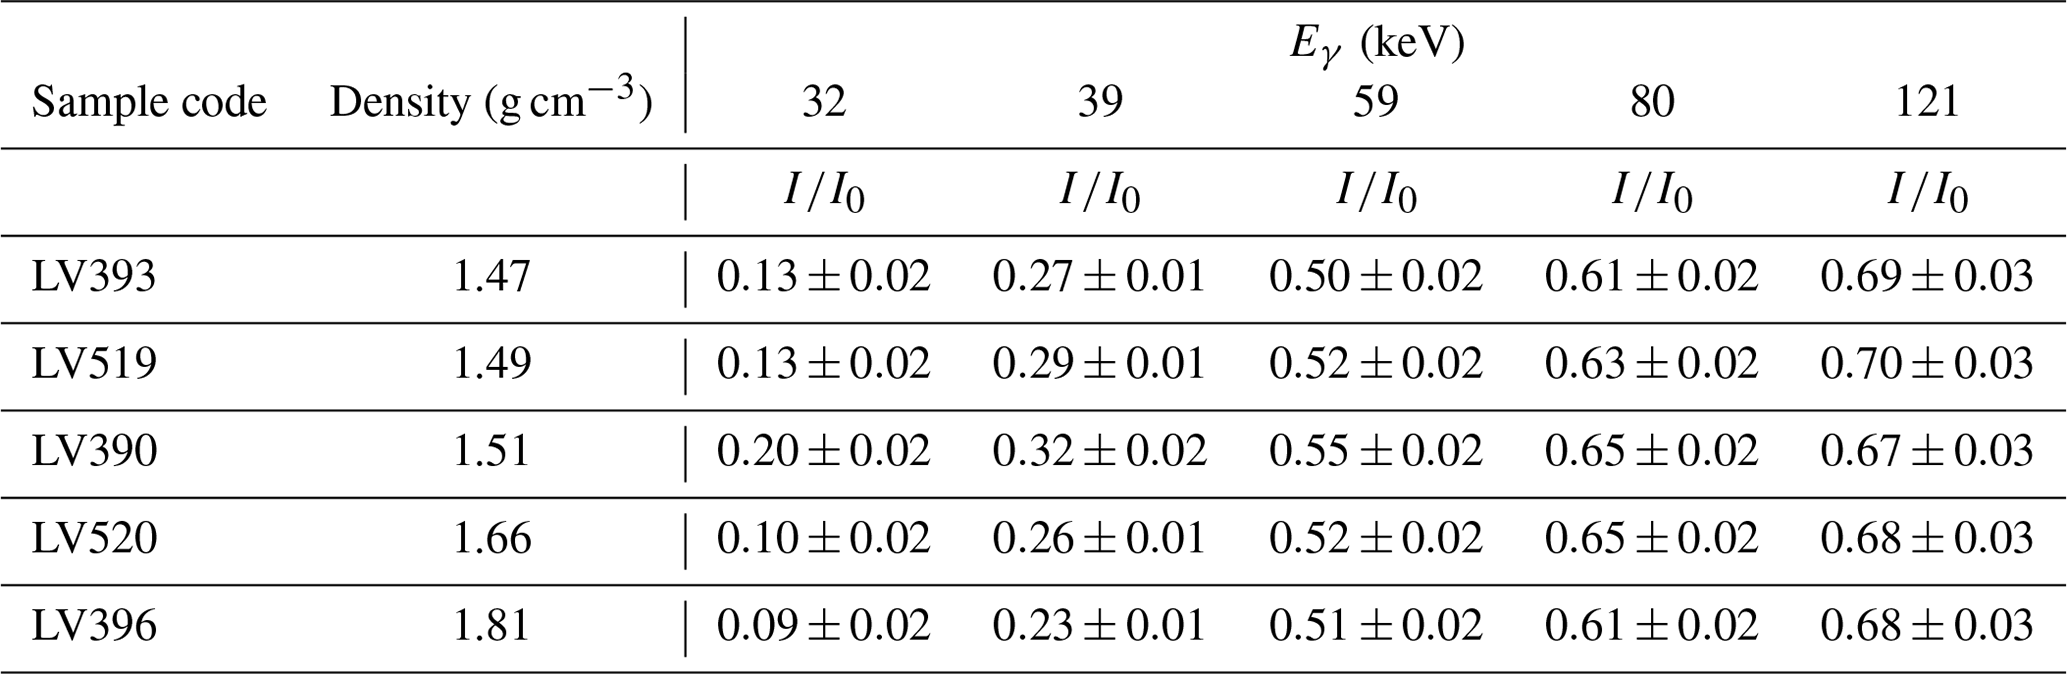
Table 4Transmitted intensities of gamma rays for sandy samples with different densities (and chemical composition). is the ratio between experimentally measured gamma-ray intensity (I) and gamma-ray intensity without a sample (I0). Gamma energies (Eγ; keV) of point sources are 32 (137Cs), 39 (152Eu), 59 (241Am), 80 (133Ba), and 121 (152Eu) (Abdualhadi, 2016).
6.2 Correcting self-absorption
A fraction of gamma photons generated by radioactive decay are lost by absorption within the sample before reaching the detector. The extent of the losses will be controlled by the sample mass, measurement geometry, and the gamma-ray attenuation coefficient of materials within the sample. They will generally be relatively small at high photon energies but much more significant at low photon energies. A semi-empirical formula for estimating the losses is
where N is the number of photons actually detected, N0 the number of photons that would have been detected in the absence of self-absorption, m the mass of the sample, ![]() the material gamma-ray mass attenuation coefficient, and k a parameter characterizing the geometry of the sample (Appleby et al., 1992). Values of the attenuation coefficient can be determined empirically using the Beer–Lambert law (Eq. A1) by measuring the reduction in intensity when a collimated beam of gamma rays is passed through the sample (transmission method). Table 4 lists empirically determined intensity reduction values () for a number of samples with different densities and chemical properties at photon energies in the range 32 to 121 keV. Differences between samples are relatively small at photon energies greater than 60 keV but may be significant at low photon energies. More advanced approaches are available using the Monte Carlo N-particle (MCNP) transport code, which effectively simulates the interaction of gamma rays emitted in a random direction by a sample of known density and chemical composition with the detector (for details see Abdualhadi et al., 2018). When the sample has a known chemical composition estimates of the attenuation coefficient can be made using information available in published databases (see Appendix A).
the material gamma-ray mass attenuation coefficient, and k a parameter characterizing the geometry of the sample (Appleby et al., 1992). Values of the attenuation coefficient can be determined empirically using the Beer–Lambert law (Eq. A1) by measuring the reduction in intensity when a collimated beam of gamma rays is passed through the sample (transmission method). Table 4 lists empirically determined intensity reduction values () for a number of samples with different densities and chemical properties at photon energies in the range 32 to 121 keV. Differences between samples are relatively small at photon energies greater than 60 keV but may be significant at low photon energies. More advanced approaches are available using the Monte Carlo N-particle (MCNP) transport code, which effectively simulates the interaction of gamma rays emitted in a random direction by a sample of known density and chemical composition with the detector (for details see Abdualhadi et al., 2018). When the sample has a known chemical composition estimates of the attenuation coefficient can be made using information available in published databases (see Appendix A).
Many studies have addressed the issue of self-absorption (e.g. Huy and Luyen, 2005; Aguiar et al., 2006; Khater and Ebaid, 2008; Kaminski et al., 2014; Barrera et al., 2017), each employing a slightly different method depending on available tools in the respective laboratory. Often, experimental work (e.g. Huy and Luyen, 2005; Aguiar et al., 2006; Khater and Ebaid, 2008) is combined with Monte Carlo-based model work (e.g. Huy et al., 2013; Bruggeman et al., 2016).
This is Part 1 of our paper on the quantification of uranium-series disequilibrium in natural samples. It focuses on basic principles for estimating contemporary dose rates using gamma spectrometry. We describe the basics of gamma radiation and the penetration depth of this radiation in matter as a function of photon energy and material properties. The detectors suitable for detecting gamma-ray emissions in the typical range of 10–2600 keV (Fig. 1) are high-purity germanium (HPGe) crystals operated at low temperature (Table 1). The fully absorbed gamma photons entering the detector crystal generate discrete full-energy peaks in the gamma spectrum that are specific to 40K and the radioisotopes of the 238U and 232Th series. The analysis of these full-energy peaks accounts for the gamma emission probability of the corresponding radioisotope, the detector's efficiency and background at that energy, and accompanying interactions between the sample and detector. All these factors together result in the choice of a number of photopeaks suitable for estimating the parent nuclide activities (Tables 2 and 3). For these peaks the simple comparison with a reference material of known activity (e.g. Volkegem loess) delivers accurate activities of individual radioisotopes and hence the parent nuclide, with an uncertainty of 3 %–6 %.
The essential prerequisite of this approach is radioactive equilibrium: that is, all members of the 238U series have the same activity. Since only samples that have been isolated for millions of years will be in secular equilibrium, most samples that are subject to dosimetric dating are likely to exhibit disequilibrium. The significance of this disequilibrium for the dose-rate estimate depends on the radioisotope involved and the duration of the process that leads to loss or gain of a 238U-series member. If disequilibrium is suspected, the photopeaks at 46, 63, and 92 keV as well as at 186 keV have to be analysed, and this involves accounting for peak interference and self-absorption, both being well-known issues of gamma spectrometry. Advanced approaches are currently available using the Monte Carlo N-particle (MCNP) transport code, which effectively simulates the interaction between the detector and gamma rays emitted in a random direction by a sample of known density and chemical composition. This allows quantifying the activities of key members of the 238U series required to calculate the historical dose rate by solving the Bateman equation. This will the subject of Part 2 of our paper.
Depending on the photon energy and characteristics of the material, gamma rays can penetrate objects to a depth of several centimetres, though the intensity (I) attenuates exponentially with distance (x) in accordance with the Beer–Lambert law.
The (linear) attenuation coefficient μ is a function of photon energy and material characteristics. The penetration depth is defined as the distance over which the intensity is reduced to a fraction (37 %) of its initial value I0 (that is, a 63 % reduction) and is given by
The intensity is reduced by 50 % over a depth . Values of the mass attenuation coefficients given in the literature are usually expressed in terms of the mass attenuation coefficient, defined as
where ρ is the mass density. For example, the mass attenuation coefficient for 1 MeV photons in SiO2 is 0.0637 cm2 g−1; since the density is 2.32 g cm−3, the linear attenuation coefficient is 0.148 cm−1. The penetration depth (63 % reduction) is thus 6.8 cm and is 4.7 cm for a 50 % reduction. Values of ![]() at other photon energies or for other materials can be found in the literature (e.g. Hubbell, 1983) or from online databases (Hubbell and Seltzer, 2004).
at other photon energies or for other materials can be found in the literature (e.g. Hubbell, 1983) or from online databases (Hubbell and Seltzer, 2004).
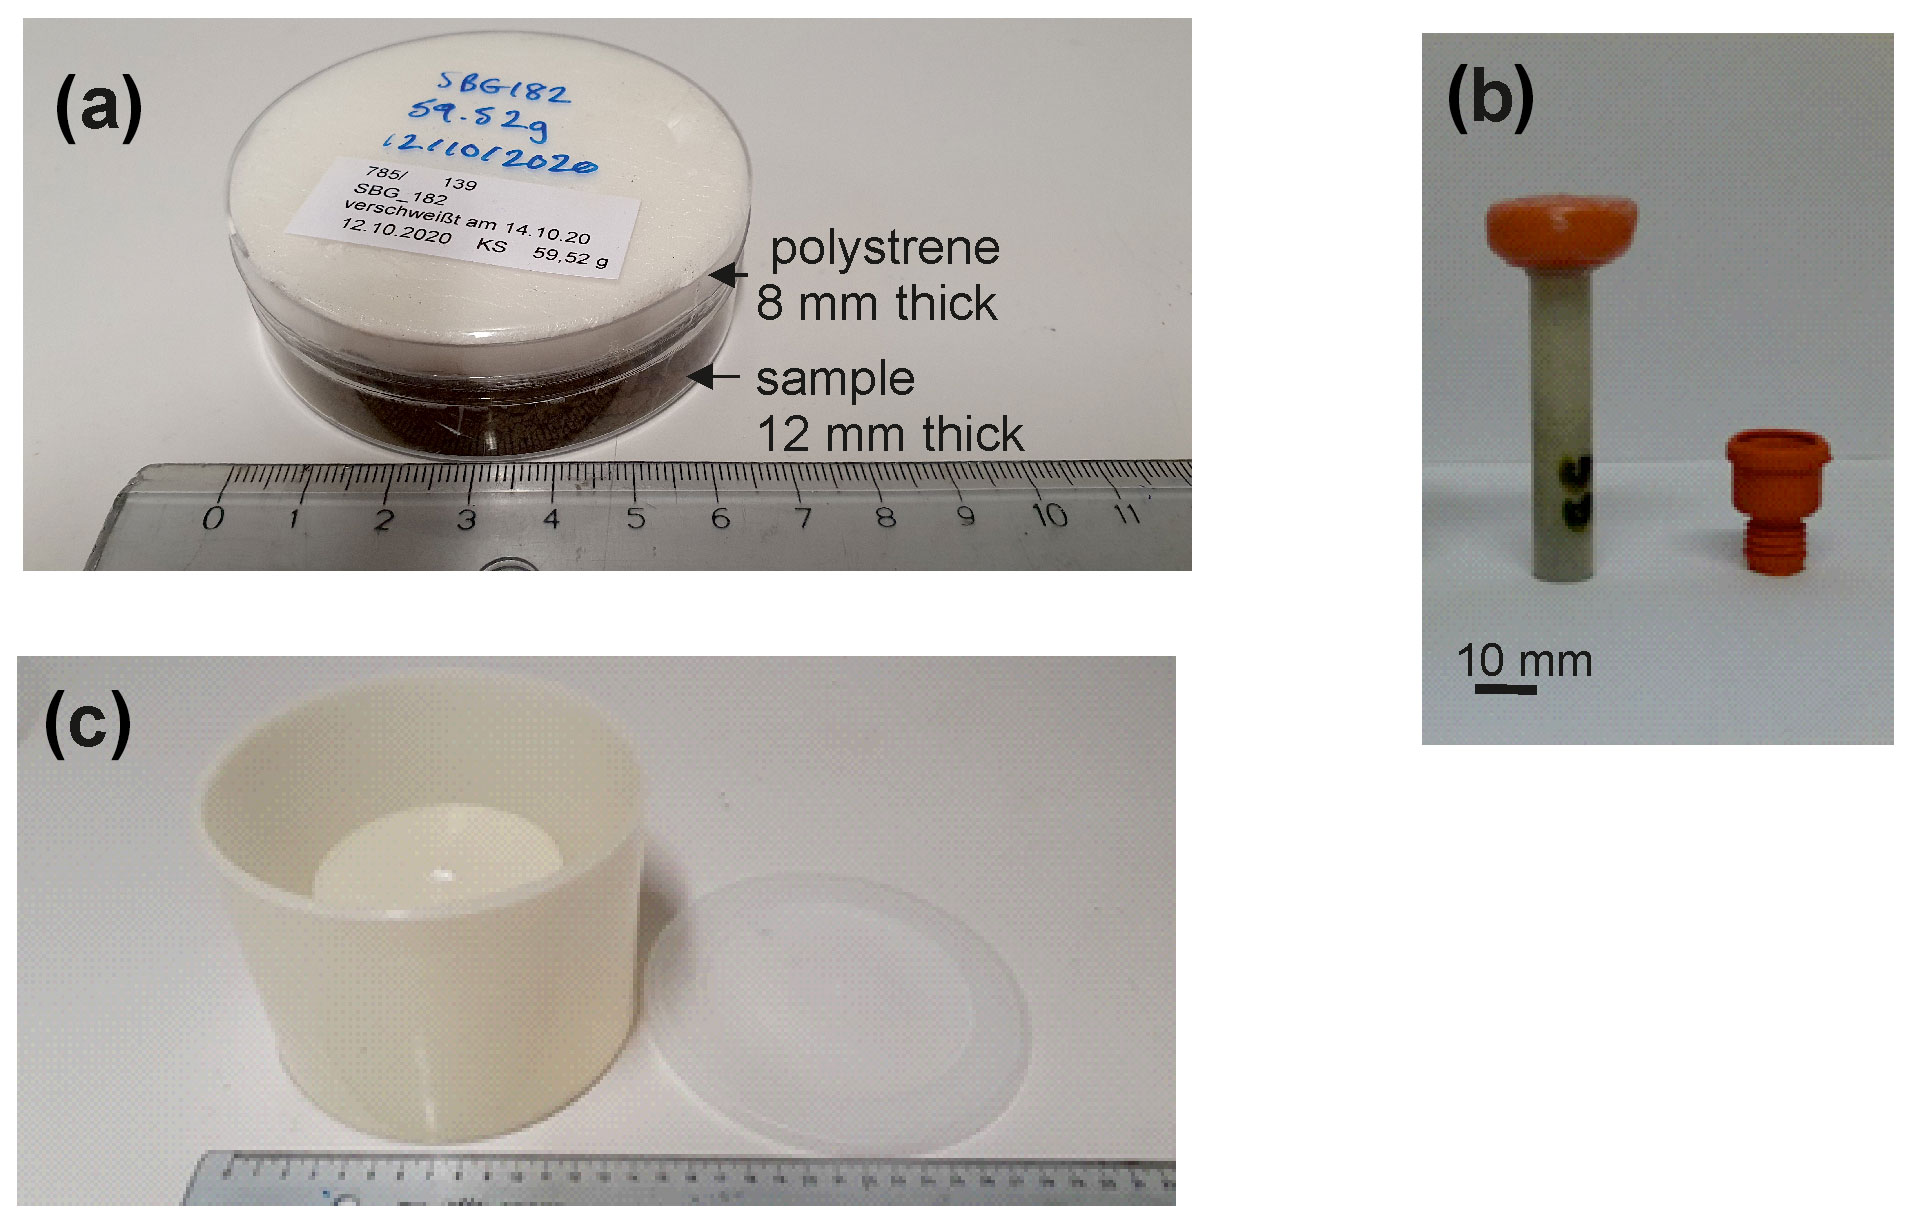
Figure B1Sample holders typically used for measuring a gamma spectrum: (a) cylinder; (b) well tube; (c) Marinelli beaker.

Figure B2Samples mixed with wax and cast in three different geometries (photo kindly provided by Vicki Hansen, DTU).
Table C1The Volkegem loess: activity concentrations (Bq kg−1) determined in different laboratories using different methods.

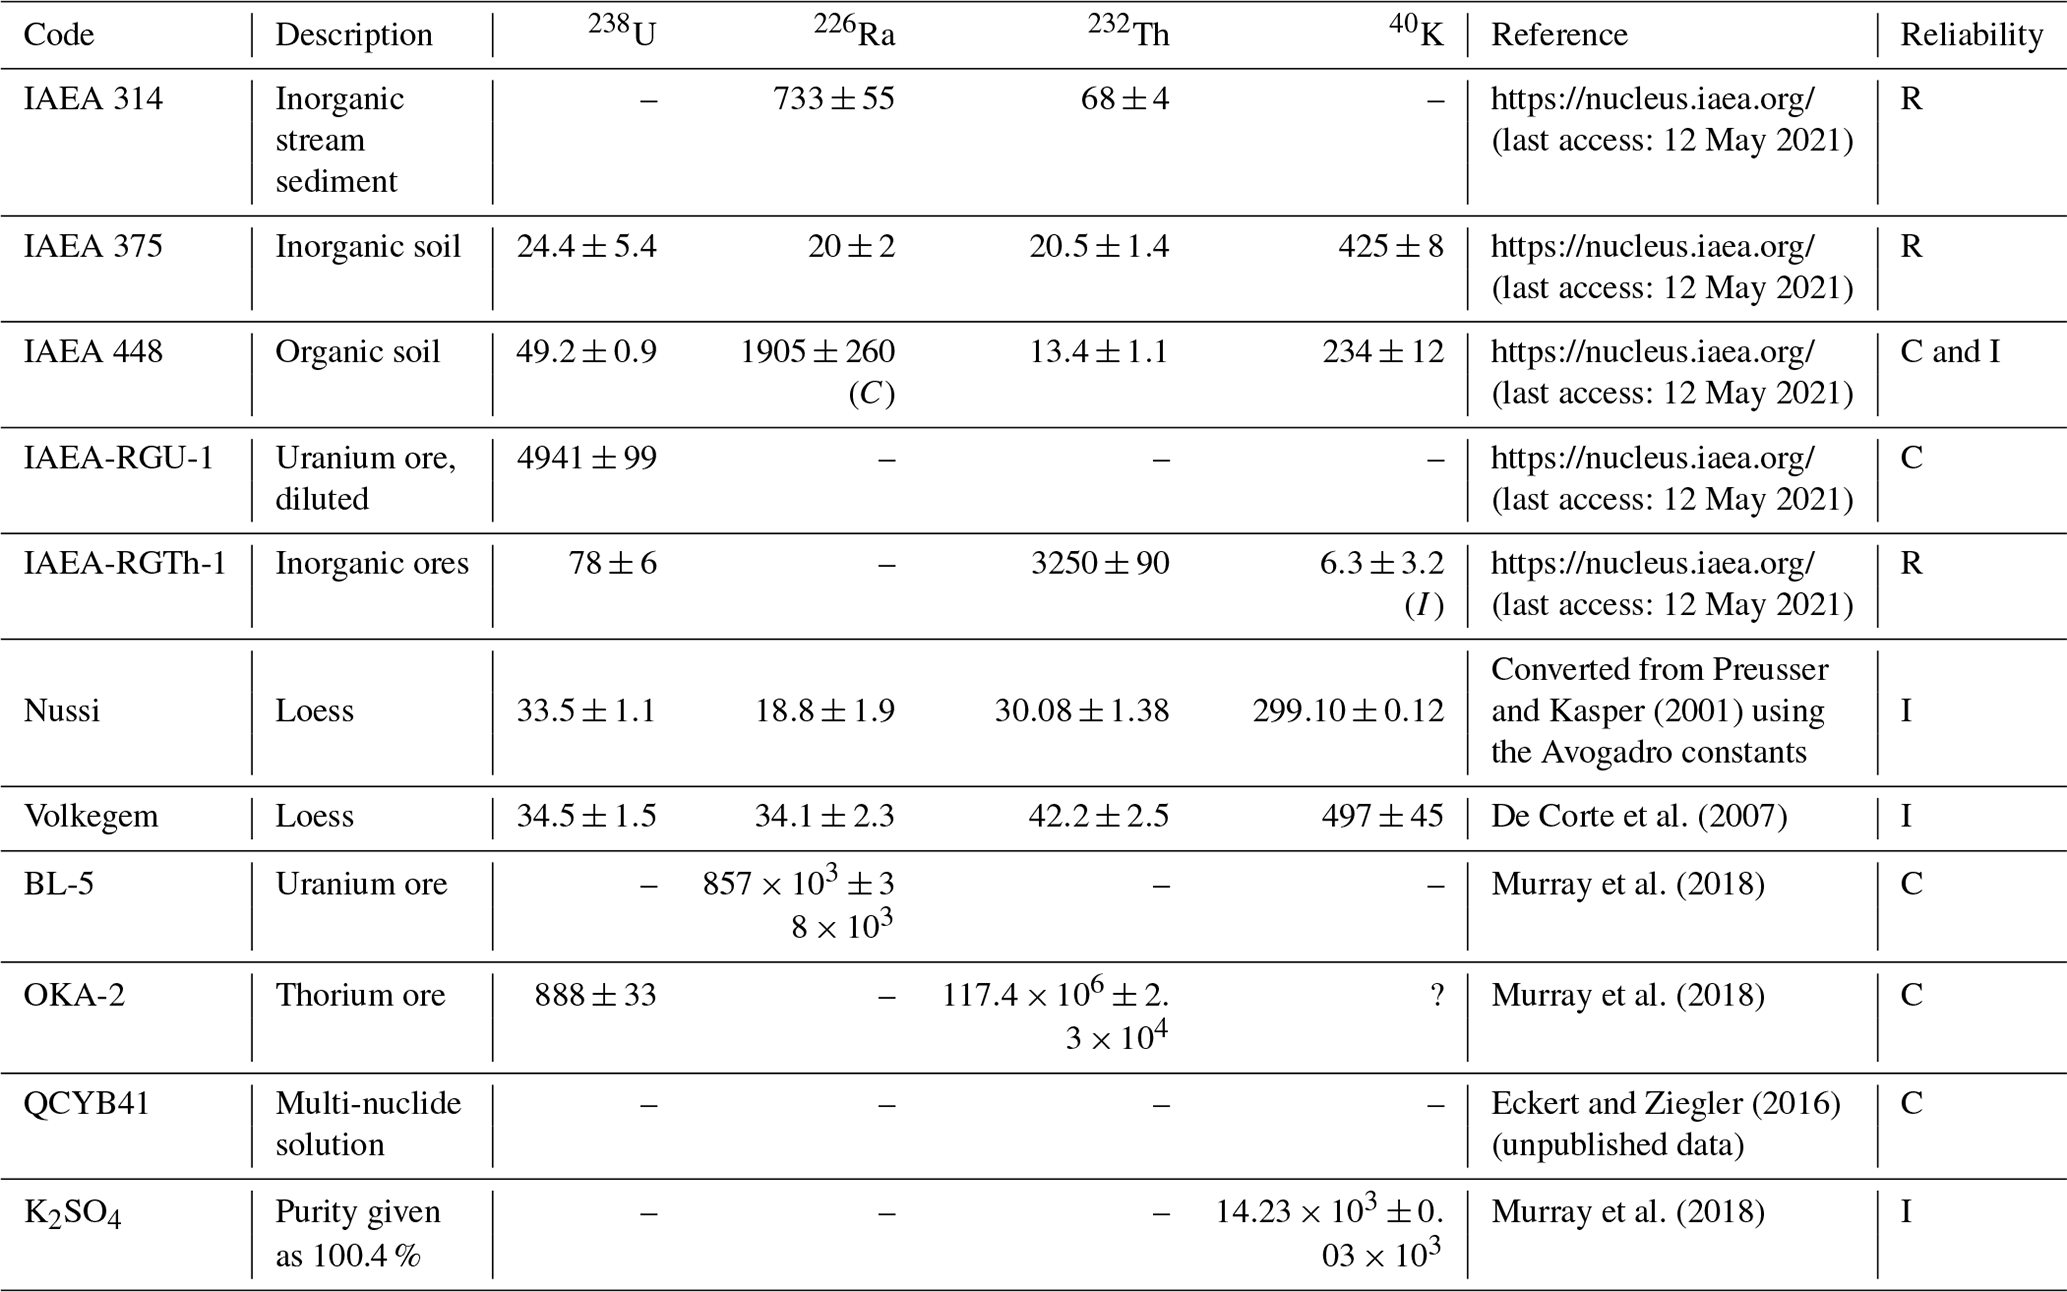
Table C2Reference material commonly used for efficiency calibration. Activities are given in Bq kg−1. R: recommended; C: certified; I: information.
The gamma spectrum of a given sample records emissions from both the sample and the background environment (including the detector itself). They include (a) discrete full-energy peaks at photon energies specific to individual radionuclides (whether from the sample or from the background environment) and (b) a more or less continuous spectrum of partial-energy interactions arising from various scattering processes. Most software will calculate both the total number of interactions within the boundaries of each photopeak (the gross area, including those due to scattering) and the number of full-energy interactions (the net area) by subtracting those due to scattering from the gross area. The contribution of the background environment to the net peak area can be determined from “background counts” carried out without a sample being present. Writing NT for the net counts in the peak with the sample present and NB for the background contribution, the number attributable to the sample itself will be .
The activity (A) of the radionuclide can be calculated using the formula
where m is the mass of the sample, T the count time, Pγ the gamma emission probability, and η a practical efficiency that takes account of not only the full energy efficiency of the detector at that energy, but also the effects of factors such as self-absorption and, where necessary, true coincidence summing (Gilmore, 2008). The effects of self-absorption can be minimized by limiting the sample size.
A procedure that avoids many difficulties is using a reference material of known activity with similar self-absorption characteristics as that of the sample, having exactly the same geometry. Activities in the sample can then be calculated by direct comparison with the reference material using the equation
Equation (C2) is valid on a peak-by-peak basis, which requires Areference to be known for each peak of interest. Alternatively, if Areference is only known for 238U, all members of the 238U series in both the reference material and unknown sample have to be in secular equilibrium. In this case the activity can in principle be determined using any of the photopeaks listed in Table 2. In practice some peaks are more suitable then others depending on the sensitivity of the peak to the sample's Z and density as well as on detector-specific parameters such as energy resolution and full-energy peak efficiency.
-
Non-certified internal standard material
Two loess samples, namely Volkegem (De Corte et al., 2007) and Nussi (Preusser and Kasper, 2001), have previously been proposed as suitable standard material. Loess is a sedimentary deposit resulting from the accumulation of wind-blown dust. Typically, a loess deposit is several metres thick and composed of 20–40 µm grains. The grains comprise minerals such as feldspars, quartz, and heavy minerals in percentages representative for the provenance areas. Loess is mostly transported over long distances and over large areas, hence carrying the signature of a significant proportion of the Earth's surface, which is then homogeneously distributed in the accumulation. In fact, while grain size may vary between outcrops, radionuclide activity concentrations are strikingly similar (see e.g. Scheidt et al., 2021, for the Carpathian loess; Roberts et al., 2003, for North American loess; Sauer et al., 2016, for central European loess; Lü et al., 2020, for Chinese loess).
Volkegem – this material is derived from a loess deposit in Belgium (De Corte et al., 2007).
Nussi – this material is derived from a loess deposit in southern Germany (Preusser and Kasper, 2001). The material is registered with the International Association of Geoanalysts (http://www.geoanalyst.org, last access: 22 February 2018) as “Loess-1 GeoPT13” with assigned chemical values for all low-mass elements (Potts et al., 2003).
Both samples have been tested in several luminescence laboratories. Here we provide details for the Volkegem material – see Table C1.
-
Certified reference material
Table C2 lists a number of materials commonly used for efficiency calibration. It should be noted that some of these materials entail problems; for instance, some radionuclides included in the QCYK multi-nuclide reference material exhibit true coincidence summing when measured close to the detector (Gilmore, 2008), and this limits the usage of some energy lines.
We compared two different efficiency calibration methods using the coaxial (n) detector of this study described in Table 1: one uses the multi-nuclide reference solution QCYB41 and follows Eq. (C1). The other one is based on the direct comparison with the Volkegem reference material using Eq. (C2). A total of 81 samples with different activities originating from geochemically variable environments were used for the comparative study. Almost perfect agreement exists for energy lines 1460, 338, 352, 609, 911, and 46 keV. Systematic differences appear for energy lines 63 and 238 keV (Mauz et al., 2021). These results suggest that accurate activity data are obtained from the simple comparison with the Volkegem internal standard as long as suitable energy peaks are selected to determine the parent nuclide.
-
Software suitable to analyse full-energy peak efficiency
Canberra LabSOCS application note: http://canberra.com/literature/application-notes.asp (last access: 18 July 2018).
Ortec ANGLE user guide: https://www.ortec-online.com/ (last access: 3 April 2022).
Overlaps between neighbouring peaks will occur where photopeaks are separated by less than around 2.5 times the FWHM value: that is, between 4 and 5 keV. An example is the 226Ra peak at 186.2 keV, which is separated from the nearby 235U peak at 185.7 keV by just 0.5 keV. Most modern high-resolution detectors are incapable of separating them and will record them as a single peak. When the separation is greater and two overlapping peaks can be distinguished, it may be possible to apportion the total area between the two. One method is to assign fractions based on the areas below the lower peak and above the upper peak.
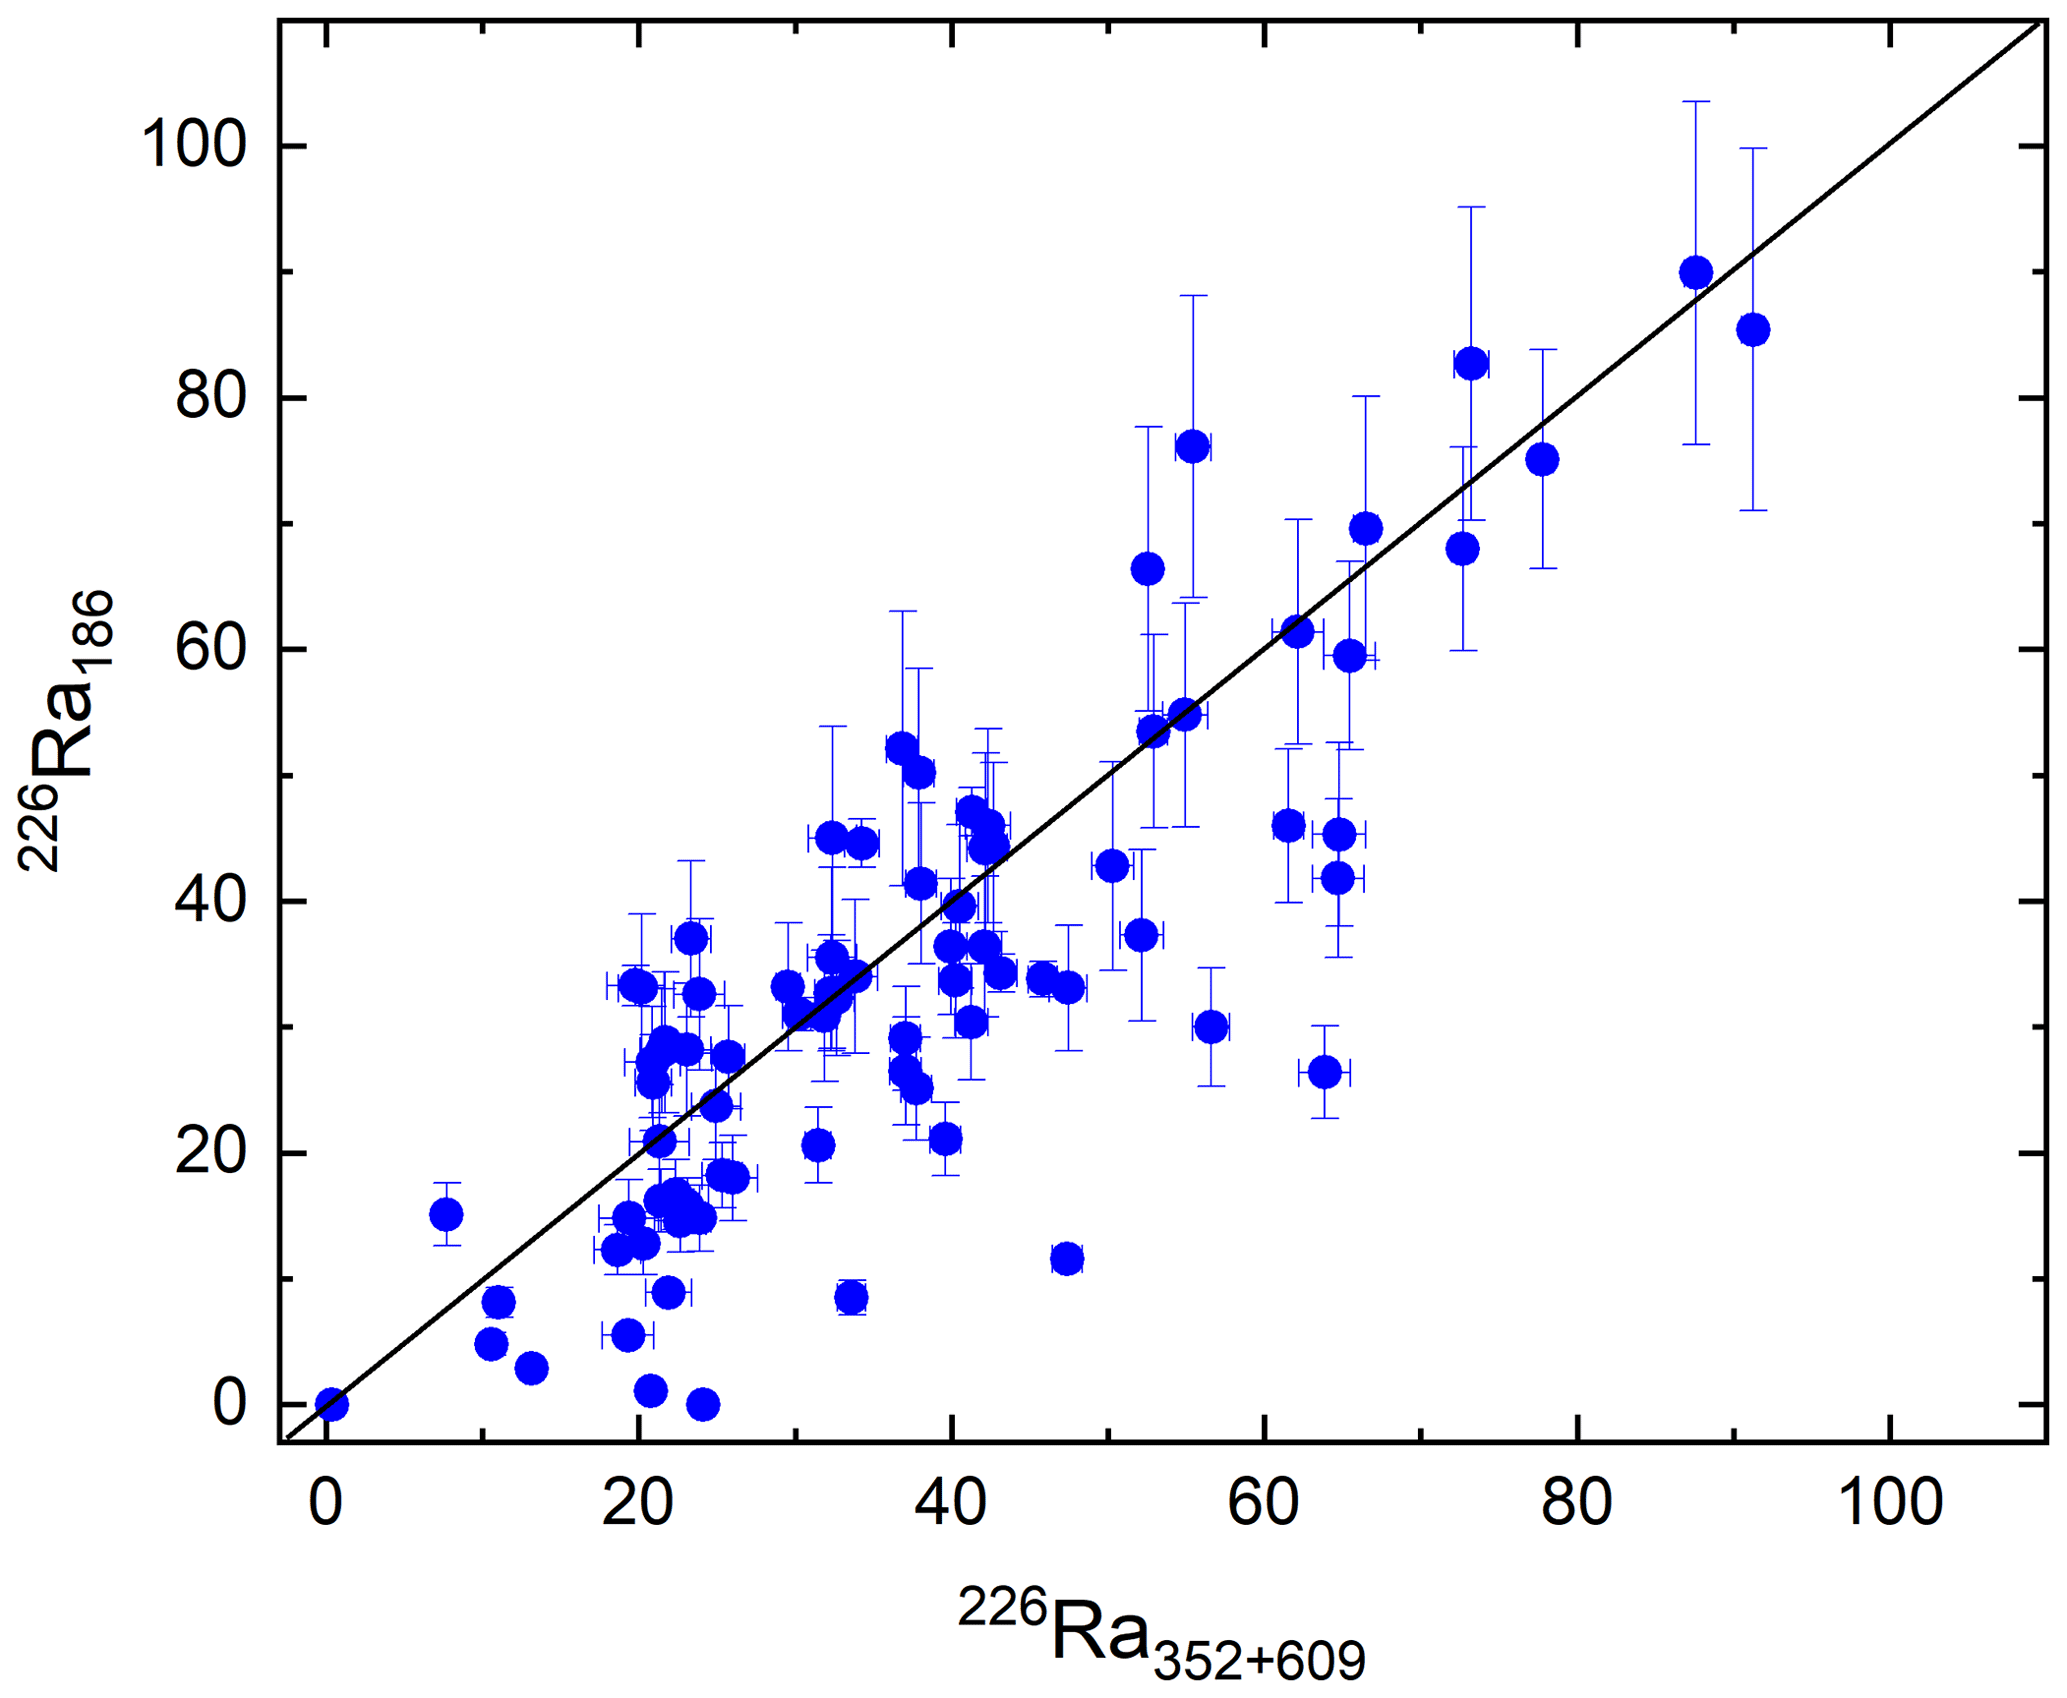
Figure D1Comparing activity data (Bq kg−1) obtained from the photopeak at 186 keV. Each blue dot represents a sample in relation to the 1:1 black line. 226Ra186 activity is derived from Eq. (C1) corrected for the activity of 235U directly inferred from its peak at 144 keV and plotted versus the weighted mean of activities derived from the 226Ra daughters emitting 352 and 609 keV.
Although 238U does not have significant gamma emissions itself, it will normally be in radioactive equilibrium with its short-lived daughter 234Th (half-life 24.1 d). 234Th has two significant photopeaks at around 63.3 and 92.6 keV, though both are in fact composite peaks. The 92.6 keV gamma line includes two separate 234Th peaks at 92.4 and 92.8 keV, a small 235U peak at 93.4 keV, two 231Th peaks at 92.3 and 93.0 keV, and X-rays (Huy and Luyen, 2005). 226Ra activity is best determined using one of the peaks of its short-lived daughter radionuclides 214Pb or 214Bi. 235U may either be determined via its peaks at 144 and 205 keV or, in natural samples, from the established activity ratio with 238U. See also De Corte et al. (2005) and https://www.nndc.bnl.gov/ (last access: 10 August 2021). In practice, the methods available for correcting the 186 keV emission deliver ambiguous results (e.g. Fig. C1). The correction procedure should therefore be replaced by the use of software in which a detailed detector characterization is combined with the MCNP Monte Carlo modelling code (see Appendix C for software references).
-
Software suitable to analyse overlapping photopeaks
https://radware.phy.ornl.gov/gf3/gf3.html (last access: 3 April 2022)
This work used licenced third-party software provided by the manufacturers of gamma spectrometers. The Mirion (former Canberra) application notes are accessible at https://www.mirion.com/learning-center/application-notes (Mirion, 2022). The Ortec software package is described at https://www.ortec-online.com (last access: 7 April 2022). The RadWare software is accessible at https://radware.phy.ornl.gov/gf3/gf3.html (Radford, 2000).
Attenuation coefficients for various photon energies and materials are listed in Hubbell and Seltzer (2004). Photon energies and emission probabilities for key members of the 238U series and the 232Th series can be accessed at the NUDAT database, version 3.0, at https://www.nndc.bnl.gov/nudat3/ (Kinsey et al., 1997). Activities of reference material are available at https://nucleus.iaea.org/sites/ReferenceMaterials/Pages/Index-for-Radionuclides.aspx (International Atomic Energy Agency, 2021). Data of other reference material are listed in Murray et al. (2018), Preusser and Kasper (2001), and De Corte et al. (2007).
BM designed the work and wrote the text; PGA and PJN oversaw text and figures dealing with gamma radiation, instruments, and associated equations.
The contact author has declared that neither they nor their co-authors have any competing interests.
Publisher's note: Copernicus Publications remains neutral with regard to jurisdictional claims in published maps and institutional affiliations.
This work was facilitated by Sumia Abdualhadi, who studied the quantification of U-series disequilibrium using gamma spectrometry in her PhD. Barbara Mauz is grateful for the continuous support provided by Alexander Hubmer and Chiara Bahl (University of Salzburg).
This paper was edited by Sumiko Tsukamoto and reviewed by Guillaume Guérin and one anonymous referee.
Abdualhadi, S. A.: Quantifying disequilibrium in U-series decay using high-purity germanium spectrometry, PhD thesis, University of Liverpool, https://livrepository.liverpool.ac.uk/3004531/ (last access: 3 April 2022), 2016.
Abdualhadi, S. A., Mauz, B., Joss, S. D. T, and Nolan, P.: Detecting and quantifying uranium-series disequilibrium in natural samples for dosimetric dating applications, Radiat. Meas., 114, 25–31, https://doi.org/10.1016/j.radmeas.2018.04.011, 2018.
Aguiar, J. C., Galiano, E., and Fernandez, J.: Peak efficiency calibration for attenuation corrected cylindrical sources in gamma ray spectrometry by the use of a point source, Appl. Radiat. Isotopes, 64, 1643–1647, https://doi.org/10.1016/j.apradiso.2006.05.014, 2006.
Appleby P. G., Richardson, N., and Nolan, P. J.: Self-absorption corrections for well-type germanium detectors, Nucl. Instrum. Meth. B, 71, 228–233, 1992.
Barrera, M., Suarez-Llorens, A., Casas-Ruiz, M., Alonso, J. J., and Vidal, J.: Theoretical determination of gamma spectrometry systems efficiency based on probability functions, Application to self-attenuation correction factors, Nucl. Instrum. Meth. A, 854, 31–39, https://doi.org/10.1016/j.nima.2017.02.052, 2017.
Bruggeman, M., Verheyen, L., Vidmar, T., and Liu, B.: Assessing sample attenuation parameters for use in low-energy efficiency transfer in gamma-rayspectrometry, Appl. Radiat. Isotopes, 109, 547–550, https://doi.org/10.1016/j.apradiso.2015.11.077, 2016.
De Corte, F., Umans, H., Vandenberghe, D., De Wispelaere, A., and Van den Haute, P.: Direct gamma-spectrometric measurement of the 226Ra 186.2 keV line for detecting 238URa disequilibrium in determining the environmental dose rate for the luminescence dating of sediments, Appl. Radiat. Isotopes, 63, 589–598, https://doi.org/10.1016/j.apradiso.2005.05.008, 2005.
De Corte, F., Vandenberghe, D., Hossain, S. M., De Wispelaere, A., Buylaert, J.-P., and Van den Haute, P.: Preparation and characterization of loess sediment for use as a reference material in the annual radiation dose determination for luminescence dating, J. Radioanal. Nucl. Ch., 272, 311–319, https://doi.org/10.1007/s10967-007-0522-5, 2007.
Degering, D. and Degering, A.: Change is the only constant – time-dependent dose rates in luminescence dating, Quat. Geochronol., 58, 101074, https://doi.org/10.1016/j.quageo.2020.101074, 2020.
Gilmore, G.: Practical gamma spectrometry, 2nd edn., Wiley, West Sussex, https://doi.org/10.1002/9780470861981, 2008.
Guibert, P. and Schvoerer, M.: TL Dating: Low background gamma spectrometry as a tool for the determination of the annual dose, Nucl. Tracks Rad. Meas., 18, 231–238, 1994.
Hubbell, J. H.: Photon Mass Attenuation and Energy-absorption Coefficients from 1 keV to 20 MeV., Int. J. Appl. Radiat. Is., 33, 1269–1290, 1983.
Hubbell, J. H. and Seltzer S. M.: NIST Standard Reference Database 126, Tables of X-Ray Mass Attenuation Coefficients and Mass Energy-Absorption Coefficients from 1 keV to 20 MeV for Elements Z=1 to 92 and 48 Additional Substances of Dosimetric Interest, Radiation Physics Division, PML, NIST [data set], https://doi.org/10.18434/T4D01F, 2004.
Huy, N. Q. and Luyen, T. V.: A method to determine 238U activity in environmental soil samples by using 63.3-keV-photopeak-gamma HPGe spectrometer, Appl. Radiat. Isotopes, 61, 1419–1424, https://doi.org/10.1016/j.apradiso.2004.04.016, 2005.
Huy, N. Q., Binh, D. Q., An, V. X., Hong Loan, T. T., and Thanh Can, N.: Self-absorption correction in determining the 238U activity of soil samples via 63.3 keV gamma ray using MCNP5 code, Appl. Radiat. Isotopes, 71, 11–20, https://doi.org/10.1016/j.apradiso.2012.09.004, 2013.
International Atomic Energy Agency: Reference Materials characterized for Radionuclides, IAEA [data set], https://nucleus.iaea.org/sites/ReferenceMaterials/Pages/Index-for-Radionuclides.aspx (last access: 12 May 2021), 2021.
Kaminski, S., Jakobi, A., and Wilhelm, C.: Uncertainty of gamma-ray spectrometry measurement of environmental samples due to uncertainties in matrix composition, density and sample geometry, Appl. Radiat. Isotopes, 94, 306–313, https://doi.org/10.1016/j.apradiso.2014.08.008, 2014.
Khater, A. E. M. and Ebaid, Y. Y.: A simplified gamma-ray self-attenuation correction in bulk samples, Appl. Radiat. Isotopes, 66, 407–413, https://doi.org/10.1016/j.apradiso.2007.10.007, 2008.
Kinsey, R. R., Dunford, C. L., Tuli, J. K., and Burrows, T. W.: The NUDAT/PCNUDAT program for nuclear data, in: Gamma-ray spectroscopy and related topics, edited by: Molnar, G. L., Belgya, T., and Revay, Zs., Springer, Budapest, 657–661, ISBN 963-7775-55-2, 1997 (data available at: https://www.nndc.bnl.gov/nudat3/, last access: 10 August 2021).
Lü , T., Sun, J., Feathers, J. K., and Sun, D.: Spatiotemporal variations and implications of luminescence sensitivity of quartz grains on the Chinese Loess Plateau since the last interglaciation, Quaternary Res., 99, 190–203, https://doi.org/10.1017/qua.2020.53, 2020.
Mauz, B., Hubmer, A., Bahl, C., Lettner, H., and Lang, A.: Comparing two efficiency calibration methods used in gamma spectrometry, Ancient TL, 39, 12–17, http://ancienttl.org/ATL_39.htm#December (last access: 20 January 2022), 2021.
Mirion: Application Notes, Mirion [code], https://www.mirion.com/learning-center/application-notes, last access: 7 April 2022.
Murray, A., Buylaert, J.-P., and Thiel, C.: A luminescence dating intercomparison based on a Danish beach-ridge sand, Radiat. Meas., 81, 32–38, https://doi.org/10.1016/j.radmeas.2015.02.012, 2015.
Murray, A., Helsted, L. M., Autzen, M., Jain, M., and Buylaert, J.-P.: Measurement of natural radioactivity: Calibration and performance of a high-resolution gamma spectrometry facility, Radiat. Meas., 120, 215–220, https://doi.org/10.1016/j.radmeas.2018.04.006, 2018.
Murray, A. S. and Aitken, M. J.: Analysis of low-level natural radioactivity in small mineral samples for use in thermoluminescence dating, using high-resolution gamma spectrometry, Appl. Radiat. Isotopes, 39, 145–158, 1988.
Preusser, F. and Kasper, H. U.: Comparison of dose rate determination using high-resolution gamma spectrometry and inductively coupled plasma-mass spectrometry, Ancient TL, 19, 19–23, 2001.
Radford, D. C.: Notes on the use of the program gf3, Radware [code], https://radware.phy.ornl.gov/gf3/gf3.html (last access: 3 April 2022), 2000.
Roberts, H. M., Muhs, D. R., Wintle, A. G., Duller, G. A. T., Arthur Bettis III, E.: Unprecedented last-glacial mass accumulation rates determined by luminescence dating of loess from western Nebraska, Quaternary Res., 59, 411–419, 2003.
Sauer, D., Kadereit, A., Kühn, P., Kösel, M., Miller, C. E., Shinonaga, T., Kreutzer, S., Herrmann, L., Fleck, W., Starkovich, B. M., and Stahr, K.: The loess-palaeosol sequence of Datthausen, SW Germany: Characteristics, chronology, and implications for the use of the Lohne Soil as a marker soil, Catena, 146, 10–29, https://doi.org/10.1016/j.catena.2016.06.024, 2016.
Scheidt, S., Berg, S., Hambach, U., Klasen, N., Pötter, S., Stolz, A., Veres, D., Zeeden, C., Brill, D., Brückner, H., Kusch, S., Laag, C., Lehmkuhl, F., Melles, M., Monnens, F., Oppermann, L., Rethemeyer, J., and Nett, J. J.: Chronological assessment of the Balta Alba Kurgan loess-paleosol section (Romania) – A comparative study on different dating methods for a robust and precise age model, Front. Earth Sci., 8, 598448, https://doi.org/10.3389/feart.2020.598448, 2021.
Tudyka, K., Porȩba, G., Szymak, A., Rocznik, J., Pluta, J., Schüler, T., Kolb, T., and Murray, A.: Systematic error in 238U decay chain radionuclides measurements due to 222Rn emanation from reference materials, Measurement, 184, 109893, https://doi.org/10.1016/j.measurement.2021.109893, 2021.
- Abstract
- Introduction
- Gamma radiation and gamma spectrum
- Detector and instrumentation
- Sample preparation and measurement geometries
- Data analysis
- Quantifying U-series radionuclides for the detection of secular disequilibrium
- Summary
- Appendix A: Penetration depth and attenuation of gamma rays
- Appendix B: Measurement geometry
- Appendix C: Background, efficiency calibration, and reference material
- Appendix D: Peak interference
- Code availability
- Data availability
- Author contributions
- Competing interests
- Disclaimer
- Acknowledgements
- Review statement
- References
Please read the editorial note first before accessing the article.
- Article
(4918 KB) - Full-text XML
- Abstract
- Introduction
- Gamma radiation and gamma spectrum
- Detector and instrumentation
- Sample preparation and measurement geometries
- Data analysis
- Quantifying U-series radionuclides for the detection of secular disequilibrium
- Summary
- Appendix A: Penetration depth and attenuation of gamma rays
- Appendix B: Measurement geometry
- Appendix C: Background, efficiency calibration, and reference material
- Appendix D: Peak interference
- Code availability
- Data availability
- Author contributions
- Competing interests
- Disclaimer
- Acknowledgements
- Review statement
- References