the Creative Commons Attribution 4.0 License.
the Creative Commons Attribution 4.0 License.
 | 22 Sep 2023
Differential bleaching of quartz and feldspar luminescence signals under high-turbidity conditions
Wolfgang Schwanghart
Anna-Maartje de Boer
Tony Reimann
Sediment burial dating using optically stimulated luminescence (OSL) is a well-established tool in geochronology. An important but often inapplicable requirement for its successful use is that the OSL signal is sufficiently reset prior to deposition. However, subaqueous bleaching conditions during fluvial transport are vastly understudied; for example the effect of turbidity and sediment mixing on luminescence bleaching rates is only poorly established. The possibility that slow bleaching rates may dominate under certain transport conditions led to the concept that OSL could be used to derive sediment transport histories. The feasibility of this concept is still to be demonstrated, and experimental set-ups are still to be tested. Our contribution to this scientific challenge involves subaquatic bleaching experiments, in which we suspend saturated coastal sand of Miocene age in a circular flume and illuminate it for discrete time intervals with natural light. We record the in situ energy flux density received by the suspended grains in the UV-NIR frequency range by using a broadband spectrometer with a submersible probe. Our analysis includes pre-profiling of each sample following a polymineral multiple signal (PMS) protocol. Using the PMS, the quartz-dominated, blue-stimulated luminescence signal at 125 ∘C (BSL-125) decays slower than the K-feldspar-dominated, infrared-stimulated luminescence signal at 25 ∘C (IR-25) even under subaerial conditions. The BSL-125 from purified quartz shows the opposite behaviour, which renders the PMS unreliable in our case. We find a negative correlation between suspended-sediment concentration and bleaching rate for all the measured signals. For outdoor bleaching experiments we propose to relate the measured luminescence dose to the cumulative received irradiance rather than to the bleaching time. Increases in the sediment concentration lead to a stronger attenuation of the UV–blue compared to the red–NIR wavelength. This attenuation thereby follows an exponential decay that is controlled by the sediment concentration and a wavelength-dependent decay constant, λ. As such λ could potentially be used in numerical models of luminescence signal resetting in turbid suspensions.
- Article
(7232 KB) - Full-text XML
-
Supplement
(216945 KB) - BibTeX
- EndNote


The natural luminescence of quartz and feldspar is widely used in geochronology to determine burial ages, i.e. the time of sediment deposition and burial (Huntley et al., 1985; Roberts and Lian, 2015). Geochronological methods that exploit luminescence thereby rely on the ability of quartz and feldspar to trap charges from the naturally occurring ionizing irradiation while buried. The rate at which the minerals trap charges is governed by the concentration and type of radioactive isotopes (mainly 40K) and radioisotopes within the U and Th decay chains in the surrounding sediment and the type of charge-trapping heterogeneities in the crystal lattice. Upon exposure to sunlight or to an artificial light source, the charges recombine, and the stored energy is released, a process referred to as bleaching or zeroing. The bleaching is accompanied by the emission of photons, whose amount (light intensity) is proportional to the charge-acquisition time, hence the duration of burial. Since the number of traps is finite, the grain can attain a state of “saturation”. Upon saturation, no more charges can be acquired, and the “luminescence clock” stops ticking.
A main assumption of this dating method is that the luminescence signal of the sediment grains is reset during transport or during the residence at the surface before burial; i.e. no luminescence from previous irradiation episodes is inherited. However, many geomorphic processes such as mass-wasting processes, long-shore drift or fluvial transport may lead to very brief exposures of the sediments to sunlight (Rittenour, 2008; Fuchs and Lang, 2009). In fluvial settings, for example, individual grains often experience only limited bleaching prior to deposition, which implies that their ages can be overestimated (Wallinga, 2002). This remnant luminescence signal that is also commonly observed in modern alluvium (Murray et al., 1995; Jain et al., 2004; McGuire and Rhodes, 2015a) and coastal sediments (Richardson, 2001; Jacobs, 2008; Alexanderson and Murray, 2012) has been attributed to limited bleaching due to the attenuation of light caused by high suspended-sediment loads and turbidity (Berger, 1990; Davies-Colley and Nagels, 2008; Reimann et al., 2015). For river systems dominated by sediment recycling the fraction of well-bleached grains in a sample has further been reported to increase with downstream transport distance (Porat et al., 2001; Stokes et al., 2001; Jain et al., 2004; McGuire and Rhodes, 2015b; Gray et al., 2018; Guyez et al., 2022). Albeit a limitation of luminescence dating of fluvial deposits, an increase in the amount of bleaching with transport distance would bear the possibility of offering insights into fluvial (McGuire and Rhodes, 2015a, b; Gray and Mahan, 2015; Gray et al., 2017) and coastal (Alexanderson and Murray, 2012; Ahmed et al., 2014; Reimann et al., 2015) transport conditions in terms of suspended-sediment concentration and/or particle velocity. However, there still exists a knowledge gap concerning the accurate quantification of such bleaching rates, which restrains the development of luminescence as a sediment tracer (Gray et al., 2019).
Previous studies suggested using the infrared-stimulated luminescence (IRSL) in feldspars for tracing subaqueous sediment transport (e.g. McGuire and Rhodes, 2015a) because this signal appears to bleach more slowly than the optically stimulated luminescence (OSL) from quartz (Godfrey-Smith et al., 1988). Following theoretical considerations, however, feldspar may not be the mineral of choice for subaqueous tracing if the turbidity reaches a certain threshold. First, the bleaching efficiency of quartz and feldspar varies for different parts of the light spectrum (Spooner, 1994a, b) as the ultraviolet (UV) and infrared (IR) spectra have different subaqueous transmission characteristics (Wallinga, 2002). While the bleaching efficiency of quartz OSL in the blue part of the UV–VIS spectrum (∼400 nm) is approximately 10 times higher than feldspar IRSL, the latter bleaches significantly more efficiently than quartz OSL for wavelengths exceeding 500 nm (Spooner, 1994a, b; Wallinga, 2002, Fig. 4 therein). The subaqueous transmission characteristic is controlled by the concentration and type of dissolved and/or suspended materials in the water (e.g. Berger and Luternauer, 1987; Ditlefsen, 1992; Wallinga, 2002; Sanderson et al., 2007). Secondly, while in pure water the attenuation length of UV is about 2 orders of magnitude larger than that of IR (Pope and Fry, 1997); this difference is reduced for clear ocean water (Bradner, 1992) and eventually inverts under turbid conditions (Gallegos et al., 1990). This implies that high suspended-sediment concentrations (Cs) and turbidity not only reduce the intensity of light received by the grains but also alter the shape of the light spectrum. The attenuating effect of an increase in turbidity may be disproportionately larger for the UV than for the IR wavelengths. The combined effects of water and sediment on light spectra and different bleaching behaviour of quartz and feldspar imply a threshold of Cs/turbidity beyond which the UV–blue-stimulated quartz OSL bleaches slower than the feldspar IRSL. Establishing such a threshold may eventually help to infer palaeoturbidities from differential bleaching of quartz and feldspar in fluvial deposits or other depositional environments with a significant contribution of subaquatic transport prior to burial (e.g. glacial–fluvial, shallow marine). To test this hypothesis and to quantify bleaching rates in sediment-laden water we conducted flume experiments with saturated coastal sand of Miocene age and registered the bleaching response of OSL and IRSL as a function of the Cs/turbidity and illumination time.
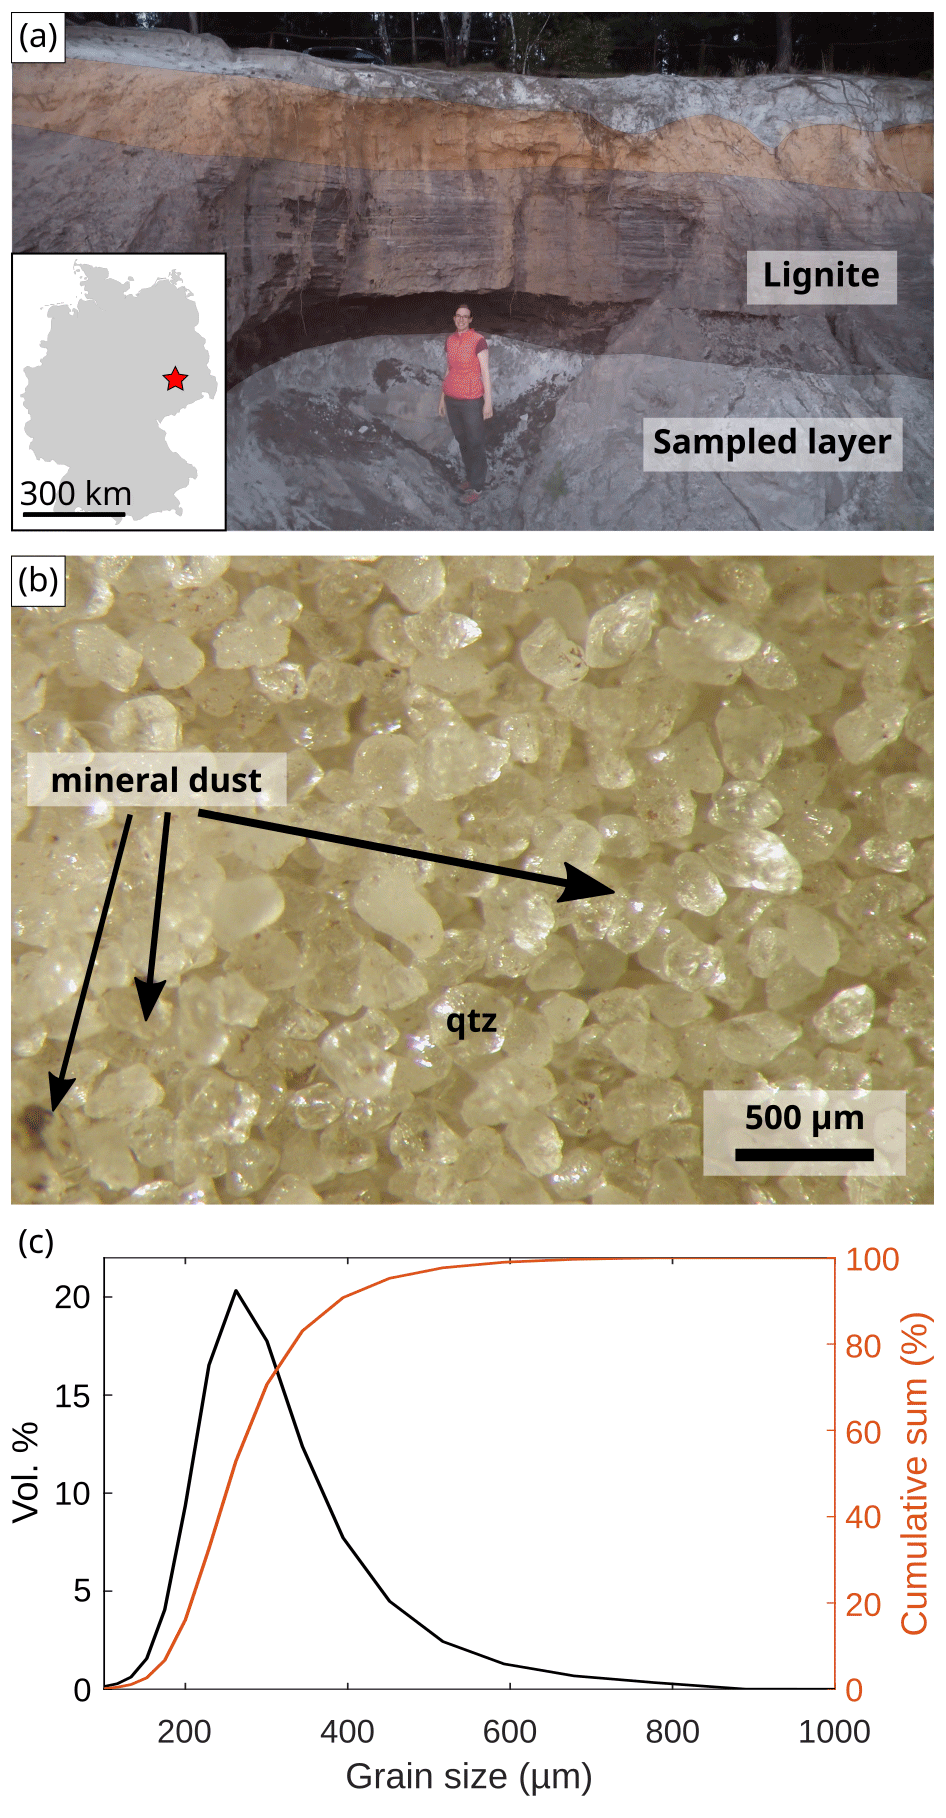
Figure 1Sample location. We sampled coastal sand of Miocene age (Stackebrandt and Franke, 2015) from an abandoned open coal pit in southern Brandenburg (a). The sampled layer is overlain by a prominent lignite horizon. The grains are composed of 99.5 % quartz and less than 0.5 % feldspar (b), and the size distribution is shown in (c). Dark-brown mineral dust is attached to some grains, which plays an important role in creating turbidity (see Sect. 4.2). The person in (c) is 170 cm tall.
2.1 Bleaching experiment and measurement of light spectra
The experimental character of this study required a large saturated sample containing quartz and feldspar that enabled us to measure OSL and IRSL within the same measurement sequence. We aimed for a saturated sample to maximize the stored energy and to reduce the uncertainty involved with using sediment with an unknown state of charge acquisition. We collected coastal sand of Miocene age from “Grube Gotthold” (51.5038∘ N, 13.5310∘ E), an abandoned open-pit coal mine near the village of Hohenleipisch in southern Brandenburg, Germany (Fig. 1; Stackebrandt and Franke, 2015). We sampled a homogeneous, weakly lithified and quartz-dominated horizon underlying a prominent bed of lignite. Sampling was conducted under red-light conditions during the night using a shovel and a light-proof cover. To obtain saturated material, we removed the outer ∼10 cm of the sediment before sampling. We conducted laser particle size analysis, X-ray diffractometry (XRD) and raster electron microscope microprobing (EDX). All experiments were conducted with the same kind of material, which is a well-sorted, fine to medium sand (125–500 µm) composed mainly of quartz (99.5 %) and a few feldspar grains (Fig. 1). A dark-brown coating is attached to some of the grains that is composed of quartz, halite, calcite, gypsum, magnesium calcite and anhydrite (see Fig. 1b and Supplement).
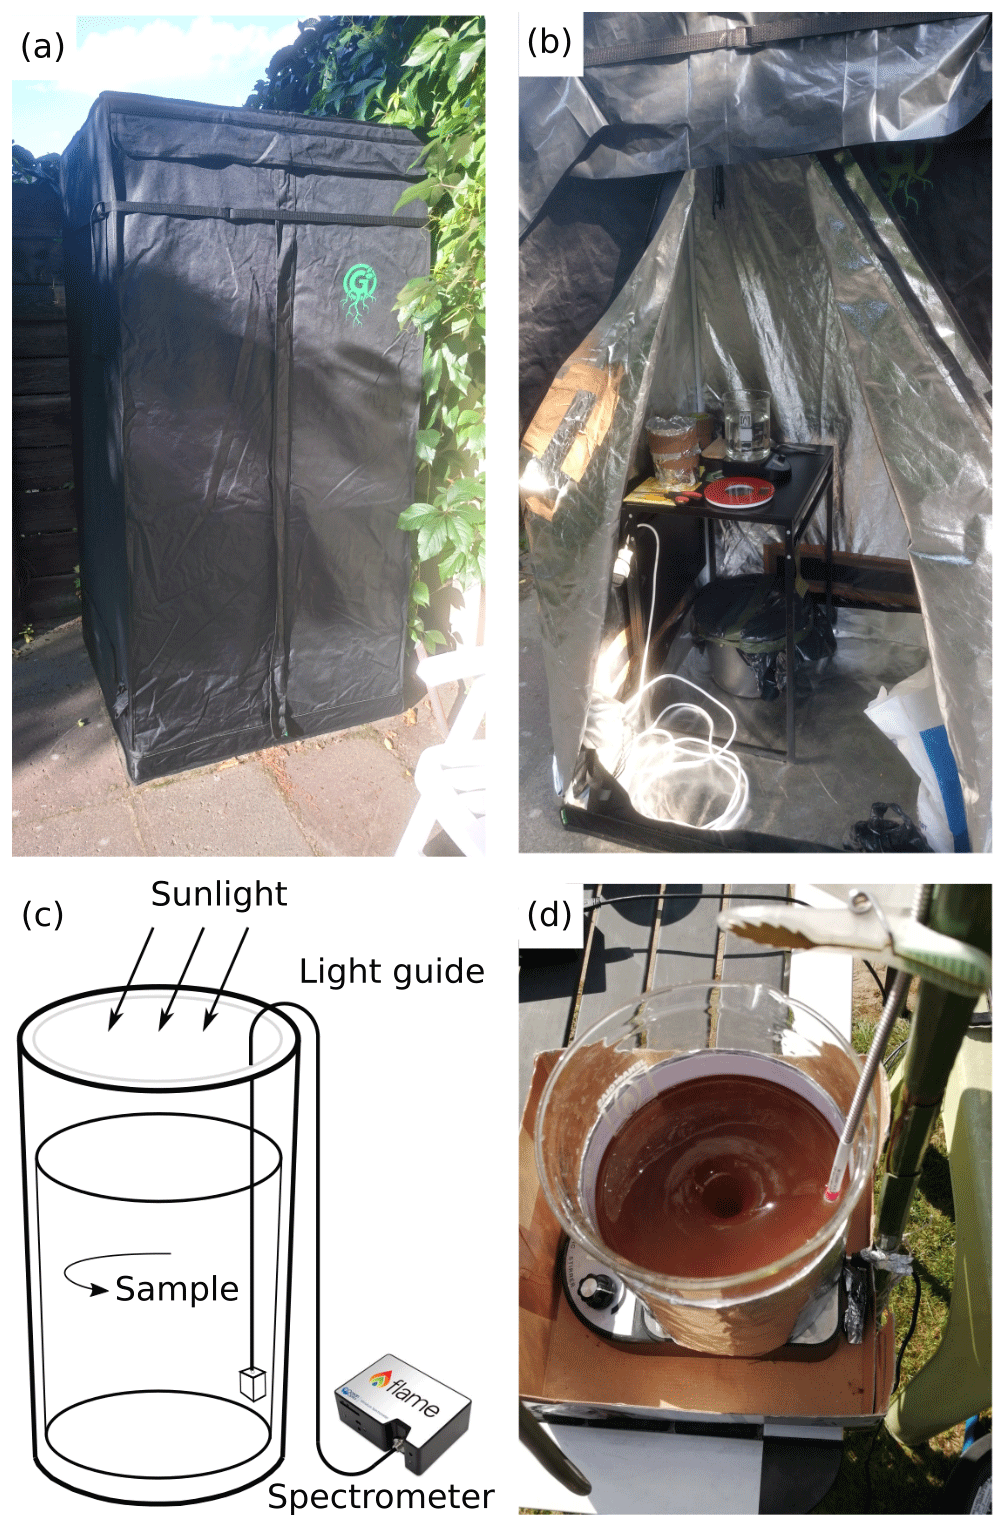
Figure 2Experimental set-up. We used a circular flume (c) and a light-proof tent (a) in an outdoor laboratory (b). Subaqueous solar irradiance was measured using a UV–IR spectrometer with a submersible probe (d). We conducted experiments with suspended-sediment concentrations of 10, 33, 66 and 100 g L−1 and illuminated for time intervals of 5 min to 5 h. After each exposure interval a sub-sample was extracted in the light-proof tent for OSL and IRSL analysis.
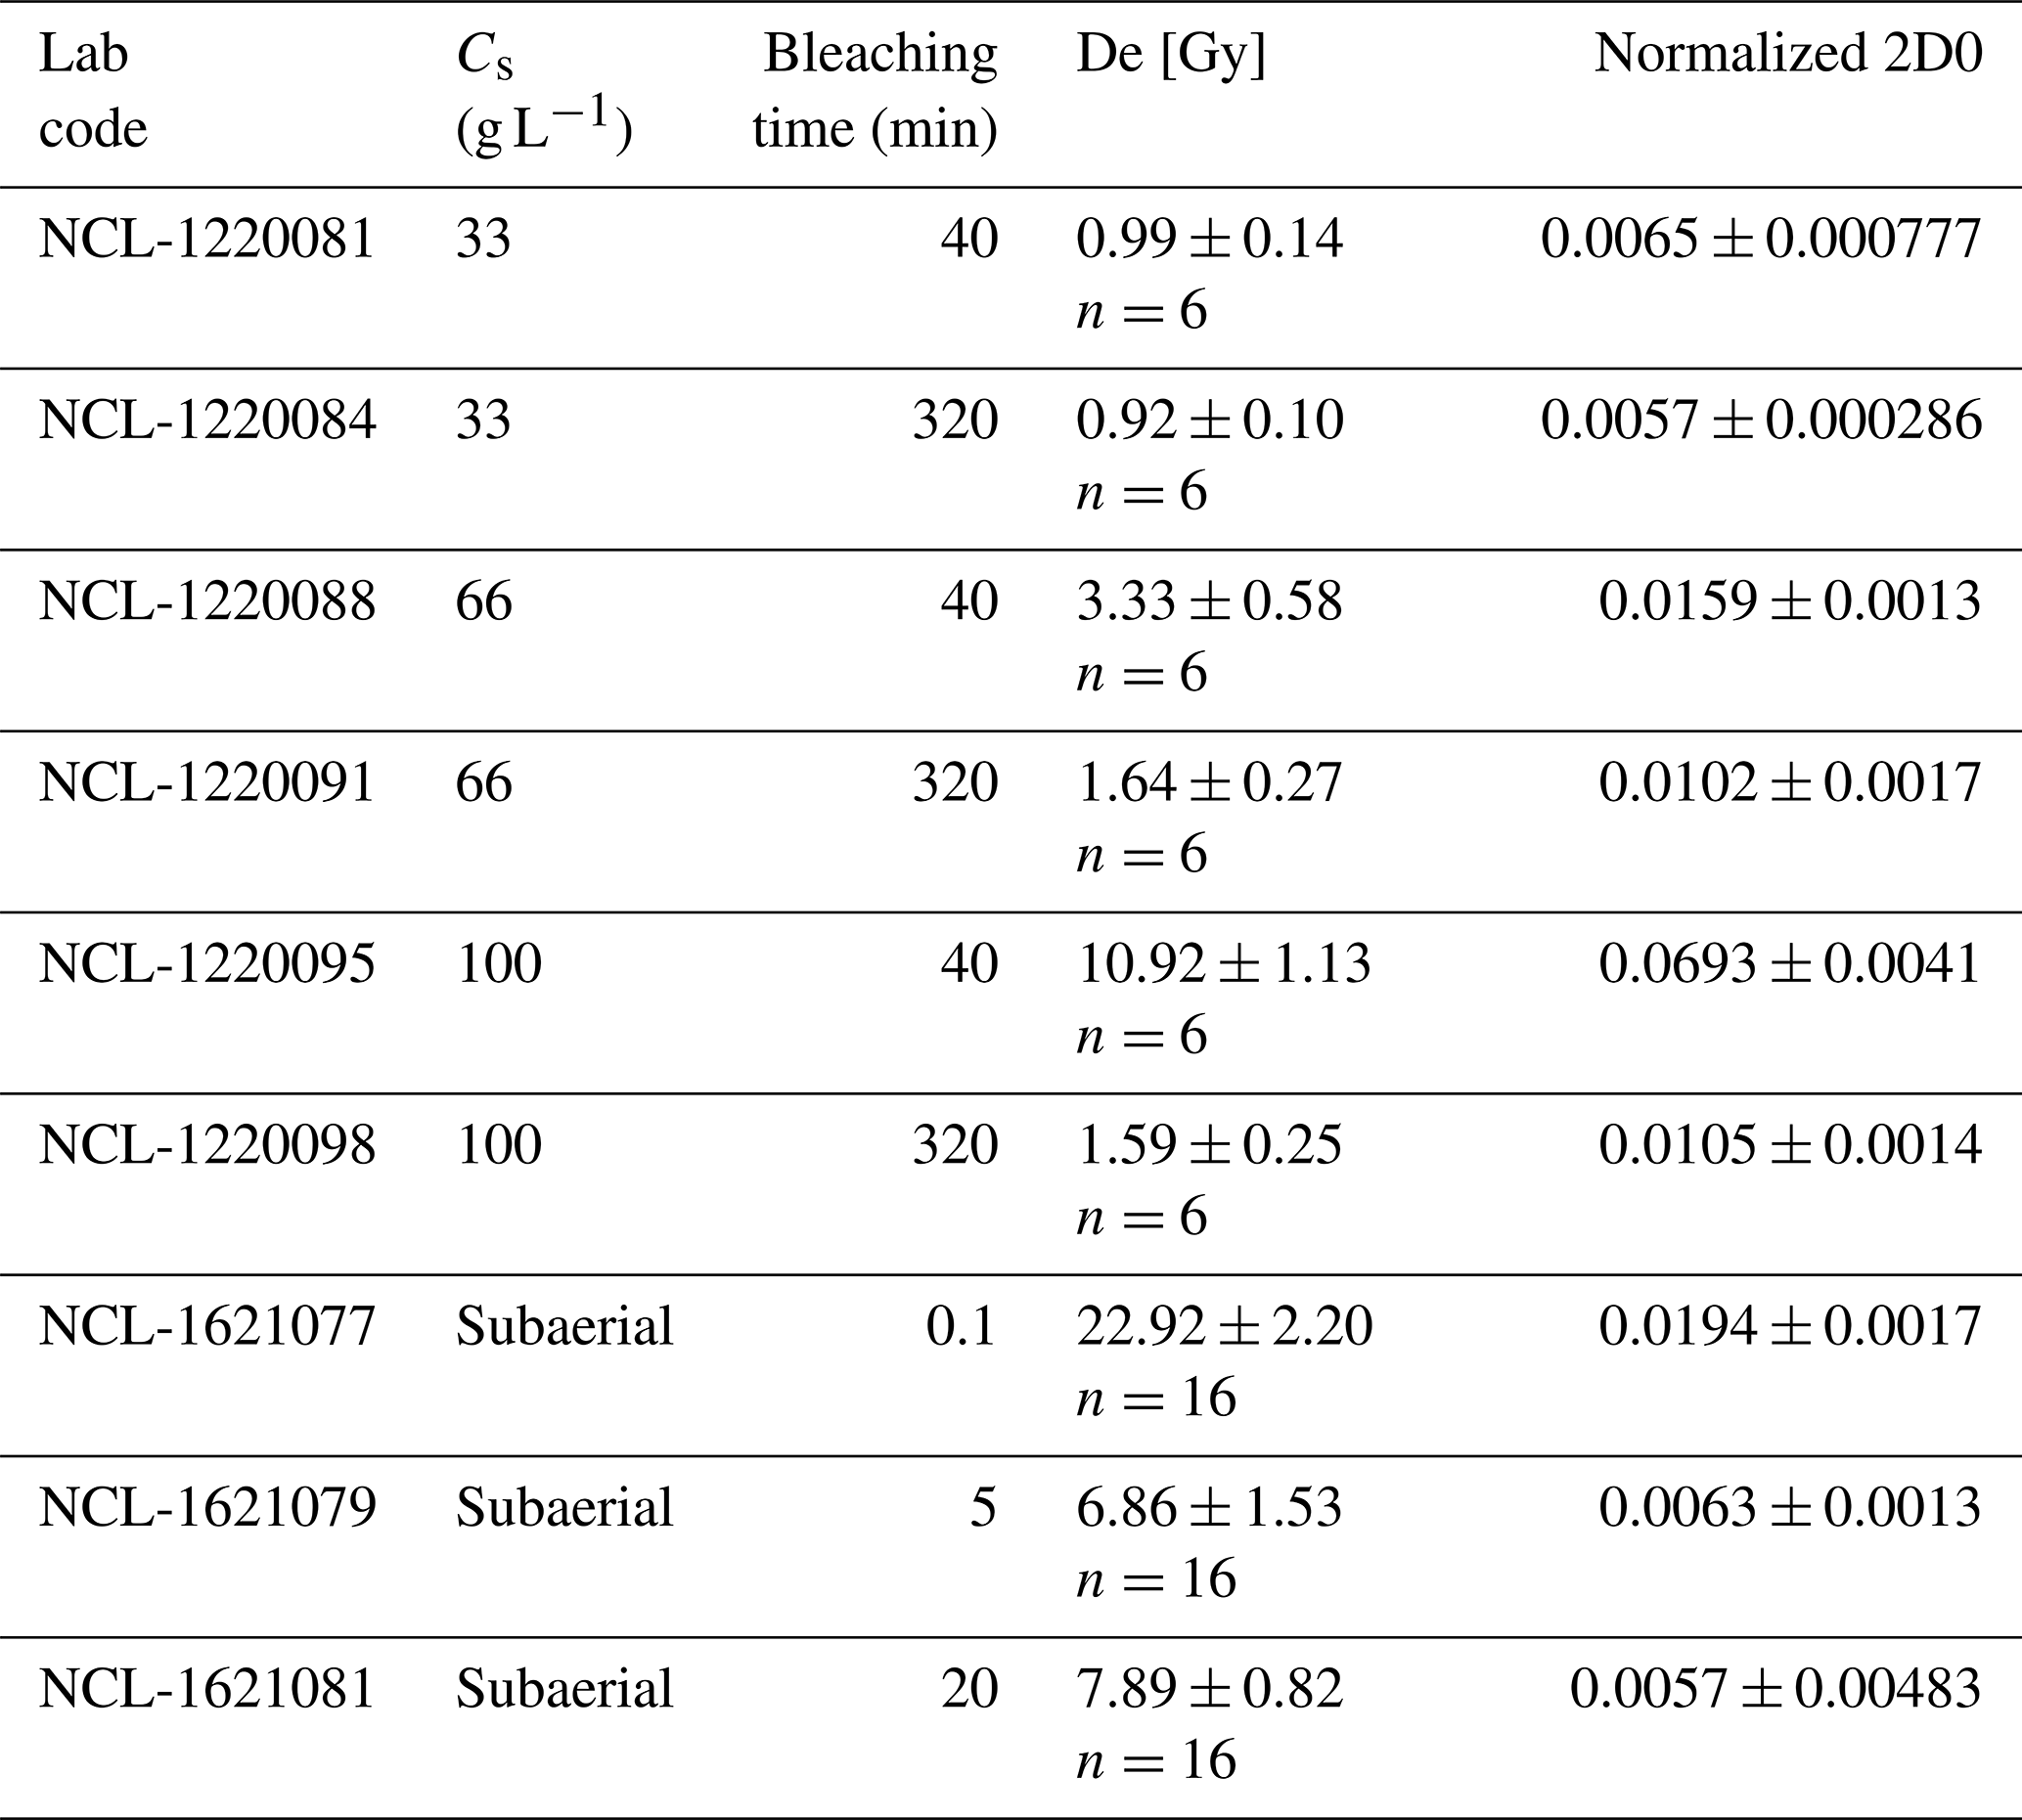
Table 1Experiments conducted in this study.
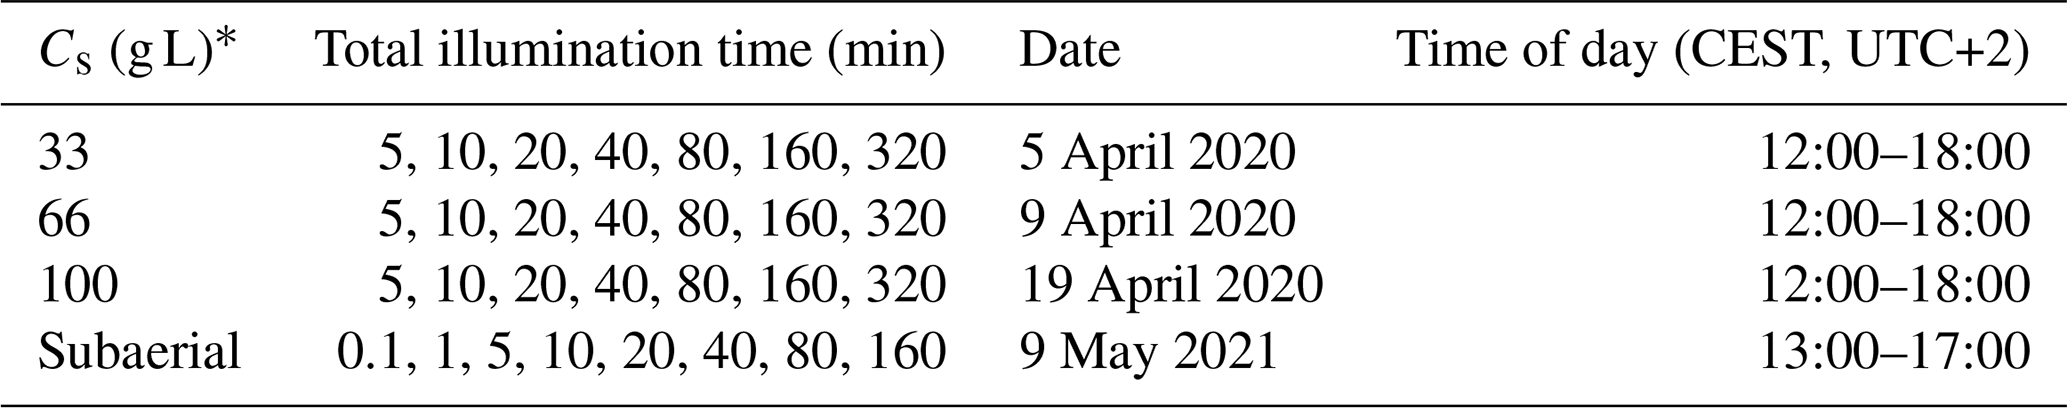
∗ Suspended-sediment concentration.
Our experimental set-up is similar to that of Gray et al. (2018) and uses natural light in an outdoor lab, which is more realistic than the use of a solar simulator (Höhnle SOL2 for example) in an indoor environment in terms of bleaching spectrum and bleaching light intensity. We induced circular flow within a glass cylinder filled with 1.5 L of clear tap water using a magnetic stirrer and added the sample under red-light conditions in a light-proof tent (Fig. 2). Next, the flume containing the sample was placed outside the tent for a certain time interval (Table 1). During the illumination period, the turn rate of the magnetic stirrer was adjusted so that all grains remained in suspension. Simultaneously, we measured the in situ intensity and wavelength of light received by the grains in the UV–NIR interval using an Ocean Insight Flame-T miniature spectrometer and a submersible probe. This set-up enabled us to account for variable illumination due to clouds and the change in the sun's elevation. The probe was lowered into the suspension to ∼3 cm above the bottom, where sediment concentration was high, and interaction with the magnet of the stirrer could be avoided. The water depth was ∼12 cm. The limited bending radius of the light guide connecting the probe with the spectrometer required the probe to look sideways towards the centre of the flume. The probe itself posed an obstacle to the flow that induced turbulence and caused mixing of the grains throughout the water column. To ensure that light entered the flume exclusively from the top, we wrapped the cylinder in a non-transparent foil with a diffuse reflecting side directed inwards. Excluding light penetration from the sides does lower the overall radiance but prevents contamination of the light by scattering from anthropogenic surfaces, e.g. buildings. Moreover, light from the sides would directly hit the grains that are travelling along the inner wall of the container, which may offset the imposed turbidity. After each bleaching interval we returned the flume back into the dark tent and extracted a small sub-sample for luminescence analysis. We illuminated the samples for time intervals of 5, 10, 20, 40, 80, 160 and 320 min and with high suspended-sediment concentrations of 33, 66 and 100 g L−1, spanning a wide range of observed peak values during floods (e.g. Müller and Förstner, 1968; Hicks et al., 2000; Lenzi and Marchi, 2000; Wulf et al., 2012; Andermann et al., 2012). With a sediment density of 2.65 g cm−3 these values correspond to 1.25, 2.5 and 3.8 vol % of sediment, respectively. These concentrations are at the upper end of concentrations that have been measured in most rivers. However, in active orogens like the Himalayas with high rainfall intensity, landslide activity, and a strong coupling between hillslopes and channels, such concentrations may be reached more often. For example Wulf et al. (2012) show that in the winter of 2007, Cs in the Baspa River, a tributary of the Sutlej River, equaled or exceeded 80 g L−1 twice, and the Sutlej River itself reached 60 g L−1. Thus, we can assume that the effective discharge, at least in such regions, is indeed associated with extremely high SSCs. Further, we expect not just a relatively high turbidity threshold for the inversion but also that the effect of the differential bleaching will be more pronounced, i.e. better detectable, using such high sediment concentrations. Additionally, we performed a single subaerial bleaching run with a sample distributed as a monolayer with a thickness of one grain on a flat, reflective surface and illuminated it for 0.1, 1, 5, 10, 20, 40, 80 and 160 min while measuring the solar irradiance. We chose shorter time intervals in the subaerial experiment due to the more favourable bleaching conditions. The experiments were conducted between 5 April 2020 and 9 May 2021 between noon and 18:00 CEST. (Table 1).
Before conducting the bleaching experiments, we determined the wavelength-dependent discrimination of light in turbid suspensions with sediment loads of 0–100 g L−1 in 10 g increments. These measurements aimed at verifying that the width of the spectrometer's optical slit was suitable for our purpose. As we operate with high sediment concentrations, the use of a wider slit permits a higher throughput of photons, thereby increasing the signal-to-noise ratio of the measurements and hence the sensitivity of the instrument. However, higher sensitivity is achieved at the cost of reduced spectral resolution. The spectrometer assembly was calibrated against a standardized target by the manufacturer providing the transfer function to convert the measured intensities, i.e. count rates, to solar irradiance in watts per square centimetre per nanometre. Note that we use the terms irradiance, energy flux density and light intensity synonymously throughout this paper.
2.2 Sample preparation and determination of dose reduction
We adopted a polymineral multiple signal (PMS) approach that measures different luminescence signals from single polymineral coarse-grain aliquots (Reimann et al., 2015). The approach enabled us to measure the bleaching data in a labour-efficient manner and to obtain multiple luminescence signals from the same subset of grains. Sample preparation and measurements were conducted at the Netherlands Centre for Luminescence dating (NCL) at Wageningen University and Research (WUR) in the Netherlands.
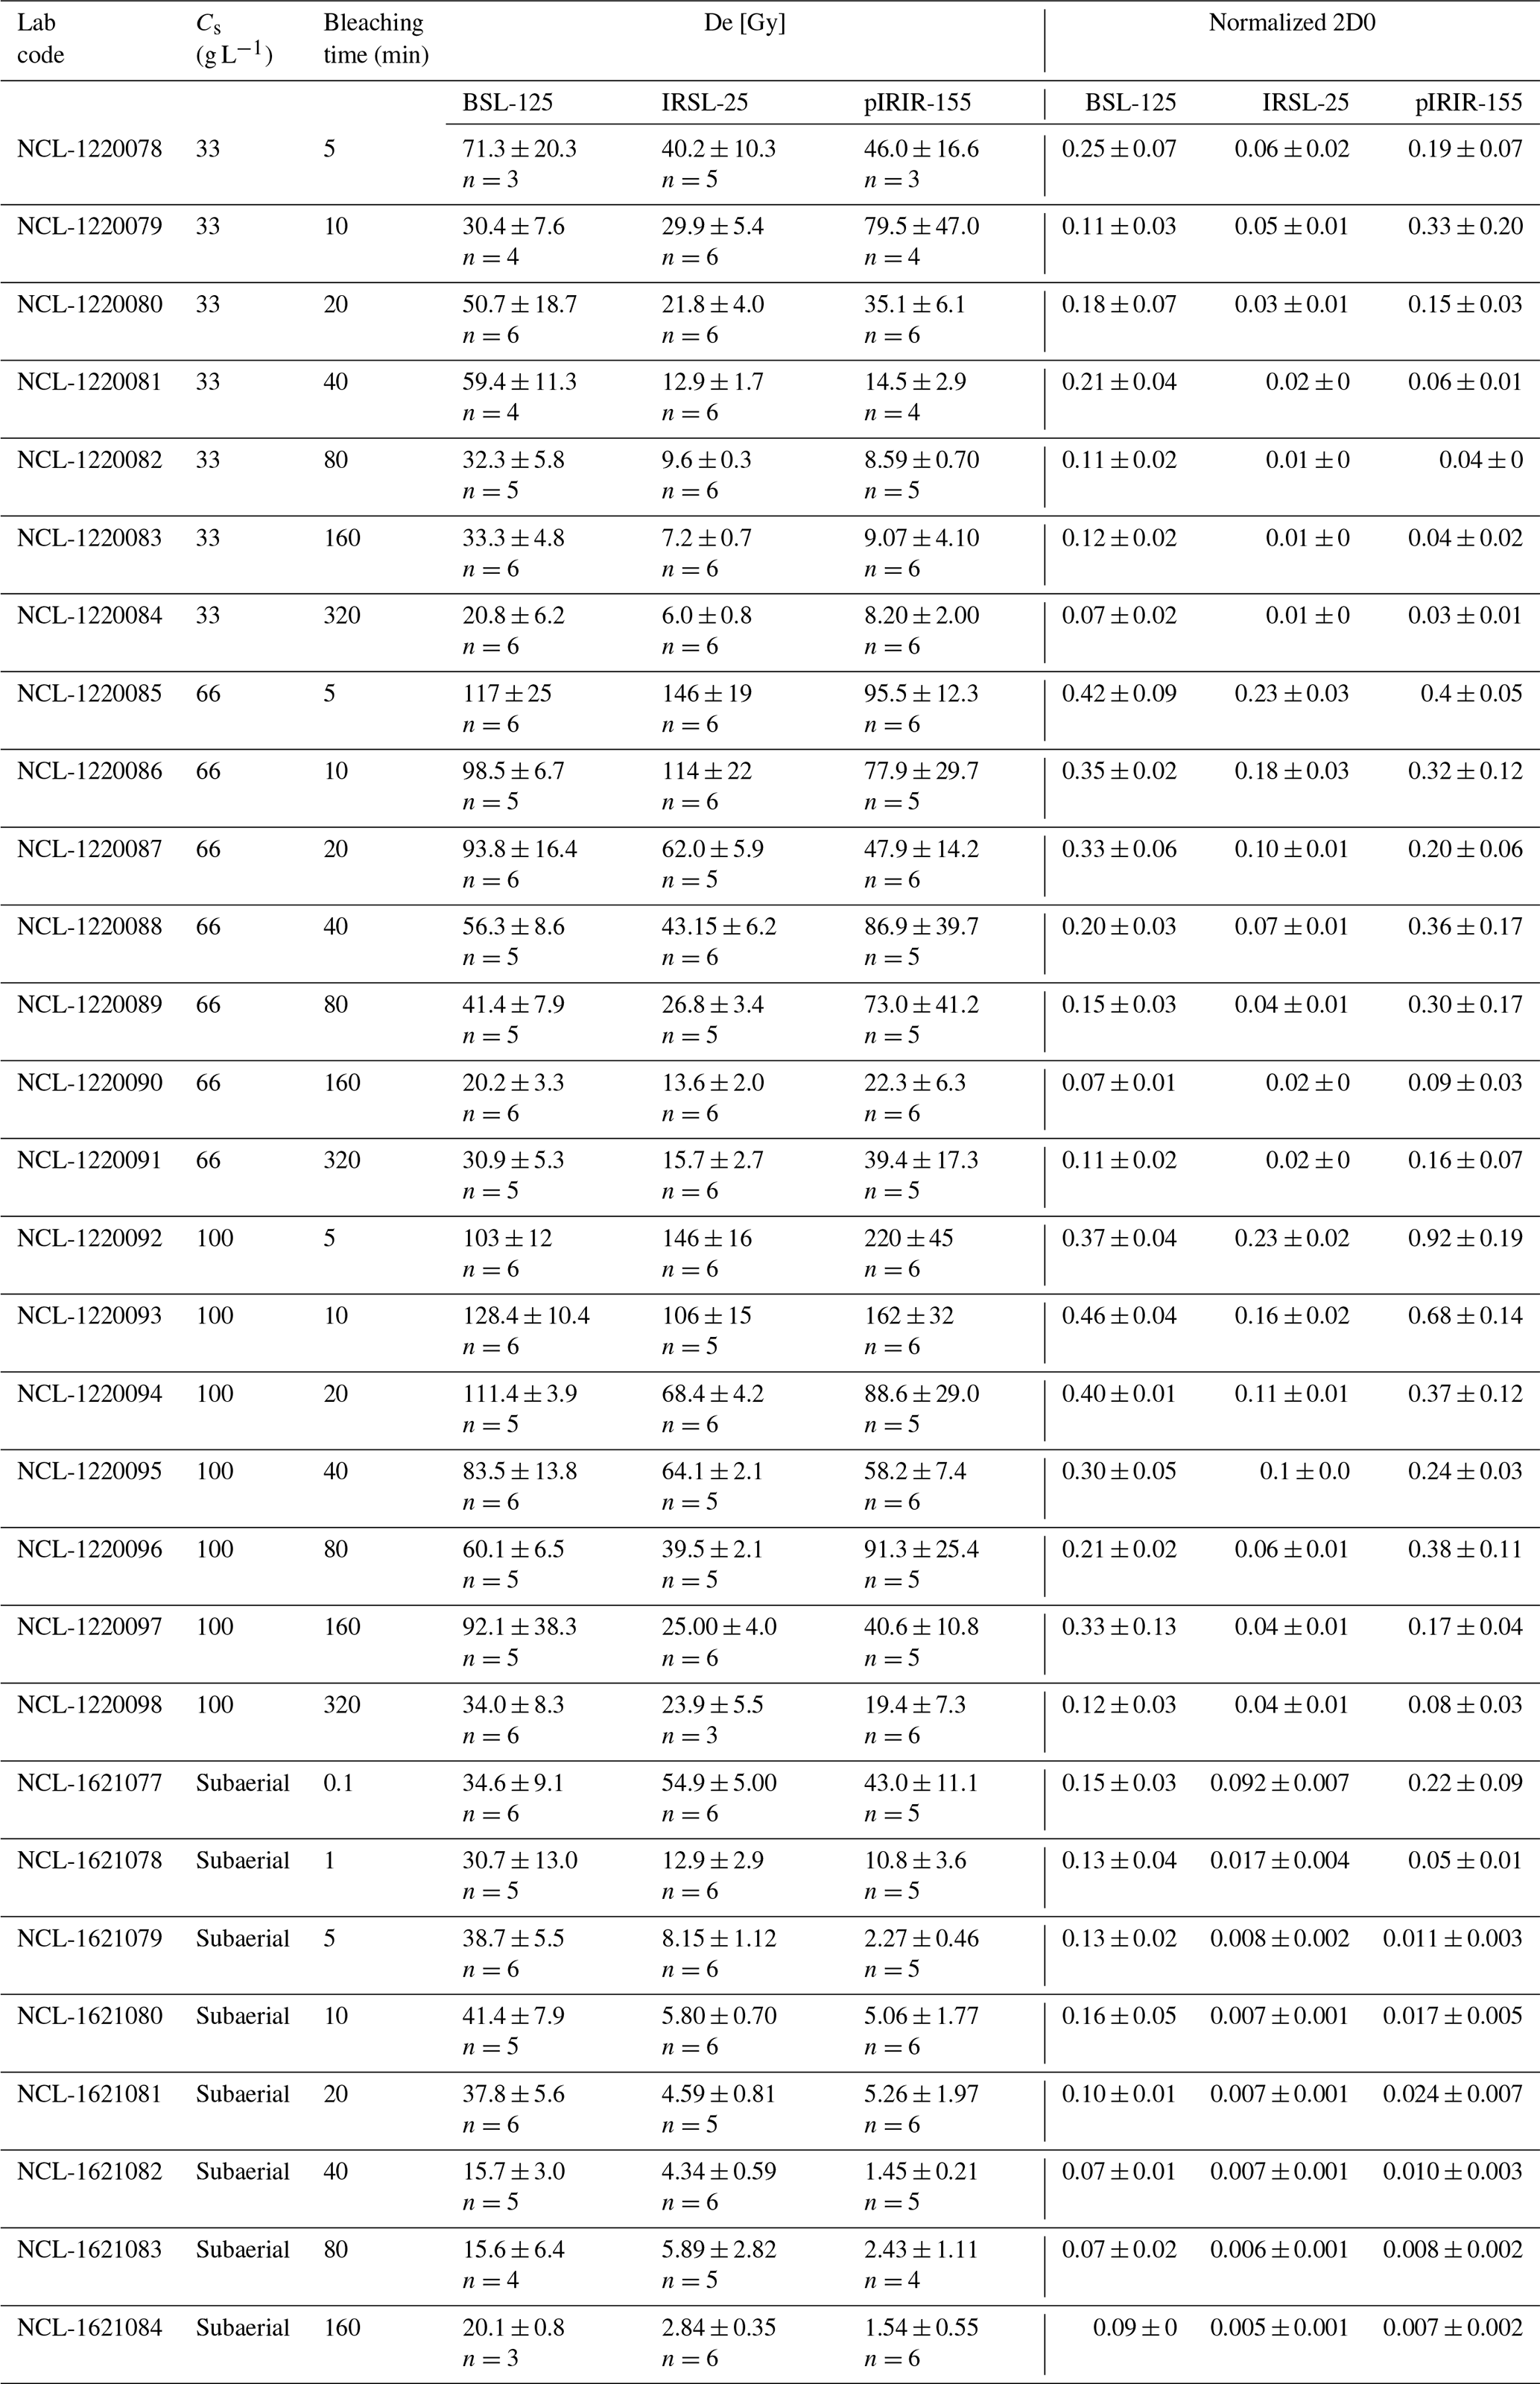
Altogether, 38 samples (see Table 2) were first dried and sieved to a grain size of 180 to 250 µm. Afterwards the samples were purified using 10 % HCl and 10 % H2O2 to remove carbonates and organic matter, respectively. The polymineral coarse-grained material was mounted on a stainless-steel disc using silicon oil. The aliquot size was kept at 5 mm, which is equivalent to a few hundred grains per aliquot. Altogether, three aliquots per sample were measured. More details of the measurement protocol, the experimental set-up and rejection criteria are provided in Reimann et al. (2015). To calculate the reduction in dose we used the threshold for the onset of dose saturation 2D0 (Wintle and Murray, 2006), which is equivalent to 85 % full signal saturation, for normalization. The normalized reduction for each sample to this threshold was calculated from three aliquots and based on the unweighted mean and the 1σ standard error as the uncertainty.
To test the performance of the PMS approach, especially with regard to blue-stimulated OSL at 125 ∘C (BSL-125), which is supposed to be dominated by the quartz OSL fast component (Reimann et al., 2015), we density-separated 16 out of 38 samples using lithium heteropolytungstate (LST) heavy liquid and applied etching with 40 % HF for 45 min to chemically remove any contamination of feldspar luminescence in the BSL-125 signal. The BSL-125 signal of the purified and etched quartz extracts was measured by applying a conventional quartz OSL single-aliquot regenerative-dose (SAR) protocol (Wintle and Murray, 2006) to typically 2 mm aliquots, equivalent to ∼50 grains (Table 3). The normalized reduction compared to 2D0 was calculated for each sample from three aliquots and based on the unweighted mean. A 1σ standard error was chosen as the uncertainty. A table of the PMS protocol is provided in the Supplement.
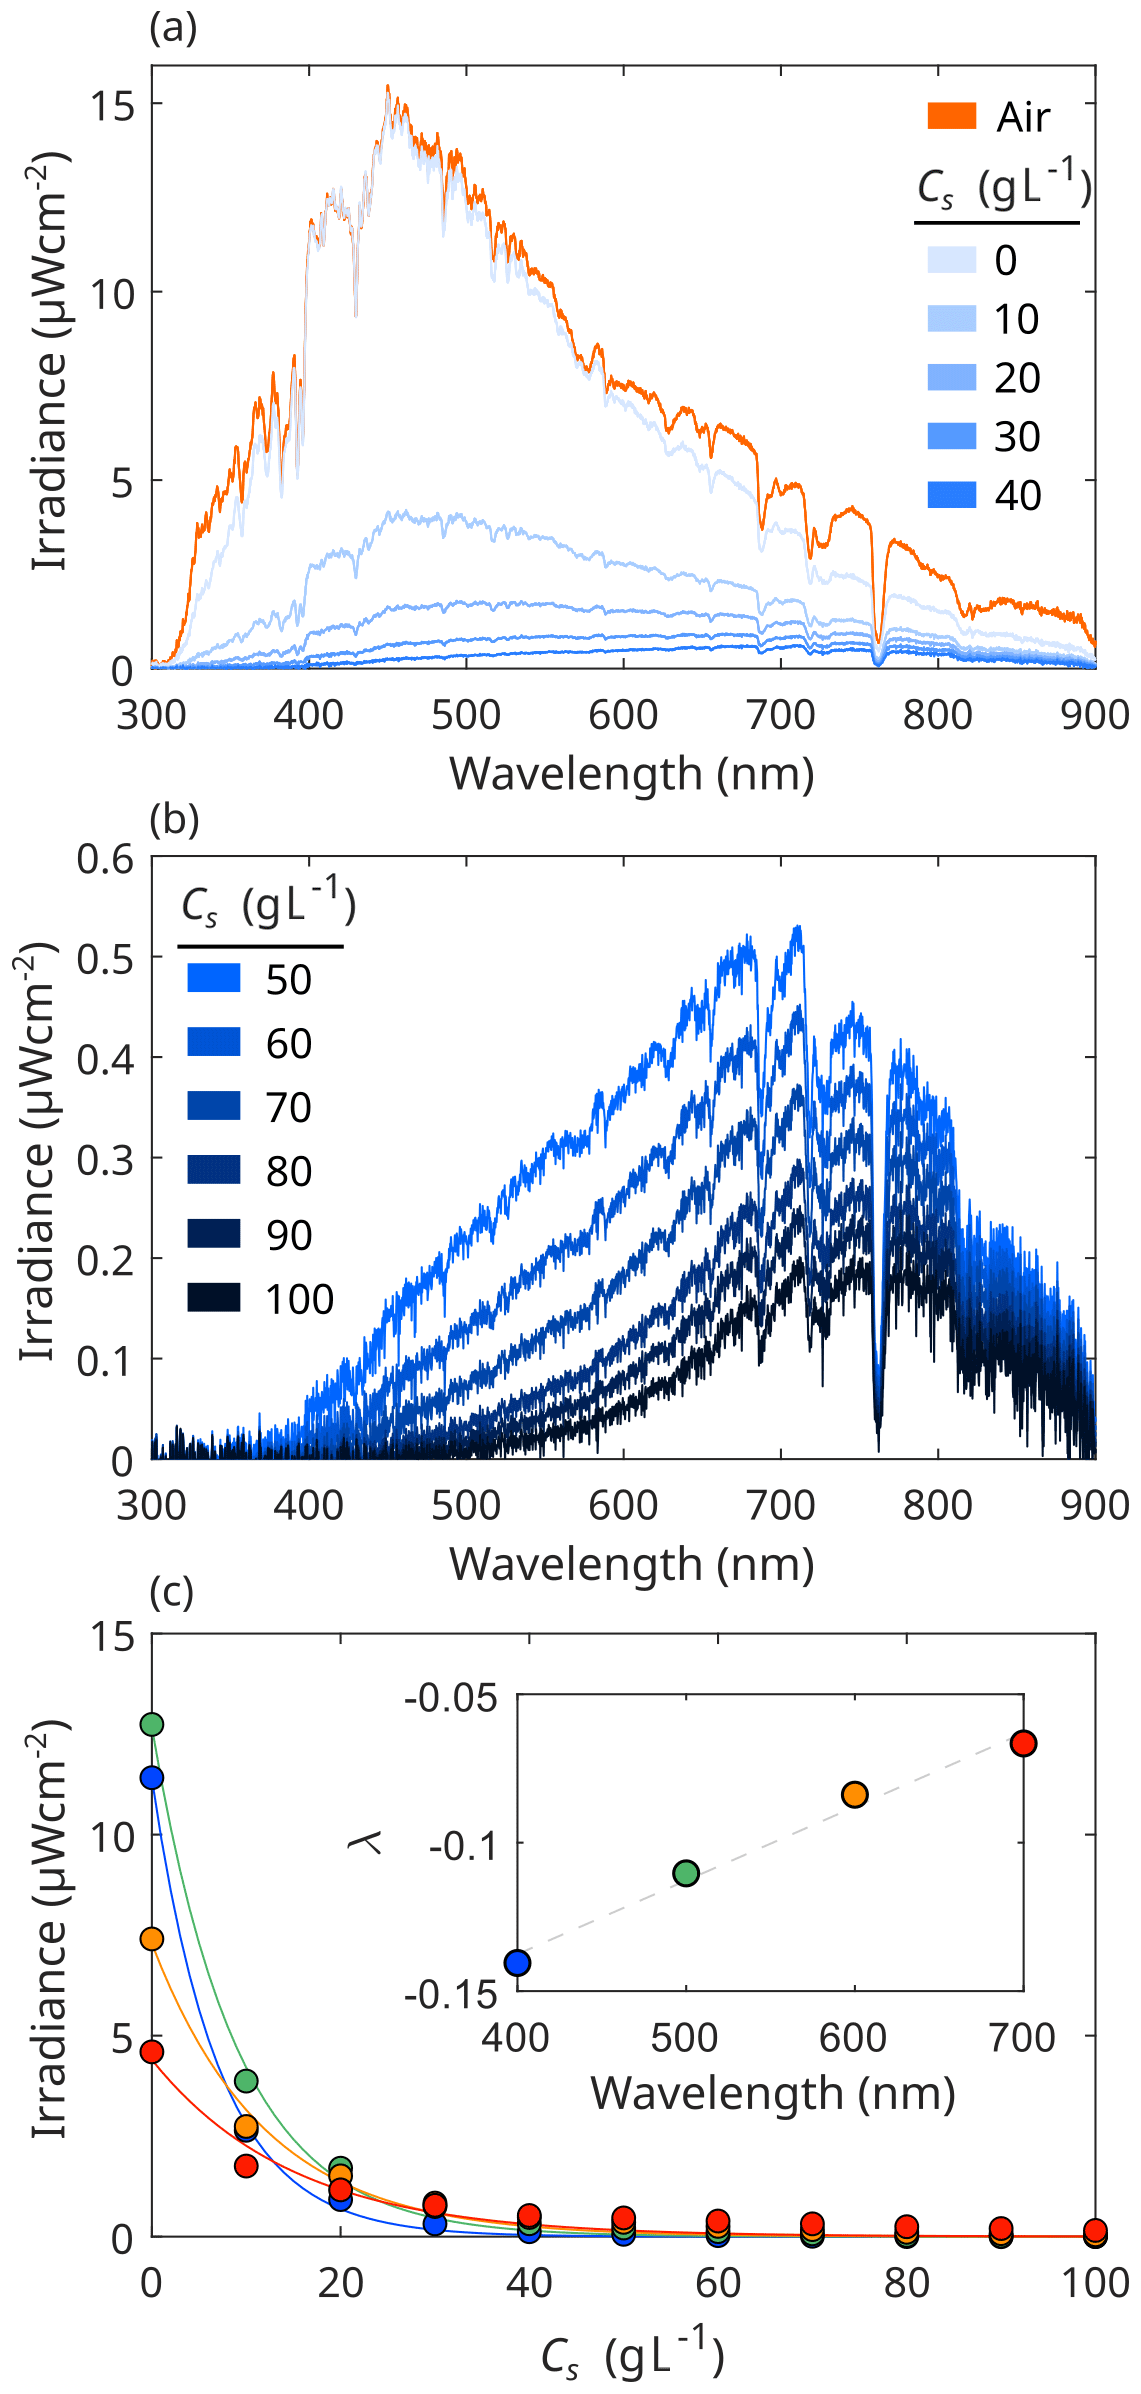
Figure 3Spectra in turbid suspensions. (a) Subaerial and clear-water (0 g L−1) spectra as a reference for the measurements with increased suspended-sediment concentrations (Cs) of 10–40 g L−1 and (b) 50–100 g L−1. (c) The attenuation of light follows an exponential decay, with the decay constant λ being a function of the wavelength. Under high-turbidity conditions, shorter wavelengths disappear more quickly, and the spectral peak broadens and shifts to the red–NIR region.
3.1 Subaqueous light spectra
Our measurements show a marked dependency of light attenuation on the suspended-sediment concentration that varies over the wavelength interval of 315–930 nm (Fig. 3a). Clear water slightly reduces the intensity in the UV (<400 nm) but has virtually no impact within the 400–500 nm range. From 500 to 650 nm the effect is of similar magnitude to that of the UV, but the attenuation is twice as high in the wavelength range of 650–800 nm in particular. Upon addition of just 10 g L−1 of sediment the irradiance in the UV–blue region (315–450 nm) drops sharply by 77 %, whereas the drop in the red–NIR region (625–900 nm) is 48 % and thus similar to that caused by clear water alone. With increasing sediment concentration this trend continues until the UV–blue component is effectively cancelled out. Moreover, the spectral peak successively broadens and shifts from ∼500 nm under subaerial conditions to ∼600 nm with a Cs of 40 g L−1. When increasing the sediment concentration even further, up to 100 g L−1 (Fig. 3b), the wavelengths smaller than 500 nm almost disappear, and the spectral peak moves to ∼710 nm. So, in this experiment, we observe that (1) clear water attenuates the IR part of the spectrum stronger than UV–blue, (2) the reduction in light intensity with increasing Cs is wavelength-dependent, (3) UV–blue is fully attenuated with Cs greater than 40 g L−1, and (4) the spectral peak shifts to the red–NIR region. The reduction in light intensity follows an exponential decay of the form
where the decay constant λ is a linear function of the wavelength (Fig. 3c).
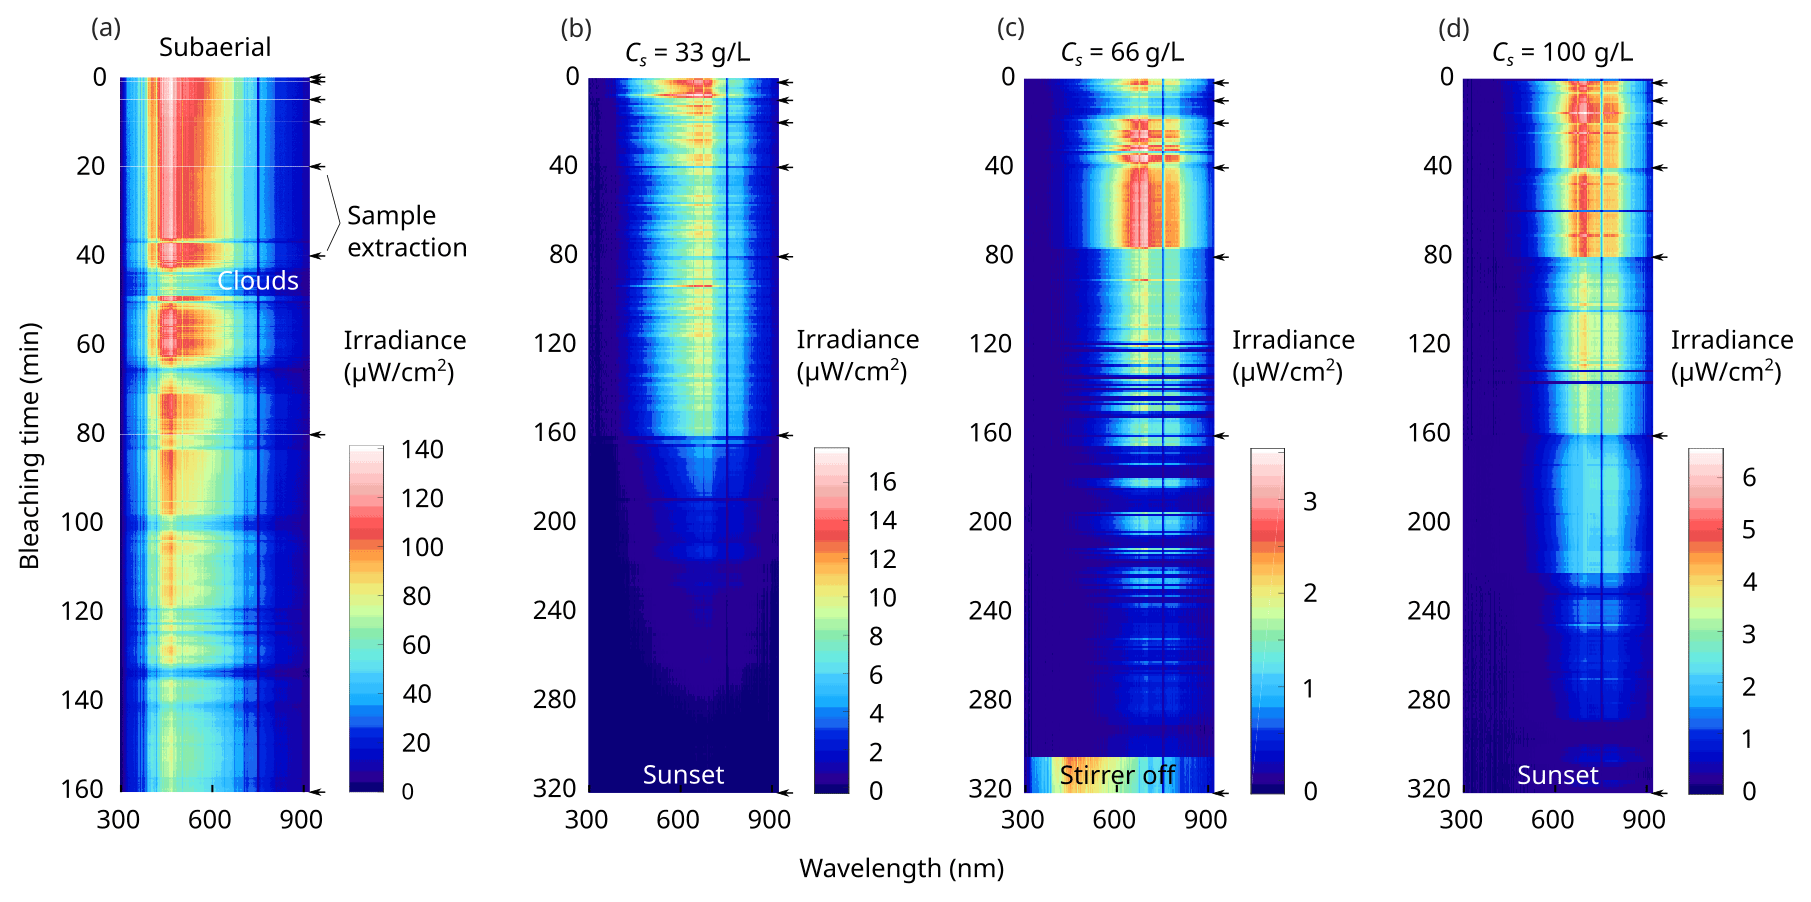
Figure 4Irradiance time series. We continuously measured the in situ irradiance received by the grains in the wavelength interval of 300–915 nm for (a) the subaerial case and with a Cs of (b) 33 g L−1, (c) 66 g L−1 and (d) 100 g L−1. With increasing Cs the irradiance decreases, and the spectral peak broadens and shifts to the longer wavelength. Note the different bleaching timescales of the subaerial and the subaqueous experiments. At the end of the last bleaching interval in (c) the magnet of the stirrer lost connection, and turbidity decreased due to the settling of grains. Cs: suspended-sediment concentration.
This Cs-dependent modification of the light spectrum is also reflected within the calibrated irradiance time series that we measured simultaneously with the bleaching of the samples (Fig. 4). We further observe a gradual decline in the intensity reading of the instrument with time that is superimposed by sudden intensity drops. The former can be attributed to the lowering of the sun with the progression of the afternoon and the latter to shadows from clouds. Consequently, when plotting the total received irradiance against the bleaching time, we observe a decrease in the relative contribution of the last bleaching interval, in particular in the 33 g L−1 case. Thus, it may be more appropriate to relate the measured luminescence dose to the total received irradiance rather than to the bleaching duration. Comparing the irradiance time series we note that with 66 g L−1 we measure a lower irradiance than with 100 g L−1. This is due to more overcast conditions on this day, which is also registered in the subaerial reference spectra that we measured before and after each experiment (Fig. 5). At the end of the last illumination interval with Cs=66 g L−1, the magnet of the stirrer stopped spinning, which led to rapid settling of the grains and a sudden drop in turbidity. Therefore, we omitted the last sample of the 66 g L−1 run from further analyses.
In the following we investigate whether the above changes in the light characteristics had an effect on the differential bleaching of quartz and feldspar during the experiments.
3.2 Bleaching behaviour
We initially limited our analysis to the PMS protocol (see “Data and methods”) as a time-effective means of profiling the luminescence signal loss with bleaching. In all samples of the subaqueous experiments, the PMS BSL-125 bleaches slower than the IR-25 and the post-infrared infrared-stimulated luminescence signal at 155 ∘C (pIRIR-155) (Fig. 6), which is consistent with the theoretical considerations outlined in the Introduction and with the evidence presented in Sect. 3.1 and Fig. 3. However, in our subaerial control run we observed the same pattern of slow BSL-125 using the PMS approach, which contradicts our theoretical considerations and previous experimental work (e.g. Godfrey-Smith et al., 1988; Buylaert et al., 2012). To investigate whether this unexpected observation is caused by contaminated BSL-125 signals within the PMS approach, we additionally measured the BSL-125 on purified quartz for a subset of the samples. In contrast to the BSL-125 within the PMS protocol, the genuine quartz yields a BSL-125 that decays faster than the feldspar signals in all experiments. A possible explanation for this observation is elaborated on in the Discussion section below.
Among all our experiments, the subaerial run features the lowest overall luminescence response with respect to 2D0 (Fig. 6a). After 6 s of illumination the normalized BSL-125 dose is already bleached to 2 %. After 5 min it further decreases by about 1 order of magnitude but remains near-constant thereafter. We detect a similar pattern for the IRSL-25 and the pIRIR-155 signals, i.e. large decreases in the normalized dose within the initial 5 min and only minor changes afterwards. In general, with increasing Cs more of the normalized dose remains for all three signals (Fig. 7a–c). Thus, the turbidity modulates the energy flux density received by the grains, as was expected. The disproportionally larger discrimination against short wavelengths by the turbid suspension (Fig. 3), however, does not cause an inversion of the relative responses of the blue-stimulated pure quartz and the IR-stimulated luminescence signals. This is at odds with our hypothesis that there exists a turbidity condition under which both signals decay at the same rate.
When relating the luminescence response to the cumulative irradiance instead of the bleaching time, a very different pattern appears (Fig. 7d–f). A general trend of decreasing luminescence response with increasing cumulative irradiance is clearly captured. From a theoretical perspective though, samples that have received the same amount of irradiance should bear the same remaining luminescence everything else being equal. But in our case, differences in the remaining luminescence of up to 1 order of magnitude were measured for samples which received a highly similar cumulative irradiance. Given the relatively low error in the normalized dose, this scatter cannot entirely be attributed to uncertainties in the luminescence measurements. It may thus follow from methodological limitations of the chosen experimental set-up. A possible explanation is that some transient settling of grains occurred at the bottom of the container and that the spectrometer measurements therefore registered a too-high cumulative irradiance. With increasing sediment concentration this effect presumably increased as well, which would explain the systematically higher residual doses measured for the 66 g L−1 and 100 g L−1 samples with respect to the 33 g L−1 samples.
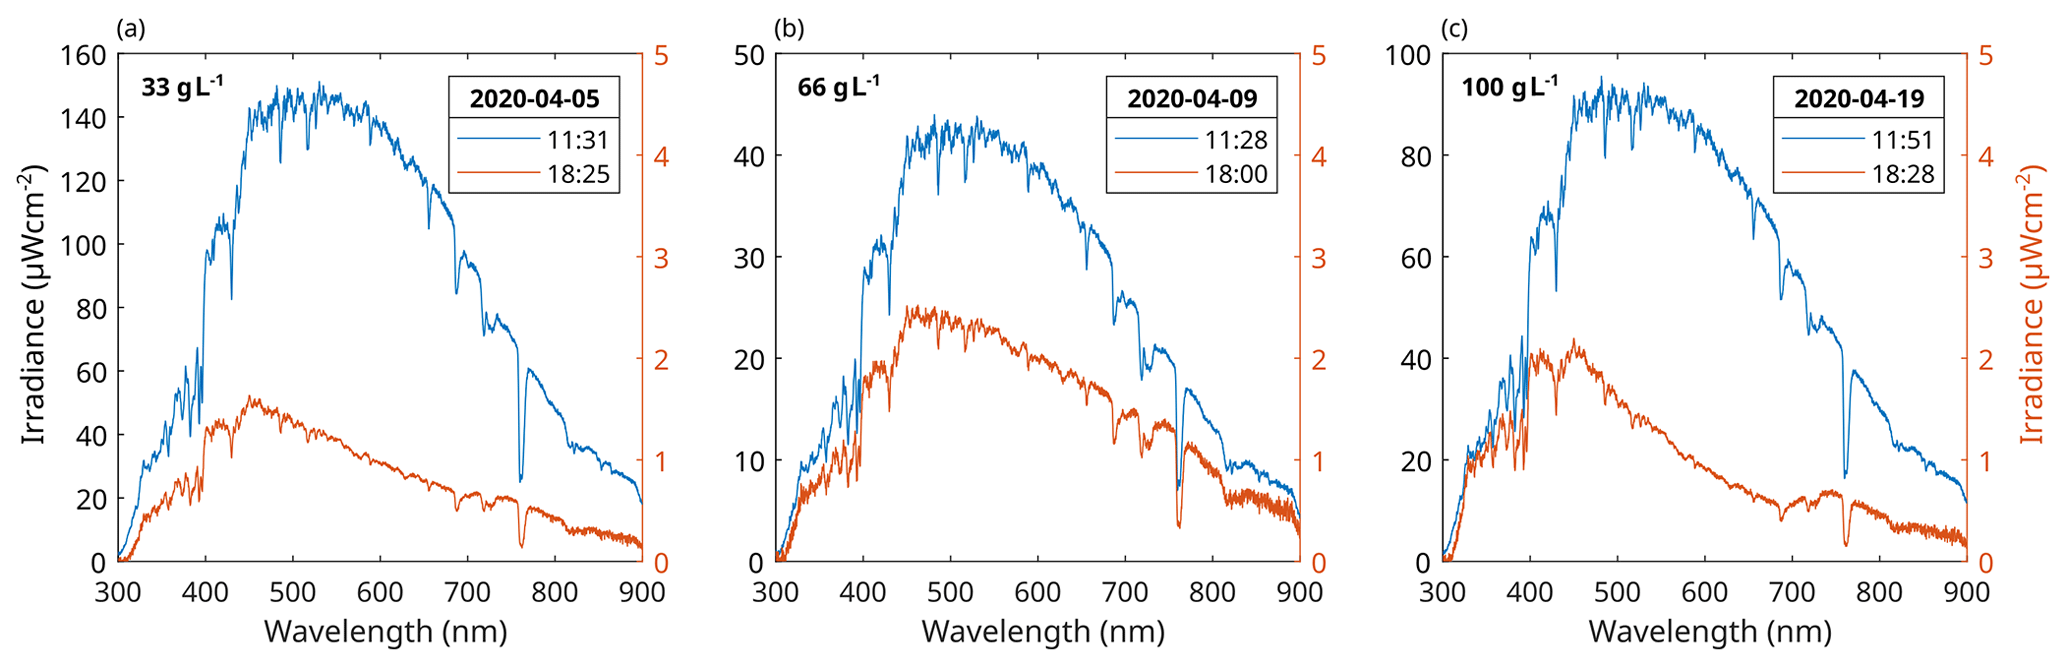
Figure 5Subaerial spectra. Before and after each experiment, we recorded the subaerial spectra for reference. Note that in the 66 g L−1 experiment (b) the noon spectrum features an irradiance peak smaller than 50 µW cm−2. This is due to a generally more overcast sky from noon to early afternoon on that day compared to the 33 g L−1 (a) and the 100 g L−1 (c) experiments.
4.1 Why so fast?
The measurements of the subaqueous irradiance demonstrate that the addition of sediment has a profound effect on the intensity and wavelength distribution of light within the water column. With increasing sediment concentration, the blue portion of the spectrum diminishes and eventually fades into measurement noise, whereas the intensity peak shifts from ∼500 to ∼700 nm, i.e. to the red–NIR region. The wavelength shift has been observed in previous experiments as well (e.g. Berger and Luternauer, 1987; Sanderson et al., 2007). Bleaching of quartz is predominantly caused by the blue wavelength (∼470 nm) spectrum (Spooner, 1994b), which raises the question of why the BSL-125 still decays relatively fast with respect to the IR-25 and pIRIR-155 (Fig. 6). A possible explanation relates to our experimental set-up, where the light characteristics are continuously recorded at a fixed position inside the flume. Yet, the turbulent flow inside the container causes mixing of grains throughout the water column. Thus, there is a high probability that a large fraction of grains will sporadically appear at the water surface during the experiment. Albeit short, these exposures to an unaltered solar spectrum may well be sufficient to bleach the quartz (Gray et al., 2017). Although this is true for the feldspar as well, the effect will be more pronounced for the quartz signal as even a quick exposure to UV–blue light can more efficiently reset the BSL-125 signal (Godfrey-Smith et al., 1988). To test whether these bleaching patterns also dominate in natural settings, modifications of our experimental set-up need to be incorporated to ensure more laminar flow and less vertical mixing, which would provide the means to investigate the effect of turbulence. Yet such modifications were beyond the scope of this study. However, our data clearly hint at the importance of flow turbulence as a potential control of luminescence signal bleaching.
4.2 Turbidity versus suspended-sediment concentration
It is important to note that Cs is only a proxy for the turbidity (e.g. Minella et al., 2008) and that the relation of both is a function of the sample composition, mineralogy and grain-size distribution (Davies-Colley and Smith, 2001; Merten et al., 2014). For example, when we decant our sample and refill the container with clear tap water, the turbidity is greatly reduced, although the mass loss of the sample is minor. Thus, only a tiny fraction of the sediment sample determines the turbidity of the water. This fraction is predominantly composed of fine silt- and clay-sized particles of quartz, calcite, gypsum, anhydrite, halite and magnesium calcite (Supplement). This implies that a repeat bleaching experiment with a different sample would probably result in different luminescence responses (at least for the feldspar components) even if the sediment concentration and boundary conditions were held constant.
4.3 Light spectra measurements
As shown in Sect. 3.1 and Fig. 3, the decrease in irradiance follows an exponential decay that is controlled by the sediment concentration and a wavelength-dependent decay constant, λ. Thus, the knowledge of λ enables the computation of the energy flux density for a broad range of wavelengths and sediment concentrations, which may be useful for the modelling of luminescence signal resetting in turbid suspensions. Because the turbidity is controlled not only by the sediment concentration but also by other sediment characteristics (see section above), we infer that λ is sample-specific as well. However, in natural systems water depth, salinity, stratification and/or vertical turbidity gradients may also affect the energy flux density but are not captured in Eq. (1). Thus, the developments of flume experiments that enable isolation of these individual factors are an avenue for further research. Concerning the effect of water depth on light penetration, it has been shown that the OSL and IRSL signals are efficiently bleached in clear water down to 10 m depth (Rendell et al., 1994). For the fluvial environment at least, water depth can thus be regarded as much less important for the sediment bleaching than turbidity.
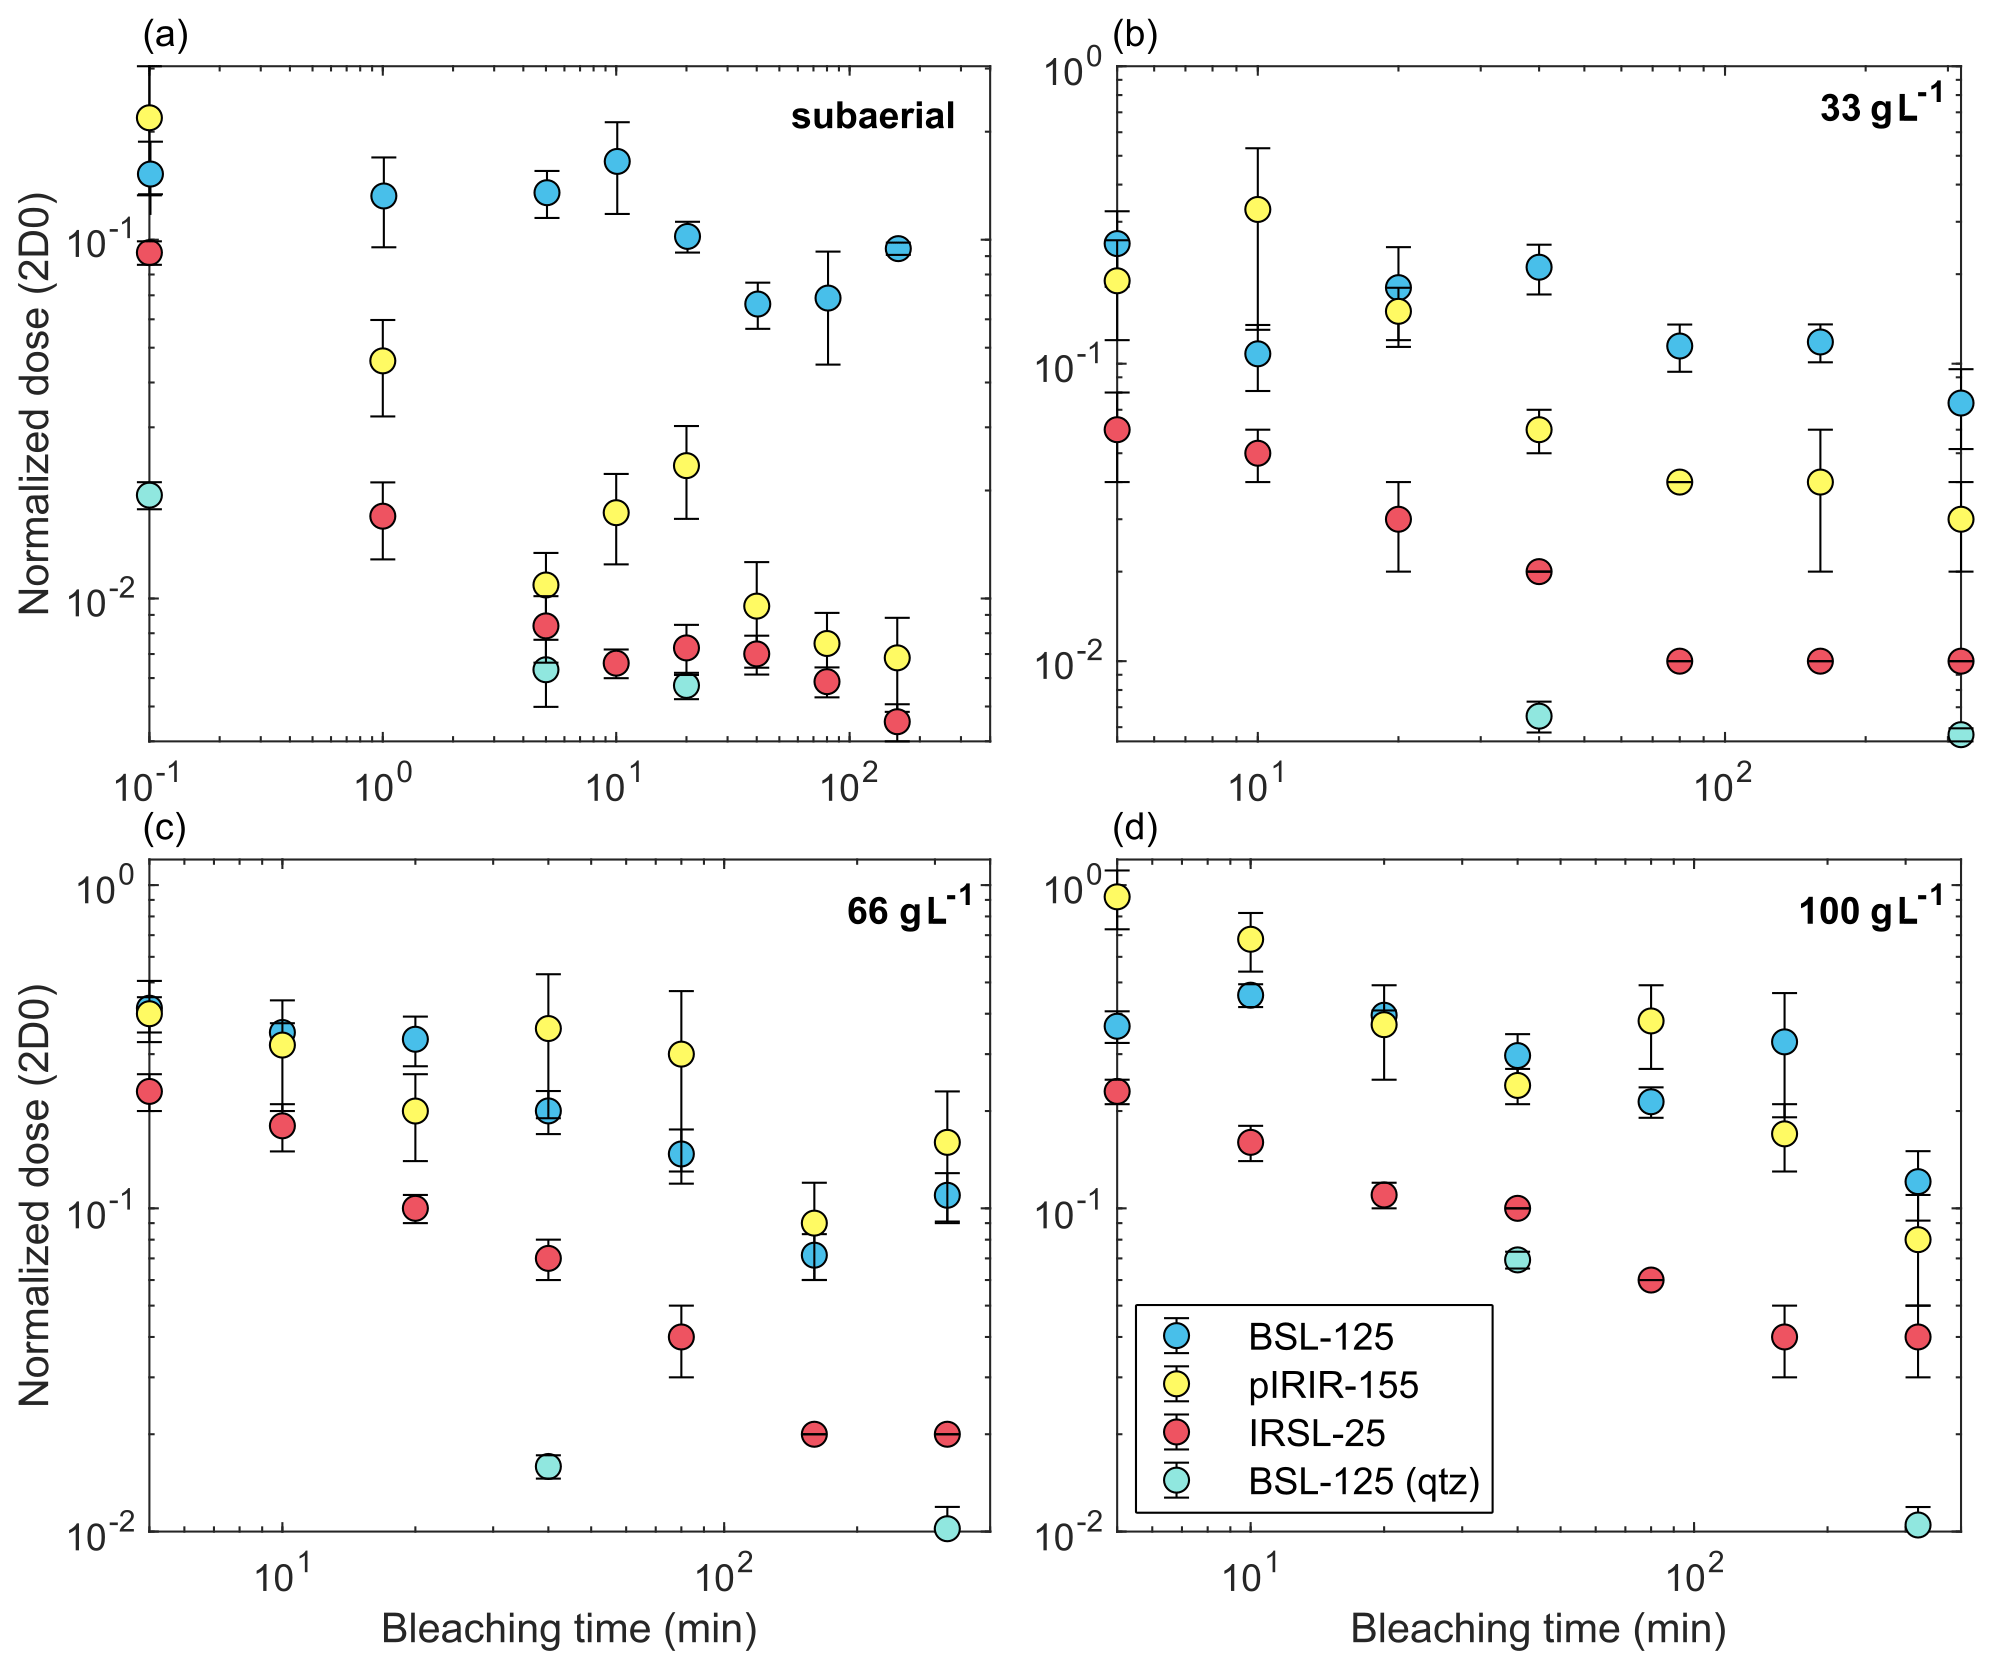
Figure 6Bleaching behaviour I. Polymineral luminescence response of BSL-125, pIRIR-155 and IRSL-25 as well as BSL-125 of pure quartz as a function of the daylight bleaching time for all experiments. Note the slow bleaching of the polymineral BSL-125 in the subaerial case.
4.4 Performance of the PMS approach for capturing bleaching trends
Previous studies suggest that the PMS approach is able to sufficiently capture dose trends also with regard to the BSL-125 signal (e.g. Reimann et al., 2015; Chamberlain et al., 2017). The advantage of the approach is a very time-efficient measurement of larger sets of samples and in particular the prospect of measuring multiple luminescence signals – with various bleaching rates – from the same sub-sample of mineral grains. For our samples, however, the approach was not proficient to measure a clean-enough quartz-dominated BSL-125 signal from minimally prepared samples. A comparison to a subset (16 samples) of fully purified quartz extracts may suggest that the PMS-based BSL-125 signal is likely contaminated by feldspar signal components that were not removed during the IR (at 25 ∘C) and pIRIR wash (at 155 and 225 ∘C). This observation is surprising as previous studies show that multiple IR washes, including multiple steps at elevated temperatures, are able to remove all feldspar luminescence signals from a feldspar-contaminated sample (e.g. Zhang and Zou, 2007). This could perhaps be explained by a modification of the BSL signal during the heating in the IR steps prior to the measurements if the quartz is thermally unstable. An alternative explanation could be that the minimally prepared samples are contaminated by other luminescent minerals (e.g. heavy minerals) that are not sufficiently sensitive to the IR and/or elevated-temperature pIRIR stimulation. To test the latter hypothesis one could further purify a subset of minimally prepared samples by removing the heavy mineral, for example through density and/or magnetic separation (Porat, 2006), and compare the corresponding BSL-125 results with those of the minimally prepared PMS samples and the fully prepared pure quartz extracts. For future studies using the PMS approach it seems advisable to test the performance of the corresponding BSL-125 signal by using a BSL-125 measurement on a subset of fully prepared quartz extracts as a benchmark.
4.5 Implications for using luminescence as a sediment transport tracer
The use of luminescence as a sediment transport tracer is so far mainly based on the sensitivity of sand grain luminescence signal bleaching to sediment transport lengths and the mean resting time of the grains between two transport episodes (e.g. Gray et al., 2017, 2019; Guyez et al., 2023). For example, Guyez et al. (2023) were able to compute the virtual transit velocity of sand grains passing through two braided river systems in New Zealand from single-grain feldspar pIRIR data. The aim of our experiments was to systematically investigate the sensitivity of bleaching of different luminescence signals (quartz OSL vs. feldspar IR/pIRIR) to changes in turbidity to evaluate the potential of luminescence sediment transport tracing to determine palaeoturbidities from fluvial and coastal sediment records such as river terrace sequences, long-shore drift or intertidal deposits, respectively. Interestingly, however, our data do not show the threshold Cs we hypothesize, beyond which feldspar IR/pIRIR signals bleach faster than quartz OSL.
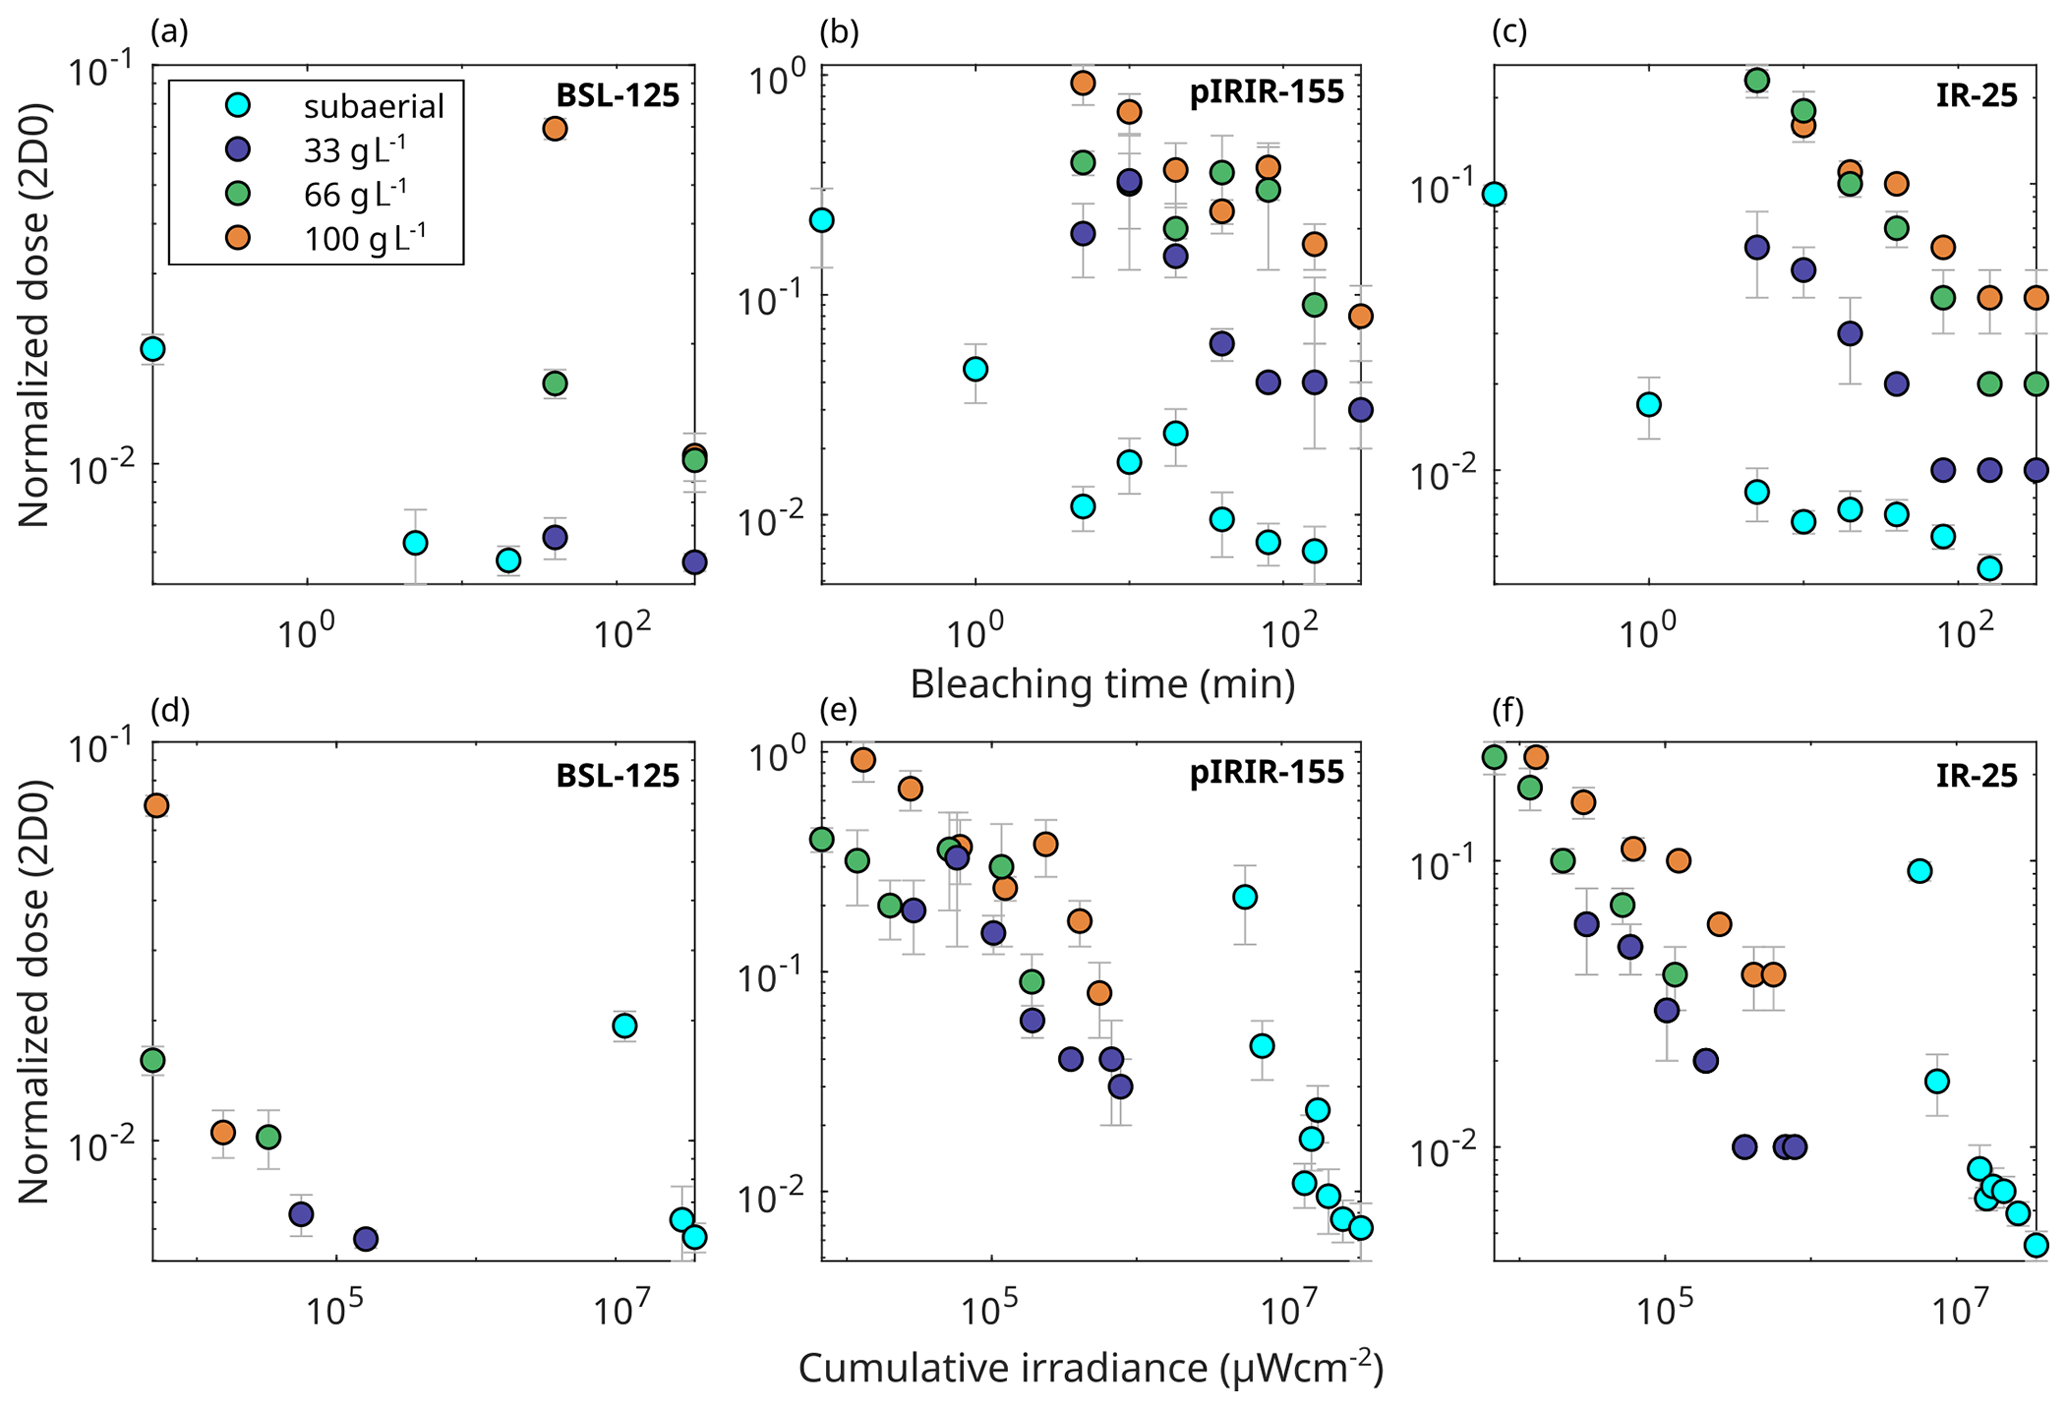
Figure 7Bleaching behaviour II. Bleaching time (a–c) and cumulative irradiance (d–f) versus the normalized dose shown for the pure quartz BSL-125 and the feldspar-dominated pIRIR-155 and IRSL-25. Particularly (b) and (c) show that increased Cs is systematically accompanied by larger remaining normalized doses, i.e. a slower signal resetting. For the BSL and IR in (d)–(f), we integrated over the wavelength intervals of 300–600 and 600–900 nm, respectively.
The interpretation of this observation is not straightforward. Our light spectra experiments clearly show the impact of turbidity on the effective intensity but also show a shift in the spectrum towards longer wavelengths, which potentially favours the bleaching of feldspar IR/pIRIR signals. Yet, the reduction in the light intensity (for Cs=10 g L−1 only 30 % of light intensity is left) is far more significant than the changes in the relative contribution of longer wavelengths. This supports the finding that the bleaching efficiency for sediments in a turbid water column drops dramatically even for relatively moderate sediment concentrations (Ditlefsen, 1992). Hence, the effective bleaching of the grains is likely controlled by the short periods the grains spend at the surface and receive nearly subaerial bleaching conditions. For our experimental set-up bleaching of the grains is thus mainly controlled by the vertical mixing velocity (i.e. turbulence), which explains why we did not observe a convergence of quartz OSL vs. feldspar IR/pIRIR bleaching rates.
The aim of this study was to devise and conduct an experiment that helps to evaluate the effect of turbidity on the bleaching of fluvially transported sediment. We found a systematic relationship between the suspended-sediment concentration and the irradiance at wavelengths between 300–900 nm. Increases in Cs lead to a stronger attenuation of the UV–blue compared to the red–NIR wavelength; i.e. the shorter the wavelength, the faster it disappears within the suspension and vice versa (Fig. 3). The broadband, Cs-dependent decrease in irradiance was captured in the luminescence response, with the remaining normalized doses being positively correlated with Cs (Fig. 7a–c). The sediment concentration thus modifies the resetting time for the measured BSL-125, IRSL-25 and pIRIR-155 signals. However, we did not find the wavelength-dependent discrimination of light in the suspension to be reflected in the luminescence data. Particularly, the hypothesized threshold in Cs, at which the BSL-125 and the IRSL-25 signals bleach at the same rate, could not be established. We attribute this to the turbulence and vertical mobility of grains in the flume, which may lead to a fast bleaching of BSL-125 during short and sporadic moments when grains emerge at the water surface. This implies that turbulent-flow conditions are an important prerequisite for bleaching grains during transport. Yet, another experiment would have to be designed to further scrutinize this finding.
The PMS approach resulted in a slower bleaching of the BSL-125 when compared to the IRSL-25, even under subaerial conditions (Fig. 6). The analysis of purified quartz showed the opposite behaviour of BSL-125, which rendered the PMS-based BSL-125 unreliable in this case. A potential reason could be the presence of other luminescent minerals (e.g. heavy minerals) that contaminated the BSL-125 signal. Thus, for future studies using the PMS, we recommend benchmarking the BSL-125 using a subset of fully purified quartz extracts.
Particularly in bleaching experiments that use daylight conditions and long illumination times, irradiance will be subject to gradual as well as abrupt variations. Therefore, it seems advisable to relate the measured luminescence dose to the cumulative received irradiance rather than to the bleaching time. For a more complete picture of the irradiance boundary conditions it may even be better to employ a second spectrometer that simultaneously registers the incoming subaerial radiation.
The code and data to run the analysis are available in the Supplement.
The supplement related to this article is available online at: https://doi.org/10.5194/gchron-5-377-2023-supplement.
JM, WS and TR conceived the study; JM conducted the experiment; and AMdB performed the sample preparation and luminescence measurements. All authors wrote the manuscript.
The contact author has declared that none of the authors has any competing interests.
Publisher’s note: Copernicus Publications remains neutral with regard to jurisdictional claims in published maps and institutional affiliations.
This project was financed by the “Experiment!” funding initiative of the VolkswagenStiftung (project: Illuminating the speed of sand). We thank Werner Stackebrandt for suggestions on the sampling site and Stefanie Tofelde for help during the field excursion. Jürgen Mey expresses his gratitude to Jürgen and Rita Heinrich for providing the outdoor environment during the Covid-19 pandemic.
This project was supported by the “Experiment!” funding initiative of the Volkswagen Foundation (“Illuminating the speed of sand” project, grant no. 95108).
This paper was edited by Julie Durcan and reviewed by Harrison Gray and one anonymous referee.
Ahmed, M. T. T., Sato, S., and Tajima, Y.: Quantitative Estimation of Longshore Sediment Transport Based on Thermoluminescence: Two Case Studies around Tenryu and Nile River Mouths, J. Coast. Res., 30, 537–547, https://doi.org/10.2112/JCOASTRES-D-13-00050.1, 2013.
Alexanderson, H. and Murray, A. S.: Luminescence signals from modern sediments in a glaciated bay, NW Svalbard, Quat. Geochronol., 10, 250–256, https://doi.org/10.1016/j.quageo.2012.01.001, 2012.
Andermann, C., Crave, A., Gloaguen, R., Davy, P., and Bonnet, S.: Connecting source and transport: Suspended sediments in the Nepal Himalayas, Earth Planet. Sc. Lett., 351, 158–170, 2012.
Berger, G. W.: Effectiveness of natural zeroing of the thermoluminescence in sediments, J. Geophys. Res.-Sol. Ea., 95, 12375–12397, 1990.
Berger, G. W. and Luternauer, J. J.: Preliminary field work for thermoluminescence dating studies at the Fraser River delta, British Columbia, Geol. Surv. Canada Pap., 87, 901–904, 1987.
Bradner, H.: Attenuation of light in clear deep ocean water, in: Proceedings of the 2nd NESTOR International Workshop, Pylos, Greece, p. 247, 1992.
Buylaert, J.-P., Jain, M., Murray, A. S., Thomsen, K. J., Thiel, C., and Sohbati, R.: A robust feldspar luminescence dating method for Middle and Late Pleistocene sediments, Boreas, 41, 435–451, https://doi.org/10.1111/j.1502-3885.2012.00248.x, 2012.
Chamberlain, E. L., Wallinga, J., Reimann, T., Goodbred, S. L., Steckler, M. S., Shen, Z., and Sincavage, R.: Luminescence dating of delta sediments: Novel approaches explored for the Ganges-Brahmaputra-Meghna Delta, Quat. Geochronol., 41, 97–111, https://doi.org/10.1016/j.quageo.2017.06.006, 2017.
Davies-Colley, R. J. and Smith, D. G. Turbidity suspended sediment, and water clarity: a review.: J. Am. Water Resour. As., 37, 1085–1101, 2001.
Davies-Colley, R. J. and Nagels, J. W.: Predicting light penetration into river waters, J. Geophys. Res.-Biogeo., 113, G03028, doi:10.1029/2008JG000722, 2008.
Ditlefsen, C.: Bleaching of K-feldspars in turbid water suspensions: a comparison of photo-and thermoluminescence signals, Quat. Sci. Rev., 11, 33–38, 1992.
Fuchs, M. and Lang, A.: Luminescence dating of hillslope deposits – A review, Geomorphology, 109, 17–26, https://doi.org/10.1016/j.geomorph.2008.08.025, 2009.
Gallegos, C. L., Correll, D. L., and Pierce, J. W.: Modeling spectral diffuse attenuation, absorption, and scattering coefficients in a turbid estuary, Limnol. Oceanogr., 35, 1486–1502, 1990.
Godfrey-Smith, D. I., Huntley, D. J., and Chen, W.-H.: Optical dating studies of quartz and feldspar sediment extracts, Quat. Sci. Rev., 7, 373–380, 1988.
Gray, H. J. and Mahan, S. A.: Variables and potential models for the bleaching of luminescence signals in fluvial environments, Quat. Int., 362, 42–49, 2015.
Gray, H. J., Tucker, G. E., Mahan, S. A., McGuire, C., and Rhodes, E. J.: On extracting sediment transport information from measurements of luminescence in river sediment, J. Geophys. Res.-Earth, 122, 654–677, 2017.
Gray, H. J., Tucker, G. E., and Mahan, S. A.: Application of a Luminescence-Based Sediment Transport Model, Geophys. Res. Lett., 45, 6071–6080, https://doi.org/10.1029/2018GL078210, 2018.
Gray, H. J., Jain, M., Sawakuchi, A. O., Mahan, S. A., and Tucker, G. E.: Luminescence as a sediment tracer and provenance tool, Rev. Geophys., 57, 987–1017, 2019.
Guyez, A., Bonnet, S., Reimann, T., Carretier, S., and Wallinga, J.: Illuminating past river incision, sediment source and pathways using luminescence signals of individual feldspar grains (Rangitikei River, New Zealand), Earth Surf. Proc. Land., 47, 1952–1971, https://doi.org/10.1002/esp.5357, 2022.
Guyez, A., Bonnet, S., Reimann, T., Carretier, S., and Wallinga, J.: A Novel Approach to Quantify Sediment Transfer and Storage in Rivers – Testing Feldspar Single-Grain pIRIR Analysis and Numerical Simulations, J. Geophys. Res.-Earth, 128, e2022JF006727, https://doi.org/10.1029/2022JF006727, 2023.
Hicks, D. M., Gomez, B., and Trustrum, N. A.: Erosion thresholds and suspended sediment yields, Waipaoa River basin, New Zealand, Water Resour. Res., 36, 1129–1142, 2000.
Huntley, D. J., Godfrey-Smith, D. I., and Thewalt, M. L.: Optical dating of sediments, Nature, 313, 105–107, 1985.
Jacobs, Z.: Luminescence chronologies for coastal and marine sediments, Boreas, 37, 508–535, https://doi.org/10.1111/j.1502-3885.2008.00054.x, 2008.
Jain, M., Murray, A. and Botter-Jensen, L.: Optically stimulated luminescence dating: how significant is incomplete light exposure in fluvial environments?, Datation par luminescence stimulée optiquement: quelle signification en cas de blanchiment incomplet des sédiments fluviatiles?, Quaternaire, 15, 143–157, 2004.
Lenzi, M. A. and Marchi, L.: Suspended sediment load during floods in a small stream of the Dolomites (northeastern Italy), Catena, 39, 267–282, 2000.
McGuire, C. and Rhodes, E. J.: Determining fluvial sediment virtual velocity on the Mojave River using K-feldspar IRSL: Initial assessment, Quat. Int., 362, 124–131, 2015a.
McGuire, C. and Rhodes, E. J.: Downstream MET-IRSL single-grain distributions in the Mojave River, southern California: Testing assumptions of a virtual velocity model, Quat. Geochronol., 30, 239–244, 2015b.
Merten, G. H., Capel, P. D., and Minella, J. P.: Effects of suspended sediment concentration and grain size on three optical turbidity sensors, J. Soil Sed., 14, 1235–1241, 2014.
Minella, J. P., Merten, G. H., Reichert, J. M., and Clarke, R. T.: Estimating suspended sediment concentrations from turbidity measurements and the calibration problem, Hydrol. Process., 22, 1819–1830, 2008.
Müller, G. and Förstner, U.: General relationship between suspended sediment concentration and water discharge in the Alpenrhein and some other rivers, Nature, 217, 244–245, 1968.
Murray, A. S., Olley, J., and Caitcheon, G. G.: Measurement of equivalent doses in quartz from contemporary water-lain sediments using optically stimulated luminescence, Quat. Sci. Rev., 14, 365–371, 1995.
Pope, R. M. and Fry, E. S.: Absorption spectrum (380–700 nm) of pure water, II. Integrating cavity measurements, Appl. Opt., 36, 8710–8723, 1997.
Porat, N., Zilberman, E., Amit, R., and Enzel, Y.: Residual ages of modern sediments in an hyperarid region, Israel, Quat. Sci. Rev., 20, 795–798, https://doi.org/10.1016/S0277-3791(00)00021-4, 2001.
Porat, N.: Use of magnetic separation for purifying quartz for luminescence dating, Ancient TL, 24, 33–36, 2006.
Reimann, T., Notenboom, P. D., Schipper, M. A. De, and Wallinga, J.: Testing for sufficient signal resetting during sediment transport using a polymineral multiple-signal luminescence approach, Quat. Geochronol., 25, 26–36, https://doi.org/10.1016/j.quageo.2014.09.002, 2015.
Rendell, H. M., Webster, S. E., and Sheffer, N. L.: Underwater bleaching of signals from sediment grains: new experimental data, Quat. Sci. Rev., 13, 433–435, https://doi.org/10.1016/0277-3791(94)90055-8, 1994.
Richardson, C. A.: Residual luminescence signals in modern coastal sediments, Quat. Sci. Rev., 20, 887–892, https://doi.org/10.1016/S0277-3791(00)00052-4, 2001.
Rittenour, T. M.: Luminescence dating of fluvial deposits: applications to geomorphic, palaeoseismic and archaeological research, Boreas, 37, 613–635, https://doi.org/10.1111/j.1502-3885.2008.00056.x, 2008.
Roberts, R. G. and Lian, O. B.: Illuminating the past, Nature, 520, 438–439, https://doi.org/10.1038/520438a, 2015.
Sanderson, D. C. W., Bishop, P., Stark, M., Alexander, S., and Penny, D.: Luminescence dating of canal sediments from Angkor Borei, Mekong Delta, Southern Cambodia, Quat. Geochronol., 2, 322–329, https://doi.org/10.1016/j.quageo.2006.05.032, 2007.
Spooner, N. A.: The anomalous fading of infrared-stimulated luminescence from feldspars, Radiat. Meas., 23, 625–632, https://doi.org/10.1016/1350-4487(94)90111-2, 1994a.
Spooner, N. A.: On the optical dating signal from quartz, Radiat. Meas., 23, 593–600, /https://doi.org/10.1016/1350-4487(94)90105-8, 1994b.
Stackebrandt, W. and Franke, D. (Eds.): Geologie von Brandenburg, Schweizerbart Science Publishers, Stuttgart, Germany, 805 pp., ISBN 978-3-510-65295-2, 2015.
Stokes, S., Bray, H. E., and Blum, M. D.: Optical resetting in large drainage basins: tests of zeroing assumptions using single-aliquot procedures, Quat. Sci. Rev., 20, 879–885, https://doi.org/10.1016/S0277-3791(00)00045-7, 2001.
Wallinga, J.: Optically stimulated luminescence dating of fluvial deposits: a review, Boreas, 31, 303–322, https://doi.org/10.1111/j.1502-3885.2002.tb01076.x, 2002.
Wintle, A. G. and Murray, A. S.: A review of quartz optically stimulated luminescence characteristics and their relevance in single-aliquot regeneration dating protocols, Radiat. Meas., 41, 369–391, https://doi.org/10.1016/j.radmeas.2005.11.001, 2006.
Wulf, H., Bookhagen, B., and Scherler, D.: Climatic and geologic controls on suspended sediment flux in the Sutlej River Valley, western Himalaya, Hydrol. Earth Syst. Sci., 16, 2193–2217, https://doi.org/10.5194/hess-16-2193-2012, 2012.
Zhang, J. F. and Zhou, L. P.: Optimization of the “double SAR” procedure for polymineral fine grains, Radiat. Meas., 42, 1475–1482, https://doi.org/10.1016/j.radmeas.2007.06.007, 2007.