the Creative Commons Attribution 4.0 License.
the Creative Commons Attribution 4.0 License.
 | 20 Oct 2023
Technical note: Darkroom lighting for luminescence dating laboratory
Marine Frouin
Taylor Grandfield
William Huebsch
Owen Evans
An optimal lighting setting for the darkroom laboratory is fundamental for the accuracy of luminescence dating results. Here, we present the lighting setting implemented in the new Luminescence Dating Research Laboratory at Stony Brook University, USA. In this study, we performed spectral measurements on different light sources and filters. Then, we measured the optically stimulated luminescence (OSL) signal of quartz and the infrared stimulated luminescence (IRSL) at 50 ∘C (IR50) as well as post-IR IRSL at 290 ∘C (pIR-IR290) signal of potassium (K)-rich feldspar samples exposed to various light sources and durations.
Our ambient lighting is provided by ceiling fixtures, each equipped with a single orange light-emitted diode (LED). In addition, our task-oriented lighting, mounted below each wall-mounted cabinet and inside the fume hoods, is equipped with a dimmable orange LED stripline.
The ambient lighting, delivering 0.4 lx at the sample position, induced a loss of less than 5 % (on average) in the quartz OSL dose after 24 h of exposure and up to 5 % (on average) in the IR50 dose for the K-rich feldspar samples, with no measurable effect on their pIR-IR290 dose. The fume hood lighting, delivering 1.1 lx at the sample position, induced a dose loss of less than 5 % in quartz OSL and K-rich feldspar IR50 doses after 24 h of exposure, with no measurable effect on their pIR-IR290 dose. As light exposure during sample preparation is usually less than 24 h, we conclude that our lighting setting is suitable for luminescence dating darkrooms; it is simple, inexpensive to build, and durable.
- Article
(3225 KB) - Full-text XML
- BibTeX
- EndNote


Luminescence dating techniques enable evaluation of the time that has elapsed since crystallized mineral grains, such as quartz and feldspar, were last exposed to sunlight or high temperature. Hence, a fundamental requirement of the method is that the light-sensitive traps in mineral grains must have been entirely emptied in the past and remained unexposed to light until laboratory measurement (Aitken, 1998). During sample collection in the field and sample preparation in the laboratory, precautions should be taken to preserve the integrity of the samples using controlled lighting conditions; otherwise, there is a severe risk of reducing the dating signal (i.e., luminescence signal) and hence the apparent age (i.e., deposition time) of the mineral grains. For quartz grains, the shorter wavelengths (less than 360 nm) are most effective in evicting electrons from traps. For K-rich feldspar grains, the bleaching resonance is centered at 860 nm. For quartz and feldspar grains, dim lighting conditions in the orange–yellow to red wavelengths provide minimal signal loss over a limited time (Aitken, 1998). Within this large wavelength range, each luminescence dating laboratory worldwide defines its lighting conditions. In fact, only a few laboratories have reported measurements of their lighting conditions (e.g., Spooner, 2000; Huntley and Baril, 2002; Lindvall et al., 2017; Sohbati et al., 2017, 2021) and their effect on the mineral samples.
Here we report on the lighting conditions implemented in the new Luminescence Dating Research Laboratory at Stony Brook University. First, we performed spectral measurements on different light sources and filters. Then, we measured the dose loss of quartz and potassium (K)-rich feldspar samples after exposure to various light sources and times.
Spectral measurements were performed using a Qmini Wide VIS (AFBR-S20M2WV) spectrometer with a spectral range of 212–1035 nm (sensitivity optimized at ∼ 500 nm) and a spectral resolution at 1.5 nm equipped with an optic fiber P400-1-UV-VIS400. The calibration of the spectrometer was performed in May 2019. All spectra were measured over a total integration time of 2 s. The amount of light on the laboratory benchtops was measured with a Dr.meter LX1330B digital illumination/light meter.
In this study we used two quartz samples and two feldspar samples. One of the quartz samples is the calibration quartz (180–250 µm, batch no. 118 and no. 123; Hansen et al., 2015). The second quartz sample (SB27) was collected from the middle paleolithic site of Oscurusciuto (Italy) and had a natural average dose of 133 ± 5 Gy (n=14). The feldspar samples SB36 and 44 were from the last glacial cycle and collected on Long Island, NY. Sample SB36 had a saturated post-IR infrared stimulated luminescence (IRSL) at 290 ∘C (pIR-IR290) dose (2D0=328 ± 10 Gy, n=3). Sample SB44 had an average pIR-IR225 dose of 49 ± 1 Gy (n=11; not fading corrected) and a pIR-IR290 dose of 67 ± 3 Gy (n=12).
Coarse-grain (180–250 µm) fractions were dispensed on 10 mm diameter aluminum discs (quartz) and cups (feldspar) with a silicone oil adhesive of 4 mm diameter. Sixty aliquots per sample were prepared.
The luminescence measurements were performed on a Risø thermoluminescence (TL)/optically stimulated luminescence (OSL) DA-20 reader equipped with a ET PDM9107-CP-TTL photomultiplier tube and a 90Sr 90Y source delivering a dose of 0.106 ± 0.003 Gy s−1 to the material deposited on a disc. The luminescence signal from the quartz grains was stimulated with blue diodes emitting at 470 ± 30 nm and detected through a combination of a 2.5 and 5 mm thick Hoya U-340 glass filters (transmission between ∼ 290–370 nm). The infrared stimulated signal from the K-rich feldspar grains was stimulated with LEDs emitting at 850 ± 30 nm, and the luminescence signal was detected through the so-called blue filter pack composed of a 3 mm thick Schott BG3 and a 2 mm thick Schott BG39 filter (detection window centered on 410 nm).
A standard multi-grain, single-aliquot regenerative (SAR) procedure was used for the dose determination. After the measurement of the natural OSL signal, the aliquots were subjected to regenerative-dose cycles (including a duplicate dose and zero dose). The SAR protocol was applied to quartz samples with a preheat of 220 ∘C for 10 s and a cutheat of 180 ∘C. The quartz OSL signal was measured for 40 s at 125 ∘C prior to heating at a higher temperature for the quartz samples. The net intensity of the blue luminescence signal was integrated over the first 0.8 s after subtracting the background signal derived from the last 8 s of stimulation. For feldspar, equivalent doses were measured using SAR protocols exploiting the IRSL signal measured at low temperature and referred to as the IR50 protocol (Huntley and Lamothe, 2001), as well as the post-IR infrared luminescence signal measured at high temperature and referred to as the pIR-IR290 (Thiel et al., 2011). Prior to the IRSL stimulation, standard preheat conditions were applied at 250 ∘C for 60 s and 320 ∘C for 60 s for the IR50 and pIR-IR290 protocols, respectively. Both luminescence signals were integrated over the first 5 s of stimulation, and the background was taken from the last 10 s of stimulation. For quartz and feldspar samples, the growth curve was fitted with a single saturating exponential function. The uncertainties in an individual dose have been determined using classical rules of error combination using the Analyst software (Duller, 2015); a further systematic uncertainty of 2 % was added in quadrature to each uncertainty value to account for calibration errors and machine reproducibility.
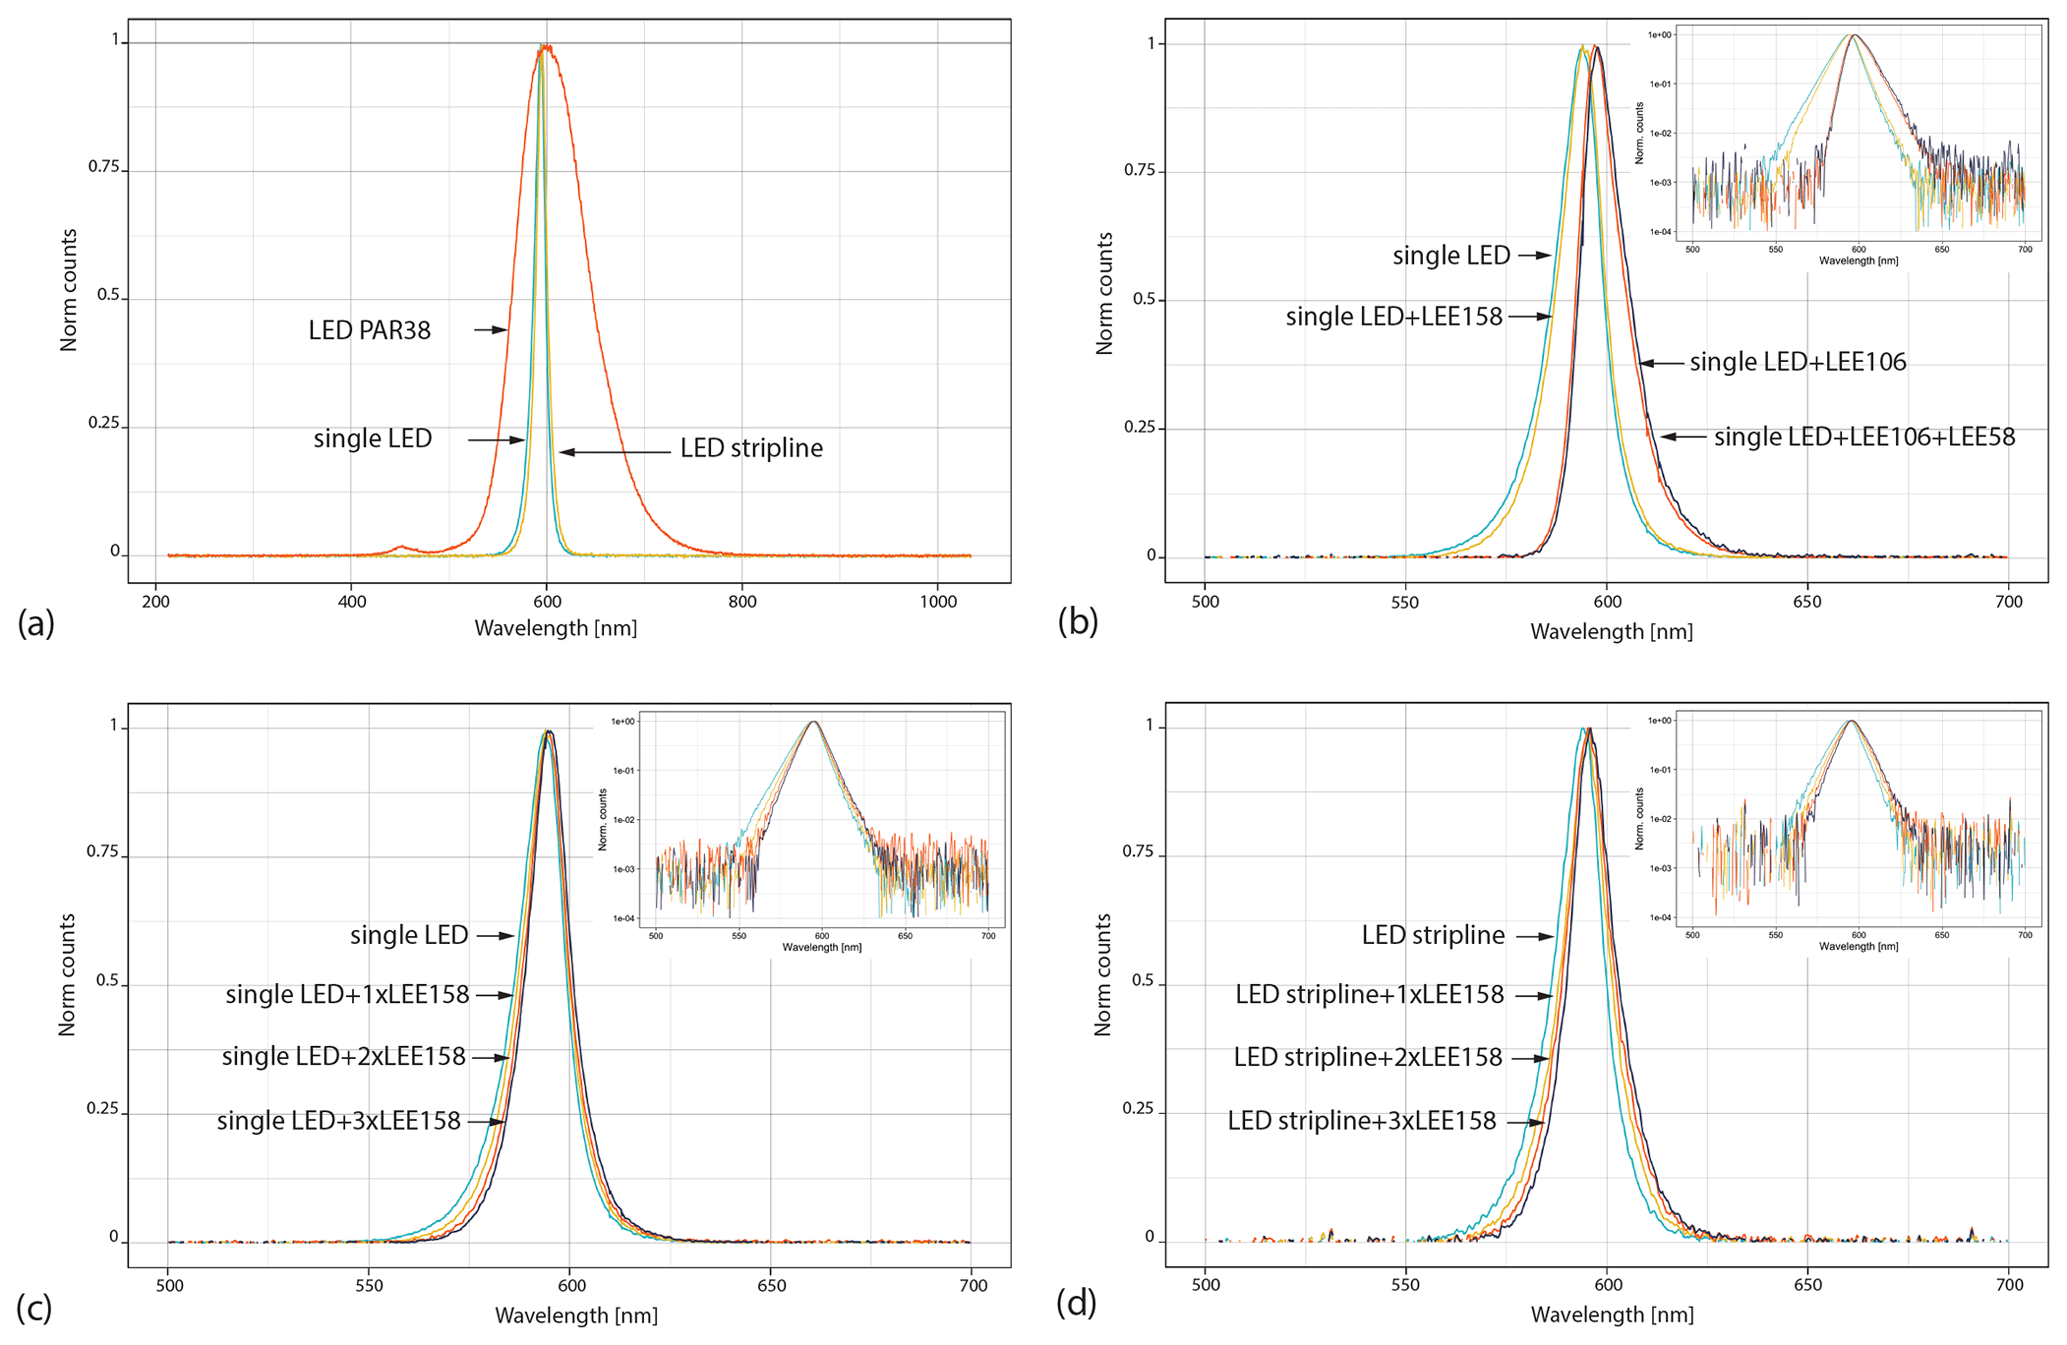
Figure 1The normalized emission spectra of (a) the LED PAR38, single LED, and LED stripline; (b) the single LED, though a different long-pass filter combination; (c) the single LED through layers of the 158 deep-orange LEE filter (LEE158); (d) the LED stripline through layers of the LEE158.
3.1 Lighting condition
The decay of luminescence in both quartz and feldspar can be induced by any wavelength of solar radiation. More precisely, the maximum bleaching rate of the quartz OSL signal is induced by short wavelengths (in the UV–blue–green region), while feldspar IRSL signals have their bleaching resonance in the long wavelengths (in the red–infrared region). Therefore, finding an optimum lighting condition for both quartz and feldspar is difficult. Some luminescence laboratories use red bulbs or red fluorescent tubes, which are particularly well adapted for quartz (Sutton and Zimmerman, 1978). Lamothe (1995) reports that restriction to the wavelength region 650–600 nm can be obtained from a white fluorescent tube using three layers of LEE 106 filters (i.e., deep red) and an infrared trimming glass filter. However, Lindvall et al. (2017) report a loss of 3 % to 21 % of the quartz luminescence signal intensity after 24 h of exposure to the red wavelength. For feldspar, there is an optimum at 620–540 nm in the yellow part of the spectrum (Fig. 1 in Huntley and Baril, 2002). Orange–yellow wavelengths can be obtained using a low-pressure sodium vapor lamp with appropriate yellow filters to block the blue to ultraviolet emissions (Spooner, 1993, 2000). Sohbati et al. (2017, 2021) also observed that using amber light-emitting diodes (LEDs) with an emission peak at 594 nm, quartz and feldspar lost only between 1 % and 3 % of luminescence signal intensity after 48 h of exposure.
On another note, a comfortable laboratory illumination level is required for the safety of those spending long hours working in the darkrooms. In low-light conditions (e.g., moonless night), human eyes have a maximum sensitivity at 507 nm (in the blue–green region), and red light is almost invisible. Green wavelengths cannot be used in our laboratory as our lighting environment, as it bleaches the quartz OSL signal. However, the closest solution, and therefore our best compromise, is the orange–yellow wavelength, similar to what was recommended by Sobhati et al. (2017, 2021).
3.2 Bleaching test procedure
All aliquots were bleached for 5 d in a solar simulator (UVACUBE400) equipped with a SOL500 lamp filtered with an H1 filter glass (transmission range from 315 to 800 nm). Quartz samples received an artificial beta dose of 5 Gy (calibration quartz) or 20 Gy (SB27). K-rich feldspar samples (SB36 and 44) received an artificial beta dose of 70 Gy. All the aliquots were placed at different locations in the darkrooms for 24, 72, 240, and 720 h, and their remaining dose was measured and normalized by the given dose. Noting that 720 h of exposure is an unrealistic exposure time for sample preparation in the laboratory, we nevertheless wanted to investigate the effect of extremely long exposure.
To monitor the bleaching effect of the ceiling fixtures, the aliquots were placed on a benchtop at a workstation. To monitor the bleaching effect of the dimmable LEDs, we fixed the light intensity at 20 % and 30 % of their maximum intensity inside our two fume hoods with a black benchtop and at 20 % inside our fume hood with a white benchtop.
In nature, the quartz OSL signal bleaches faster than the K-feldspar signals, and the K-feldspar IR50 signal bleaches faster than the K-feldspar pIR-IR290 signal. Therefore, the OSL and IR50 signals are key for monitoring the bleaching effect of our laboratory darkroom lights rather than the pIR-IR290. The IR50 signal is, however, and contrary to the pIR-IR290 signal, affected by anomalous fading, which is a loss of luminescence signal through time. To account for fading and overcome any laborious fading correction, we measured all the aliquots 720 h after the initial beta irradiation. In practice, a set of aliquots was given a dose of 70 Gy and then stored in the dark for 720 h, while another set of aliquots was exposed to a light source for 24 h and then stored in the dark for 696 h, and another set of aliquots was exposed for 72 h and then stored in the dark for 648 h, and so on. Assuming that all the aliquots are affected by the same fading rate after 1 month, any tendency that we will observe as a result of our bleaching test is assumed to be the only effect of the light exposure.
4.1 Spectral analysis
We measured the emission spectrum of three light sources: a red LED PAR38, a deep-orange single LED, and a dimmable deep-orange LED stripline. Details on the LEDs are reported in Table 1. The PAR38 LED emits a peak wavelength at ∼ 600 nm (full width at half maximum, FWHM: ∼ 84 nm) with a large tail in both the short- and the long-wavelength emissions and a low-intensity peak at ∼ 452 nm in the blue region of the spectrum (Fig. 1a). The single LED emits a peak wavelength of 594 nm, and the stripline of LEDs emits a peak wavelength at 596 nm (Fig. 1a). Both peaks are narrow, with a FWHM of ∼ 14 nm. Contrary to the red PAR38 LED, the single LED's and stripline LEDs' results are the closest to our preferred conditions.
The single LED and the stripline LEDs have, however, a tail in the short wavelengths starting at ∼ 530 nm in the green region of the spectrum. To reduce this short-wavelength emission, we measured the emission spectrum of the single LED with a series of long-pass filters: 106 primary red LEE, which has a cut-off at 580 nm, and 158 deep-orange LEE, which has a cut-off at 530 nm. As expected, the primary red filter successfully removed the short-wavelength emission (Fig. 1b); however, the peak wavelength shifted from 594 to 597 nm, and a tail in the long-wavelength emissions appeared (up to 640 nm). With the orange filter, the tail in the short wavelengths is slightly reduced, while the rest of the LED emission spectrum remains the same (Fig. 1b). Using both filters simultaneously results in an emission spectrum similar to the one obtained with the primary red filter (Fig. 1b). In order to narrow the emission band of the single LED, we measured its spectrum with additional layers of 158 deep-orange LEE long-pass filters. Figure 1c shows that adding one, two, or three layers of orange filters significantly contributes to reducing the short-wavelength emission while slightly increasing the long-wavelength emission. With three layers of orange filters, the single-LED peak wavelength is at 595 nm (FWHM ∼ 13 nm). Similarly, adding three layers of 158 deep-orange LEE long-pass filters in front of the stripline LEDs successfully removes the green emission (Fig. 1d), while the peak emission remains at 596 nm (FWHM ∼ 13 nm).
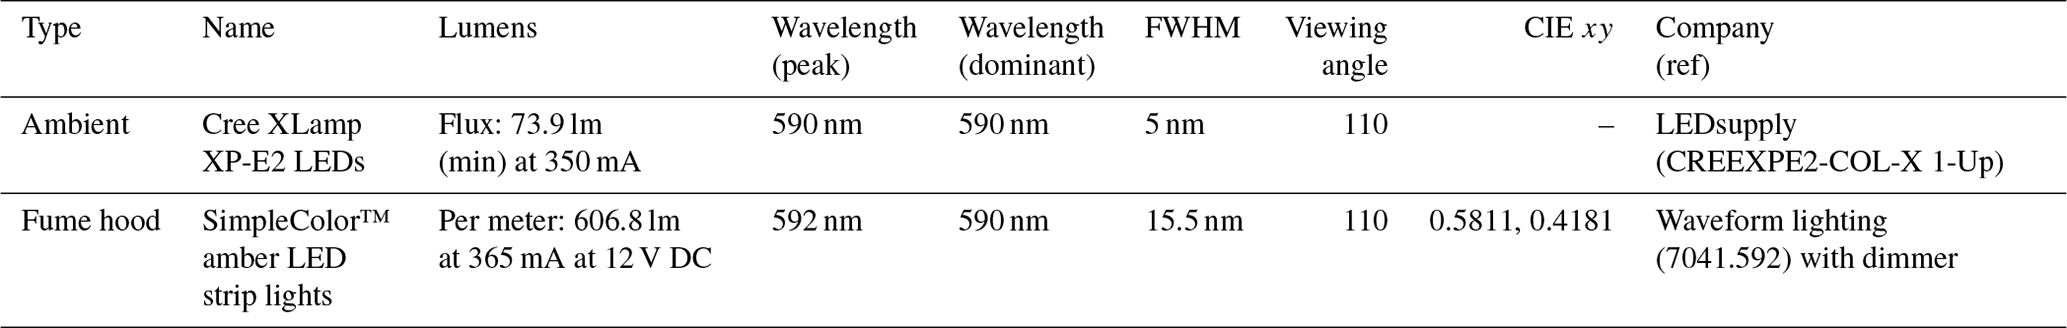
Our ceiling lighting consists of line track fixtures made of aluminum alloy placed ∼ 1.70 cm from the benchtop (Fig. 2a). Each fixture has a single orange LED covered by three layers of 158 deep-orange LEE filters and a transparent acrylic glass (1 mm thick). We checked that the transparent acrylic glass does not change the light spectrum. Inside the fume hoods, we used the dimmable LED stripline covered by three layers of 158 deep-orange LEE filters and a transparent acrylic glass (3 mm thick), placed at 1.20 cm from the benchtop (Fig. 2b–d). The same stripline of dimmable orange LEDs with 158 deep-orange LEE filters was fixed under the wall-mounted cabinets, 0.50 cm from the benchtop.
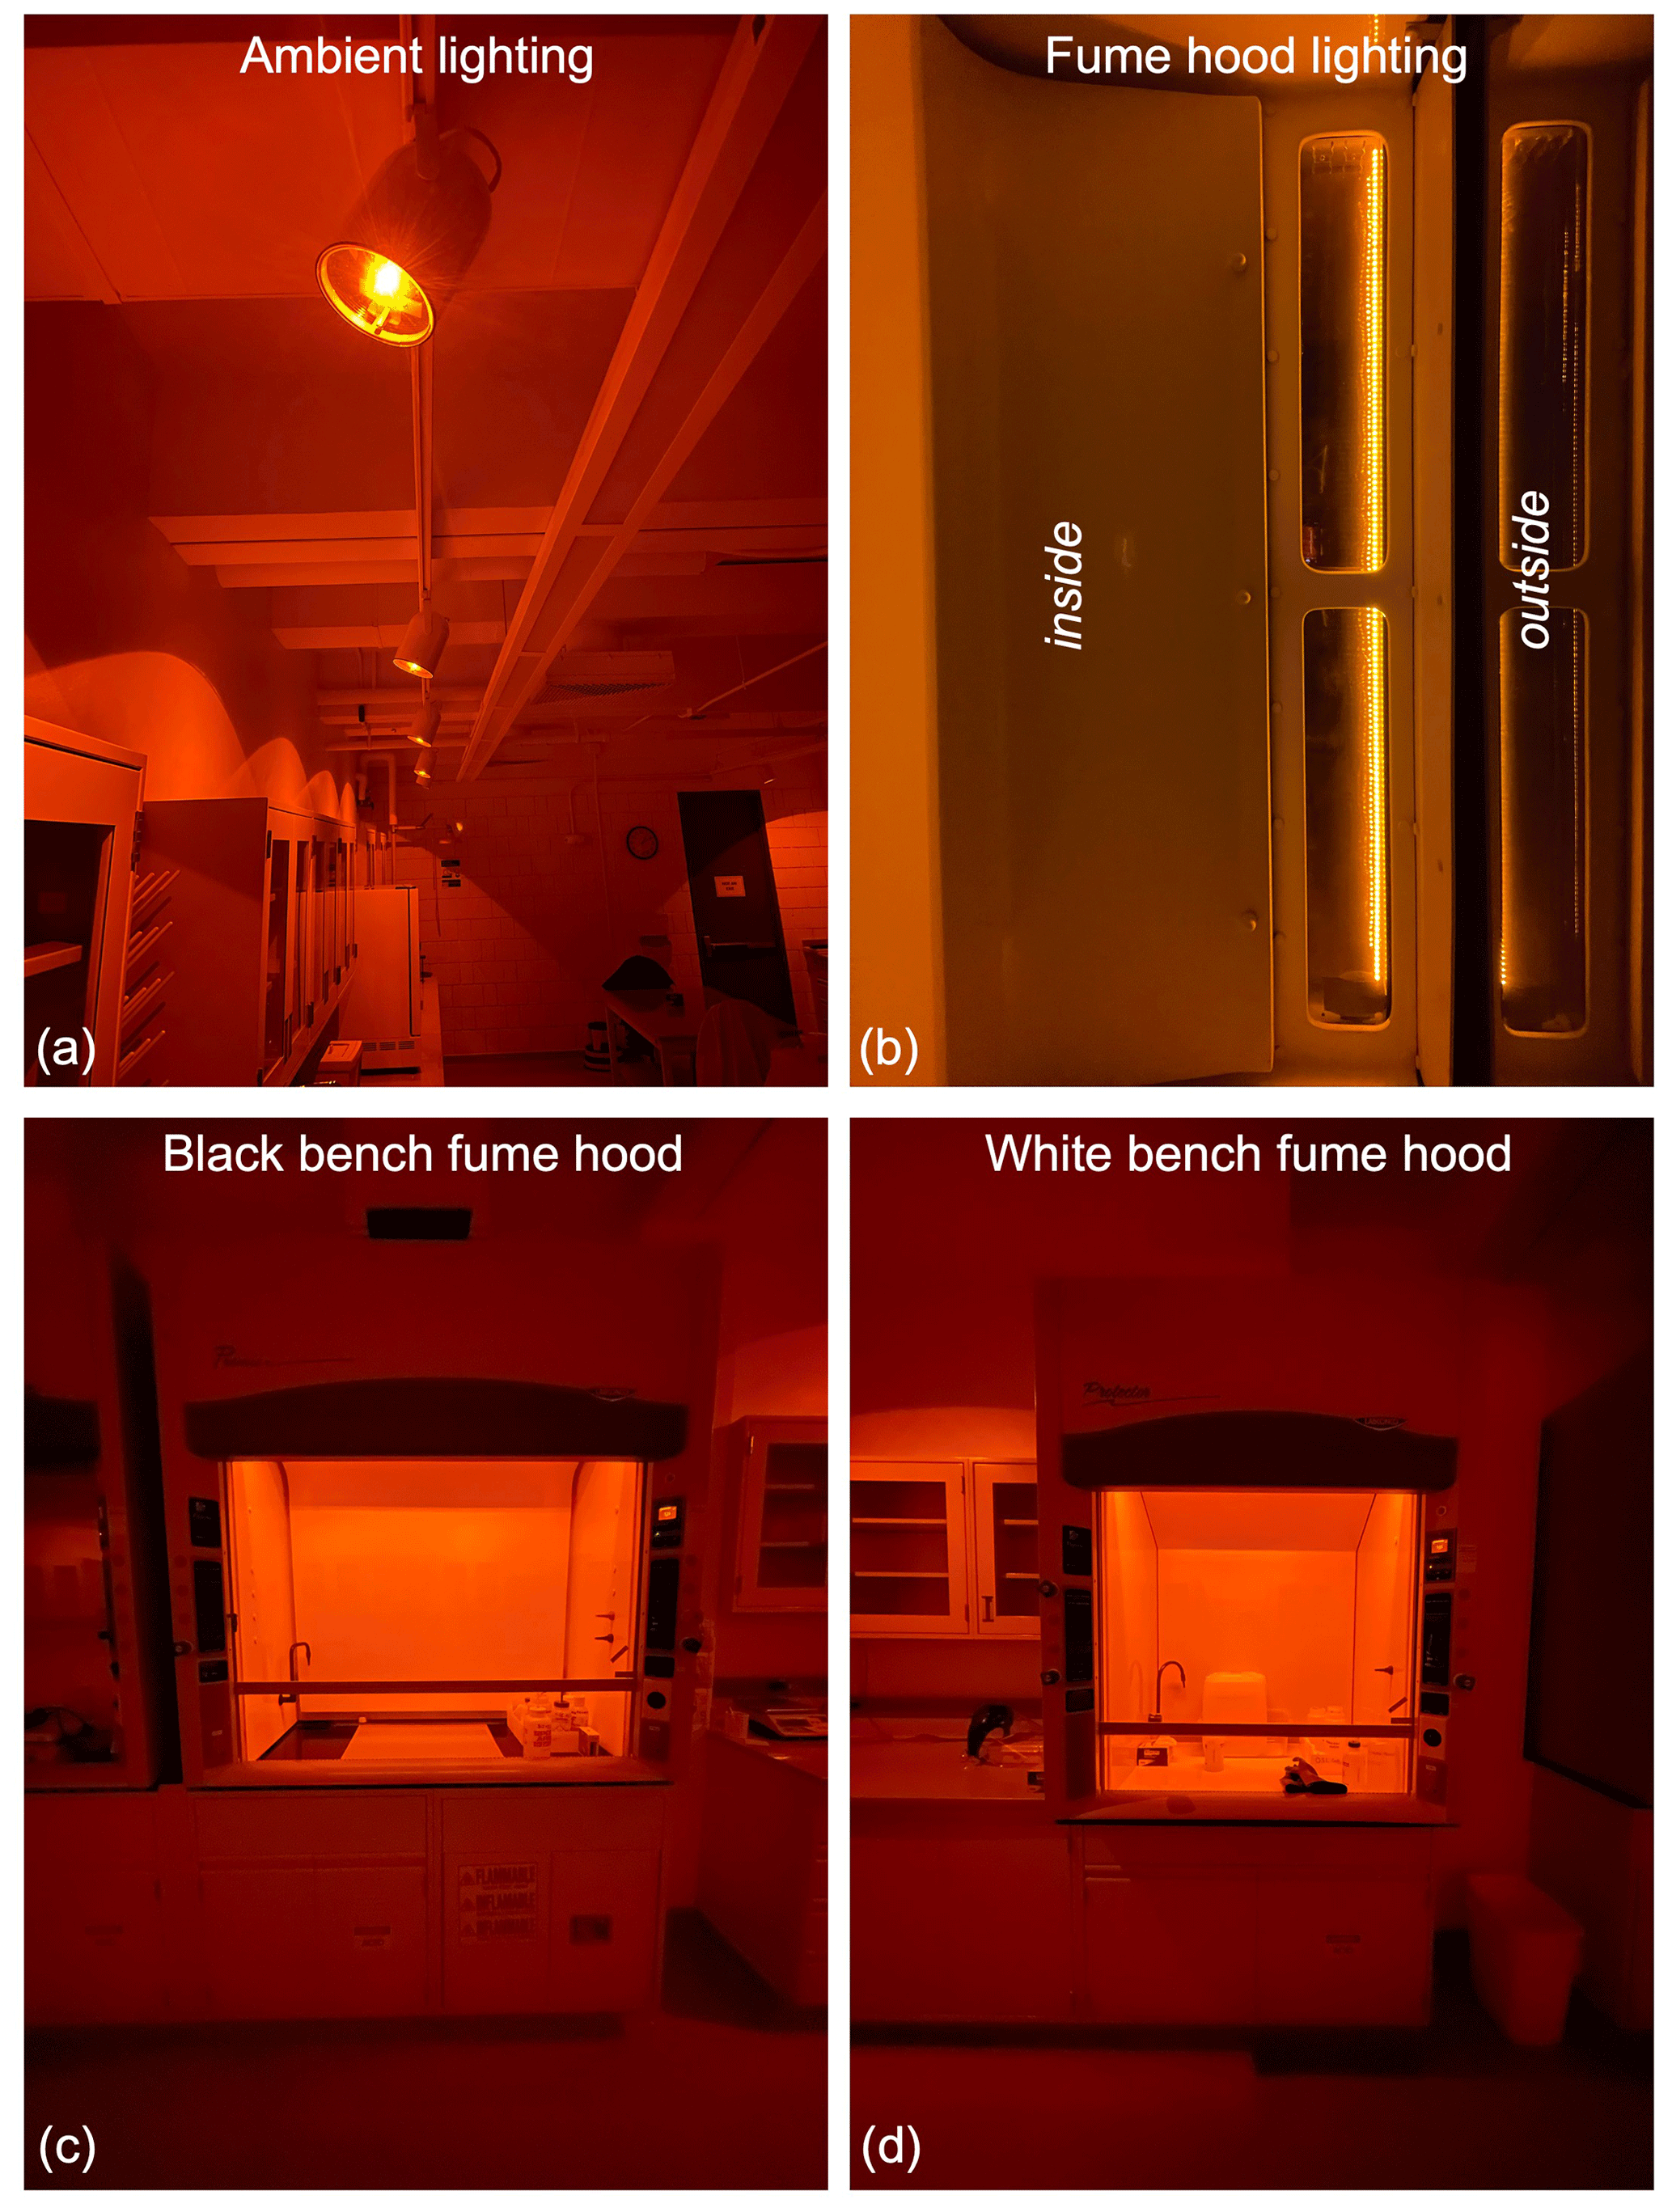
Figure 2Pictures of the laboratory setting in the laboratory darkroom showing the ceiling light fixture (a) and the fume hood lighting (b–d).
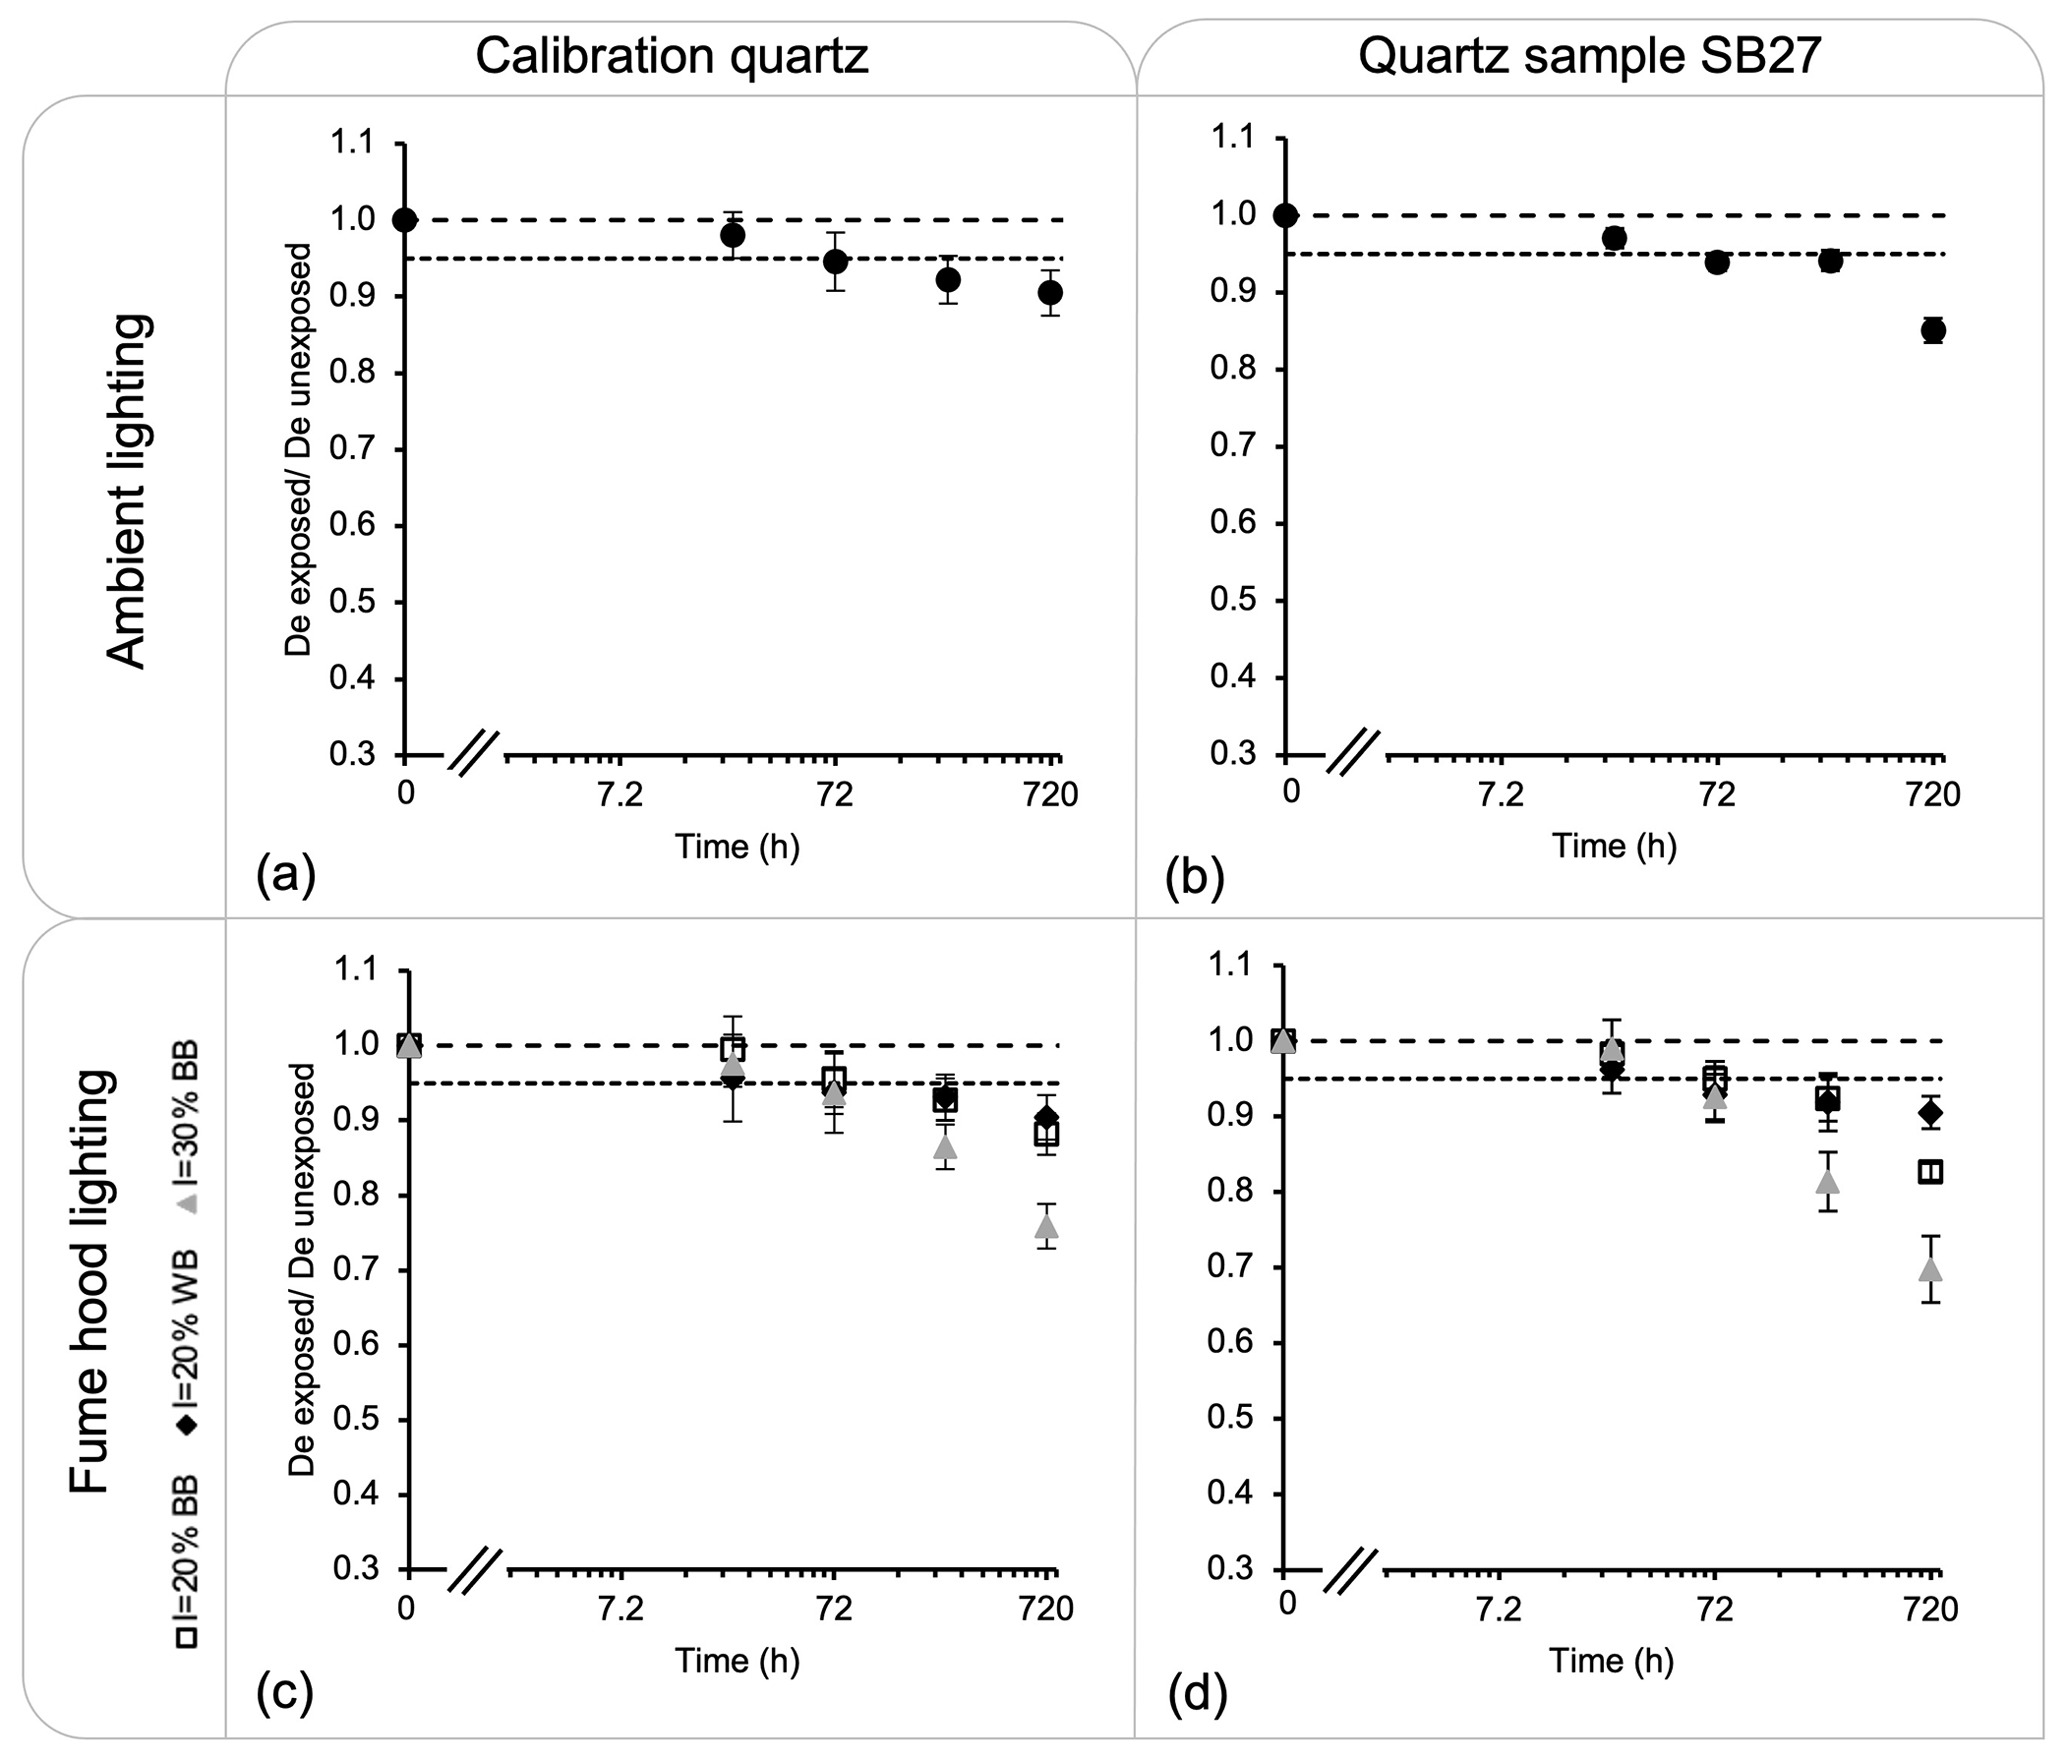
Figure 3Ratio between the measured OSL dose from aliquots exposed to light and the measured dose from aliquots unexposed. The figures show the results from (a) the Risø calibration quartz exposed to the ceiling light fixture, (b) the quartz sample SB27 exposed to the ceiling light fixture, (c) the Risø calibration quartz exposed to fume hood lighting, and (d) the quartz sample SB27 exposed to fume hood lighting. Three aliquots were measured per exposure time. The long dashed line indicates a ratio of 1, and the dashed line indicates a loss of 5 %.
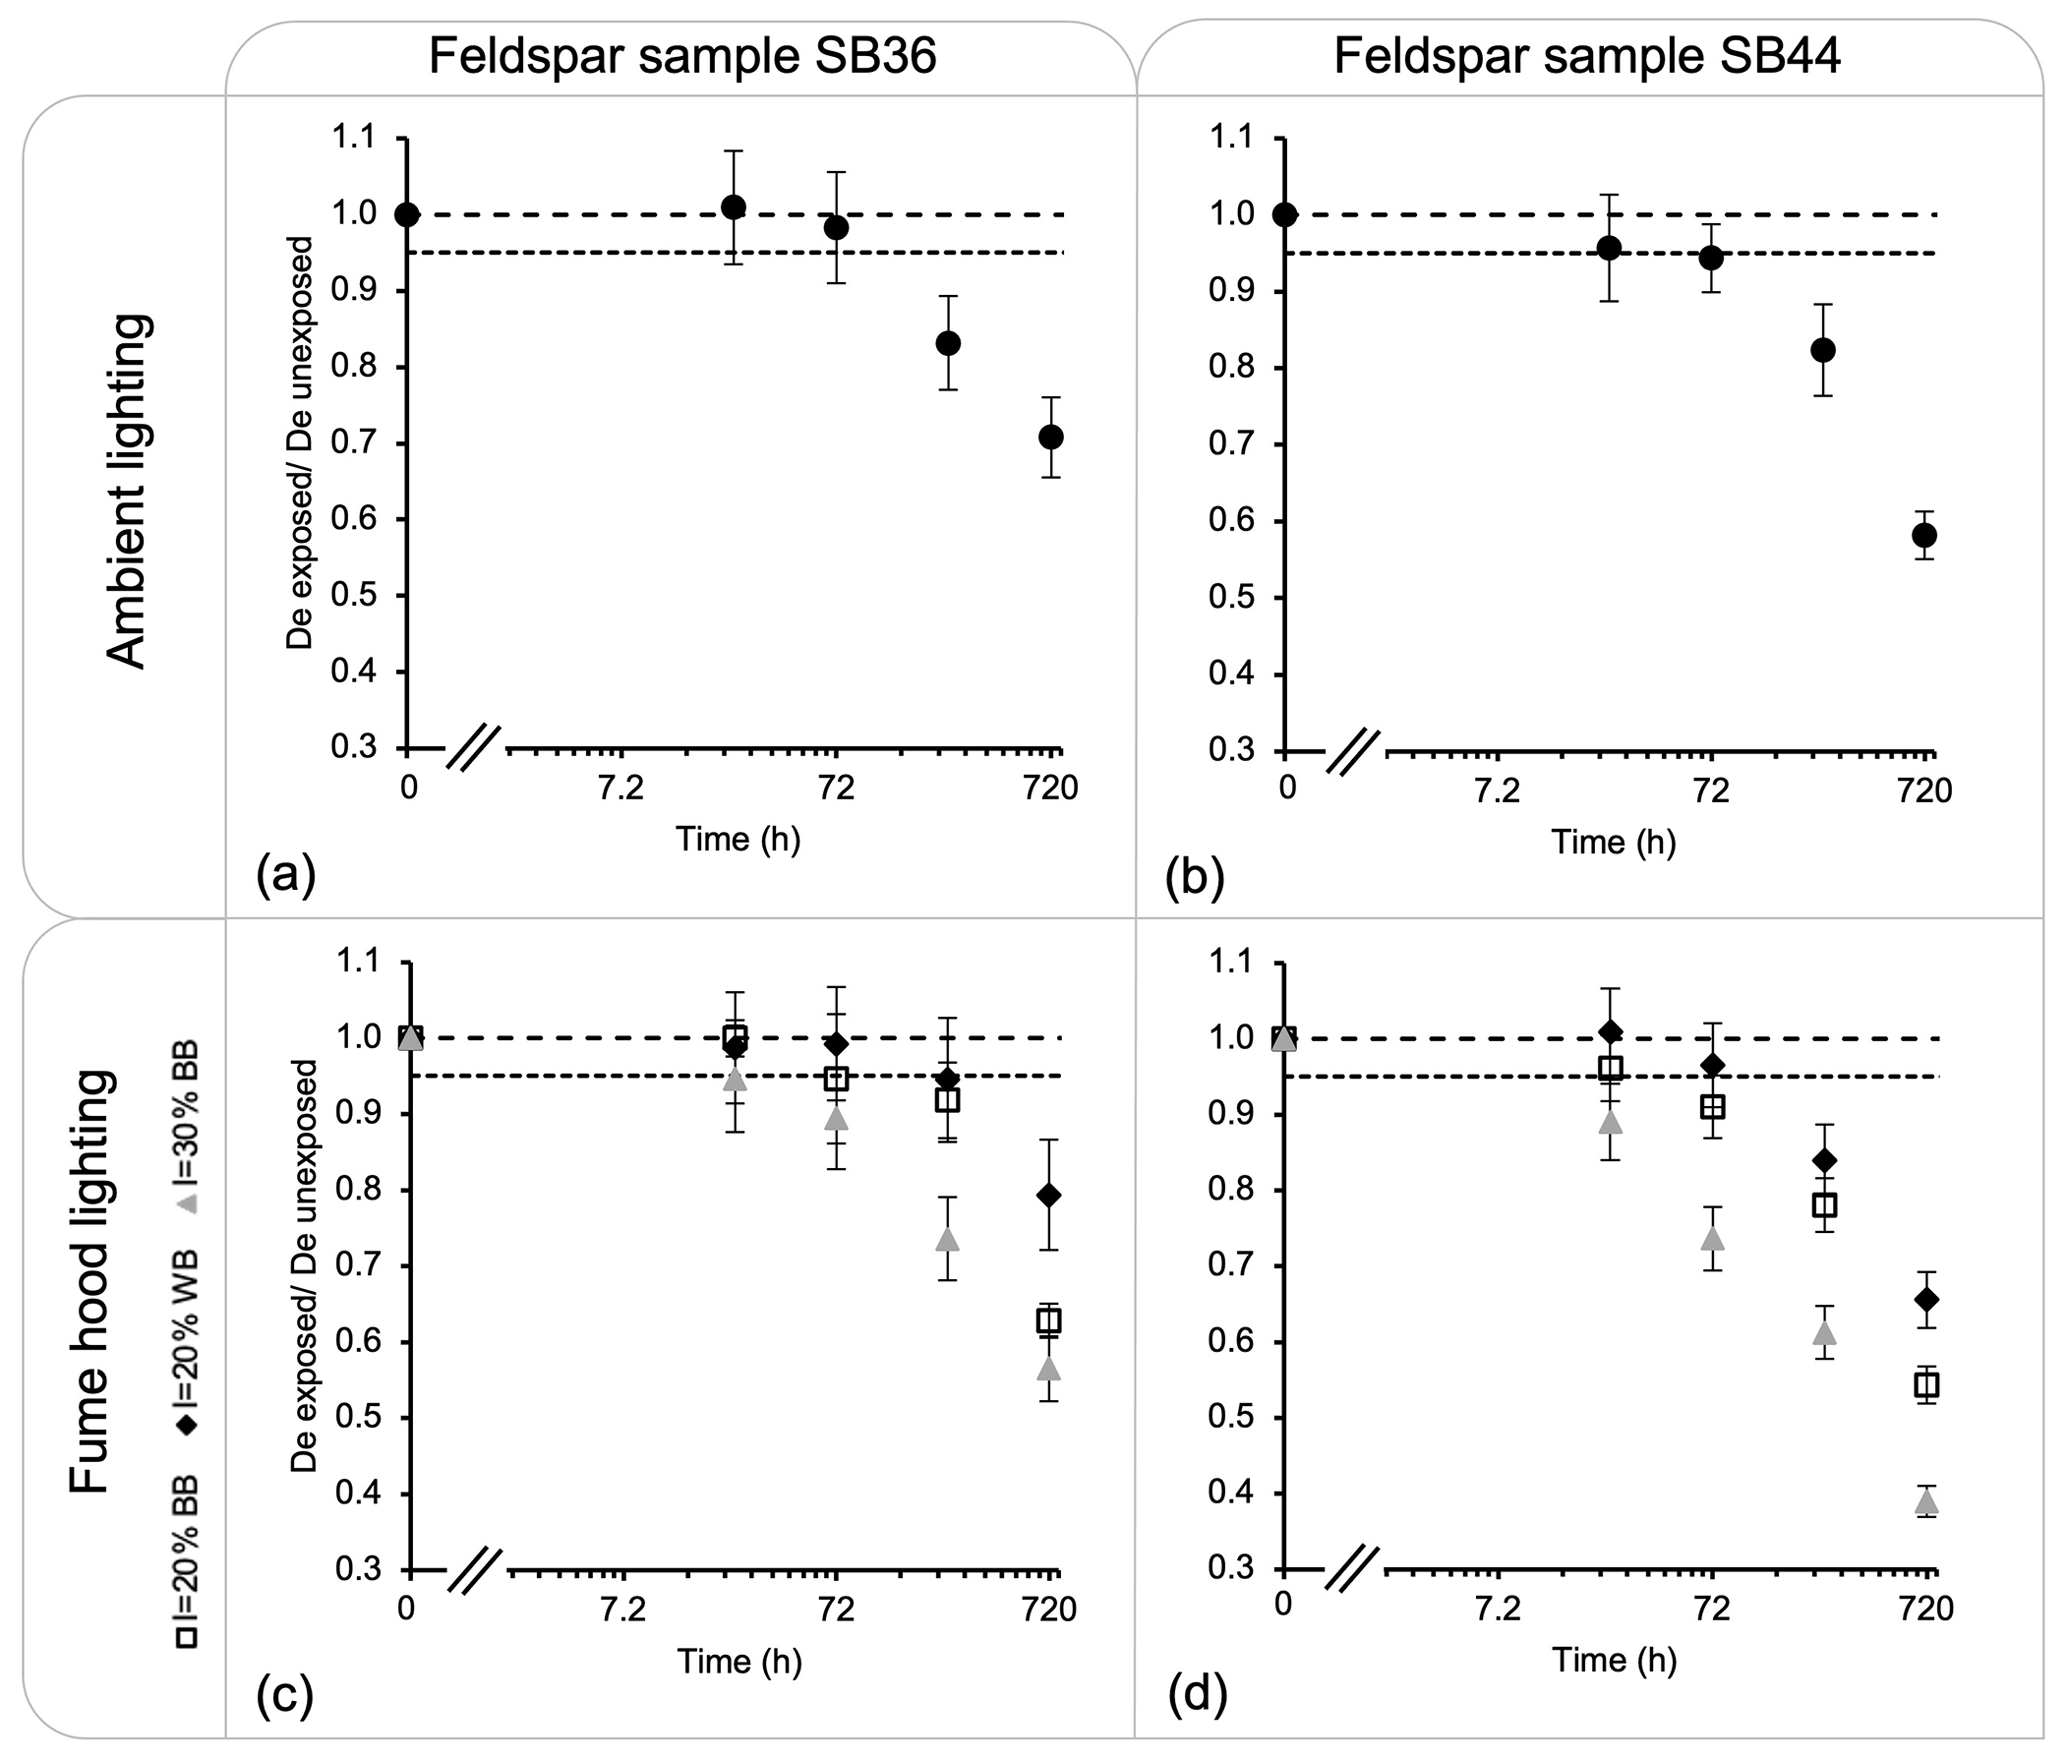
Figure 4Ratio between the measured IR50 dose from aliquots exposed to light and the measured dose from aliquots unexposed. The figures show the results from (a) the feldspar sample SB36 exposed to the ceiling light fixture, (b) the feldspar sample SB44 exposed to the ceiling light fixture, (c) the feldspar sample SB36 exposed to fume hood lighting, and (d) the feldspar sample SB44 exposed to fume hood lighting. Three aliquots were measured per exposure time. The long dashed line indicates a ratio of 1, and the dashed line indicates a loss of 5 %.
4.2 Bleaching test
Here we report on the capacity of our light sources in bleaching quartz and feldspar samples. Each ambient fixture delivers 0.4 lx at the sample location on a benchtop. The intensity of the LED stripline in fume hood no. 1 was fixed at 20 % and delivered 1.1 lx at the sample location on a white benchtop (referred to as I=20 % WB in Fig. 3). The intensity of the LED stripline in fume hood no. 2 was fixed at 20 % and delivered 1.1 lx at the sample location on a black benchtop (referred to as I=20 % BB in Fig. 3). The intensity of the LED stripline in fume hood no. 3 was fixed at 30 % and delivered 1.7 lx at the sample location on a black benchtop (referred to as I=30 % BB in Fig. 3). These settings remained constant throughout the experiment.
For all samples, we decided to report the results as dose loss because such a value is directly comparable to the equivalent dose.
However, it is worth noting that the signal intensity loss was equal to or lower (within 2 %) than the dose loss. Such a small difference could be due to the fact that some aliquots were re-used multiple times over this experiment, which may have affected the grain's sensitivity.
Figure 3a–b show the dose decrease after exposure to the ceiling light fixture for the Risø calibration quartz and sample SB27. Both samples displayed a ∼ 3 % (average) dose loss after 24 h and ∼ 5 % after 72 h. After a substantially longer exposure of 720 h, the Risø calibration quartz displayed a dose loss of ∼ 10 % and sample SB27 of ∼ 18 %. Figure 3c–d show the remaining dose after exposure to the LED striplines within the fume hoods. For the Risø calibration quartz, the dose loss is indistinguishable for the three settings after 24 h of exposure. Beyond this time, however, the fume hood with the LED set to an intensity of 30 % induced the fastest dose loss. The bleaching rates between the fume hood with the light intensity fixed at 20 % and the white benchtop or the black benchtop are indistinguishable. For both settings, the dose loss is ∼ 1 % after 24 h of exposure and ∼ 10 % after 720 h of exposure. For quartz sample SB27, a similar tendency has been observed; a dose loss of ∼ 1 % (average) has been recorded for the three settings after 24 h of exposure. For the fume hoods with the light intensity fixed at 20 %, a ∼ 10 % loss in dose was recorded after 240 h of exposure and up to 18 % after 720 h. The light fixed at 30 % intensity provoked the fastest dose loss.
This set of measurements has been repeated on two K-rich feldspar samples. The results show more dispersion in the measured dose, possibly due to the anomalous fading (all aliquots were stored and/or exposed for 30 d before measurement). Figure 4a–b illustrate the remaining dose after exposure to the ceiling light fixture. Before 72 h of exposure, the dose loss is less than ∼ 5 % for both samples, while after 72 h, there is a drastic decrease in dose for both samples. After 720 h of exposure, the dose loss is between 30 % and 40 %.
Figure 4c–d show the remaining dose of the initial given dose after exposure to the LED striplines within the fume hoods. The LEDs set to an intensity of 30 % displayed the most rapid dose loss. After 24 h of exposure, both samples lost between 5 % and 10 % dose, and up to ∼ 40 % to 60 % after 720 h of exposure. For the settings set at 20 % intensity, there was no dose loss recorded for sample SB36 after 24 h of exposure. The dose loss remains less than 5 % after 72 h of exposure and less than 10 % after 240 h. After 720 h of exposure, the dose loss ranges between 20 % and 40 %. For sample SB44 (Fig. 4d), the aliquots exposed to the LED stripline with an intensity of 30 % had a ∼ 10 % dose loss after 24 h and ∼ 60 % dose loss after 720 h of exposure. For the aliquots placed under the fume hoods with an LED intensity of 20 %, the dose loss was up to 5 % after 24 h, 10 % after 72 h, and between 30 and 40 % after 720 h. Overall, sample SB44 bleaches faster than sample SB36. A difference in bleaching response from different K-rich feldspar samples has been observed by Sohbati et al. (2017) and interpreted as being due to variation in the grain's optical transmission.
This experiment has been repeated to measure the bleaching effect of each setting on the pIR-IR290 dose of the same K-feldspar samples (SB36 and SB44) for up to 72 h of exposure. The measured doses are undistinguishable from the given dose at 1σ and therefore indicate no measurable bleaching effects of our light sources on the pIR-IR290 dose.
Our results show the same tendency as the results reported by others (e.g., Bailif and Poolton, 1991; Spooner, 1993, 1994a, b, 2000; Sohbati et al., 2017). The K-rich feldspar IRSL signal decays faster than the quartz OSL signal when exposed to yellow–orange light. The reason for such a difference is, however, not fully understood. Additional analyses on well-characterized samples from different origins would be required to understand the relationship between bleaching rate and geochemical composition.
Two lighting settings have been implemented in the new Luminescence Dating Research Laboratory at Stony Brook University. For ambient lighting, ceiling fixtures were equipped with single orange LEDs. For task-oriented lighting, a dimmable orange LED stripline was mounted below the wall-mounted cabinets and inside the fume hoods. Both settings are covered with three layers of 158 deep-orange LEE filters, and their peak wavelength is at 595 and 596 nm, respectively.
Our bleaching tests quantified the dose loss in quartz and K-rich feldspar samples with exposure. The ambient lighting delivering 0.4 lx at the sample position induced a loss of less than 3 % in the quartz OSL dose after 24 h of exposure and between 0 % and 5 % in the K-rich feldspar IR50 doses, with no effect on their pIR-IR290 dose. The fume hood lighting at an intensity of 20 %, delivering 1.1 lx at the sample position, induced a loss of less than 5 % in quartz OSL and K-rich feldspar IR50 dose after 24 h of exposure. At an intensity of 30 %, the stripline of LEDs induced more rapid bleaching. Therefore, we recommend using the dimmable orange LED stripline at more than 20 % intensity only in case of emergency or during lab cleaning.
Our setting is well adapted to luminescence dating darkrooms by providing a comfortable laboratory illumination for the operator, which has a minimal bleaching effect on the samples. During laboratory preparation, the samples are exposed to ambient lighting only for a few hours, mainly during sieving and density separation, and to the fume hood lighting for a few minutes when pouring chemicals. The total light exposure to darkroom lighting should be less than 24 h. In addition, extreme precautions should be taken at each step to avoid unnecessary light exposure by using non-transparent beakers when possible, covering the sample container with an opaque lid or aluminum foil, switching off the light in the fume hood when sample manipulation is not necessary, and storing the sample in an opaque container while preparing the aliquots. Finally, we plan on regularly monitoring the bleaching effect of our light sources as we work on samples from various origins.
All data sets are available at Zenodo https://doi.org/10.5281/zenodo.8427765 (Frouin et al., 2023).
MF designed the experiments, and TG carried them out. WH and OE built the ceiling light fixture. MF designed and built the LED striplines.
The contact author has declared that none of the authors has any competing interests.
Publisher’s note: Copernicus Publications remains neutral with regard to jurisdictional claims made in the text, published maps, institutional affiliations, or any other geographical representation in this paper. While Copernicus Publications makes every effort to include appropriate place names, the final responsibility lies with the authors.
Marine Frouin would like to thank Desmond DeLanty (architect) for designing the ceiling fixtures and installing the light sources in the laboratory.
This paper was edited by Sumiko Tsukamoto and reviewed by Helena Alexanderson and Tobias Lauer.
Aitken, M. J.: An introduction to optical dating, Oxford University Press, Oxford, Clarendon Press, ISBN-10:0198540922, 1998.
Duller, G. A. T.: The Analyst software package for luminescence data: overview and recent improvements, Ancient TL, 33, 35–42, 2015.
Frouin, M., Grandfield, T., Huebsch, W., and Evans, O.: Data for Technical note: Darkroom lighting for luminescence dating laboratory, Zenodo [data set], https://doi.org/10.5281/zenodo.8427765, 2023.
Hansen, V., Murray, A. S., Buylaert, J.-P., Yeo, E. Y., and Thomsen, K. J.: A new irradiated quartz for beta source calibration, Radiat. Meas., 81, 123–127, 2015.
Huntley, D. J. and Baril, M.: Yet another note on laboratory lighting, Ancient TL, 20, 39–40, 2002.
Huntley, D. J. and Lamothe, M.: Ubiquity of anomalous fading in K-feldspars and the measurement and correction for it in optical dating, Can. J. Earth Sci., 38, 1093–1106, 2001.
Lamothe, M.: Using 600–650 nm light for IRSL sample preparation, Ancient TL, 13, 1–4, 1995.
Lindvall, A., Stjern, R., and Alexanderson, H.: Bleaching of quartz OSL signals under natural and laboratory light conditions, Ancient TL, 35, 12–20, 2017.
Sohbati, R., Murray, A., Lindvold, L., Buylaert, J.-P., and Jain, M.: Optimization of laboratory illumination in optical dating, Quat. Geochronol., 39, 105–111, https://doi.org/10.1016/j.quageo.2017.02.010, 2017.
Sohbati, R., Kook, M., Pirtzel, L., and Thomsen, K.: Safelight for OSL dating laboratories: a follow-up study, Ancient TL, 39, 1–5, 2021.
Spooner, N. A.: The validity of optical dating based on feldspar, PhD Thesis, University of Oxford, 1993.
Spooner, N. A.: On the optical dating signal from quartz, Radiat. Meas., 23, 593–600, 1994a.
Spooner, N. A.: The anomalous fading of infrared-stimulated luminescence from feldspars, Radiat. Meas., 23, 625–632, 1994b.
Spooner, N. A., Questiaux, D., and Aitken, M.: The use of sodium lamps for low-intensity laboratory safelighting for optical dating, Ancient TL, 18, 45–49, 2000.
Sutton, S. R. and Zimmerman, D. W.: A blue-UV absorbing filter for laboratory illumination, Ancient TL, 5 pp., 1978.
Thiel, C., Buylaert, J. P., Murray, A., Terhorst, B., Hofer, I., Tsukamoto, S., and Frechen, M.: Luminescence dating of the Stratzing loess profile (Austria) – testing the potential of an elevated temperature post-IR IRSL protocol, Quaternary Int., 234, 23–31, 2011.