the Creative Commons Attribution 4.0 License.
the Creative Commons Attribution 4.0 License.
 | 19 Jan 2024
Insight into the dynamics of a long-runout mass movement using single-grain feldspar luminescence in the Pokhara Valley, Nepal
Anna-Maartje de Boer
Wolfgang Schwanghart
Jürgen Mey
Basanta Raj Adhikari
Tony Reimann
Mass movements play an important role in landscape evolution of high mountain areas such as the Himalayas. Yet, establishing numerical age control and reconstructing transport dynamics of past events is challenging. To fill this research gap, we bring luminescence dating to the test in an extremely challenging environment: the Pokhara Valley in Nepal. This is challenging for two reasons: (i) the optically stimulated luminescence (OSL) sensitivity of quartz, typically the mineral of choice for dating sediments younger than 100 ka, is poor, and (ii) highly rapid and turbid conditions during mass movement transport hamper sufficient OSL signal resetting prior to deposition, which eventually results in age overestimation. Here, we first assess the applicability of single-grain feldspar dating of medieval mass movement deposits catastrophically emplaced in the Pokhara Valley. Second, we exploit the poor bleaching mechanisms to get insight into the sediment dynamics of this paleo-mass movement through bleaching proxies. The Pokhara Valley is a unique setting for our case study, considering the availability of an extensive independent radiocarbon dataset as a geochronological benchmark.
Single-grain infrared stimulated luminescence (IRSL) signals were measured at 50 ∘C (IRSL-50) and post-infrared infrared stimulated luminescence signals at 150 ∘C (pIRIR-150). Our results show that the IRSL-50 signal is better bleached than the pIRIR-150 signal. A bootstrapped minimum age model (bMAM) is applied to retrieve the youngest subpopulation to estimate the paleodose. However, burial ages calculated with this paleodose overestimate the radiocarbon ages by an average factor of ∼23 (IRSL-50) and ∼72 (pIRIR-150), showing that dating of the Pokhara Formation with a single-grain approach was not successful for most samples. Some samples, however, only slightly overestimate the true emplacement age and thus could be used for a rough age estimation. Large inheritances in combination with the scatter in the single-grain dose distributions show that the sediments have been transported under extremely limited light exposure prior to deposition, which is consistent with the highly turbid nature of the sediment-laden flood and debris flows depositing the Pokhara gravels.
To investigate the sediment transport dynamics in more detail, we studied three bleaching proxies: the percentage of grains in saturation 2D0 criteria, the percentage of best-bleached grains (2σ range of bMAM-De) and the overdispersion (OD). None of the three bleaching proxies indicate a spatial relationship with runout distance of the mass movement deposits. We interpret this as evidence for the lack of bleaching during transport, which reflects the catastrophic nature of the event. While not providing reliable burial ages of the Pokhara mass movement deposits, single-grain feldspar dating can potentially be used as an age range finder method. Our approach shows the potential of luminescence techniques to provide insights in sediment transport dynamics of extreme and rare mass movement events in mountainous regions.
- Article
(5118 KB) - Full-text XML
-
Supplement
(9160 KB) - BibTeX
- EndNote


Mass movements such as landslides and debris flows belong to the most fatal and destructive geomorphological events in high-mountain areas (Froude and Petley, 2018). Sourced on steep mountain flanks, they are capable of displacing large volumes of sediment over hundreds of metres to several tens of kilometres (Hewitt, 1988; Shugar et al., 2021). As these mass movements propagate downstream, they put people, buildings, agricultural land and infrastructure at risk and impact river systems with high sediment loads, thus leading to widespread aggradation, affecting river habitats and drinking water quality. The Sixth Assessment Report of the IPCC (IPCC, 2022) indicates that many regions will face an increase in landslide activity in a future changing climate, but there is still low confidence about these predictions.
How landslide activity changes over time can be inferred from paleo-evidence (Gariano and Guzzetti, 2016). Several studies, for example, have compared ages of landslide deposits with paleoclimatic records (Borgatti and Soldati, 2010, and references therein). In rapidly eroding mountain areas, however, this approach is hampered due to the low preservation potential of the landslide deposits (Croissant et al., 2017). Moreover, diamictic sediments are often difficult to clearly attribute to mass movements as they resemble glacial deposits (Hewitt, 1999; Weidinger et al., 2014). To this end, there are multiple challenges in constraining the age of landslide deposits (Pánek, 2015; Zech et al., 2009). For example, there often is a lack of organic material for radiocarbon dating and even if it is available, radiocarbon ages should be seen as maximum ages as they may be affected by older organic material incorporated in the displaced sediment mass (Pánek, 2015).
To tap other avenues for dating mass movements, several studies have examined the potential of luminescence techniques (Eriksson et al., 2000; Fuchs et al., 2010; Tatumi et al., 2003). On geological timescales, mass movement deposits are freshly eroded from the bedrock. For example, deep-seated mass movements in young and active orogens usually entrain material with a short, if any, sedimentary history. This entails that quartz is often less sensitive than feldspar (Duller, 2006; Preusser et al., 2006) and that the quartz signal sensitivity varies widely over sedimentary settings (Preusser et al., 2009). In mountainous areas, such as the Himalayas, freshly eroded quartz often shows very poor luminescence sensitivity (Chamberlain et al., 2017; Jaiswal et al., 2009; Scherler et al., 2015). In contrast, feldspar from plutonic or metamorphic bedrock bears a measurable luminescence signal and has a higher intrinsic brightness than quartz (Guralnik et al., 2015). Moreover, the relatively short travel distance of mass movements and thus limited exposure time of individual grains often leads to heterogeneously bleached samples.
The degree to which samples are bleached is, aside from external factors, dependent on the intrinsic mineralogical properties as well as the signal used. Especially infrared stimulated luminescence (IRSL) signals from feldspars are prone to poor bleaching (Reimann et al., 2012) as the exposure to daylight resets the luminescence signal in feldspar at slower rates than in quartz (Godfrey-Smith et al., 1988; Thomsen et al., 2008), particularly with respect to the post-IR IRSL (pIRIR) signal (e.g. Buylaert et al., 2012; Kars et al., 2014). The challenge of heterogeneously bleached samples may be overcome by the application of single-grain measurement techniques (e.g. Bonnet et al., 2019). Single-grain analysis identifies best-bleached and heterogeneously bleached grains within samples (see review by Duller, 2008). For heterogeneously bleached samples – insufficient light exposure to reset the luminescence signal – single-grain dating could systematically curtail age overestimation by distinguishing those grains which are fully bleached before deposition thus capturing the “true burial age” from those which inherit a heterogeneously bleached signal. Statistical models, like the minimum age model (MAM) demonstrate that single-grain pIRIR dating can be decisive in overcoming age overestimation (Brill et al., 2018).
Feldspar minerals are prone to anomalous fading, especially when using the conventional IRSL signal, which is a major drawback in using feldspar for dating sediments. Anomalous fading is athermal loss of trapped charge resulting in dose underestimation. It is presumably caused by quantum mechanical tunnelling from the ground state of the trap (e.g. Jain and Ankjærgaard, 2011, and references therein). The combination of pIRIR stimulation, especially at moderate temperatures (<200 ∘C), and single-grain equivalent dose (De) analyses can correct for age underestimation effects caused by anomalous fading on burial age determination (Li et al., 2014; Reimann et al., 2012; Roberts, 2012; Thomsen et al., 2008) and potentially offer opportunities in dating mass movement or mega-lake deposits (Zhang et al., 2022). Furthermore, recent methodological developments have shown the potential of single-grain feldspar luminescence beyond dating deposits. For example, heterogeneous bleaching can be used to unravel recent and past sediment dynamics and is a promising proxy in the fields of sediment tracing, sediment provenance and sediment dynamics reconstruction (Bonnet et al., 2019; Chamberlain and Wallinga, 2019; Gray et al., 2019; Guyez et al., 2022; Reimann et al., 2015; Rhodes and Leathard, 2022; Riedesel et al., 2018; Sawakuchi et al., 2020). Another novel proxy that has been shown to be useful for sediment provenance analysis is the sensitivity of the quartz optically stimulated luminescence (OSL) signal (Souza et al., 2023).
In this study, we put luminescence dating to the test for sediment samples from the Pokhara Valley in central Nepal. The valley hosts extensive deposits of medieval mass-wasting events sourced from the Annapurna region (Schwanghart et al., 2016; Stolle et al., 2017). We apply single-grain feldspar pIRIR dating to study the suitability of the method to determine the age of catastrophic deposits emplaced by mass movement, thus expanding on the few previous works that have attempted to obtain luminescence burial data for deposits in and around the Himalayan Mountain range (Hu et al., 2015; Lavé et al., 2023). The obtained burial ages are compared with an extensive dataset of radiocarbon ages which offers an independent benchmark (Yamanaka, 1982; Fort, 1987; Schwanghart et al., 2016). Moreover, we analyse three luminescence-based bleaching proxies and test their consistency with the notion of a rapid, long-runout mass movement: the overdispersion, the percentage of saturated grains and the percentage of best-bleached grains as identified by the bootstrapped minimum age model (bMAM).
We conducted fieldwork in the Pokhara Valley, Nepal (28.2∘ N, 83.0∘ E) (Fig. 1). The valley contains one of the world's steepest topographic gradients as elevations drop from the >7000 m high peaks of the Annapurna Massif down to Pokhara City (∼800 m) in less than 35 km horizontal distance. Together with high seismicity in the region, this topographic setting primes the valley for very large, long-runout mass movements as testified by extensive mass-wasting deposits lining the valley bottom over a distance of ∼70 km (Fort, 1984, 1987, 2009; Yamanaka, 1982). Among the deposited layers, the Pokhara Formation is the youngest one (Fig. 1a). The 100 m thick formation comprises several, up to 10 m thick beds of massive, matrix-supported, very poorly sorted and locally fining-upward conglomerates, indicative of repeated surges of debris flows. The conglomerates are overlain by up to 40 m thick massive, clast-supported pebble- to granule-bearing sheets (Fig. 2). These sediments are interpreted to be deposited by rapid aggradation from turbulent, sediment-laden flow due to the absence of current structures and erosive contacts. Dark Nilgiri limestone as well as kyanite–sillimanite gneiss, pyroxenic marble and augen gneiss dominate the lithological composition of the deposits and attest to their High Himalayan and Tethyan origin. The lithological composition further enables us to distinguish the deposits from local sediments derived from Lesser Himalayan low-grade phyllitic bedrock (Schwanghart et al., 2016; Stolle et al., 2017). The estimated volume of 4–5 km3 of the Pokhara Formation can thus be unambiguously associated with a localized source in the Sabche Cirque (Lavé et al., 2023), which enables us to infer transport distances.
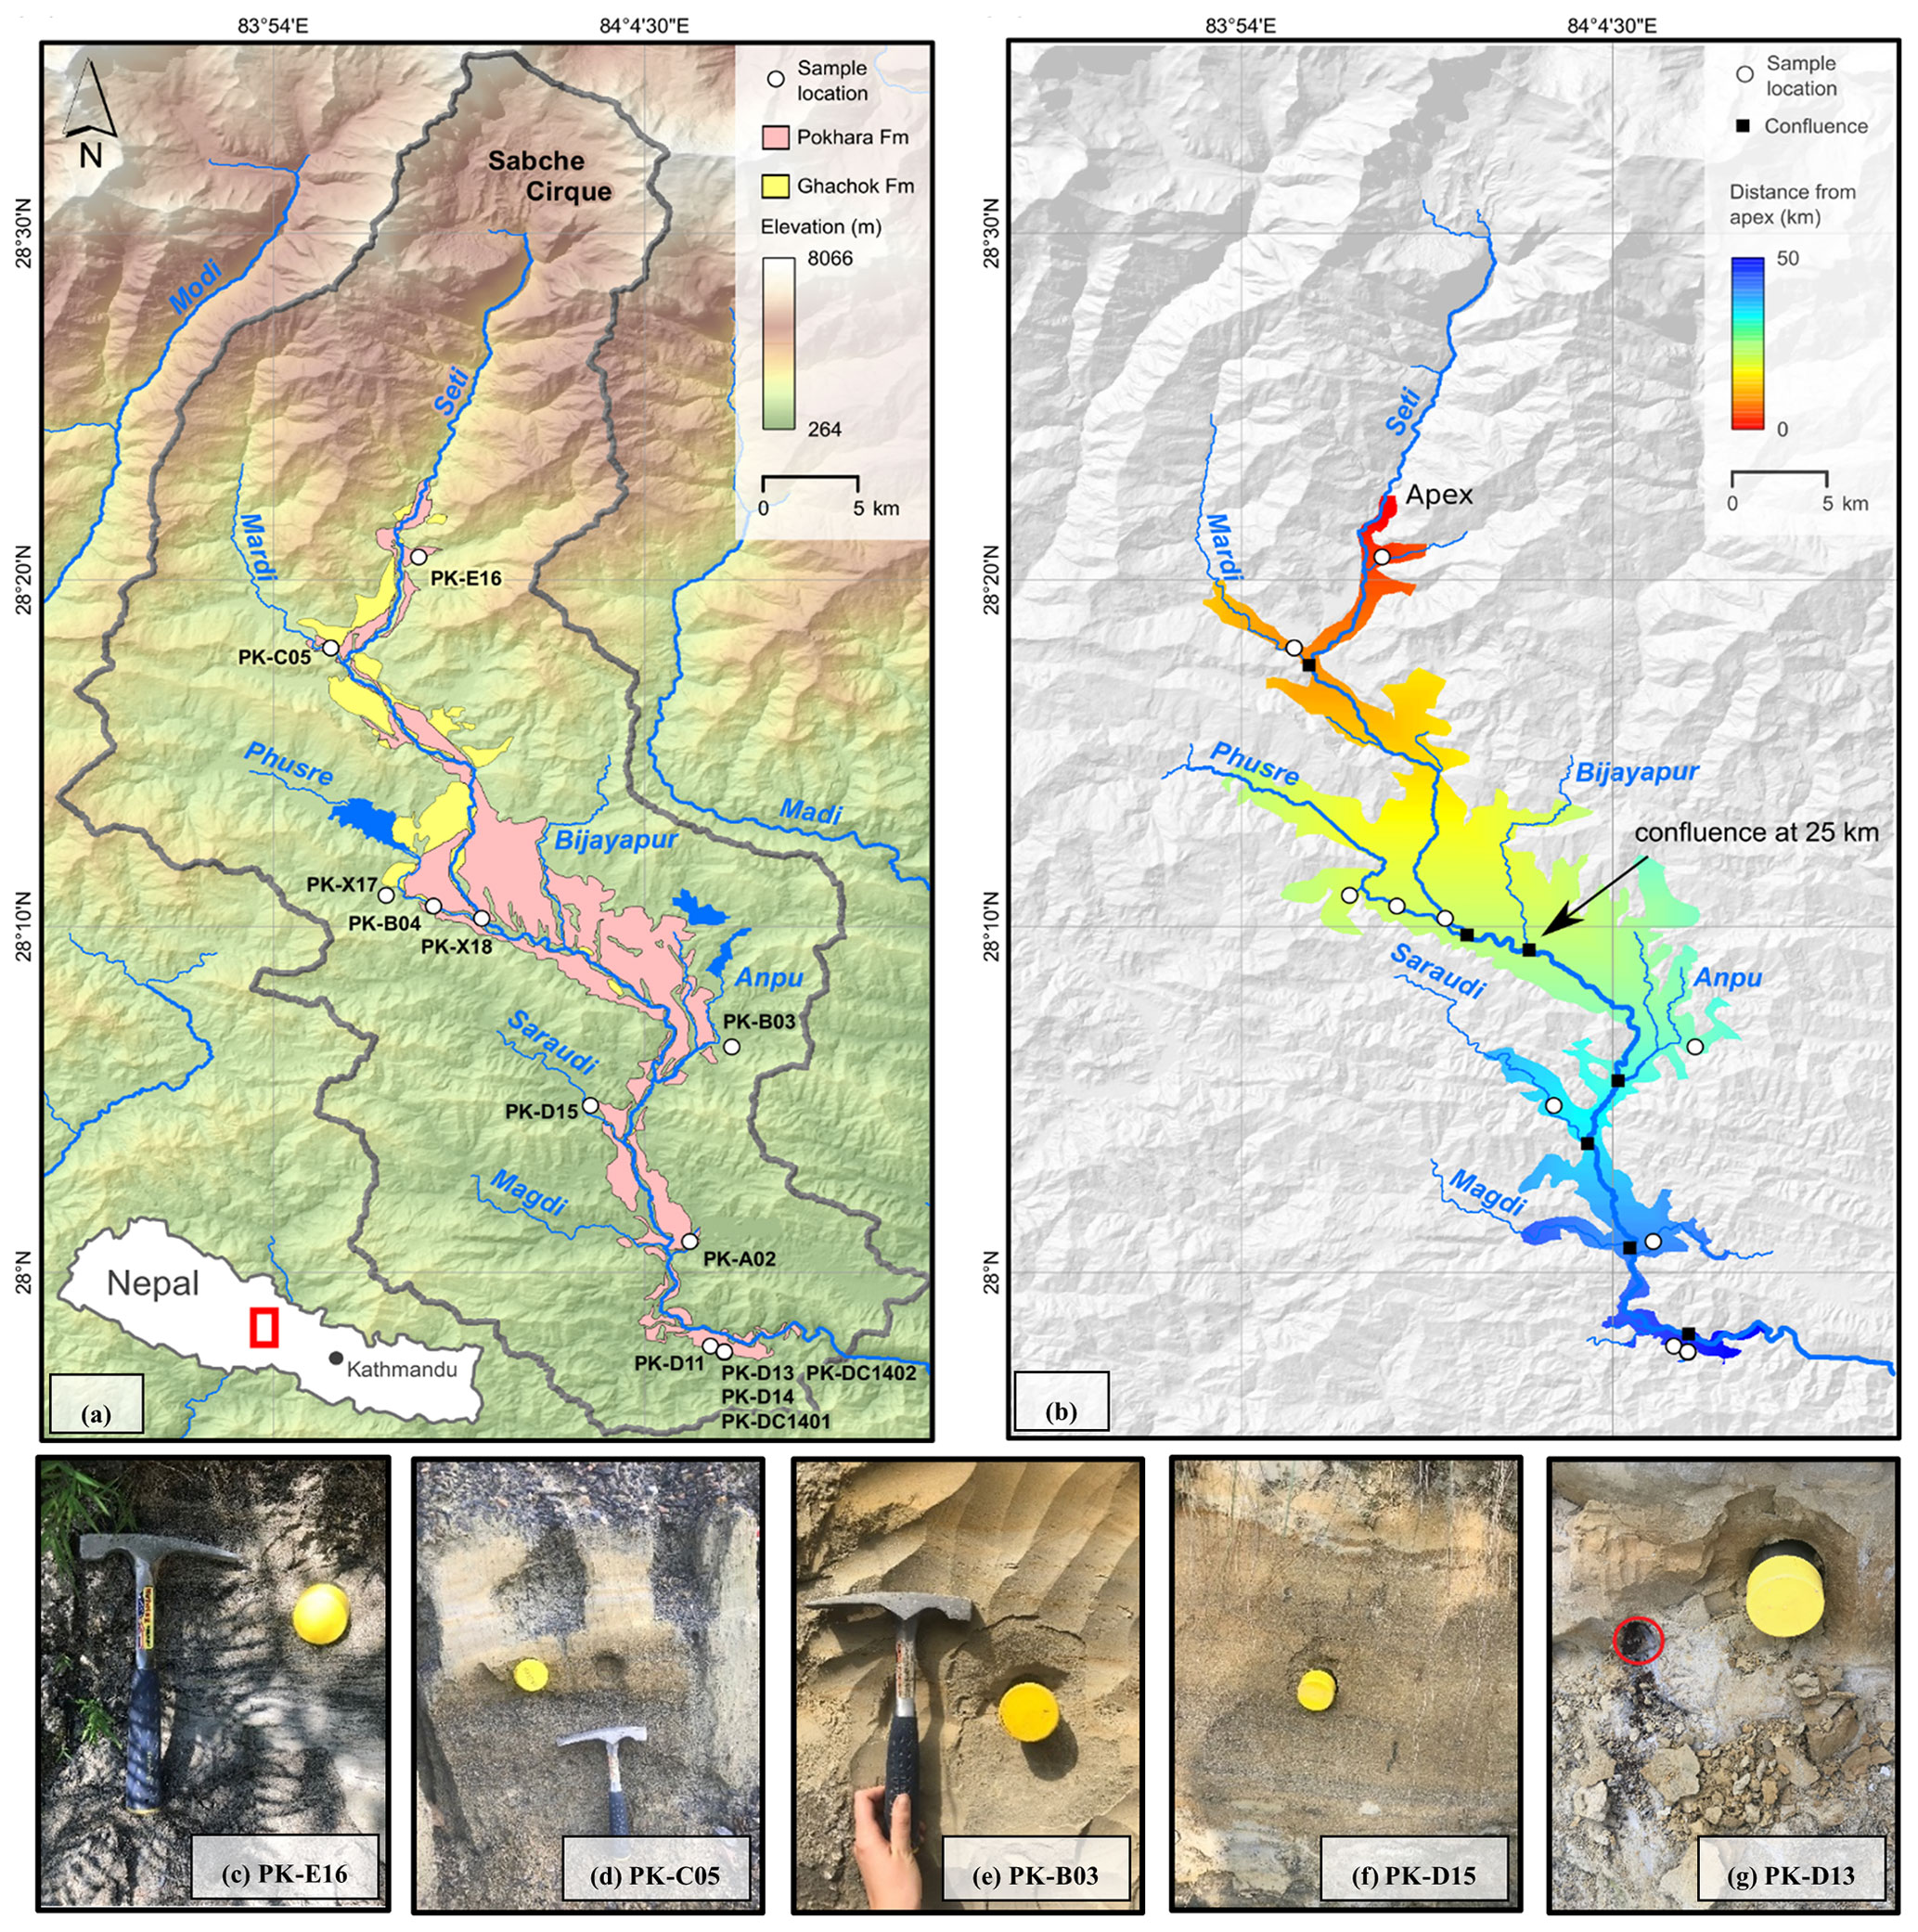
Figure 1Map of the Pokhara Valley in central Nepal (a), displaying the sampled locations (white round symbols) and the Pokhara and Ghachok formations. The map in panel (b) shows the distance from the fan apex in the Pokhara Valley and all river tributaries and their confluences (square black symbols). Pictures (c–g) illustrate sample locations Pk-E16 (c), Pk-C05 (d), Pk-B03 (e), Pk-D15 (f) and Pk-D13 (g). The red circle (g) indicates the location of radiocarbon sample Pk_DC_1402.
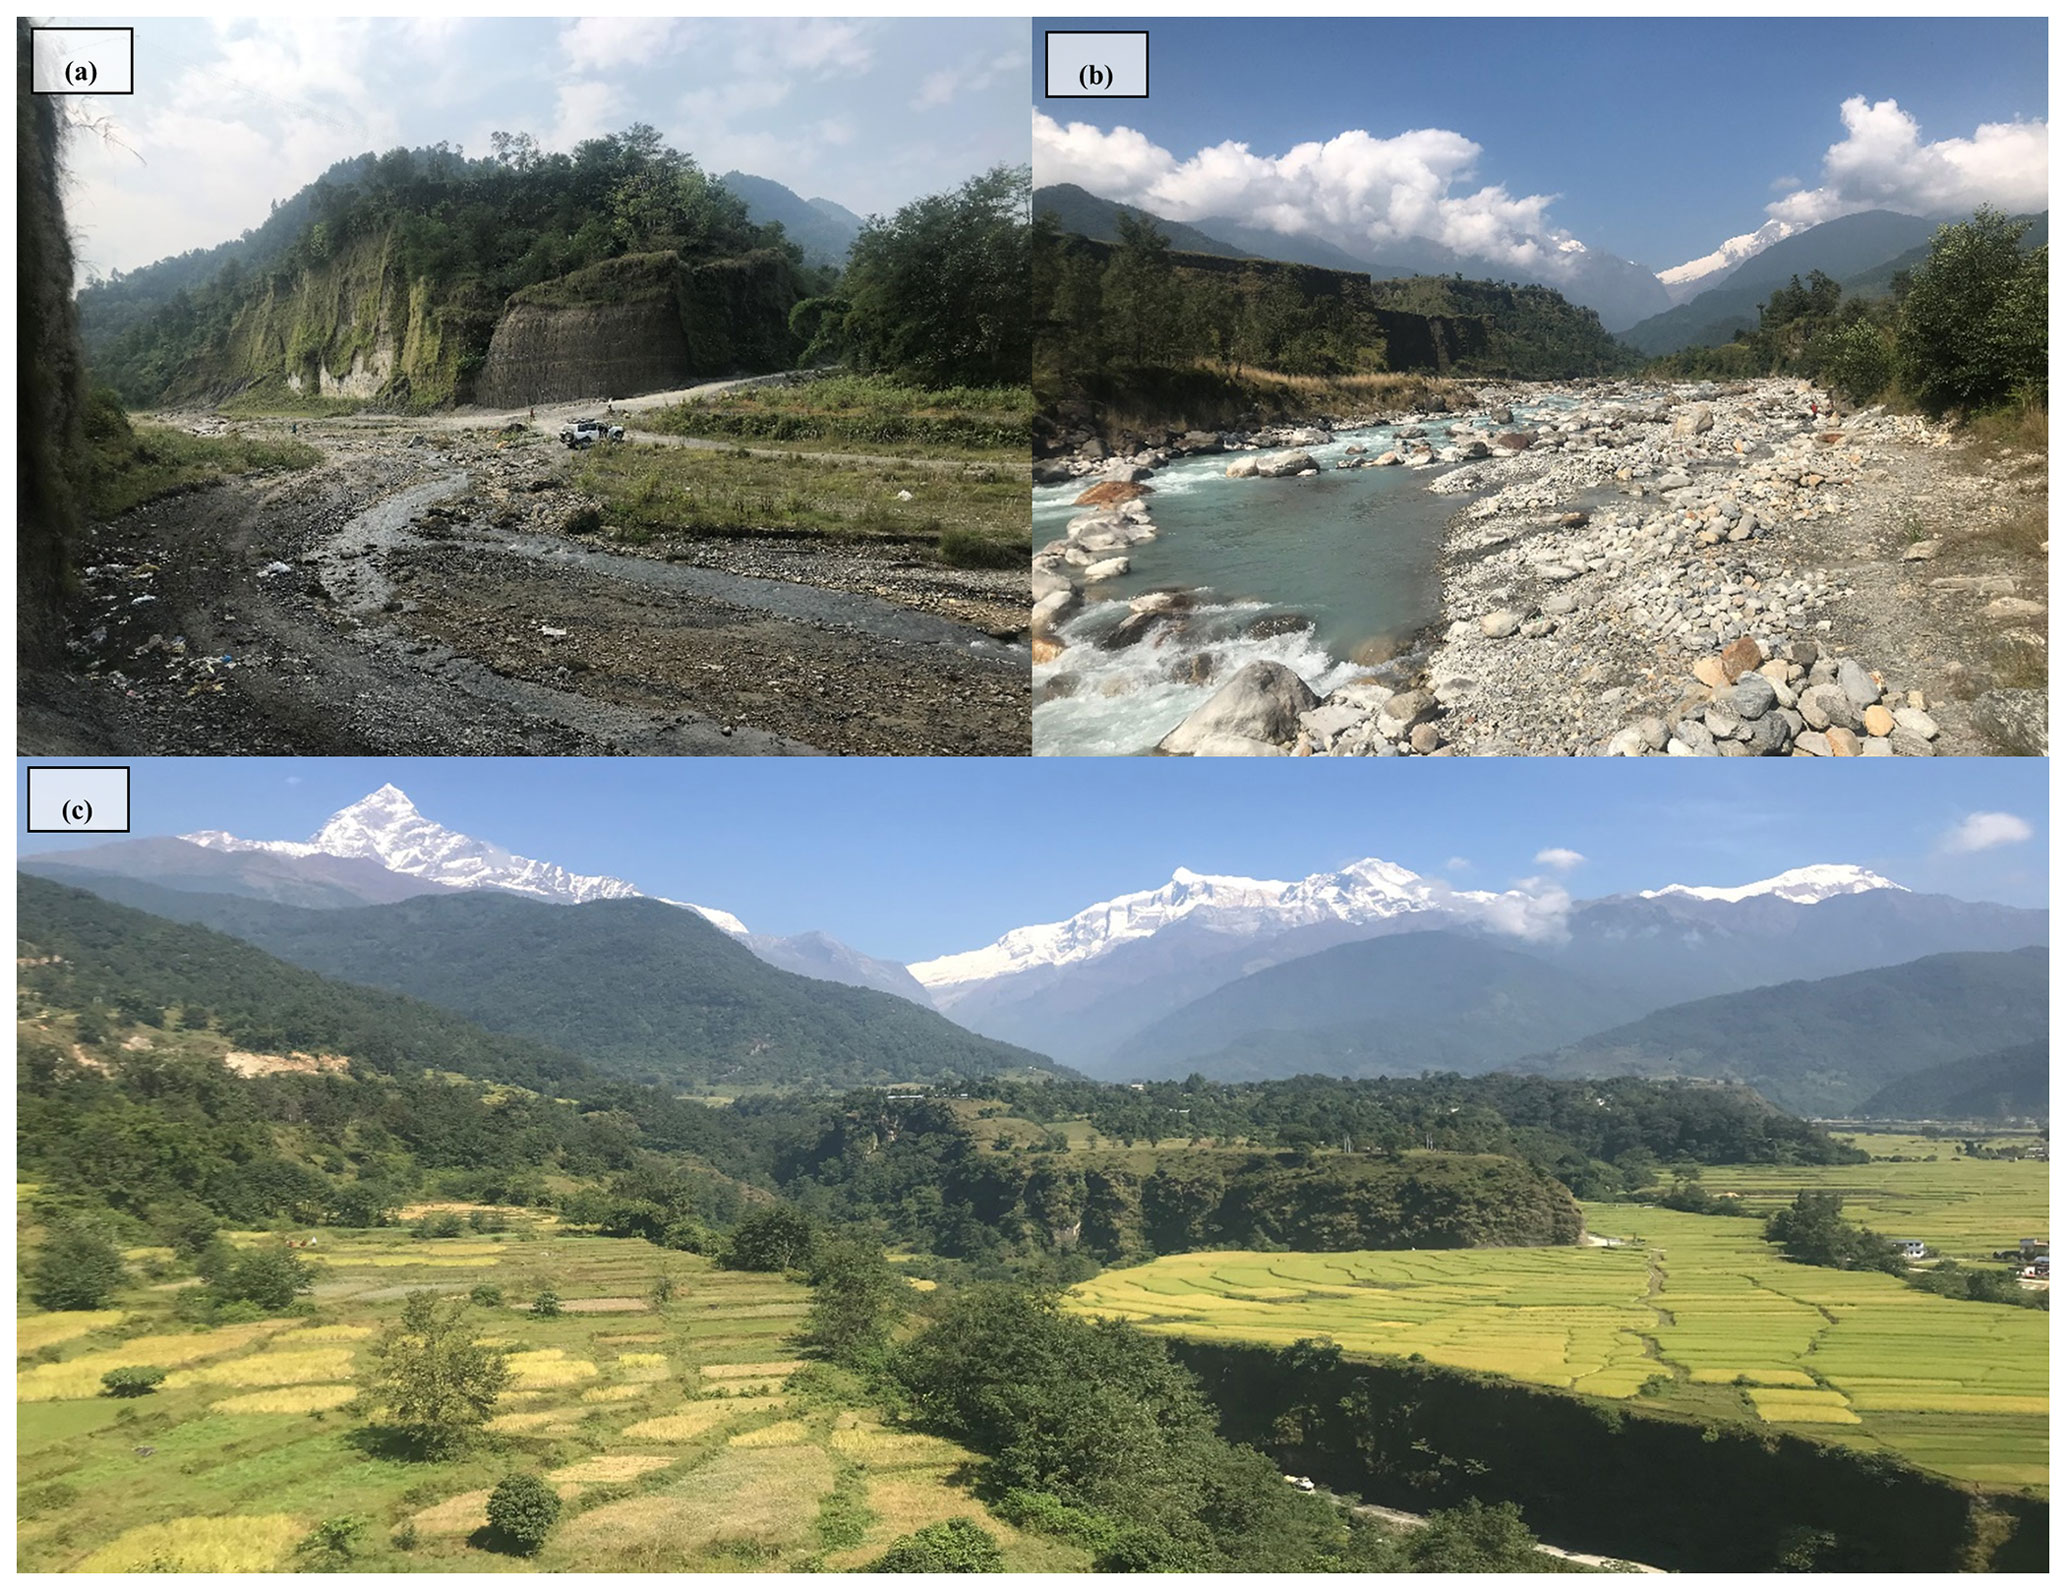
Figure 2Photographical impression of the incised Pokhara Formation (a–c) and the Seti River and its tributaries. The snow-covered mountain range depicts the Annapurna Massif; the highest mountain peak (c) is the Machapuchare, locally known as the fishtail mountain.
Deposits of the Pokhara Formation form an extensive debris fan perched on and spatially confined by the Pokhara Valley (Fig. 2a–c). The sediments are accessible downstream from the apex of this fan. Further upstream, in the Seti Gorge, the sediments are preserved in a few isolated hills within the valley (Lavé et al., 2023) which were not accessible at the time of our fieldwork. A radiocarbon-based geochronology of 37 radiocarbon ages from charcoal, wood, humic silt, peat, intact leaves and soils (Fort, 1987; Schwanghart et al., 2016; Stolle et al., 2017; Yamanaka, 1982) was mostly recovered upstream in tributaries to the Seti River. The debris flow and flood deposits were swept up to 7 km into these tributaries where reduction in flow velocities led to the deposition of fine materials (e.g. slack water deposits) together with organic material often found at the top of silty beds. The (re-)calibrated (Ramsey, 2009) radiocarbon dates show that the emplacement of the Pokhara Formation is consistent with the timing of M>8 medieval earthquakes shattering the region between 1100 and 1344 CE, with the 1222 CE earthquake being the event releasing most of the material from the Annapurna Massif (Stolle et al., 2017).
3.1 Luminescence and radiocarbon sampling and measuring
We collected samples along the entire flow distance between the apex and the most distal parts of the Pokhara Formation (Figs. 1 and 2a–c) for luminescence dating in the autumn of 2019. Sample preparation and analysis were conducted at the Netherlands Centre for Luminescence dating (NCL) at Wageningen University under amber light conditions. The outer 3 cm of sand from each tube were used for environmental dose rate (Dr) measurements, and the rest of the sample was sieved at a grain size of 212–250 µm for paleodose estimation. We added a 10 % HCl solution to the 212–250 µm fraction to remove carbonates. Consecutively, organic matter was removed with a 10 % H2O2 solution. To obtain K-feldspars with a density ranging between 2.50 and 2.56 g cm−3, we conducted a heavy liquid density separation of quartz and feldspar. First, quartz grains were removed by adding LST heavy liquid with a density of 2.63 g cm−3 and etched in a 10 % HF solution. Subsequently, the K-feldspar grains were isolated from the Na-feldspar grains by adding a liquid with a density of 2.58 g cm−3 and mounted on single-grain discs. The bulk sediment for Dr measurement was dried overnight at 105 ∘C and then weighted to calculate the moisture content. Then the samples were ashed overnight at 550 ∘C to determine their organic matter content and ground to obtain a homogeneous sample with particles smaller than 300 µm. Then, pucks were formed by adding melted wax, and the activity of radioactive nuclides was measured with gamma spectrometry. A substantiation of the determined dose rates can be found in the Supplement, this includes internal and external alpha, gamma and cosmic-ray values, as well as grain size and water-attenuated dose rate values.
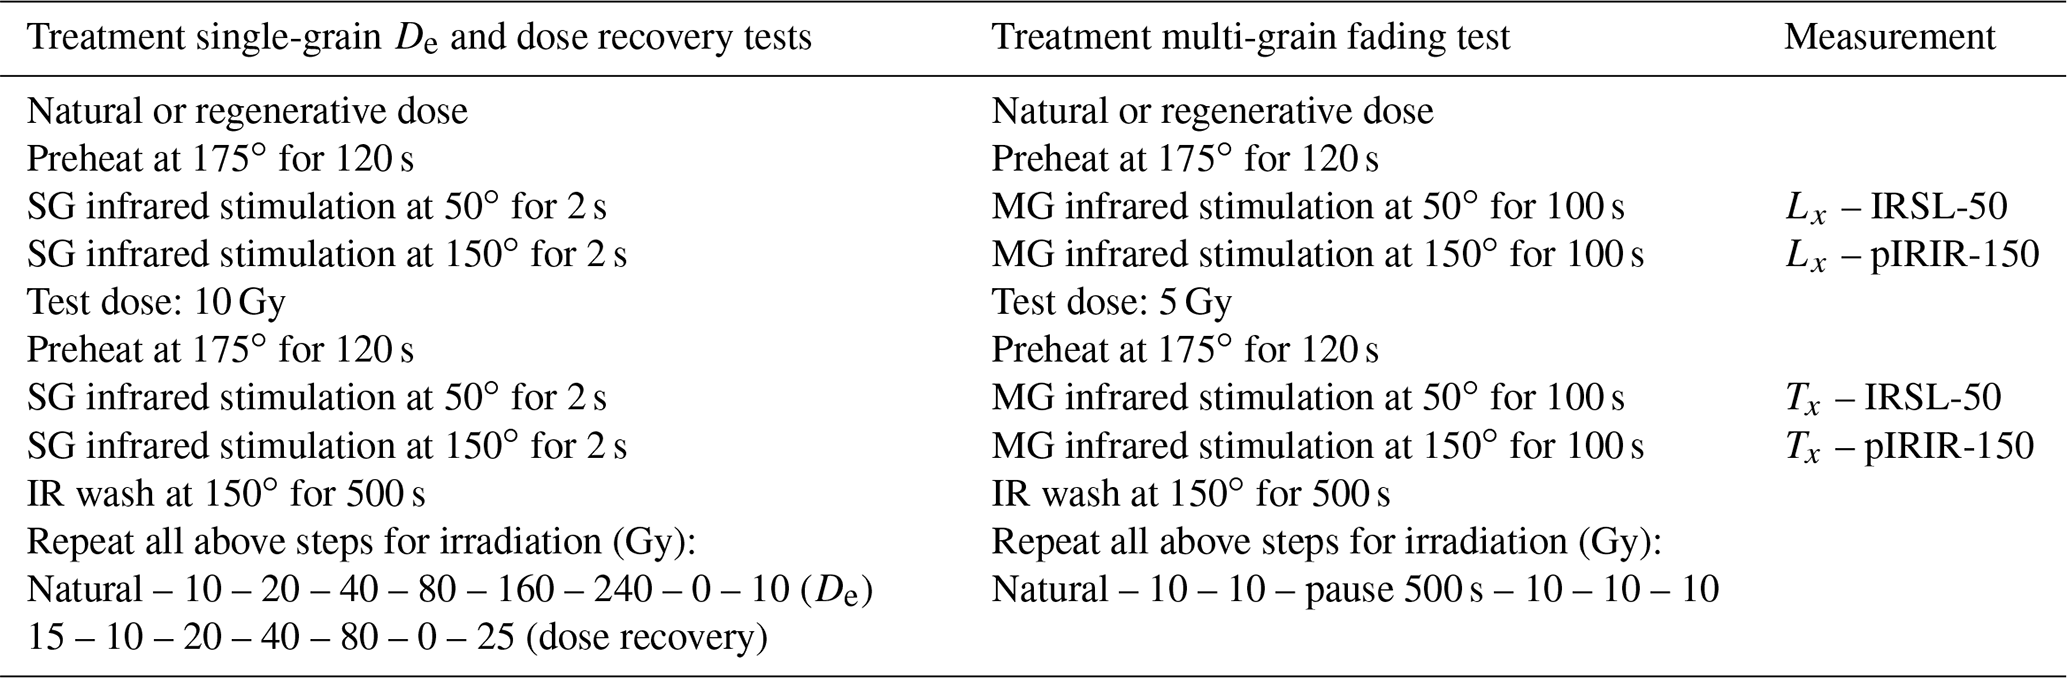
All luminescence measurements were performed on an automated Risø TL/OSL reader (DA 15). The samples were irradiated by a beta source with a dose rate of 0.098 Gy s−1 for all single-grain measurements. The infrared stimulated luminescence emitted by the feldspar grains was detected through an I-410 filter to capture the typical K-feldspar blue emission at 410 nm for the IRSL (at 50 ∘C) and pIRIR (at 150 ∘C) signal. In addition to the single aliquot regenerative (SAR) dose measurement of equivalent doses, fading and dose recovery tests are performed (Table 1). For the dose recovery test sample, NCL-7619125 was bleached for 48 h in a Hönle SOL2 solar simulator, subsequently dosed to 15 Gy and measured using the pIRIR-150 SAR protocol (Table 1, column on the left). The laboratory fading test was performed on multi-grain discs using the approach outlined in Auclair et al. (2003) on samples NCL-7619109, -111, -122 and -123 (Table 1, column in the middle). The burial ages were corrected for the measured fading rates with the calc_FadingCorr function from the R Luminescence package (Kreutzer, 2023). The time between irradiation and prompt measurements was 255 s (tc). The g value was normalized to 2 d (172 800 s) (tc.g_value). We chose to use an exponential and linear fit for both De and D0 estimations as a conservative estimate of the onset of saturation (e.g. Joordens et al., 2015) and to keep our analysis consistent within this study.
Table 1Measurement protocols applied within this study: details on single-grain equivalent dose and dose recovery measurements on the left side, and details on the multi-grain fading test on the right side of the table. Lx indicates the natural or regenerative OSL dose obtained and is corrected by the OSL response to the test dose Tx.
Additionally, we collected two radiocarbon samples, PK_DC_1401 and PK_DC_1402, in close proximity to luminescence sample Pk_D13 (Fig. 2g). The newly obtained radiocarbon samples were dated at the Poznań radiocarbon laboratory in Poland and calibrated with the IntCal20 curve within the OxCal online environment (Reimer et al., 2020). They were used to further support the radiocarbon benchmark. To compare the OSL and radiocarbon data, an overestimation was calculated in the following manner: the median value of 0.90 ka of the radiocarbon dataset (Schwanghart et al., 2016) was used as a benchmark value and expressed in CE to calculate the ratio between a OSL burial age and the radiocarbon benchmark value. We used faded ages to calculate the overestimation ratio.
3.2 Luminescence-based bleaching proxies
The following three luminescence-based bleaching proxies were used to study the sediment dynamics.
-
Overdispersion is a measure of the spread within an equivalent dose distribution that cannot be explained by the individual uncertainties of the single-grain equivalent dose estimates such as measurement errors, parameter fitting errors and/or measurement equipment errors. Overdispersion is often associated with incomplete bleaching due to processes like turbulent or sub-aquatic sediment transport under turbid conditions (Brill et al., 2018; Cunningham et al., 2015). It is indicative for heterogeneous luminescence signal resetting and may therefore serve as a valuable bleaching proxy (Olley et al., 2004). Populations of grains can be homogeneously or heterogeneously bleached. Heterogeneously bleached populations contain zeroed grains and grains with remnant doses (Duller, 2008).
-
The percentage of saturated grains can function as a proxy for the percentage of unbleached bedrock grains (Reimann et al., 2017; Bonnet et al., 2019; Guyez et al., 2022); these grains were eroded from the parent material and travelled without sufficient exposure to reset their luminescence signal. The 2D0 criterion (85 % full saturation) is applied to differentiate if a grain is in saturation or not (Wintle and Murray, 2006).
-
The minimum age model (MAM) is a statistical model used to identify the paleodose based on the population of best-bleached grains within a heterogeneously bleached sample (Galbraith et al., 1999). It is typically applied to samples from fluvial settings, since fluvial samples are often heterogeneously bleached (Cunningham and Wallinga, 2012; Rhodes, 2011; Rodnight et al., 2006). A bootstrapped version of the MAM (bMAM) measures the average statistical properties of a subsample, as the relation between a subsample and a sample is considered to be the same as the relation between a subpopulation and a sample (Cunningham and Wallinga, 2012). The percentage of grains used to calculate the bMAM-equivalent dose can be identified by scanning how many grains of the total population correspond with the bMAM based paleodose value within 2σ of their uncertainty boundaries. It is important to use an appropriate sigma-b value, which is one of the model's input parameters. If sigma-b is chosen too high the bMAM De value will be overestimated, and if the sigma-b is too low the bMAM De will be underestimated. We chose to use a sigma-b value of 0.3 based on comparative literature (Smedley, 2014; Brill et al., 2018). It is expected that the outcome of this proxy can be translated into bleaching dynamics: the lower the percentage of grains used to identify the bMAM-De, the higher the spread in the distribution.
4.1 Measurement protocol performance
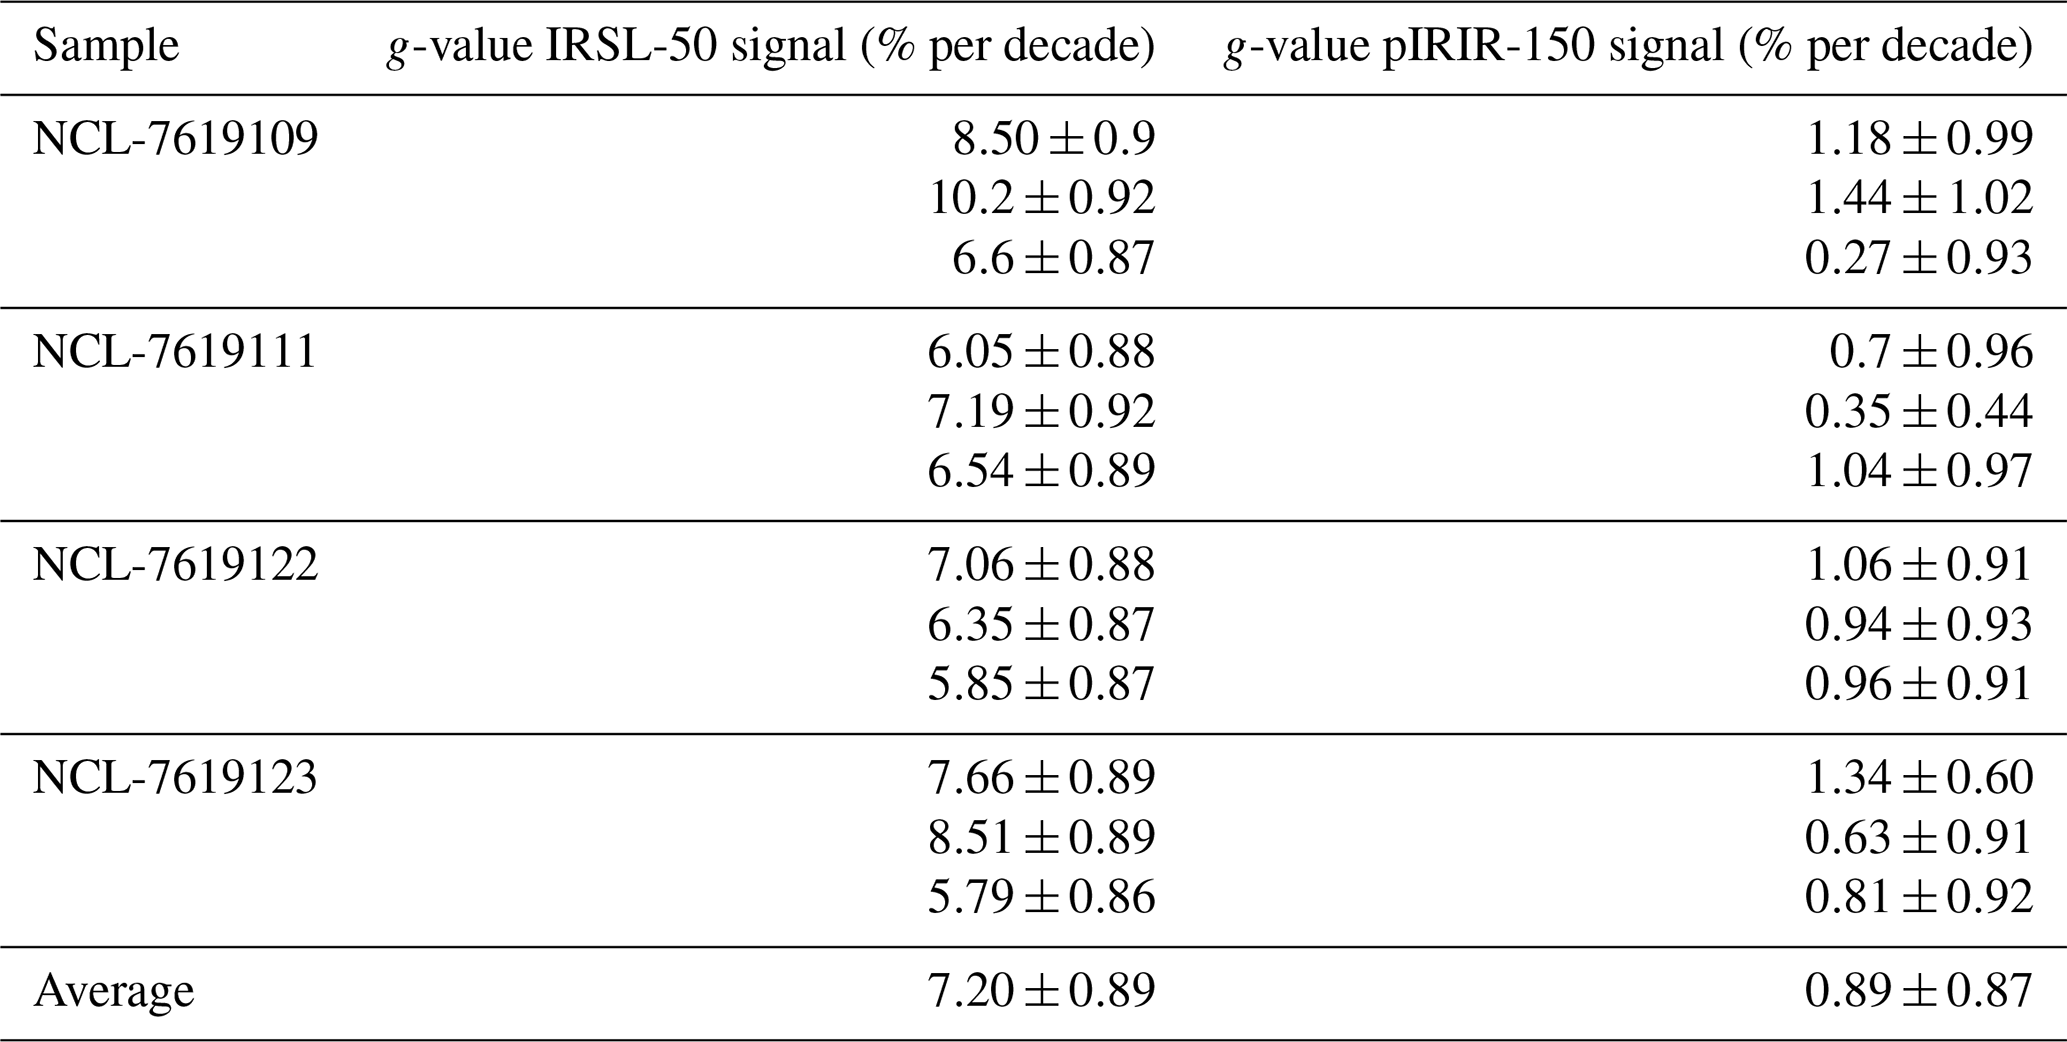
Test measurements of the extracted quartz-rich fraction on two samples (Pk-B04 and Pk-E16) showed that the quartz grains contained in the Pokhara gravels are not suitable for OSL dating, mainly because of a poor luminescence sensitivity and the absence of the fast OSL component; 2 out of 540 grains (<1 %) held a measurable luminescence signal. The fast ratios of 0.94 and 3.38 of these two grains, calculated according to Durcan and Duller (2011), are significantly lower than the suggested threshold of 20. Thus, all subsequent measurements were performed on K-feldspar grains, of which the IRSL-50 and pIRIR-150 signals showed clearly defined decay curves (Fig. 3a and b). The residual dose corrected dose recovery ratio was calculated (Appendix A) as 0.88 ± 0.01 (n=68 grains) and 0.95 ± 0.01 (n=51 grains) for the IRSL-50 and pIRIR-150 signal, respectively. The fading rate (g-value) results of the four samples are in line with each other, an average was calculated at 7.20 % ± 0.89 % and 0.89 % ± 0.87 % per decade for the IRSL-50 and pIRIR-150 signal, respectively (Appendix B).
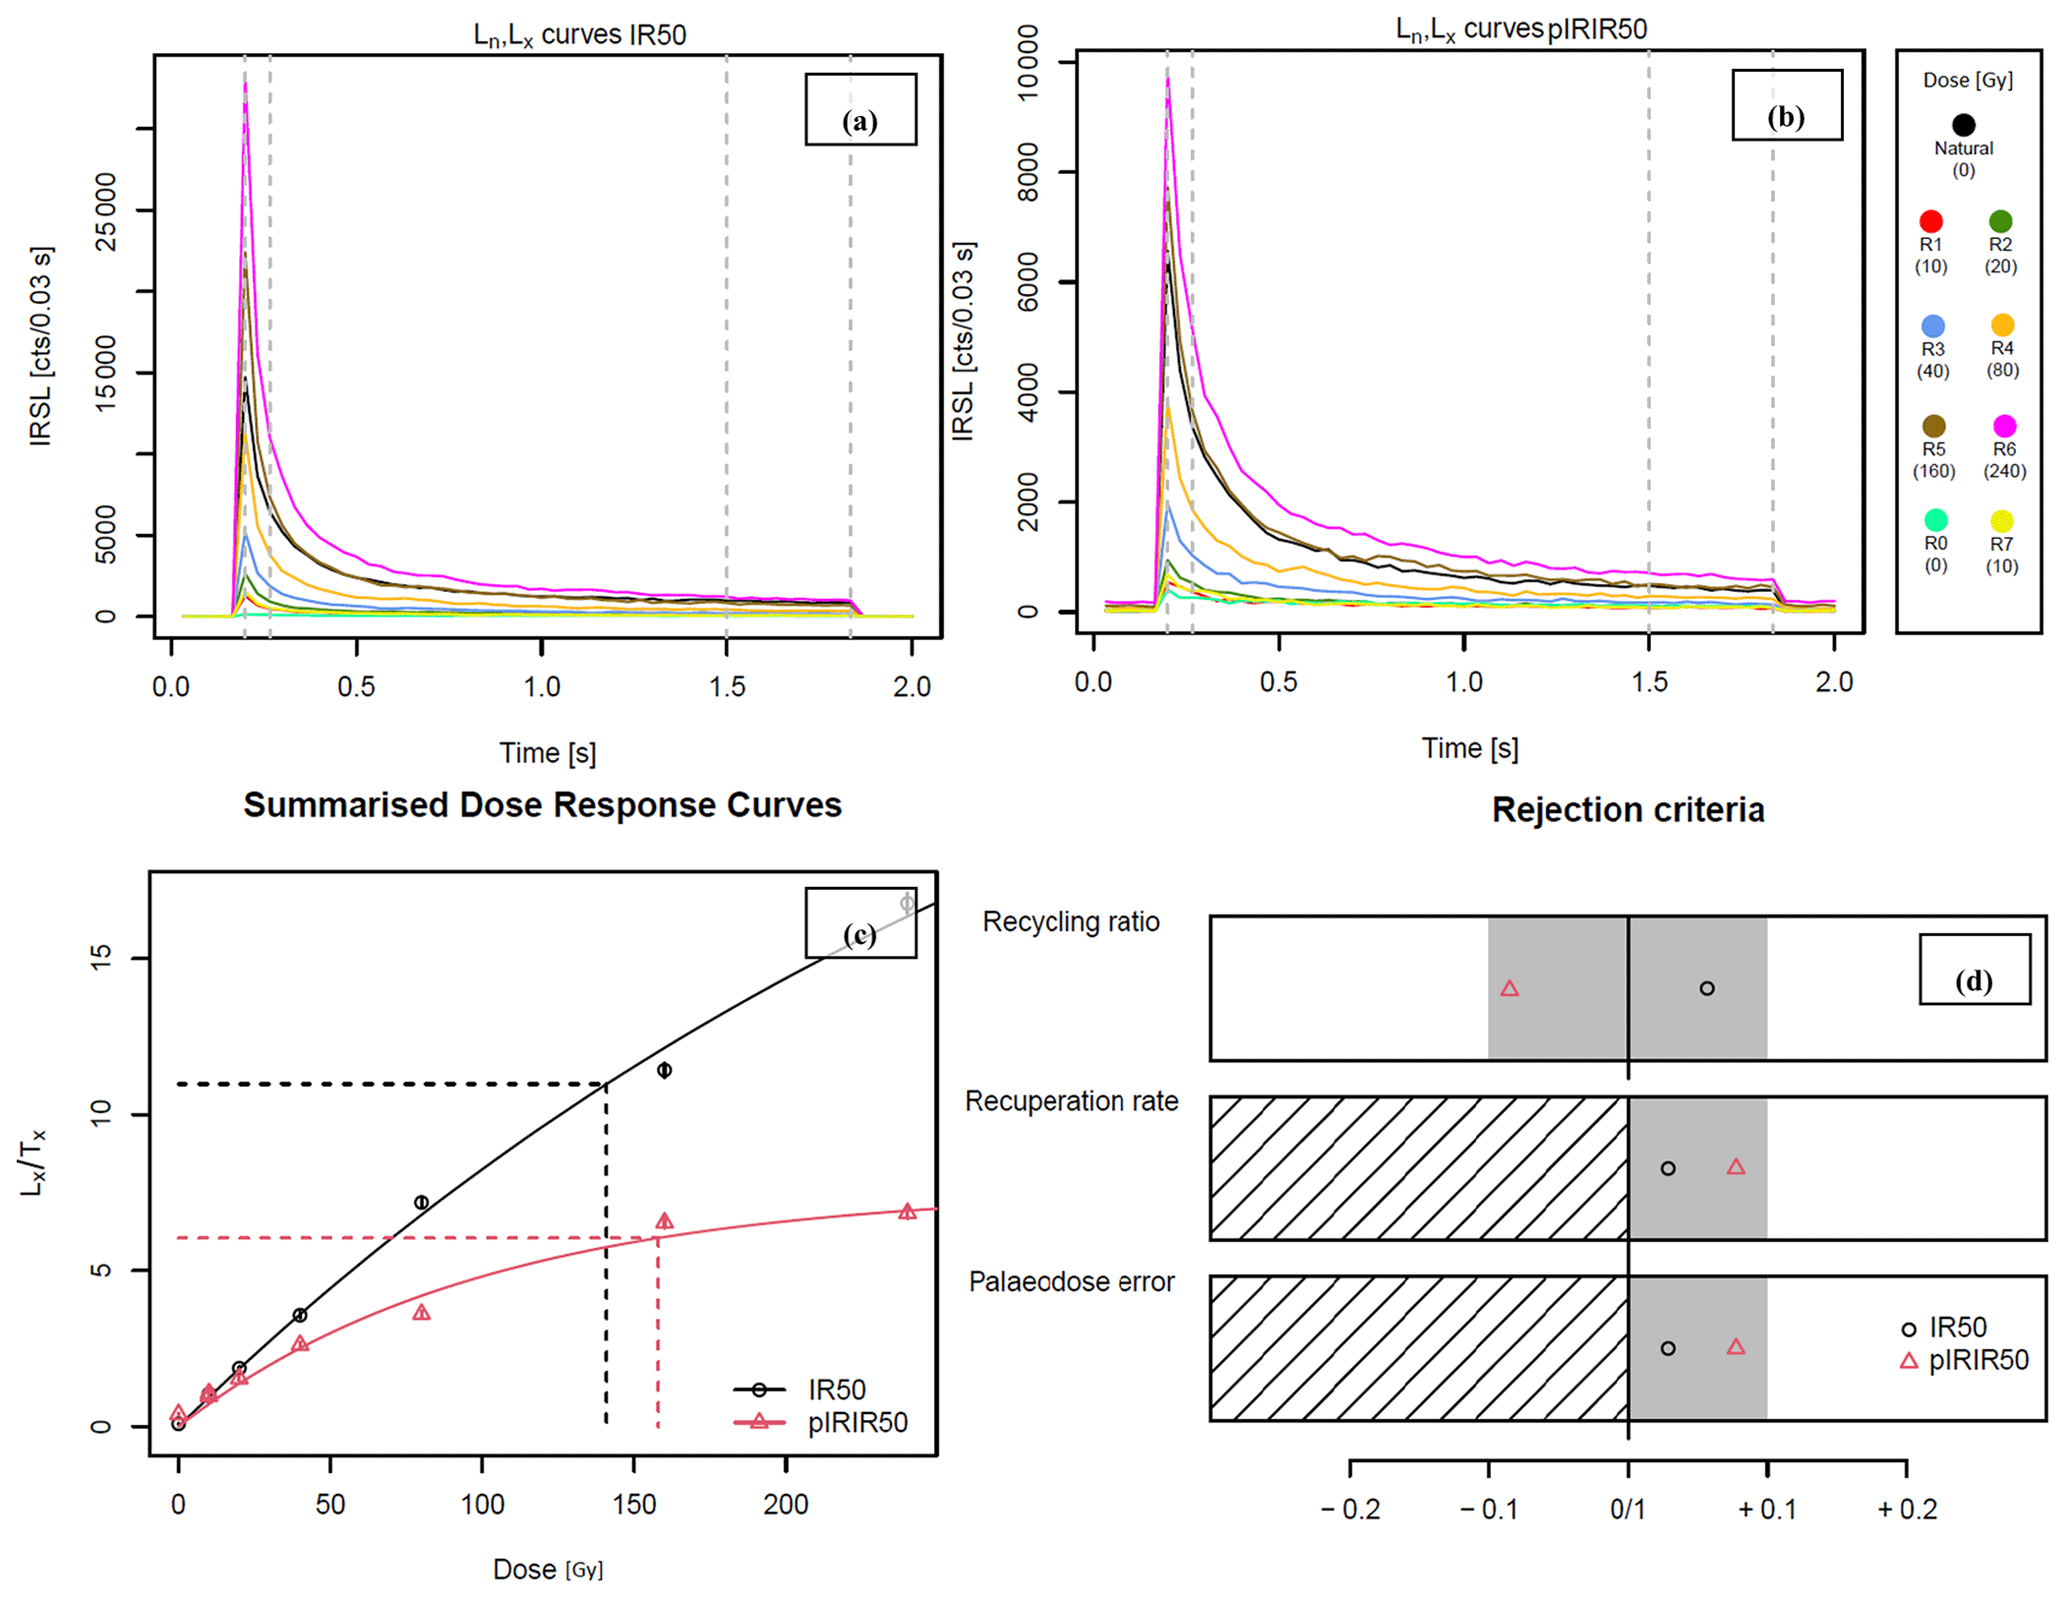
Figure 3Panels (a) and (b) show the decay curves of sample NCL-7619124 for measured IRSL-50 and pIRIR-150 signals, respectively. The black line shows the natural decay curves, while the coloured lines show the decay curves in response to the regenerative doses as indicated in the legend. Panel (c) shows the summarized dose response curves for both signals of the same sample; the dotted line indicates the estimated equivalent dose on the x axis (in Gy). Panel (d) shows that both signals of sample NCL-7619124 are within unity (±10 %) for the three rejection criteria: recycling ratio, recuperation rate and relative paleodose error.
4.2 Single-grain feldspar burial ages
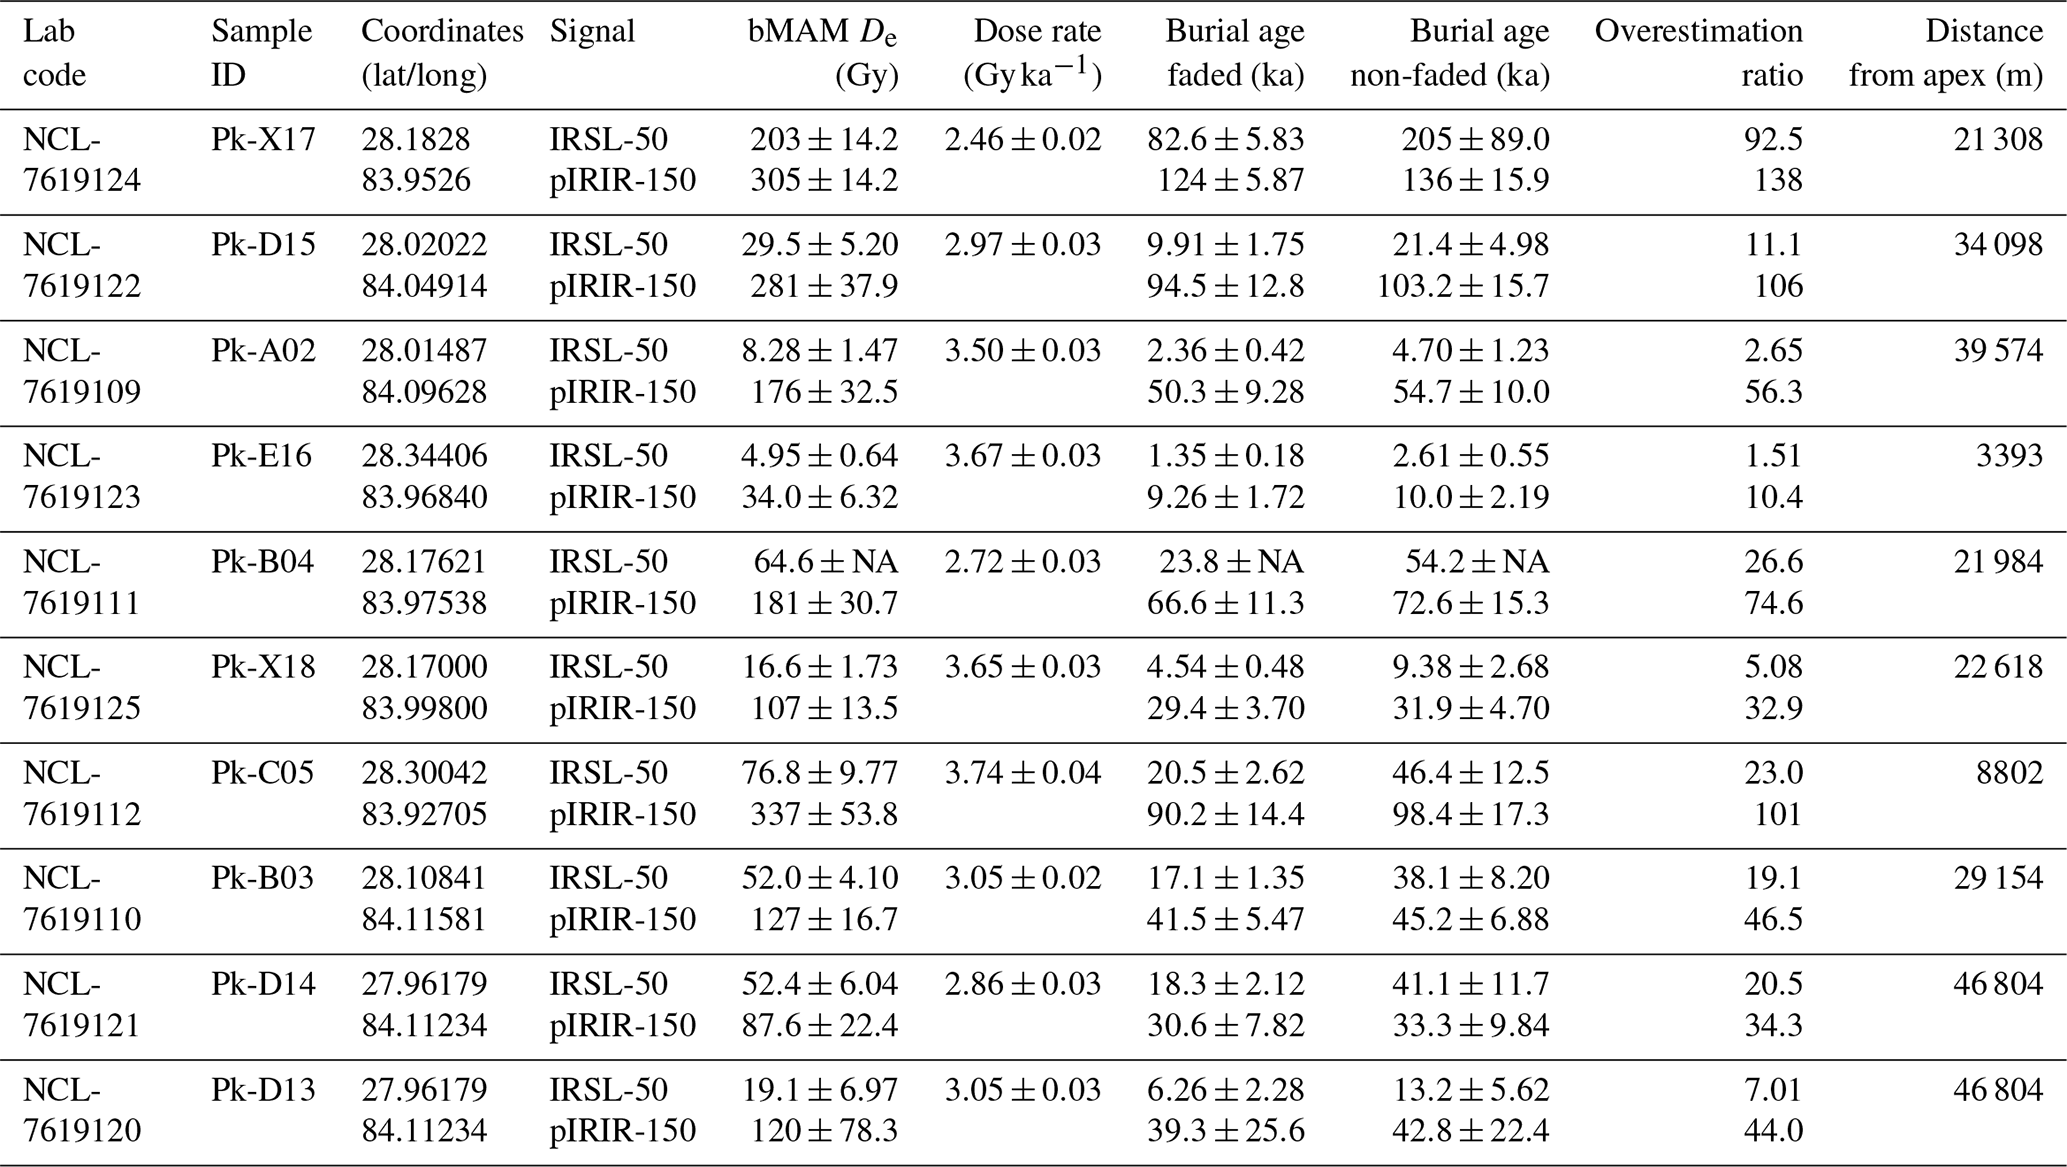
Table 2 shows the estimated paleodose (based on bMAM-De), the dose rate, the (non-)faded burial ages, and the overestimation ratios of the IRSL-50 and pIRIR150 ages for each sample. The paleodoses derived from the bMAM dose estimate range from 4.95 ± 0.64 to 203 ± 14.2 Gy and from 34.0 ± 6.32 to 337 ± 53.8 Gy for the IRSL-50 and the pIRIR150, respectively. The dose rates range from 2.46 ± 0.02 to 3.74 ± 0.04 Gy ka−1 with no clear pattern in function of runout distance. However, the dose rates of samples taken from the Phusre and Saraudi tributary valleys (Pk-X17, Pk-B04 and Pk-D15) are ∼30 % lower than dose rates from the Seti main valley, presumably reflecting on the different mineralogy of the sourced sediments. The IRSL-50 signal consistently results in lower burial ages than the pIRIR-150 signal and therefore in a lower overestimation ratio of the radiocarbon benchmark. Fading corrected burial ages range from 4.70 ± 1.23 to 205 ± 88.9 ka and from 10.0 ± 2.19 to 136 ± 15.9 ka for the IRSL-50 and the pIRIR150, respectively.
Table 2A tabular overview of all single-grain feldspar equivalent doses, dose rates, (fading corrected) burial ages, overestimation ratios, and their associated uncertainties (1σ confidence interval) obtained within this study. All luminescence ages refer to the year of sampling 2019.
4.3 Overestimation of the geochronological benchmark
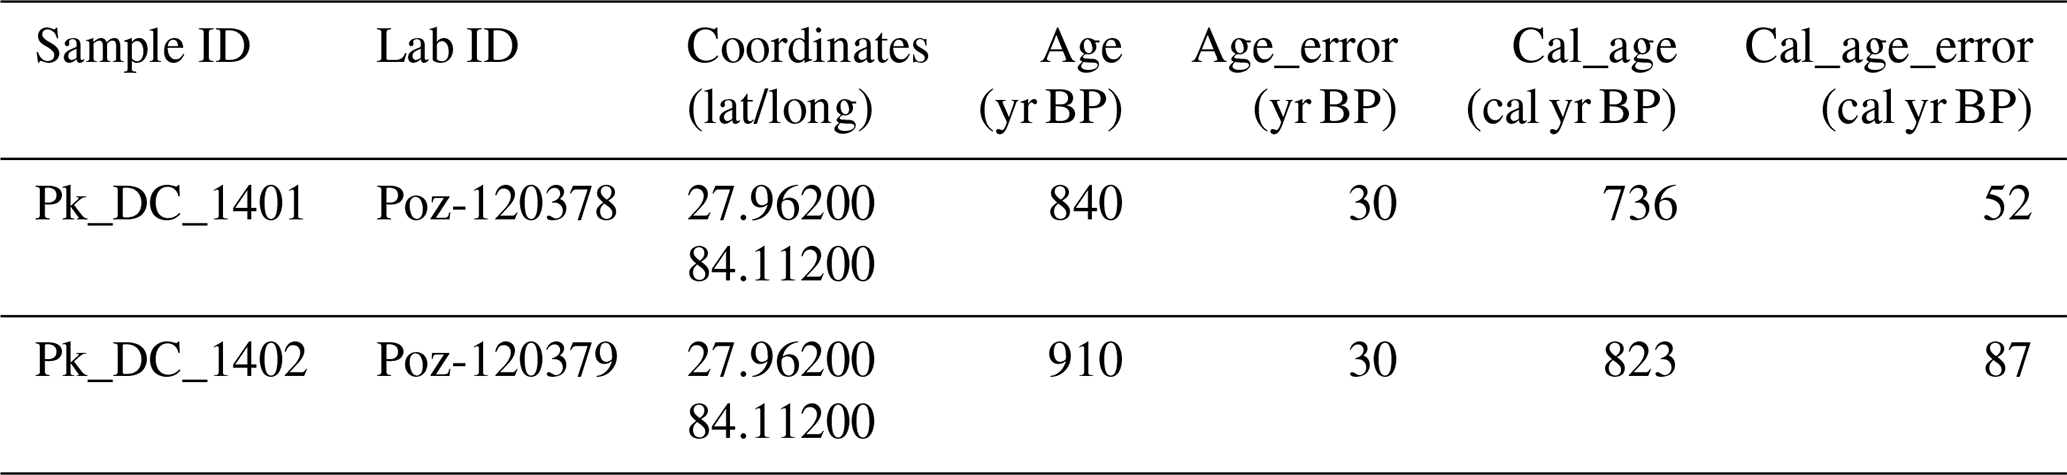
To further support the radiocarbon dating benchmark we took two radiocarbon samples from the Pokhara Formation (Table 3) in addition to the radiocarbon dataset presented by Schwanghart et al. (2016). The obtained age was calibrated to 736 ± 52 and 823 ± 87 years BP for sample Pk_DC-1401 and Pk_DC-1402, respectively. Two luminescence samples, Pk-D13 and Pk-D14, were sampled in close proximity to the radiocarbon samples Pk_DC_1401 and Pk_DC_1402 (Fig. 2g). The fading corrected burial age of sample Pk-D13 is 13.2 ± 5.62 and 42.8 ± 22.4 ka for the IRSL-50 and the pIRIR-150, respectively. The fading corrected burial age of sample Pk-D14 is 41.1 ± 11.7 and 33.3 ± 9.84 ka for the IRSL-50 and the pIRIR-150, respectively.
Table 3A tabular overview of the newly dated radiocarbon samples, including the raw ages and the calibrated ages.
All luminescence burial ages overestimate the median value of the radiocarbon benchmark (Fig. 4), with an average ratio of ∼23 and ∼72 for the IRSL-50 and pIRIR-150, respectively. The fading corrected burial ages for both signals result in even higher overestimation ratios. The smallest overestimation ratios occur for the IRSL-50 burial ages of samples PK-A02 and PK-E16, with ∼2.65 and ∼1.51, respectively. No clear relationship between overestimation ratios and the distance between sample location and fan apex can be observed (Fig. 4). The larger difference between fading corrected and uncorrected burial ages for IRSL-50 compared to the pIRIR-150 signal is a result of the larger IRSL-50 fading rates. The consistent differences between burial ages and resulting overestimation ratios of the IRSL-50 and pIRIR-150 ages compared to the radiocarbon benchmark suggest that our samples are strongly affected by incomplete bleaching (Kars et al., 2014). The large scatter in the radial plots shown in Fig. 5 likewise suggests that the IRSL-50 signal of our samples is significantly impacted by heterogeneous bleaching.
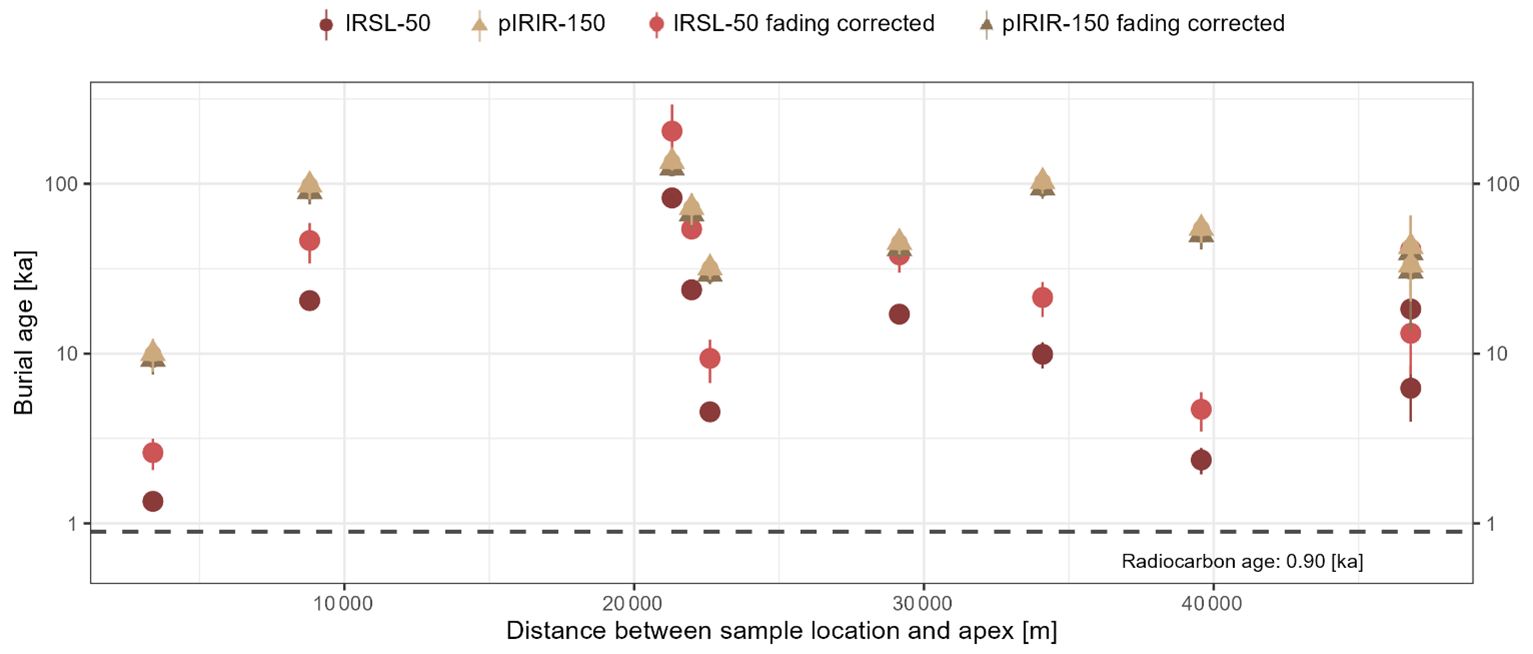
Figure 4The obtained burial ages and their associated uncertainties (1σ confidence interval) are plotted against the distance between sample location and the fan apex of the mass movement (m). The dark red dots correspond to the IRSL-50 signal, while the light red dots correspond to the fading corrected IRSL-50 signal values. The light brown triangles correspond to the pIRIR-150 signal, while the dark brown triangles correspond to the fading corrected pIRIR-150 signal values. The dashed horizontal line indicates the benchmark age of 0.90 ka established based on an elaborate radiocarbon chronology. Note the y axis is plotted on logarithmic scale.
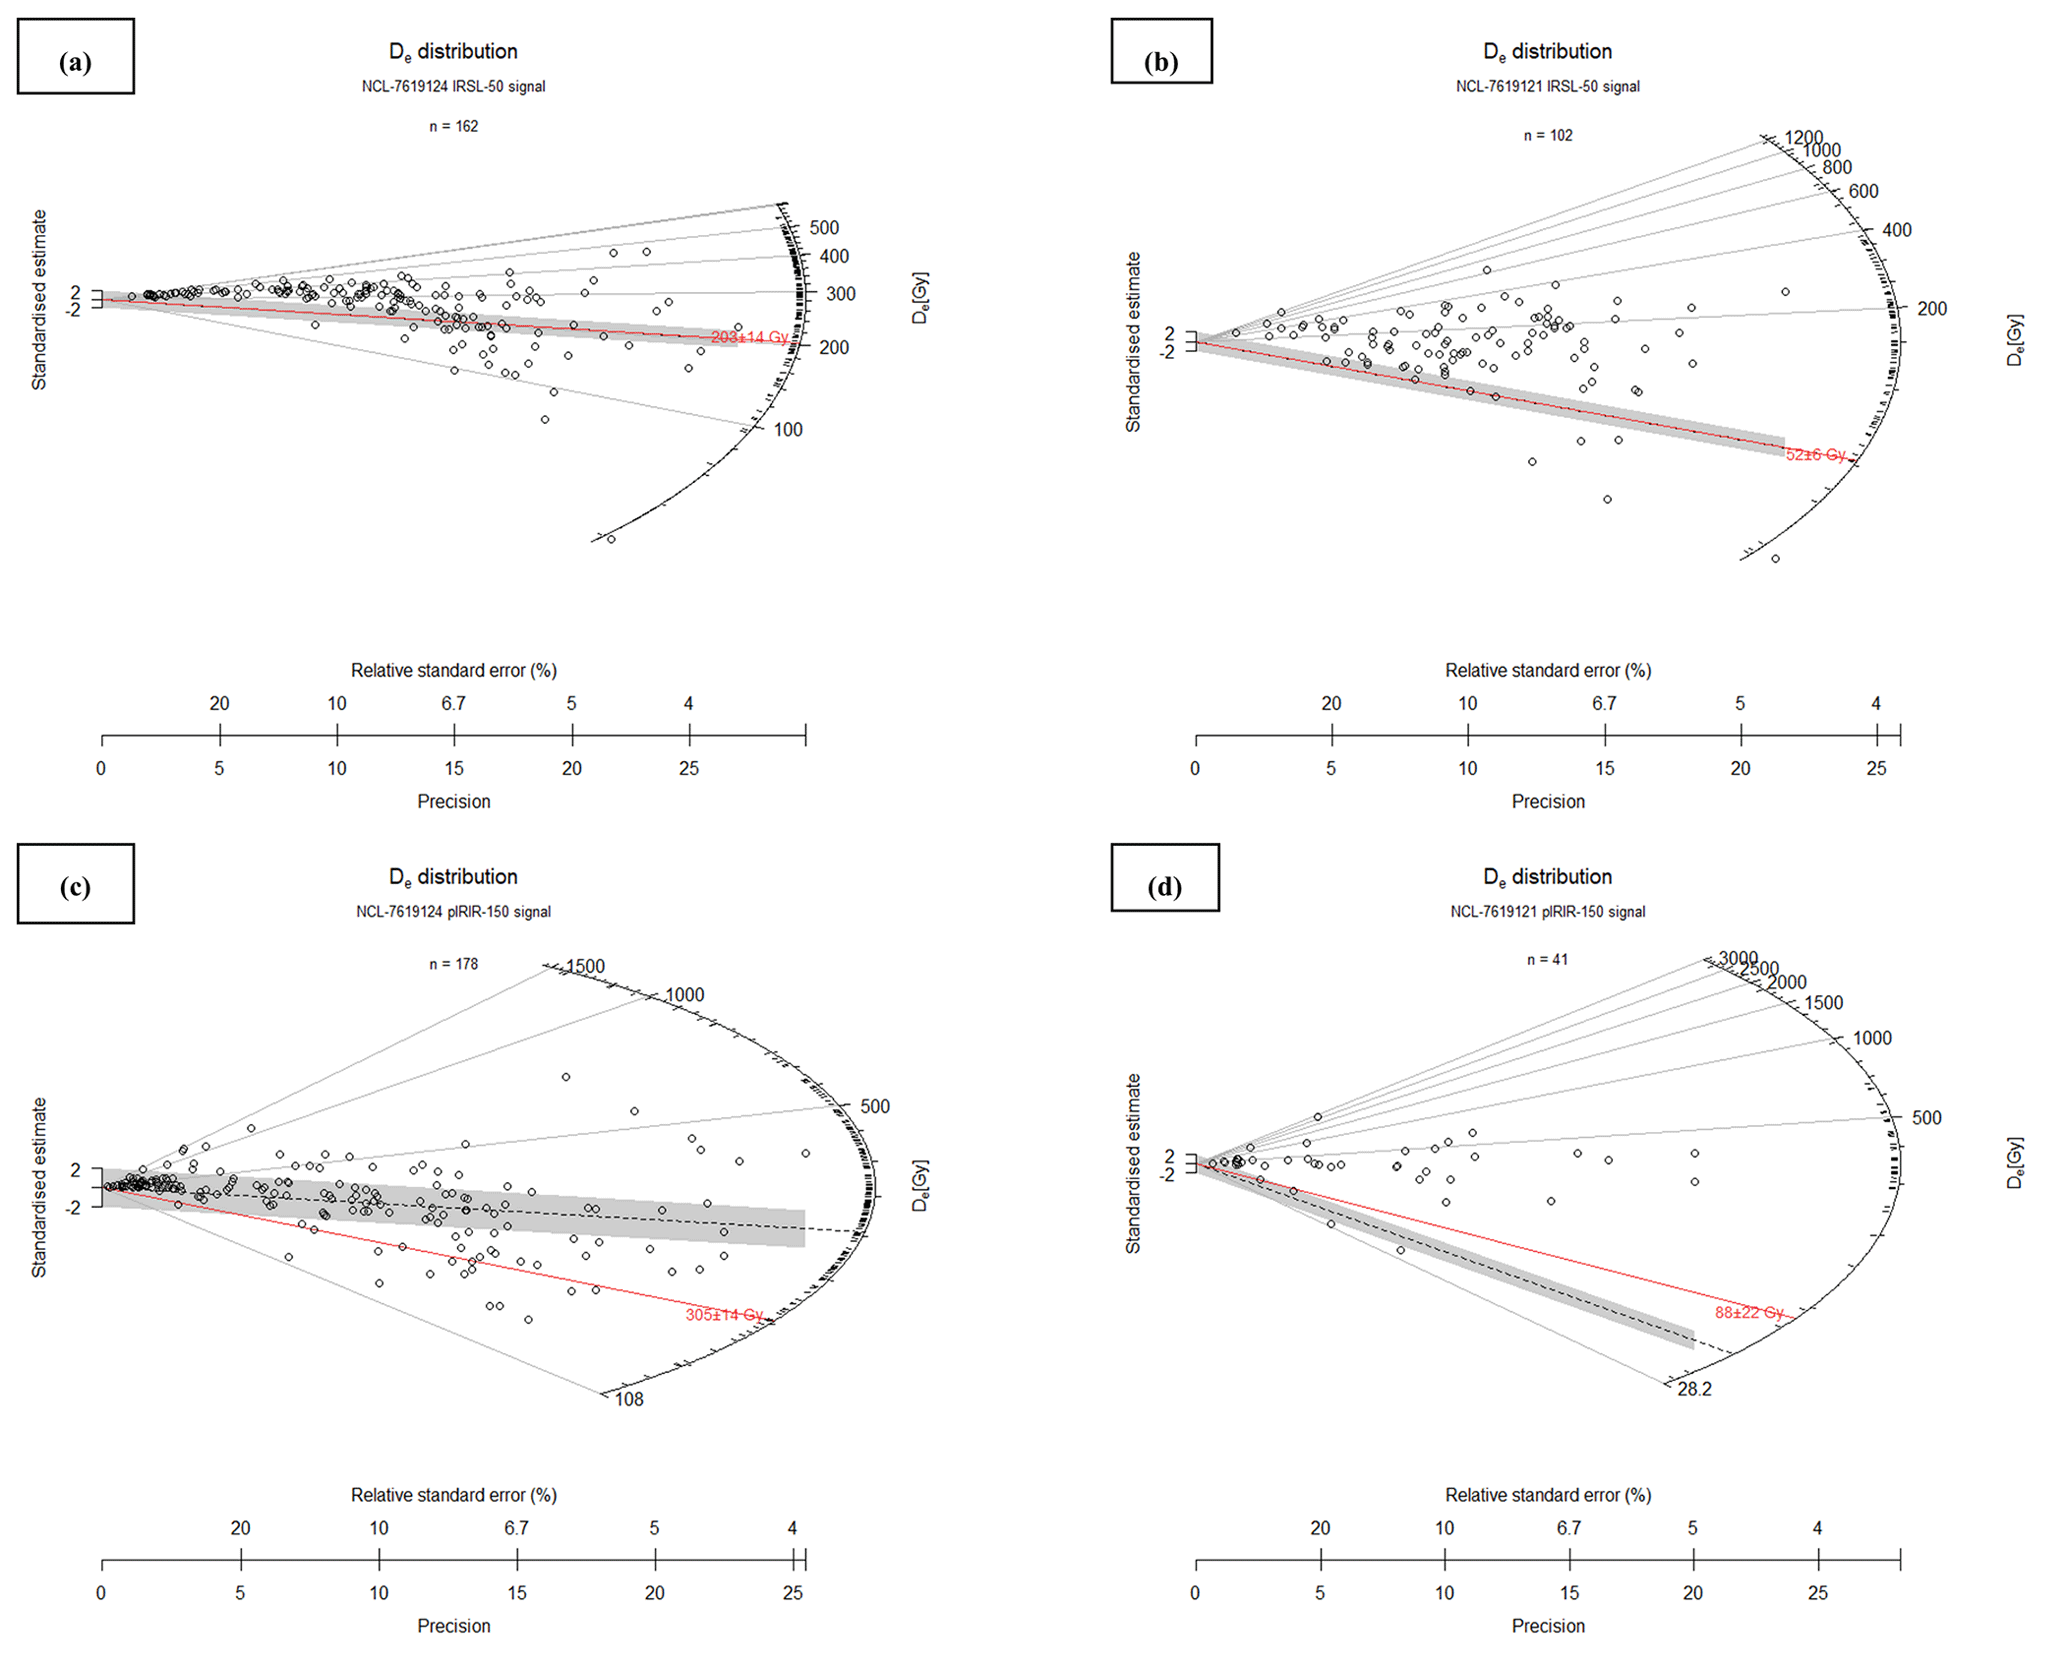
Figure 5The radial plots in (a) and (b) show the equivalent dose distributions of the IRSL-50 and pIRIR-150 signal, respectively for sample Pk-X17 (NCL-7619124) and the radial plots in (c) and (d) show the same for sample Pk-X18 (NCL-7619121). The red line indicates the paleodose in Gray as estimated by a bootstrapped version of the minimum age model (Cunningham and Wallinga, 2012); n indicates the number of grains per radial plot.
4.4 Using proxies to identify sediment dynamics
Table 4 lists the overdispersion, the number of accepted and saturated grains, and the percentages of saturated, best-bleached, and other grains for all samples and both feldspar signals (for details, see Sect. 3.2). The data of the three bleaching proxies (overdispersion, the percentage of saturated grains, and the percentage of best-bleached grains) always sum up to 100 %. Figure 6a shows the relationship between overdispersion and sample location distance downstream from the apex. A trend towards higher overdispersion values is observed for the IRSL-50 signal, except for sample Pk-B03, which suggests that IRSL-50 is more heterogeneously bleached than the pIRIR-150 signal. Figure 6b shows the relationship between overdispersion and equivalent dose. For both signals, overdispersion decreases with increasing equivalent dose values. This suggests that heterogeneous bleaching is the main source of scatter in the corresponding equivalent dose distributions (Fig. 5a–d) for both feldspar signals.
Table 4A tabular overview of all data associated with the calculated bleaching proxies expressed in numbers (no.) or percentage (%).
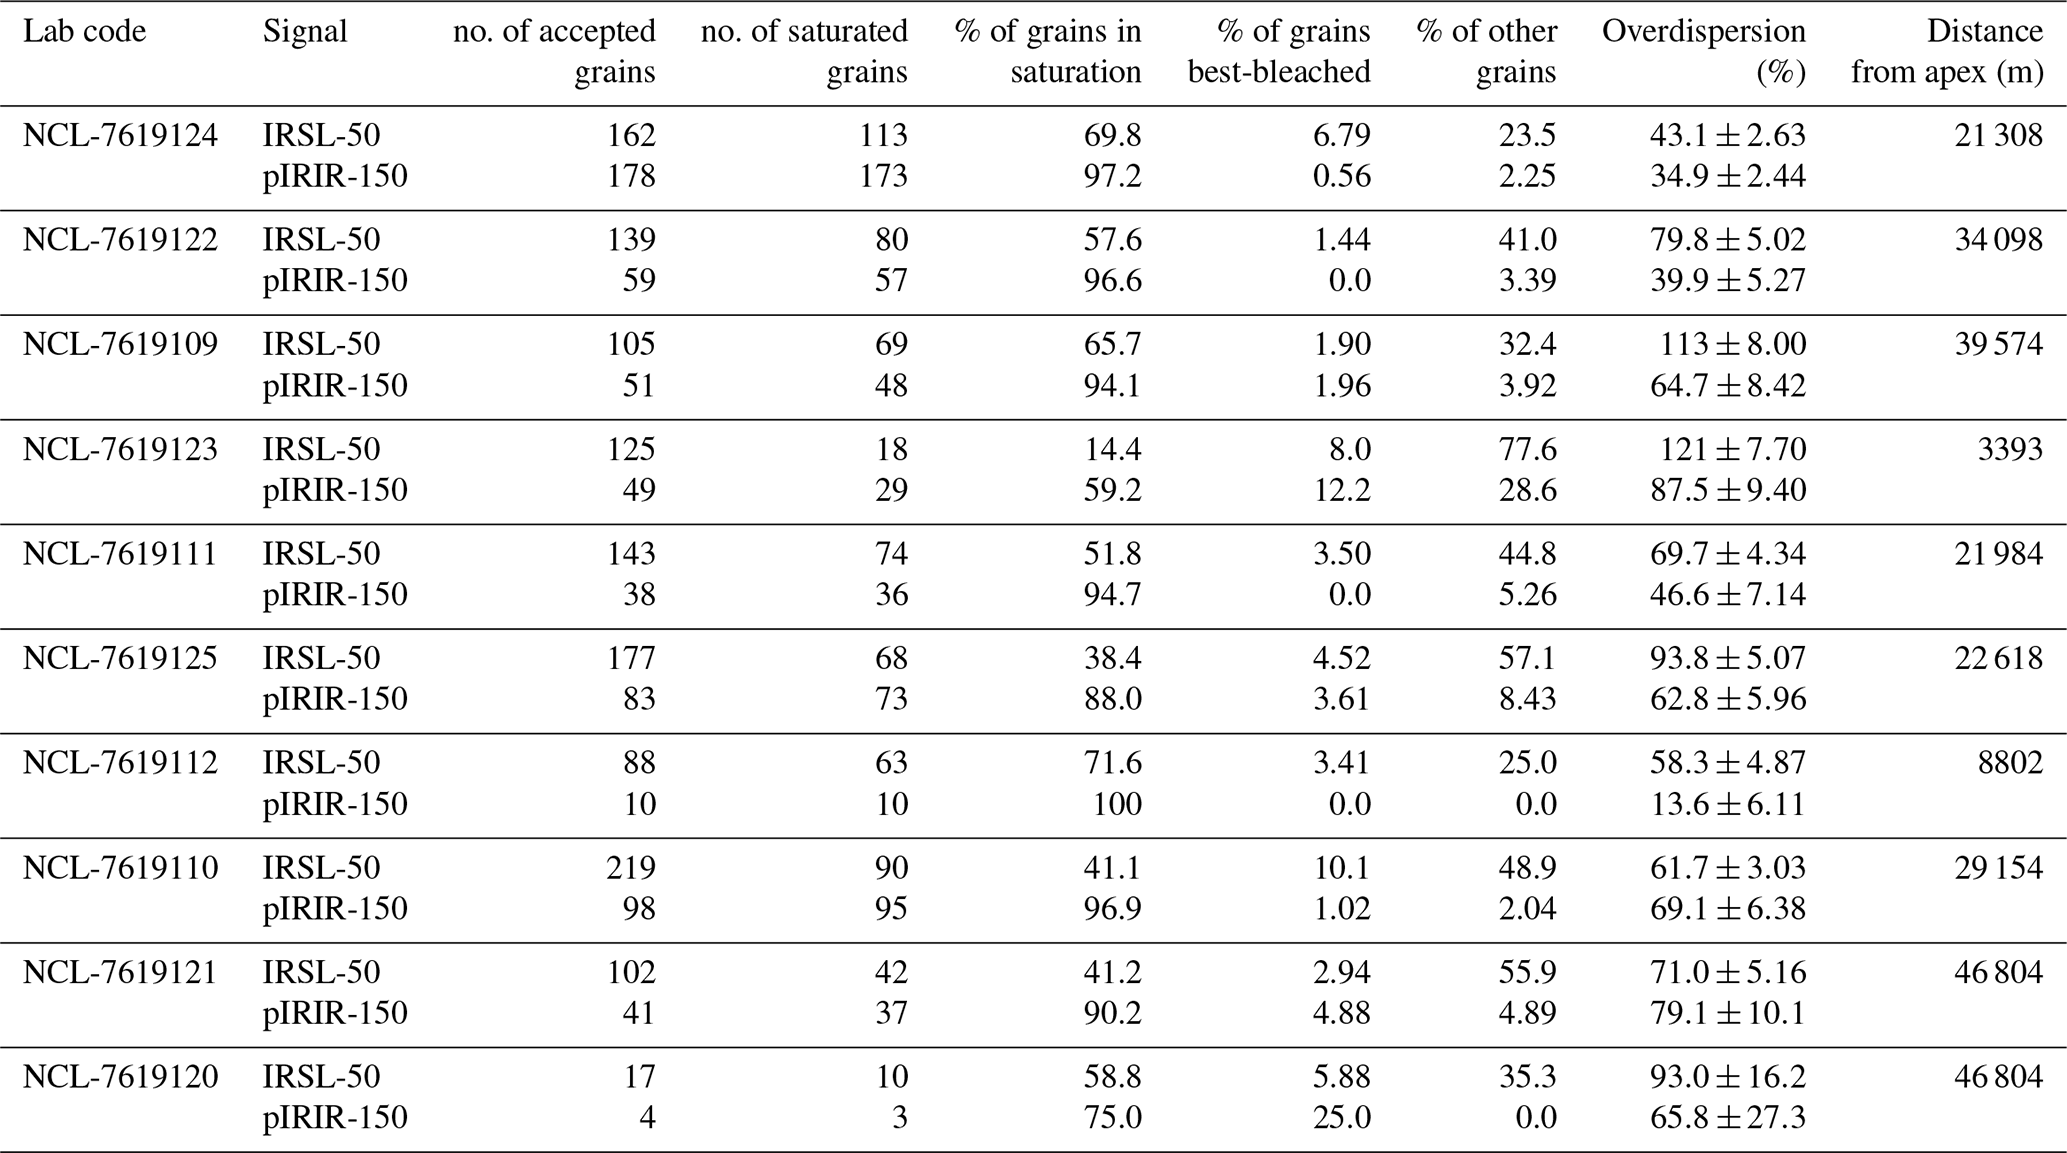
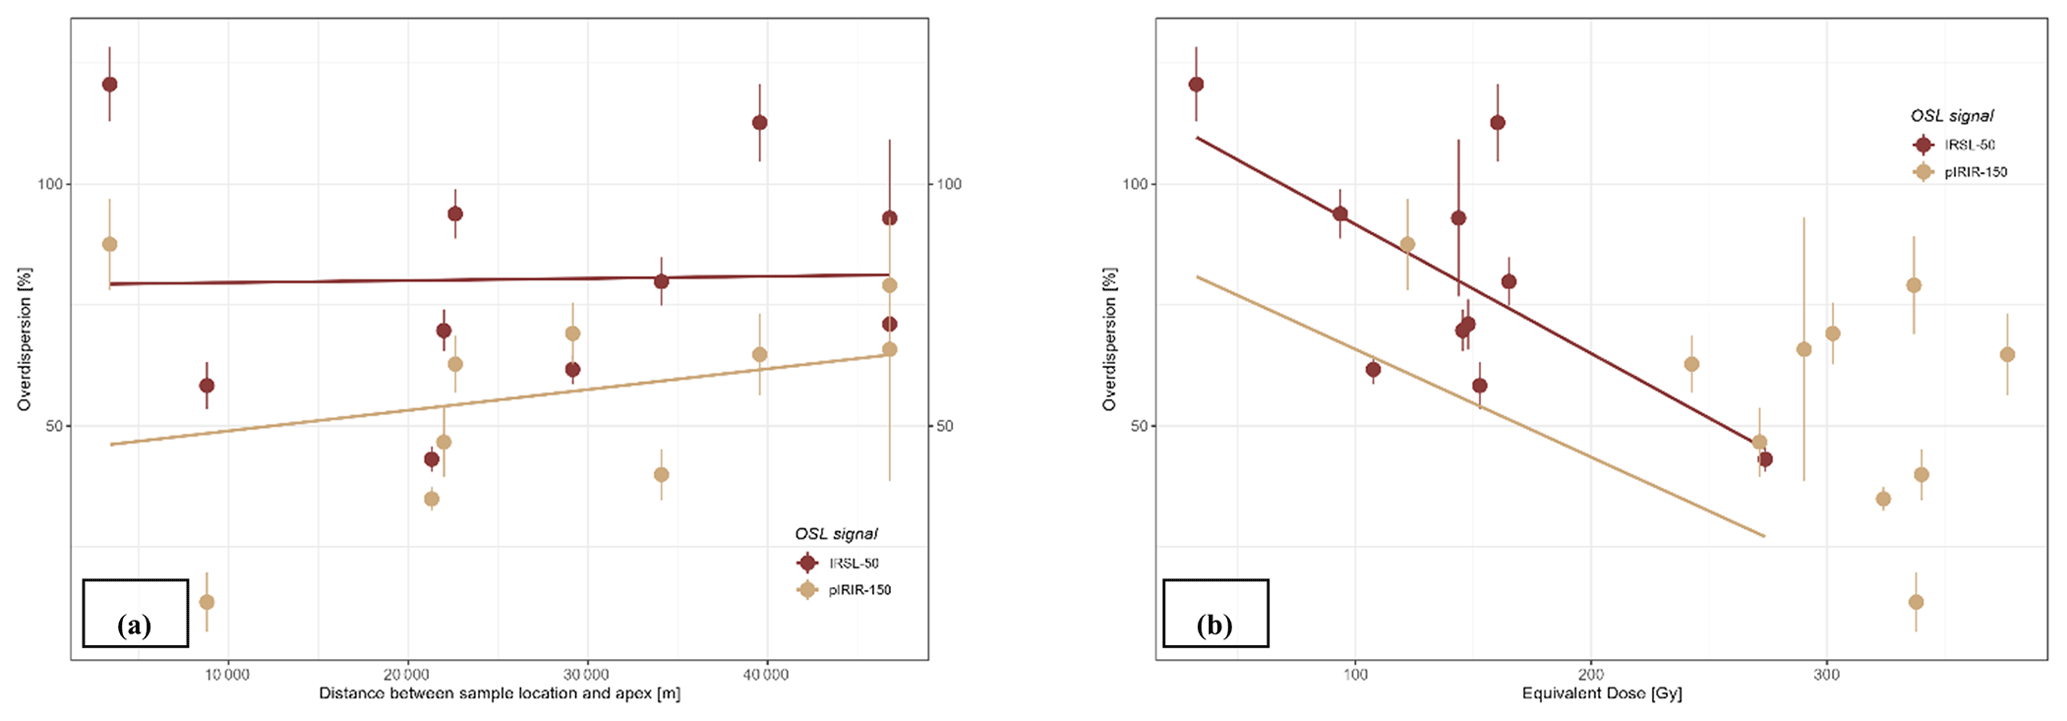
Figure 6Panel (a) shows the relationship between overdispersion (%) and the distance between the sample location and the fan apex of the mass movement expressed in metres. Panel (b) shows the relationship between overdispersion (%) and equivalent dose (Gy). The dark red dots correspond to the IRSL-50 signal, the light brown triangles to the pIRIR-150 signal. The trend line colour matches the luminescence signal colours as indicated in the legend.
The stack graphs in Fig. 7 show the percentage of saturated, best-bleached and other grains over the fan length for the IRSL-50 (Fig. 7a) and pIRIR-150 (Fig. 7b) signal, respectively. The percentage of best-bleached grains is comparable for both signals, although the IRSL-50 signal shows slightly higher percentages. The percentage of saturated grains for the pIRIR-150 signal is constantly higher than for the IRSL-50 signal, which is an artefact of the high IRSL-50 fading rates – i.e. an athermal signal loss during burial. This argument is substantiated by the observation that the 2D0 of the pIRIR-150 is generally lower than the IRSL-50 (Excel file in the Supplement). The high numbers of pIRIR-150-saturated grains suggest a high input of bedrock grains. At 25 km from the apex at the Annapurna Massif a dip in the percentage of saturated grains for both signals is visible. For the IRSL-50 data the reduction in the percentage of saturated grains is from ∼70 to 37, whereas for the pIRIR150 data the reduction is only from ∼97 to 88.
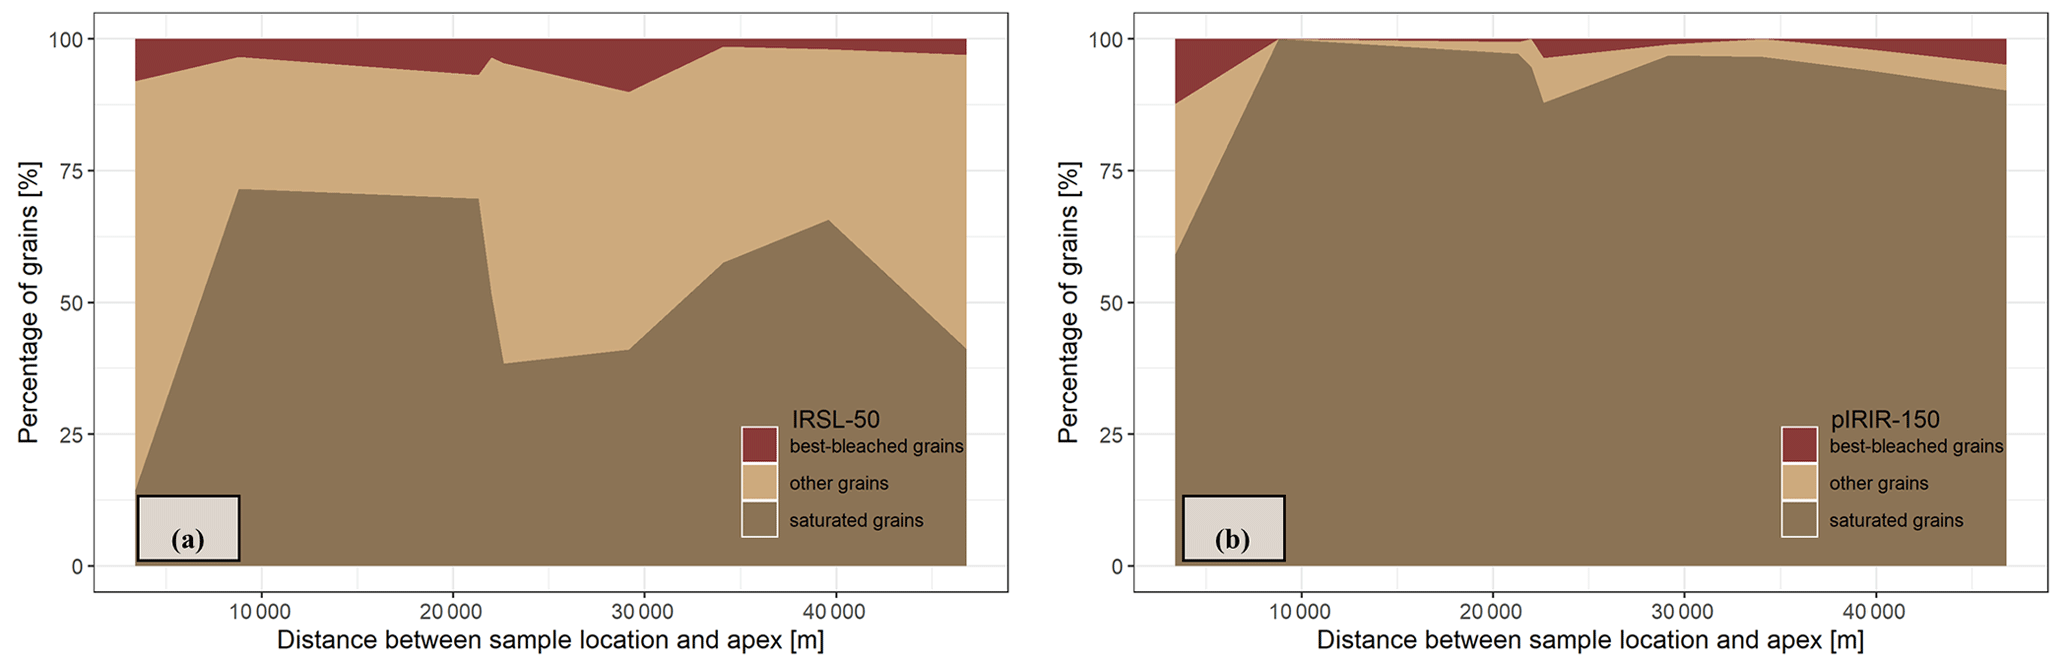
Figure 7Stack graphs showing the relationship between the percentage of grains for the best-bleached grains in dark red, saturated grains in dark brown, and other grains in light brown, and the distance between the sample location and the fan apex of the mass movement. Panel (a) shows the IRSL-50 data, panel (b) displays the pIRIR-150 data. Other grains represent grains that are incompletely bleached and have an inherited dose.
5.1 Dating mass movements using feldspar single grains
As expected from previous studies (e.g. Jaiswal et al., 2009), the investigated quartz minerals contained in the Pokhara Formation are largely unsuitable for single-grain luminescence dating due to their poor luminescence sensitivity. Less than 1 % of the grains yielded a sensitive quartz OSL signal that was not dominated by the fast OSL signal component. Feldspar minerals are more sensitive and were therefore chosen as the main study material. Single-grain feldspar burial ages show that the IRSL-50 consistently results in lower burial ages than the pIRIR-150 signal. It should be considered, however, that the IRSL-50 signal suffers from a relatively high fading rate of 7.20 % ± 0.89 % per decade whilst the pIRIR-150 signal is subject to a lower fading rate of 0.89 % ± 0.87 % per decade, and therefore the gap between the fading corrected burial ages becomes relatively small. The IRSL-50 signal of 2 out of 10 samples yielded a Late Holocene age for the Pokhara Formation, but still overestimated the ages obtained from an extensive collection of radiocarbon samples (Schwanghart et al., 2016; Stolle et al., 2017) by 2.65 and 1.51, respectively. The IRSL-50 signal of an additional three samples dated the fan at Early Holocene age, and the other samples indicated a Pleistocene age. The pIRIR-150 signals greatly overestimate the radiocarbon benchmark, and none of the samples correspond with the expected Holocene mass movement depositional age within assigned 2σ uncertainties.
Our dating results generally confirm previous luminescence studies with samples taken from high mountainous settings, i.e. fast sediment production and transfer (e.g. Scherler et al., 2015; Bonnet et al., 2019). The chance for full daylight exposure under these conditions is very limited, resulting in a vast majority of feldspar grains being insufficiently reset by daylight prior to burial. Yet, unlike for samples from the Rangitikei River in New Zealand analysed in Bonnet et al. (2019), the amount of best-bleached grains from the Pokhara Formation was too limited to be able to establish a robust absolute chronology based on feldspar single-grain luminescence analyses. In the case of the long-runout mass movement from Pokhara only ∼2 % (Pk-A02) and ∼8 % (Pk-E16) of the grains from the two best-bleached samples (n=10) yield ages within the targeted age range. It should be noted, however, that the sampled sediments from the Pokhara Formation presumably represent one of the most extreme settings in terms of bleaching likelihood during sediment transport as several cubic kilometres of sediment were mobilized in the headwaters of the upper Seti River (Schwanghart et al., 2016; Lavé et al., 2023). In other, less extreme, high mountainous settings the application of feldspar single-grain to Late Glacial or Holocene samples proved to be successful for most samples for both the IRSL-50 (e.g. Scherler et al., 2015) and the low-temperature pIRIR (e.g. van Gorp et al., 2013; Bonnet et al., 2019).
5.2 Age range finder
Our observation that the IRSL-50 signal of 2 out of 10 samples captured the Late Holocene age while none of the samples shows pIRIR-150 ages in line with the Late Holocene further highlights the expected extremely fast mobilization and high-turbidity transport mechanisms under which the sediments from the Pokhara Formation were formed. It is well established that the IRSL-50 signal bleaches quicker than the pIRIR-150 signal (Kars et al., 2014), which suggests that the pre-exposure (prior to the extreme event) and transport time was too limited, the turbidity of the discharge was too high (Mey et al., 2023), and/or the deposition rate was too high to provide sufficient light exposure to fully bleach the IRSL-50 signal and at least partly bleach the pIRIR-150 signal of a significant number of grains (Brill et al., 2018). Lavé et al. (2023) sampled material from the internal shear zone high up in the Sabche Cirque (Fig. 1a) and assumed that increased temperature and/or shear heating sufficiently reset the IRSL-50 and pIRIR-225 signals for dating, a phenomenon referred to as triboluminescence. Like our data, their IRSL-50 age distributions also show highly scattered data with a minimum age of ∼900 years. Their scattered age distributions also suggest that the samples are heterogeneously reset, suggesting that shear heating was not able to fully reset the IRSL signal (Bateman et al., 2018). Regardless, the recent results of Lavé et al. (2023) and our results indicate that luminescence methods have the potential to be used as an age range finder in dating these extremely dynamic mass movement events. If the main research goal is to place similar mass movements into a general stratigraphic context, for example to establish whether the valley infill is of Holocene or Pleistocene (Early, Middle or Late) age, feldspar single-grain IRSL-50 will facilitate a correct chronostratigraphic interpretation. However, the data must be interpreted cautiously, and care must be taken to retrieve the youngest subpopulation from a sample by applying the bMAM. However, even the youngest subpopulation may still overestimate the true age by a few thousand years. In our case the IRSL-50 signal of 2 out of 10 samples yielded the correct Late Holocene age range. Therefore, we advise to study at least 10 samples when dating samples from comparable mass movement deposits. It should also be noted that the advantages of using single-grain feldspar IRSL-50 as an age range finder method, compared to conventional quartz OSL dating, are (i) the availability of a sensitive luminescence signal even in settings in close proximity to plutonic or metamorphic bedrock (e.g. Guralnik et al., 2015) and (ii) the very measurement-time-efficient data gathering, as typically ∼50 % of the K-rich feldspar signal provides a suitable IRSL or pIRIR luminescence response (e.g. Reimann et al., 2017).
5.3 Using luminescence-based proxies for tracing sediment dynamics
The heterogeneous nature of the sediments is manifested in high overdispersion values ranging from 43 % to 120 % and 14 % to 88 % for the IRSL-50 and pIRIR-150 signal, respectively. The lower overdispersion of the pIRIR-150 signal should thereby be interpreted as a result of more homogeneous poor bleaching compared to the on average more heterogeneous poor bleaching of the IRSL-50 signal. Additionally, the relationship between overdispersion and equivalent doses (Fig. 6b) shows, for both signals, a decrease in overdispersion with increasing equivalent dose values, which suggests bleaching as the main source of scatter in the corresponding equivalent dose distributions (Brill et al., 2018; Cunningham et al., 2015). Interestingly, we could not observe a trend in the overdispersion with runout distance, i.e. the degree of heterogeneous bleaching neither increases nor decreases with distance from the apex. Again, this hints at extremely limited bleaching opportunities overall, and thus mobilization of sediments with very limited pre-exposure, very rapid sediment transport under high turbidity conditions and immediate burial after deposition (i.e. very high sedimentation rates).
Apart from a dip in the percentage of saturated grains at ∼25 km distance from the apex (Fig. 7a), especially in the IRSL-50 data, the results of the other two bleaching proxies show no clear trend with runout distance. Guyez et al. (2022) propose that a decrease in the fraction of saturated grains may either indicate a lower input of bedrock grains or a change in fluvial bleaching potential. Bearing in mind the catastrophic nature of sediment transport that resulted in the emplacement of the Pokhara formation, a change of the fluvial bleaching potential seems unlikely, and we interpret that the dip in the percentage of saturated grains more likely indicates a change in the sediment contribution of different source areas. While saturated grains are typically sourced from side gorges and/or local valley wall (bedrock) incisions, the decrease in the percentage of saturated grains may indicate the contribution of fluvially transported sediments from a tributary of the Seti River. In our case the most likely explanation is the activation of previously deposited fluvial sediments from the Bijayapur Khola (Khola means small river in Nepali) (Fig. 1b).
The percentages of best-bleached, saturated and other grains (Fig. 7a and b) lack an overall trend with runout distance. Absence of clear spatial relationships suggests that sediments were transported under conditions with an extremely low probability of bleaching, which points at fast mobilization of the grains, transport under highly turbid conditions and low chances for sediment cycling in the floodplain. This strongly supports the hypothesis put forward by Stolle et al. (2017) that Pokhara sediment fill-in was deposited by one or several discrete mass movement events.
McGuire and Rhodes (2015a), Gray et al. (2017), and Guyez et al. (2023) used single-grain luminescence data to calculate virtual velocities for grains transported in fluvial systems; a virtual velocity is a velocity averaged over transport and rest times (Gray et al., 2019). The estimated virtual velocities are based on bleaching during in-channel transport. These studies show an along-stream decrease in the luminescence signals for their less extreme mountainous settings; additionally, McGuire and Rhodes (2015b) showed that differential luminescence decreases depending on IR and pIRIR stimulation temperature. Due to the absence of a clear trend in luminescence proxies with runout distance, our single-grain luminescence data cannot be used to calculate the virtual velocity of the associated sediments. We encourage future work on river sediment systems that can be placed between the dynamic mountainous settings studied by McGuire and Rhodes (2015a, b) and Guyez et al. (2022, 2023) and our extreme mass movement. This would help to identify the potential threshold between clear longitudinal trends of luminescence proxies for dynamic mountainous settings and the absence of a clear trend for extreme mass movement sediments. We propose to mainly focus on the proxies of best-bleached and saturated grains in future work such as Guyez et al. (2023), and not on the overdispersion proxy. Our data and previous studies showed (Guyez et al., 2023) that the overdispersion proxy is less sensitive in capturing bleaching dynamics and longitudinal trends than the fraction of saturated and best-bleached grains.
This study tested the application of single-grain (feldspar) luminescence for dating and reconstructing sediment dynamics of an extreme mass movement event in the Himalayan mountain range. Our analysis revealed that the quartz signal did not bear a sensitive signal, which strongly limits the suitability of the method for determining the age of Himalayan mass movement deposits. The IRSL-50 and pIRIR-150 feldspar signals were used for estimating the age range of the deposits and underscored the expected extreme fast mobilization and high-turbidity transport mechanisms under which the Pokhara Formation was emplaced. If one's main research goal is to place similar mass movements into a general stratigraphic context, feldspar single-grain IRSL-50 will lead to the most plausible chronostratigraphic interpretation. Care must be taken to focus on retrieving the youngest subpopulation from a sample by applying the bMAM. Ages that are overestimated by thousands of years can, however, still occur.
The high overdispersion values underline the heterogeneous nature of the sediment and the decrease in overdispersion with increasing equivalent dose implies that the degree of bleaching is the main source of scatter in the equivalent dose distributions for both feldspar signals under study. Our data show that overdispersion is less sensitive in capturing longitudinal trends than our two bleaching proxies; therefore, we propose focusing on studying proxies based on best-bleached and saturated grains in future work. These two bleaching proxies show no general longitudinal trend either. However, they capture a decreased input of saturated bedrock grains at ∼25 km from the apex, which are possibly related to a change in sediment contribution from different source areas.
The absence of clear spatial relationships suggests that sediments were transported under conditions with extremely low bleaching probabilities, which prevented us from calculating virtual velocities. Still, our data support rather than falsify the current hypothesis that the Pokhara sediment fill-in was deposited by one or several extreme mass movement events.
Table A1Overview of residual and recovered doses for both signals, the resulting dose recovery ratio, and the number of grains contributing to the calculations. Sample NCL-7619125 has been used for these measurements.
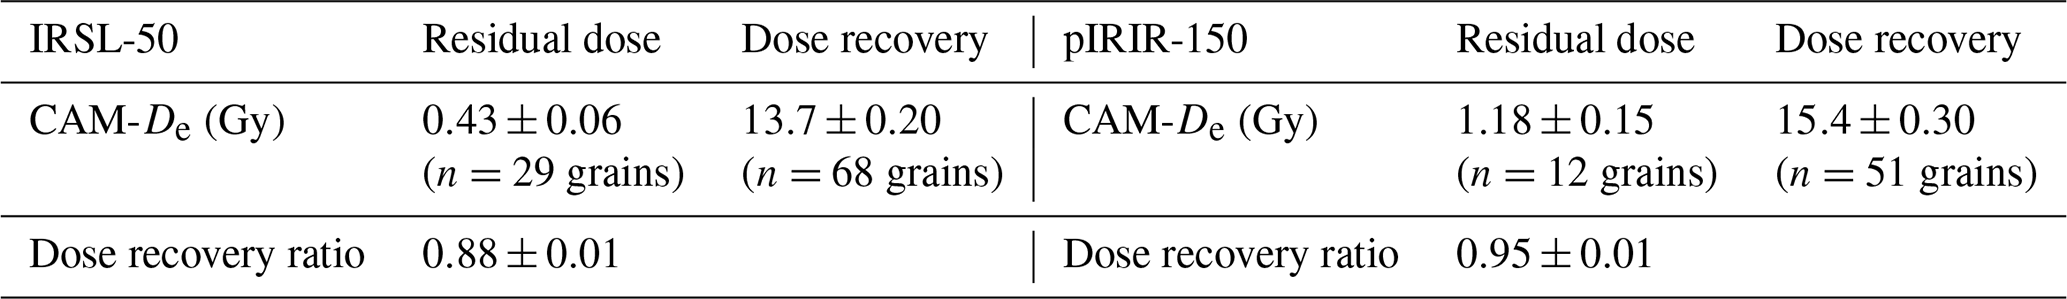
Table B1Overview of the fading g values for both signals for NCL samples 7619109, -111, -122, -123. Three multi-grain discs were measured per sample. The outcomes are averaged into one g value per signal, and these are used for further analysis. The g value was normalized to 2 d (172 800 s) (tc.g_value).
The code, the data to run the analysis and a substantiation of the dose rate portions are available in the Supplement.
The supplement related to this article is available online at: https://doi.org/10.5194/gchron-6-53-2024-supplement.
All authors contributed to the study conception and design. Fieldwork was performed by WS, JM, BRA, and AMdB. Laboratory work, measurements and data analyses were performed at the Netherlands Centre for Luminescence dating at Wageningen University & Research by AMdB with the support of TR. The first draft of the manuscript was written by AMdB, and all authors commented on previous versions of the manuscript. All authors read and approved the final manuscript.
The contact author has declared that none of the authors has any competing interests.
Publisher's note: Copernicus Publications remains neutral with regard to jurisdictional claims made in the text, published maps, institutional affiliations, or any other geographical representation in this paper. While Copernicus Publications makes every effort to include appropriate place names, the final responsibility lies with the authors.
The authors gratefully acknowledge funding from the VolkswagenStiftung for the Experiment!-project “Illuminating the speed of sand – quantifying sediment transport using optically stimulated luminescence”. The samples Pk-X17 and 18 were collected by Amelie Stolle (University of Osnabrück), John Jansen (Czech Academy of Sciences), Oliver Korup (University of Potsdam) and Tim J. Cohen (University of Wollongong), whom we thank for their contribution to this work. We thank Alice Versendaal and Erna van den Hengel-Voskuilen for their support at the Netherlands Centre for Luminescence dating. We thank both reviewers for their comments, which helped to improve the clarity of the manuscript.
This research has been supported by the Volkswagen Foundation (Experiment!-project “Illuminating the speed of sand – quantifying sediment transport using optically stimulated luminescence”).
This paper was edited by Julie Durcan and reviewed by Maria Schaarschmidt and one anonymous referee.
Auclair, M., Lamothe, M., and Huot, S.: Measurement of anomalous fading for feldspar IRSL using SAR, Radiat. Meas., 37, 487–492, https://doi.org/10.1016/S1350-4487(03)00018-0, 2003.
Bateman, M. D., Swift, D. A., Piotrowski, J. A., Rhodes, E. J., and Damsgaard, A.: Can glacial shearing of sediment reset the signal used for luminescence dating?, Geomorphology, 306, 90–101, https://doi.org/10.1016/j.geomorph.2018.01.017, 2018.
Bonnet, S., Reimann, T., Wallinga, J., Lague, D., Davy, P., and Lacoste, A.: Landscape dynamics revealed by luminescence signals of feldspars from fluvial terraces, Sci. Rep.-UK, 9, 1–9, https://doi.org/10.1038/s41598-019-44533-4, 2019.
Borgatti, L. and Soldati, M.: Landslides as a geomorphological proxy for climate change: a record from the Dolomites (northern Italy), Geomorphology, 120, 56–64, https://doi.org/10.1016/j.geomorph.2009.09.015, 2010.
Brill, D., Reimann, T., Wallinga, J., May, S. M., Engel, M., Riedesel, S., and Brückner, H.: Testing the accuracy of feldspar single grains to date late Holocene cyclone and tsunami deposits, Quat. Geochronol., 48, 91–103, https://doi.org/10.1016/j.quageo.2018.09.001, 2018.
Buylaert, J. P., Jain, M., Murray, A. S., Thomsen, K. J., Thiel, C., and Sohbati, R.: A robust feldspar luminescence dating method for Middle and Late P leistocene sediments, Boreas, 41, 435–451, https://doi.org/10.1111/j.1502-3885.2012.00248.x, 2012.
Chamberlain, E. L. and Wallinga, J.: Seeking enlightenment of fluvial sediment pathways by optically stimulated luminescence signal bleaching of river sediments and deltaic deposits, Earth Surf. Dynam., 7, 723–736, https://doi.org/10.5194/esurf-7-723-2019, 2019.
Chamberlain, E. L., Wallinga, J., Reimann, T., Goodbred Jr., S. L., Steckler, M. S., Shen, Z., and Sincavage, R.: Luminescence dating of delta sediments: Novel approaches explored for the Ganges-Brahmaputra-Meghna Delta, Quat. Geochronol., 41, 97–111, https://doi.org/10.1016/j.quageo.2017.06.006, 2017.
Croissant, T., Lague, D., Steer, P., and Davy, P.: Rapid post-seismic landslide evacuation boosted by dynamic river width, Nat. Geosci., 10, 680–684, https://doi.org/10.1038/ngeo3005, 2017.
Cunningham, A. C. and Wallinga, J.: Realizing the potential of fluvial archives using robust OSL chronologies, Quat. Geochronol., 12, 98–106, https://doi.org/10.1016/j.quageo.2012.05.007, 2012.
Cunningham, A. C., Wallinga, J., Hobo, N., Versendaal, A. J., Makaske, B., and Middelkoop, H.: Re-evaluating luminescence burial doses and bleaching of fluvial deposits using Bayesian computational statistics, Earth Surf. Dynam., 3, 55–65, https://doi.org/10.5194/esurf-3-55-2015, 2015.
Duller, G. A.: Single-grain optical dating of Quaternary sediments: why aliquot size matters in luminescence dating, Boreas, 37, 589–612, https://doi.org/10.1111/j.1502-3885.2008.00051.x, 2008.
Duller, G. A. T.: Single grain optical dating of glacigenic deposits, Quat. Geochronol., 1, 296–304, https://doi.org/10.1016/j.quageo.2006.05.018, 2006.
Durcan, J. A. and Duller, G. A.: The fast ratio: A rapid measure for testing the dominance of the fast component in the initial OSL signal from quartz, Radiat. Meas., 46, 1065–1072, https://doi.org/10.1016/j.radmeas.2011.07.016, 2011.
Eriksson, M. G., Olley, J. M., and Payton, R. W.: Soil erosion history in central Tanzania based on OSL dating of colluvial and alluvial hillslope deposits, Geomorphology, 36, 107–128, https://doi.org/10.1016/S0169-555X(00)00054-4, 2000.
Fort, M.: Phases d'accumullations sédimentaires internes et phases orogéniques au Sud du massif de l'Annapurna: L'exemple du bassin de Pokhara (Népal), Revue géographique des Pyrénées et du Sud-Ouest, 1, 25–47, 1984.
Fort, M.: Sporadic morphogenesis in a continental subduction setting: an example from the Annapurna Range, Nepal Himalaya, Z. Geomorphol., 63, 9–36, 1987.
Fort, M.: The Pokhara valley: a product of a natural catastrophe, in: Geomorphological Landscapes of the World, Springer, Dordrecht, 265–274, https://doi.org/10.1007/978-90-481-3055-9_27, 2009.
Froude, M. J. and Petley, D. N.: Global fatal landslide occurrence from 2004 to 2016, Nat. Hazards Earth Syst. Sci., 18, 2161–2181, https://doi.org/10.5194/nhess-18-2161-2018, 2018.
Fuchs, M., Fischer, M., and Reverman, R.: Colluvial and alluvial sediment archives temporally resolved by OSL dating: Implications for reconstructing soil erosion, Quat. Geochronol., 5, 269–273, https://doi.org/10.1016/j.quageo.2009.01.006, 2010.
Galbraith, R. F., Roberts, R. G., Laslett, G. M., Yoshida, H., and Olley, J. M.: Optical dating of single and multiple grains of quartz from Jinmium rock shelter, northern Australia: Part I, experimental design and statistical models, Archaeometry, 41, 339–364, https://doi.org/10.1111/j.1475-4754.1999.tb00987.x, 1999.
Gariano, S. L. and Guzzetti, F.: Landslides in a changing climate, Earth-Sci. Rev., 162, 227–252, https://doi.org/10.1016/j.earscirev.2016.08.011, 2016.
Godfrey-Smith, D. I., Huntley, D. J., and Chen, W. H.: Optical dating studies of quartz and feldspar sediment extracts, Quaternary Sci. Rev., 7, 373–380, https://doi.org/10.1016/0277-3791(88)90032-7, 1988.
Gray, H. J., Tucker, G. E., Mahan, S. A., McGuire, C., and Rhodes, E. J.: On extracting sediment transport information from measurements of luminescence in river sediment, J. Geophys. Res.-Earth, 122, 654–677, https://doi.org/10.1002/2016JF003858, 2017.
Gray, H. J., Jain, M., Sawakuchi, A. O., Mahan, S. A., and Tucker, G. E.: Luminescence as a sediment tracer and provenance tool, Rev. Geophys., 57, 987–1017, https://doi.org/10.1029/2019RG000646, 2019.
Guralnik, B., Ankjærgaard, C., Jain, M., Murray, A. S., Müller, A., Wälle, M., Lowick, S. E., Preusser, F., Rhodes, E. J., Wu, T.-S., Mathew, G., and Herman, F.: OSL-thermochronometry using bedrock quartz: A note of caution, Quat. Geochronol., 25, 37–48, https://doi.org/10.1016/j.quageo.2014.09.001, 2015.
Guyez, A., Bonnet, S., Reimann, T., Carretier, S., and Wallinga, J.: Illuminating past river incision, sediment source and pathways using luminescence signals of individual feldspar grains (Rangitikei River, New Zealand), Earth Surf. Proc. Land., 47, 1952–1971, https://doi.org/10.1002/esp.5357, 2022.
Guyez, A., Bonnet, S., Reimann, T., Carretier, S., and Wallinga, J.: A Novel Approach to Quantify Sediment Transfer and Storage in Rivers – Testing Feldspar Single-Grain pIRIR Analysis and Numerical Simulations, J. Geophys. Res.-Earth, 128, e2022JF006727, https://doi.org/10.1029/2022JF006727, 2023.
Hewitt, K.: Catastrophic landslide deposits in the Karakoram Himalaya, Science, 242, 64–67, https://doi.org/10.1126/science.242.4875.64, 1988.
Hewitt, K.: Quaternary moraines vs. catastrophic rock avalanches in the Karakoram Himalaya, northern Pakistan, Quaternary Res., 51, 220–237, https://doi.org/10.1006/qres.1999.2033, 1999.
Hu, G., Yi, C. L., Zhang, J. F., Liu, J. H., and Jiang, T.: Luminescence dating of glacial deposits near the eastern Himalayan syntaxis using different grain-size fractions, Quaternary Sci. Rev., 124, 124–144, https://doi.org/10.1016/j.quascirev.2015.07.018, 2015.
IPCC: Climate Change 2022: Impacts, Adaptation, and Vulnerability. Contribution of Working Group II to the Sixth Assessment Report of the Intergovernmental Panel on Climate Change, edited by: Pörtner, H.-O., Roberts, D. C., Tignor, M., Poloczanska, E. S., Mintenbeck, K., Alegría, A., Craig, M., Langsdorf, S., Löschke, S., Möller, V., Okem, A., and Rama, B., Cambridge University Press, https://oceanrep.geomar.de/id/eprint/57717 (last access: 24 October 2023), in press, 2022.
Jain, M. and Ankjærgaard, C.: Towards a non-fading signal in feldspar: insight into charge transport and tunnelling from time-resolved optically stimulated luminescence, Radiat. Meas., 46, 292–309, https://doi.org/10.1016/j.radmeas.2010.12.004, 2011.
Jaiswal, M. K., Bhat, M. I., Bali, B. S., Ahmad, S., and Chen, Y. G.: Luminescence characteristics of quartz and feldspar from tectonically uplifted terraces in Kashmir Basin, Jammu and Kashmir, India, Radiat. Meas., 44, 523–528, https://doi.org/10.1016/j.radmeas.2009.04.008, 2009.
Joordens, J. C., d'Errico, F., Wesselingh, F. P., Munro, S., De Vos, J., Wallinga, J., Ankjærgaard, C., Reimann, T., Wijbrands, J. W., Kuiper, K. F., Mücher, H. J., Coqueugniot, H., Prié, V., Joosten, I., van Os, B., Schulp, A. S., Panuel, M., van der Haas, V., Lustenhouwer, W., Reijmer, J. J. G., and Roebroeks, W.: Homo erectus at Trinil on Java used shells for tool production and engraving, Nature, 518, 228–231, https://doi.org/10.1038/nature13962, 2015.
Kars, R. H., Reimann, T., Ankjærgaard, C., and Wallinga, J.: Bleaching of the post-IR IRSL signal: new insights for feldspar luminescence dating, Boreas, 43, 780–791, https://doi.org/10.1111/bor.12082, 2014.
Kreutzer, S.: calc_FadingCorr(): Apply a fading correction according to Huntley and Lamothe (2001) for a given g-value and a given tc. Function version 0.4.3, in: Luminescence: Comprehensive Luminescence Dating Data Analysis. R package version 0.9.22, edited by: Kreutzer, S., Burow, C., Dietze, M., Fuchs, M. C., Schmidt, C., Fischer, M., Friedrich, J., Mercier, N., Philippe, A., Riedesel, S., Autzen, M., Mittelstrass, D., Gray, H. J., and Galharret, J., https://CRAN.R-project.org/package=Luminescence (last access: 24 October 2023), 2023.
Lavé, J., Guérin, C., Valla, P. G., Guillou, V., Rigaudier, T., Benedetti, L., France-Lanord, C., Gajurel, A. P., Morin, G., Dumoulin, J. P., Moreau, C., and Galy, V.: Medieval demise of a Himalayan giant summit induced by mega-landslide, Nature, 619, 94–101, https://doi.org/10.1038/s41586-023-06040-5, 2023.
Li, B., Jacobs, Z., Roberts, R. G., and Li, S. H.: Review and assessment of the potential of post-IR IRSL dating methods to circumvent the problem of anomalous fading in feldspar luminescence, Geochronometria, 41, 178–201, 2014.
McGuire, C. and Rhodes, E. J.: Determining fluvial sediment virtual velocity on the Mojave River using K-feldspar IRSL: Initial assessment, Quatern. Int., 362, 124–131, https://doi.org/10.1016/j.quaint.2014.07.055, 2015a.
McGuire, C. and Rhodes, E. J.: Downstream MET-IRSL single-grain distributions in the Mojave River, southern California: Testing assumptions of a virtual velocity model, Quat. Geochronol., 30, 239–244, https://doi.org/10.1016/j.quageo.2015.02.004, 2015b.
Mey, J., Schwanghart, W., de Boer, A.-M., and Reimann, T.: Differential bleaching of quartz and feldspar luminescence signals under high-turbidity conditions, Geochronology, 5, 377–389, https://doi.org/10.5194/gchron-5-377-2023, 2023.
Olley, J. M., Pietsch, T., and Roberts, R. G.: Optical dating of Holocene sediments from a variety of geomorphic settings using single grains of quartz, Geomorphology, 60, 337–358, https://doi.org/10.1016/j.geomorph.2003.09.020, 2004.
Pánek, T.: Recent progress in landslide dating: a global overview, Prog. Phys. Geog., 39, 168–198, https://doi.org/10.1177/0309133314550671, 2015.
Preusser, F., Ramseyer, K., and Schlüchter, C.: Characterisation of low OSL intensity quartz from the New Zealand Alps, Radiat. Meas., 41, 871–877, https://doi.org/10.1016/j.radmeas.2006.04.019, 2006.
Preusser, F., Chithambo, M. L., Götte, T., Martini, M., Ramseyer, K., Sendezera, E. J., Susino, G. J., and Wintle, A. G.: Quartz as a natural luminescence dosimeter, Earth-Sci. Rev., 97, 184–214, https://doi.org/10.1016/j.earscirev.2009.09.006, 2009.
Ramsey, C. B.: Bayesian analysis of radiocarbon dates, Radiocarbon, 51, 337–360, https://doi.org/10.1017/S0033822200033865, 2009.
Reimann, T., Thomsen, K. J., Jain, M., Murray, A. S., and Frechen, M.: Single-grain dating of young sediments using the pIRIR signal from feldspar, Quat. Geochronol., 11, 28–41, https://doi.org/10.1016/j.quageo.2012.04.016, 2012.
Reimann, T., Notenboom, P. D., De Schipper, M. A., and Wallinga, J.: Testing for sufficient signal resetting during sediment transport using a polymineral multiple-signal luminescence approach, Quat. Geochronol., 25, 26–36, https://doi.org/10.1016/j.quageo.2014.09.002, 2015.
Reimann, T., Román-Sánchez, A., Vanwalleghem, T., and Wallinga, J.: Getting a grip on soil reworking–Single-grain feldspar luminescence as a novel tool to quantify soil reworking rates, Quat. Geochronol., 42, 1–14, https://doi.org/10.1016/j.quageo.2017.07.002, 2017.
Reimer, P. J., Austin, W. E., Bard, E., Bayliss, A., Blackwell, P. G., Ramsey, C., Butzin, M., Cheng, H., Edwards, R. L., Friedrich, M., Grootes, M. P., Guilderson, T. P., Hajdas, I., Heaton, T. J., Hogg, A. G., Hughen, K. A., Kromer, B., Manning, S. W., Muscheler, R., Palmer, J. G., Pearson, C., van der Plicht, J., Reimer, R. W., Richards, D. A., Scott, E. M., Southon, J. R., Turney, C. S. M., Wacker, L., Adolphi, F., Büntgen, U., Capano, M., Fahrni, S. M., Fogtmann-Schulz, A., Friedrich, R., Köhler, P., Kudsk, S., Miyake, F., Olsen, J., Reinig, F., Sakamoto, M., Sookdea, A., and Talamo, S.: The IntCal20 Northern Hemisphere radiocarbon age calibration curve (0–55 cal kBP), Radiocarbon, 62, 725–757, 2020.
Rhodes, E. J.: Optically stimulated luminescence dating of sediments over the past 200 000 years, Annu. Rev. Earth Pl. Sc., 39, 461–488, https://doi.org/10.1146/annurev-earth-040610-133425, 2011.
Rhodes, E. J. and Leathard, J. A.: MET-IRSL used to track pre-depositional sediment transport history, Quat. Geochronol., 70, 101294, https://doi.org/10.1016/j.quageo.2022.101294, 2022.
Riedesel, S., Brill, D., Roberts, H. M., Duller, G. A., Garrett, E., Zander, A. M., King, G. E., Tamura, T., Burow, C., Cunningham, A., Seeliger, M., de Batist, M., Heyvaert, V. M. A., Fuijwara, O., and Brückner, H.: Single-grain feldspar luminescence chronology of historical extreme wave event deposits recorded in a coastal lowland, Pacific coast of central Japan, Quat. Geochronol., 45, 37–49, https://doi.org/10.1016/j.quageo.2018.01.006, 2018.
Roberts, H. M.: Testing Post-IR IRSL protocols for minimising fading in feldspars, using Alaskan loess with independent chronological control, Radiat. Meas., 47, 716–724, https://doi.org/10.1016/j.radmeas.2012.03.022, 2012.
Rodnight, H., Duller, G. A. T., Wintle, A. G., and Tooth, S.: Assessing the reproducibility and accuracy of optical dating of fluvial deposits, Quat. Geochronol., 1, 109–120, https://doi.org/10.1016/j.quageo.2006.05.017, 2006.
Sawakuchi, A. O., Rodrigues, F. C. G., Mineli, T. D., Mendes, V. R., Melo, D. B., Chiessi, C. M., and Giannini, P. C. F.: Optically stimulated luminescence sensitivity of quartz for provenance analysis, Methods and Protocols, 3, 6, https://doi.org/10.3390/mps3010006, 2020.
Scherler, D., Bookhagen, B., Wulf, H., Preusser, F., and Strecker, M. R.: Increased late Pleistocene erosion rates during fluvial aggradation in the Garhwal Himalaya, northern India, Earth Planet. Sc. Lett., 428, 255–266, https://doi.org/10.1016/j.epsl.2015.06.034, 2015.
Schwanghart, W., Bernhardt, A., Stolle, A., Hoelzmann, P., Adhikari, B. R., Andermann, C., Tofelde, S., Merchel, S., Rugel, G., Fort, M., and Korup, O.: Repeated catastrophic valley infill following medieval earthquakes in the Nepal Himalaya, Science, 351, 147–150, https://doi.org/10.1126/science.aac9865, 2016.
Shugar, D. H., Jacquemart, M., Shean, D., Bhushan, S., Upadhyay, K., Sattar, A., Schwanghart, W., McBride, S., Van Wyk De Vries, M., Mergili, M., Emmer, A., Deschamps-Berger, C., McDonnell, M., Bhambri, R., Allen, S., Berthier, E., Carrivick, J. L., Clague, J. J., Dokukin, M., Dunning, S. A., Frey, H., Gascoin, S., Haritashya, U. K., Huggel, C., Kääb, A., Kargel, J. S., Kavanaugh, J. L., Lacroix, P., Petley, D., Rupper, S., Azam, M. F., Cook, S. J., Dimri, A. P., Eriksson, M., Farinotti, D., Fiddes, J., Gnyawali, K. R., Harrison, S., Koppes, M. M., KUMAR, A., Leinss, S., Majeed, U., Mal, S., Muhuri, A., Noetzli, J., Paul, F., Rashid, I., Sain, K., Steiner, J., Ugalde, F., Watson, C. S., and Westoby, M. J.: A massive rock and ice avalanche caused the 2021 disaster at Chamoli, Indian Himalaya, Science, 373, 300–306, https://doi.org/10.1126/science.abh4455, 2021.
Souza, P. E., Pupim, F. N., Mazoca, C. E., del Río, I., Mineli, T. D., Rodrigues, F. C., Porat, N., Hartmann, G. A., and Sawakuchi, A. O.: Quartz osl sensitivity from dating data for provenance analysis of pleistocene and holocene fluvial sediments from lowland Amazonia, Quat. Geochronol., 74, 101422, https://doi.org/10.1016/j.quageo.2023.101422, 2023.
Smedley, R. K.: Testing the use of single grains of K-feldspar for luminescence dating of proglacial sediments in Patagonia, Doctoral dissertation, Aberystwyth University, 2014.
Stolle, A., Bernhardt, A., Schwanghart, W., Hoelzmann, P., Adhikari, B. R., Fort, M., and Korup, O.: Catastrophic valley fills record large Himalayan earthquakes, Pokhara, Nepal, Quaternary Sci. Rev., 177, 88–103, https://doi.org/10.1016/j.quascirev.2017.10.015, 2017.
Tatumi, S. H., Peixoto, M. N. O., Moura, J. R., Mello, C. L., Carmo, I. O., Kowata, E. A., Yee, M., Brito, S. L. M., Gozzi, G., and Kassab, L. R.: Optical dating using feldspar from Quaternary alluvial and colluvial sediments from SE Brazilian Plateau, Brazil, J. Lumin., 102, 566–570, https://doi.org/10.1016/S0022-2313(02)00616-6, 2003.
Thomsen, K. J., Murray, A. S., Jain, M., and Bøtter-Jensen, L.: Laboratory fading rates of various luminescence signals from feldspar-rich sediment extracts, Radiat. Meas., 43, 1474–1486, https://doi.org/10.1016/j.radmeas.2008.06.002, 2008.
van Gorp, W., Veldkamp, A., Temme, A. J. A. M., Maddy, D., Demir, T., van der Schriek, T., Reimann, T., Wallinga, J., Wijbrans, J., and Schoorl, J. M.: Fluvial response to Holocene volcanic damming and breaching in the Gediz and Geren rivers, western Turkey, Geomorphology, 201, 430–448, https://doi.org/10.1016/j.geomorph.2013.07.016, 2013.
Weidinger, J. T., Korup, O., Munack, H., Altenberger, U., Dunning, S. A., Tippelt, G., and Lottermoser, W.: Giant rockslides from the inside, Earth Planet. Sc. Lett., 389, 62–73, https://doi.org/10.1016/j.epsl.2013.12.017, 2014.
Wintle, A. G. and Murray, A. S.: A review of quartz optically stimulated luminescence characteristics and their relevance in single-aliquot regeneration dating protocols, Radiat. Meas., 41, 369–391, https://doi.org/10.1016/j.radmeas.2005.11.001, 2006.
Yamanaka, H.: Radiocarbon ages of upper Quaternary deposit in central Nepal and their geomorphological significance, Science Reports of the Tohoku University, 7th Series, Geography, 32, 46–60, 1982.
Zech, R., Zech, M., Kubik, P. W., Kharki, K., and Zech, W.: Deglaciation and landscape history around Annapurna, Nepal, based on 10Be surface exposure dating, Quaternary Sci. Rev., 28, 1106–1118, https://doi.org/10.1016/j.quascirev.2008.11.013, 2009.
Zhang, S., Zhao, H., Sheng, Y., Zhang, J., Zhang, J., Sun, A., Wang, L., Huang, L., Hou, J., and Chen, F.: Mega-lakes in the northwestern Tibetan Plateau formed by melting glaciers during the last deglacial, Quaternary Sci. Rev., 285, 107528, https://doi.org/10.1016/j.quascirev.2022.107528, 2022.