the Creative Commons Attribution 4.0 License.
the Creative Commons Attribution 4.0 License.
 | 04 Apr 2025
U–Pb dating on calcite paleosol nodules: first absolute age constraints on the Miocene continental succession of the Paris Basin
Rémi Rateau
Kerstin Drost
Cyril Gagnaison
Bastien Mennecart
Renaud Toullec
Koen Torremans
David Chew
Continental sedimentary successions are typically less complete and more poorly preserved than the marine record, leading to limited correlations between basins. Traditionally, intra-basin correlation employs radiometric dating of volcanic markers or relative dating based on the fossil record. However, volcanic markers may not always be present, and biostratigraphy relies on index fossils that are often sparse to absent in continental succession. Recent progress in carbonate U–Pb dating can improve correlations between continental successions by providing absolute age constraints on carbonate deposition and/or on syn- to post-depositional processes such as pedogenesis.
In this study, we analysed pedogenic calcite nodules within a continental Miocene succession in the southwestern Paris Basin (the important paleontological site at Mauvières quarry, France). Following multi-method petrographic characterisation of the samples, LA-ICP-MS (laser ablation inductively coupled plasma mass spectrometry) U–Pb dating was employed to obtain formation ages on the pedogenic calcite nodules. The Tera–Wasserburg intercept ages from five nodules from the same horizon (19.3 ± 1.3/1.4, 18.8 ± 2.7/2.7, 19.11 ± 0.84/0.94, 19.0 ± 2.3/2.3 and 19.4 ± 2.7/2.7 Ma) are in excellent agreement with previous biostratigraphic constraints on the sequence. Petrographic evidence points to a single crystallisation event, and we conclude that the formation of the calcite nodules occurred at 19.22 ± 0.66/0.79 Ma (central age from a radial plot of the five Tera–Wasserburg intercept ages). This calcite formation age is regarded to represent a minimum depositional age of the strata hosting the root nodules. It provides the first absolute age for the continental Miocene succession (and Neogene mammal zone MN3) of the Paris Basin and allows correlation with other continental basins independent of their fossil assemblages or where fossil content is absent.
- Article
(11871 KB) - Full-text XML
-
Supplement
(1843 KB) - BibTeX
- EndNote


Biostratigraphy assigns relative ages to rock strata by using the fossil assemblages contained within them, with the goal of showing that a particular horizon in a given section represents a similar period of time as an analogue horizon in a different succession. It relies heavily on the presence of index fossils – fossils with a limited time range, wide geographic distribution and rapid evolutionary trends. The common absence of biostratigraphically diagnostic index fossils in continental successions is problematic, and absolute dating approaches often need to be applied to continental successions. Such approaches include geochronology of volcanic horizons such as lava flows, ash beds or cryptotephra (e.g. Rubidge et al., 2013; Smith et al., 2017; Poujol et al., 2023); astronomic calibration (e.g. Kerr, 1992; Montano et al., 2021); and magnetostratigraphic correlation (e.g. Kälin and Kempf, 2009). While volcanic horizons can provide accurate and precise absolute ages, they are not ubiquitous in the sedimentary record. Carbonates are very common in terrestrial successions (except in humid climates) where they can be classified as pedogenic or non-pedogenic, depending on whether they have formed by soil-forming processes (Zamanian et al., 2016). Pedogenic carbonates comprise calcretes and dolocretes – paleosols that have been indurated by a pervasive calcitic cement; pisoliths – globular nodules made of concentric calcitic spheres; and more generic calcitic nodules – indurated concretions with a globular or cylindrical shape, often associated with calcitic cementation around plant roots (rhizocretions; Zamanian et al., 2016).
The formation of carbonates nodules can be classified according to the morphology of the nodule and the postulated fluid pathway that led to the formation of the nodule (Zamanian et al., 2016). Perdescendum models and perascendum models involve dissolution of carbonate with reprecipitation in a different horizon (a deeper horizon for perdescendum and shallower for perascendum), while in situ models do not imply significant carbonate migration through the soil profile (Zamanian et al., 2016). Biological models invoke absorption of Ca-enriched fluid by an organism, leading to calcification of Ca-bearing organs or supersaturation that induces carbonate precipitation (Zamanian et al., 2016). These biological models include rhizolith formation, whereby plant roots pump the water from Ca-enriched fluids leaving behind residual Ca2+ ions that react with the CO2 emitted by rhizomicrobial respiration, resulting in the earliest carbonate cements around the root (Zamanian et al., 2016). After the root dies, the void created is filled (partially to completely) by calcite resulting from the activity of bacteria and algae or from dissolution of the early carbonate cement and reprecipitation into cavities (Aguirre Palafox et al., 2024). When compaction starts, intergranular space and compaction cracks can create new cavities for carbonate precipitation. With burial, the nodule can travel from the oxidising conditions of the vadose zone towards the more reducing environment of the phreatic zone (Aguirre Palafox et al., 2024). This results in chemical changes (e.g. in Fe, Mn and Pb) observable in cathodoluminescence (CL) images but which also affect U–Pb geochronology (Aguirre Palafox et al., 2024).
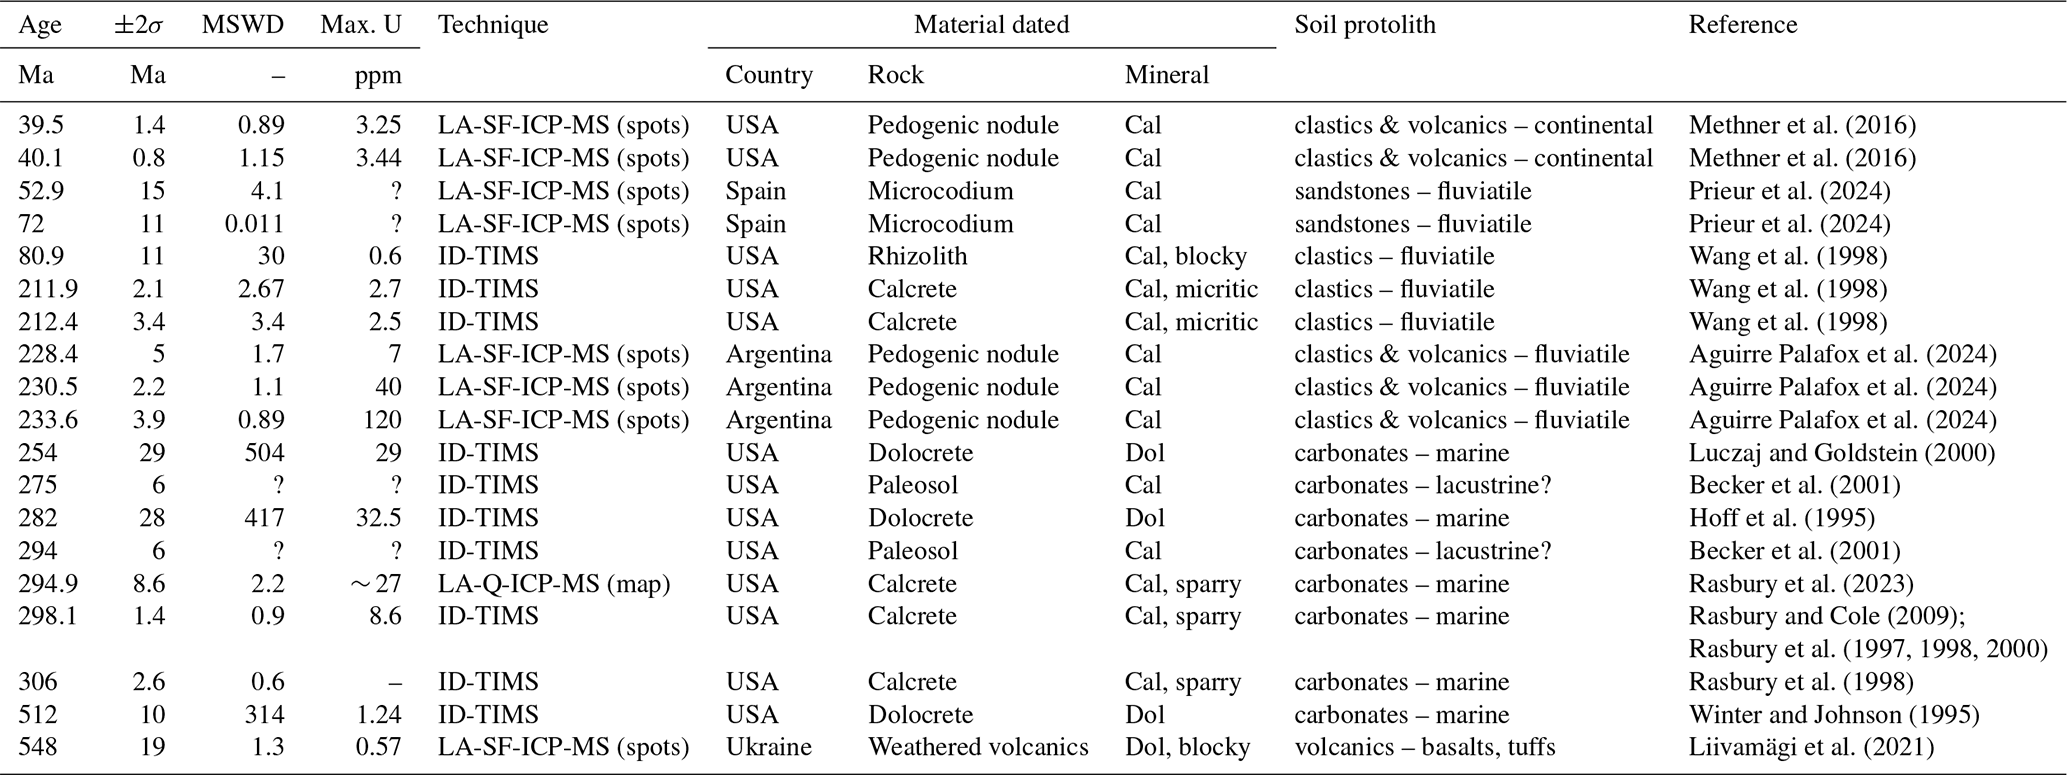
U–Pb dating of calcium carbonate started in the late 1980s using isotope dilution (ID) thermal ionisation mass spectrometry (TIMS) methods (Smith and Farquhar, 1989; Roberts et al., 2020, and references therein). Most terrestrial U–Pb carbonate dating studies have focused on non-pedogenic carbonates (e.g. speleothems, tufas and lacustrine carbonates; see review in Rasbury and Cole, 2009, and a more recent review by Rasbury et al., 2023). The first U–Pb dating studies applied to terrestrial pedogenic carbonates took place in the mid-1990s on Paleozoic uranium-rich dolocretes, developed subaerially on top of marine limestones (Hoff et al., 1995; Winter and Johnson, 1995). Over the following years, a series of ID-TIMS U–Pb dating studies yielded meaningful subaerial exposure ages from (1) late Paleozoic paleosol-derived sparry calcite developed on top of marine carbonate cyclothems in the southwestern USA (Rasbury et al., 1997, 1998, 2000; Rasbury and Cole, 2009); (2) late Paleozoic dolocretes from Kansas, USA (Luczaj and Goldstein, 2000); (3) late Paleozoic subaerially soil-modified palustrine limestones in Ohio, USA (Becker et al., 2001); and (4) Triassic calcretes developed on top of fluviatile siliciclastic deposits in Connecticut, USA (Wang et al., 1998) (Table 1).
Since the mid-2010s, advances in laser ablation inductively coupled plasma mass spectrometry (LA-ICP-MS) have allowed U–Pb dating of calcite with the benefits of much greater spatial resolution, mineralogical context (being in situ) and sample throughput (e.g. Li et al., 2014; Roberts and Walker, 2016; Nuriel et al., 2017). While individual LA-ICP-MS spot ablation U–Pb data are typically significantly less precise than ID-TIMS U–Pb analyses, the high spatial resolution of the approach means it can commonly encounter both high and low portions of the sample, resulting in age regressions with superior precision compared to ID-TIMS U–Pb dating studies which employ bulk sampling (e.g. Li et al., 2014; Roberts et al., 2020). The technique has been employed to date pedogenesis including (1) Eocene pedogenic calcite nodules from Montana, USA (Methner et al., 2016); (2) an Upper Triassic continental succession with calcite nodules and interbedded volcanic markers from Argentina (Aguirre Palafox et al., 2024); (3) Ediacaran dolomite from subaerially weathered volcanics in Ukraine (Liivamägi et al., 2021) (Table 1); and (4) U–Pb geochronology on Microcodium calcite from the Spanish southern Pyrenees that provided more constraints on fluvial mobility during the Paleocene–Eocene Thermal Maximum event (Prieur et al., 2024).
LA-ICP-MS U–Pb dating requires chemically homogenous and large enough zones (circles or squares typically between 50 and 200 µm wide) to obtain sufficient U and radiogenic Pb signals to produce meaningful age results (Roberts and Holdsworth, 2022). Additionally, high U and low common Pb concentrations are required to produce precise U–Pb dates, but carbonates typically incorporate low U abundances (unless the precipitation takes place in reducing environments, e.g. Fournier et al., 2004; Drake et al., 2018; Aguirre Palafox et al., 2024) and significant common Pb (Roberts et al., 2020). Carbonates in general, and pedogenic carbonates in particular, are also often heterogenous at the scale of hundreds of micrometres or below (Zamanian et al., 2016; Roberts and Holdsworth, 2022; Aguirre Palafox et al., 2024), partially explaining the paucity of reliable dating results from pedogenic carbonates. More widespread absolute dating of pedogenic carbonates may provide valuable chronostratigraphic constraints in continental successions, particularly those where volcanic horizons or index fossils are absent. Aguirre Palafox et al. (2024) recently provided guidelines and strategies to improve the sampling and interpretation of pedogenic carbonates and addressed the influence of redox conditions on U concentrations and potential internal zonation.
Table 1Summary of published U–Pb ages of terrestrial pedogenic carbonates (modified and updated after Rasbury and Cole, 2009). Abbreviations: Cal – calcite, Dol – dolomite, ID-TIMS – isotope dilution thermal ionisation mass spectrometer, LA-(SF-/Q-)ICP-MS – laser ablation (sector field/quadrupole) inductively coupled mass spectrometry.
A recent and innovative LA-ICP-MS U–Pb carbonate dating protocol, based on the selection and pooling of pixels from 2D elemental and isotopic ratio maps (Drost et al., 2018; Roberts et al., 2020; Chew et al., 2021), is now commonly employed as a U–Pb dating strategy (e.g. Monchal et al., 2023; Rasbury et al., 2023; Subarkah et al., 2024). This in situ technique allows for the selection of chemically homogenous zones within a chemically heterogenous ablated 2D map area, reducing the risk of incorporating U–Pb data from non-carbonate inclusions or different generations of carbonates (Drost et al., 2018). In addition, this method optimises the spread of data points in Tera–Wasserburg (TW) space, increasing the precision of the results (Drost et al., 2018). Therefore, this mapping-based technique is well suited to U–Pb dating and elemental characterisation of paleosol calcite and can help alleviate some of the issues caused by microheterogeneity in pedogenic carbonates. A late Paleozoic paleosol calcite, already dated by ID-TIMS (298.1 ± 1.4 Ma; Rasbury et al., 1998), has been successfully dated using this approach (294.9 ± 8.6 Ma; Rasbury et al., 2023).
Continental sedimentary successions are often barren or poor in index fossils, which makes dating and intra-basin correlation difficult. Mammal remains have been used to create terrestrial biostratigraphic scales, such as the Neogene mammal (MN) scale in western Europe (Mein, 1975; Agustí et al., 2001). The European MN scale is similar to the scales of the North American Land Mammal Ages (NALMAs) and South American Land Mammal Ages (SALMAs) (see the review of Hilgen et al., 2012). However, mammal fossils are not ubiquitous in the sedimentary record; thus the MN and other mammal scales cannot always be employed. When compared to marine biostratigraphic records (which have index fossils such as planktonic foraminifera, ammonites and graptolites), they also exhibit diachronicity and a poorer temporal resolution. The poor temporal resolution, particularly in the early stages of the MN scale (see Discussion), is well illustrated by the MN3 biozone, which has a duration of between 2.8 and 5.4 Myr, depending on the absolute age chosen for the top and bottom boundaries (Mein, 1999; Steininger, 1999; Aguilar et al., 2003; Raffi et al., 2020). For comparison, the Paleogene calcareous nannofossil scale biozones all have a duration lower than 2 Myr, with most lower than 1 Myr (Agnini et al., 2014). The LA-ICP-MS calcite U–Pb geochronology approach adopted in this study has the potential to constrain the age of continental sedimentary horizons where pedogenic nodules are present. This approach may improve inter-basin correlations and temporal resolution of the MN scale, as well as potentially highlighting regional diachronism if more extensive sampling campaigns were conducted. In this study, we apply the LA-ICP-MS U–Pb mapping technique along with spot analysis to obtain absolute ages from pedogenic calcite nodules from a terrestrial Miocene succession in the Paris Basin, France, whose age is hitherto poorly constrained in terms of absolute dating.
2.1 Regional geology
The Mauvières paleontological site is located in the SW of the Paris Basin (France), a Mesozoic–Cenozoic intracontinental sag basin (Guillocheau et al., 2000). The site is on the northeast margin of the Neogene outcrops, which comprise continental and marine sedimentary rocks unconformably deposited on Paleogene continental sedimentary rocks (Fig. 1a). Regionally, the Cenozoic sedimentary sequence reflects a dominantly continental paleoenvironment with occasional marine transgressions during the Miocene (Fig. 1b, Gagnaison, 2020).
2.2 Paleoenvironment and origin of the calcite nodules
The pedogenic nodules were sampled from the Early Miocene (early to middle Burdigalian) Orléanais Marls and Sands Formation (Fig. 1b), a succession of coarse and fine-grained clastic sediments, a few metres thick (Fig. 2). This formation rests unconformably over a Paleogene lacustrine silty marl (the Eocene–Oligocene Grey Marls Formation) and is overlain by Middle Miocene marine shelly carbonate sands, known locally as faluns (Gagnaison et al., 2023) (Figs. 1b and 2).
The Early Miocene continental sequence at Mauvières consists of a series of eight clastic beds (numbered s1 to s8; Gagnaison et al., 2023; Fig. 2a). The pedogenic nodules were found in the basal bed s1, which overlies Eocene–Oligocene silty marls (Fig. 2). The s1 bed is comprised of a very coarse light grey–orange quarzitic sand with minor feldspar, in situ terrestrial vertebrate fossils, poorly preserved Unio shells (a freshwater mussel), and in situ calcite nodules and cylinders. The sand also contains reworked material, including Cretaceous calcareous and siliceous pebbles, altered glauconite grains, and Cretaceous and Oligocene–Early Miocene vertebrate fossils. The sand is loosely cemented with a clayey and calcareous matrix (Gagnaison et al., 2023). Some rare Unio shells have been found with both valves still connected, indicating both a low-energy environment and the fact that they are in situ (i.e. not reworked from older beds).
The occurrence of (1) hollow calcite cylinders and nodules interpreted as rhizocretions, (2) root tracks in the matrix, (3) iron oxides that give the sand its orange colour, and (4) microvacuoles interpreted as products of subaerial microbial activity suggests the presence of a paleosol (Gagnaison et al., 2023). The nodule-bearing s1 bed is interpreted as a water-transported, low-energy fluvial sequence with prograding sand bars, with phases of lacustrine flooding and development of paleosols. The sequence was subsequently subaerially exposed and followed by the development of a vegetated soil (Gagnaison et al., 2023). The pedogenic nodules are consequently interpreted as in situ and not reworked from older horizons. Rasbury et al. (1997) have shown that the calcite spar typically forms rapidly following paleosol development, and therefore absolute dating of the nodules should provide robust age constraints on the minimum age of the s1 bed. Based on detailed petrography including CL imaging, Aguirre Palafox et al. (2024) provided more information on the environmental factors that influence the timing of nodule formation (e.g. redox conditions, burial, water table levels) that can in turn help refine the interpretation of geochronological results.
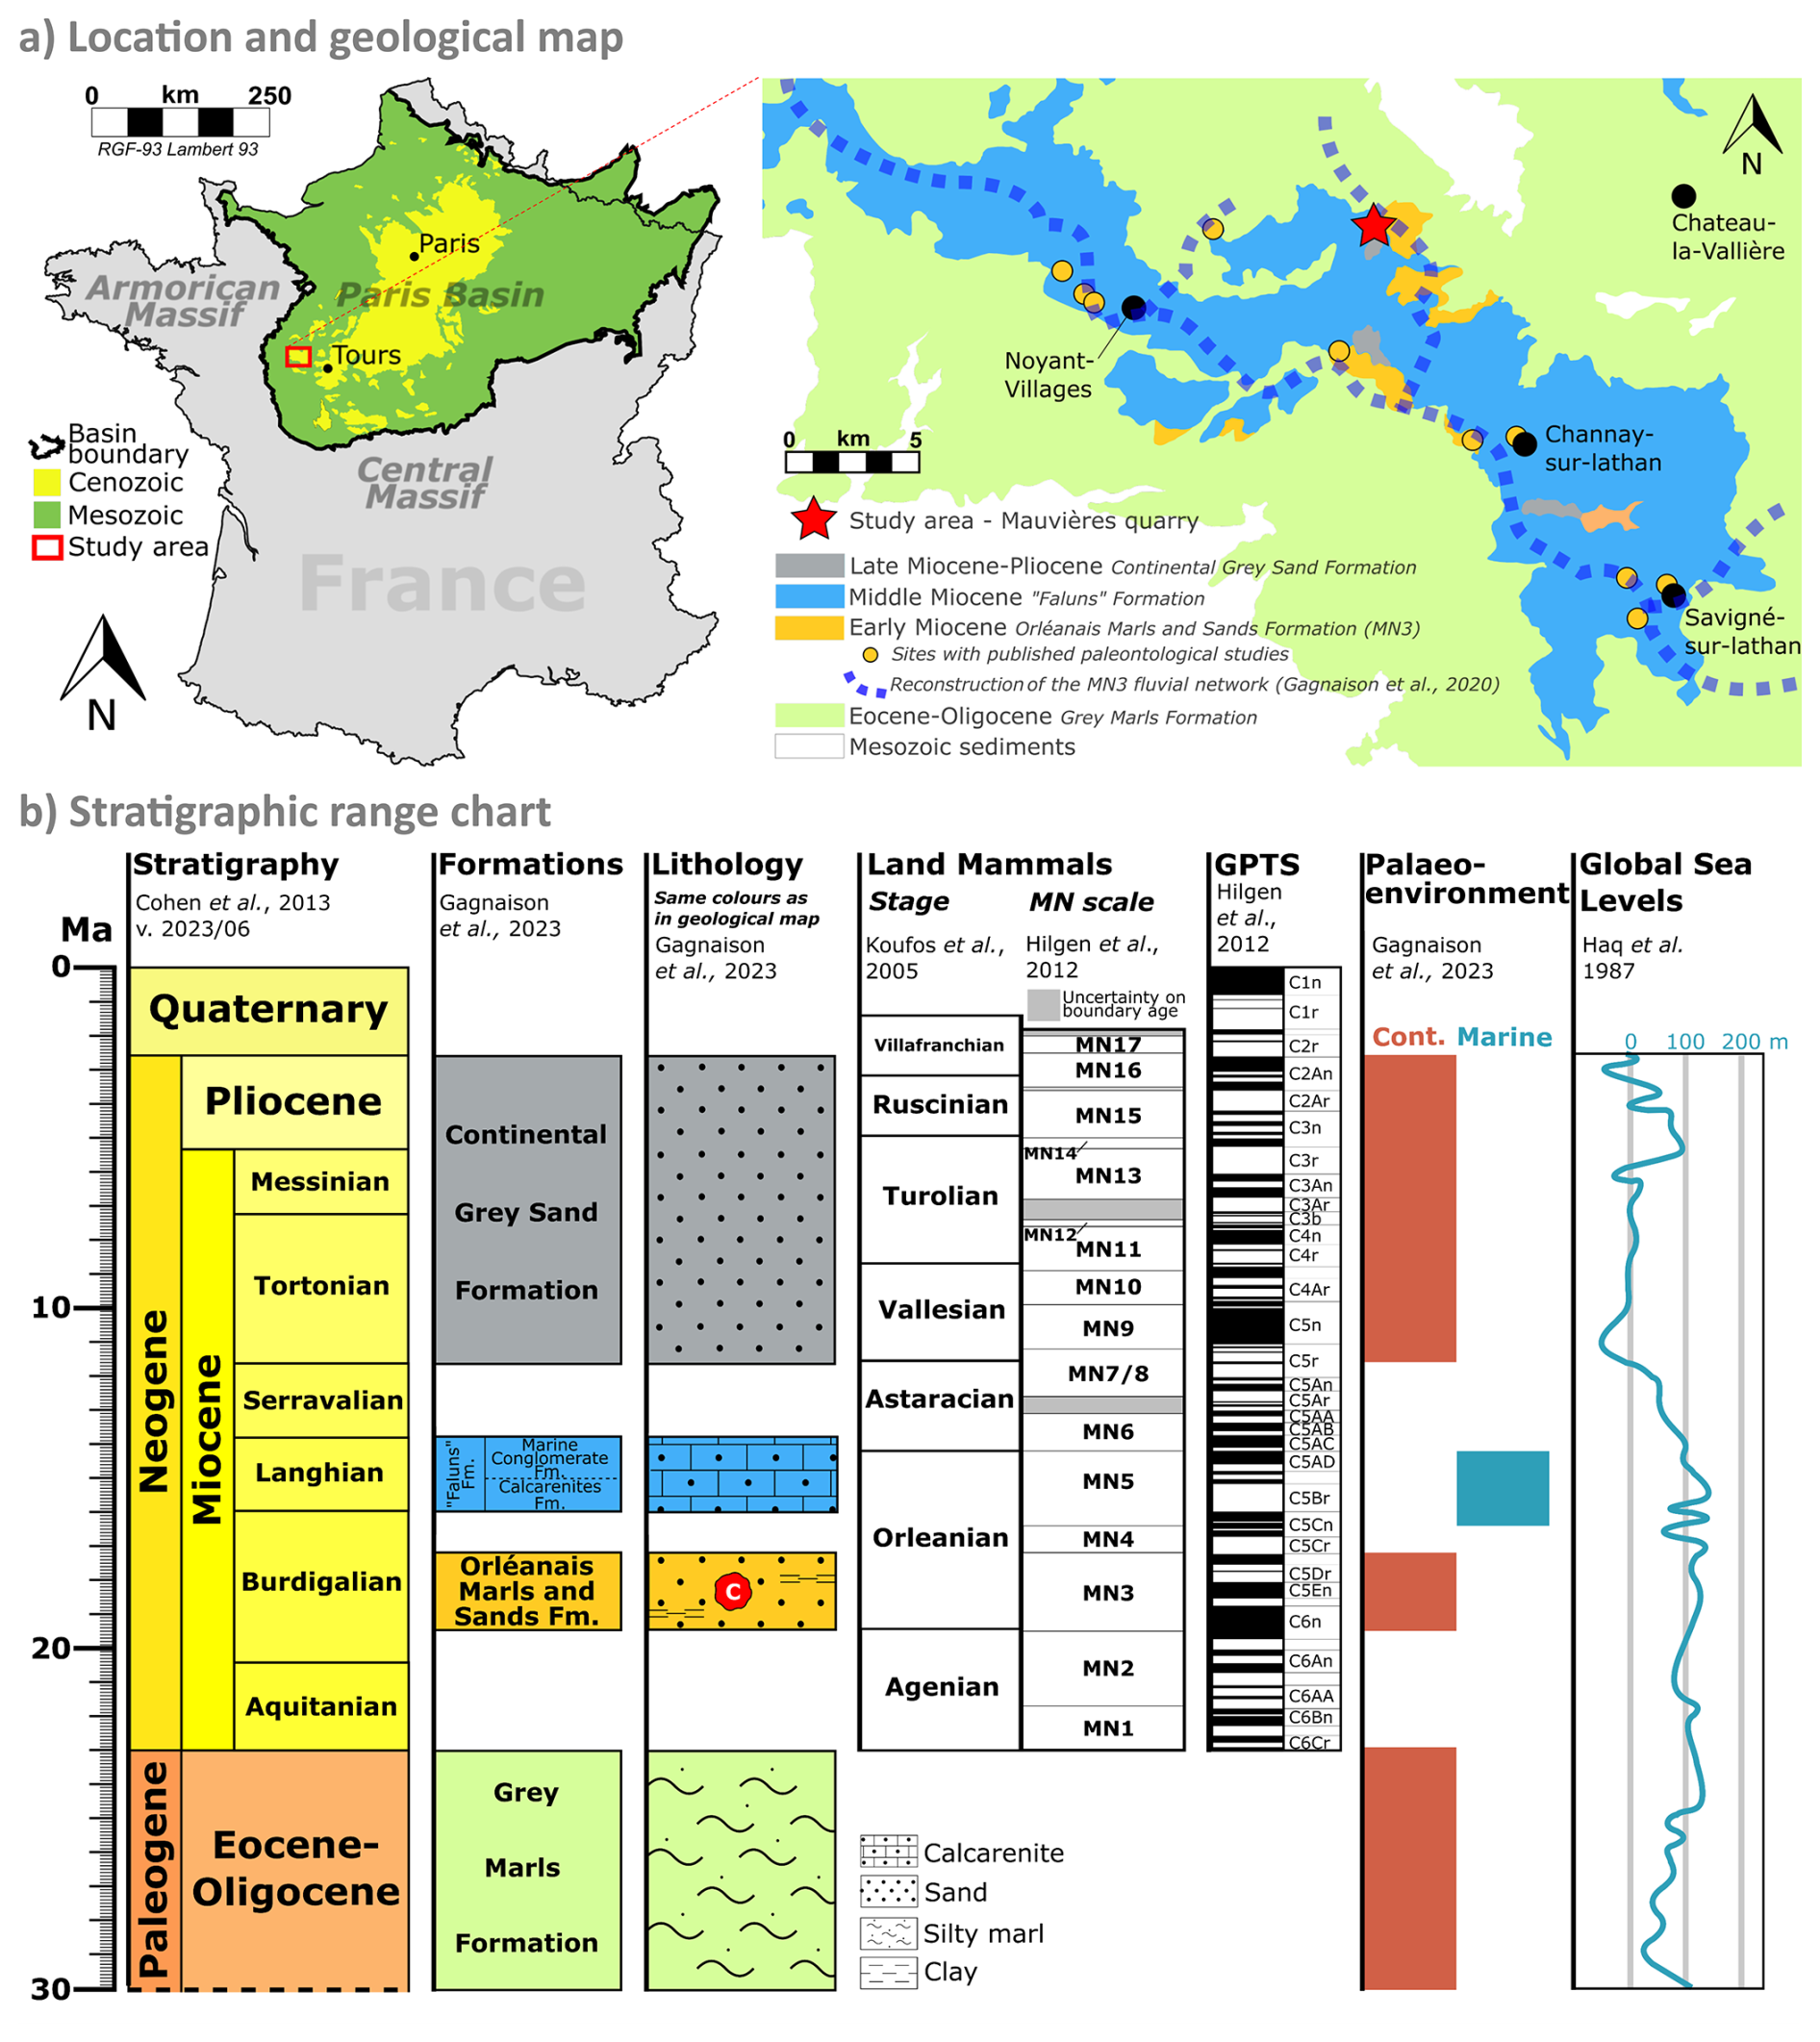
Figure 1Geological context of the Mauvières section. (a) Location of Mauvières quarry and regional geology based on the BRGM 1:50 000 unified vector geological map of France (InfoTerre), modified after Gagnaison et al. (2020). (b) Stratigraphy of the Mauvières section. The nodules (red symbol with a C) come from the Orléanais Marls and Sands Formation attributed to the MN3 biozone (Gagnaison et al., 2023). V. 2023/06: the sixth International Chronostratigraphic Chart of the International Commission of Stratigraphy (Cohen et al., 2013, updated in 2023). GPTS: Geomagnetic Polarity Time Scale.
2.3 Biostratigraphic age of the continental sands and nodule-bearing s1 bed
MN biozones were defined as a tool for inter-basin faunal comparisons (Mein, 1999). Limits of the zones are defined by (1) steps in mammalian evolutionary lineages (local evolution), (2) first appearance datum and/or last appearance datum of species, (3) dispersal of taxa, and (4) faunal assemblages (Mein, 1999; Steininger, 1999). As discussed by Mein (1999), even when relatively inaccurate, the MN zones are still a useful tool for regional correlation. For example, where local mammalian biozones are developed (e.g. the Mongolian Mammalian biostratigraphy proposed by Daxner-Höck et al., 2017), the MN system can still be employed since Europe and Asia often share taxa (Wang et al., 2013). However, we should keep in mind that correlation using the MN timescale is affected by ecological limits, latitudinal disparities, general diachronism in the dispersion of taxa, the presence of immigrant taxa (Mein, 1999; Steininger, 1999) and local differences in taxa (even between neighbouring basins; Engesser and Mödden, 1997).
Regionally, both the continental and marine Miocene sediments are known for their rich fauna of vertebrate fossils, including mammal taxa (Ginsburg, 2001). At Mauvières, vertebrate remains have been found within four horizons within the Orléanais Marls and Sands Formation (Fig. 2a). The majority of fossils (>95 %) are fresh and thus interpreted as syn-sedimentary and not reworked from older beds. In total, 53 taxa have been identified, most of them present in the s1 bed, the richest of the four fossiliferous horizons. The taxa are typical of the middle of the MN3 biozone (Gagnaison et al., 2023) (Figs. 1b and 2a).
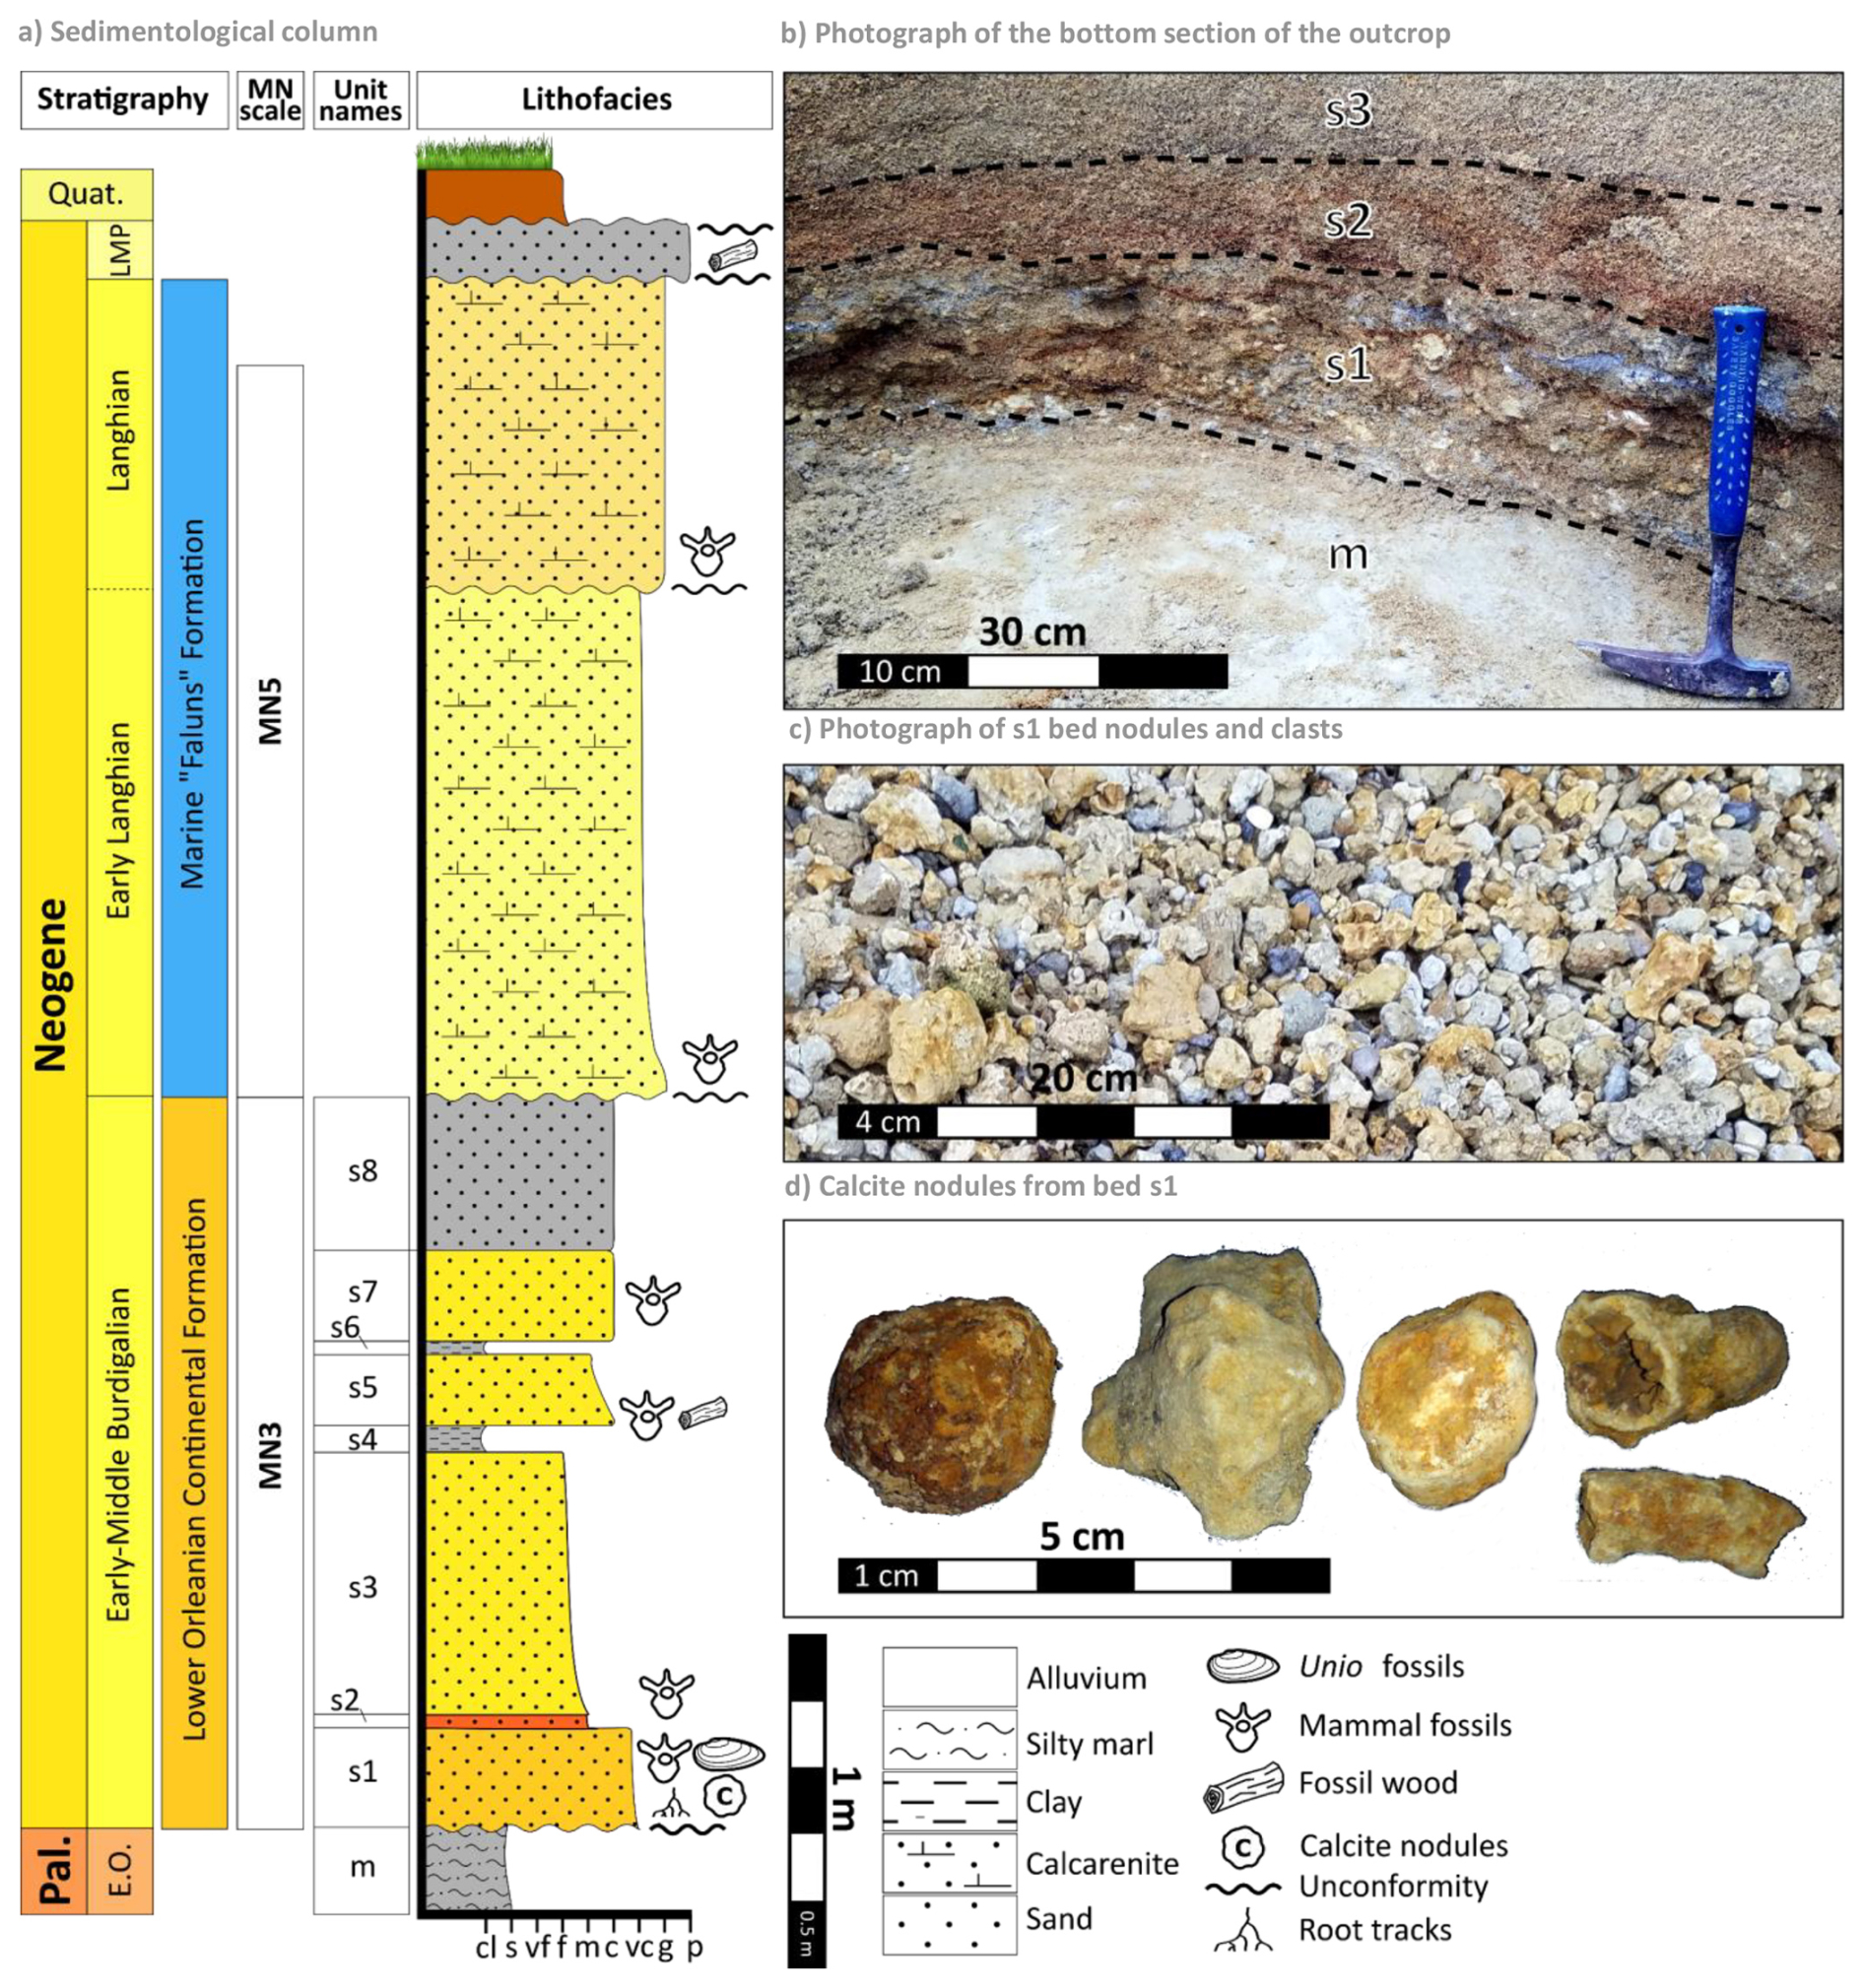
Figure 2Geology of the Mauvières section. (a) Sedimentological log and bed nomenclature (modified after Gagnaison et al., 2023). The calcite nodules are found in the early to middle Burdigalian basal sand s1. (b) Photograph of the basal section of the outcrop, showing the basal Paleocene–Eocene silty marls unconformably overlain by an orange, very coarse fluviatile sand with mammal remains, freshwater mussel shells, root tracks and pedogenic calcite nodules. (c) Granule and pebble fraction after sieving of the s1 sand. The fraction is dominated by pale-coloured calcite nodules. (d) Photographs of representative calcite nodules from the s1 bed showing both spherical and cylindrical irregularly shaped nodules of varying colour.
3.1 Samples
Between 2020 and 2022, a series of geological sampling campaigns were undertaken at the Mauvières site. The sample material was sieved, washed and dried. From the separate coarse fraction (>2 mm), numerous nodules were collected and identified as vadose calcite nodules (Gagnaison et al., 2023). The nodules are spherical to oblong, with a yellow-orange colour and a coarse aspect. Five of these nodules were selected for SEM elemental analysis and U–Pb dating (P00, P01, P02, P04 and P14) and three nodules for powder X-ray diffraction analysis (XRD). One nodule was prepared as a thin section for detailed microscopic analysis (MIOC4). For XRD analysis, each selected nodule was crushed in an agate mortar to create a fine powder. The five other nodules selected for U–Pb dating were sawn in half to reveal an internal surface. One half of each nodule was mounted in a 25 mm mould; mounted in epoxy resin; cured; and polished, with the final polishing step employing 1 µm diamond suspension polishing fluid. The epoxy resin mounts were cleaned in an ultrasonic bath of deionised water for 3 min and imaged by optical microscopy. LA-ICP-MS U–Pb dating was undertaken on sample P00 to see if high-quality age data can be obtained from the sample suite. Following LA-ICP-MS analysis of sample P00, it was repolished to remove the ablation rasters, cleaned in an ultrasonic bath of deionised water and carbon coated for SEM analysis. The other four samples were first carbon-coated for SEM analysis and later polished and then cleaned to remove the carbon before subsequent LA-ICP-MS analysis.
3.2 Optical microscopy
The resin pucks were imaged under reflected light using a Nikon Eclipse LV100 at the iCRAG Lab@TCD, Trinity College Dublin. Images were acquired at 5× magnification using a Nikon DS-Ri2 camera. Each tiled image is comprised of multiple frames stitched together by the Nikon NIS-Elements software. Each frame was taken with a square field of view of ca. 2.8 mm in width and with an overlap of 10 %. Transmitted and plane-polarised light images were also acquired for the thin section MIOC4.
3.3 XRD
The powders were analysed using a Siemens/Bruker D5000 power X-ray diffractometer (Cu Kα radiation, 0.01° step − 1 from 5 to 60 ° 2θ at 1 ° min − 1, 4.5 h per sample). Mineral identification was undertaken with DIFFRAC.EVA (Bruker) using the Powder Data File (PDF-4, The International Centre for Diffraction Data) (Gates-Rector and Blanton, 2019). XRD results and its interpretation are available in the Supplement.
3.4 SEM
The SEM analyses were carried out at the iCRAG Lab@TCD (Trinity College Dublin, Ireland) on a Tescan TIGER MIRA3 FEG-SEM equipped with a backscatter electron detector (BSE), two Oxford Instruments Ultim Max 170 mm2 SSD EDX detectors and an X4 pulse processor. Scanning electron (SE) and BSE imaging and energy-dispersive X-ray spectroscopy (EDS) analyses were acquired using an accelerating voltage of 20 kV and a working distance of 15 mm above the carbon-coated pucks. The images and maps were processed using the AZtec version 6.1 X-ray microanalysis software suite (Oxford Instruments).
3.5 Cathodoluminescence
Polished and uncovered carbon-coated thin sections for each sample were imaged using optical CL microscopy. CL images were acquired at University College Dublin (UCD) using an HC5-LM hot-cathode CL microscope from Lumic Special Microscopes, operated at 12.2 kV with a current density of 0.24 mA mm−2. No staining solution was applied prior to the imaging.
3.6 LA-Q-ICP-MS
Laser ablation quadrupole (Q) ICP-MS U–Pb dating was performed at the iCRAG Lab@TCD, Trinity College Dublin, employing an Iridia 193 nm ArF excimer LA system (Teledyne Photon Machines, Bozeman, MT, USA), coupled to an Agilent 7900 Q-ICP-MS via 1.016 mm ID PEEK tubing and a medium pulse interface. One sample (P00) was dated using a mapping approach and follows the U–Pb imaging technique described in Drost et al. (2018), while the remaining samples (P00-repeat, P01, P02, P04, P14) were analysed by static spot analysis. For the latter, signal smoothing was achieved by inserting a mixing chamber (Glass Expansion) between the medium pulse interface and torch. Details on the specific analytical protocol and operating conditions are given in the Supplement. This includes the selection criteria, regions of interest (ROI), map dimensions and time-equivalents for all selected pixels and pixel groups (“pseudo-analyses”) for the sample analysed with the mapping approach and the laser pit locations of the samples analysed by spot ablation. Additional tables are available on the Zenodo repository system (Monchal et al., 2024–2025), while additional text and figures are available in the Supplement of this paper.
Samples were first screened for suitability using line scans. Samples and sample area yielding high initial Pb concentrations and low μ throughout were omitted from further analysis. Similarly, samples areas with U ≤ 10 ppb were ignored as the young sample age would result in very low concentrations of radiogenic Pb. Final locations for U–Pb analysis were selected according to the results of the test line scans in combination with mineralogical and textural observations from optical microscopy and from chemical information obtained by SEM–EDS mapping. In each dated nodule, we targeted calcite zones with minimal incorporation of other phases. For the mapping experiment, this resulted in multiple groups of raster lines spread out across the nodule surface. Final ROIs for data extraction were chosen to represent zones that may be interpreted as cogenetic and thus a single age population constraining cementation. However, samples P01, P02, P04 and P14 did not feature large enough coherent calcite areas with ratios favourable for efficient and reproducible use of the mapping protocol. Spot analysis was subsequently performed on those samples, using the chemical information from the SEM and LA-ICP-MS maps to help site the spot analyses. Additionally, the U–Pb mapping data from sample P00 were also augmented by a static spot ablation experiment.
The mapping session employed a laser spot size of 80 µm square, a repetition rate of 50 Hz and a fluence of 2.5 J cm−2 while moving the sample along successive linear rasters with 30 µm s−1 under the static laser beam. Samples were bracketed by NIST SRM 614 glass as the primary standard, WC-1 calcite for the matrix matching of the ratio (Roberts et al., 2017) and Duff Brown Tank limestone as quality control material (Hill et al., 2016). The total analysis time for sample P00 was ca. 34 min. Spot analysis employed 85 µm diameter spots, a repetition rate of 12 Hz, 480 shots (40 s) and a fluence of 2.2 J cm−2. Again, NIST SRM 614 was used as the primary standard, but Duff Brown Tank limestone was used for the matrix matching of the ratio as it is closer in U concentration and age to the samples than WC-1. Gas settings (optimised daily), analyte menus and integration times for all analytical sessions are reported in the Supplement along with the data processing protocols used.
Uncertainties on dates in the text and figures are quoted at the 2σ or 95 % confidence level, respectively. The geochronological results are presented with two uncertainties; the first is an estimate of the session uncertainties, while the second is propagated with full systematic uncertainties (e.g. the uncertainty on the reference age of WC-1 (maps) or DBT (spots) respectively, the decay constant uncertainties, and the 2 % long-term reproducibility of secondary age reference materials in the laboratory; see the Supplement).
4.1 Petrographic observations
The samples are composed of transparent, mostly rounded quartz grains with some more angular crystals, set in a pale orange-yellow cement with vein-like cavities, partially filled with calcite crystals (Fig. 3). The majority of the samples exhibit a main cavity that in some cases branches out via micro-cracks, typical of alpha-type paleosoil (Wright, 1990). We can distinguish two stages of formation. The first stage involves the formation of sedimentary concretions around roots. The concretions are rich in quartz and cemented by clear carbonate, as observed under the optical transmitted light microscope (Fig. 3). After decomposition of the roots, sparry calcite crystals precipitated predominantly into free space producing a brown layer on the edge of the cavity and filling the micro-cracks. The host rock is composed of touching or floating terrigenous clastic elements such as quartz in a clotted carbonated matrix with authigenic goethite. The host rock is also cross-cut by rhizolith root tubules, traces of which are still visible (Fig. 3a). These relics of paleo-roots are expressed by the stack of several layers of dark microbial micrite linings (Fig. 3a) and some holocrystalline microsparite. The presence of holocrystals is dependent on the degree of microbial activity and the root structure (i.e. main axis vs lateral roots). These early pedogenic carbonate crystals (e.g. the calcite crystals in Fig. 3b–c) are classically found in many paleosols (e.g. Wright, 1987; Esteban and Klappa, 1983; Bain and Foos, 1993; Alonso-Zarza, 2003).
Sample MIOC4 is a representative nodule from the s1 bed that exhibits evidence of primarily calcified root traces (Fig. 3; see also Gagnaison et al., 2023). No evidence of later crystallisation nor recrystallisation was detected, with the calcite spar homogeneous and unzoned (Fig. 3b–c). Moreover, micro-cracks and alveolar structures are commonly found without calcite crystallisation (Fig. 3a), especially where the primary root was located. When calcite crystals are present, they are typically associated with lateral roots.
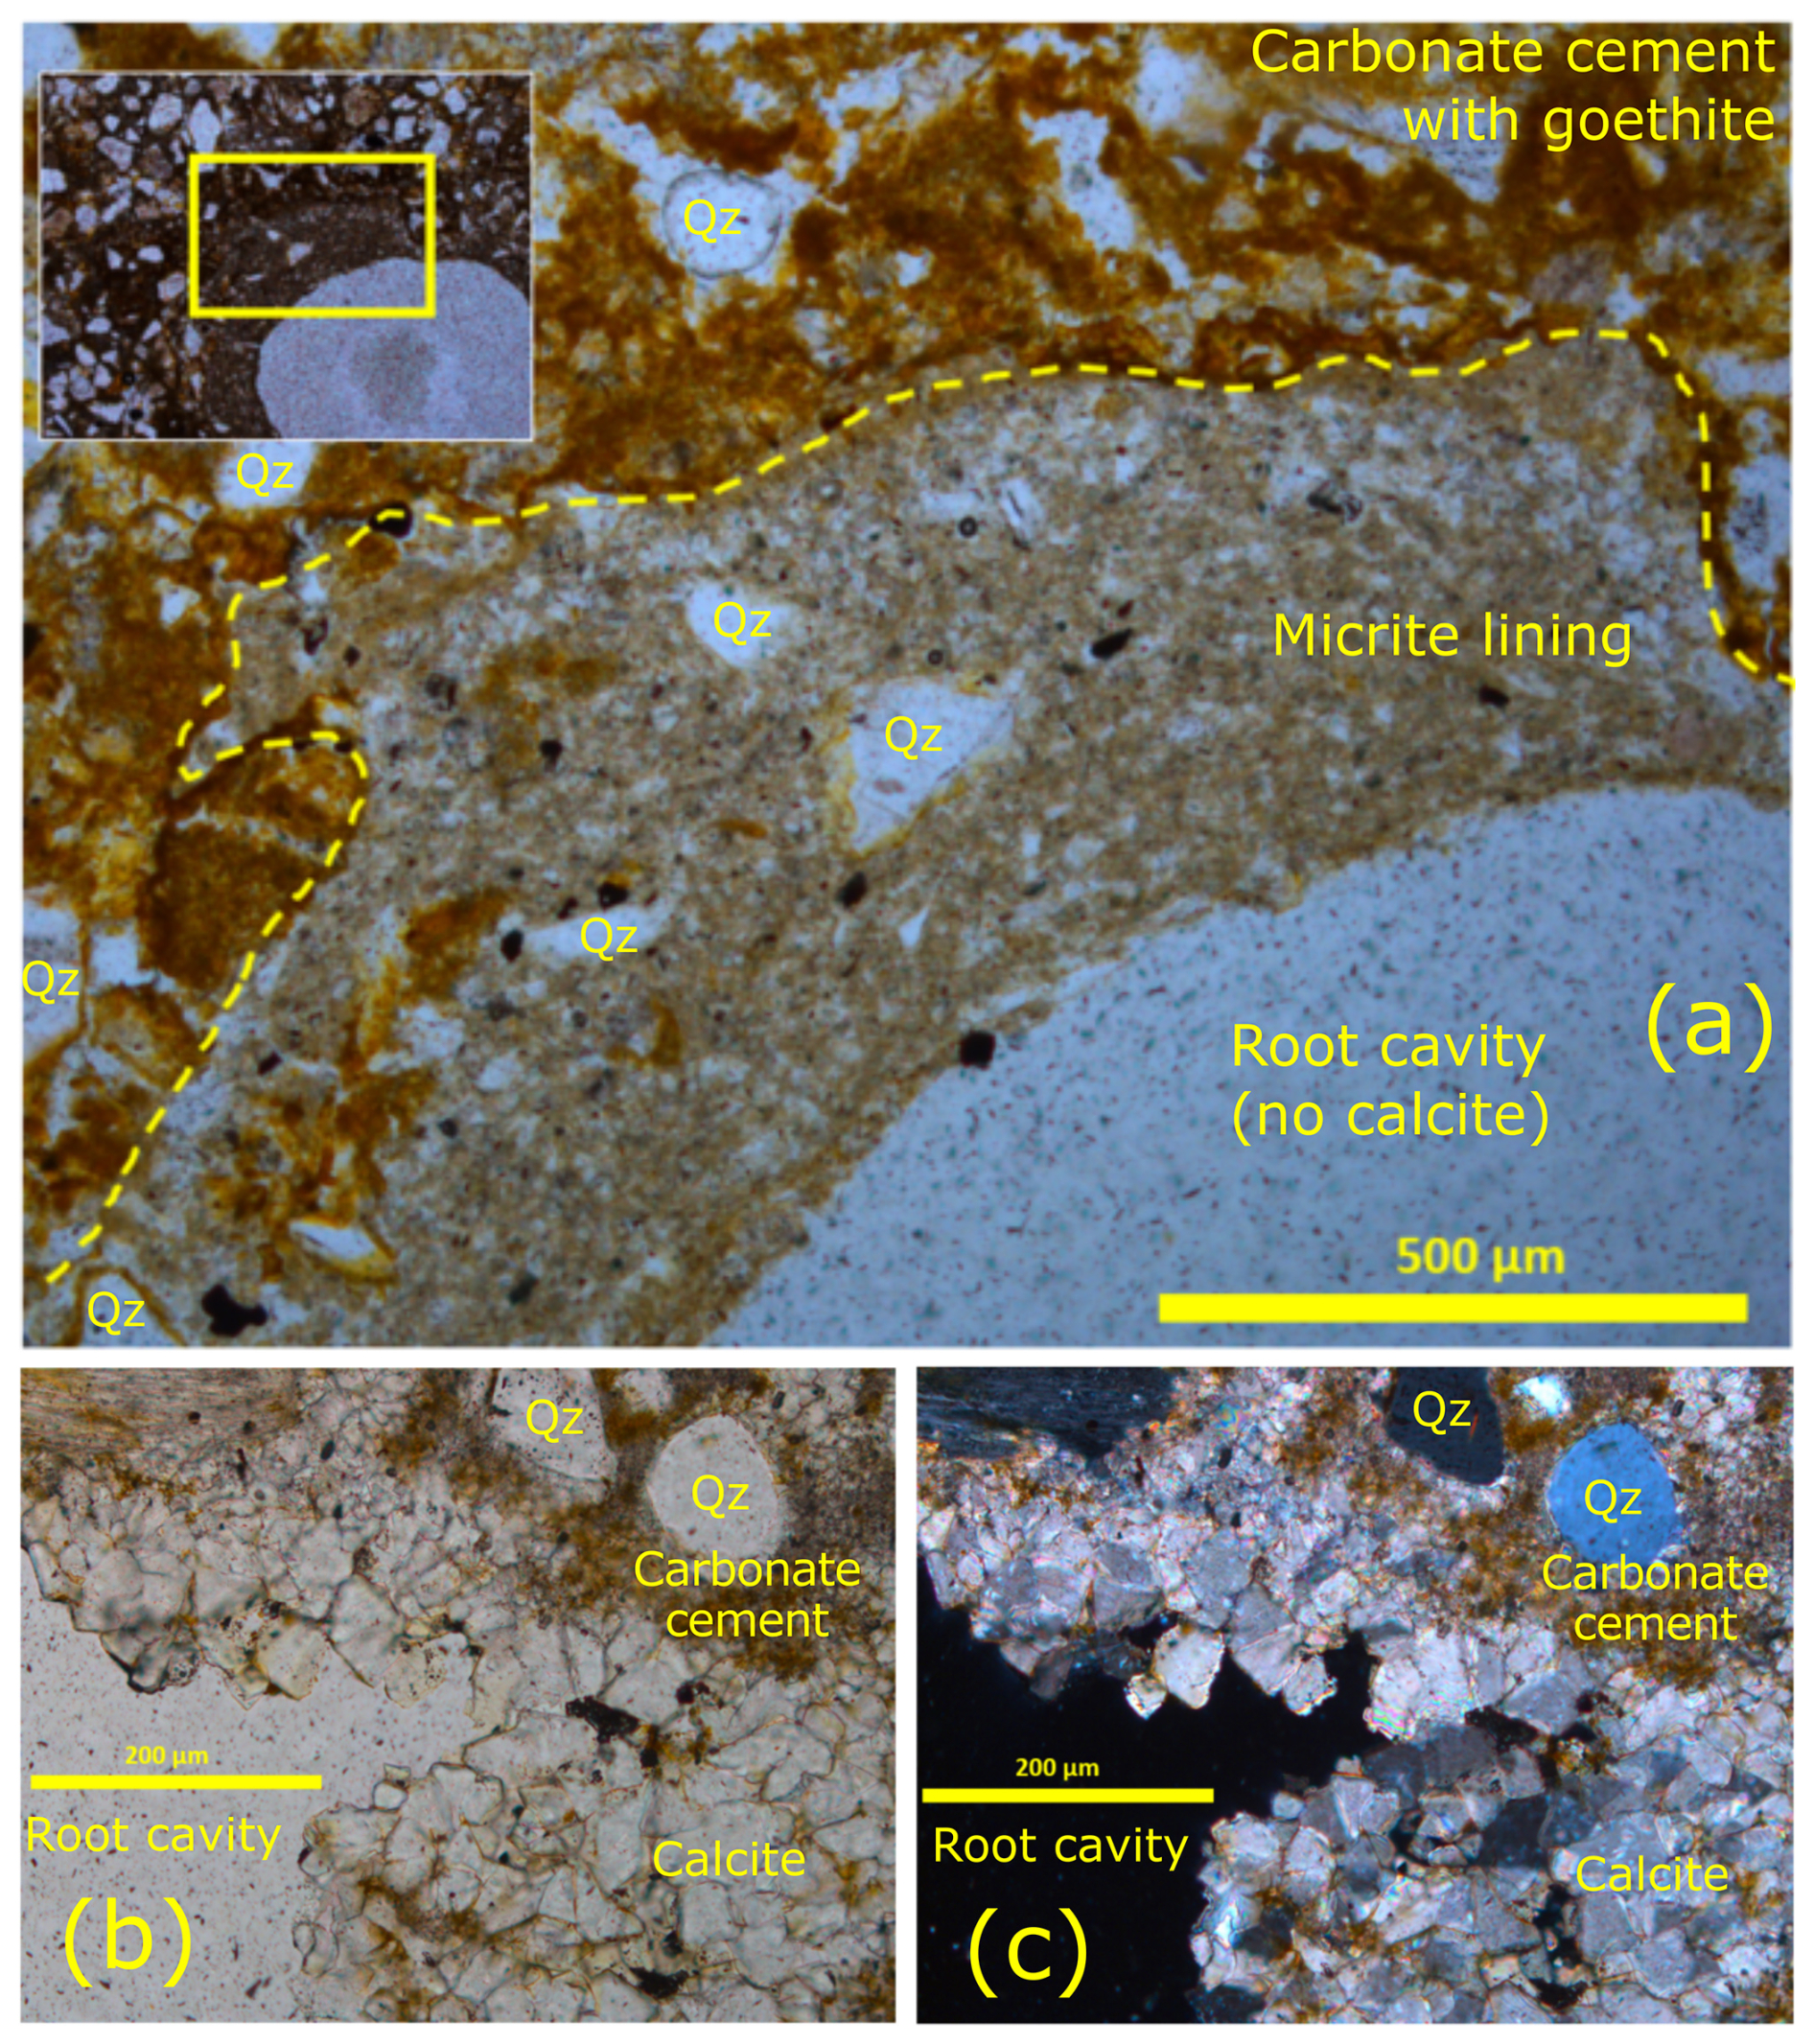
Figure 3Optical microscope photography of sample MIOC4. (a) Primary root structure with a dark microbial micrite lining – dashed yellow line highlights the boundary of the external part of the microbial micrite lining. An alveolar structure can be seen in the zoomed-out inset at the top of the microphotograph (PPL). (b) Sparry calcite crystals; a lateral root perforation is on the lower left side of the microphotograph (PPL) and (c) (XPL). Q – quartz.
4.2 SEM–EDS elemental mapping
The SEM–EDS maps of the five dated nodules reveal that the nodules are composed of poorly sorted angular Si-rich minerals cemented by a Ca-rich phase (Fig. 4). The two phases are interpreted respectively as quartz and calcite based on optical microscopy and the XRD results. The cemented sand also contains grains rich in Si and K and Na interpreted as feldspar, in agreement with the results of XRD. Large cavities, mostly branching or rounded, are present in all the nodules. These cavities are lined by a pure Ca-rich phase interpreted as calcite that precipitated into the free cavity space. In some locations, quartz-free calcite crystals have filled the cavities entirely. These zones of pure calcite were subsequently targeted for LA-ICP-MS U–Pb dating.
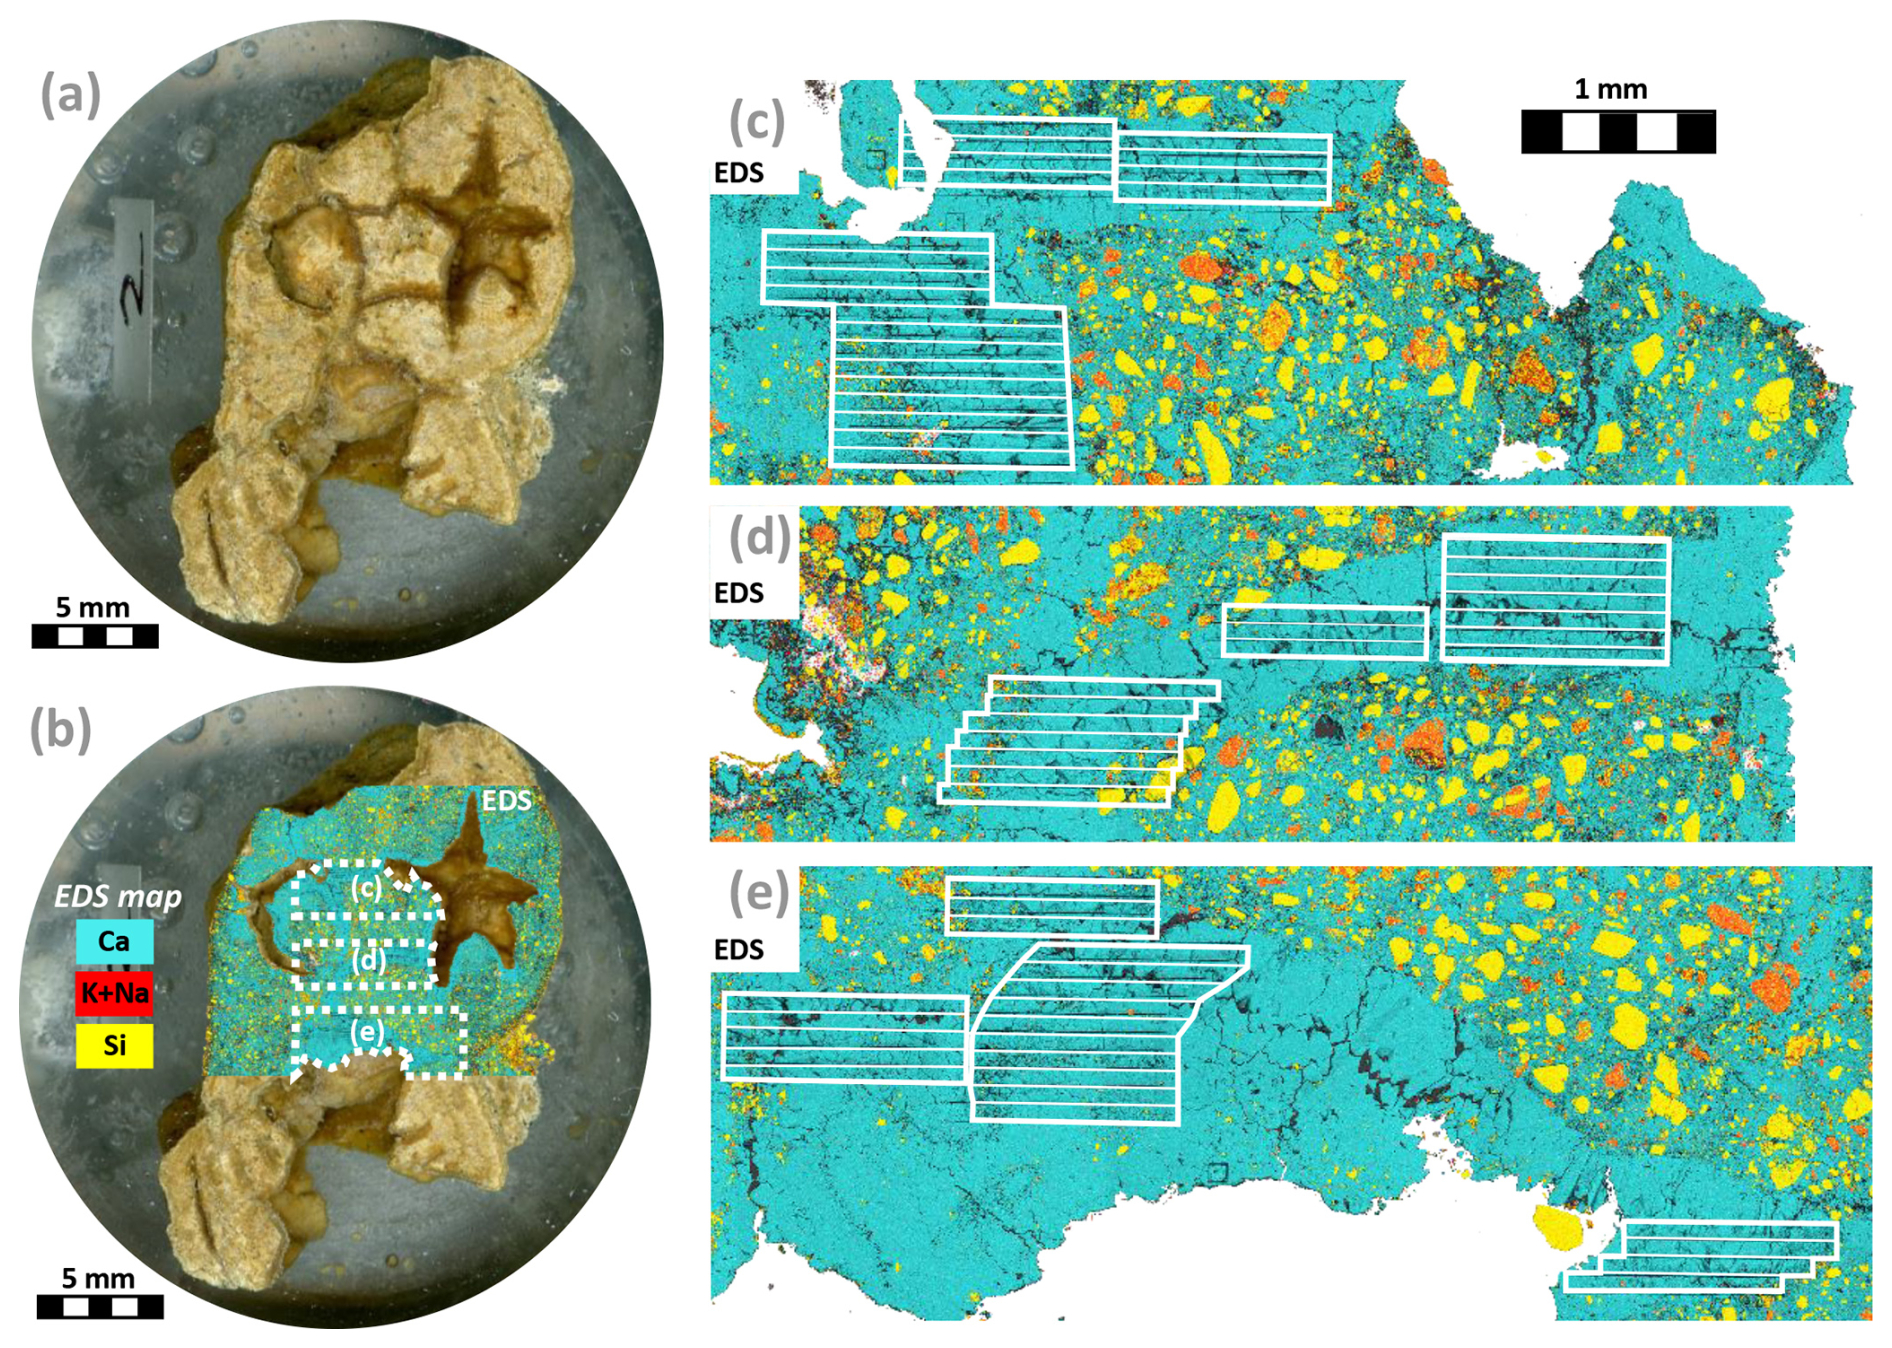
Figure 4Photographic montage of nodule P00 in a polished resin puck. (a) Optical microscopy image. (b) The same image overlain by a partial EDS map of the nodule showing Ca (a proxy for calcite, blue), Si (a proxy for quartz, yellow) and K + Na (a proxy for feldspar, red). The locations of the EDS maps in (c), (d) and (e) are represented by the dashed white polygons. (c–e) EDS maps showing the LA-ICP-MS ablation zones and line scans for the P00 nodule. Pure calcite veins were targeted, avoiding the zones of calcite-cemented quartz-rich sand. See Supplement for pictures and EDS map of the other samples (Fig. S1 in the Supplement).
4.3 Cathodoluminescence imaging
The calcite-cemented sands in the concretions show a complex pattern of dull brown and orange to bright yellow luminescent calcite cementing quartz and minor feldspars which are highly (and variably) luminescent. Sparry calcite crystals infilling cavities and fractures show strong oscillatory CL zoning at the <10 µm scale (Fig. 5). The calcite growth in the fractures oscillates between non-luminescent, dull brown to orange luminescence, and bright yellow and orange luminescence. Growth morphologies from CL are euhedral to occasionally subhedral blocky, with no recrystallisation of the oscillatory zoning observed.
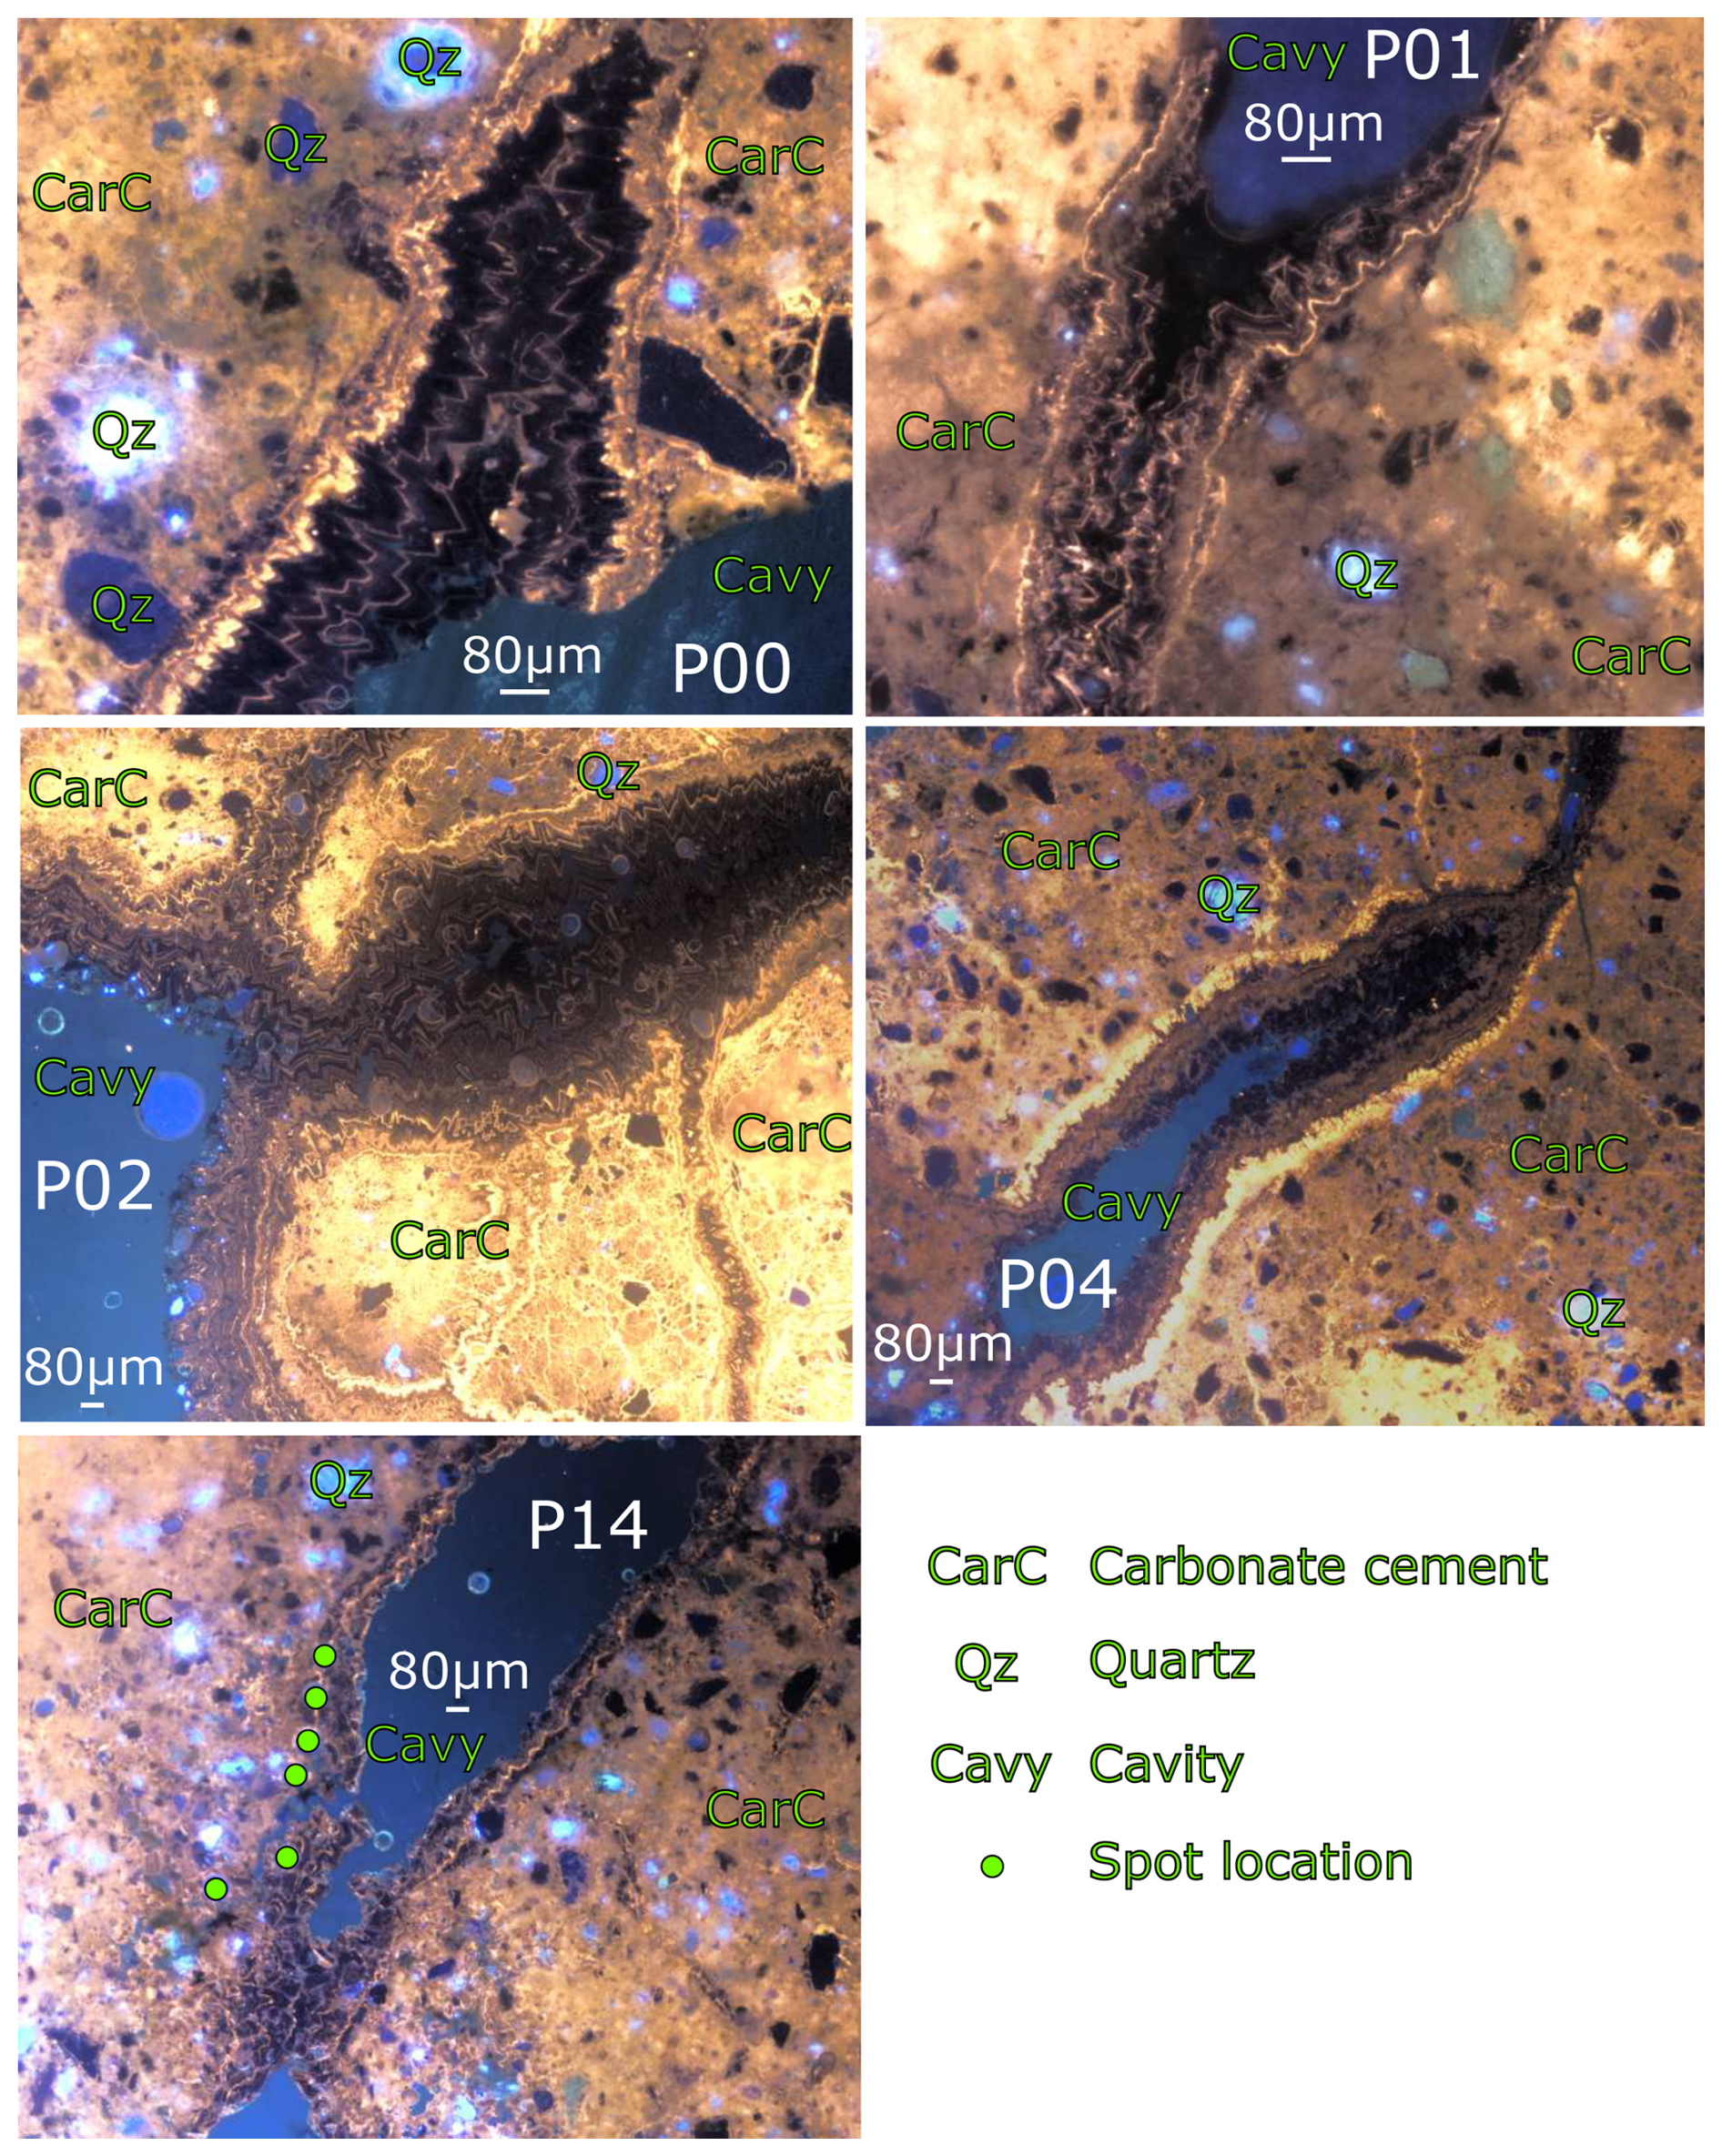
Figure 5Cathodoluminescence images from the samples at 5× (P02/P04/P14) or 10× (P00/P01) magnification illustrating the oscillation between non-luminescent dull brown and orange luminescent zonation in the calcite crystals. Spot locations are shown on the P14 photo, showing that the outer margins of the calcite zones were ablated.
4.4 LA-ICP-MS U–Pb dating
Calcite crystals that have precipitated freely inside the cavities were targeted for geochronology analysis (Fig. 6) as they are assumed to have precipitated rapidly after the formation of the paleosol (see Sect. 2.2 and Rasbury et al., 1997). The mapped areas in P00 targeted zones of pure calcite based on the SEM–EDS mapping. A Ca filter (e.g. retaining pixels with Ca >350 000 ppm) was applied on the P00 map to exclude any inclusions, cracks, epoxy resin or the host sedimentary rock, and this filter removed ca. 7 % of the pixels from the maps. The average U content is ∼ 10 µg g−1 (ranging from 9 to 13 µg g−1), while the average Th content is ∼ 0.7 µg g−1 (ranging from <0.1 to 2.5 µg g−1; see Supplement Table S1) resulting in Th/U ratios of <0.01 to <0.2. Significant initial Pb concentrations (∼ 0.44 to 33 µg g−1) and the long half-life of Th in combination with the young age of the samples render the radiogenic ingrowth of 208Pb negligible ( ∼ 2800 to 12 000). Therefore, we used the empirical cumulative distribution function of the channel for pooling of the filtered pixel data into pseudo-analyses. The channel is a good estimate of the μ ratio between parent U (238U) and initial Pb (204Pb) as the total 208Pb concentration is a robust proxy for the initial Pbcommon component.
The spot U–Pb data were corrected post-analysis for any ablation that went through the calcite. This correction employs the visual inspection of peaks for a significant change in Ca, Pb, Th or U composition that indicate a change in the phase ablated. The U–Pb spot analyses on samples P01, P02, P04 and P14 yielded dates of 18.8 ± 2.7/2.7, 19.11 ± 0.84/0.94, 19.0 ± 2.3/2.3 and 19.4 ± 2.7/2.7 Ma, respectively, while sample P00 yielded dates of 19.3 ± 1.3/1.4 Ma (mapping) and 19.7 ± 1.5/1.6 Ma (spots) (Fig. 7). A radial plot and weighted average age were calculated using the five dates from spot analysis and their respective internal uncertainties (session estimates), featuring a mean square weighted deviation (MSWD) and chi-square (p[χ2]) test, representing how good the results are fitting to the statistic value. The full systematic uncertainties (Sect. 3.6) were propagated onto the resultant age (radial plot or weighed average) calculation. The radial plot in Fig. 8 shows a single age group at 19.22 ± 0.66/0.79 Ma (p[χ2] = 0.96), and a weighted average age was calculated at 19.21 ± 0.64/0.77 Ma (MSWD = 0.16; p[χ2] = 0.96; see Fig. 8). All U–Pb spot data were also plotted in the same Tera–Wasserburg space with their individual propagated uncertainties providing a result of 19.1 ± 0.56/0.71 Ma. The radial plot single group age of 19.22 ± 0.66/0.79 Ma is the preferred age adopted in this study as discussed in Sect. 5.2.
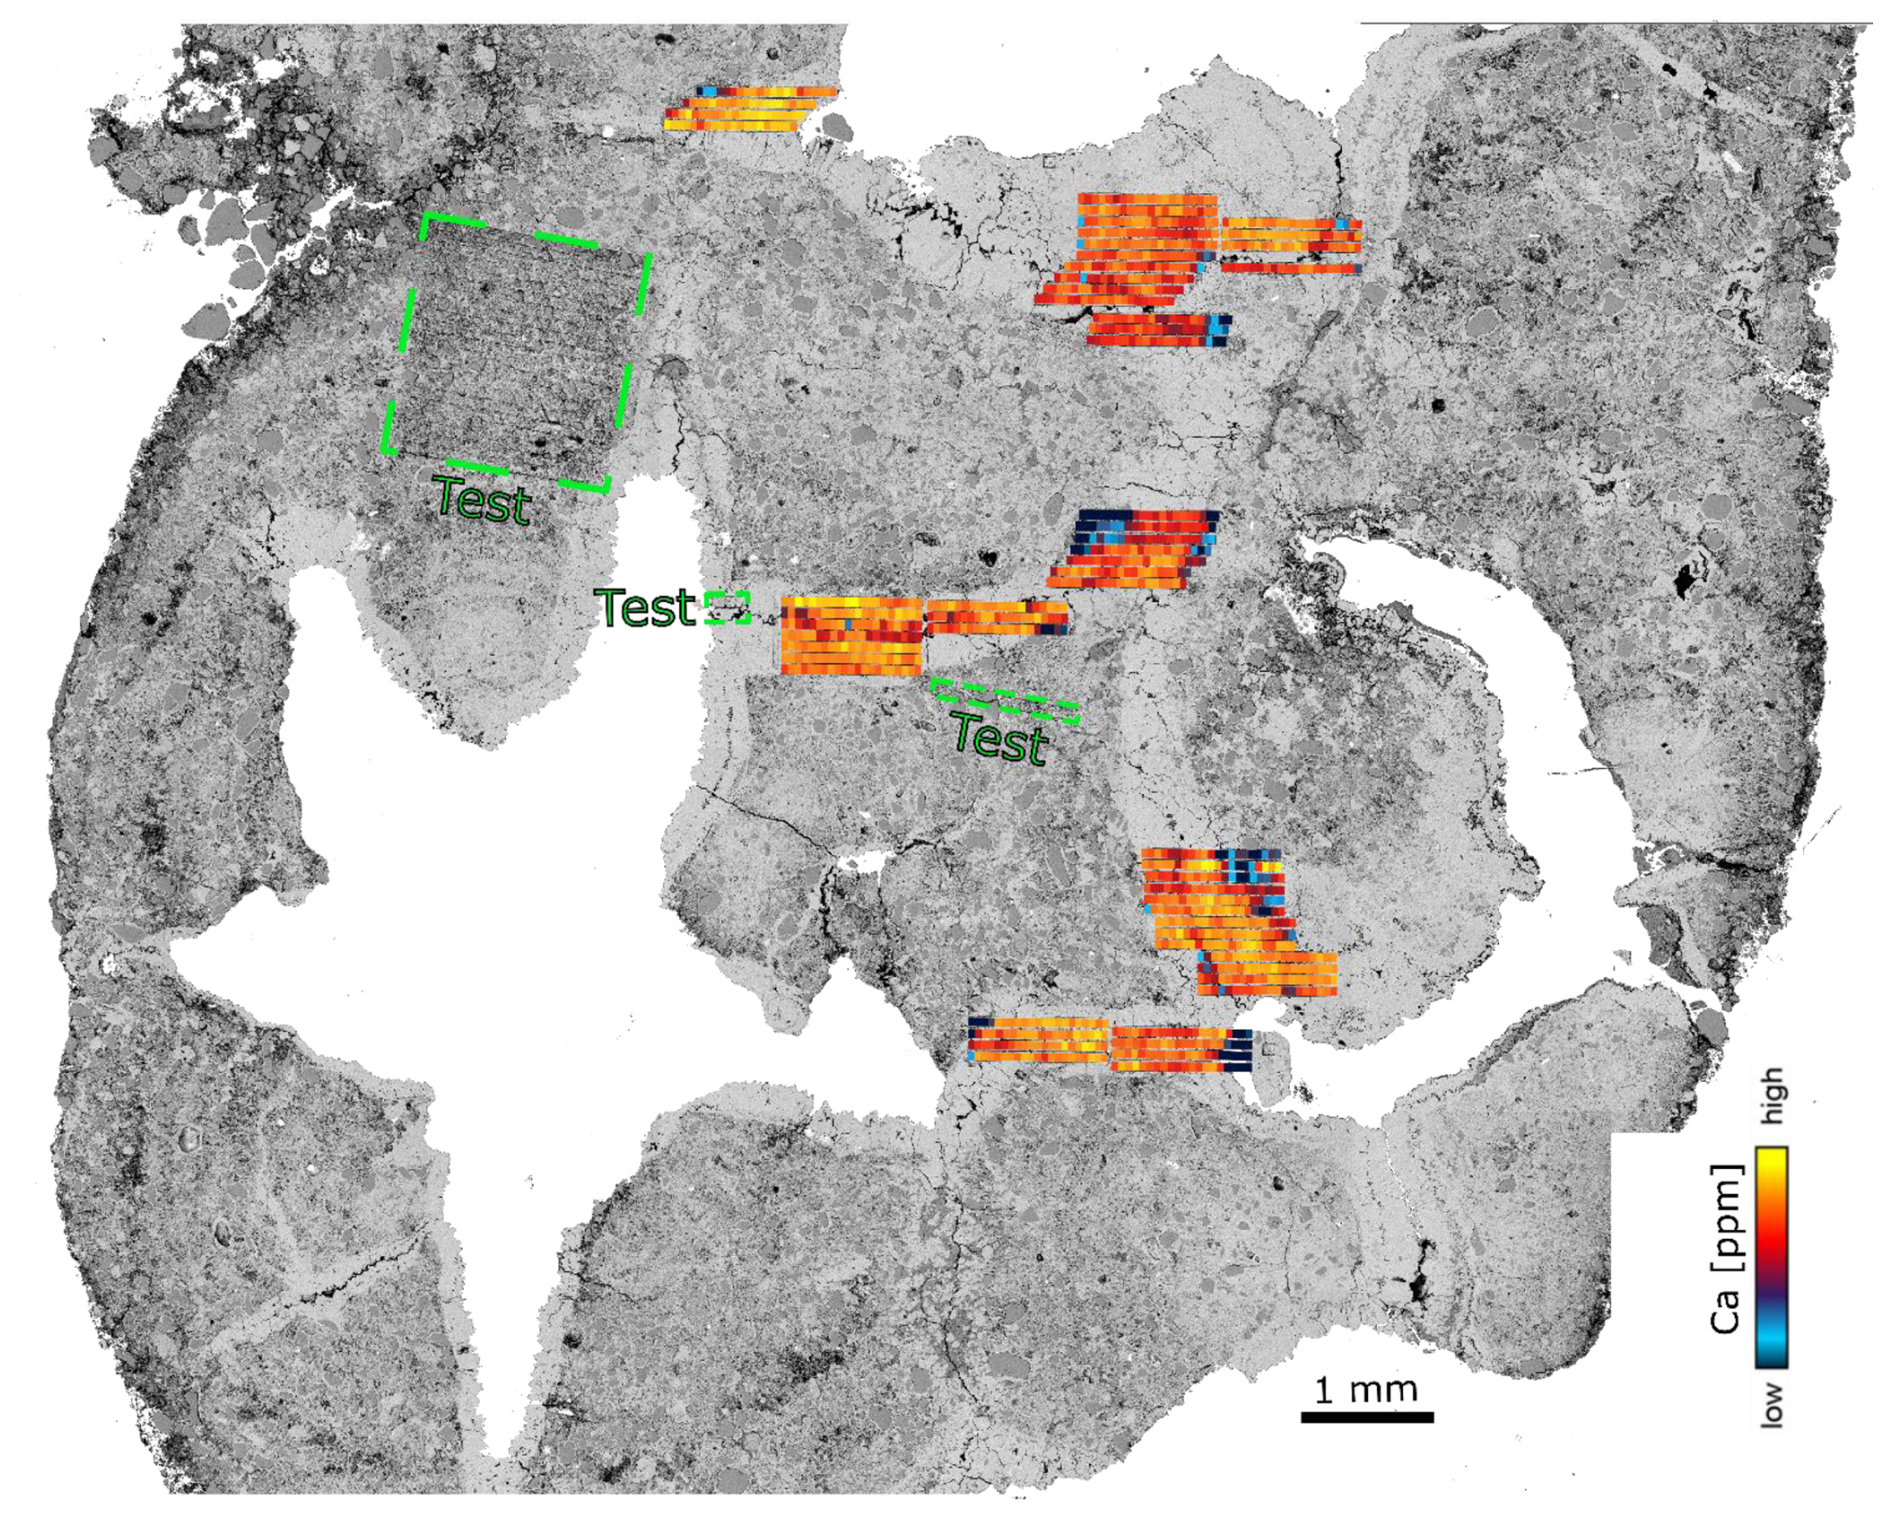
Figure 6BSE image of P00 overlain by the LA-ICP-MS line rasters used to extract the age. This figure shows that the pristine calcite was targeted by our analysis.
5.1 Accuracy and precision of the U–Pb ages
The imaging techniques (optical microscopy, SEM–EDS and LA-ICP-MS mapping) have differentiated zones of pristine calcite and the pervasive cementation of the nodules. Optical microscopy evidence favours the hypothesis of preservation of pristine calcite in our samples (see Results Sect. 4.1). In addition, prior to their extraction from the s1 bed, all the pedogenic nodules (along with clasts and fossil material) were coated with an impermeable clay layer, which likely hindered subsequent passage of fluid into the nodules. The clay coating is interpreted as syn-sedimentary (see Fig. 2b–d and Gagnaison et al., 2023). This sealed system is another argument in favour for the preservation of pristine calcite (Perry and Taylor, 2006) in the nodule interiors (See Figs. 4 and 5). The nodule morphology is preserved (not rolled or broken) and does not feature any sign of compaction nor internal collapse which supports the hypothesis of non-reworked nodules. Tubular nodules have also been found perpendicular to the stratigraphy, thus clearly marking the former position of the root. The Eocene–Oligocene marls (m on Fig. 2) below the s1 bed do not contain nodules, further supporting the hypothesis that the nodules found in the s1 bed are in situ.
The growth morphologies from optical and CL microscopy indicate gradual growth competition took place, indicative of a crystallisation in a cavity that remained open (e.g. Wendler et al., 2016; Prajapati et al., 2018). The oscillatory zoning with multiple bright concentric subzones observed under CL (Fe is the main CL quencher and Mn the main activator) can be explained by small yet rapid variations in Eh/pH conditions accompanied by changes in oxidation state (e.g. Pagel et al., 2000). With increasing oxidation, Fe2+ and Mn2+ sensitised by Pb2+ and/or Ce3+ (Pagel et al., 2000) are replaced by Fe3+ and Mn3+ or Mn4+ ions (e.g. Richter et al., 2003; Boggs and Krinsley, 2006). A log–log plot (Fe–Mn) (in ppm) can predict if calcite will be bright, dull or non-luminescent in CL (Machel and Burton, 1991; Boggs and Krinsley, 2006) (see Supplement). The specific CL patterns are consistent with redox fluctuations caused by water table fluctuations in a vadose or in a fluid-saturated environment (Mason, 1987; Barnaby and Rimstidt, 1989), which is also in agreement with the previous paleo-environment reconstitutions for the s1 bed (Gagnaison et al., 2023). Given the above observations and since the oscillatory zoning is continuous, we interpret a single continuous event of calcite formation to have occurred inside the nodules. The differing thickness of the CL bands appears related to the size of each cavity in the nodules, with P00/P01/P02 having the largest cavities and bands compared to nodules P04 and P14 with the thinner bands.
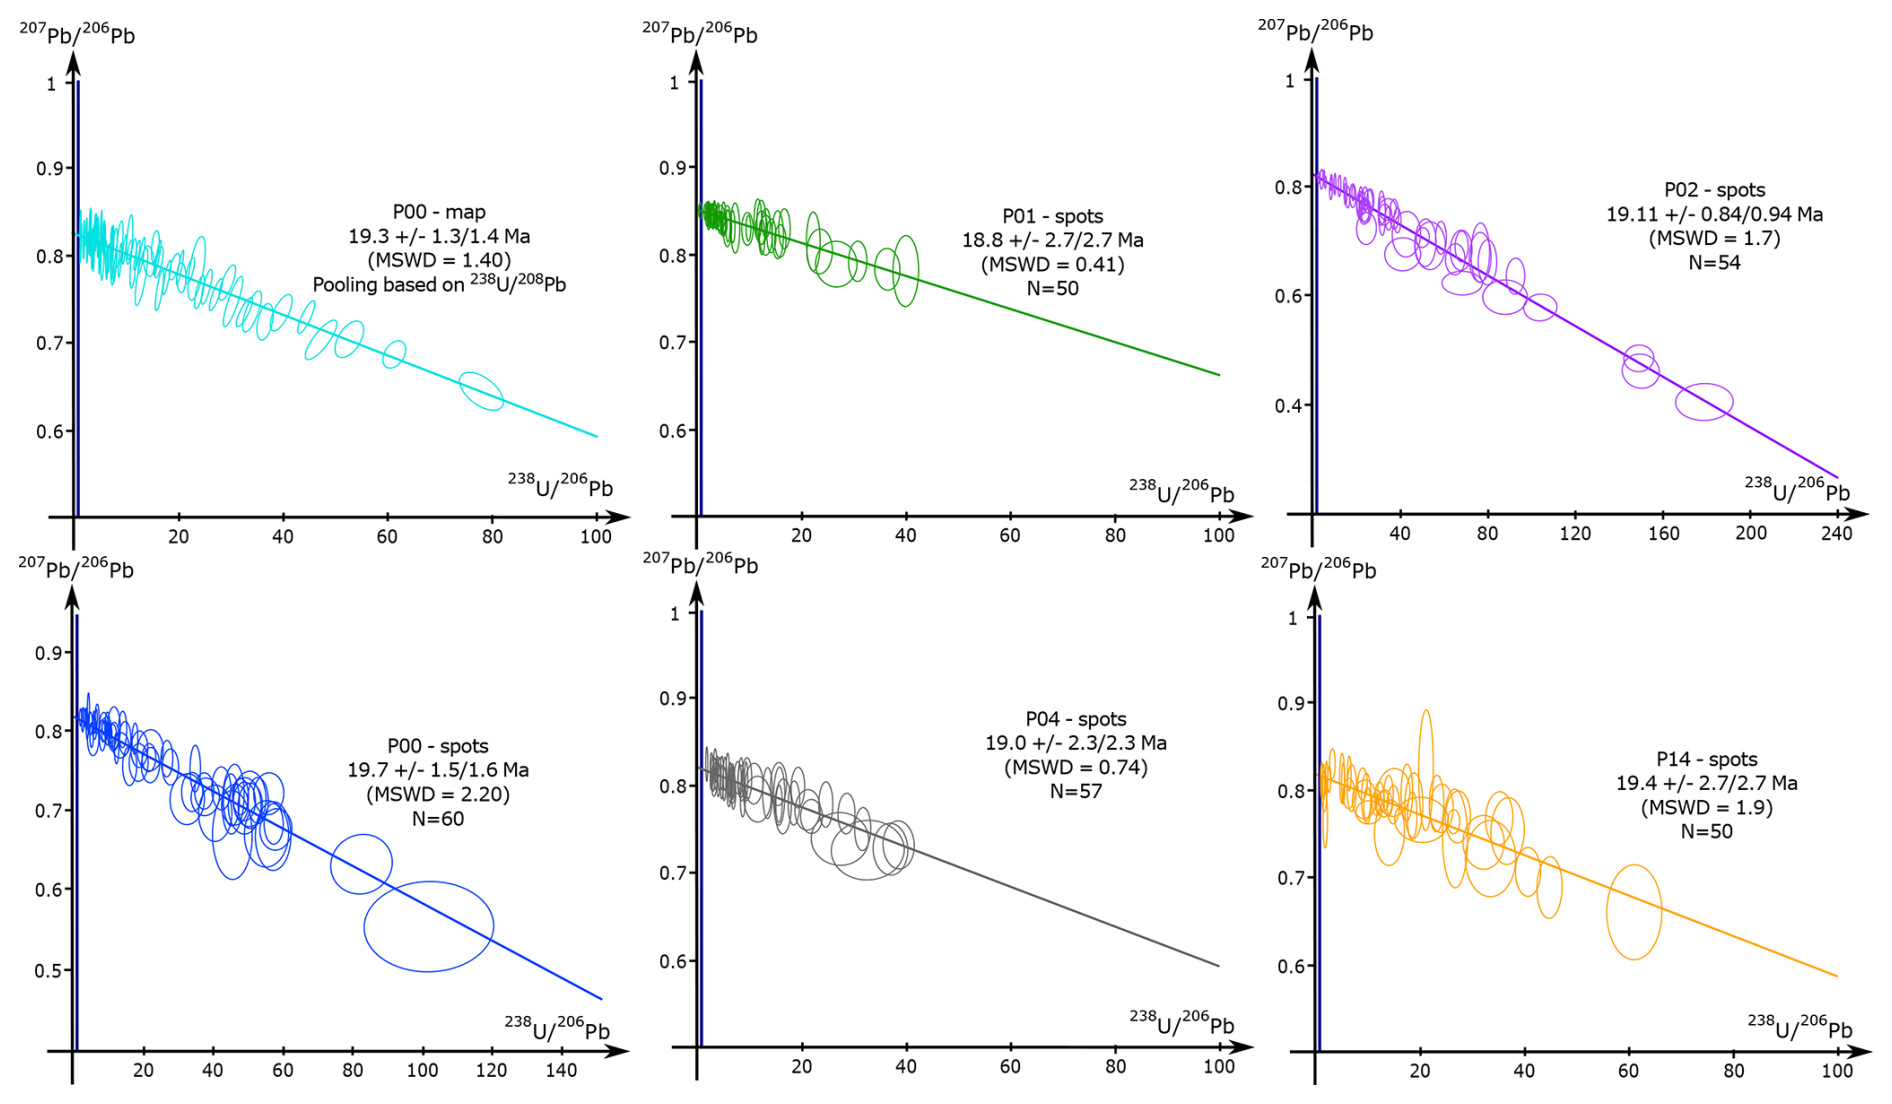
Figure 7Tera–Wasserburg concordia diagrams and lower intercept ages of all samples. For the map analysis of P00, the pooling was based on the ECDF (empirical cumulative distribution function) using as the pooling channel. For the spot analysis, the number of spots is indicated by N.
The LA-ICP-MS mapping technique adopted herein is recognised for its potential (see Rasbury et al., 2023) in dating pedogenic nodules by allowing the selection of only pristine calcite in the extraction and processing of the U–Pb data. However, only one sample had large enough coherent zones of pristine calcite with ratios suitable for U–Pb dating, and a spot analysis strategy was used to date the remaining four samples. All six results yield ages with a precision of 5 % to 14 %, which is considered precise for LA-ICP-MS calcite U–Pb dating of such young samples (Roberts et al., 2020). The accuracy of our data set can be assessed by the fact that the five samples provide the same age and initial within uncertainties, along with the radial plot confirming that there is only one age group (Fig. 8). The accuracy of the mapping experiment is also demonstrated by the similar dates (within uncertainties) yielded using three different isochron approaches. The mapping approach data for sample P00 (using as the pooling channel) yield 19.3 ± 1.3/1.4 Ma for the TW intercept age, 19.6 ± 1.7/1.8 Ma for the isochron (e.g. Getty et al., 2001) and an 86TW age (Parrish et al., 2018) of 19.4 ± 1.6/1.7 Ma (Sect. 3.4 and Supplement Table S1).
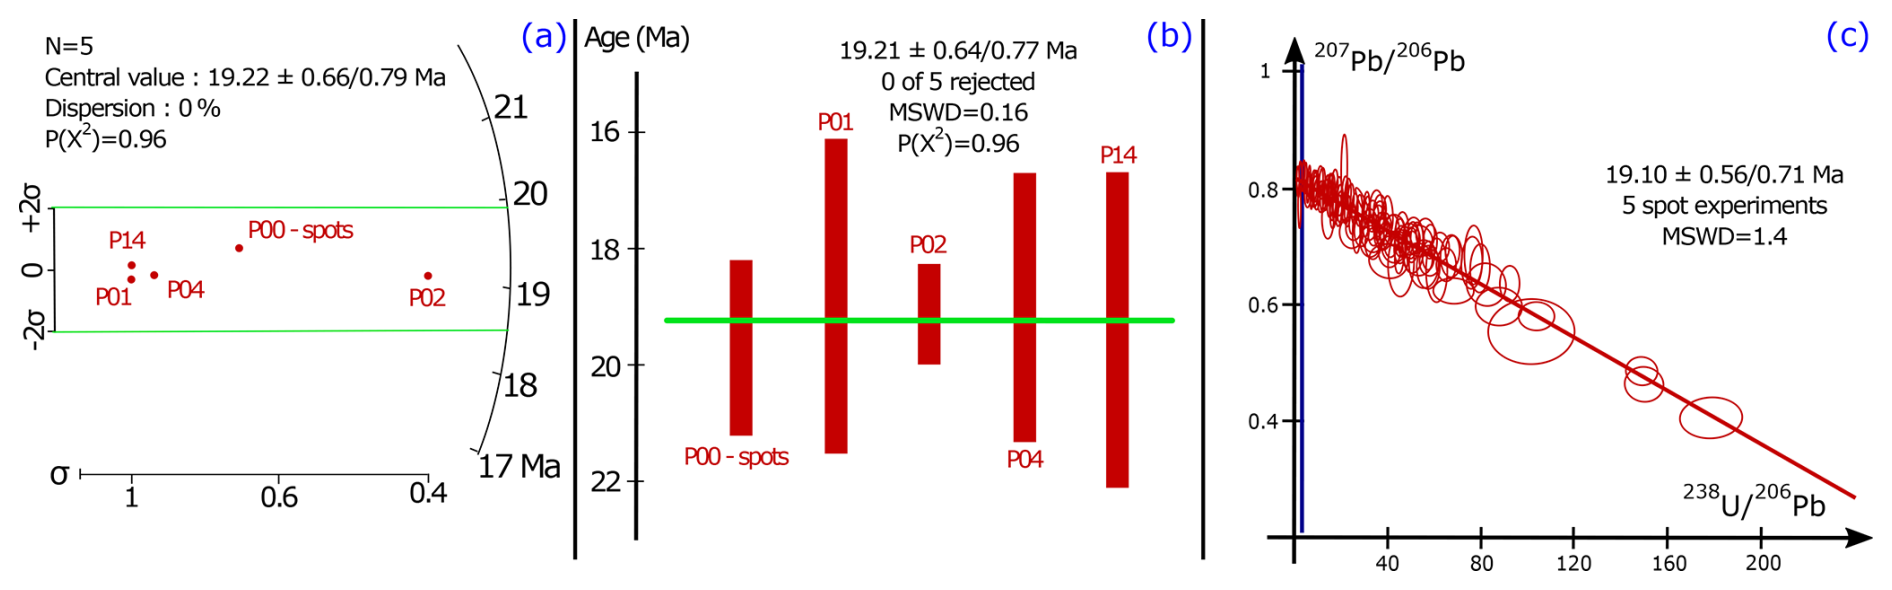
Figure 8(a) The radial plot and (b) weighted average of the samples used in this study. The radial plot central value and the weighted average value are indicated with 2σ internal uncertainties (session estimates). The full systematic uncertainties (Sect. 3.6) were propagated onto the resultant age calculations with the same method as for the individual sample ages. (c) Tera–Wasserburg concordia diagram of all five spot ablation experiments. See text for the interpretation and discussion of the data.
5.2 Age of the nodules and paleosol
Our age data are compatible within uncertainty with the proposed biostratigraphic age of the continental biozone MN3, which is correlated with the Burdigalian marine stratigraphic age (20.44–15.98 Ma; Cohen et al., 2013 (updated September 2023)) and the Orleanian continental stratigraphic age (19.5–14.2 Ma; Hilgen et al., 2012). Dating the pedogenic calcite should provide a minimum age for the paleosol formation (Rasbury et al., 1997). The nodules are found within the same sedimentary layer (Sect. 2.2), and we can therefore reasonably assume that the crystallisation of the calcite inside each nodule arose from the same process(es). Even if these process(es) involve multiple phases of growth, we do not see any evidence of incremental growth of more than one generation of calcite from petrography, CL and SEM–EDS mapping. The dates obtained on these five nodules are identical within age uncertainty of our method (Fig. 8) and do not exhibit evidence for more than one stage of calcite growth, diachronous growth across different nodules, or a substantial time span between initiation and termination of calcite formation. We therefore assume that formation of the analysed nodules (which are identical within age uncertainty of our method) was effectively synchronous.
To determine the minimum age of nodule formation, there are several possible approaches: (1) the date with the lowest uncertainty (P02: 19.11 ± 0.84/0.94 Ma), (2) the date derived from the combined TW regression of spot analyses from all five samples (Fig. 8c; 19.10 ± 0.56/0.71 Ma), (3) a weighted mean of the dates from all analysed samples (Fig. 8b; 19.21 ± 0.64/0.77 Ma) or (4) the radial plot age (Fig. 8a; 19.22 ± 0.66/0.79 Ma). The former two methods may introduce some bias as they may overly rely on the data points with the highest ratios all coming from the same sample (P02), while the latter two methods put more emphasis on the similarity of the results associated with individual samples. The radial plot only shows one age group, and the central age from the radial plot and the weighted mean of the TW intercept ages are identical within age uncertainty. The weighted mean age calculation assumes the data follows a normal distribution, while the radial plot assumes that the log of the values follows a normal distribution curve (Vermeesch, 2018). Geochronological data are less likely than other data to conform to a normal distribution due to the presence of outliers and the range of age values must be positive; thus the distribution is asymmetric (Vermeesch, 2018). The log of the outliers used in radial plots will smooth these deviations and heteroscedastic variation (unequal uncertainties) and make it fit to the normal distribution curve (Galbraith et al., 1999), which is why the radial plot central age is preferred. This age of 19.22 ± 0.66/0.79 Ma for the s1 bed allows precise correlation with other dated sequences, independently of the lithofacies or fossil assemblages present. This age is the first absolute age for the continental Miocene facies of the Paris Basin and to the best of our knowledge the youngest U–Pb age from pedogenic carbonates in the literature (Table 1).
5.3 Biostratigraphic significance
The MN stratigraphic timescale is based on faunal calibration. The appearance and disappearance of taxa result in a given combination of species that can be linked to a given time (Mein, 1999). The MN scale incorporates a stratigraphic component as well as classical stratigraphic correlations and magnetostratigraphy to help refine the age control (Hilgen et al., 2012). MN units were initially defined without boundaries or clearly defined limits (e.g. Mein, 1975), but nowadays the scale is often presented alongside a chronostratigraphic scale, with an absolute age associated with each biozone boundary (e.g. Agustí et al., 2001; Van Dam et al., 2001; Aguilar et al., 2003; Gagnaison et al., 2023). The absolute ages of the boundaries remain debated (see the example of MN3 below) due to diachronicity and incomplete paleontological and magnetostratigraphical data (Fortelius et al., 2014; Ezquerro et al., 2022). Each zone is characterised by a specific fauna found at a reference locality (for Europe these are mainly in Teruel and Ebro Basin (Spain), Paris Basin (France), and North Alpine Foreland Basin (Germany)) that can be asynchronous by up to 1–2 Myr in the Late Miocene (Van der Meulen et al., 2012; Fortelius et al., 2014; Ezquerro et al., 2022). The majority of the MN zones have uncertainties attached to their age boundaries (Fig. 9), while the application of the MN timescale typically involves comparison to the most proximal and well-constrained reference section to circumvent potential diachronicity. Local modifications to the MN timescale are thus often adopted for selected biozones (Hilgen et al., 2012; Van der Meulen et al., 2012; Fortelius et al., 2014; Ezquerro et al., 2022).
To improve the precision of this scale, the incorporation of magnetostratigraphy has helped to better define the MN unit boundaries within basins (e.g. Agustí et al., 2001; Kälin and Kempf, 2009). Steininger (1999) used magnetostratigraphic data to propose that magnetochron C6r (20.5 Ma) represented the base and C5Dr the top (18.5 Ma) of MN3. The top boundary of MN3 was then extended to chron C5Cn.2r, dated between 16.6 and 17.2 Ma, based on magnetostratigraphy of sections in the North Alpine foreland (Agustí et al., 2001). The MN3 faunal reference site was defined as Wintershof-West with a sedimentary succession dated between 17.5 and 18.5 Ma (Hilgen et al., 2012), thus only partially covering the time interval defined by the magnetochron ages. The MN3 boundaries were refined by magnetochron ages for C6r (19.979 Ma) and C5Dr (18.007–17.634 Ma), which are the chrons defined by Steininger (1999) as bracketing the MN3 biozone; the ages of these magnetochrons were subsequently updated by Raffi et al. (2020). It should be noted that magnetostratigraphy requires thick sections (typically >10 m thick profiles) and cannot always be employed. Our results are compatible within uncertainties with the different magnetochron ages proposed for MN3 and are not challenging the actual consensus around the absolute age of the base or the top of MN3 (Fig. 9).
Absolute U–Pb dating of in situ pedogenic carbonates enables a better understanding of the spatio-temporal distribution and evolution of continental mammalian faunas. This method is not affected by the limits detailed above (i.e. diachronicity, index fossil scarcity, insufficient profile thickness), thus offering a reliable opportunity to improve the local constraints on the MN scale. Our age is compatible with an early Orleanian stage assignation (Fig. 1) and the MN3 unit (Hilgen et al., 2012). The age constraints on the Mauvières fossil locality are thus significantly improved by our results, but it should be noted that an age for one locality does not improve the precision of the MN3 boundaries at a European scale. Therefore, more studies employing a similar method are needed for further improvement of the MN scale, especially zones with large uncertainties such as MN3.
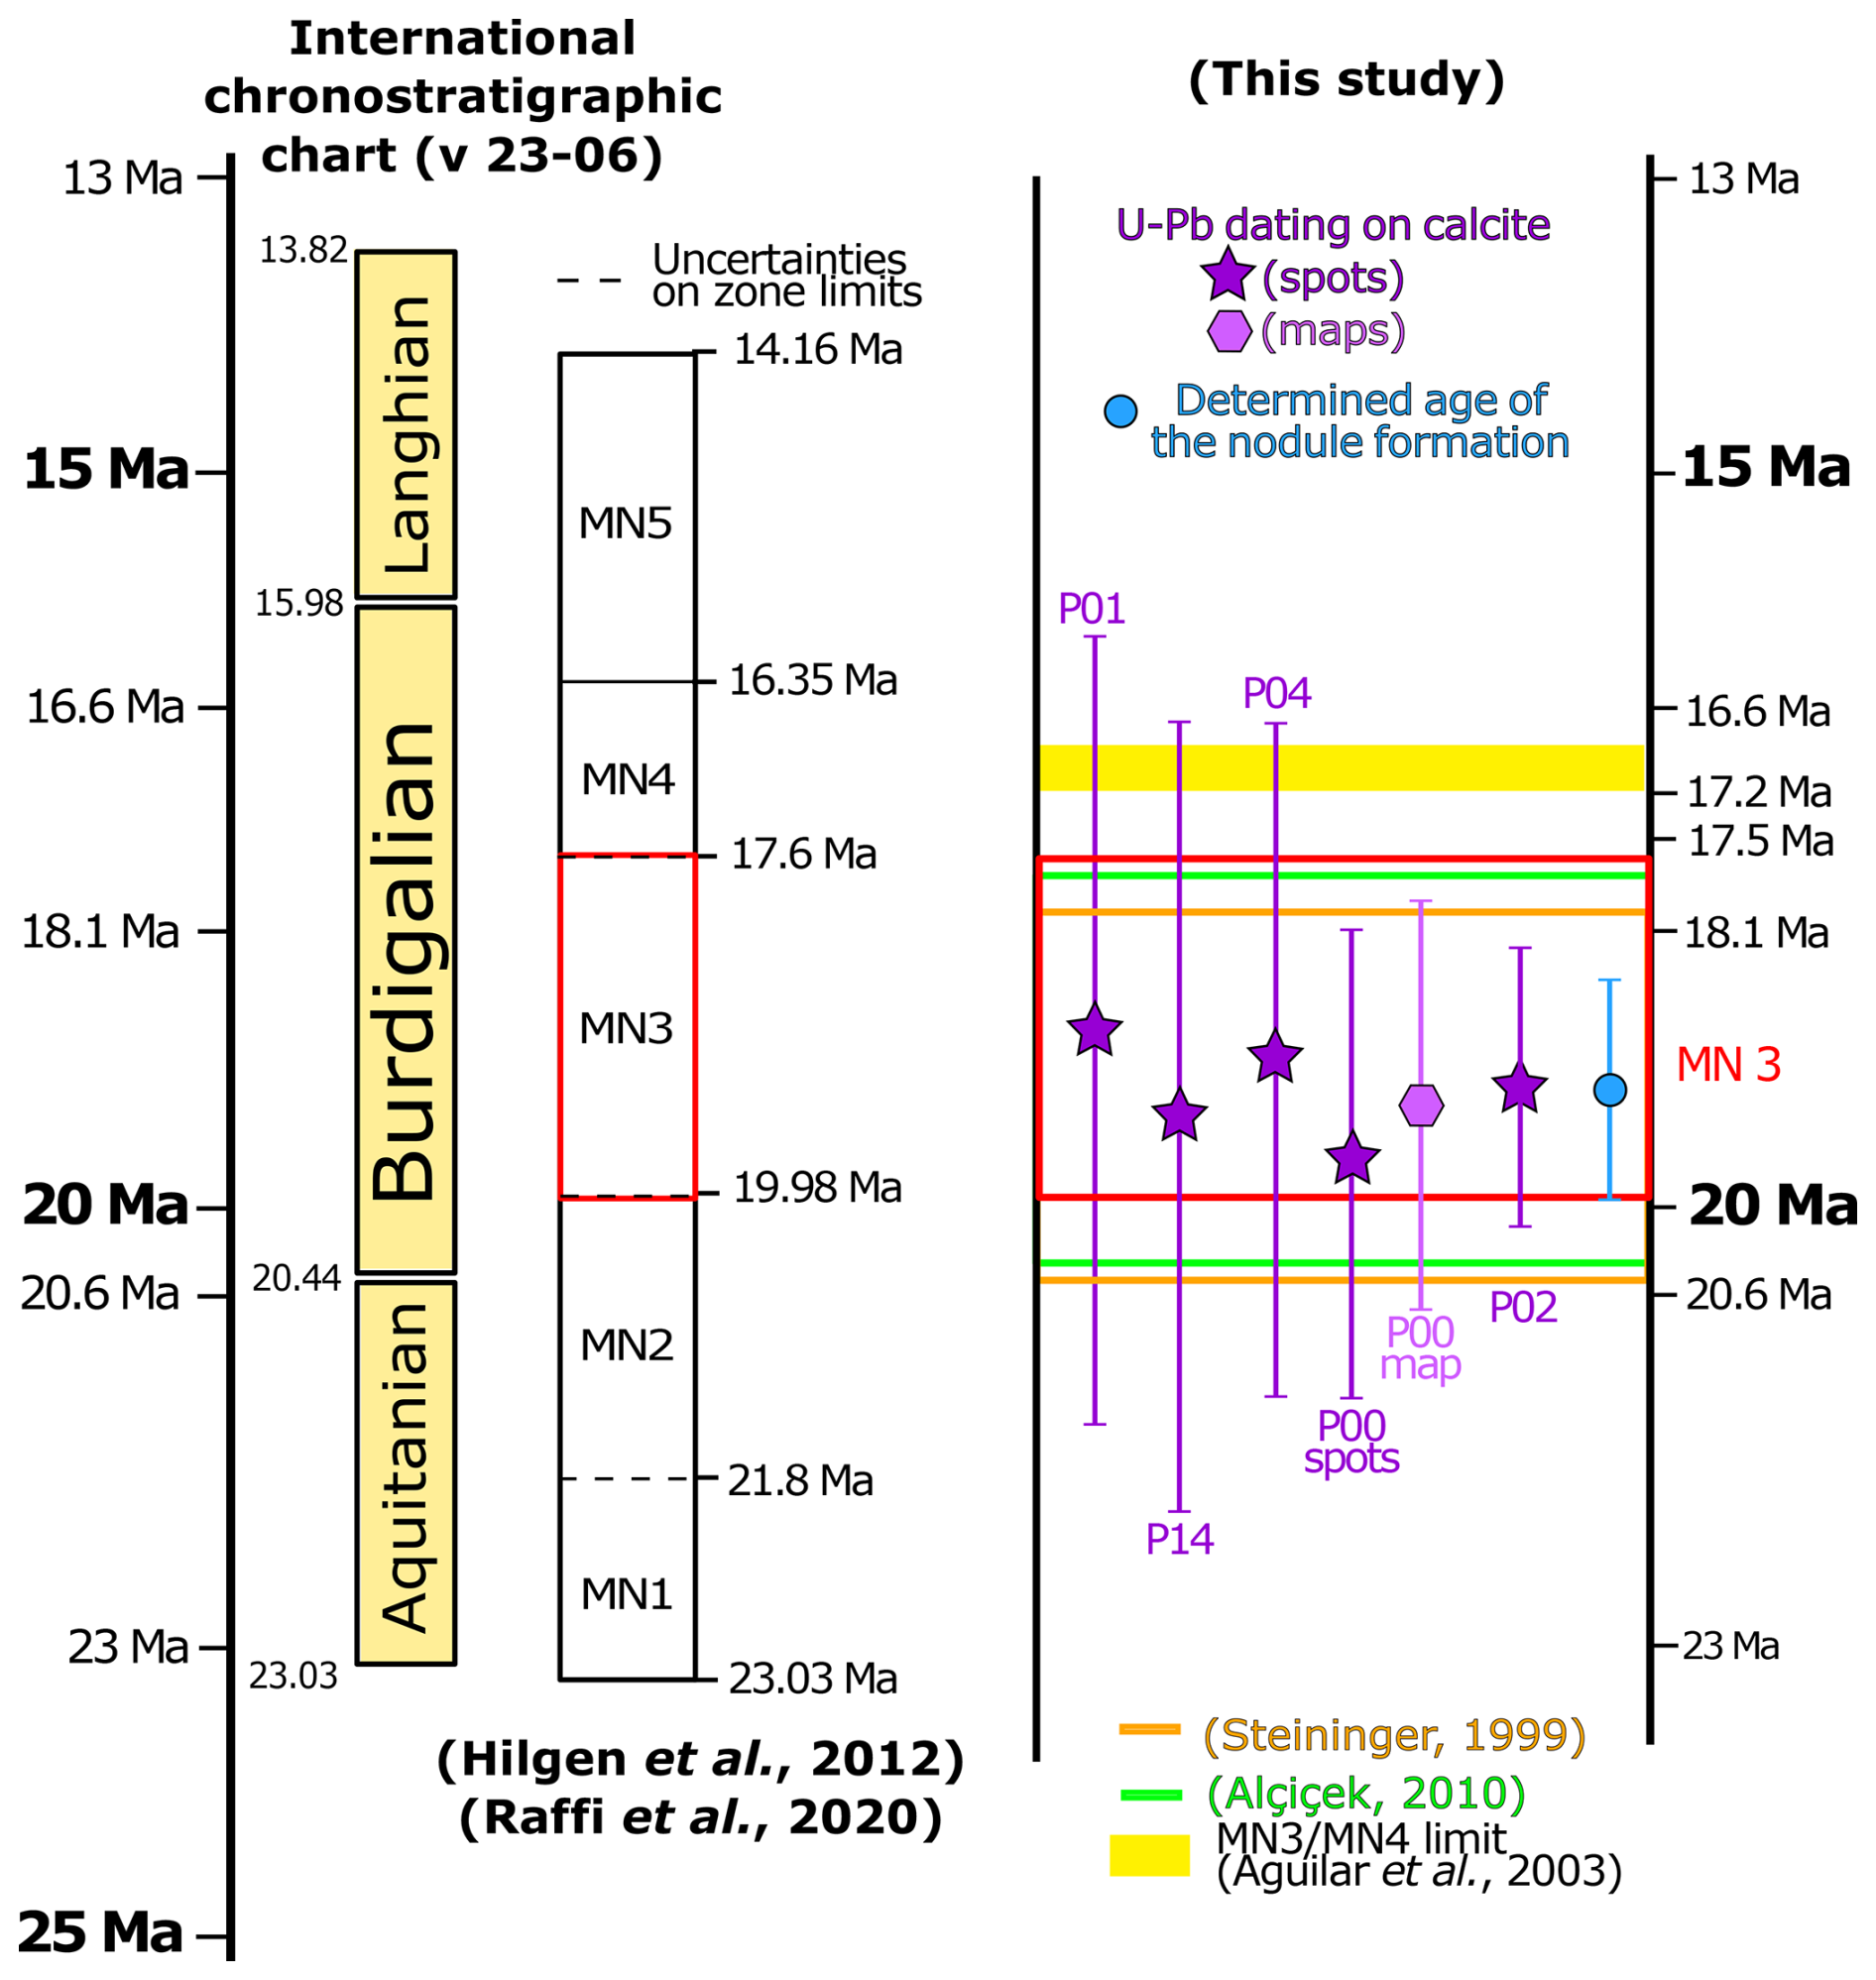
Figure 9Overview of MN timescales in the literature compared to the age data from this study. The red box defining the currently accepted boundaries of the MN3 biozone is taken from Raffi et al. (2020) by taking the base of magnetochron C6r at 19.979 Ma and the top of C5Dr as 17.634 Ma. The age of nodule formation is the result of the radial plot using the six U–Pb geochronology dates and their respective internal uncertainties; the full systematic uncertainty was propagated on to the radial plot result age calculation (see Sects. 4.4 and 5.2).
The application of LA-ICP-MS U–Pb dating of calcite pedogenic nodules as employed in this study is a robust and reliable way to provide absolute age data for terrestrial strata. Our samples yield a precise and accurate age of 19.22 ± 0.79 Ma in accordance with earlier biostratigraphic estimates (Orleanian), demonstrating the suitability of the method and confirming the feasibility of the technique for dating continental sedimentary facies that do not contain any index fossils or volcanic horizons such as lavas or ash beds.
Our results are in good agreement with the biostratigraphic age (MN3 of the Neogene Mammalian timescale) of sedimentary horizon s1 from Mauvières (Gagnaison et al., 2023) and represent the first absolute age constraint for the MN3 unit in France. This absolute dating approach has the potential to advance chronostratigraphy and climatic reconstructions (Liivamägi et al., 2021) by improving inter-basin correlations in continental successions and extending such correlations to the marine sedimentary record. In order to refine the geochronological constraints, the use of a more precise reference material would decrease the external uncertainties (i.e. ASH15, Nuriel et al., 2021; JT, Guillong et al., 2020; RA138, Guillong et al., 2024). The protocol for U–Pb dating of carbonate nodules proposed by Aguirre Palafox et al. (2024) offers a uniform approach and a basis for comparisons between studies. While their study was published during the review process of this paper, it should be noted that our study nevertheless broadly conforms with this protocol.
The data corresponding to this paper is available in open access following the link https://doi.org/10.5281/zenodo.14500416 (Monchal et al., 2024–2025).
The supplement related to this article is available online at https://doi.org/10.5194/gchron-7-139-2025-supplement.
VM contributed to the conceptualisation, the formal acquisition, the investigation, the methodology, the project administration, the visualisation and the writing (initial draft and edits). RR contributed to the conceptualisation, the formal acquisition, the investigation, the methodology, the project administration, the visualisation and the writing (edits and part of initial draft). KD contributed to the methodology, the supervision and the writing (edits). CG and BM contributed to the resources, the conceptualisation and the writing (edits). RT contributed to the writing (edits). DC contributed to the supervision, the funding acquisition and the writing (edits).
The contact author has declared that none of the authors has any competing interests.
Publisher's note: Copernicus Publications remains neutral with regard to jurisdictional claims made in the text, published maps, institutional affiliations, or any other geographical representation in this paper. While Copernicus Publications makes every effort to include appropriate place names, the final responsibility lies with the authors.
The authors would like to acknowledge the Poirier family who allowed us to sample the shell bed (falun) at Mauvières quarry. We would also like to thank Didier Memeteau and Bruno Cossard for assistance sampling the nodules. We acknowledge the support of the Science Foundation Ireland, the Environmental Protection Agency and the Geological Survey of Ireland under Investigators Programme grant 15/IA/3024. Comments by reviewers Perach Nuriel and Andreas Möller and the associate editor Axel Schmitt significantly improved this paper and are gratefully acknowledged.
This research has been supported by the Science Foundation Ireland, the Environmental Protection Agency and the Geological Survey of Ireland (grant no. 15/IA/3024).
This paper was edited by Axel Schmitt and reviewed by Perach Nuriel and Andreas Möller.
Agnini, C., Fornaciari, E., Raffi, I., Catanzariti, R., Pälike, H., Backman, J., and Rio, D.: Biozonation and biochronology of Paleogene calcareous nannofossils from low and middle latitudes, Newsl. Stratigr., 47, 131–181, https://doi.org/10.1127/0078-0421/2014/0042, 2014.
Aguilar, J. P., Antoine, P. O., Crochet, J. Y., López Martínez, N., Métais, G., Michaux, J., and Welcomme, J. L.: Les mammifères du Miocène inférieur de Beaulieu (Bouchesdu-Rhône, France), comparaison avec Wintershof-West et le problème de la limite MN3/MN4, Coloquios de paleontología, Vol. E (1), 1–24, ISSN 1132-1660, https://hdl.handle.net/20.500.14352/50445 (last access 12 July 24), 2003.
Aguirre Palafox, L. E., Möller, A., McLean, N. M., Ludvigson, G. A., Colombi, C. E., and Montañez, I. P.: U–Pb Geochronology of Paleosol Carbonate Cements by LA-ICP-MS: A Proof of Concept and Strategy for Dating the Terrestrial Record, Geochem. Geophy. Geosy., 25, e2024GC011488, https://doi.org/10.1029/2024GC011488, 2024.
Agustí, J., Cabrera, L., Garcés, M., Krijgsman, W., Oms, O., and Parés. J. M.: A Calibrated Mammal Scale for the Neogene of Western Europe, State of the Art, Earth-Sci. Rev., 52, 247–60, https://doi.org/10.1016/S0012-8252(00)00025-8, 2001.
Alçiçek, H.: Stratigraphic Correlation of the Neogene Basins in Southwestern Anatolia: Regional Palaeogeographical, Palaeoclimatic and Tectonic Implications, Palaeogeogr. Palaeocl., 291, 297–318, https://doi.org/10.1016/j.palaeo.2010.03.002, 2010.
Alonso-Zarza, A. M.: Palaeoenvironmental significance of palustrine carbonates and calcretes in the geological record, Earth-Sci. Rev., 60, 261-298, https://doi.org/10.1016/S0012-8252(02)00106-X, 2003.
Bain, R. J. and Foos, A. M.: Carbonate microfabrics related to subaerial exposure and paleosol formation, in: Carbonate Microfabrics: Frontiers in Sedimentology, edited by: Rezak, R. and Lavoie, D. L., Springer-Verlag, 17–27, https://doi.org/10.1007/978-1-4684-9421-1_2, 1993.
Barnaby, R. J. and Rimstidt, J. D.: Redox conditions of calcite cementation interpreted from Mn and Fe contents of authigenic calcites, GSA Bulletin, 101, 795–804, 1989.
Becker, M. L., Rasbury, E. T., Hanson, G. N., and Meyers, W. J.: Refinement in the age of the Carboniferous-Permian boundary based on U–Pb dating of biostratigraphically constrained syn-sedimentary carbonates in the Appalachian region of North America, Newsletter on Carboniferous Stratigraphy, 19, 18–20, 2001.
Boggs, S. and Krinsley, D.: Application of cathodoluminescence imaging to the study of sedimentary rocks, Cambridge University Press, ISBN 9781139460330, 2006.
Chew, D., Drost, K., Marsh, J. H., and Petrus, J. A.: LA-ICP-MS imaging in the geosciences and its applications to geochronology, Chem. Geol., 559, 119917, https://doi.org/10.1016/j.chemgeo.2020.119917, 2021.
Cohen, K. M., Finney, S. C., Gibbard, P. L., and Fan, J.-X.: The ICS International Chronostratigraphic Chart, Episodes 36, 199–204, 2013.
Daxner-Höck, G., Badamgarav, D., Barsbold, R., Bayarmaa, B., Erbajeva, M., Göhlich, U. B., Harzhauser, M., Höck, E., Höck, V., Ichinnorov, N., Khand, Y., López-Guerrero, P., Maridet, O., Neubauer, T., Oliver, A., Piller, W., Tsogtbaatar, K. and Ziegler, R.: Oligocene stratigraphy across the Eocene and Miocene boundaries in the Valley of Lakes (Mongolia), Palaeobio. Palaeoenv., 97, 111–218, 2017.
Drake, H., Mathurin, F. A., Zack, T., Schäfer, T., Roberts, N. M. W., Whitehouse, M., Karlsson, A., Broman, C., and Åström, M. E.: Incorporation of Metals into Calcite in a Deep Anoxic Granite Aquifer, Environ. Sci. Technol., 52, 493–502, https://doi.org/10.1021/acs.est.7b05258, 2018.
Drost, K., Chew, D., Petrus, J. A., Scholze, F., Woodhead, J. D., Schneider, J. W., and Harper, D. A. T.: An image mapping approach to U–Pb LA-ICP-MS carbonate dating and applications to direct dating of carbonate sedimentation, Geochem. Geophy. Geosy., 19, 4631–4648, https://doi.org/10.1029/2018gc007850, 2018.
Engesser, B. and Mödden, C.: A new version of the biozonation of the Lower Freshwater Molasse (Oligocene and Agenian) of Switzerland and Savoy on the basis of fossil mammals, in: BiochroM'97 Montpellier, Ecole pratique des hautes études, edited by: Aguilar, J.-P., Legendre, S., and Michaux, J., Institut de Montpellier, Montpellier, France, 475–499, ISSN: 0335-8178, 1997.
Esteban, M. and Klappa, C. F.: Subaerial exposure environment: Chapter 1: Part 2, in: Carbonate Depositional Environments, edited by: Scholle, P. A., Bebout, D. G., and Moore C. H., 23–54, https://doi.org/10.1306/M33429C1, 1983.
Ezquerro, L., Luzón, A., Simón, J. L., and Liesa, C. L.: A review of the European Neogene Mammal zones from integration of litho-, bio- and magnetostratigraphy in the Teruel Basin, Earth-Sci. Rev., 234, 104223, https://doi.org/10.1016/j.earscirev.2022.104223, 2022.
Fortelius, M., Eronen, J. T., Kaya, F., Tang, H., Raia, P., and Puolamäki, K.: Evolution of Neogene Mammals in Eurasia: Environmental forcing and biotic interactions, Annu. Rev. Earth Pl. Sc., 42, 579–604, https://doi.org/10.1146/annurev-earth-050212-124030, 2014.
Fournier, F., Montaggioni, L., and Borgomano, J.: Paleoenvironments and high-frequency cyclicity from Cenozoic South-East Asian shallow-water carbonates: a case study from the Oligo-Miocene buildups of Malampaya (Offshore Palawan, Philippines), Mar. Petrol. Geol., 21, 1–21, https://doi.org/10.1016/j.marpetgeo.2003.11.012, 2004.
Gagnaison, C.: Le Miocène du Nord-Ouest de la France (vallée de la Loire, Bretagne et Normandie) : Révision du contexte taphonomique des fossiles de vertébrés, proposition d'un découpage stratigraphique et clarification des variations paléoenvironnementales, Fossiles, 41, 3–30, 2020.
Gagnaison, C., Cabidoche, M., Riera, R., Dechamps, M., and Gagnaison, J. C.: The geological context of the Lower Orleanian continental sands from the Savigné-sur-Lathan/Noyant-sous-le-Lude basin (Anjou-Touraine, France), Bulletin d'Information des Géologue du Bassin de Paris, 57, 3–15, 2020.
Gagnaison, C., Mennecart, B., Bailleul, J., Barrier, P., Chenot, E., Toullec, R., Potel, S., Martin, H., Millet, A., and Memeteau, D. : Nouvelles données géologiques et biostratigraphiques du gisement paléontologique à vertébrés de Mauvières, à Marcilly-sur-Maulne (Miocène inférieur et moyen ; Indre-et-Loire, France), Geodiversitas, 45, 449–478, https://doi.org/10.5252/geodiversitas2023v45a16, 2023.
Galbraith, R. F., Roberts, R.G., Laslett, R. G., Yoshida, H., and Olley, J. M.: Optical dating of single and multiple grains of quartz from Jinmium rock shelter, northern Australia: part 1, experimental design and statistical models, Archaeometry, 41, 339–364, https://doi.org/10.1111/j.1475-4754.1999.tb00987.x, 1999.
Gates-Rector, S. and Blanton, T.: The Powder Diffraction File: A quality materials characterization database, Powder Diffr., 34, 352–360, https://doi.org/10.1017/S0885715619000812, 2019.
Getty, S. R., Asmerom, Y., Quinn, T. M., and Budd, A. F.: Accelerated Pleistocene coral extinctions in the Caribbean Basin shown by uranium-lead (U–Pb) dating, Geology, 29, 639–642, https://doi.org/10.1130/0091-7613(2001)029<0639:APCEIT>2.0.CO;2, 2001.
Ginsburg, L.: Les faunes de mammifères terrestres du Miocène moyen des Faluns du bassin de Savigné-sur-Lathan (France), Geodiversitas, 23, 381–394, 2001.
Guillocheau, F., Robin, C., Allemand, P., Bourquin, S., Brault, N., Dromart, G., Friedenberg, R., Garcia, J.-P., Gaulier, J.-M., Gaumet, F., Grosdoy, B., Hanot, F., Le Strat, P., Mettraux, M., Nalpas, T., Prijac, C., Rigollet, C., Serrano, O., and Grandjean, G.: Meso-Cenozoic geodynamic evolution of the Paris Basin: 3D stratigraphic constraints, Geodin. Acta, 13, 189–246, https://doi.org/10.1016/S0985-3111(00)00118-2, 2000.
Guillong, M., Wotzlaw, J.-F., Looser, N., and Laurent, O.: Evaluating the reliability of U–Pb laser ablation inductively coupled plasma mass spectrometry (LA-ICP-MS) carbonate geochronology: matrix issues and a potential calcite validation reference material, Geochronology, 2, 155–167, https://doi.org/10.5194/gchron-2-155-2020, 2020.
Guillong, M., Samankassou, E., Müller, I. A., Szymanowski, D., Looser, N., Tavazzani, L., Merino-Tomé, Ó., Bahamonde, J. R., Buret, Y., and Ovtcharova, M.: Technical note: RA138 calcite U–Pb LA-ICP-MS primary reference material, Geochronology, 6, 465–474, https://doi.org/10.5194/gchron-6-465-2024, 2024.
Haq, B. U., Hardenbol, J., and Vail, P. R.: Chronology of Fluctuating Sea Levels Since the Triassic, Science, 235, 1156–1167, https://doi.org/10.1126/science.235.4793.1156, 1987.
Hill, C. A., Polyak, V. J., Asmerom, Y., and P. Provencio, P.: Constraints on a Late Cretaceous uplift, denudation, and incision of the Grand Canyon region, southwestern Colorado Plateau, USA, from U–Pb dating of lacustrine limestone, Tectonics, 35, 896–906, https://doi.org/10.1002/2016tc004166, 2016.
Hilgen, F. J., Lourens, L. J., Van Dam, J. A., Beu, A. G., Boyes, A. F., Cooper, R. A., Krijgsman, W., Ogg, J. G., Piller, W. E., and Wilson, D. S.: Chapter 29 – The Neogene Period, in: The Geologic Time Scale, edited by: Gradstein, F. M., Ogg, J. G., Schmitz, M. D., and Ogg, G. M., Elsevier, Boston, https://doi.org/10.1016/b978-0-444-59425-9.00029-9, 2012.
Hoff, J. A., Jameson, J., and Hanson, G. N.: Application of Pb isotopes to the absolute timing of regional exposure events in carbonate rocks; an example from U-rich dolostones from the Wahoo Formation (Pennsylvanian), Prudhoe Bay, Alaska, J. Sediment. Res., 65, 225–233, https://doi.org/10.1306/D426807C-2B26-11D7-8648000102C1865D, 1995.
Kerr, R. A.: Huge impact tied to mass extinction, Science, 257, 878–880, 1992.
Kälin, D. and Kempf, O.: High-resolution stratigraphy from the continental record of the Middle Miocene Northern Alpine Foreland Basin of Switzerland, Neues Jahrb. Geol. P.-A., 254, 177–235, https://doi.org/10.1127/0077-7749/2009/0010, 2009.
Koufos, G. D., Kostopoulos, D. S., and Vlachou, T. D.: Neogene/Quaternary mammalian migrations in eastern Mediterranean, Belg. J. Zool., 135, 181–190, https://doc.rero.ch/record/13544/files/PAL_E383.pdf (last access: 1 July 2024), 2005.
Li, Q., Parrish, R. R., Horstwood, M. S. A., and McArthur, J. M.: U–Pb dating of cements in Mesozoic ammonites, Chem. Geol., 376, 76–83, https://doi.org/10.1016/j.chemgeo.2014.03.020, 2014.
Liivamägi, S., Środoń, J., Bojanowski, M. J., Stanek, J. J., and Roberts, N. M. W.: Precambrian paleosols on the Great Unconformity of the East European Craton: An 800 million year record of Baltica's climatic conditions, Precambrian Res., 363, 106327, https://doi.org/10.1016/j.precamres.2021.106327, 2021.
Luczaj, J. A. and Goldstein, R. H.: Diagenesis of the Lower Permian Krider Member, Southwest Kansas, U.S.A.: Fluid-Inclusion, U–Pb, and Fission-Track Evidence for Reflux Dolomitization During Latest Permian Time, J. Sediment. Res., 70, 762–773, https://doi.org/10.1306/2DC40936-0E47-11D7-8643000102C1865D, 2000.
Machel, H. G. and Burton, E. A.: Factors governing cathodoluminescence in calcite and dolomite, and their implications for studies of carbonate diagenesis, in: Luminescence Microscopy and Spectroscopy – Qualitative and quantitative applications, edited by: Barker, C. E. and Kopp, O. C., Society for Sedimentary Geology, 37–57, https://doi.org/10.2110/scn.91.25.0037, 1991.
Mason, R. A.: Ion microprobe analysis of trace elements in calcite with an application to the cathodoluminescence zonation of limestone cements from the Lower Carboniferous of South Wales, U.K, Chem. Geol., 64, 209–224, https://doi.org/10.1016/0009-2541(87)90003-9, 1987.
Mein, P.: Report on activity RCMNS-Working groups (1971–1975), Bratislava, 78–81, 1975.
Mein, P.: European Miocene Mammal Biochronology, in: The Miocene Land Mammals of Europe, edited by: Rössner, G. E. and Heissig, K., Verlag Dr. Friedrich Pfeil, München, 25–38, ISBN 9783931516505, 1999.
Methner, K., Mulch, A., Fiebig, J., Wacker, U., Gerdes, A., Graham, S. A., and Chamberlain, C. P.: Rapid Middle Eocene temperature change in western North America, Earth Planet. Sc. Lett., 450, 132–139, https://doi.org/10.1016/j.epsl.2016.05.053, 2016.
Monchal, V., Drost, K., and Chew, D.: Precise U–Pb dating of incremental calcite slickenfiber growth: Evidence for far-field Eocene fold reactivation in Ireland, Geology, 51, 611–615, https://doi.org/10.1130/G50906.1, 2023.
Monchal, V., Rateau, R., Drost, K., Gagnaison, C., Mennecart, B., Toullec, R., Torremans, K., and Chew, D.: Supplementary Tables : U–Pb direct dating on calcite paleosol nodules: first absolute age constraints on the Miocene continental succession of the Paris Basin, Zenodo [code and data set], https://doi.org/10.5281/zenodo.14500416, 2024–2025.
Montano, D., Gasparrini, M., Gerdes, A., Della Porta, G., and Albert, R.: In-situ U–Pb dating of Ries Crater lacustrine carbonates (Miocene, South-West Germany): Implications for continental carbonate chronostratigraphy, Earth Planet. Sc. Lett., 568, 117011, https://doi.org/10.1016/j.epsl.2021.117011, 2021.
Nuriel, P., Weinberger, R., Kylander-Clark, A. R. C., Hacker, B. R., and Craddock, J. P.: The onset of the Dead Sea transform based on calcite age-strain analyses, Geology, 45, 587–590, https://doi.org/10.1130/G38903.1, 2017.
Nuriel, P., Wotzlaw, J.-F., Ovtcharova, M., Vaks, A., Stremtan, C., Šala, M., Roberts, N. M. W., and Kylander-Clark, A. R. C.: The use of ASH-15 flowstone as a matrix-matched reference material for laser-ablation U − Pb geochronology of calcite, Geochronology, 3, 35–47, https://doi.org/10.5194/gchron-3-35-2021, 2021.
Pagel, M., Barbin, V., Blanc, P., and Ohnenstetter, D.: Cathodoluminescence in Geosciences: An Introduction, in: Cathodoluminescence in Geosciences, edited by: Pagel, M., Barbin, V., Blanc, P., and Ohnenstetter, D., Springer Berlin Heidelberg, Berlin, Heidelberg, 1–21, https://doi.org/10.1007/978-3-662-04086-7_1, 2000.
Parrish, R. R., Parrish, C. M., and Lasalle, S.: Vein calcite dating reveals Pyrenean orogen as cause of Paleogene deformation in southern England, Journal of the Geological Society, 175, 425–442, https://doi.org/10.1144/jgs2017-107, 2018.
Perry, C. T. and Taylor, K. G.: Inhibition of dissolution within shallow water carbonate sediments: impacts of terrigenous sediment input on syn-depositional carbonate diagenesis, Sedimentology, 53, 495–513, https://doi.org/10.1111/j.1365-3091.2006.00777.x, 2006.
Poujol, M., Mercuzot, M., Lopez, M., Bourquin, S., Bruguier, O., Hallot, E., and Beccaletto, L.: Insights on the Permian tuff beds from the Saint-Affrique Basin (Massif Central, France): an integrated geochemical and geochronological study, C. R. Géosci., 355, 137–161, 2023.
Prajapati, N., Selzer, M., Nestler, B., Busch, B., and Hilgers, C.: Modeling fracture cementation processes in calcite limestone: a phase-field study, Geothermal Energy, 6, 7, https://doi.org/10.1186/s40517-018-0093-4, 2018.
Prieur, M., Whittaker, A. C., Nuriel, P., Jaimes-Gutierrez, R., Garzanti, E., Roigé, M., Sømme, T. O., Schlunegger, F., and Castelltort, S.: Fingerprinting enhanced floodplain reworking during the Paleocene–Eocene Thermal Maximum in the Southern Pyrenees (Spain): Implications for channel dynamics and carbon burial, Geology, 52, 651–655, https://doi.org/10.1130/g52180.1, 2024.
Raffi, I., Wade, B. S., Pälike, H., Beu, A. G., Cooper, R., Crundwell, M. P., Krijgsman, W., Moore, T., Raine, I., Sardella, R., and Vernyhorova, Y. V.: Chapter 29 – The Neogene Period, in: Geologic Time Scale 2020, edited by: Gradstein, F. M., Ogg, J. G., Schmitz, M. D., and Ogg, G. M., Elsevier, https://doi.org/10.1016/B978-0-12-824360-2.00029-2, 2020.
Rasbury, E. T. and Cole, J. M.: Directly dating geologic events: U–Pb dating of carbonates, Rev. Geophys., 47, RG3001, https://doi.org/10.1029/2007RG000246, 2009.
Rasbury, E. T., Hanson, G. N., Meyers, W. J., and Saller, A. H.: Dating of the time of sedimentation using U–Pb ages for paleosol calcite, Geochim. Cosmochim. Ac., 61, 1525–1529, https://doi.org/10.1016/S0016-7037(97)00043-4, 1997.
Rasbury, E. T., Hanson, G. N., Meyers, W. J., Holt, W. E., Goldstein, R. H., and Saller, A. H.: U–Pb dates of paleosols: Constraints on late Paleozoic cycle durations and boundary ages, Geology, 26, 403–406, https://doi.org/10.1130/0091-7613(1998)026<0403:UPDOPC>2.3.CO;2, 1998.
Rasbury, E. T., Meyers, W. J., Hanson, G. N., Goldstein, R. H., and Saller, A. H: Relationship of Uranium to Petrography of Caliche Paleosols with Application to Precisely Dating the Time of Sedimentation, J. Sediment. Res., 70, 604–618, https://doi.org/10.1306/2DC4092B-0E47-11D7-8643000102C1865D, 2000.
Rasbury, E. T., Piccione, G., Holt, W., and Ward, W. B.: Potential for constraining sequence stratigraphy and cycle stratigraphy with U–Pb dating of carbonates, Earth-Sci. Rev., 243, 104495, https://doi.org/10.1016/j.earscirev.2023.104495, 2023.
Richter, D. K., Götte, T., Götze, J., and Neuser, R. D.: Progress in application of cathodoluminescence (CL) in sedimentary petrology, Miner. Petrol., 79, 127–166, https://doi.org/10.1007/s00710-003-0237-4, 2003.
Roberts, N. M. W. and Holdsworth, R. E.: Timescales of faulting through calcite geochronology: A review, J. Struct. Geol., 158, 104578, https://doi.org/10.1016/j.jsg.2022.104578, 2022.
Roberts, N. M. W. and Walker, R. J.: U–Pb geochronology of calcite-mineralized faults: Absolute timing of rift-related fault events on the northeast Atlantic margin, Geology, 44, 531–534, https://doi.org/10.1130/G37868.1, 2016.
Roberts, N. M. W., Rasbury, E. T., Parrish, R. R., Smith, C. J., Horstwood, M. S. A., and Condon, D. J.: A calcite reference material for LA-ICP-MS U-Pb geochronology, Geochem., Geophy. Geosy., 18, 2807–2814, https://doi.org/10.1002/2016gc006784, 2017.
Roberts, N. M. W., Drost, K., Horstwood, M. S. A., Condon, D. J., Chew, D., Drake, H., Milodowski, A. E., McLean, N. M., Smye, A. J., Walker, R. J., Haslam, R., Hodson, K., Imber, J., Beaudoin, N., and Lee, J. K.: Laser ablation inductively coupled plasma mass spectrometry (LA-ICP-MS) U–Pb carbonate geochronology: strategies, progress, and limitations, Geochronology, 2, 33–61, https://doi.org/10.5194/gchron-2-33-2020, 2020.
Rubidge, B. S., Erwin, D. H., Ramezani, J., Bowring, S. A., and de Klerk, W. J.: High-precision temporal calibration of Late Permian vertebrate biostratigraphy: U-Pb zircon constraints from the Karoo Supergroup, South Africa, Geology, 41, 363–366, https://doi.org/10.1130/G33622.1, 2013.
Smith, J. J., Ludvigson, G. A., Layzell, A., Möller, A., Harlow, R. H., Turner, E., Platt, B., and Petronis, M.: Discovery of Paleogene deposits of the central High Plains aquifer in the western Great Plains, USA, J. Sediment. Res., 87, 880–896, 2017.
Smith, P. E. and Farquhar, R. M.: Direct dating of Phanerozoic sediments by the 238U–206Pb method, Nature, 341, 518–521, https://doi.org/10.1038/341518a0, 1989.
Steininger, F. F.: Chronostratigraphy, geochronology and biochronology of the Miocene “European Land Mammal Mega-Zones” (ELMMZ) and the Miocene “Mammal-Zones (MN-Zones)”, in: The Miocene: Land Mammals of Europe, edited by: Rössner, G. E. and Heissig, K., Friedrich Pfeil, 9–24, ISBN 3-931516-50-4, 1999.
Subarkah, D., Nixon, A. L., Gilbert, S. E., Collins, A. S., Blades, M. L., Simpson, A., Lloyd, J. C., Virgo, G. M., and Farkaš, J.: Double dating sedimentary sequences using new applications of in-situ laser ablation analysis, Lithos, 480–481, 107649, https://doi.org/10.1016/j.lithos.2024.107649, 2024.
Van Dam, J. A., Alcalá, L., Zarza, A. A., Calvo, J. P., Garcés, M., and Krijgsman, W.: The Upper Miocene Mammal Record from the Teruel-Alfambra Region (Spain). The MN System and Continental Stage/Age Concepts Discussed, J. Vertebr. Paleontol., 21, 367–385, http://www.jstor.org/stable/20061959 (last access: 1 July 2024), 2001.
Van der Meulen, A. J., García-Paredes, I., Álvarez-Sierra, M. A., Van den Hoek Ostende, L. W., Hordijk, K., Oliver, A., and Peláez-Campomanes, P.: Updated Aragonian biostratigraphy: Small Mammal distribution and its implications for the Miocene European Chronology, Geol. Acta, 10, 159–179, https://doi.org/10.1344/105.000001710, 2012.
Vermeesch, P.: IsoplotR: A free and open toolbox for geochronology, Geosci. Front., 9, 1479–1493, https://doi.org/10.1016/j.gsf.2018.04.001, 2018.
Wang, X., Flynn, L. J., and Fortelius, M.: Fossil mammals of Asia: Neogene biostratigraphy and chronology, Columbia University Press, https://doi.org/10.7312/wang15012-033, 2013.
Wang, Z. S., Rasbury, E. T., Hanson, G. N., and Meyers, W. J.: Using the U–Pb system of calcretes to date the time of sedimentation of clastic sedimentary rocks, Geochim. Cosmochim. Ac., 62, 2823–2835, https://doi.org/10.1016/S0016-7037(98)00201-4, 1998.
Wendler, F., Okamoto, A., and Blum, P.: Phase-field modeling of epitaxial growth of polycrystalline quartz veins in hydrothermal experiments, Geofluids, 16, 211–230, https://doi.org/10.1111/gfl.12144, 2016.
Winter, B. L. and Johnson, C. M.: U–Pb dating of a carbonate subaerial exposure event, Earth Planet. Sc. Lett., 131, 177–187, https://doi.org/10.1016/0012-821X(95)00026-9, 1995.
Wright, V. P.: Paleosols. Their Recognition and Interpretation, Princeton University Press, Blackwell Scientific, Oxford, ISBN 9780691084053, 1987.
Wright, V. P.: A micromorphological classification of fossil and recent calcic and petrocalcic microstructures, in: Soil Micromorphology, in: Proceedings of 8th meeting of Soil Micromorphology, San Antonio, 1988, edited by: Douglas, L. A., Developments in Soil Science, 19, Elsevier, Amsterdam, 401–407, https://doi.org/10.1016/S0166-2481(08)70354-4, 1990.
Zamanian, K., Pustovoytov, K., and Kuzyakov, Y.: Pedogenic carbonates: Forms and formation processes, Earth-Sci. Rev., 157, 1–17, https://doi.org/10.1016/j.earscirev.2016.03.003, 2016.