the Creative Commons Attribution 4.0 License.
the Creative Commons Attribution 4.0 License.
 | 06 Aug 2025
Zircon micro-inclusions as an obstacle for in situ garnet U–Pb geochronology: an example from the As Sifah eclogite locality, Oman
Jesse B. Walters
Joshua M. Garber
Aratz Beranoaguirre
Leo J. Millonig
Axel Gerdes
Tobias Grützner
Horst R. Marschall
Garnet is commonly used to calculate pressure (P)–temperature (T) histories of metamorphic rocks, as well as to monitor changes in bulk-rock composition (X) and deformation (d). In situ U–Pb geochronology by laser ablation–inductively coupled mass spectrometry (LA-ICPMS) is a rapid and relatively high spatial resolution technique, which can be used to constrain the timing of the metamorphic P–T–X–d histories preserved in garnet. However, the low U contents (low µg g−1 to ng g−1 levels) of most common metamorphic garnet crystals present unique analytical challenges, including potential contamination of the U–Pb system by high-U inclusions, such as zircon, rutile, monazite, and apatite. Here we use laser ablation split-stream (LASS) ICPMS (LASS-ICPMS) analysis to simultaneously measure the U, Th, and Pb isotopes and trace-element contents of eclogite-facies garnet from metamafic rocks at As Sifah, Oman. We observe abundant zircon micro-inclusions (<2 µm) in all five dated samples. Strong linear correlations in U vs. Zr contents in the analysed laser ablation spots plot along garnet–zircon mixing lines, the slopes of which can only be explained by zircon contamination. Despite clear zircon contamination in the trace-element data, the time-resolved laser ablation U and Pb signals show some irregularities but lack sharp diagnostic spikes typically indicative of inclusions. Instead, zircon micro-inclusions are sufficiently small, abundant, and dispersed over the scale of the laser spot site (193 µm diameter) such that their contributions to the U, Th, and Pb signals are diluted to produce irregular time-resolved signals that have previously not been identified as inclusions.
Analyses affected by contamination result in well-defined U–Pb regression lines that give concordia intercept dates of 94–89 Ma. After screening, only one sample had sufficient inclusion-free analyses and spread in U–Pb ratios to calculate a statistically meaningful garnet U–Pb date. The calculated concordia intercept date of 71±7 Ma is consistent within uncertainty of previously published garnet–whole-rock Sm–Nd peak metamorphic ages. We suggest that the 94–89 Ma ages represent the growth of micro-zircons produced during low-grade metamorphism or hydrothermal alteration of the mafic tuff protolith during the submergence of and sediment deposition on the Arabian margin at this time. To obviate the effect of micro-inclusions in garnet LA-ICPMS U–Pb geochronology, we recommend a careful examination of garnet grains by electron microscopy prior to analysis and determination of background garnet U, Th, and Pb contents and ThU combined with the rejection of analyses with even slight or moderately irregular signals. We also demonstrate that LASS-ICPMS is a powerful tool to screen for inclusion contamination for in situ U–Pb garnet geochronology, providing confidence in the geologic meaning of the resulting ages.
- Article
(11818 KB) - Full-text XML
-
Supplement
(2345 KB) - BibTeX
- EndNote


Garnet is a common rock-forming mineral in igneous and metamorphic rocks. As garnet regularly preserves compositional zoning, overprints or develops static and dynamic microstructures, and participates in numerous cation-exchange and net-transfer reactions, it is often used to constrain pressure (P), temperature (T), chemical (X), and deformation (d) histories of rocks in a large range of tectonic settings (see review in Caddick and Kohn, 2013). Linking these changes in P–T–X–d to time is required to constrain the rates and mechanisms of geological processes, as well as their broader context in the geological timeline. The U(–Th)–Pb decay system has a long-half life, well-characterised decay constants, and was the first decay system to be used in geochronology; as a result, it is one of the most regularly applied systems in geochronology (see review in Mattinson, 2013). Contemporary U–Th–Pb geochronology has focused on accessory phases, such as zircon, monazite, xenotime, baddeleyite, and titanite, which contain high contents of radioactive parent isotopes (e.g. U, Th) and high parent / child ratios. Dates of these phases are linked to P–T–X–d histories through textural and chemical criteria. For example, depleted heavy rare earth (HREE) element plus Y contents in metamorphic zircon and monazite are often interpreted to result from inter-mineral partitioning with co-crystallising garnet (e.g. Pyle and Spear, 1999; Rubatto, 2002; Gibson et al., 2004). Zircon and monazite are predicted to dissolve during prograde to peak thermal metamorphism through a combination of increasing Zr solubility in major minerals, such as garnet, and dissolution of both zircon and monazite into silicate melts during anatexis (e.g. Pyle and Spear, 2003; Corrie and Kohn, 2011; Kohn et al., 2015; Yakymchuk, 2023). Thus, accessory-phase geochronology may access only fragments of the record preserved in more complexly zoned minerals, like garnet, that grow over a wider range of P–T–X–d conditions.
Direct dating of garnet provides a direct link between isotopic dates and the P–T–X–d history recorded by garnet (Baxter et al., 2017). Garnet geochronology was first conducted by van Breeman and Hawkesworth (1980) utilising the Sm–Nd decay system by isotope dilution-thermal ionisation mass spectrometry (ID-TIMS). Both Sm–Nd and Lu–Hf garnet analyses have also utilised isotope-dilution multi-collector inductively coupled plasma mass spectrometry (ID-MC-ICPMS) (e.g. Blichert-Toft et al., 1997). Early studies were hampered by contamination of garnet by micro-inclusions, the need for analysis of co-genetic phases to anchor the isochron, sample size limitations, and a long and laborious analytical process (see review in Baxter et al., 2017). Modern Sm–Nd and Lu–Hf garnet geochronology has reduced sample size limitations, allowing for sampling of individual zones by micro-drilling (e.g. Christensen et al., 1989; Pollington and Baxter, 2010; Nesheim et al., 2012) and laser milling (Tual et al., 2022). Additionally, chemical pre-treatment of garnet to dissolve micro-inclusions can largely eliminate the effect of contamination (e.g. DeWolf et al., 1996; Scherer et al., 2000). However, weeks of preparatory work are required for a single isochron date, and sampling of garnet zones is only possible on the scale of millimetres (laser milling) to centimetres (microdrilling), resulting in relatively few data compared to accessory-phase geochronology. In contrast, in situ analysis by laser ablation–inductively coupled mass spectrometry (LA-ICPMS) offers a rapid alternative to ID-TIMS and ID-MC-ICPMS garnet geochronology with relatively little sample preparation. Several isotopic systems can be analysed in situ in garnet; some (e.g. Lu–Hf) require in-line separation using modern collision-cell technology (e.g. Simpson et al., 2021; Tamblyn et al., 2022;), whereas U–Pb geochronology can be performed on a standard single-collector (e.g. Seman et al., 2017; Yang et al., 2018; Millonig et al., 2020; O'Sullivan et al., 2023) or multi-collector ICPMS instrument (Shu et al., 2024; Bartoli et al., 2024). However, the potential influence of inclusion contamination on the dates must be thoroughly investigated.
Uranium–lead garnet geochronology was first applied by Mezger et al. (1989), using ID-TIMS analysis of the U–Pb system in almandine–pyrope series regional metamorphic garnet; however, DeWolf et al. (1996) reassessed these data and concluded that nearly all the measured U (0.05–2 µg g−1) in the garnet aliquots was contributed by inclusions. Indeed, other authors have explicitly used ID-TIMS dating of U-bearing inclusions in garnet to obtain accessory-phase crystallisation dates (e.g. Lima et al., 2012). In situ U–Pb garnet geochronology by LA-ICPMS was first conducted by Seman et al. (2017) on grossular–andradite series skarn garnet, which may contain µg g−1 levels of U (e.g. DeWolf et al., 1996; Seman et al., 2017; Wafforn et al., 2018; Burisch et al., 2019, 2023). The sample mass used for ID-TIMS analysis by Mezger et al. (1989) and DeWolf et al. (1996) was on the order of 10–100 mg, whereas 0.3–1.3 mg of garnet was micro-milled by Beno et al. (2024) for U–Pb ID-TIMS geochronology. In contrast, the LA-ICPMS technique samples a much smaller mass of garnet (<3 µg). Due to the analytical difficulties of measuring low U contents in situ, only recently has the LA-ICPMS approach been applied to almandine–pyrope garnet (e.g. Millonig et al., 2020; Schannor et al., 2021; Mark et al., 2023; O'Sullivan et al., 2023; Bartoli et al., 2024; and Shu et al., 2024).
U–Pb analyses on regional metamorphic garnet with U contents of by LA-ICPMS were conducted by Millonig et al. (2020), and the effects of U-rich inclusions on garnet U–Pb data through microbeam sampling of inclusions and garnet host, grain size analysis of inclusions, and calculation of the impact of inclusions on U contents measured in garnet were investigated. They suggested that U-rich inclusions may be identified by examining the time-resolved U signal, ThU ratios, and data plotted on the Terra-Wasserburg diagram, where inclusions older or younger than the garnet would fall to the left or right of the regression line between common and radiogenic Pb, respectively. Similarly, Ceccato et al. (2024) conducted garnet U–Pb analyses and observed that analyses with Zr contents gave an older age (ca. 128 Ma) relative to low Zr analyses (34 Ma) in one sample. They suggested that the high Zr analyses represented the co-ablation of zircon micro-inclusions that were not observed optically or at the surface by scanning electron microscopy.
The large-diameter (150–200 µm) spot sizes used to achieve sufficient U and Pb signals for LA-ICPMS analyses make it difficult to avoid micro-inclusions. For example, monitoring of Zr in time-resolved signals for Lu–Hf geochronology by LA-ICPMS, using up to 120 µm diameter spot sizes, revealed outliers resulting from the contribution of Hf from co-ablated zircons (Simpson et al., 2021; Tamblyn et al., 2022). Small inclusions (i.e. <5 µm) may not be clearly visible in optical microscopy or when setting spots. If such inclusions are sufficiently abundant and garnet U contents sufficiently low, the U signal may be theoretically dominated by inclusions without sharp discrete spikes in the time-resolved U signal. Such time-resolved signals may appear irregular but may not necessarily be distinct from other signal irregularities (e.g. zoning). At such low U contents in the host garnet, the regression line may be defined entirely by mixing between inclusions and host. If the inclusions are mostly cogenetic, then the regression line will be narrowly defined and may appear to reflect a garnet date unless more carefully examined. For example, Peillod et al. (2024) found that U-rich inclusions at high 238U206Pb and low 207Pb206Pb plotted along the same regression line as the garnet. As these inclusions are likely coeval, the authors included these data in their regression to improve the resolution of the concordia intercept age. Similarly, Hollinetz et al. (2022) interpreted ages calculated by bulk U–Pb geochronology LA-ICPMS analysis of zircon inclusions in chloritoid to reflect the timing of chloritoid growth during prograde metamorphism.
Here we analysed ultra-low U garnet () from the As Sifah eclogite locality, Oman, by laser ablation split-stream (LASS) ICPMS for simultaneous high-sensitivity analysis of U and Pb isotopes and trace elements. We found that despite the presence of statistically robust regression lines () and reproducible dates (89–94 Ma) among different samples, these data almost entirely reflect contamination by abundant zircon micro-inclusions (<2 µm diameter). Incorporation of zircon inclusions elevates measured U contents from in clean garnet to 0.01–2.00 µg g−1, resulting in data, which define linear mixing lines in Zr–U space between garnet and zircon. The calculated dates are 10–15 Myr older than the 81–77 Ma age of eclogite-facies metamorphism calculated by previous studies using Sm–Nd garnet, U–Pb zircon, U–Pb rutile, and Rb–Sr white-mica geochronology and are inconsistent with existing tectonic models for the timing of the high-P stage of subduction metamorphism. These data demonstrate the utility of combining simultaneous analysis of U and Pb isotopes and trace elements with detailed petrographic observations to assess garnet U–Pb geochronology by LA-ICPMS in samples where small or abundant inclusions are suspected. Therefore, the presence of inclusions must be rigorously scrutinised before assigning geological meaning to U–Pb dates of metamorphic garnet, and we provide recommendations for the screening of inclusion contamination.
A suite of high-pressure low-temperature (HP–LT) metasedimentary and metavolcanic rocks crop out within the Saih Hatat tectonic window, which is exposed structurally beneath the obducted Samail ophiolite in NE Oman (e.g. Goffé et al., 1988; El-Shazly et al., 1990; Searle et al., 1994, 2004; Miller et al., 2002; Hansman et al., 2021). Units within the Saih Hatat window have been correlated with Precambrian to Cretaceous continental margin rocks elsewhere in Oman (e.g. the Jebel Akhdar) (Mann and Hanna, 1990; Searle et al., 2004; Chauvet et al., 2009) and thus represent the most deeply subducted and exhumed portion of the Arabian continental margin (see, although, Zuccari et al., 2023). The highest-grade rocks in the Saih Hatat occur in two shear-zone bounded exposures: (i) the Hulw window, which preserves rocks metamorphosed to blueschist-facies conditions, and (ii) the As Sifah window, which contains structurally lower rocks metamorphosed to eclogite-facies conditions (Fig. 1b). Mafic eclogites (with subsidiary felsic eclogites) occur as boudinaged lenses bounded by metacarbonate and carbonate-silicate schist and are exposed along the shoreline just north of the town of As Sifah. The eclogite-facies units in the As Sifah window have been correlated to their stratigraphic equivalents in the Hulw window, which were metamorphosed to lower P–T conditions (e.g. Miller et al., 2002). These metavolcanics are interpreted to represent metamorphosed mafic to felsic tuffs emplaced during the late Carboniferous based on ca. 298 and 284–290 Ma U–Pb zircon protolith ages (Gray et al., 2005; Warren, 2004; Garber et al., 2021).
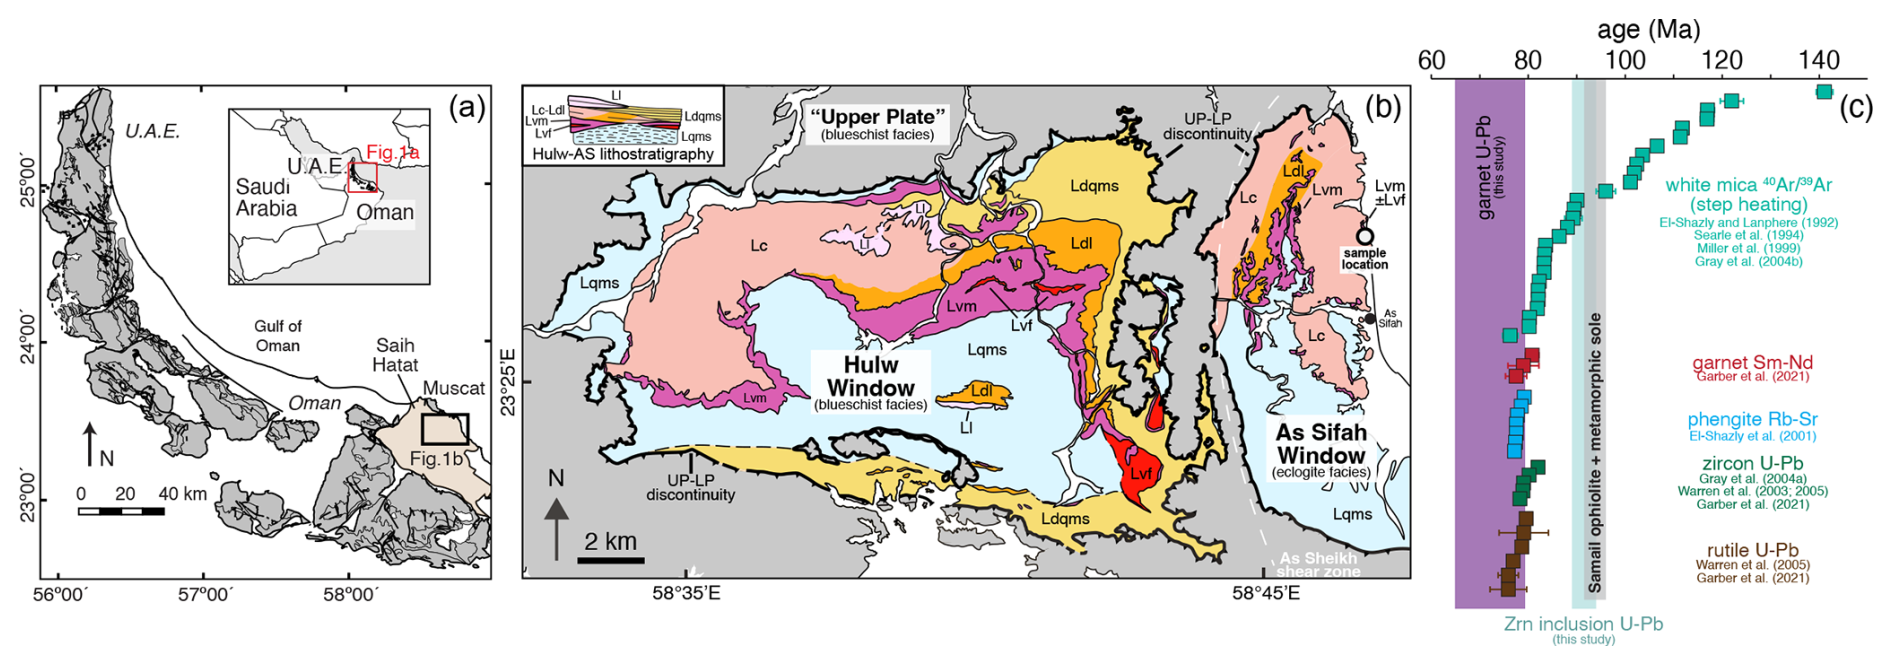
Figure 1(a) Regional overview map modified from Nicolas et al. (2000) showing the Samail ophiolite (dark grey) and subducted continental margin rocks of the Saih Hatat (light brown). (b) Lithologic map of the Hulw and As Sifah windows in the Saih Hatat, modified from Miller et al. (2002), Searle et al. (2004), and Warren and Miller (2007) (and lightly modified from Garber et al., 2021). The dominant structural feature is the “UP-LP” discontinuity (bold line), which separates “Upper Plate” rocks (dark grey) from “Lower Plate” units. The poorly exposed but structurally necessary “As Sheikh” ductile shear zone between the Hulw and As Sifah windows is shown by a dashed white line. Unit abbreviations: Lqms=lower-plate quartz-mica schist; Lvf=lower-plate felsic volcanic; Lvm=lower-plate mafic volcanic; Lc=lower-plate carbonate-silicate schist and quartz schist; Ldl=brown dolomite; Ldqms=dolomitic quartz-mica schist; Ll=Permian metacarbonate. The mafic-eclogite samples in this study are interpreted to be part of the “Lvm” and “Lvf” units exposed just north of the town of As Sifah. The inset stratigraphic sketch is modified from Miller et al. (2002); the Hulw and As Sifah windows are interpreted as stratigraphically correlative equivalents of the Ordovician (Lqms; Amdeh Fm.) to Permian (Lc-Ll; Saiq Fm.) Arabian continental margin sequence that is also exposed in the “Upper Plate” (e.g. Searle et al., 2004; Warren and Miller, 2007; Chauvet et al., 2009). (c) Previously published geochronology from the As Sifah eclogites, including the new U–Pb dates in this study. ArAr hornblende and U–Pb zircon geochronology from the overlying Samail ophiolite and metamorphic sole is shown as a grey bar (dates from Hacker et al., 1996; Warren et al., 2005; Rioux et al., 2012, 2013, 2016, 2021, 2023). Where not visible, error bars on dates are smaller than symbols. See text for additional discussion.
Previous studies have constrained peak eclogite-facies P–T conditions in the As Sifah eclogites to 2.0–2.5 GPa at ∼550 °C through a combination of garnet–clinopyroxene–phengite thermobarometry, Si-in-phengite barometry, and equilibrium thermodynamic modelling (Searle et al., 1994; Warren and Waters, 2006; Massonne et al., 2013), whereas El-Shazly (2001) suggested significantly lower pressures (<1.6 GPa). The As Sifah eclogites are thought to have undergone metamorphism along a single clockwise P–T path along a “cold” subduction geothermal gradient (El-Shazly et al., 1990; Warren and Waters, 2006; Garber et al., 2021), as evidenced by pseudomorphs after lawsonite and inclusions of chloritoid preserved in garnet from some lithologies (e.g. Fig. 2). Eclogite-facies assemblages were partially hydrated at high P, with retrograde phengite and amphibole overprinting peak garnet and omphacite, and variably overprinted at greenschist facies conditions by the assemblage epidote + albite + chlorite + calcic amphibole + hematite + carbonate + titanite (e.g. El-Shazly et al., 1990; Massonne et al., 2013; Garber et al., 2021).
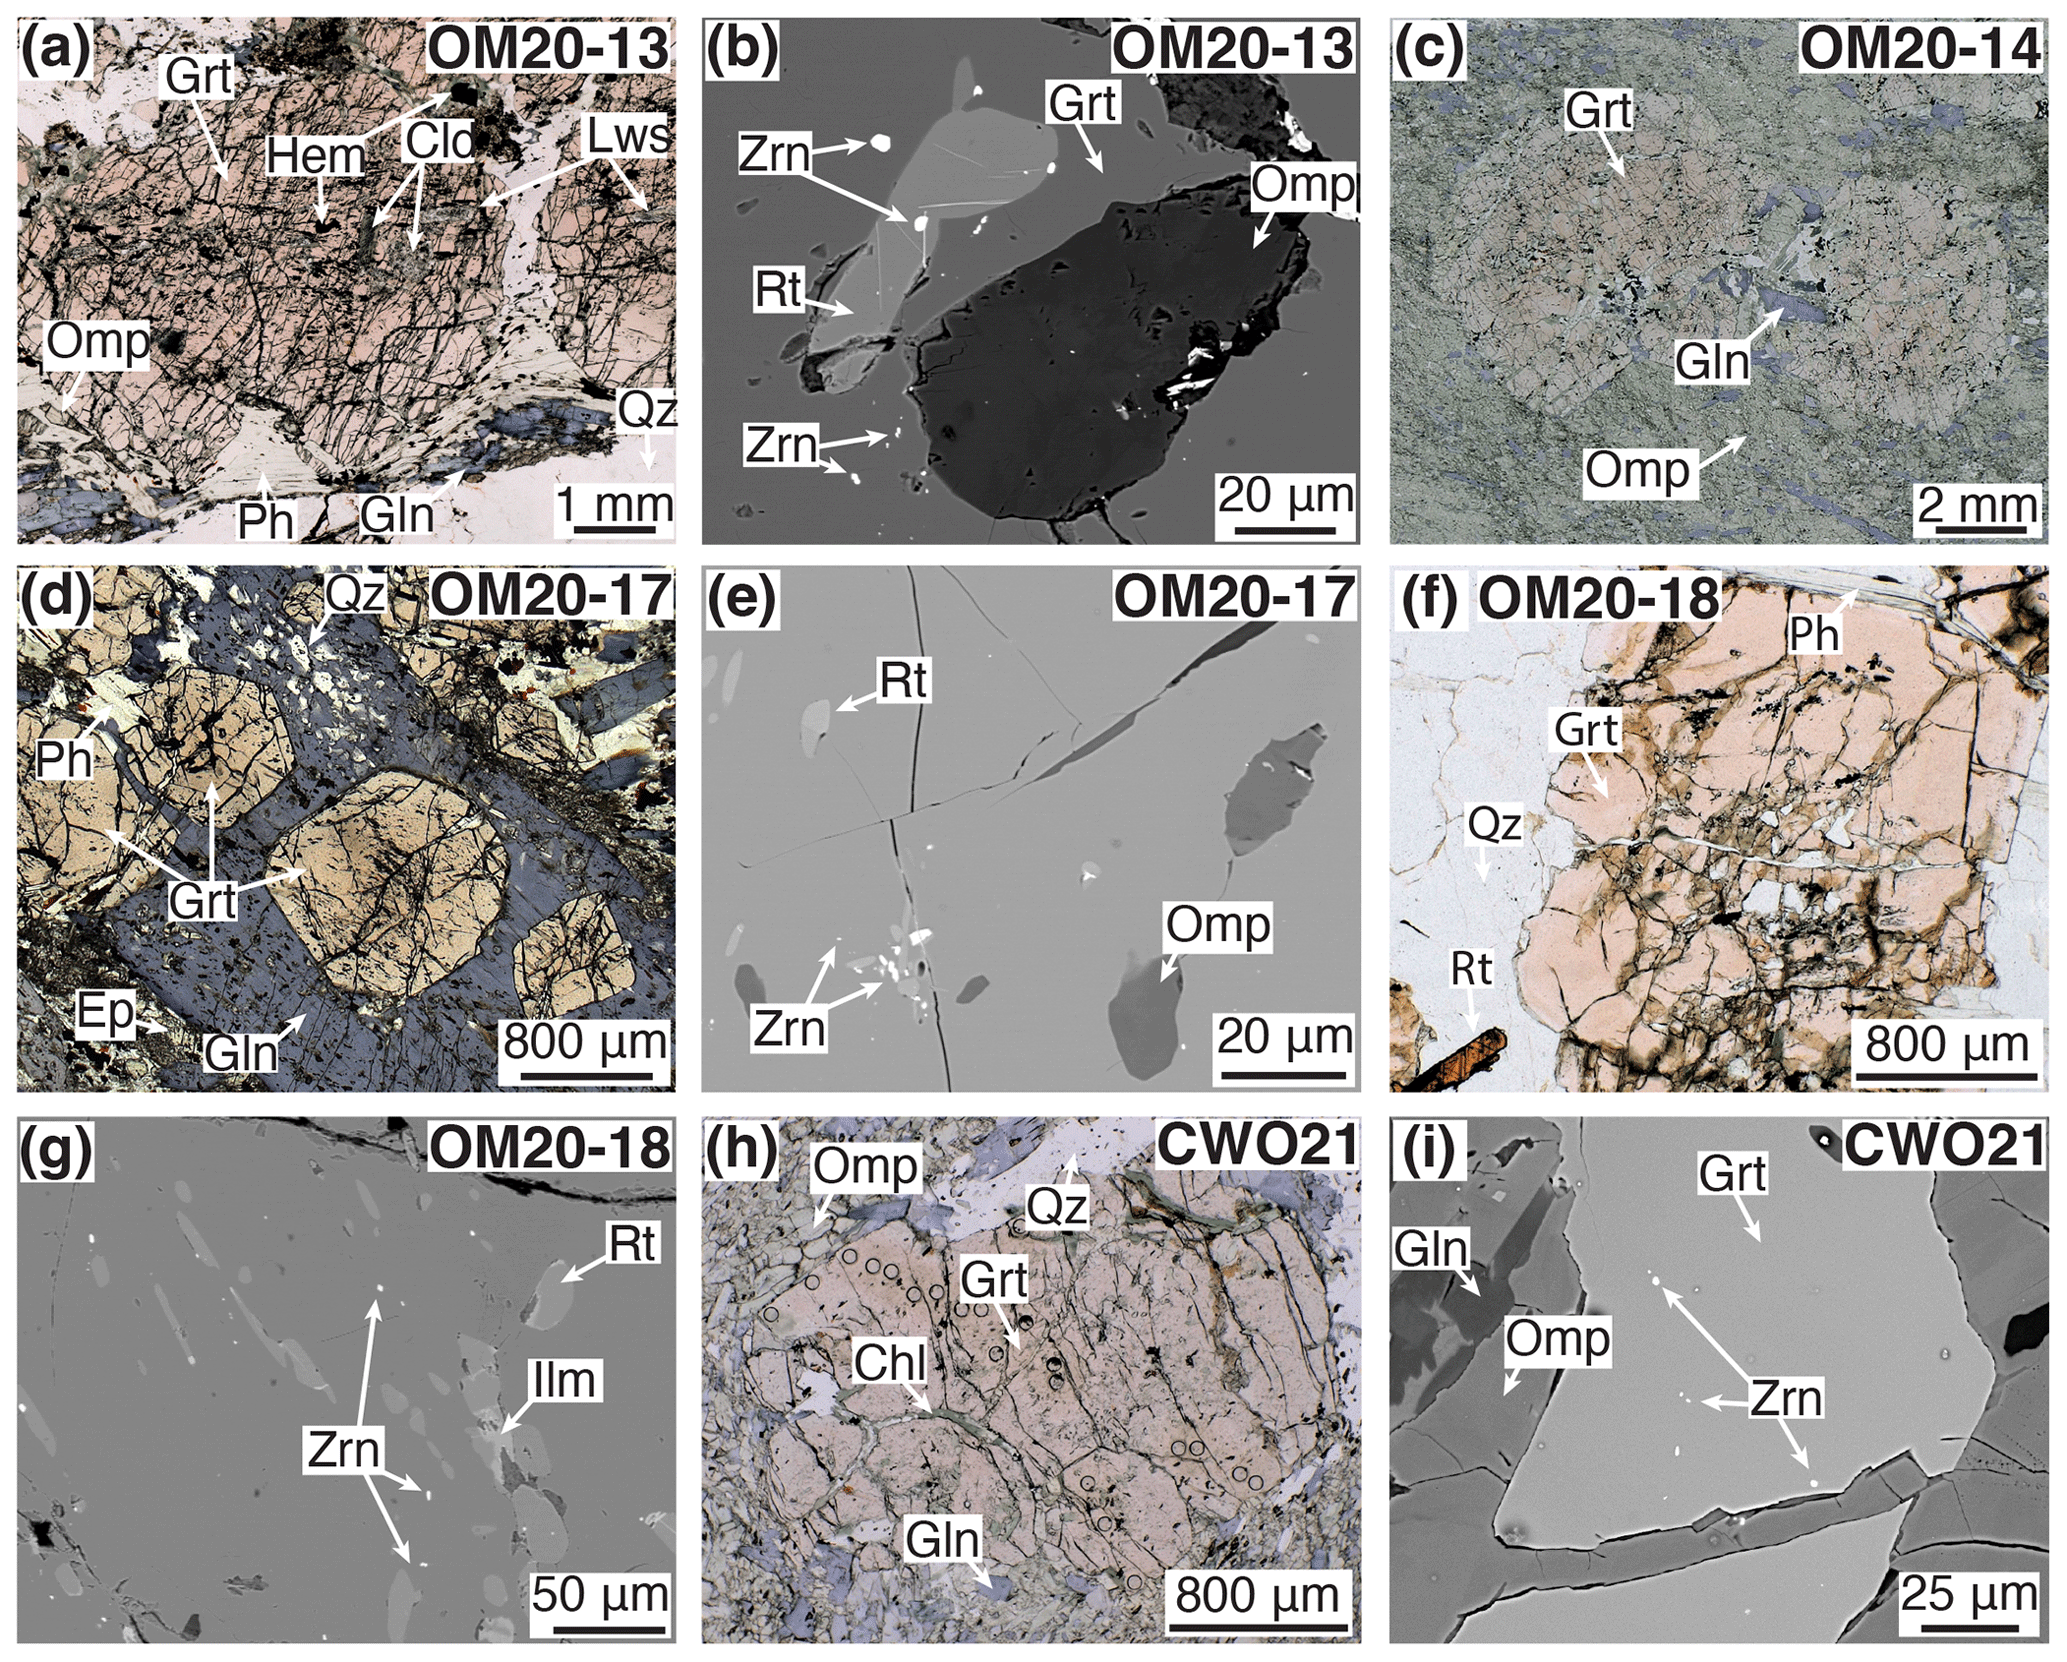
Figure 2Transmitted optical light (a, c, d, f, h) and backscattered electron (b, e, g, i) images of the studied samples. (a, b) Garnet porphyroblast with inclusions of omphacite, chloritoid, Ti-hematite, rutile, zircon, and pseudomorphs after lawsonite in a quartz and glaucophane-rich banded eclogite (OM20-13). (c) Garnet porphyroblasts in an omphacite-rich eclogite with minor retrograde glaucophane (OM20-14). (d) Retrogressed eclogite with large millimetre-scale glaucophane grains overgrowing peak metamorphic garnet with phengite and epidote in the matrix (OM20-17). (e) Omphacite, rutile, and zircon inclusions in garnet from OM20-17. (f, g) Garnet porphyroblast with inclusions of quartz, rutile, ilmenite, and zircon in a quartz–garnet segregation with minor phengite (OM20-18). (h) Garnet porphyroblast with omphacite, quartz, and retrograde glaucophane and chlorite in eclogite CWO21. (i) Backscattered electron image with micro-zircon inclusions in garnet in sample CWO21 from Warren (2004). Mineral abbreviations after Warr (2021).
Extensive geochronological studies have been conducted at As Sifah (Fig. 1c), leading to myriad hypotheses for the age and tectonic configurations leading to HP–LT metamorphism. Uranium–lead zircon and rutile geochronology on mafic eclogites conducted by TIMS resulted in dates of 79–78 Ma (Warren et al., 2003, 2005), which was suggested to represent the timing of a single eclogite-facies metamorphic event based on abundant zircon and rutile inclusions in both garnet and omphacite as well as in the matrix. Gray et al. (2004a) subsequently conducted Sm–Nd garnet–whole-rock isochron geochronology and obtained dates of 110±9 and 109±13 Ma, which were interpreted to represent the timing of peak eclogite-facies metamorphism, with the <80 Ma U–Pb zircon and rutile dates interpreted as relating to late exhumation. These older dates were nominally supported by numerous K–Ar and 40Ar39Ar step-heating white mica dates spanning 140–80 Ma that were reported by several studies (Montigny et al., 1988; El-Shazly and Lanphere, 1992; Searle et al., 1994; Miller et al., 1999; Gray et al., 2004b), leading some authors to infer distinct HP–LT metamorphic events at 130–110 and 80 Ma. However, El-Shazly et al. (2001) measured several ca. 80 Ma Rb–Sr isochron dates from As Sifah micas and suggested that >80 Ma K–Ar and 40Ar39Ar dates were the result of inherited non-radiogenic excess Ar (Kelley, 2002). This latter interpretation is supported by the direct observation of extensive excess Ar by high-precision laser 40Ar39Ar dating of individual micas from As Sifah (Warren et al., 2011), which is consistent with the derivation of excess Ar from trapped pore fluids during devolatilisation (Smye et al., 2013). Recently, Garber et al. (2021) determined new Sm–Nd garnet–whole-rock ID-TIMS dates from multiple As Sifah lithologies and obtained 81–77 Ma dates with internally consistent εNd intercepts, as well as providing additional U–Pb zircon (80–78 Ma) and rutile (80–76 Ma) dates that are consistent with previous U–Pb geochronology. A comparison between the Garber et al. (2021) and Gray et al. (2004a) Sm–Nd data showed that the earlier determined ∼110 Ma dates most likely represent mixing lines rather than isochrons. These recent studies demonstrate that some previously published K–Ar, 40Ar39Ar, and Sm–Nd dates from As Sifah are not geologically meaningful and that the As Sifah rocks achieved peak metamorphic conditions only after ∼81 Ma.
Along with structural data, these disparate dates from different studies have led to greatly contrasting tectonic interpretations. The Samail ophiolite, a relatively intact segment of obducted upper oceanic lithosphere, is thought to have initially crystallised between 96.2 and 95.7 Ma based on high-precision ID-TIMS zircon U–Pb geochronology (Rioux et al., 2012, 2013, 2021). The metamorphic sole welded to the base of the ophiolite – thought to have formed during the initial stage of Samail ophiolite obduction – consists of metasediments and metabasalts metamorphosed to granulite facies conditions of 700–900 °C and 0.8–1.4 GPa (Ghent and Stout, 1981; Gnos, 1998; Hacker and Mosenfelder, 1996; Searle and Cox, 2002; Cowan et al., 2014; Soret et al., 2017; Ambrose et al., 2021). Though there is disagreement based on recently published, disparate Lu–Hf garnet dates (e.g. Guilmette et al., 2018), the timing of high-grade metamorphism as dated by high-precision U–Pb zircon and hornblende 40Ar39Ar geochronology is coeval with or at most <500 kyr prior to the formation of the ophiolite crust (Hacker et al., 1996; Warren et al., 2005, Rioux et al., 2016, 2023). The spatial and temporal correlation of ophiolite and sole formation has been used to construct a tectonic model in which subduction initiation occurred simultaneously with the formation of the ophiolite crust in a suprasubduction zone setting (Searle and Cox, 2002; Cowan et al., 2014; Soret et al., 2017; Kotowski et al., 2021), consistent with the magmatic compositional evolution of the ophiolite itself (e.g. Pearce et al., 1981; Ishikawa et al., 2002; Kusano et al., 2017; Belgrano and Diamond, 2019; Rioux et al., 2021). This interpretation, however, results in strongly contrasting thermal regimes between the granulite facies rocks of the metamorphic sole and far cooler blueschist and lawsonite eclogites of the Saih Hatat, which were only separated in time by ∼15 Myr. The simplest kinematic explanation is a single subduction system, starting with high-T conditions during subduction initiation below the ophiolite crust at 96–95 Ma, followed by relaxing of the geothermal gradient for ∼10 Myr until subduction of the Arabian continental margin at lawsonite–eclogite-facies conditions at ca. 80 Ma, coincident with the final emplacement of the Samail ophiolite (e.g. El-Shazly et al., 2001; Searle et al., 1994; Warren et al., 2003; Agard et al., 2010; Duretz et al., 2016; Garber et al., 2021). This interpretation is further consistent with biostratigraphic constraints for the initial timing of the drowning of the Arabian passive margin, at ∼94 Ma (Robertson, 1987). In contrast, studies which support an older age or protracted HP–LT metamorphism have invoked multiple subduction zones operating simultaneously to account for the vastly different thermal regimes between the HT metamorphic sole rocks and the LT Saih Hatat rocks (e.g. Gray et al., 2004a, b; Goscombe et al., 2020; Ring et al., 2024). Additional geochronological constraints may help differentiate a geologically accurate tectonic model for HP–LT metamorphism and ophiolite obduction and was the motivation behind this study.
Five samples of mafic to felsic eclogite with varying mineralogical composition were selected for analysis. Four were collected from Oman in March 2020 (OM20-13, OM20-14, OM20-17, and OM20-18), whereas the fifth (CWO21) was previously characterised and dated by Warren et al. (2003, 2005) and Garber et al. (2021). The samples all exhibit the peak metamorphic assemblage of garnet + omphacite + rutile ± quartz, as described by previous authors (e.g. Fig. 2), but with varying proportions of these phases: samples OM20-14 and CWO21 have high proportions of omphacite (Fig. 2c and h), whereas sample OM20-18 is a felsic high-P rock with garnet + quartz + minor phengite and no omphacite (Fig. 2f). Garnet grains in sample OM20-13 contain an inclusion assemblage of chloritoid, clinozoisite + paragonite after lawsonite, and titanohematite (Fig. 2a), whereas garnet in other samples includes only the peak metamorphic assemblage. Samples are variably retrogressed to both the blueschist-facies (especially phengite + glaucophane–riebeckite) and greenschist-facies assemblages. In sample OM20-13, omphacite is rarely observed, and oriented phengite and glaucophane overgrow the peak assemblage (Fig. 2a). In sample OM20-17, garnet grains are completely encased in centimetre-scale blades of glaucophane, and matrix omphacite is largely replaced by a fine-grained symplectite (Fig. 2d). Retrograde glaucophane is observed in OM20-14 and, to a lesser extent, in CWO21. Garnet grains are highly fractured in all samples, with chlorite + hematite occurring within some fractures.
Accessory phases are abundant in all samples. The inclusions in garnet in OM20-13 evolve from titanohematite (with ilmenite exsolution) in the core to rutile in the rim, suggesting a prograde partitioning of Fe3+ into aegirine and Ti into rutile. The other samples only contain rutile or rutile + ilmenite (among the Ti minerals) as inclusions in garnet and in the matrix. A second generation of hematite with square-shaped to bladed habits is observed in the matrix and in fractures in garnet, associated with carbonate, chlorite, and fine-grained symplectites. Frequent zircon micro-inclusions ( diameter) are visually observed primarily as inclusions in garnet in all five samples (Fig. 2), where sample OM20-18 was qualitatively observed to have the fewest inclusions overall.
4.1 Sample preparation
Four samples (OM20-samples) were prepared as ∼100 µm thick polished sections, whereas CWO21 was polished to the standard thickness (30 µm). The sections were examined petrographically and imaged by optical microscopy using a petrographic microscope, as well as a Keyence VHX-6000 digital microscope for full-section transmitted light scans.
4.2 Electron probe microanalysis
Electron probe microanalysis (EPMA) of garnet was conducted at Goethe University Frankfurt (GUF) using a JXA-8530F Plus Hyperprobe field-emission EPMA equipped with five WDS-carrying standard-type as well as H- and L-type spectrometer crystals. Prior to analysis, backscattered electron imaging and phase confirmation by energy-dispersive spectroscopy was conducted. Operating conditions for quantitative WDS analysis were a 15 kV accelerating voltage, 20 nA beam current, and a 3 µm spot size. Elements analysed were Si, Ti, Al, Cr, Fe, Mn, Mg, Ni, Ca, Na, K, and P. On-peak counting times of 20 s (10 s background) were used for all elements. Natural and synthetic reference materials used for calibration were albite (Na), forsterite (Mg), fayalite (Fe), wollastonite (Ca, Si), pyrophanite (Mn), Cr2O3 (Cr), Al2O3 (Al), and KTiOPO4 (Ti, K, P). Garnet structural formulae were calculated and endmember fractions plotted using MinPlotX (Walters, 2022; Walters and Gies, 2025). All EPMA data are reported in Table S1, and garnet transects are plotted in Fig. S1 in the Supplement. Garnet grains from samples OM20-14 and CWO21 were not analysed by EPMA.
4.3 LASS-ICPMS garnet analysis
Laser ablation split-stream inductively coupled plasma mass spectrometry (LASS-ICPMS) analyses were performed during two sessions at the Frankfurt Isotope and Element Research Center (FIERCE), GUF. Ablation was performed using a RESOLUTION-LR (Resonetics) 193 nm ArF Excimer laser (Compex Pro 102, Coherent) equipped with a two-volume (Laurin Technic S155) ablation cell. A spot size of 193 µm diameter (round) was used for all analyses. A fluence of at 12 Hz was used, with a resulting ablation rate of . Acquisition of 18 s of background and 18 s of ablation was conducted following four laser pulses to prepare and clean the sample surface. Prior to LASS-ICPMS analysis, transmitted light optical microscopy and BSE imaging were used to preselect locations of apparently inclusion-free garnet domains.
Simultaneous analyses of U–Pb isotopic ratios and trace-element contents were measured by splitting the ablation stream between two mass spectrometers following the protocol of Shu et al. (2024). Approximately 80 % of the volume was sent to a Thermo Scientific Neptune Plus sector-field multi-collector ICPMS for U–Pb isotopic analysis, whereas the remaining 20 % was diverted to a Thermo Scientific Element-XR sector-field ICPMS for trace-element analysis. For U–Pb analysis, 206Pb, 207Pb, and 208Pb were measured using secondary-electron multipliers, whereas 232Th and 238U were measured on Faraday cups, whose amplifiers are equipped with 1013 Ω resistors. We do not analyse 204Pb due to anticipated high initial Pb and instead calculate the “common Pb” contribution to Pb isotopic composition using the Tera-Wasserburg approach (see below). Signal strength was tuned for maximum sensitivity while maintaining an oxide formation of ∼0.5 % UO+U+ and low interelement fractionation (monitored using by tuning to achieve a ThU ratio of ∼0.9 for NIST-SRM614). The calibration strategy for U–Pb analyses includes the soda–lime glass NIST-SRM614 as the primary reference material (reference values from Jochum et al., 2011) to correct for instrumental drift, mass bias, and inter-element fractionation. A Mali garnet reference material (202.0±1.2 Ma, TIMS; Seman et al., 2017) was used to correct for the matrix offset between NIST glass and garnet. Secondary reference materials Lake Jaco Pink (34.0±1.4 Ma, LA-ICPMS; Seman et al., 2017) and an in-house garnet reference material (Pakistan3b; ca. 45 Ma) were also analysed to test for reproducibility. Additional analytical details are presented in Table S2A.
Raw data were processed and corrected offline using the in-house VBA spreadsheet program of Gerdes and Zeh (2006, 2009), which employs the algorithms of Ludwig (2012). A minor drift correction using NIST-SRM614 was also applied over each session using third-order (207Pb206Pb, 232Th238U) and fourth-order (206Pb238U) polynomial functions. Analyses of Mali garnet were used to calculate offset factors applied to 206Pb238U ratios, accounting for differences in ablation rates and composition between NIST-SRM614 and garnet. Calculated offset factors are 0.91 and 0.96 for Sessions 1 and 2, respectively. Data were used to define linear arrays in 207Pb206Pb vs. 238U206Pb space (Tera and Wasserburg, 1972) from which pooled lower-intercept concordia ages were calculated. The initial 207Pb206Pb, or “common Pb”, ratios are calculated as the y intercept of a linear regression of the data array and are not anchored for unknown samples, Lake Jaco Pink, and Pakistan3b. Following Horstwood et al. (2016), quoted age uncertainties (2 s absolute) include within-run precision, background, and excess variance (calculated from the primary reference material). An additional excess variance is calculated from the reproducibility of the offset reference material and added quadratically (see Table S2). Systematic uncertainties are reported as an expanded uncertainty, which considers the 206Pb238U ratio uncertainty of the Mali garnet reference material (1 %, 2 s), long-term reproducibility (1.5 %, 2 s), and decay-constant uncertainties. Measured dates of Lake Jaco Pink (36.6±1.4 and 35.7±1.4 Ma, 2 s) are within uncertainty of the LA-ICPMS age of 34.0±1.4 Ma by Seman et al. (2017). Additionally, the 45.4±0.8 Ma (2 s, both sessions) date of Pakistan3b is consistent with our long-term reproducibility for this secondary reference material. Tera-Wasserburg diagrams for secondary reference materials are shown in Fig. S2. These data suggest that dates are both precise and true relative to reference values and support high long-term reproducibility. The ablation rate of garnet is ∼ 50 % lower compared to the ablation rate of glass. To account for this effect, we apply an average pit-depth correction measured on garnets during previous sessions (see Millonig et al., 2020). Calculated total Pb considers both the radiogenic and common Pb.
Trace elements were measured simultaneously on the Element-XR ICPMS. Masses of 23Na, 25Mg, 27Al, 29Si, 43Ca, 44Ca, 45Sc, 49Ti, 51V, 53Cr, 55Mn, 57Fe, 59Co, 66Zn, 85Rb, 88Sr, 89Y, 90Zr, 93Nb, 133Cs, 137Ba, 139La, 140Ce, 141Pr, 146Nd, 147Sm, 151Eu, 157Gd, 159Tb, 161Dy, 165Ho, 167Er, 169Tm, 172Yb, 175Lu, 178Hf, 181Ta, 208Pb, 232Th, and 238U were analysed by peak jumping in pulse counting mode with a total time per cycle of 0.51 ms for 54 cycles (total acquisition time of 41.6 s). Data were processed using LADR (Norris and Danyushevsky, 2018) using 29Si as the internal reference isotope with Si measured by EPMA for OM20-13, OM20-17, and OM20-18. Garnet grains in OM20-14 and CWO21 were not analysed by EPMA, and the Si content of garnet measured by EPMA for OM20-13 was used for these analyses (see Table S3). Analysed reference materials include basalt glass BIR-1G (reference values from Jochum et al., 2006) and NIST-SRM614 (reference values from Jochum et al., 2011). BIR-1G has extremely low U and Th contents (0.023 and 0.030 µg g−1, respectively; see Table S3); therefore, we use NIST-SRM614 as the primary reference material and BIR-1G as the secondary reference for all masses with some exceptions. We found variable and/or low signals of masses of 25Mg, 45Sc, 49Ti, 53Cr, 55Mn, 57Fe, 59Co, 66Zn, and 90Zr for analyses of NIST-SRM614. For these elements we instead use BIR-1G as the primary reference material and NIST-SRM614 as the secondary reference material (see Table S3). Uncertainties are quoted as 2 s absolute and include background signal, peak signal, and reference material analysis uncertainty, as well as propagated systematic uncertainties in the published reference material values. Trace-element data are summarised in Table S3. All trace-element contents are within uncertainty of the GeoREM-preferred values. Note that total Pb is calculated as total common Pb from the 208Pb signal.
4.4 LA-ICPMS garnet trace-element analysis
After the split-stream analysis, new polished thick sections were prepared, and garnet grains in samples OM20-13, OM20-17, and OM20-18 were reanalysed for their trace elements by LA-ICPMS on the Element-XR using a 33 µm diameter spot size to better avoid micro-inclusions. Ablation was performed in a He atmosphere (0.3 L min−1) and mixed in the ablation funnel with 1.0 L min−1 Ar and 0.05 L min−1 N2. A fluence of at a repetition rate of 6 Hz was used. Acquisition of 20 s of background and 20 s of ablation followed four pulses of ablation to clean the sample surface. Further analytical details are provided in Table S4. Masses 23Na, 25Mg, 27Al, 29Si, 43Ca, 44Ca, 49Ti, 51V, 52Cr, 55Mn, 57Fe, 59Co, 60Ni, 66Zn, 88Sr, 89Y, 90Zr, 93Nb, 139La, 140Ce, 141Pr, 146Nd, 147Sm, 151Eu, 157Gd, 158Gd, 159Tb, 161Dy, 165Ho, 167Er, 169Tm, 172Yb, 175Lu, 178Hf, 181Ta, 206Pb, 208Pb, 232Th, and 238U were analysed by peak jumping in pulse counting mode with a total time per cycle of 1.007 s for 44 cycles (total acquisition time of 44.3 s). Basalt glass GSD-1G (reference values from Jochum et al., 2005) was used as the primary reference material, and basalt glass BIR-1G, basalt glass BCR-1, and soda–lime glass NIST-SRM612 (reference values from Pearce et al., 1997; Jochum et al., 2005, 2011) were used as the secondary reference materials. Trace-element data processing and uncertainty reporting are the same as above. Measured elemental contents are within uncertainty to the GeoREM preferred values (see Table S4). Total Pb is calculated the same as above.
4.5 LA-ICPMS garnet trace-element mapping
Laser ablation inductively coupled plasma mass spectrometry (LA-ICPMS) for trace elements was performed on garnet in sample CWO21 at the LionChron facility at The Pennsylvania State University, USA. Samples were ablated using a Teledyne/Photon Machines Analyte G2 excimer laser ablation system with a Helex2 ablation cell, coupled to a Thermo Scientific iCAP-RQ ICPMS system for trace elements. The total Ar gas flow for the experiment was 1.01 L min−1, with total He gas flows from the laser at 0.44 L min−1. The CWO21 garnet was run as a grid map in a single session, with a 20 µm square, 15 Hz repetition rate, 120 shots, and a laser fluence at the sample surface of for each pixel. The laser was first fired thrice for each pixel location to remove surface contamination; only short, 1–2 s pauses were run between each pixel, and reference material analyses and backgrounds were collected once every ∼200 unknowns. Analyses of unknowns were bracketed by analyses of whole-rock glasses Kilauea basalt KL2-G and Alpine quartz diorite T1G from the Max-Planck-Institut (reference values from Jochum et al., 2006), as well as NIST-SRM612 glass (reference values from Pearce et al., 1997; Jochum et al., 2011). KL2-G was used as the primary reference material for all analyses. For trace-element quantification, 27Al (assuming 11.0 wt % Al) was used as the internal reference isotope, with measured peaks on the iCAP-RQ at 7Li, 23Na, 24Mg, 27Al, 29Si, 31P, 43Ca, 45Sc, 49Ti, 51V, 52Cr, 55Mn, 57Fe, 88Sr, 89Y, 90Zr, 146Nd, 147Sm, 153Eu, 157Gd, 159Tb, 163Dy, 165Ho, 166Er, 169Tm, 172Yb, 175Lu, 178Hf, 208Pb, and 238U. Iolite version 4 (Paton et al., 2011) was used to correct measured isotopic ratios and elemental intensities for baselines, plasma-induced fractionation, and instrumental drift. The mean and standard error of the measured ratios of the backgrounds and peaks were calculated after rejection of outliers more than two standard errors beyond the mean. Using the same methods as applied to unknowns, this routine yielded values for T1G accurate to within 5 % for all elements except for Pb (10 %) and U (15 %). LA-ICPMS maps for all elements are presented in Fig. S3.
5.1 Characterisation of garnet compositional zoning and textures
Garnets in samples OM20-13, OM20-17, and CWO21 show bell-shaped major-element compositional patterns (Figs. 3a, S1, and S2), comparable to garnet compositional profiles reported in previous studies of blueschist and eclogite at As Sifah (Warren and Waters, 2006; Garber et al., 2021). In the EPMA transect of OM20-13, the almandine content decreases (XAlm=0.76–0.71) and pyrope content increases (XPrp=0.08–0.20) from core to rim (Fig. S1a). In OM20-17 the pyrope content also increases from core to rim (XPrp=0.04–0.22), but almandine increases from XAlm=0.53 in the core to 0.71 in the mantle and then decreases to 0.67 in the rim (Fig. S1b). Elemental LA-ICPMS maps of sample CWO21 similarly show a decrease in Fe and increase in Mg from garnet core to rim (Fig. S2). In contrast, garnet in OM20-18 displays oscillatory zoning in Fe, Mg, and Mn, where high Mg + Fe zones are balanced by low Mn. In all four samples, there is a general core to rim decrease in garnet Mn content (Figs. 3a and S1).
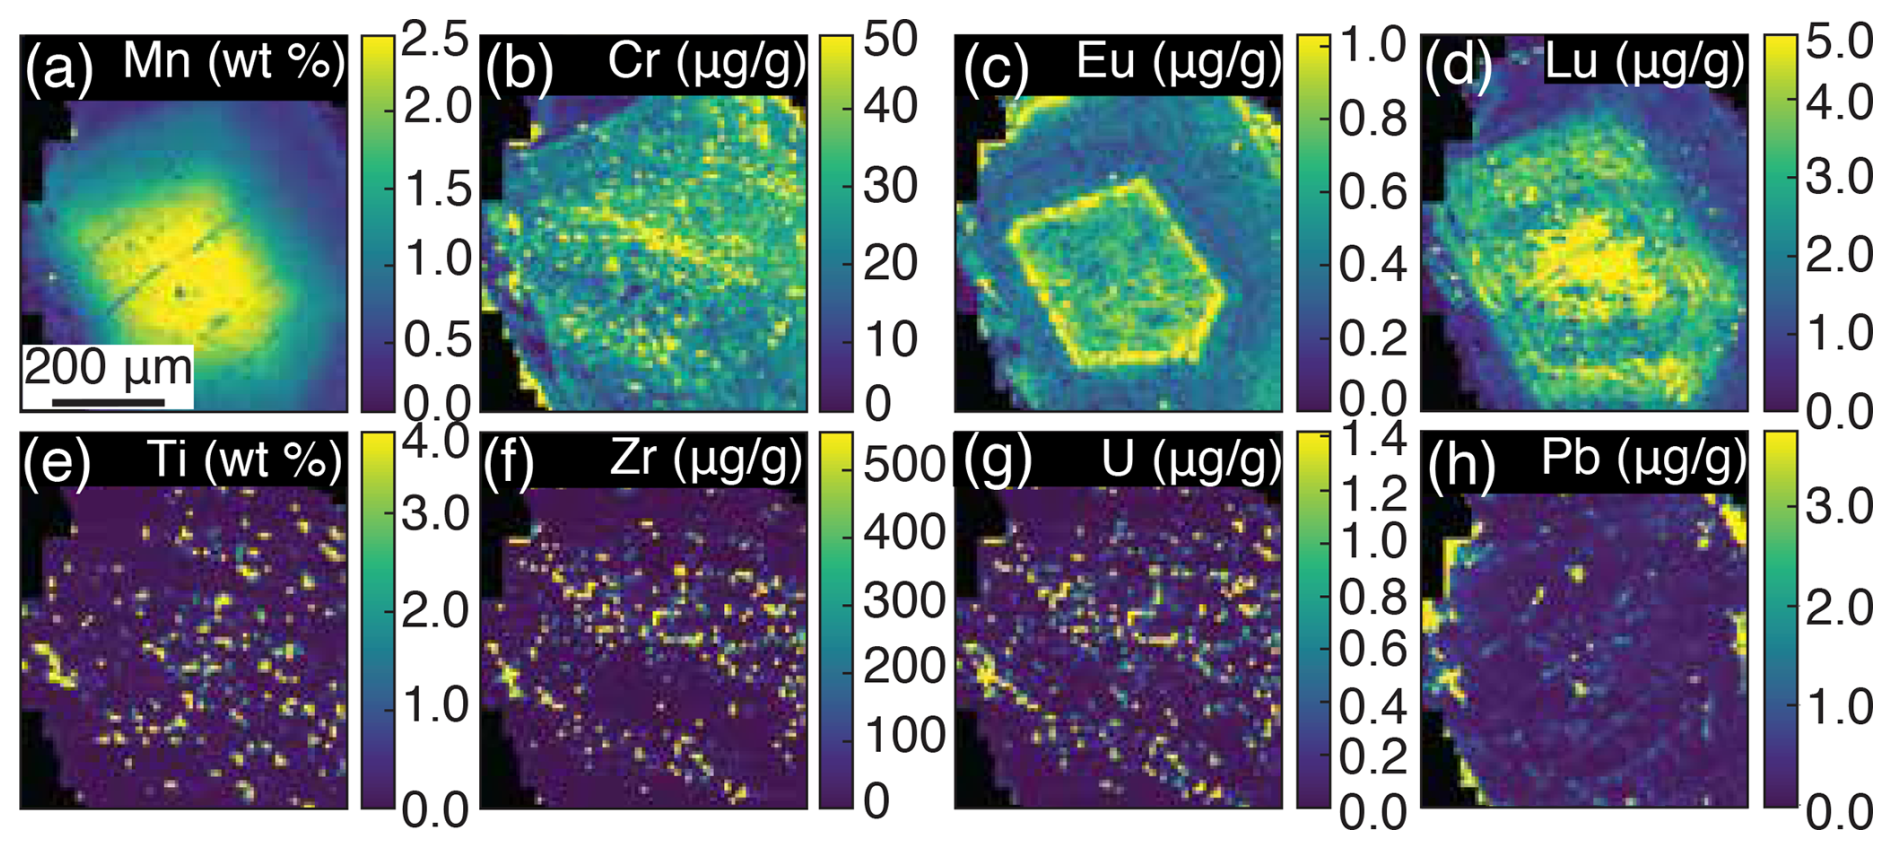
Figure 3LA-ICPMS minor- and trace-element maps of Mn (a), Cr (b), Eu (c), Lu (d), Ti (e), Zr (f), U (g), and Pb (h) in a garnet grain in sample CWO21. Each pixel is 20×20 µm2. High Pb regions at the edge of the garnet are the result of contamination by matrix phases, such as epidote, chlorite, and white mica.
Trace-element maps of CWO21 reveal complex zoning patterns. For example, Cr contents are relatively uniform throughout the mapped garnet (30–40 µg g−1), except for a portion of the rim in which the Cr content drops to (Fig. 3b). Middle REE, such as Eu, show relatively high contents in the core surrounded by a high-concentration annulus and lower contents in the mantle and rim (Fig. 3c). Complex oscillatory zoning is observed in Y + HREE, with uniformly high contents in the core followed by an oscillatory-zoned inner mantle and low Y + HREE contents in the outer mantle and rim (Fig. 3d). Maps of Ti, Zr, U, and Pb show that these elements are elevated only in inclusion phases, whereas uniformly low contents are observed in the background garnet except for Ti (Fig. 3e–h).
5.2 Concentrations of Zr, Ti, Nb, Ce, Th, U, and Pb in garnet
LA-ICPMS trace-element analyses with a smaller size of the laser spot (33 µm diameter) were collected to minimise potential inclusion contamination and measure “clean” garnet signals. These analyses were conducted separately, i.e. after the U–Pb analyses had been performed. Micro-inclusions of zircon, as well as abundant inclusions of rutile, Ti-hematite, and ilmenite were observed by optical microscopy, EPMA imaging, and LA-ICPMS mapping (Figs. 2 and 3). While analysis locations were pre-selected using optical and BSE imaging, the large volume of ablated material using the 193 µm diameter spot for U–Pb analysis requires careful consideration of potential inclusion contamination. We assess the minor- and trace-element results from the 33 µm diameter spot analyses to establish the background composition of uncontaminated garnet. An emphasis is placed on elements, which exhibit high contents in potential contaminant phases, such as Zr in zircon; Ti and Nb in rutile, ilmenite, and Ti-hematite; and Ce in allanite and monazite. We found that 33 µm diameter spot analyses are sufficiently small for inclusions to appear as sharp peaks in the time-resolved data while maintaining sufficiently low limits of detection.
Zircon is likely the most problematic contaminant phase, given the abundance of petrographically observed inclusions. Sharp spikes in laser ablation downhole Zr counts were observed for analyses of sample OM20-13 and OM20-17, such that analyses with sufficient stable-signal Zr are interpreted to be free from zircon contamination (see Table S4). In some cases, no spikes were observed, whereas the analytical window was restricted to the stable portions of the signal during data processing for other analyses. Measured background garnet Zr contents are 1.03–1.30, 0.72–0.78, and 0.32–0.86 µg g−1 in samples OM20-13, OM20-17, and OM20-18, respectively. These data contrast with the 3–4 orders of magnitude higher Zr contents measured in most LASS-ICPMS analyses (see below).
Measured Ti garnet contents show compositional ranges of 117–422 and 89–243 µg g−1 in samples OM20-13 and OM20-17, respectively. In sample OM20-18, a transect shows a decrease from 567 µg g−1 Ti in the core to 164 µg g−1 Ti in the rim. Therefore, variable Ti contents may correspond to real compositional zoning and not uniquely identify contamination by a Ti oxide phase. In contrast, garnet Nb contents range from below a detection limit of 8.9 ng g−1 to a maximum of 1.5 µg g−1. The transect in sample OM20-18 shows a core to rim decrease Nb from 1.00 µg g−1 to below detection, mirroring the zoning observed in Ti. Whereas Ti is a minor element in garnet, we show that Nb contents are consistently low in garnet but are likely much higher in Ti oxide phases. For example, Garber et al. (2021) measured Nb contents of rutile in the range 250–9000 µg g−1 from As Sifah eclogites. We calculate ratios on the order of 104−105 (or higher for garnet analyses below detection limits), whereas ratios are the order of 103. Therefore, Nb is a more sensitive indicator than Ti of contamination by Ti oxide phases.
Garnet Ce contents were below a calculated detection limit of 4.5 ng g−1 for most analyses not affected by zircon contamination, whereas spots with higher Zr also contain higher Ce (see below). In contrast, Garber et al. (2021) measured Ce contents of up to tens of micrograms per gram (µg g−1), which may reflect the influence of contaminant phases in their analyses.
Uranium, Th, and Pb contents in garnet are also low in all three samples. Measured background U contents range from 1–27 ng g−1, with large uncertainties of 30 %–60 % (2 s) due to low signal. Thorium contents range from below a detection limit of 0.3 to 30 ng g−1. Finally, Pb contents, calculated from the 208Pb signal, range from below a detection limit of 6.6 ng g−1 to a maximum of 0.17 µg g−1. Comparison of U, Th, and Pb contents measured on the Neptune Plus to contents of these elements measured using the Element-XR during LASS-ICPMS analyses shows a systematic offset from the 1:1 line (e.g. Fig. S4 for U), with calculated U, Th, and Pb contents higher in the Neptune Plus data compared to simultaneously collected using the Element-XR ICPMS. A larger offset is observed for Session 1 compared to Session 2, and the offset is highly sensitive to the pit-depth correction. We suggest that there may be slight differences in the garnet ablation rate between sessions and samples that we do not account for by applying an average pit-depth correction. Therefore, we use the U, Th, and Pb contents measured by the Element-XR ICPMS and processed in LADR for comparison between the LASS-ICPMS session data and the 33 µm spot background U, Th, and Pb data collected described here. In both cases, the trace-element data were analysed using the Element-XR and data processed with LADR, providing consistency between the separate LASS-ICPMS and LA-ICPMS sessions.
5.3 Evidence for minor and trace-element mixing between garnet and inclusions
Simultaneous U–Pb isotopic and trace-element data collected by LASS-ICPMS spots on garnet show trends that identify widespread contamination by U- and Th-bearing inclusions. These inclusions dominate the U, Th, and Pb contents of the measured analyses in all samples. Linear mixing arrays between garnet, whose background minor- and trace-element compositions are described in Sect. 4.2, and zircon and rutile were calculated. Below we assess these trends on a sample-by-sample basis.
5.3.1 OM20-13
Linear mixing arrays of U vs. Zr, Th vs. Zr, Th vs. Ce, U vs. Nb, Nb vs. Ti, and Nb vs. Zr between garnet and potential contaminants of the U–(Th–)Pb isotopic system are shown in Fig. 4 for sample OM20-13. Trends in U vs. Zr and Th vs. Zr display positive linear correlations consistent with mixing between garnet (average Zr = 1.17 µg g−1, , and zircon (49.77 wt % Zr for pure ZrSiO4) with 1000–2400 µg g−1 of U and 200–1600 µg g−1 of Th (Fig. 4a and b). Some analyses show elevated Th and Ce contents and high Th and at low Zr, consistent with contamination by a Th + REE-enriched phase such as monazite or allanite (Fig. 4b and c). The plot of U vs. Nb (Fig. 4d) shows that most data exhibit variable U (0–2.5 µg g−1) at . Mixing lines between garnet ( and ) and rutile (assuming an average Nb of 500 µg g−1 calculated from Garber et al., 2021) are plotted for U contents of 50–350 µg g−1 in rutile, but these potential mixing lines only intersect a small portion of the data array with both elevated Nb and U. A plot of Nb vs. Ti displays analyses with 200–400 µg g−1 Ti at low Nb, likely representing Ti zoning in garnet, with a linear array of analyses extending to high Nb and Ti. LA-ICPMS analyses of garnet from OM20-13 that are free from Ti spikes display tens of nanograms per gram or less of Nb (Table S4), requiring inclusion contamination to describe the linear Nb vs. Ti array in Fig. 3e. This array shows some dispersion, consistent with mixing of garnet with variable Ti and rutile with variable Nb. Finally, a plot of Nb vs. Zr shows little correlation between these elements (Fig. 4f).
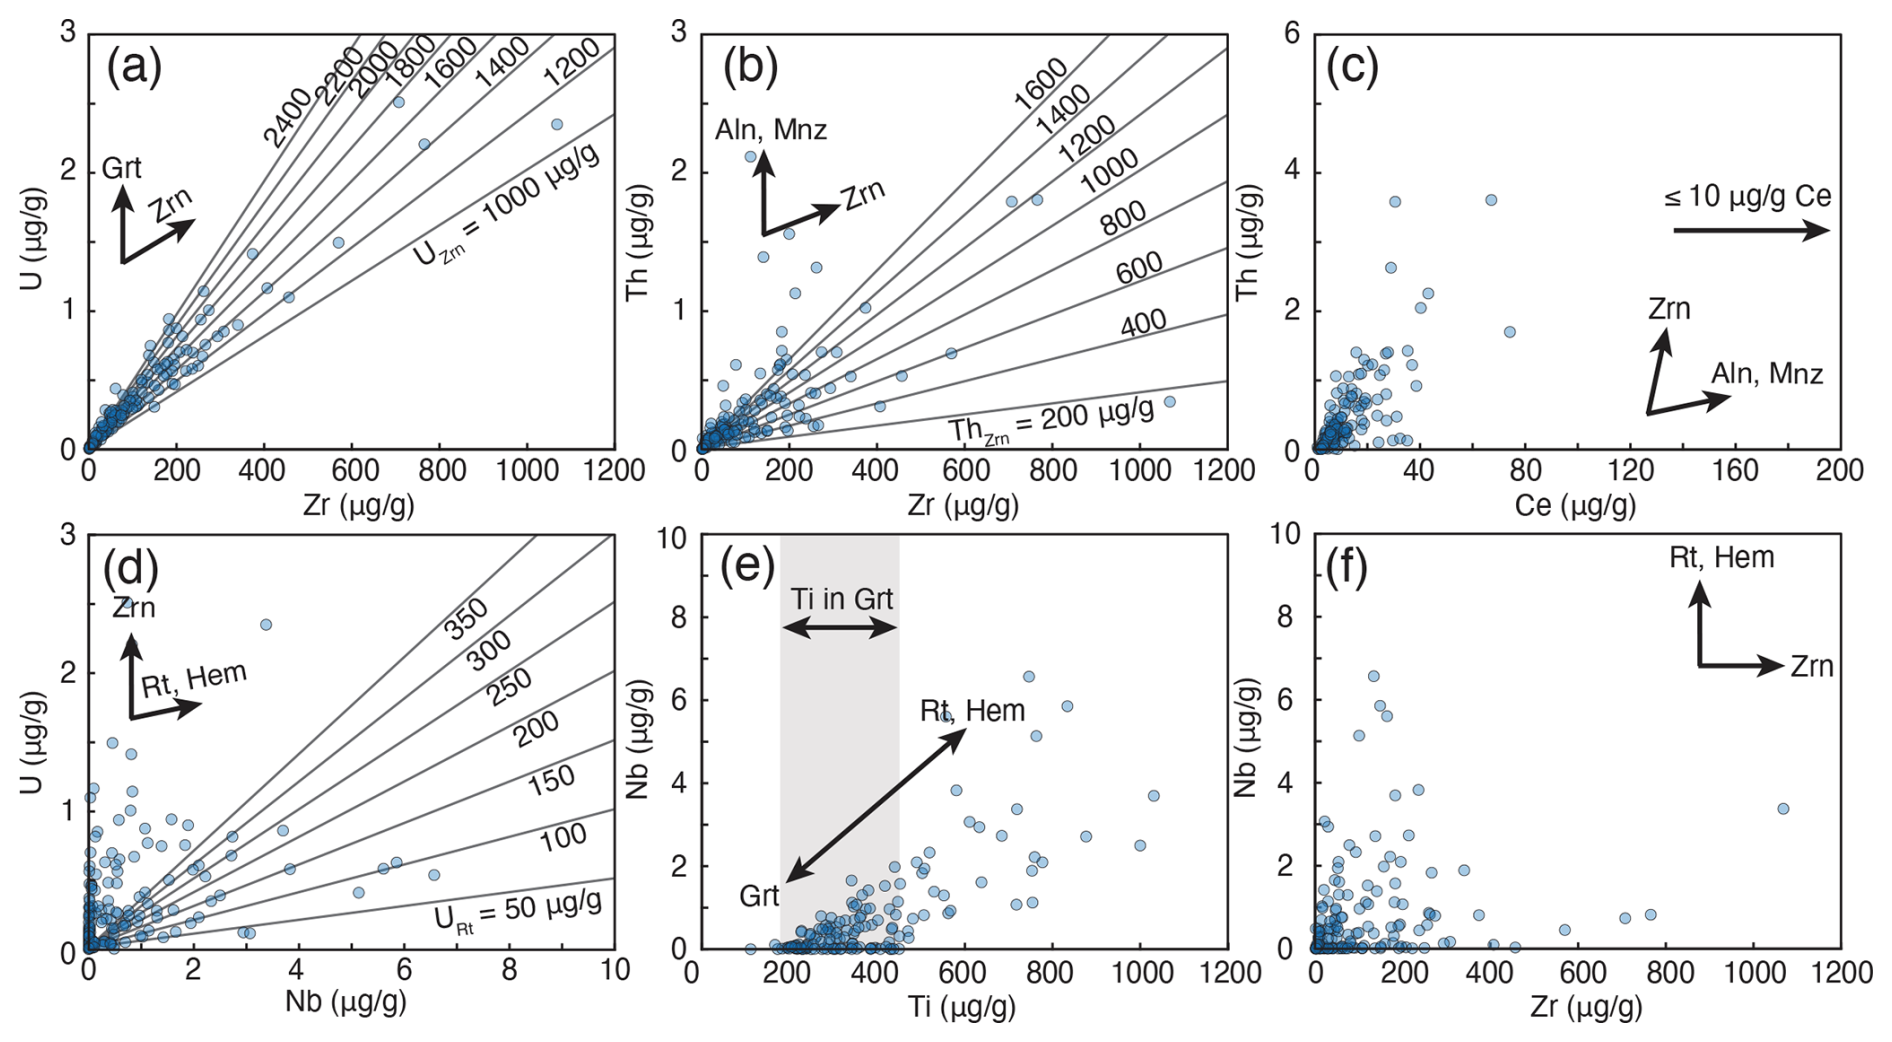
Figure 4Plots of U vs. Zr (a), Th vs. Zr (b), Th vs. Ce (c), U vs. Nb (d), Nb vs. Ti (e), and Nb vs. Zr (f) for LASS-ICPMS analyses of garnet in sample OM20-13. Mixing lines between garnet and zircon and rutile are plotted for a range of U and Th contents. Mineral abbreviations are defined as Grt (garnet), Zrn (zircon), Aln (allanite), Mnz (monazite), Rt (rutile), and Hem (hematite) after Warr (2021).
5.3.2 OM20-14
Plots of U vs. Zr and Th vs. Zr (Fig. 5a and b) show linear trends consistent with mixing between garnet (, , ) and zircon with 50–600 µg g−1 U (average U) and 20–160 µg g−1 Th, respectively. The garnet background Zr, U, and Th contents were not determined for OM20-14; however, garnet Zr contents measured in the three samples in which 33 µm diameter LA-ICPMS analyses were conducted were consistently low (0.5–1.5 µg g−1), and U and Th contents were at low ng g−1 levels. Therefore, assumptions regarding the lower intercept of the mixing arrays are unlikely to significantly change their slopes. In the plot of Th vs. Ce, (Fig. 5c), eight analyses plot at elevated Ce (10–100 ng g−1 Ce) and moderate to high Th (3–30 ng g−1), whereas most analyses fall along a linear trend projecting to high Th at low Ce. The plot of U vs. Nb (Fig. 5d) shows data extending to both high Nb and low U, falling within an array consistent with mixing between garnet ( and ) and rutile () with U contents of 10–60 µg g−1. However, most analyses plot outside of this array. The plot of Nb vs. Ti shows a cluster of analyses at low Nb and 100–500 µg g−1 Ti, like analyses from OM20-13, and is interpreted to represent Ti zoning in garnet (Fig. 5e). A well-defined linear array of Nb vs. Ti far exceeds background garnet Ti and Nb contents measured for samples OM20-13, OM20-17, and OM20-18. An ordinary least-squares regression shows that this trend is well-defined, with an R2 of 0.95. Assuming this trend represents mixing between garnet and rutile, the slope of the regression projects to a Nb content of for rutile, consistent with the average Nb content of rutile () measured by Garber et al. (2021) in rutile from As Sifah. The plot of Nb vs. Zr shows a cloud of data covering nearly the entire range of potential Nb/Zr ratios (Fig. 5f), with most clustered at relatively low Nb and Zr.
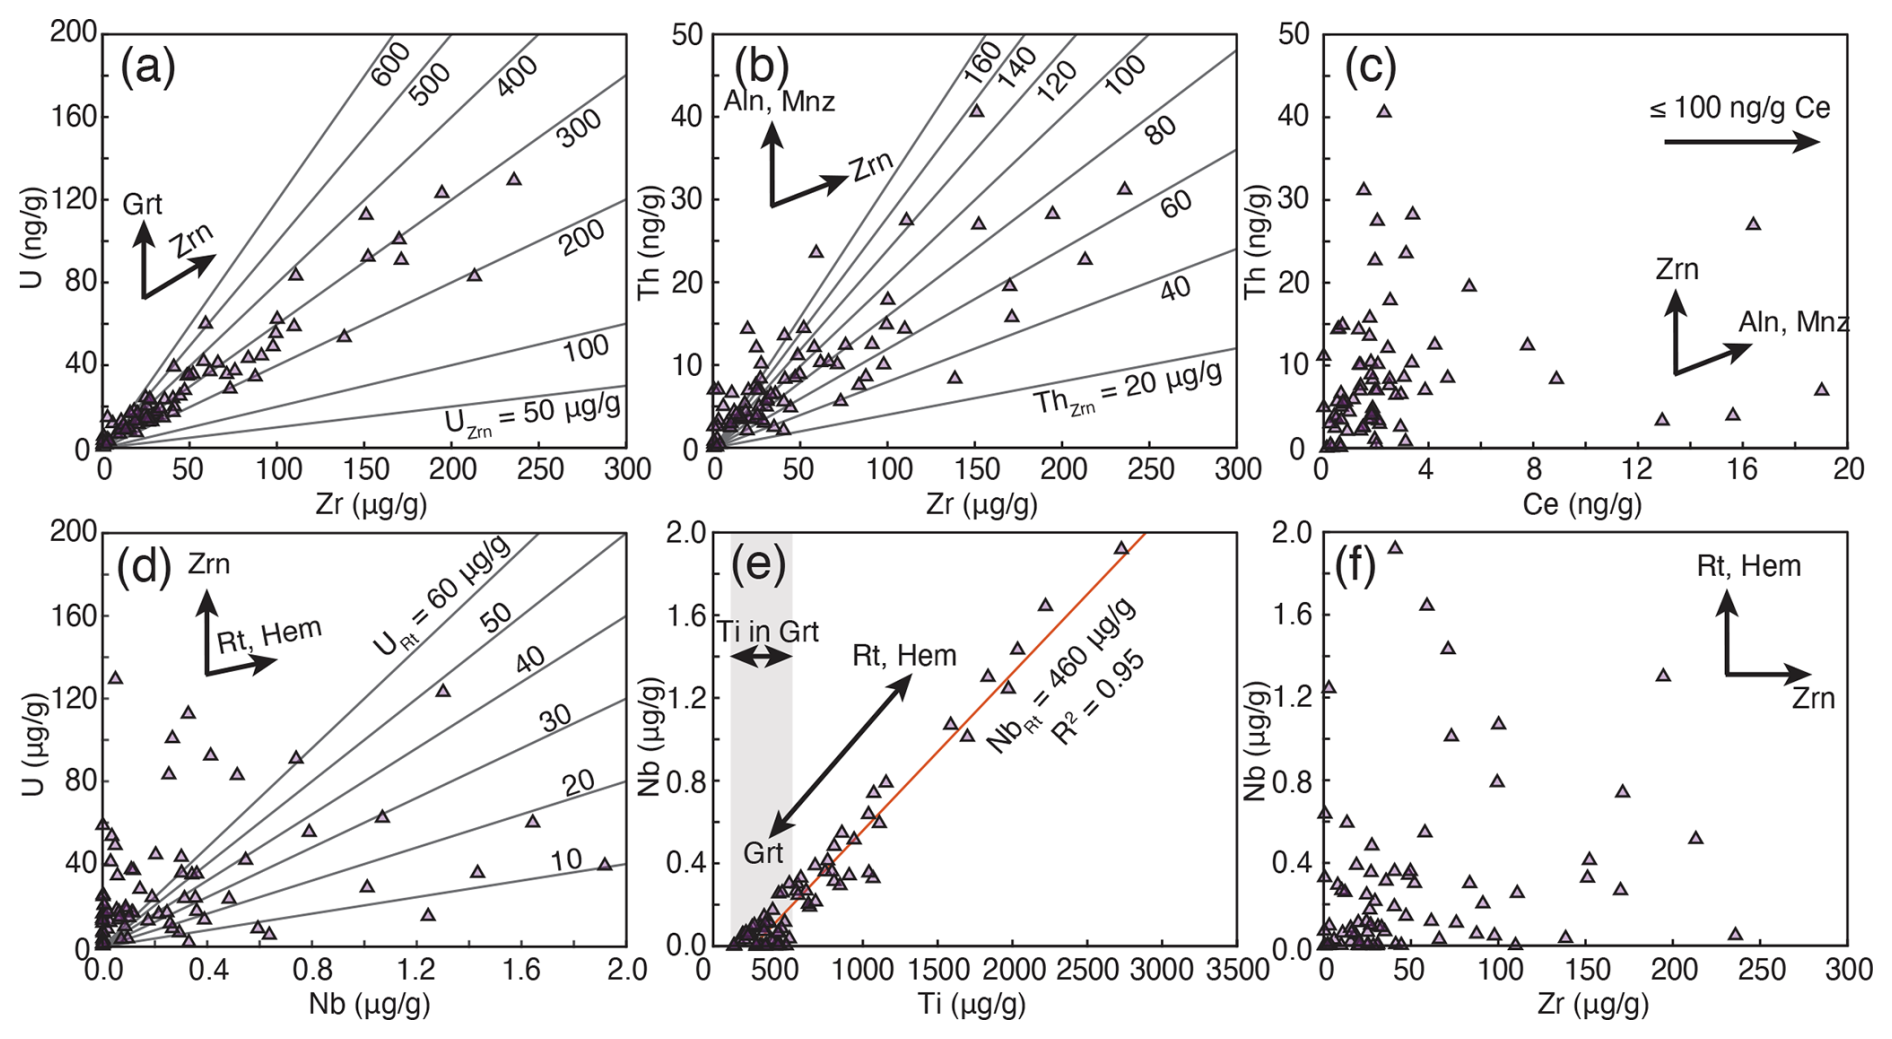
Figure 5Plots of U vs. Zr (a), Th vs. Zr (b), Th vs. Ce (c), U vs. Nb (d), Nb vs. Ti (e), and Nb vs. Zr (f) for LASS-ICPMS analyses of garnet in sample OM20-14. Mixing lines between garnet and zircon and rutile are plotted for a range of U and Th contents. Mineral abbreviations after Warr (2021).
5.3.3 OM20-17
Plots of U vs. Zr and Th vs. Zr display linear positive correlations in these elements (Fig. 6a and b). These trends fall on mixing lines between garnet (average , , ) and zircon with 200–1000 µg g−1 U and 100–700 µg g−1 Th. Nearly all analyses fall on a mixing line with zircon containing 400–600 µg g−1 U. The plot of Ce vs. Th (Fig. 6c) shows that only one analysis falls above 10 ng g−1 Ce, whereas all other data fall between 0 and 0.1 µg g−1 Th at 0–10 ng g−1 Ce. In the plot of U vs. Nb, 63 % of analyses cluster at Nb and U, with most of the remaining analyses plotting between 0 and 0.15 µg g−1 U and up to Nb (Fig. 6d). Similar to sample OM20-14, some of the low U–high Nb analyses fall between mixing lines for garnet ( and ) and rutile () with U contents of 20–140 µg g−1. Low Nb analyses plot between 100 and 300 µg g−1 Ti, whereas analyses up to Ti plot along a linear array in Nb vs. Ti space (Fig. 6e). Assuming the linear regression of these data (R2=0.96) represents rutile contamination, the estimated average Nb content of the rutile is 860 µg g−1. Also, like in OM20-14, the plot of Nb vs. Zr shows a cloud of data with elevated Nb and Zr but without a clear trend (Fig. 6f).
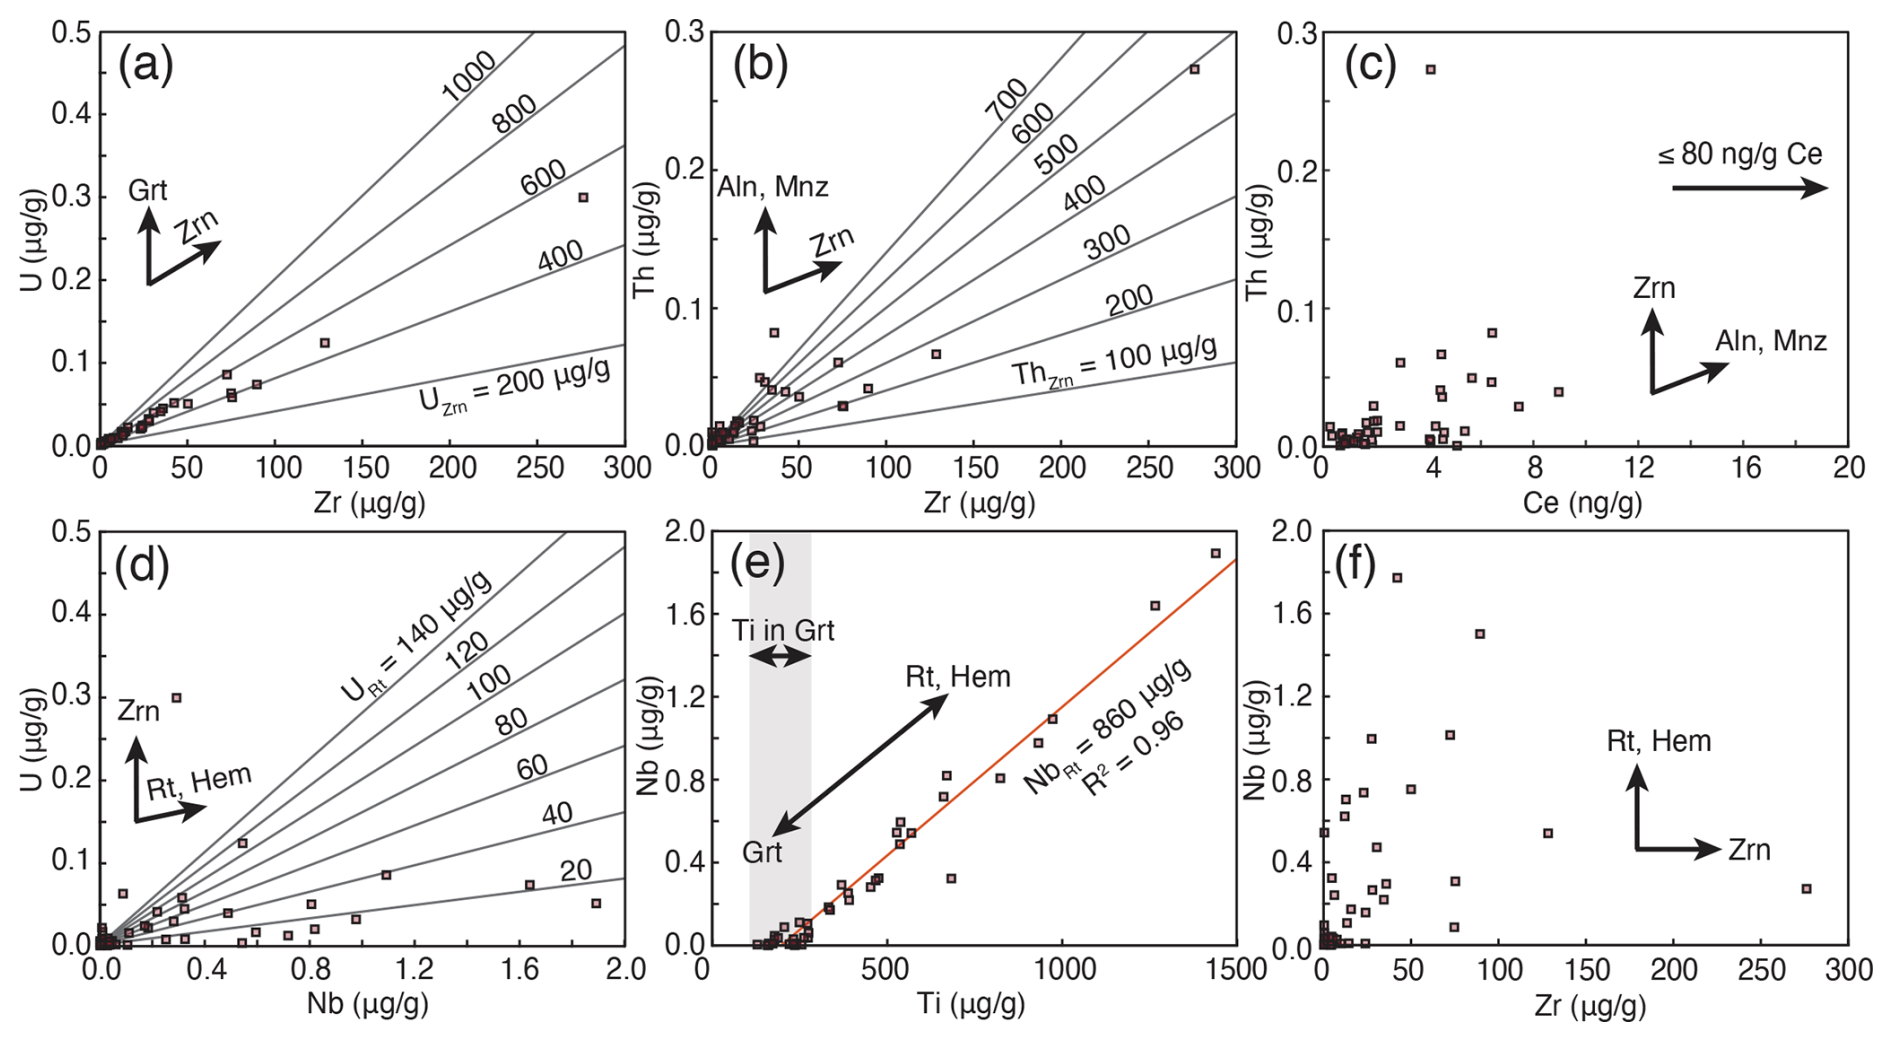
Figure 6Plots of U vs. Zr (a), Th vs. Zr (b), Th vs. Ce (c), U vs. Nb (d), Nb vs. Ti (e), and Nb vs. Zr (f) for LASS-ICPMS analyses of garnet in sample OM20-17. Mixing lines between garnet and zircon and rutile are plotted for a range of U and Th contents. Mineral abbreviations after Warr (2021).
5.3.4 OM20-18
Analyses in Sample OM20-18 also plot along linear arrays in U vs. Zr and Th vs Zr space (Fig. 7a and b). These data are largely bounded by mixing lines between garnet (average , , and zircon with 1200–2400 µg g−1 U and 100–700 µg g−1 Th. In the plot of Ce vs. Th, 90 % of analyses plot at and Th contents of 0 to almost 0.15 µg g−1 (Fig. 7c). The remaining analyses plot at both elevated Th and Ce contents, indicating contamination by a REE-rich phase, such as monazite or allanite. Similarly, 88 % of analyses in the U vs. Nb diagram plot below 1 µg g−1 Nb but exhibit variable U (Fig. 7d). The highest Nb contents (up to 11 µg g−1) plot at low U, consistent with background garnet U contents. Only four analyses with high U (out of 133 analyses) plot on mixing lines between garnet ( and ) and rutile (). In Nb vs. Ti space (Fig. 7e), low Nb–high Ti analyses fall between 200–500 µg g−1 Ti, consistent with measured Ti zoning measured in a core–rim transect from OM20-18 using 33 µm spots (see Sect. 4.1). A positively correlated array of data extends from low Nb and background Ti contents to a maximum of Nb and Ti. Finally, Nb and Zr are decoupled, with the highest Zr contents occurring at low Nb and the highest Nb contents occurring at low Zr (Fig. 7f).
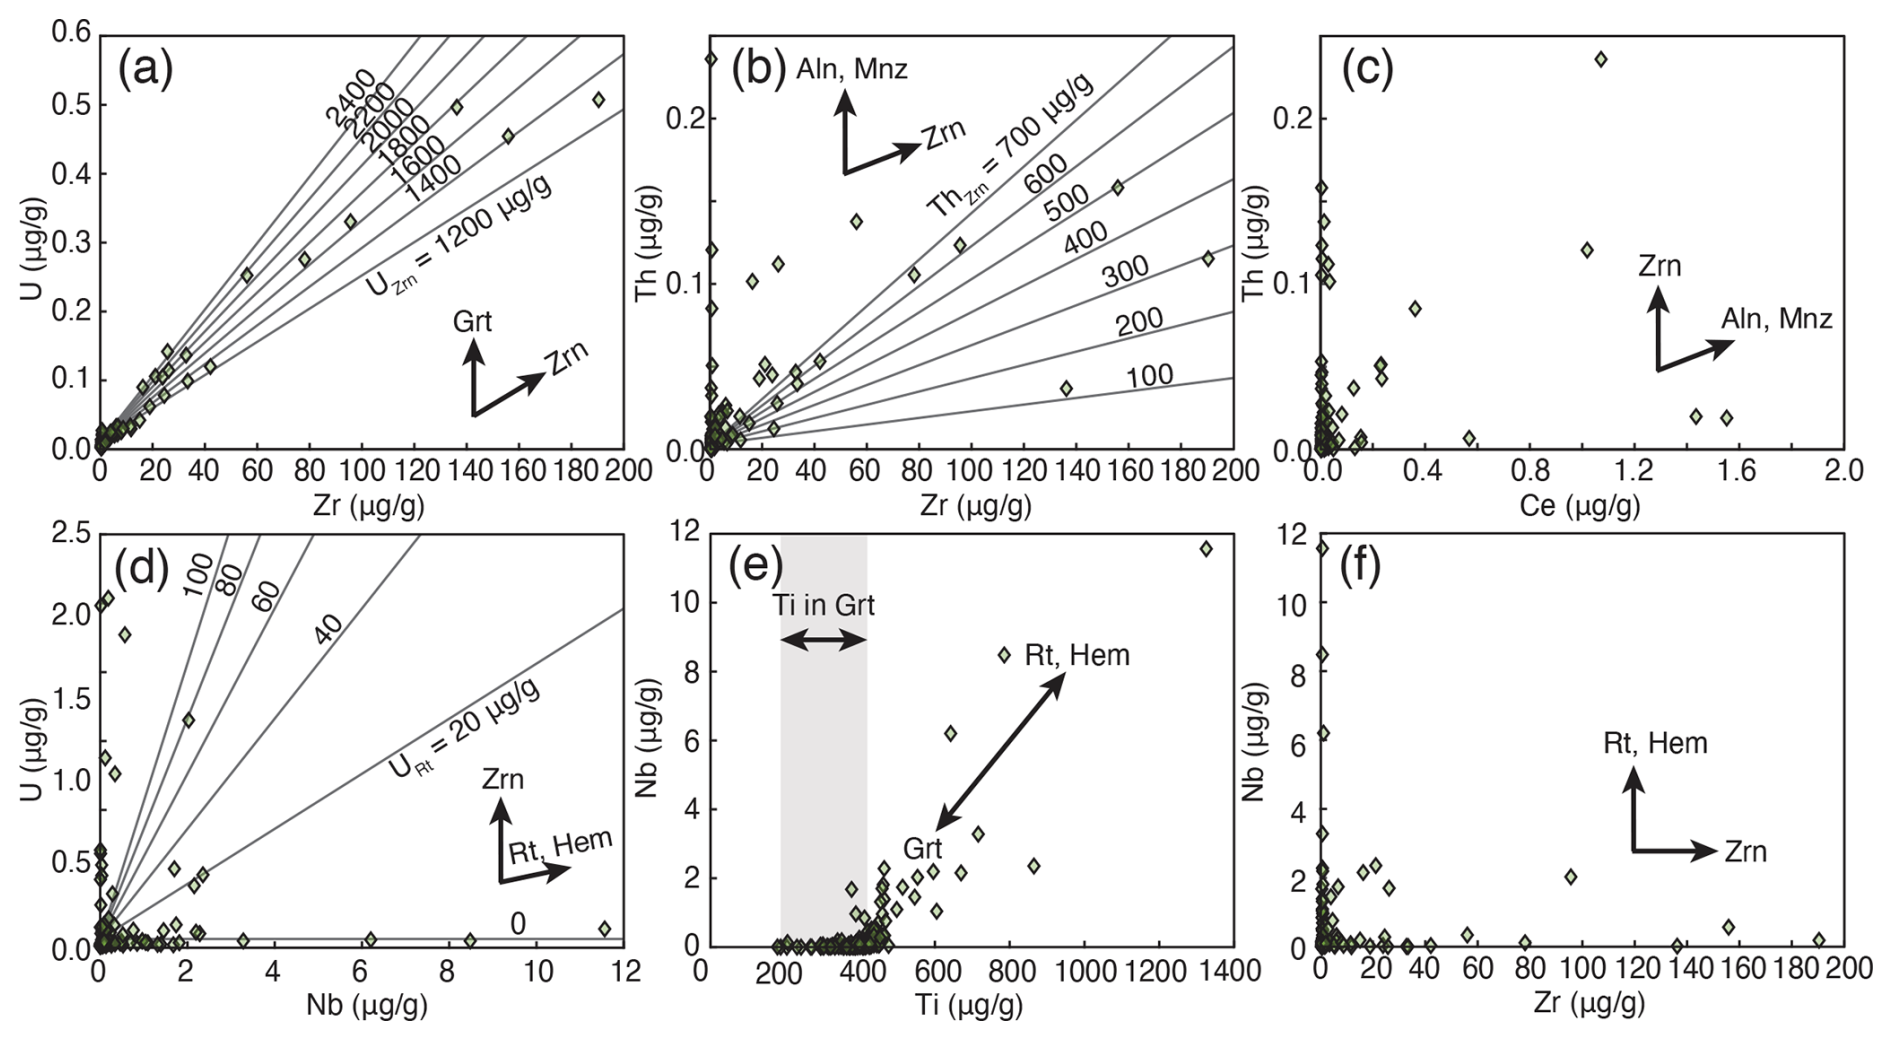
Figure 7Plots of U vs. Zr (a), Th vs. Zr (b), Th vs. Ce (c), U vs. Nb (d), Nb vs. Ti (e), and Nb vs. Zr (f) for LASS-ICPMS analyses of garnet in sample OM20-18. Mixing lines between garnet and zircon and rutile are plotted for a range of U and Th contents. Mineral abbreviations after Warr (2021).
5.3.5 CWO21
Analyses of garnet in CWO21 display a positive correlation in U vs. Zr (Fig. 8a). These data are bounded by mixing lines between garnet (, ) and zircon with 200–1600 µg g−1 U. The plot of Th vs. Zr shows less linearity, but the data are generally positively correlated and are bounded by mixing lines between garnet (, ) and zircon containing 50–600 µg g−1 Th (Fig. 8b). Measured Ce and Th contents are <1 and (Fig. 8c), respectively, with analyses trending to either high Th at low Ce or low Th and high Ce. In the plot of U vs. Nb, 56 % of analyses cluster at Nb and U (Fig. 8d). The remaining data extend to U at low Nb or show both elevated U and Nb, where the latter are bounded by mixing lines between garnet ( and ) and rutile () with 5–30 µg g−1 U. Analyses which display low Nb contents exhibit Ti contents between 150 and 650 µg g−1, likely representing Ti zoning in garnet (Fig. 8e). The remaining data extend in a linear array up to Nb and 6500 µg g−1 Ti. If this trend represents mixing between garnet and rutile, the linear regression of this trend (R2=0.99) projects to a potential Nb of 665 µg g−1 for rutile. Finally, the plot of Nb vs. Zr shows decoupling between these elements, such that analyses exhibit a range of Zr contents between 0 and 190 µg g−1 regardless of Nb content (Fig. 8f).
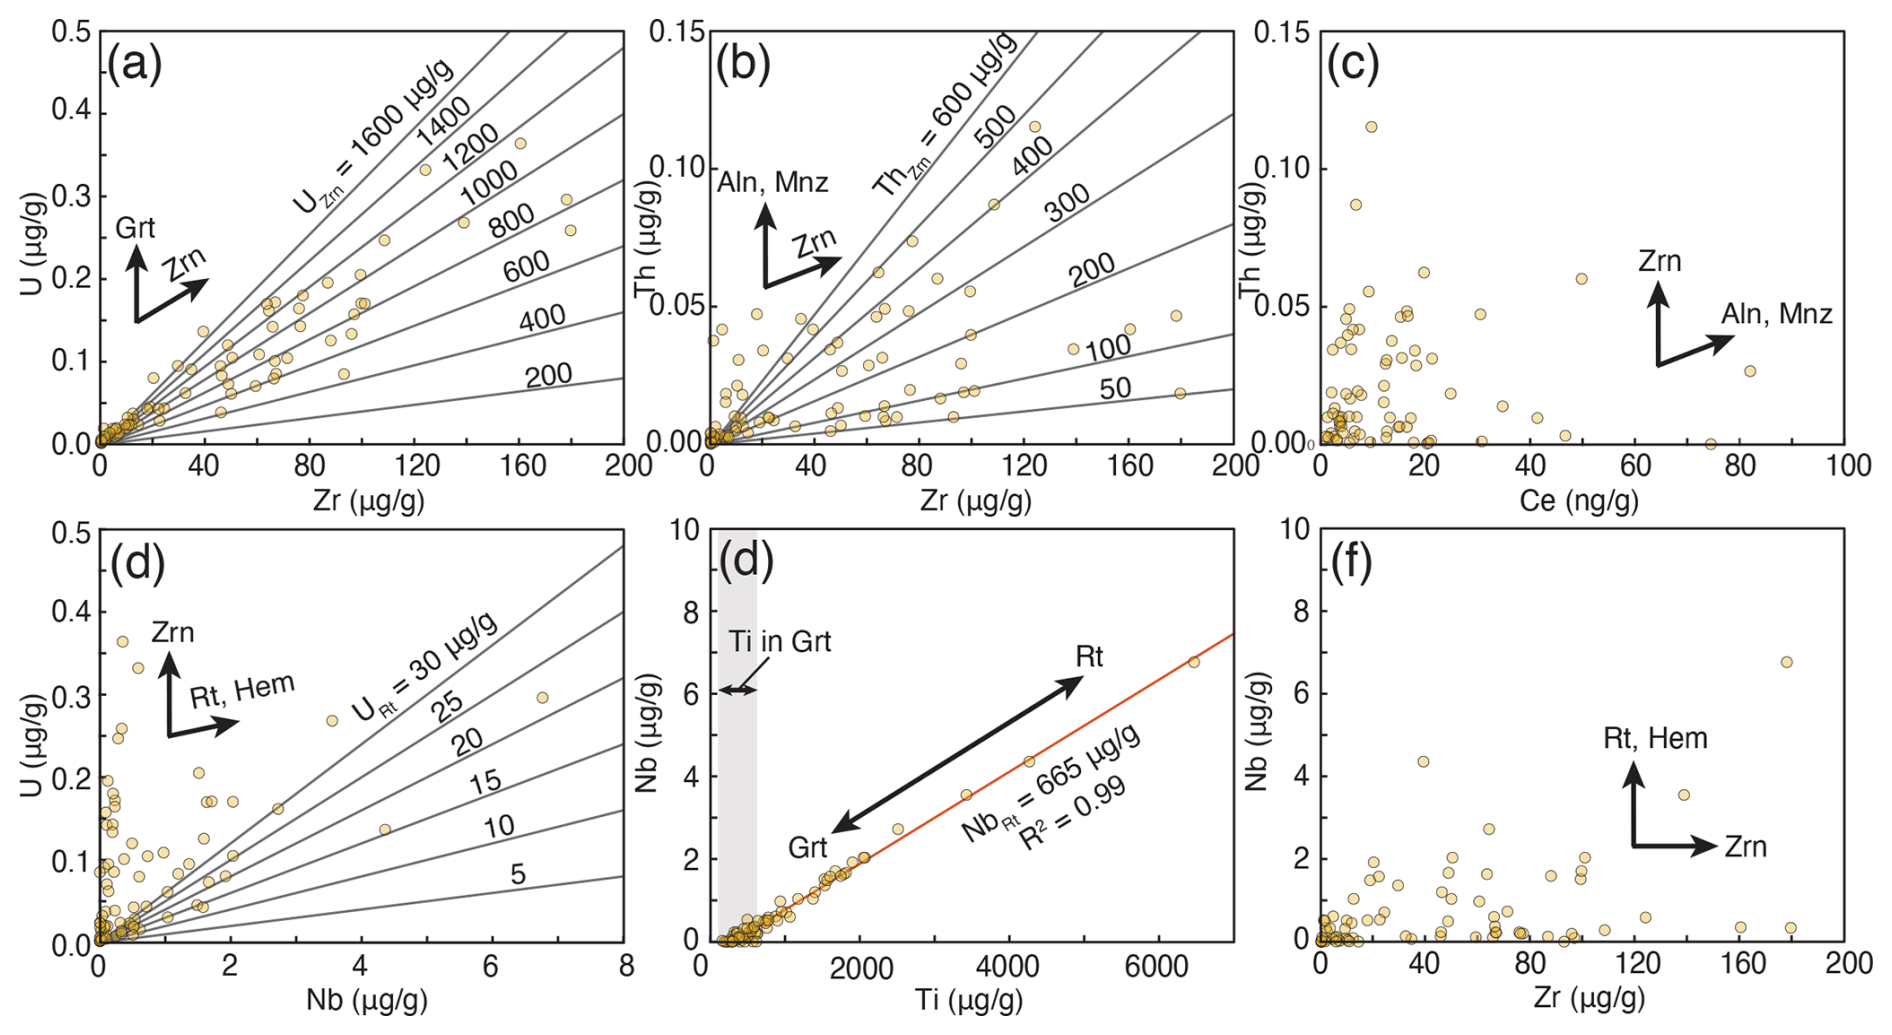
Figure 8Plots of U vs. Zr (a), Th vs. Zr (b), Th vs. Ce (c), U vs. Nb (d), Nb vs. Ti (e), and Nb vs. Zr (f) for LASS-ICP-MS analyses of garnet in sample CWO21. Mixing lines between garnet and zircon and rutile are plotted for a range of U and Th contents. Mineral abbreviations after Warr (2021).
5.4 U–Pb geochronology
The LASS-ICPMS U–Pb isotopic data are plotted in Tera-Wasserburg diagrams in which data are aligned along regression lines, which show linear mixing between common Pb (y intercept) and ingrown radiogenic Pb (Fig. 9). The data in Fig. 9a–e were screened for sharp spikes or disruptions in the downhole U and Pb signals, but trace-element downhole signals and contents were not considered at this stage. A 2 s filter was applied on the data during calculation of the lower intercept ages; however, most analyses fall within the 2 s uncertainty envelope of the regression line, and calculated mean squared weighted deviation (MSWD) of 0.97–1.93 reflect that the calculated ages are statistically well-defined by the remaining analyses. Calculated concordia intercept dates range from 88.8±1.9 to 94.4±7.2 Ma. Although there is some variability, all analyses with elevated U contents and high 238U206Pb co-occur with Zr contents that are elevated above background garnet Zr contents (see previous section). Garnet U–Pb error envelopes on individual data points are linearly colour-coded in greyscale as a function of Zr content, between background (white) and the highest Zr content for each sample (black). While there is some spread in the colour-coded data, analyses with the lowest Zr contents consistently plot near the y intercept with common Pb (Fig. 9).
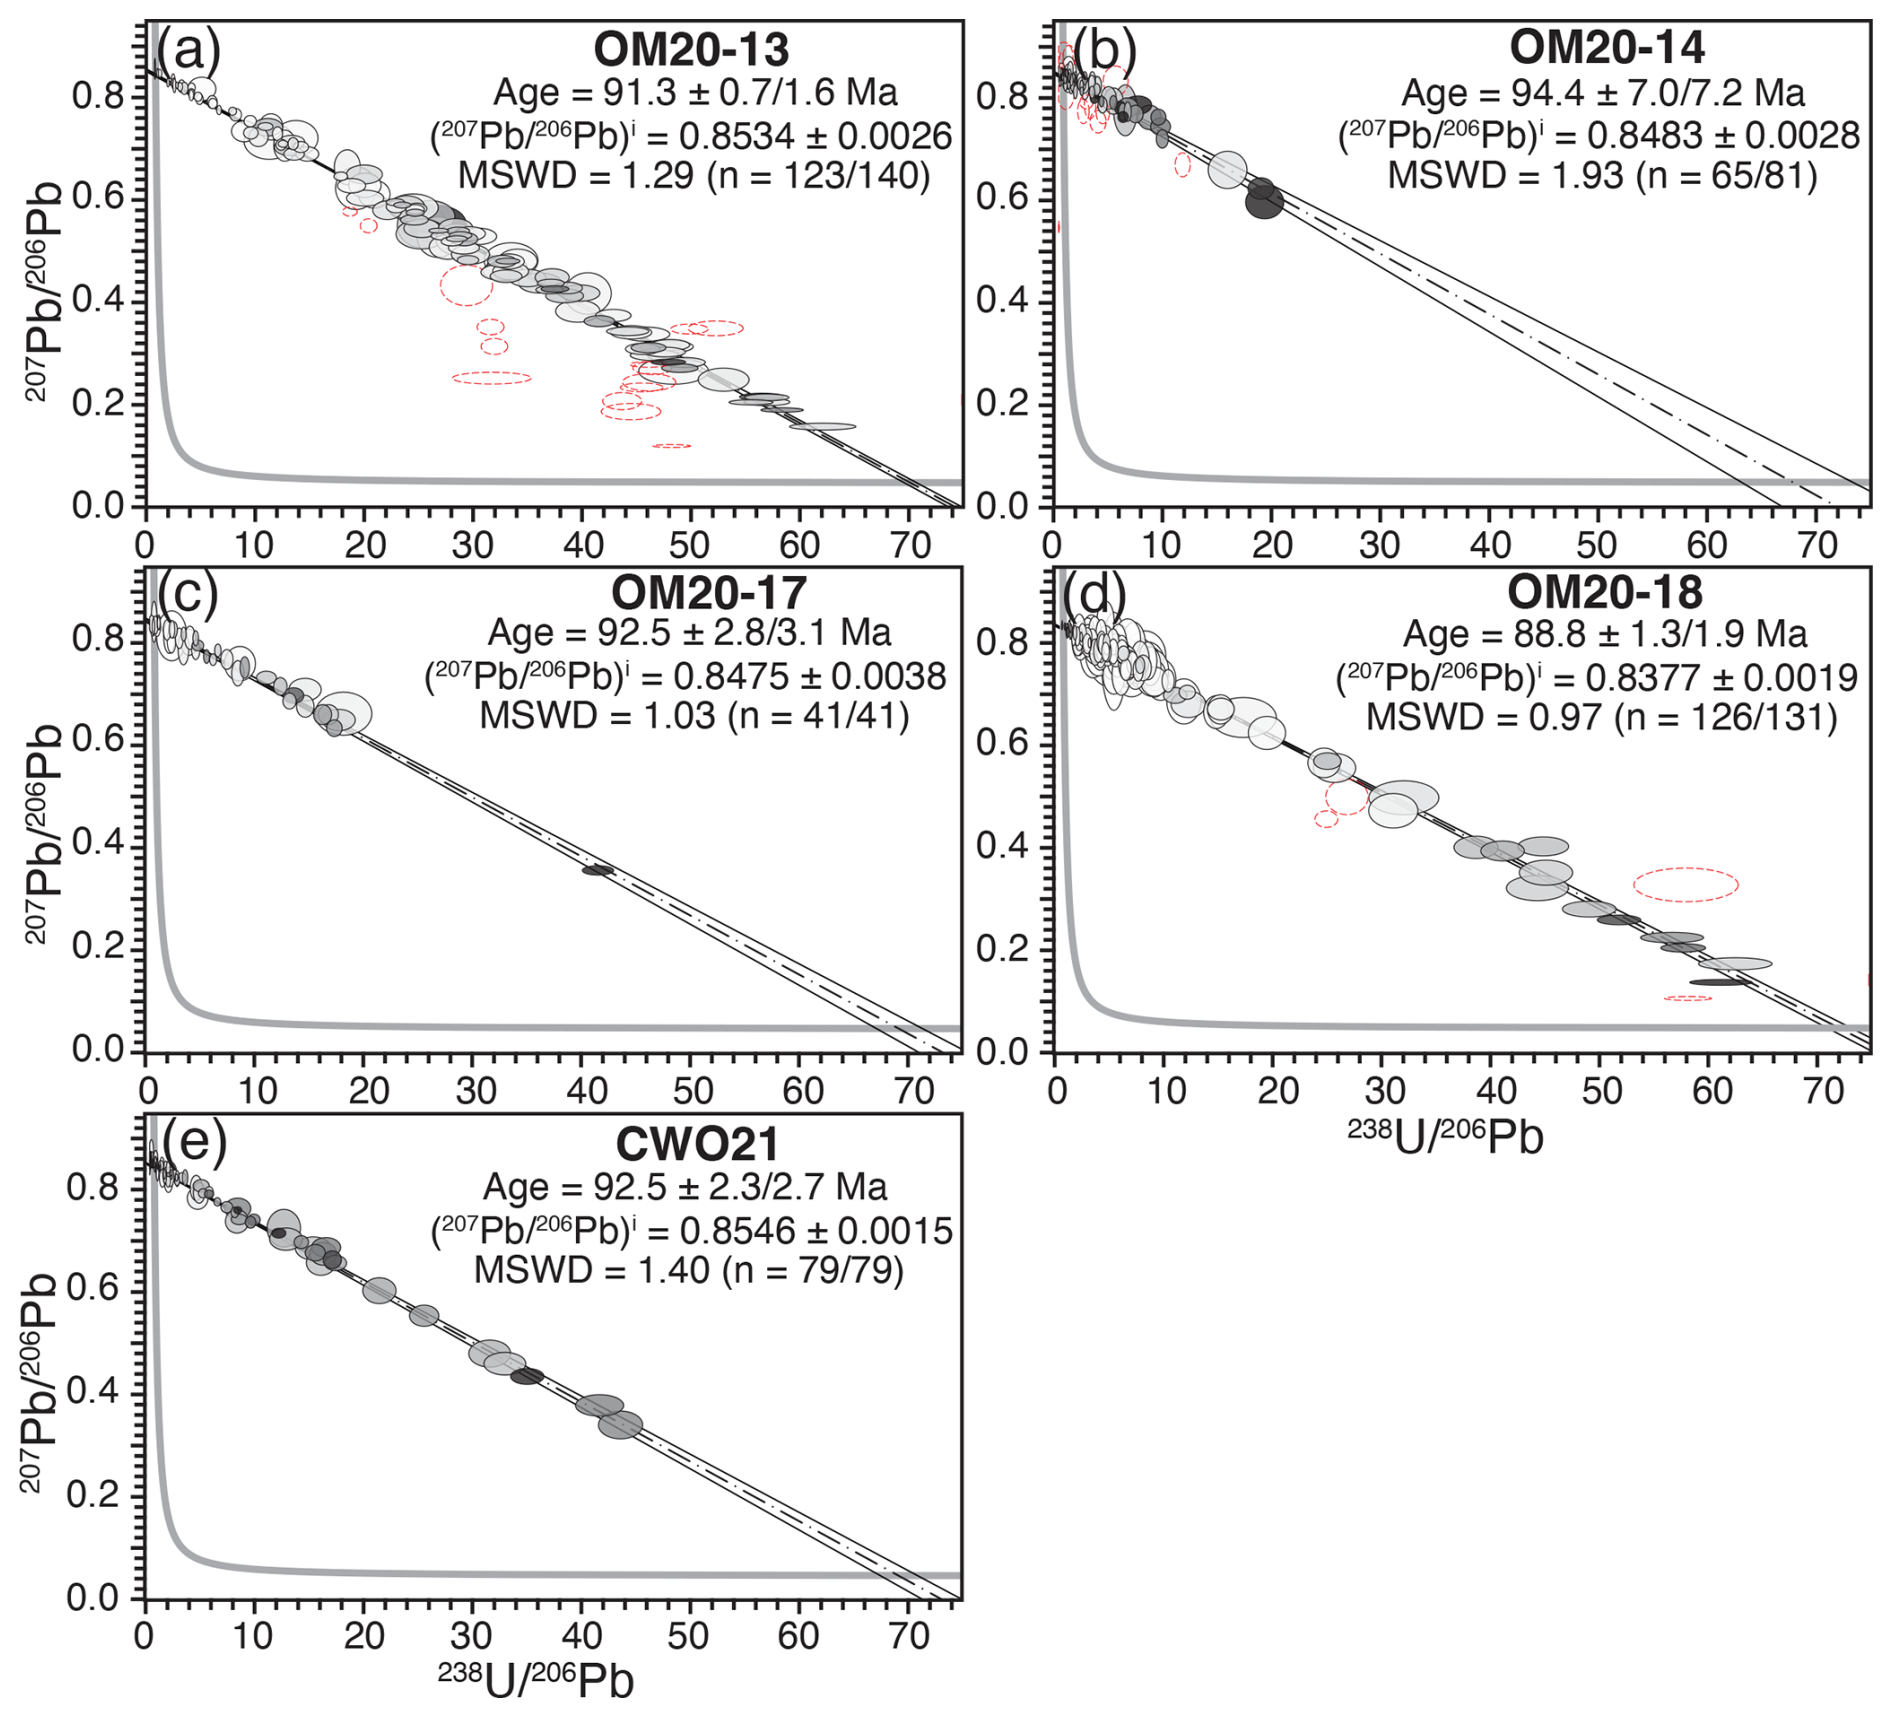
Figure 9Tera-Wasserburg diagrams of garnet U–Pb LASS-ICPMS analyses for OM20-13 (a), OM20-14 (b), OM20-17 (c), OM20-18 (d), and CWO21 (e). Data points are colour-coded in greyscale for Zr content between white (lowest Zr content) and black (highest Zr content). Dashed red analyses show data that are not included in the regression. The dashed black line is the regression line, whereas the solid black lines are the 2 s uncertainty envelope, and the thick grey line is concordia.
If the 94–89 Ma garnet U–Pb dates calculated here accurately constrained the timing of garnet growth during eclogite-facies metamorphism, then our data would require (1) a reason for decoupling between U–Pb and Sm–Nd isotopic systems under relatively low-T metamorphic conditions (∼550 °C and lower) and (2) a tectonic explanation for simultaneous lawsonite eclogite-facies metamorphism of the As Sifah eclogite and granulite-facies metamorphism of the sole of the Semail ophiolite. Garnet U–Pb dates of 94–89 Ma are significantly older than 81–77 Ma ages calculated by Sm–Nd garnet, U–Pb zircon, and U–Pb rutile geochronology for the As Sifah eclogite (Warren et al., 2003, 2005; Garber et al., 2021). In particular, Garber et al. (2021) determined a Sm–Nd garnet age of 77.5±2.2 Ma for sample CWO21, whereas the U–Pb “garnet” date calculated here for CWO21 is 92.5±2.7 Ma. Additionally, the 94–89 Ma garnet U–Pb dates calculated here overlap (within uncertainty) the formation age of the oceanic crust of the Semail ophiolite (Rioux et al., 2012, 2013, 2021) and granulite-facies subduction metamorphism of the metamorphic sole at ca. 95 Ma (Hacker et al., 1996; Warren et al., 2005, Rioux et al., 2016, 2023), which structurally overlie the high-P rocks of the Saih Hatat window. Instead of a geological explanation, we suggest that these apparent discrepancies can be resolved analytically: our garnet U–Pb data do not constrain the timing of lawsonite eclogite-facies metamorphism, but instead the U–Pb regression lines represent mixing between dominantly unradiogenic common Pb in garnet and radiogenic Pb and U in zircon micro-inclusions.
6.1 Evidence for zircon contamination
Plots of U vs. Zr show positive linear correlations in all samples (Figs. 4–8). These trends are consistent with linear mixing between garnet and zircon during ablation. Linear Zr–U trends observed here (Figs. 4–8) project to high Zr at low U. These trends are inconsistent with any coupled substitution of U and Zr into the garnet structure and instead plot towards U and Th contents that are reasonable for zircon. Additionally, the 33 µm trace-element analyses, which were conducted by selecting every spot location optically and by BSE for areas free of zircon inclusions before analysis, have uniformly low Zr and U compared to the larger-spot LASS-ICPMS analyses (see Sect. 5, Results). Finally, a close inspection of the samples reveals that zircon micro-inclusions (≤2 µm) are ubiquitous in garnet grains in all five samples analysed in this study (Fig. 2). These observations are consistent with trace-element garnet maps (Fig. 3), which show that elevated U and Zr contents co-occur in discrete pixels, whereas the surrounding garnet contains little U and Zr. The density of zircon micro-inclusions in garnet in all samples, except OM20-18, suggests that co-ablation of zircon inclusions is unavoidable given the large ablation spot size (193 µm diameter) necessary to achieve sufficient U and Pb counts for U–Pb garnet geochronology.
The LASS-ICPMS screening method is highly sensitive to the detection of co-ablated zircon considering the low garnet background Zr content (0.5–1.5 µg g−1) relative to the Zr content of zircon (49.77 wt %). For example, ablation of a single 2 µm wide spherical zircon inclusion is sufficient to raise the Zr content of the analysis from 1 µg g−1 in pure garnet to 9 µg g−1 of Zr, a scenario in which 99.998 vol. % of the ablated material is garnet and only 0.002 vol. % is zircon. Using the background-corrected Zr contents measured by LASS-ICPMS and the densities of zircon (4.71 g cm−3) and garnet (4.31 g cm−3), we can similarly calculate the volume of zircon ablated in each analysis. For OM20-13, OM20-17, and OM20-18, the average background garnet Zr contents were measured using a 33 µm laser spot size (Sect. 4.2), whereas a background content of 0.5 µg g−1 is assumed for OM20-14 and CWO21. Zircon is estimated to contribute from 0 to a maximum of 0.2 vol. % to each LASS-ICPMS analysis (see Table S5). Therefore, if U contents depend on zircon contamination in our samples, then very little contamination is required to reach the elevated Zr (and U) contents observed in our analyses relative to those of pure garnet in our samples.
If our isochrons are defined by inclusion contamination, then there must be a relationship between the volume of zircon ablated and the U and Pb isotopic composition measured. Data plotted in the Tera-Wasserburg diagrams in Fig. 9 are colour-coded for Zr content, showing that in all samples low Zr contents plot near the y intercept of the isochrons. As a result, these analyses must exhibit a Pb isotopic composition near to that of common unradiogenic Pb. However, the highest Zr content data points plot over a range of 207Pb206Pb and 238U206Pb ratios, which may be the result of varying U contents in the ablated zircon inclusions. To test this hypothesis, we plotted the calculated volume of ablated zircon vs. the percentage of radiogenic Pb for each sample and colour-coded the data by their measured U contents (Fig. 10). The percentage of radiogenic Pb is calculated for each data point by linear mixing between concordia and common Pb. While there is significant spread in the data, each sample displays a positive correlation between U content, percentage of radiogenic Pb, and volume of ablated zircon. While all minerals will develop increased radiogenic Pb with higher U contents, the correlation with the volume of ablated zircon is consistent with co-ablated zircon inclusions in our dataset. Combined with all other lines of evidence (e.g. frequent zircon micro-inclusions, discrete U and Pb hot zones in the LA-ICPMS map, and shallow Zr:U mixing trends), we suggest that the U–Pb dates calculated here (Fig. 9) reflect the growth/crystallisation of zircon micro-inclusions rather than eclogitic garnet.
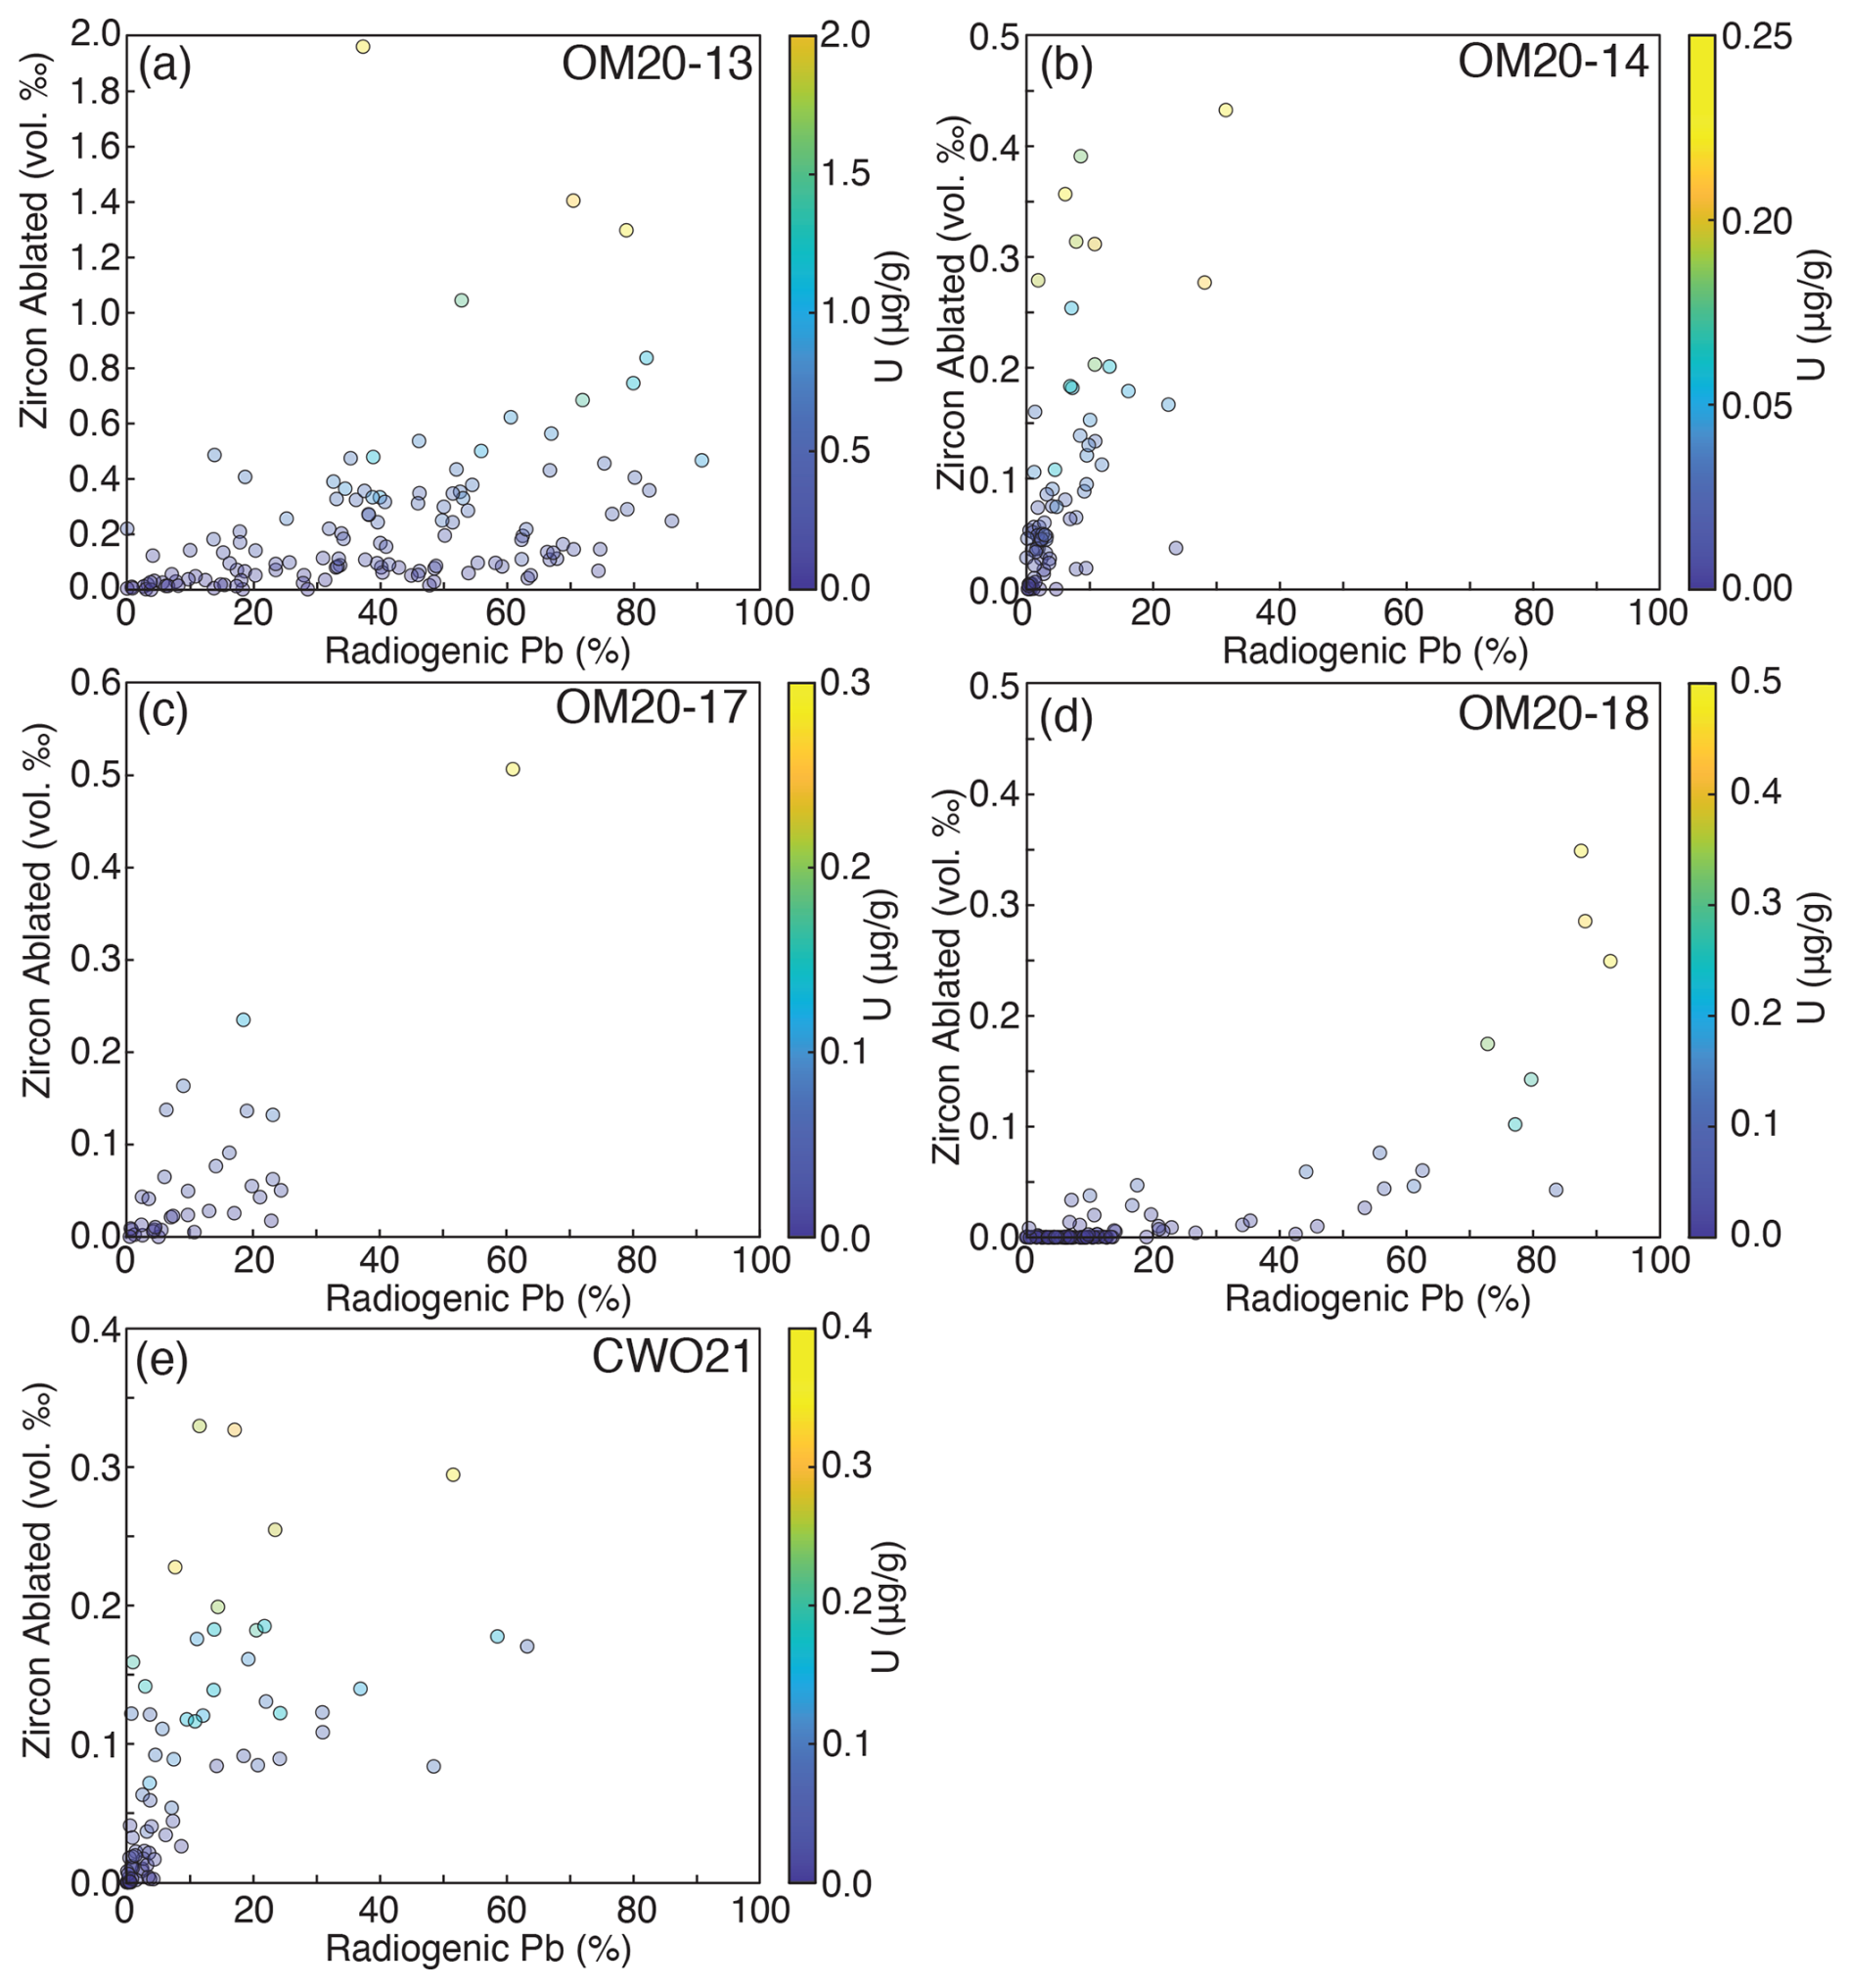
Figure 10Plots of volume of zircon ablated vs. the percentage of radiogenic Pb for OM20-13 (a), OM20-14 (b), OM20-17 (c), OM20-18 (d), and CWO21 (e). Data are colour-coded by U content.
Contributions from other U-bearing phases to the measured U and Pb isotopes are limited. For example, relatively few analyses plot at both elevated Ce and Th, and no linear correlations consistent with mixing are observed (Figs. 4–8). We did not petrographically observe monazite, allanite, or other REE-enriched phases that may contain elevated U (and Th); therefore, significant contamination of the U–Pb system by REE mineral inclusions is unlikely. In contrast, rutile and ilmenite (± Ti-hematite) are observed in all samples and may contain both U and Pb. Strong linear correlations in Nb vs. Ti are observed and many analyses far exceed background contents of these elements measured on “clean” garnet. These correlations project to potential Nb contents of rutile from 460–860 µg g−1 in rutile, falling within the range of Nb contents measured by Garber et al. (2021) for rutile from As Sifah eclogite. Rutile U contents measured by Garber et al. (2021) do not exceed 30 µg g−1, and most analyses were U. Mixing lines between garnet and rutile in U vs. Nb space show that the U contents of many analyses are too high and Nb contents too low for rutile to have contributed the majority of U, even though some data are consistent with mixing between garnet and rutile with U. Rutile contamination also cannot account for the linear correlation in U and Zr. The Zr contents of rutile are 20–40 µg g−1 (Garber et al., 2021), whereas higher contents are frequently measured here. Mixing lines between garnet and rutile in Zr vs. U space would also plot at much steeper slopes than garnet–zircon mixing lines, inconsistent with the shallow slopes of the Zr vs. U trends. Additionally, no correlation is observed between Nb and Zr, suggesting that rutile contamination makes little contribution to the Zr content. Since U and Zr are coupled, but Nb and Zr are not, it is not possible for contamination by rutile or other Ti-oxide phase to account for the elevated U contents of our analyses. Therefore, data plotting between garnet and rutile mixing lines in U vs. Nb are likely due to co-ablation of zircon and rutile instead of a significant U contribution from rutile alone, resulting in a significant number of analyses with elevated Zr and Nb.
6.2 Best practices in screening for contamination
Since the first application of in situ garnet U–Pb geochronology by LA-ICPMS by Seman et al. (2017), most studies have focused on dating grossular–andradite series garnets, which typically contain µg g−1 levels of U (e.g. DeWolf et al., 1996; Seman et al., 2017; Wafforn et al., 2018; Burisch et al., 2019, 2023) and few high-U inclusions, if any. Recent studies by Millonig et al. (2020), Schannor et al. (2021), Mark et al. (2023), Bartoli et al. (2024), and Shu et al. (2024) have expanded U–Pb geochronology by LA-ICPMS to common metamorphic garnet with very low U contents (). Early ID-TIMS studies of the U–Pb system in garnet by Mezger et al. (1989) and DeWolf et al. (1996) suggested that, whereas U is systematically incorporated at µg g−1 levels into garnet during growth in Ca-rich skarn-type garnets, the U contents of inclusions in metamorphic almandine–pyrope series garnet can be vastly higher than their host. Inclusion-free analyses of eclogitic garnet in our study display U contents of 1–20 ng g−1. These contents are lower than those in almandine–pyrope series metamorphic garnet dated by Millonig et a. (2020). At such low U contents, we show that very little inclusion contamination is required to completely overwhelm the garnet U (and Pb) signal (typically <0.1 vol. %).
Our data were re-examined in a double-blind exercise to test whether the inclusions may be screened entirely by looking at the U–Th–Pb data alone. Analyses were reprocessed by a co-author (Leo Millonig) and checked for inclusions using U, Th, and Pb contents, ThU ratio, and downhole MC-ICP-MS signals following Millonig et al. (2020). Importantly, these data were reprocessed without access to the split-stream trace-element data. During this process, some data which contained somewhat variable downhole signals (e.g. with broad-low frequency peaks) that were likely to be garnet but may possibly show inclusion contamination were retained. Similarly, the split-stream trace-element data were reprocessed by the lead author (Jesse B. Walters) without access to the U–Pb data. In both cases only the most stable portions of the signal were retained, and regions of the downhole signal that were chaotic or showed obvious spikes were removed from consideration. Analyses were rejected outright as being inclusion contaminated if the entirety of the signals were too unstable. For example, most analyses of samples OM20-14 and CWO21 do not have sufficiently stable signals with low Zr, Nb, Pb, Th, and U to select inclusion free segments; thus the data for these elements in Table S6 are equivalent to those in Table S3. It is critical to note that this approach is an inherently qualitative and subjective screening process but provides a first-order check of the reproducibility of our reduction approach. Following reprocessing and careful checking of the downhole signals, analyses which still exceeded the Zr and Ce contents of the garnet background were rejected as being inclusion biased.
The results of this double-blind study are presented in Fig. 11 and in Table S6, where the first column of Tera-Wasserburg diagrams was only screened using the U–Th–Pb MC-ICPMS data. While significantly fewer data are plotted compared to Fig. 9, the regression and calculated date for sample OM20-13 are largely unchanged (except for larger uncertainties). However, insufficient analyses remain after screening using the MC-ICPMS data to calculate meaningful concordia intercept ages for OM20-14, OM20-17, and CWO21. In all cases, the analyses rejected by examination of the MC-ICPMS data were also rejected during independent examination of the trace-element data. However, additional analyses that appeared irregular but were qualitatively passable during the assessment of the MC-ICPMS data were later rejected by considering cut-offs based on the background contents of the trace elements. As a result, <10 analyses are retained for all samples except for OM20-18 following both screening procedures. For these samples, the remaining analyses are too few and are restricted to high 207Pb206Pb and low 238U206Pb, preventing the calculation of meaningful concordia intercept ages. Only sample OM20-18, which optically, and in BSE, was found to qualitatively have the fewest inclusions, has enough clean garnet U–Pb analyses and significant enough spread in U–Pb ratios to calculate a statistically meaningful concordia-intercept date. For this sample, only eight additional analyses are rejected following both screening processes. The calculated date of 72±7 Ma is significantly younger than the 89±2 Ma date calculated for the same sample when high Zr analyses are also considered. The date is also significantly younger than the dates of all other samples prior to the double-blind screening exercise. However, 72±7 Ma is consistent within uncertainty of the 81–77 Ma Sm–Nd garnet ages of Garber et al. (2021) for As Sifah eclogite samples.
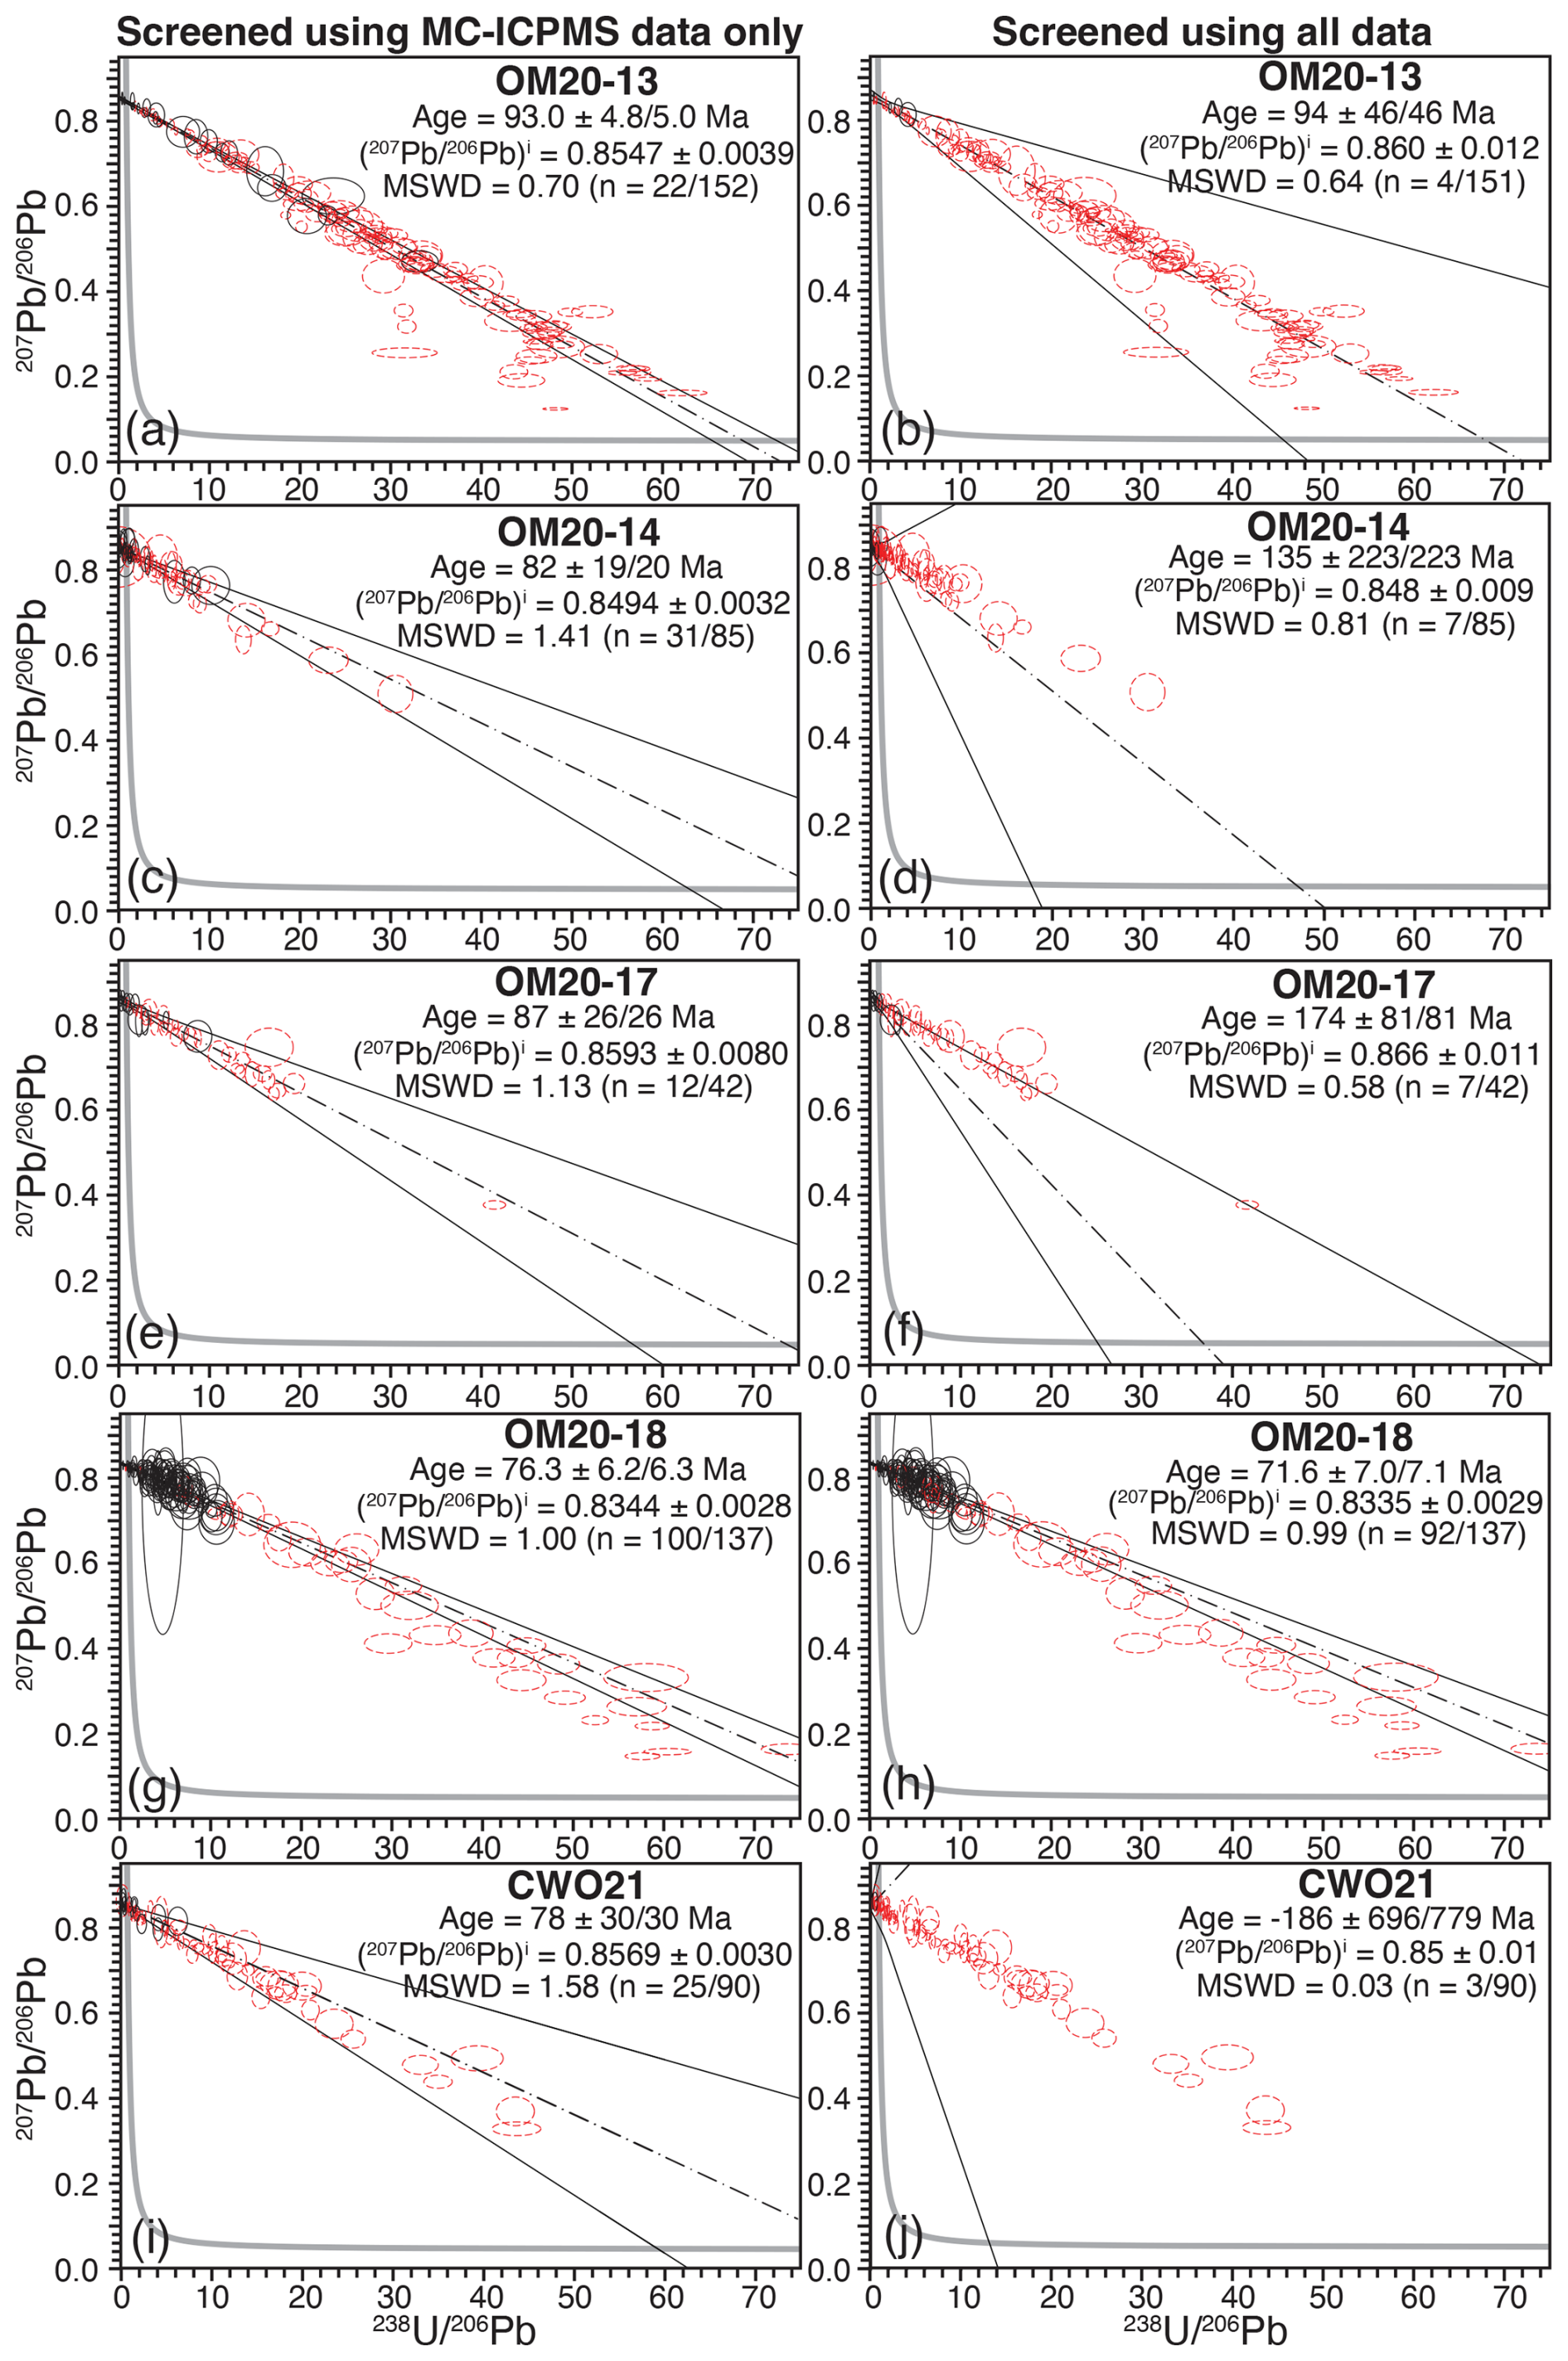
Figure 11Tera-Wasserburg diagrams of garnet U–Pb LASS-ICPMS analyses for OM20-13 (a, b), OM20-14 (c, d), OM20-17 (e, f), OM20-18 (g, h), and CWO21 (i, j) before and after screening for inclusions. Dashed red analyses show data that are not included in the regression. The dashed black line is the regression line, whereas the solid black lines are the 2 s error envelope, and the thick grey line is the concordia.
In our double-blind test, we discovered that most of the inclusion-affected analyses were identified by examining the U, Th, and Pb MC-ICPMS data alone; however, tens of analyses still showed zircon contamination after screening. In Fig. 12, we show examples of the time-resolved 238U and 208Pb signals for andradite garnet reference Mali Black (Fig. 12a), a low-Zr and low-radiogenic Pb garnet analysis from sample OM20-18 (Fig. 12b), and a high-Zr high-radiogenic Pb inclusion-contaminated garnet analysis from sample OM20-13 (Fig. 12c). The reference material analysis shows a flat stable signal in 238U and 208Pb, whereas the analysis of low-Zr garnet from OM20-18 shows a noisy, but relatively stable, signal for 238U at very low counts. Despite the elevated Zr content of analyses from OM20-13, there are no clear spikes in 238U and 208Pb that would indicate the ablation of distinct zircon inclusions (Fig. 12c). Instead, many high-Zr analyses show somewhat irregular downhole 238U and 208Pb signals but without the sharp spikes that are commonly indicative of the ablation of individual inclusions. In some analyses, areas of high 238U and 208Pb are observed; however, elevated U and Pb counts occur as low and broadened humps. Whereas relatively large individual zircon inclusions may show up as sharp spikes in the time-resolved U, Th, and Pb signals, here the zircon micro-inclusions contribute a very small volume to the overall signal (<0.1 vol. %). In our analyses, inclusion-dominated U, Th, and Pb signals are relatively smoothed due to the combination of the high frequency of zircon inclusions, small inclusion size, ultra-low U content of garnet, and large ablation spot size (193 µm). However, a rejection of all but the most stable signals (e.g. like those in Fig. 12c and d) produces identical results to the detailed screening for inclusions in our double-blind test. We therefore suggest that a conservative approach would be the total rejection of analyses that exhibit sloped and/or moderately unstable downhole signals, if split-stream data are not available.
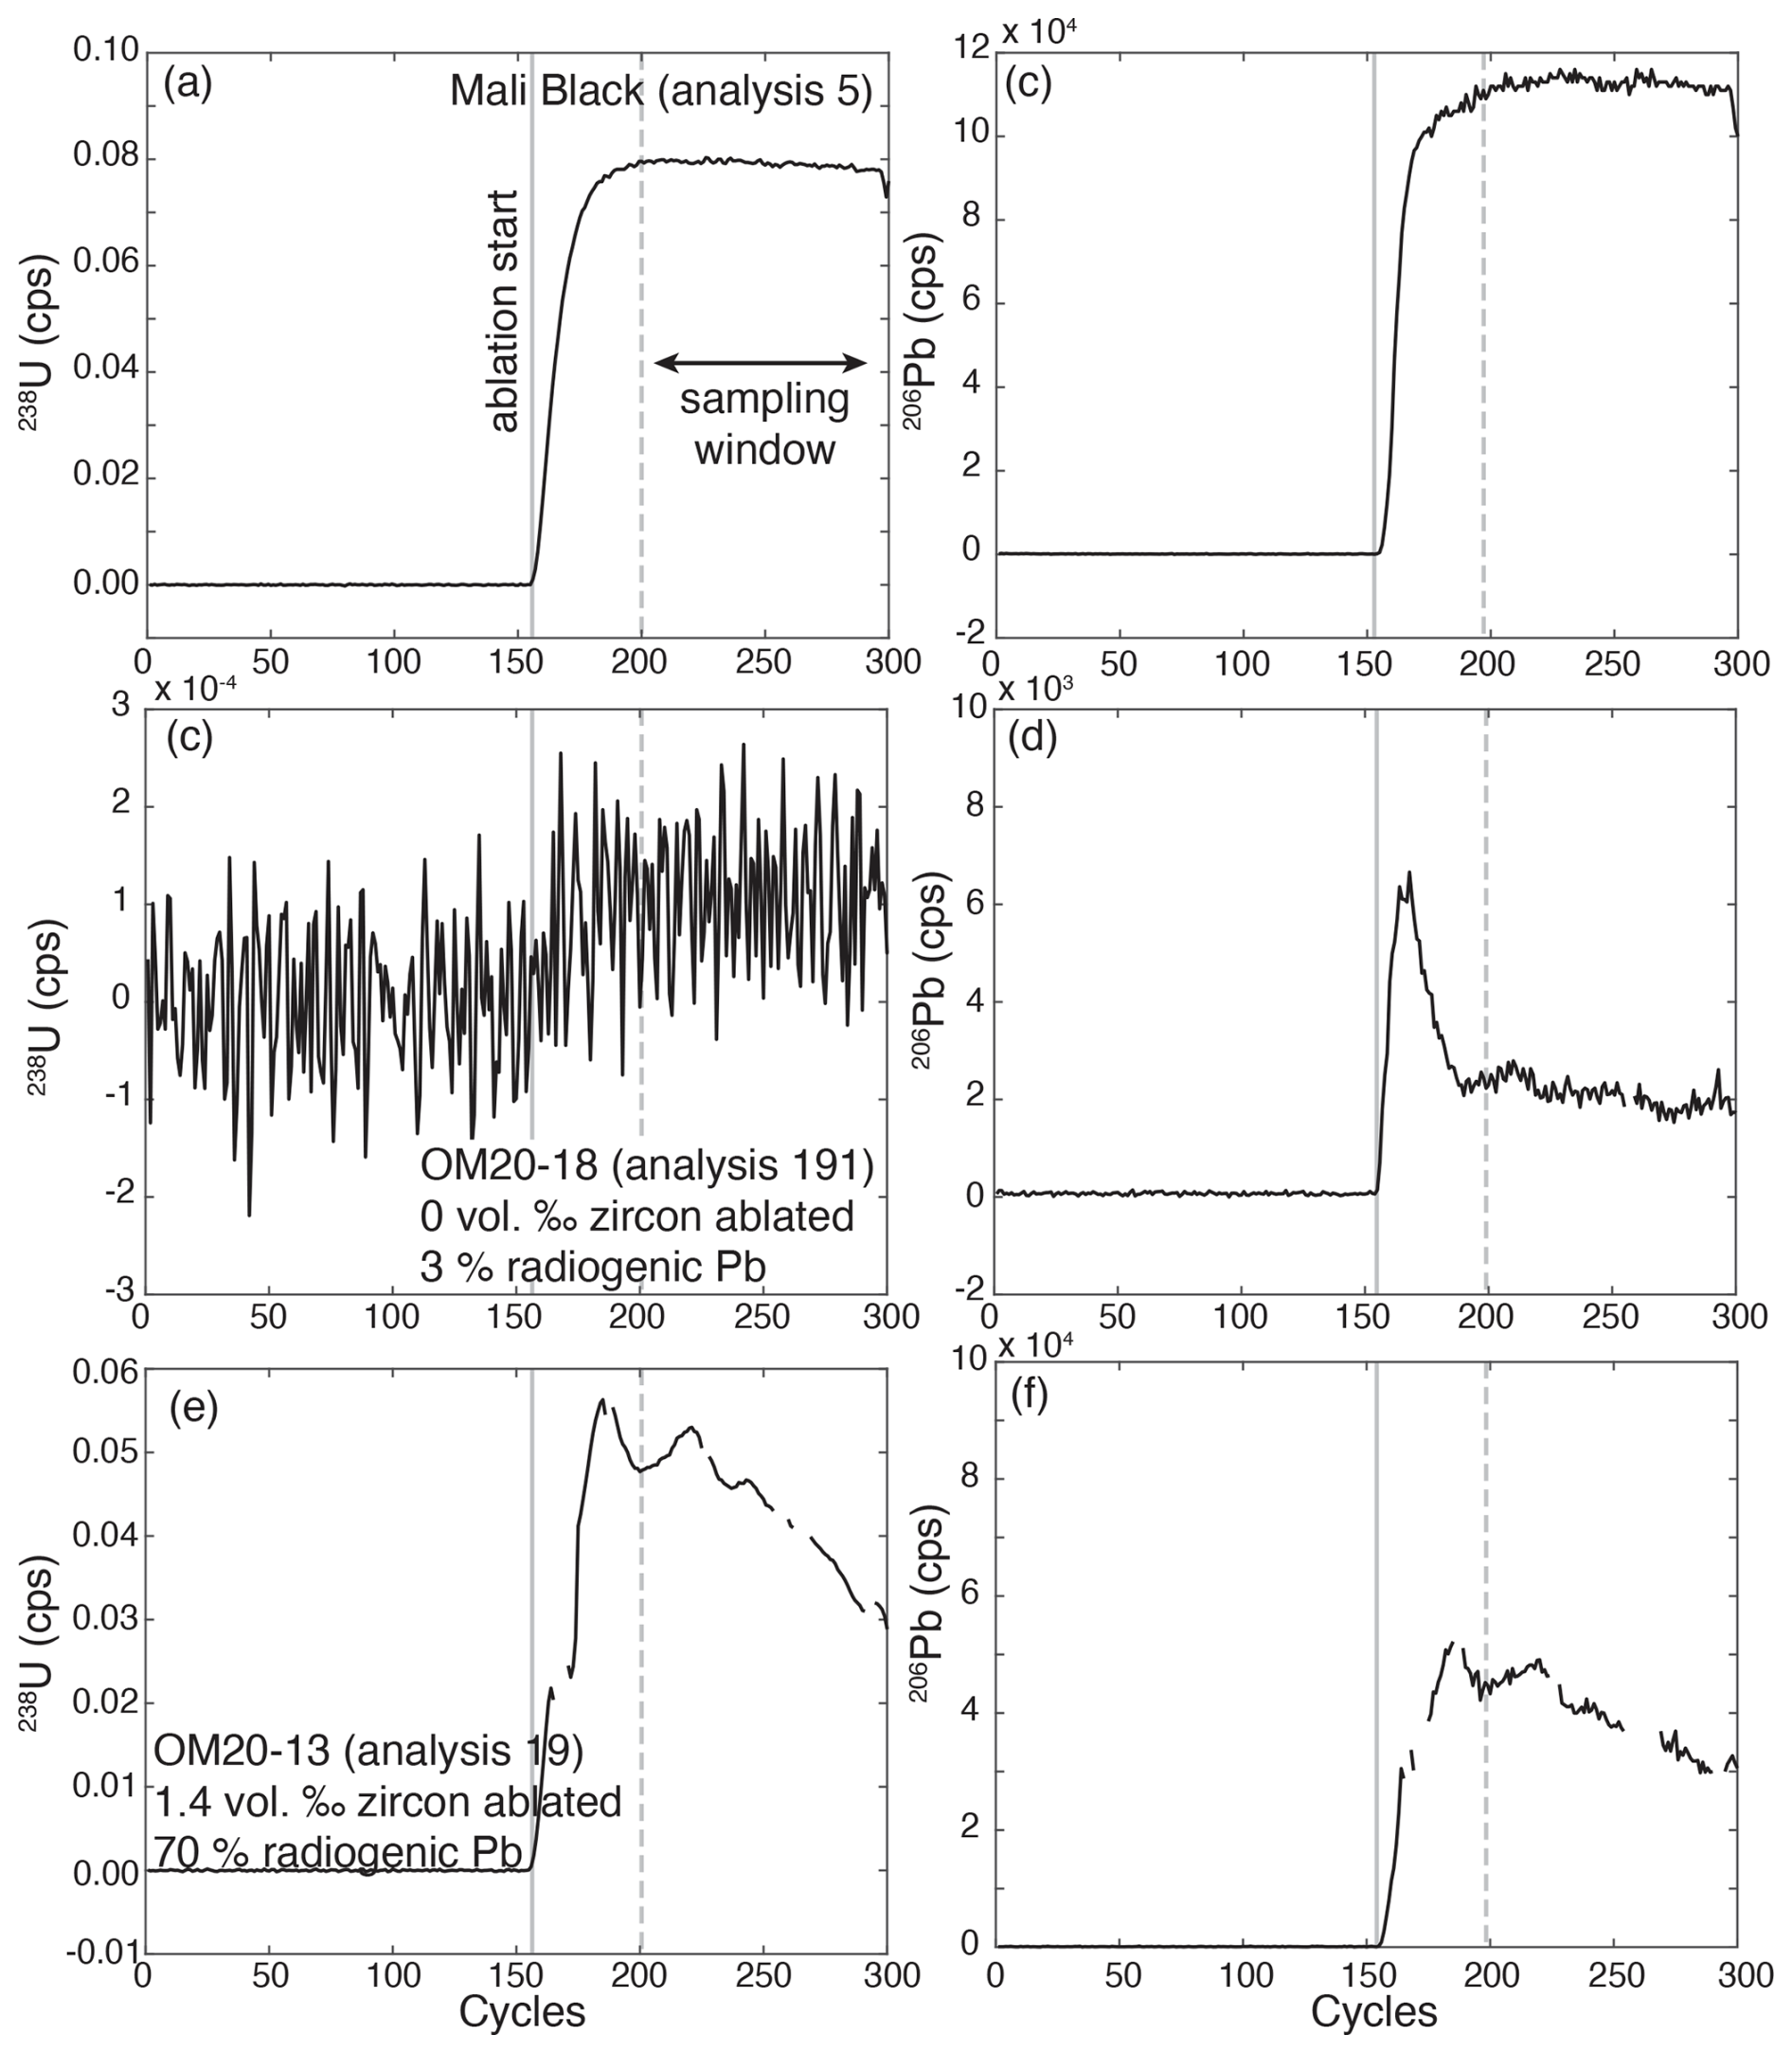
Figure 12Time-resolved 238U and 206Pb down hole signals (in counts per second, cps) for the Mali Black reference material (a, b), OM20-18 (c, d), and OM20-13 (e, f). Some electronic detector noise was removed (d, e, f). Note that whereas the U signal of (c) is noisy, the noise in 238U and 206Pb is somewhat correlated, such that there is significantly lower noise if 238U206Pb is plotted. Additionally, the mean 238U206Pb and associated standard error over the time interval are propagated into the intercept date calculation, resulting in lower uncertainties than one might at first expect from such a noisy signal.
The use of U and Th contents and ThU ratios measured on inclusion-free garnet as a cut-off remains a useful tool for identifying inclusion contamination (e.g. Millonig et al., 2020); however, some problems may arise. First, the U content of inclusion-free garnet is likely variable among different samples, meaning that a single universal U cut-off content should not be applied to all garnets in all samples and instead should be determined on a sample-by-sample basis. The locations for these analyses should be carefully selected optically and by scanning electron microscopy to minimise possible contamination. Second, the U content should be determined using the same analytical routine, instrument, and data reduction scheme to prevent possible biases. However, we demonstrate that simultaneous collection of U–Pb isotopic and trace-element data by LASS-ICPMS allows for more in-depth screening by expanding the compositional space considered. The Zr vs. U trends shown here can only be explained by the frequent ablation of micro-zircon inclusions in all five of our samples. Additionally, Zr is a more sensitive element to use to define a cut-off criterion compared to U in our samples, given Zr is a major element in zircon (wt. % level), whereas U typically occurs as a minor to trace element (hundreds to thousands of µg g−1 in most cases). Other elements may be more useful in high-T or Ti-rich garnets where Zr contents in garnet may be tens or hundreds of µg g−1. In such cases other elements, such as Hf, may be more useful than Zr. Regardless, LASS-ICPMS is a powerful tool for in situ U–Pb garnet geochronology; however, similar results may be obtained by taking a conservative approach to LA-ICPMS signal processing combined with examination of U, Th, ThU, and garnet microtextures.
6.3 Significance of the U–Pb dates
Our data demonstrate that the garnet U–Pb data measured here are dominated by contamination by micro-zircon inclusions. Therefore, the inclusions dated here must be coeval with or predate garnet growth. Inclusion contamination accounts for the apparent discrepancy between the 94–89 Ma U–Pb dates calculated here and the 81–77 Ma Sm–Nd garnet–whole-rock ages calculated by Garber et al. (2021). Unfortunately, for most samples only a few analyses remain after removing analyses with Zr contents elevated above the garnet background, and these data are insufficient to resolve meaningful garnet U–Pb concordia intercept ages (Fig. 11). Sample OM20-18 exhibits the fewest inclusions in garnet, both in our analyses and petrographically, and some radiogenic Pb is present in uncontaminated garnet analyses. Figure 11h shows the U–Pb isochron after removing analyses with elevated Zr contents, a procedure which results in a concordia intercept date of 72±7 Ma. This date is somewhat younger than the 81–77 Ma Sm–Nd garnet–whole-rock ages of Garber et al. (2021) but overlaps within uncertainty. The large uncertainties are the result of limited variation in 207Pb206Pb and 238U206Pb at high proportions of common Pb. Unfortunately, this date is not precise enough to resolve outstanding questions about the timing of garnet growth during HP–LT metamorphism at As Sifah.
The inclusion-affected analyses plot neatly along well-defined isochrons in Tera-Wasserburg space (Fig. 9), except for very few outliers. Some outliers plot along regression lines consistent with metamorphism at 81–77 Ma; however, the majority of analyses plot along regression lines consistent with 94–89 Ma intercept ages. These data suggest that the zircon inclusions in garnet formed over a narrow window in time. Previous studies have dated zircon from the eclogites of As Sifah to 82–78 Ma (Warren et al., 2003; Gray et al., 2004a; Garber et al., 2021), inconsistent with the 94–89 Ma U–Pb dates calculated here for the vast majority of zircon inclusions in garnet. Zircon grains separated by these studies are idioblastic, elongated along the c axis, and are 100–200 µm in length, whereas the minute zircon crystals included in garnet are typically ≤2 µm in diameter, xenoblastic, and equant (see also Warren et al., 2003, 2005). Gray et al. (2004a) showed that some zircon grains exhibit herringbone compositional zoning, possibly as the result of rapid crystallisation of zircon during exhumation, and suggested that the smaller zircon inclusions in garnet represent an older zircon population. If our inclusion-contaminated U–Pb data are accurate, the zircon micro-inclusion population in garnet formed at 94–89 Ma. These dates overlap with the timing of the drowning of the Arabian passive margin (Robertson, 1987). Sediment accumulation and burial of the continental margin may have resulted in low-grade metamorphism or hydrothermal alteration in the As Sifah rocks at this time.
The zircon grains dated here are extremely small, and the age of the ≤2 µm size fraction is never measured following zircon separation. Additionally, in situ dating of individual zircon grains of this size is beyond the spatial resolution of both LA-ICPMS and secondary-ion mass spectrometry. However, micro-zircons are common in low-grade metamorphic rocks and have been interpreted to form from the breakdown of precursor minerals, such as metamict detrital zircon (Dempster et al., 2008; Hay and Dempster, 2009) and baddeleyite, pyroxene, and ilmenite (Beckman and Möller, 2018). At low-grade conditions, reaction kinetics are slow, and Zr mobility is limited, which likely results in multiple nucleation sites for zircon and small crystal size. Micro-zircon grains that are trapped in porphyroblasts are preserved, whereas others may be recrystallised during prograde metamorphism via Ostwald ripening or other recrystallisation mechanisms. Such a process would produce at least two populations of zircon with distinct differences in grain size and age. Garnet does not necessarily need to grow and entrap the micro-zircon at the early stages of prograde metamorphism; instead zircon (re-)crystallisation may be overstepped and delayed until relatively high-grade conditions near the peak of metamorphism. As a result, there may be a large gap between the timing of micro-zircon crystallisation and their entrapment in garnet. Indeed, equilibrium thermodynamic calculations suggest that the garnet in reaction occurs at ∼450 °C, only 50–100 °C lower than the peak metamorphic T (Warren and Waters, 2006). A short period of garnet growth near the metamorphic peak is supported by the near complete overlap in Sm–Nd garnet ages of 81–77 Ma with U–Pb rutile ages 80–76 Ma, the latter of which are typically interpreted to reflect cooling (Warren et al., 2005; Garber et al., 2021). Therefore, our favoured interpretation of the 94–89 Ma dates obtained from the inclusion-contaminated analyses is that they reflect the timing of low-grade metamorphism or hydrothermal alteration of the Arabian margin prior to HP–LT metamorphism.
One alternative interpretation is that the 94–89 Ma dates arise from an analytical mismatch between the NIST-SRM614 glass and garnet U–Pb reference materials, relative to the zircon that contributed most of the measured U and Pb in the LASS-ICPMS analyses. Because of the minute volume (<0.1 vol. %) of ablated zircon in each analysis, we consider it unlikely that this would arise from laser-induced fractionation but could result from differential plasma-induced fractionation of the zircon + garnet-laced aerosol in the ICP. One way to evaluate these geologic vs. analytical interpretations would be to separate and digest garnet with abundant zircon micro-inclusions and then analyse them for U–Th–Pb isotopes by ID-TIMS, but this is beyond the scope of this study. However, Hollinetz et al. (2022) dated micro-zircon inclusions in chloritoid, obtaining an age consistent with K–Ar and 40Ar39Ar studies from the same structural unit, suggesting that bulk LA-ICPMS analysis of a low-U host and U-rich inclusions can successfully date the inclusions. Regardless, the LASS-ICPMS analyses cannot be interpreted as the timing of garnet growth in the As Sifah rocks.
In situ U–Pb garnet geochronology is a powerful tool to date a key metamorphic mineral at a high spatial resolution relative to ID-TIMS Sm–Nd and MC-ICPMS Lu–Hf garnet geochronology. Whereas grossular–andradite series and Ti-rich garnets can contain tens of micrograms per gram (µg g−1) of U, few studies have attempted to date common metamorphic garnets, which typically contain of U. Here we show that eclogitic garnet may exhibit very low U contents (1–20 ng g−1) and that co-ablated microscopic zircon inclusions may totally overwhelm the U signal. In many rocks, such as metasediments, igneous rocks formed by crustal partial melting, and polymetamorphic rocks, there may not be a single inclusion age population. In these cases, analyses plotted in Tera-Wasserburg space may be scattered, such that any single regression line is not possible. However, we demonstrate that U–Pb analyses of garnet may also produce discrete well-defined regressions that are inclusion dominated and difficult to distinguish from inclusion-free garnet analyses based on U and Pb isotopic data alone. Contamination of the U–Pb system by zircon micro-inclusions is nearly universal across our dataset, and it is these inclusions which define the U–Pb regression lines, unless very rigorous data filtering is applied. The inclusions are sufficiently small, frequent, and dispersed across their garnet host that they do not always produce clear spikes in the time-resolved U, Th, and Pb signals during analysis. However, many time-resolved signals still show slight to moderate irregularities with broad low-intensity peaks that must be taken as indicators of co-ablation of inclusions. We demonstrate that such ambiguous analyses need to be identified by intense screening. They are clearly identified as co-ablation of zircon inclusions by examining the full LASS-ICPMS dataset. We suggest caution when conducting in situ U–Pb garnet geochronology of inclusion-rich low U garnet if only U, Th, and Pb isotopes are measured, particularly if relatively few radiogenic analyses define the isochron. Therefore, we recommend the following:
-
Electron microscopy should be used to check for inclusions that are too small to identify optically, ideally using a field emission gun for high spatial resolution.
-
If inclusions are suspected, smaller-scale analyses of pre-selected clean garnet regions can be used to determine the background U, Th, and Pb contents and ThU to determine meaningful cut-offs.
-
If the garnet is particularly low in U, Th, and Pb, the co-ablation of small inclusions can produce slight shifts in these elements. In this case, trace elements, such as Zr, Hf, Nb, and Ce, by LASS-ICPMS allow for more sensitive cut-off values and a more thorough screening of potential contamination.
-
If trace elements cannot be collected simultaneously and inclusions are observed petrographically, the most conservative and safest approach is to reject all unstable analyses (e.g. minor undulations, positive or negative slope in the time-resolved U, Th, or Pb count rates) as potentially contaminated (in combination with U, Th, Pb, and ThU cut-off values). However, this approach should be taken as a last resort.
On the other hand, it may be possible to retrieve meaningful bulk U–Pb dates for zircon micro-inclusion rich garnet; however, these dates may reflect processes that pre-date garnet growth. To this point, if the 94–89 Ma U–Pb zircon micro-inclusion in garnet dates determined here does have geologic meaning, we suggest that they could reflect a low-grade metamorphic or hydrothermal event during flooding of and sediment deposition or burial on the Arabian margin prior to HP–LT metamorphism.
All data are included in the text (Sect. 5) and the Supplement.
The supplement related to this article is available online at https://doi.org/10.5194/gchron-7-309-2025-supplement.
JBW conceptualised the study, collected the samples, conducted petrologic and isotopic characterisation and analysis, and wrote the manuscript. All co-authors contributed to the writing of the manuscript. JMG provided additional samples for the study, assisted with interpretation, and provided expertise on Oman geology. AB, LJM, and AG assisted with setting up the protocol and conducting LASS-ICP-MS analyses and data processing and quality control. TG assisted with analyses and securing funding. HRM assisted in the study design, sample collection, and data interpretation.
The contact author has declared that none of the authors has any competing interests.
Publisher's note: Copernicus Publications remains neutral with regard to jurisdictional claims made in the text, published maps, institutional affiliations, or any other geographical representation in this paper. While Copernicus Publications makes every effort to include appropriate place names, the final responsibility lies with the authors.
Andreas Scharf at Sultan Qaboos University, Oman, is thanked for technical assistance during fieldwork. We are also indebted to Silke Voigt, who co-led the excursion to Oman in February 2020. We thank associate editor Ryan Ickert and editor Klaus Mezger for handling this paper. We also thank Clare Warren and Christopher McFarlane for their comprehensive and insightful reviews. This is FIERCE contribution no. 198.
Jesse B. Walters acknowledges support from the German Science Foundation (DFG) grant 464606040. Joshu M. Garber acknowledges support from National Science Foundation (USA) grant EAR-2120931, as well as The Pennsylvania State University for its support of the LionChron facility. Tobias Grützner acknowledges support from the Johanna Quandt Young Academy Foundation, which covered costs for LASS-ICPMS analyses. FIERCE is financially supported by the Deutsche Forschungsgemeinschaft (DFG: INST 161/921-1 FUGG, INST 161/923-1 FUGG and INST 161/1073-1 FUGG), and received financial support from the Wilhelm and Else Heraeus Foundation, which is gratefully acknowledged. Jesse B. Walters acknowledges additional financial support by the University of Graz.
This research has been supported by the Deutsche Forschungsgemeinschaft (grant nos. 464606040, INST 161/921-1 FUGG, INST 161/923-1 FUGG, and INST 161/1073-1 FUGG), National Science Foundation (USA, grant no. EAR-2120931, the Johanna Quandt Young Academy Foundation, the Wilhelm and Else Heraeus Foundation, and the University of Graz.
This paper was edited by Ryan Ickert and reviewed by Clare Warren and Christopher McFarlane.
Agard, P., Searle, M. P., Alsop, G. I., and Dubacq, B.: Crustal stacking and expulsion tectonics during continental subduction: P-T deformation constraints from Oman, Tectonics, 29, TC5018, https://doi.org/10.1029/2010TC002669, 2010.
Ambrose, T. K., Waters, D. J., Searle, M. P., Gopon, P., and Forshaw, J. B.: Burial, accretion, and exhumation of the metamorphic sole of the Oman-UAE ophiolite, Tectonics, 40, e2020TC006392, https://doi.org/10.1029/2020TC006392, 2021.
Bartoli, O., Millonig, L. J., Carvalho, B. B., Marschall, H. R., and Gerdes, A.: The Age of Granulite-Facies Metamorphism in the Ivrea–Verbano Zone (NW Italy) Determined Through in situ U–Pb Dating of Garnet, J. Petrol., 65, egae083, https://doi.org/10.1093/petrology/egae083, 2024.
Baxter, E. F., Caddick, M. J., and Dragovic, B.: Garnet: a rock-forming mineral petrochronometer, Rev. Mineral Geochem., 83, 469–533, 2017.
Beckman, V. and Möller, C.: Prograde metamorphic zircon formation in gabbroic rocks: The tale of microtextures, J. Metamorph. Geol., 36, 1221–1236, 2018.
Belgrano, T. M. and Diamond, L. W.: Subduction-zone contributions to axial volcanism in the Oman-UAE ophiolite, Lithosphere, 11, 399–411, https://doi.org/10.1130/L1045.1, 2019.
Beno, C. J., Lackey, J. S., Schmitz, M. D., Bowman, J. R., Stearns, M. A., Bartley, J. M., and Fernandez, D. P.: Assessment of natural reference materials for U–Pb geochronology of grossular-andradite garnet, Geostand. Geoanal. Res., 48, 909–925, https://doi.org/10.1111/ggr.12561, 2024.
Blichert-Toft, J., Chauvel, C., and Albaréde, F.: Separation of Hf and Lu for high-precision isotope analysis of rock samples by magnetic sector-multiple collector ICP-MS, Contrib. Mineral. Petr., 127, 248–260, https://doi.org/10.1007/s004100050278, 1997.
Burisch, M., Gerdes, A., Meinert, L. D., Albert, R., Seifert, T., and Gutzmer, J.: The essence of time – fertile skarn formation in the Variscan Orogenic Belt, Earth Planet Sc. Lett., 519, 165–170, https://doi.org/10.1016/j.epsl.2019.05.015, 2019.
Burisch, M., Bussey, S. D., Landon, N., Nasi, C., Kakarieka, A., Gerdes, A., Albert, R., Stein, H. J., Gabites, J. A., Friedman, R. M., and Meinert, L. D.: Timing of magmatism and skarn formation at the Limon, Guajes, and Media Luna gold ± copper skarn deposits at Morelos, Guerrero State, Mexico, Econ. Geol., 118, 695–718, https://doi.org/10.5382/econgeo.4985, 2023.
Caddick, M. J. and Kohn, M. J.: Garnet: witness to the evolution of destructive plate boundaries, Elements, 9, 427–432, 2013.
Ceccato, A., Behr, W. M., Zappone, A. S., Tavazzani, L., and Giuliani, A.: Structural evolution, exhumation rates, and rheology of the European crust during Alpine collision: Constraints from the Rotondo Granite – Gotthard Nappe, Tectonics, 43, e2023TC008219, https://doi.org/10.1029/2023TC008219, 2024.
Chauvet, F., Dumont, T., and Basile, C.: Structures and timing of Permian rifting in the central Oman Mountains (Saih Hatat), Tectonophysics, 475, 563–574, https://doi.org/10.1016/j.tecto.2009.07.008, 2009.
Christensen, J. N., Rosenfeld, J. L., and DePaolo, D. J.: Rates of tectonometamorphic processes from Rubidium and Strontium isotopes in garnet, Science, 244, 1465–1469, https://doi.org/10.1126/science.244.4911.1465, 1989.
Corrie, S. L. and Kohn, M.J: Metamorphic history of the central Himalaya, Annapurna region, Nepal, and implications for tectonic models, GSA Bulletin, 123, 1863–1879, https://doi.org/10.1130/B30376.1, 2011.
Cowan, R. J., Searle, M. P., and Waters, D. J. Structure of the metamorphic sole to the Oman Ophiolite, Sumeini Window and Wadi Tayyin: Implications for ophiolite obduction processes, Geol. Soc. London Spec. Publ., 392, 155–175, https://doi.org/10.1144/SP392.8, 2014.
Dempster, T. J., Hay, D. C., Gordon, S. H., and Kelly, N. M.: Micro-zircon: Origin and evolution during metamorphism, J. Metamorph. Geol., 26, 499–507, https://doi.org/10.1111/j.1525-1314.2008.00772.x, 2008.
DeWolf, C. P., Zeissler, C. J., Halliday, A. N., Mezger, K., and Essene, E. J.: The role of inclusions in U–Pb and Sm–Nd garnet geochronology: Stepwise dissolution experiments and trace uranium mapping by fission track analysis, Geochim. Cosmochim. Ac., 60, 121–134, 1996.
Duretz, T., Agard, P., Yamato, P., Ducassou, C., Burov, E. B., and Gerya, T. V.: Thermo-mechanical modeling of the obduction process based on the Oman Ophiolite case, Gondwana Res., 32, 1–10, https://doi.org/10.1016/j.gr.2015.02.002, 2016.
El-Shazly, A. E.-D., Coleman, R. G., and Liou, J. G.: Eclogites and blueschists from Northeastern Oman: petrology and P-T evolution, J. Petrol., 31, 629–666, https://doi.org/10.1093/petrology/31.3.629, 1990.
El-Shazly, A. K.: Are pressures for blueschists and eclogites overestimated? The case from NE Oman, Lithos, 56, 231–264, https://doi.org/10.1016/S0024-4937(00)00050-5, 2001.
El-Shazly, A. K. and Lanphere, M. A.: Two high-pressure metamorphic events in NE Oman: Evidence from 40Ar39Ar dating and petrological data. J. Geol., 100, 731–751, https://doi.org/10.1086/629625, 1992.
El-Shazly, A. K., Bröcker, M., Hacker, B., and Calvert, A.: Formation and exhumation of blueschists and eclogites from NE Oman: New perspectives from Rb–Sr and 40Ar39Ar dating, J. Metamorph. Geol., 19, 233–248, https://doi.org/10.1046/j.1525-1314.2001.00309.x, 2001.
Garber, J. M., Rioux, M., Searle, M. P., Kylander-Clark, A. R. C., Hacker, B. R., Vervoort, J., Warren, C. J., and Smye, A. J.: Dating continental subduction beneath the Samail Ophiolite: garnet, zircon, and rutile petrochronology of the As Sifah eclogites, NE Oman, J. Geophys. Res.-Sol. Ea., 126, e2021JB022715, https://doi.org/10.1029/2021JB022715, 2021.
Gerdes, A. and Zeh, A.: Combined U–Pb and Hf isotope LA-(MC-) ICP-MS analyses of detrital zircons: Comparison with SHRIMP and new constraints for the provenance and age of an Amorican metasediment in Central Germany, Earth Planet. Sc. Lett., 239, 47–61, 2006.
Gerdes, A. and Zeh, A.: Zircon formation versus zircon alteration – new insights from combined U–Pb and Lu–Hf in situ LA-ICP-MS analyses, and consequences for the interpretation of Archean zircon from the Central Zone of the Limpopo Belt, Chem. Geol., 261, 230–243, 2009.
Ghent, E. D. and Stout, M. Z.: Metamorphism at the base of the Samail Ophiolite, southeastern Oman Mountains, J. Geophys. Res., 86, 2557–2571, https://doi.org/10.1029/JB086iB04p02557, 1981.
Gibson, H. D., Carr, S. D., Brown, R. L., and Hamilton, M. A.: Correlations between chemical and age domains in monazite, and metamorphic reactions involving major pelitic phases: an integration of ID-TIMS and SHRIMP geochronology with Y–Th–U X-ray mapping, Chem. Geol., 211, 237–260, 2004.
Gnos, E: Peak metamorphic conditions of garnet amphibolites beneath the Semail ophiolite: Implications for an inverted pressure gradient, Int. Geol. Rev., 40, 281–304, https://doi.org/10.1080/00206819809465210, 1998.
Goffé, B., Michard, A., Kienast, J. R., and Le Mer, O.: A case of obduction-related high-pressure, low-temperature metamorphism in upper crustal nappes, Arabian continental margin, Oman: P–T paths and kinematic interpretation, Tectonophysics, 151, 363–386, https://doi.org/10.1016/0040-1951(88)90253-3, 1988.
Gray, D. R., Hand, M., Mawby, J., Armstrong, R. A., Miller, J. M., and Gregory, R. T.: Sm–Nd and Zircon U–Pb ages from garnet-bearing eclogites, NE Oman: Constraints on High-P metamorphism, Earth Planet. Sc. Lett., 222, 407–422, https://doi.org/10.1016/j.epsl.2004.03.016, 2004a.
Gray, D. R., Miller, J. M., Foster, D. A., and Gregory, R. T.: Transition from subduction- to exhumation-related fabrics in glaucophane-bearing eclogites, Oman: Evidence from relative fabric chronology and 40Ar39Ar ages, Tectonophysics, 389, 35–64, https://doi.org/10.1016/j.tecto.2004.06.016, 2004b.
Gray, D. R., Gregory, R. T., Armstrong, R. A., Richards, I. J., and Miller, J. M.: Age and stratigraphic relationships of structurally deepest level rocks, Oman Mountains: U/Pb SHRIMP evidence for late carboniferous neotethys rifting, J. Geol., 113, 611–626, https://doi.org/10.1086/449325, 2005.
Goscombe, B., Foster, D. A., Gray, D. R., Kelsey, D., and Wade, B.: Metamorphic response within different subduction–obduction settings preserved on the NE Arabian margin, Gondwana Res., 83, 298–371, https://doi.org/10.1016/j.gr.2020.02.002, 2020.
Guilmette, C., Smit, M. A., van Hinsbergen, D. J. J., Gürer, D., Corfu, F., Charette, B., Maffione, M., Rabeau, O., Savard, D.: Forced subduction initiation recorded in the sole and crust of the Semail Ophiolite of Oman, Nat. Geosci., 11, 688–695, https://doi.org/10.1038/s41561-018-0209-2, 2018.
Hacker, B. R. and Mosenfelder, J. L.: Metamorphism and deformation along the emplacement thrust of the Samail ophiolite, Oman, Earth Planet. Sc. Lett., 144, 435–451, https://doi.org/10.1016/s0012-821x(96)00186-0, 1996.
Hacker, B. R., Mosenfelder, J. L., and Gnos, E.: Rapid emplacement of the Oman ophiolite: Thermal and geochronologic constraints, Tectonics, 15, 1230–1247, https://doi.org/10.1029/96tc01973, 1996.
Hansman, R. J., Ring, U., Scharf, A., Glodny, J., and Wan, B.: Structural architecture and Late Cretaceous exhumation history of the Saih Hatat Dome (Oman), a review based on existing data and semi-restorable cross-sections, Earth Sci. Rev., 217, 103595, https://doi.org/10.1016/j.earscirev.2021.103595, 2021.
Hay, D. C. and Dempster, T. J.: Zircon behaviour during low-temperature metamorphism, J. Petrol., 50, 571–589, https://doi.org/10.1093/petrology/egp011, 2009.
Hollinetz, M. S., Schneider, D. A., McFarlane, C. R. M., Huet, B., Rantitsch, G., and Grasemann, B.: Bulk inclusion micro-zircon U–Pb geochronology: A new tool to date low-grade metamorphism, J. Metamorph. Geol., 40, 207–227, https://doi.org/10.1111/jmg.12624, 2022.
Horstwood, M. S. A., Košler, J., Gehrels, G., Jackson, S. E., McLean, N. M., Paton, C., Pearson, N. J., Sircombe, K., Sylvester, P., Vermeesch, P., Bowring, J. F., Condon, D. J., and Schoene, B.: Community-derived standards for LA-ICP-MS U–(Th–)Pb geochronology—uncertainty propagation, age interpretation and data reporting, Geostand. Geoanal. Res., 40, 311–332, 2016.
Ishikawa, T., Nagaishi, K., and Umino, S.: Boninitic volcanism in the Oman ophiolite: Implications for thermal condition during transition from spreading ridge to arc, Geology, 30, 899–902, https://doi.org/10.1130/0091-7613(2002)030<0899:BVITOO>2.0.CO;2, 2002.
Jochum, K. P., Stoll, B., Herwig, K., Willbold, M., Hofmann, A. W., Amini, M., Aarburg, S., Abouchami, W., Hellebrand, E., Mocek, B., Raczek, I., Stracke, A., Alard, O., Bouman, C., Becker, S., Dücking, M., Brätz, H., Klemd, R., de Bruin, D., Canil, D., Cornell, D., de Hoog, C.-J., Dalpé, C., Danyushevsky, L., Eisenhauer, A., Gao, Y., Snow, J. E., Groschopf, N., Günther, D., Latkoczy, C., Guillong, M., Hauri, E. H., Höfer, H. E., Lahaye, Y., Horz, K., Jacob, D. E., Kasemann, S. A., Kent, A. J. R., Ludwig, T., Zack, T., Mason, P. R. D., Meixner, A., Rosner, M., Misawa, K., Nash, B. P., Pfänder, J., Premo, W. R., Sun, W. D., Tiepolo, M., Vannucci, R., Vennemann, T., Wayne, D., and Woodhead, J. D.: MPI-DING reference glasses for in situ microanalysis: New reference values for element concentrations and isotope ratios, Geochem. Geophy. Geosy., 7, Q02008, https://doi.org/10.1029/2005GC001060, 2006.
Jochum, K. P., Weis, U., Stoll, B., Kuzmin, D., Yang, Q., Raczek, L., Jacob, D. E., Stracke, A., Birbaum, K., Frick, D. A., Günther, D., and Enzwiler, J.: Determination of reference values for NISTSRM 610-617 glasses following ISO guidelines, Geostand. Geoanal. Res., 35, 397–429, 2011.
Kelley, S.: Excess argon in K–Ar and Ar–Ar geochronology, Chem. Geol., 188, 1–22, https://doi.org/10.1016/S0009-2541(02)00064-5, 2002.
Kohn, M. J., Corrie, S. L., and Markley, C.: The fall and rise of metamorphic zircon, Am. Mineral., 100, 897–908, 2015.
Kotowski, A. J., Cloos, M., Stockli, D. F., and Orent, E. B.: Structural and thermal evolution of an infant subduction shear zone: Insights from sub-ophiolite metamorphic rocks recovered from Oman Drilling Project Site BT-1B, J. Geophys. Res., 126, e2021JB021702, https://doi.org/10.1029/2021JB021702, 2021.
Kusano, Y., Umino, S., Shinjo, R., Ikei, A., Adachi, Y., Miyashita, S., and Arai, S.: Contribution of slab-derived fluid and sedimentary melt in the incipient arc magmas with development of the paleo-arc in the Oman ophiolite, Chem. Geol., 449, 206–225, https://doi.org/10.1016/j.chemgeo.2016.12.012, 2017.
Lima, S. M., Corfu, F., Neiva, A. M. R., and Ramos, J. M. F.: U–Pb ID-TIMS dating applied to U-rich inclusions in garnet, Am. Mineral., 97, 800–806, https://doi.org/10.2138/am.2012.3930, 2012.
Ludwig, K. R.: User's manual for Isoplot Version 3.75–5.14: a geochronological toolkit for Microsoft Excel, Berkeley Geochron. Center Special Pub., 5, 1–72, 2012.
Mann, A. and Hanna, S. S.: The tectonic evolution of pre-Permian rocks, Central and Southeastern Oman Mountains, Geol. Soc. London Spec. Publ., 49, 307–325, https://doi.org/10.1144/gsl.sp.1992.049.01.19, 1990.
Mark, C., O'Sullivan, G., Glorie, S., Simpson, A., Andò, S., Barbarano, M., Stutenbecker, L., Daly, S. J., and Gilbert, S.: Detrital garnet geochronology by in situ U–Pb and Lu–Hf analysis: a case study from the European Alps, J. Geophys. Res.-Earth, 128, e2023JF007244, https://doi.org/10.1029/2023JF007244, 2023.
Massonne, H.-J., Opitz, J., Theye, T., and Nasir, S.: Evolution of a very deeply subducted metasediment from As Sifah, northeastern coast of Oman, Lithos, 156, 171–185, https://doi.org/10.1016/j.lithos.2012.11.009, 2013.
Mattinson, J. M.: Revolution and Evolution: 100 years of U–Pb geochronology, Elements, 9, 53–57, https://doi.org/10.2113/gselements.9.1.53, 2013.
Mezger, K., Hanson, G. N., and Bohlen, S. R.: U–Pb systematics of garnet: dating the growth of garnet in the late Archean Pikwitonei granulite domain at Cauchon and Natawahunan Lakes, Manitoba, Canada, Contrib. Mineral. Petr., 101, 136–148, 1989.
Miller, J. M., Gregory, R. T., Gray, D. R., and Foster, D. A.: Geological and geochronological constraints on the exhumation of a high-pressure metamorphic terrane, Oman, Geol. Soc. London Spec. Publ., 154, 241–260, https://doi.org/10.1144/gsl.sp.1999.154.01.11, 1999.
Miller, J. M., Gray, D. R., and Gregory, R. T.: Geometry and significance of internal windows and regional isoclinal folds in northeast Saih Hatat, Sultanate of Oman, J. Struct. Geol., 24, 359–386, https://doi.org/10.1016/S0191-8141(01)00061-X, 2002.
Millonig, L. J., Albert, R., Gerdes, A., Avigad, D., and Dietsch, C.: Exploring laser ablation U–Pb dating of regional metamorphic garnet – The Straits Schist, Connecticut, USA, Earth Planet. Sc. Lett., 552, 116589, https://doi.org/10.1016/j.epsl.2020.116589, 2020.
Montigny, R., Le Mer, O., Thuizat, R., and Whitechurch, H.: K–Ar and Ar study of metamorphic rocks associated with the Oman ophiolite: Tectonic implications, Tectonophysics, 151, 345–362, https://doi.org/10.1016/0040-1951(88)90252-1, 1988.
Nesheim, T. O., Vervoort, J. D., McClelland, W. C., Gilotti, J. A., and Lang, H. M.: Mesoproterozoic syntectonic garnet within Belt Supergroup metamorphic tectonites: Evidence of Grenville-age metamorphism and deformation along northwest Laurentia, Lithos, 134–135, 91–107, https://doi.org/10.1016/j.lithos.2011.12.008, 2012.
Nicolas, A., Boudier, F., Ildefonse, B., and Ball, E.: Accretion of Oman and the United Arab Emirates ophiolite – Discussion of a new structural ma, Marine Geophys. Res., 21, 147–180, https://doi.org/10.1023/a:1026769727917, 2000.
Norris, A. and Danyushevsky, L.: Towards estimating the complete uncertainty budget of quantified results measured by LA-ICP-MS, Goldschmidt abstracts, Boston, 2018.
O'Sullivan, G. J., Hoare, B. C., Mark, C., Drakou, F., and Tomlinson, E. L.: Uranium-lead geochronology applied to pyrope garnet with very low concentrations of uranium, Geol. Mag., 160, 1010–1019, https://doi.org/10.1017/S0016756823000122, 2023.
Paton, C., Hellstrom, J., Paul, B., Woodhead, J., and Hergt, J.: Iolite: Freeware for the visualisation and processing of mass spectrometric data, J. Anal. Atom. Spectrom., 26, 2508–2518, 2011.
Pearce, J. A., Alabaster, T., Shelton, A. W., and Searle, M. P., The Oman ophiolite as a cretaceous arc-basin complex: Evidence and implications, Philos. T. R. Soc. A, 300, 299–317, 1981.
Pearce, N. J. G., Perkins, W. T., Westgate, J. A., Gorton, M. P., Jackson, S. E., Neal, C. R., and Chenery, S. P.: A Compilation of New and Published Major and Trace Element Data for NIST SRM 610 and NIST SRM 612 Glass Reference Materials, Geostandard Newslett., 21, 115–144, 1997.
Peillod, A., Patten, C. G. C., Drüppel, K., Beranoaguirre, A., Zeh, A., Gudelius, D., Hector, S., Majka, J., Kleine-Marschall, B. I., Karlson, A., Gerdes, A., and Kolb, J.: Disruption of a high-pressure unit during exhumation: Example of the Cycladic Blueschist unit (Thera, Ios and Naxos islands, Greece), J. Metamorph. Geol., 42, 225–255, https://doi.org/10.1111/jmg.12753, 2024.
Pollington, A. D. and Baxter, E. F.: High resolution Sm–Nd garnet geochronology reveals the uneven pace of tectonometamorphic processes, Earth Planet. Sc. Lett., 293, 63–71, 2010.
Pyle, J. M. and Spear, F. S.: Yttrium zoning in garnet: coupling of major and accessory phases during metamorphic reactions, Geol. Mat. Res., 1, 1–49, 1999.
Pyle, J. M. and Spear, F. S.: Four generations of accessory-phase growth in low-pressure migmatites from SW New Hampshire, Am. Min., 88, 338–351, 2003.
Ring, U., Glodny, J., Hansman, R., Scharf, A., Mattern, F., Callegari, I., van Hinsbergen, D. J. J., Willner, A., and Hong, Y.: The Samail subduction zone dilemma: Geochronology of high-pressure rocks from the Saih Hatat window, Oman, reveals juxtaposition of two subduction zones with contrasting thermal histories, Earth Sci. Rev., 250, 104711, https://doi.org/10.1016/j.earscirev.2024.104711, 2024.
Rioux, M., Bowring, S. A., Kelemen, P. B., Gordon, S., Dudás, F., and Miller, R.: Rapid crustal accretion and magma assimilation in the Oman- U. A. E. ophiolite: High precision U–Pb zircon geochronology of the gabbroic crust, J. Geophys. Res., 117, https://doi.org/10.1029/2012JB009273, 2012.
Rioux, M., Bowring, S. A., Kelemen, P., Gordon, S., Miller, R., and Dudás, F.: Tectonic development of the Samail ophiolite: High-precision U–Pb zircon geochronology and Sm–Nd isotopic constraints on crustal growth and emplacement, J. Geophys. Res.-Sol. Ea., 118, 2085–2101, https://doi.org/10.1002/jgrb.50139, 2013.
Rioux, M., Garber, J., Bauer, A., Bowring, S., Searle, M., Kelemen, P., and Hacker, B.: Synchronous formation of the metamorphic sole and igneous crust of the Semail ophiolite: New constraints on the tectonic evolution during ophiolite formation from high-precision U–Pb zircon geochronology, Earth Planet. Sc. Lett., 451, 185–195, https://doi.org/10.1016/j.epsl.2016.06.051, 2016.
Rioux, M., Benoit, M., Amri, I., Ceuleneer, G., Garber, J. M., Searle, M., and Leal, K.: The origin of felsic intrusions within the mantle section of the Samail ophiolite: Geochemical evidence for three distinct mixing and fractionation trends, J. Geophys. Res.-Sol. Ea., 126, e2020JB020760, https://doi.org/10.1029/2020JB020760, 2021.
Rioux, M., Garber, J. M., Searle, M., Crowley, J. L., Stevens, S., Schmitz, M., Kylander-Clark, A. R. C., Leal, K., Ambrose, T., and Smye, A. J.: The temporal evolution of subduction initiation in the Samail ophiolite: high-precision U–Pb zircon petrochronology of the metamorphic sole, J. Metamorph. Geol., 41, 817–847, https://doi.org/10.1111/jmg.12719, 2023.
Robertson, A. H. F.: Upper cretaceous muti formation: Transition of a Mesozoic carbonate platform to a foreland basin in the Oman Mountains, Sedimentology, 34, 1123–1142, https://doi.org/10.1111/j.1365-3091.1987.tb00596.x, 1987.
Rubatto, D.: Zircon trace element geochemistry: partitioning with garnet and the link between U–Pb ages and metamorphism, Chem. Geol., 184, 123–138, 2002.
Schannor, M., Lana, C., Nicoli, G., Cutts, K., Buick, I., Gerdes, A., and Hecht, L.: Reconstructing the metamorphic evolution of the Araçuaí orogen (SE Brazil) using in situ U–Pb garnet dating and P–T modelling, J. Metamorph. Geol., 39, 1145–1171, https://doi.org/10.1111/jmg.12605, 2021.
Scherer, E. E., Cameron, K. L., and Blichert-Toft, J.: Lu–Hf garnet geochronology: Closure temperature relative to the Sm–Nd system and the effects of trace mineral inclusions, Geochim. Cosmochim. Ac., 64, 3413–3432, 2000.
Searle, M. P. and Cox, J.: Subduction zone metamorphism during formation and emplacement of the Semail ophiolite in the Oman Mountains, Geol. Mag., 139, 241–255, https://doi.org/10.1017/S0016756802006532, 2002.
Searle, M. P., Waters, D. J., Martin, H. N., and Rex, D. C.: Structure and metamorphism of blueschist-eclogite facies rocks from the northeastern Oman Mountains, J. Geol. Soc., 151, 555–576, https://doi.org/10.1144/gsjgs.151.3.0555, 1994.
Searle, M. P., Warren, C. J., Waters, D. J., and Parrish, R. R.: Structural evolution, metamorphism and restoration of the Arabian continental margin, Saih Hatat region, Oman Mountains, J. Struct. Geol., 26, 451–473, https://doi.org/10.1016/j.jsg.2003.08.005, 2004.
Seman, S., Stockli, D. F., and McLean, N. M.: U–Pb geochronology of grossular-andradite garnet, Chem. Geol., 460, 106–116, 2017.
Shu, Q., Beranoaguirre, A., Albert, R., Millonig, L. J., Walters, J. B., Marschall, H. R., Gerdes, A., Hoefer, H. E., Hezel, D., and Brey, G. P.: Multi-stage ultrahigh temperature metamorphism in the lower crust of the Kaapvaal craton recorded by U–Pb ages of garnet, Contrib. Mineral. Petr., 179, 49, https://doi.org/10.1007/s00410-024-02121-4, 2024.
Simpson, A., Gilbert, S., Tamblyn, R., Hand, M., Spandler, C., Gillespie, J., Nixon, A., and Glorie, S.: In-situ Lu–Hf geochronology of garnet, apatite and xenotime by LA ICP MS/MS, Chem. Geol.,577, 120299, https://doi.org/10.1016/j.chemgeo.2021.120299, 2021.
Soret, M., Agard, P., Dubacq, B., Plunder, A., and Yamato, P.: Petrological evidence for stepwise accretion of metamorphic soles during subduction infancy (Semail ophiolite, Oman and UAE), J. Metamorph. Geol., 35, 1051–1080, https://doi.org/10.1111/jmg.12267, 2017.
Smye, A. J., Warren, C. J., and Bickle, M. J.: The signature of devolatisation: Extraneous 40Ar systematics in high-pressure metamorphic rocks, Geochim. Cosmochim. Ac., 113, 94–112, https://doi.org/10.1016/j.gca.2013.03.018, 2013.
Tamblyn, R., Hand, M., Simpson, A., Gilbert, S., Wade, B., and Glorie, S.: In situ laser ablation Lu–Hf geochronology of garnet across the Western Gneiss Region: campaign-style dating of metamorphism, J. Geol. Soc., 179, 1–16, https://doi.org/10.1144/jgs2021-094, 2022.
Tera, F. and Wasserburg, G. J.: U–Th–Pb systematics in three Apollo 14 basalts and the problem of initial Pb in lunar rocks, Earth Planet. Sc. Lett., 14, 281–304, 1972.
Tual, L., Smit, M. A., Cutts, J., Kooijman, E., Kielman-Schmitt, M., Majka, J., and Foulds, I.: Rapid, paced metamorphism of blueschists (Syros, Greece) from laser-based zoned Lu–Hf garnet chronology and LA-ICPMS trace element mapping, Chem. Geol., 30, 121003, https://doi.org/10.1016/j.chemgeo.2022.121003, 2022.
van Breeman, O. and Hawkesworth, C. J.: Sm–Nd isotopic study of garnets and their metamorphic host rocks, T. Roy. Soc. Edin.-Earth, 71, 97–102, 1980.
Wafforn, S., Seman, S., Kyle, J. R., Stockli, D., Leys, C., Sonbait, D., and Cloos, M.: Andradite garnet U–Pb geochronology of the Big Gossan Skarn, Ertsberg-Grasberg mining district, Indonesia, Econ. Geol., 113, 769–778, https://doi.org/10.5382/econgeo.2018.4569, 2018.
Walters, J. B.: MinPlot: A mineral formula recalculation and plotting program for electron probe microanalysis, Mineralogia, 53, 51–66, https://doi.org/10.2478/mipo-2022-0005, 2022.
Walters, J. B. and Gies, N. B.: MinPlotX: A powerful tool for formula recalculation, visualization, and comparison of large mineral compositional datasets, Mineralogia, 56, 13–22, https://doi.org/10.2478/mipo-2025-0003, 2025.
Warr, L. N.: IMA-CNMNC approved mineral symbols, Mineral. Mag., 85, 291–320, https://doi.org/10.1180/mgm.2021.43, 2021.
Warren, C., Parrish, R., Waters, D., and Searle, M.: Dating the geologic history of Oman's Semail ophiolite: Insights from U–Pb geochronology, Contrib. Mineral. Petr., 150, 403–422, https://doi.org/10.1007/s00410-005-0028-5, 2005.
Warren, C. J.: Continental subduction beneath the Semail ophiolite, Oman: constraints from U–Pb geochronology and metamorphic modelling, PhD thesis, University of Oxford, England, 2004.
Warren, C. J. and Miller, J. M.: Structural and stratigraphic controls on the origin and tectonic history of a subducted continental margin, Oman. J. Struct. Geol., 29, 541–558, https://doi.org/10.1016/j.jsg.2006.10.006, 2007.
Warren, C. J. and Waters, D. J.: Oxidized eclogites and garnet-blueschists from Oman: P–T path modelling in the NCFMASHO system, J. Metamorph. Geol., 24, 783–802, https://doi.org/10.1111/j.1525-1314.2006.00668.x, 2006.
Warren, C. J., Parrish, R. R., Searle, M. P., and Waters, D. J.: Dating the subduction of the Arabian continental margin beneath the Semail ophiolite, Oman, Geology, 31, 889–892, https://doi.org/10.1130/g19666.1, 2003.
Warren, C. J., Sherlock, S. C., and Kelley, S. P.: Interpreting high-pressure phengite 40Ar39Ar laserprobe ages: An example from Saih Hatat, NE Oman, Contrib. Mineral. Petr., 161, 991–1009, https://doi.org/10.1007/s00410-010-0576-1, 2011.
Yakymchuk, C.: Prograde zircon growth in migmatites, J. Metamorph. Geol., 41, 719–743, https://doi.org/10.1111/jmg.12715, 2023.
Yang, Y.-H., Wu, F.-U., Yang, J.-H., Mitchell, R. H., Zhao, Z.-F., Xie, L.-W., Huang, C., Ma, Q., Yang, M., and Zhao, H.: U–Pb age determination of schorlomite garnet by laser ablation inductively coupled plasma mass spectrometry, J. Anal. Atom. Spectrom., 33, 231–239, https://doi.org/10.1039/C7JA00315C, 2018.
Zuccari, C., Vignaroli, G., Callegari, I., Nestola, F., Novella., D., Giuntoli, F., Guillong, M., and Viola, G.: Forming and preserving aragonite in shear zones: First report of blueschist facies metamorphism in the Jabal Akhdar Dome, Oman Mountains, Geology, 51, 454–459, https://doi.org/10.1130/G51079.1, 2023.