the Creative Commons Attribution 4.0 License.
the Creative Commons Attribution 4.0 License.
 | 07 Aug 2025
Radiometric dating of Middle Pleistocene carbonates: assessing consistency and performance of the U–Th and U–Pb dating methods
Timothy J. Pollard
Jon D. Woodhead
Russell N. Drysdale
R. Lawrence Edwards
Xianglei Li
Ashlea N. Wainwright
Mathieu Pythoud
Hai Cheng
John C. Hellstrom
Ilaria Isola
Eleonora Regattieri
Giovanni Zanchetta
Dylan S. Parmenter
The U–Th and U–Pb dating methods are widely employed for radiometric dating of Pleistocene carbonates, such as speleothems and corals. The U–Th dating method has been progressively refined over recent decades, largely through advances in mass spectrometry, and is now capable of providing accurate and precise ages for carbonates as old as ∼ 650 000 years under optimal circumstances. Similarly, the U–Pb method, traditionally restricted to dating pre-Quaternary materials, has been adapted in recent years for dating young carbonates. As a result, there is now substantial overlap in the applicable age range of these two dating methods but, thus far, only limited assessment of their consistency and relative performance when dating samples over this shared age interval.
In this study, we conduct a systematic comparison of the U–Th and U–Pb dating methods, focusing on a significant part of their overlapping age range (approximately 630–430 ka). We achieve this by dating speleothem (secondary cave mineral deposit) samples from Corchia Cave, central Italy, using both methods and evaluate their consistency and performance in terms of age precision and other factors. We adopt analytical approaches that employ state-of-the-art multi-collector inductively coupled plasma mass spectrometry (MC-ICPMS) measurement protocols, including a U–Th measurement protocol that utilises a Faraday cup equipped with a 1013 Ω resistor to collect the low-abundance 234U+ and 230Th+ ion beams. This approach is particularly well-suited to dating samples approaching the limits of the U–Th method but also enables accurate determination of ratios. Thus, as a secondary component of this study, we compare our measurements with previously published speleothem values.
Our results demonstrate excellent agreement between the U–Th and U–Pb dating methods and suggest that both are capable of providing accurate and precise ages over this interval. We find that U–Pb age uncertainties are generally less predictable than U–Th age uncertainties but, on average, do not increase significantly over the interval considered. U–Th age uncertainties, on the other hand, tend to increase in a more predictable and approximately exponential manner. Additionally, U–Pb age uncertainties are highly dependent on the availability of sub-samples with a substantial spread in parent/daughter ratios and/or highly “radiogenic” (i.e. very low inherited Pb) material. In our dataset, U–Pb isochron age precision surpasses that of U–Th precision at ∼ 520 ka, although the exact crossover point is expected to vary for different sample types and depositional settings. Overall, these findings support the prospect of obtaining accurate and internally consistent U-series chronologies spanning the Middle Pleistocene. They also suggest that, for some carbonate samples, the U–Pb dating method may provide superior age precision to the U–Th method prior to the latter reaching its upper age limit.
Finally, our results show that most speleothems exhibit ratios consistent with global carbonate values and that these ratios typically deviate from the conventional value of 137.88, widely adopted in geochronology, in agreement with previous studies.
- Article
(3877 KB) - Full-text XML
-
Supplement
(630 KB) - BibTeX
- EndNote


U-series dating of carbonates has provided some of the most accurate and precise age constraints on Earth processes unfolding over the Pleistocene. The U–Th disequilibrium dating technique (hereafter, U–Th method) is by far the most widely used approach for radiometric dating of Pleistocene carbonates. Its application to corals, beginning in the 1960s, and later speleothems (secondary cave mineral deposits) has led to significant advances in our understanding of Pleistocene climate. For example, U–Th dating of coral reef terraces has provided some of the most compelling evidence linking orbital insolation variations to glacial–interglacial cycles (e.g. Edwards et al., 2003), while U–Th dating of speleothems has yielded some of the most accurate and precise constraints on the timing of major climate events over the Pleistocene, including glacial terminations (Cheng et al., 2016) and millennial-scale climate oscillations associated with Dansgaard–Oeschger events (Corrick et al., 2020). U–Th dating of carbonates has also been used to address important questions in fields such as archaeology and human evolution (Hellstrom and Pickering, 2015; Pike et al., 2017) and provides data that underpin the calibration of the radiocarbon age scale (Reimer et al., 2020).
U–Th analytical methods have been continuously refined over the past few decades. The development of thermal ionisation mass spectrometry (TIMS) protocols in the late 1980s (Chen et al., 1986; Edwards et al., 1987), and later MC-ICPMS protocols, led to major improvements in U–Th age precision and sample throughput (Goldstein and Stirling, 2003). Following these major breakthroughs, U–Th analytical protocols have undergone more incremental refinement over the past two decades or so. An example of one such refinement is the advent of all-Faraday-cup analytical protocols that collect the low-abundance 234U+ and 230Th+ ion beams in a Faraday cup instead of using an ion counter (Andersen et al., 2004; Potter et al., 2005; Cheng et al., 2013). This approach allows much larger ion beams to be measured and circumvents issues associated with ion counter dead time correction and gain calibration, leading to significant improvement in age precision and an extension of the useful range of the dating method to ∼ 650 ka in ideal circumstances (Cheng et al., 2016).
The U–Pb dating method, traditionally used mostly for radiometric dating of igneous materials, such as zircon, has recently been adapted for dating Pleistocene carbonates, and it offers a valuable means of extending speleothem and coral chronologies beyond the current ∼ 650 ka limit of the U–Th technique (Richards et al., 1998; Woodhead et al., 2006; Denniston et al., 2008; Klaus et al., 2017). To date, the U–Pb method has been less widely applied to Pleistocene carbonates than U–Th dating. This is partly because it is more labour-intensive (especially when adopting high-precision isotope dilution TIMS or multi-collector inductively coupled plasma mass spectrometry – MC-ICPMS – approaches) but also because its application to Pleistocene carbonates is limited to samples with low inherited Pb content (Woodhead et al., 2012). Nevertheless, U–Pb dating is of similar utility, having, for example, provided radiometric age constraints on the timing of Pleistocene glacial terminations (Bajo et al., 2020), the age of key hominin fossils (Walker et al., 2006; Pickering et al., 2011), and chronologies for sub-arctic permafrost thawing over the past ∼ 1.5 Ma (Vaks et al., 2020). Although the U–Pb method is nominally better suited to dating older material, for which sufficient time has passed for significant accumulation of radiogenic Pb, it is also well-suited to dating Middle Pleistocene carbonates that typically have activity ratios (hereafter, , where square brackets denote an activity ratio) that are analytically resolvable from radioactive equilibrium, thus facilitating a precise and accurate disequilibrium correction (Woodhead et al., 2006). In ideal circumstances the carbonate U–Pb dating method can also provide precise ages for materials as young as ∼ 270 ka (Cliff et al., 2010).
With recent advances in the carbonate U–Th and U–Pb dating methods, there is now considerable overlap in the applicable range of the two chronometers, especially over the interval from ∼ 650 to ∼ 400 ka. This overlap provides a valuable opportunity to assess consistency between the two methods and thus validate, to a certain extent, the assumptions underlying their use. However, since both dating approaches are based on the 238U decay series, they are not entirely independent, and for this reason, a comparison between them may not be considered to be as definitive as one involving completely independent chronometers (e.g. Min et al., 2000), all else being equal. Nevertheless, the carbonate U–Th and U–Pb dating methods do rely on different assumptions and require analysis of distinct isotopic ratios. For instance, the U–Th method relies on the precise analysis of and is highly sensitive to any inaccuracies in this measured activity ratio. In contrast, the U–Pb method requires the analysis of Pb-based isotope ratios and often incorporates information from the 235U decay series in addition to the 238U series (although, for young samples, most of the age resolving power lies in the 238U–206Pb chronometer). The U–Pb dating method also relies on assumptions about the initial state of intermediate products beyond 230Th in the 238U decay series, such as 226Ra and 231Pa, and closed-system behaviour with respect to these nuclides (Richards et al., 1998), which do not apply to the U–Th method.
Other independent methods of dating carbonates within this age range are available, such as electron spin resonance (ESR) dating (Radtke et al., 1988) and (U,Th)–He dating (Bender et al., 1973; Makhubela and Kramers, 2022). However, these are less well-established and tend to provide lower age precision than the U–Th and U–Pb methods, limiting their utility in assessing the accuracy of these more precise U-series-based dating approaches.
The availability of two different U-series approaches to dating carbonates over the ∼ 650–400 ka interval also raises the question of which is most suitable to a given situation. While U–Th dating is often assumed to be the most accurate and precise approach throughout most, if not all, of its applicable range, the U–Pb method may perform equally well or even better for samples approaching the upper age limit of U–Th dating. Consequently, selecting an optimal dating approach for carbonates in this age range requires careful consideration. In practical terms, U–Th dating may be considered advantageous because it typically involves analysing single samples extracted from discrete positions within a given speleothem or coral sample, making it less labour-intensive on a per-age basis. U–Pb dating, on the other hand, typically involves isochron approaches, whereby multiple sub-samples from within an individual growth domain are analysed to compute a single age. Although more labour-intensive, isochron methods also provide a first-order check on the assumption of closed-system behaviour and more accurately account for any initial (i.e. non-radiogenic) quantity of the daughter isotopes.
At present, the relative precision of each dating method is not yet well characterised for samples approaching their respective age limits (i.e. upper limit for U–Th and the lower limit for U–Pb). For “well-behaved” samples – those maintaining closed-system conditions with reasonably high U and low initial Th/Pb content – the precision of U–Pb dating is likely to surpass that of U–Th somewhere before the latter reaches its nominal upper age limit. However, the exact crossover point is difficult to predict a priori because U–Pb isochron age precision is not a simple function of isotope ratio measurement precision but also depends on various sample characteristics (e.g. Woodhead et al., 2012; Engel and Pickering, 2022). The direct comparison of samples dated using both methods therefore offers the most appropriate means of evaluating their relative performance in terms of age precision and other practical considerations.
Previous studies have compared carbonate samples dated using both the U–Th and U–Pb methods, although these have tended to include a relatively small number of samples across a restricted age range (e.g. Richards et al., 1998; Pickering et al., 2010). The most comprehensive comparison to date is that of Cliff et al. (2010), who obtained multiple U–Th and U–Pb ages from a flowstone that grew between ∼ 350–265 ka. They found good overall agreement for the youngest growth segment, although age agreement for the middle and older growth segments was more equivocal. While this study was more comprehensive than previous ones, it also had some limitations. For example, only one full isochron age was included in the comparison and there was some uncertainty in co-registering the U–Th and U–Pb ages to a common depth scale, which precluded a more statistically rigorous assessment.
Here we present a systematic comparison of U–Th and U–Pb dating methods focusing on the older part of their overlapping age range (∼ 630–430 ka) where routine application of the carbonate U–Pb dating method is a more realistic prospect. We achieve this by dating carbonate speleothem samples extracted from identical growth layers using both the U–Th and U–Pb methods and then assess consistency between them and evaluate their relative merits in terms of age precision and other practical considerations. In contrast to previous comparison studies, we compute full Tera–Wasserburg (Tera and Wasserburg, 1972) isochron ages for all samples and adopt state-of-the-art MC-ICPMS-based analytical protocols. This includes the use of an all-Faraday-cup U–Th measurement protocol that employs a 233U–236U double spike for mass bias correction and collects the low-abundance 234U and 230Th isotopes in a Faraday cup fitted with a 1013 Ω resistor, which provides superior signal-to-noise ratios for small ion beams relative to more conventional 1011 Ω resistors (Pythoud, 2022). The use of this analytical protocol allows age consistency to be assessed more rigorously than in previous studies and facilitates an assessment of age precision using the most advanced U–Th measurement protocol currently available for samples in this age range.
An added benefit of adopting this high-precision U–Th analytical protocol is that it yields data of sufficient accuracy and precision for assessing natural variability in this ratio. The ratio is often used in U–Th and U–Pb data reduction, as well as U–Pb and Pb Pb age calculation, and has traditionally been treated as a constant in geochronology (Hiess et al., 2012; Tissot and Dauphas, 2015). However, the development of high-precision measurement protocols over the past two decades has revealed variations in natural ratios, typically expressed as δ238U values1, of up to a few per mil (‰) (Weyer et al., 2008; Tissot and Dauphas, 2015). Despite these findings, only a small number of studies have examined speleothem δ238U values. As a secondary component of this study we therefore combine our high-precision δ238U measurements with pre-existing speleothem data in order to assess some of the controls on speleothem δ238U variability more broadly.
The speleothem samples analysed in this study were collected from Corchia Cave, located in the Alpi Apuane massif of central Italy (43°59′ N, 10°13′ E). This cave system, which is developed in Mesozoic marbles, dolomitic marbles, and dolomites, is one of the longest (∼ 60 km) and deepest (∼ 1250 m) in Europe and has been the subject of extensive past cave exploration (Piccini et al., 2008) and scientific study (Bajo et al., 2017; Drysdale et al., 2019; Isola et al., 2019). The cave site receives the majority of its high annual precipitation (∼ 2500 mm yr−1) from eastward-moving air masses originating over the North Atlantic Ocean, resulting in a coupling between large-scale surface ocean conditions in the North Atlantic and geochemical signals preserved in speleothems at the site (e.g. Drysdale et al., 2020). Owing to this linkage, Corchia Cave has yielded an abundance of palaeoclimate data of regional and global significance, including precise constraints on the timing of glacial terminations (Drysdale et al., 2020; Bajo et al., 2020) and interglacial climate variability (Regattieri et al., 2014; Tzedakis et al., 2018).
Palaeoclimate reconstruction studies undertaken at Corchia Cave have largely focussed on stalagmites collected from the large and well-decorated Galleria delle Stalattiti chamber. This chamber sits approximately 400 m below the surface at an elevation of 835 m above sea level and about 800 m from the nearest natural cave opening (Piccini et al., 2008). The microclimate of Galleria delle Stalattiti is relatively stable, typical of deep-cave environments, with a humidity consistently above 98 % and an average present-day temperature of ∼ 7.9 °C (Drysdale et al., 2019). Stalagmites from this chamber are typically well-suited to U-series geochronology with consistently high U content (typically 3–20 ppm) and very low detrital Th, as well as relatively low inherited Pb (Bajo et al., 2012). Furthermore, most stalagmites are composed of clean (i.e. free of visible detritus) compact columnar calcite, which is typically associated with the preservation of primary geochemical signals and closed-system behaviour with respect to U-series nuclides (Scholz et al., 2014). These characteristics make stalagmites from the Galleria delle Stalattiti very well-suited to U-series geochronology and, when combined with the site's suitability for palaeoclimate reconstruction, have led to a large number of U–Th and U–Pb determinations being undertaken on speleothems from the site. These data suggest that initial values of speleothems from this cave chamber are always less than 1 and have undergone a long-term evolution over the past several hundred thousand years towards more 234U-depleted values (Woodhead et al., 2006), with activity ratios as low as ∼ 0.65 obtained for Late Holocene materials (Zanchetta et al., 2007).
This study focusses on three stalagmites (sample IDs: CCB, CC2/CC15, and CC17-1) that were found broken near their original in situ position during field campaigns between 2001 and 2017. These stalagmites are large, with lengths of 67–130 cm and average diameters ranging from approximately 9–22 cm. Following collection, the stalagmites were halved along their vertical growth axes and polished to aid in the identification of visible growth laminations. In section, the stalagmites are white to grey in colour and predominately composed of compact translucent-to-opaque primary calcite. Exceptions are the very top of CCB, which contains some slightly porous calcite as the diameter tapers toward the tip, and the middle of CC17-1, which contains some localised, slightly porous sections associated with sharp changes in growth axis direction. These features are atypical of Galleria delle Stalattiti speleothems and were avoided during sampling.
3.1 Sampling
Samples for both U–Th and U–Pb dating were extracted using a dental drill, targeting clean and compact calcite by carefully tracing along visible growth contours approximately 5 mm apart at the central axis but tapering along the flanks. Several solid sub-samples of ∼ 4 mm (width) × ∼ 4 mm (length) × ∼ 3 mm (depth), or 20–120 mg, were then extracted from each growth domain. For each sampling position, one sub-sample, taken from the centre of the sampling area, was used for U–Th analysis and the remaining 4–11 sub-samples were used for U–Pb analysis. The only exception to this is sample CC17-1-3, where the U–Th sample was taken from a growth layer marginally below that of the corresponding U–Pb samples. This sampling offset was negligible relative to the age and age uncertainty of these growth layers, and so for the purpose of this study the samples are assumed to have been extracted from the same growth layer.
3.2 U–Th geochronology
U and Th isotopic analysis was performed at the University of Minnesota using a modified version of the all-Faraday-cup mass spectrometry protocol of Cheng et al. (2013) but with the 234U+ and 230Th+ ion beams collected in a Faraday cup fitted with a 1013 Ω resistor (Pythoud, 2022). Chemistry procedures were similar to those described in Edwards et al. (1987). Briefly, solid samples of 20–110 mg (equivalent to ∼ 500 ng U) were dissolved in ∼ 1 % HNO3 before the addition of a mixed 233U–236U–229Th tracer calibrated against IRMM-074/10 (Cheng et al., 2013). Approximately six drops of concentrated HClO4 were added to each sample beaker before being capped and refluxed on a hotplate for several hours to ensure complete sample-spike equilibration. Following complete dry down, the separation and purification of U and Th proceeded in two stages. Firstly, U and Th were separated from the matrix using Fe co-precipitation in 2 N HCl by drop-wise addition of NH4OH followed by centrifuging. Secondly, U and Th were separated and further purified via elution chromatography using BioRad AG1-X8 anion exchange resin, with the Th fraction collected in 6 N HCl and the U fraction collected in ultra-pure water. The Th fraction was then passed through a second identical column to ensure complete separation from U. Following this, the purified U and Th sample fractions were dried down and sequentially treated with HClO4 and HNO3 to oxidise any remaining organics before being taken up in 1 % HNO3 for analysis.
The U and Th isotope ratios were measured separately in static mode on a Thermo-Scientific Neptune Plus MC-ICPMS (see Table S1 in the Supplement for details on the detector configuration). Samples were introduced into the mass spectrometer via a Cetac Aridus II desolvating nebulising system fitted with a C50 PFA concentric nebuliser, using an uptake rate of 30–50 µL min−1. Zeros were measured for 13 min for both U and Th immediately prior to sample introduction. U measurements were then made over 5–10 min with a 234U+ signal size between 8–18 mV. Th measurements immediately followed U for each sample and were made over 1–5 min with a 230Th+ signal size between 8–20 mV.
For Faraday cups fitted with 1010 and 1011 Ω resistors, amplifier gain calibration was performed via the mass spectrometer software using a standard current at the start of each run. However, the limited dynamic range of the 1013 Ω resistor precluded the use of this approach for the cup fitted with this resistor. Therefore, the amplifier gain on this detector was characterised by periodic (∼ fortnightly) measurement of Nd standard SRM 3135a following Pythoud (2022). Tailing of the 238U+ and 235U+ ion beams was characterised by analysis of un-spiked CRM-112A prior to each run, with the background measured at masses 233, 233.5, 234.5, 236, and 237 amu on the axial SEM with the retarding potential quadrupole (RPQ) off. A logarithmic regression fit through these data was then used to estimate tailing onto the mass 233–236 cups as a function of the signal intensity at mass 237 during measurement (Pythoud, 2022). For each U fraction, tailing was corrected by measuring the background at mass 237 on the axial SEM during sample analysis and applying the predicted ratios (where M refers to masses 233–236). Tailing of the 232Th+ beam onto the mass 230 cup was negligible given the very high ratios of the samples analysed in this study and was not corrected for.
Table 1U–Th dating results.
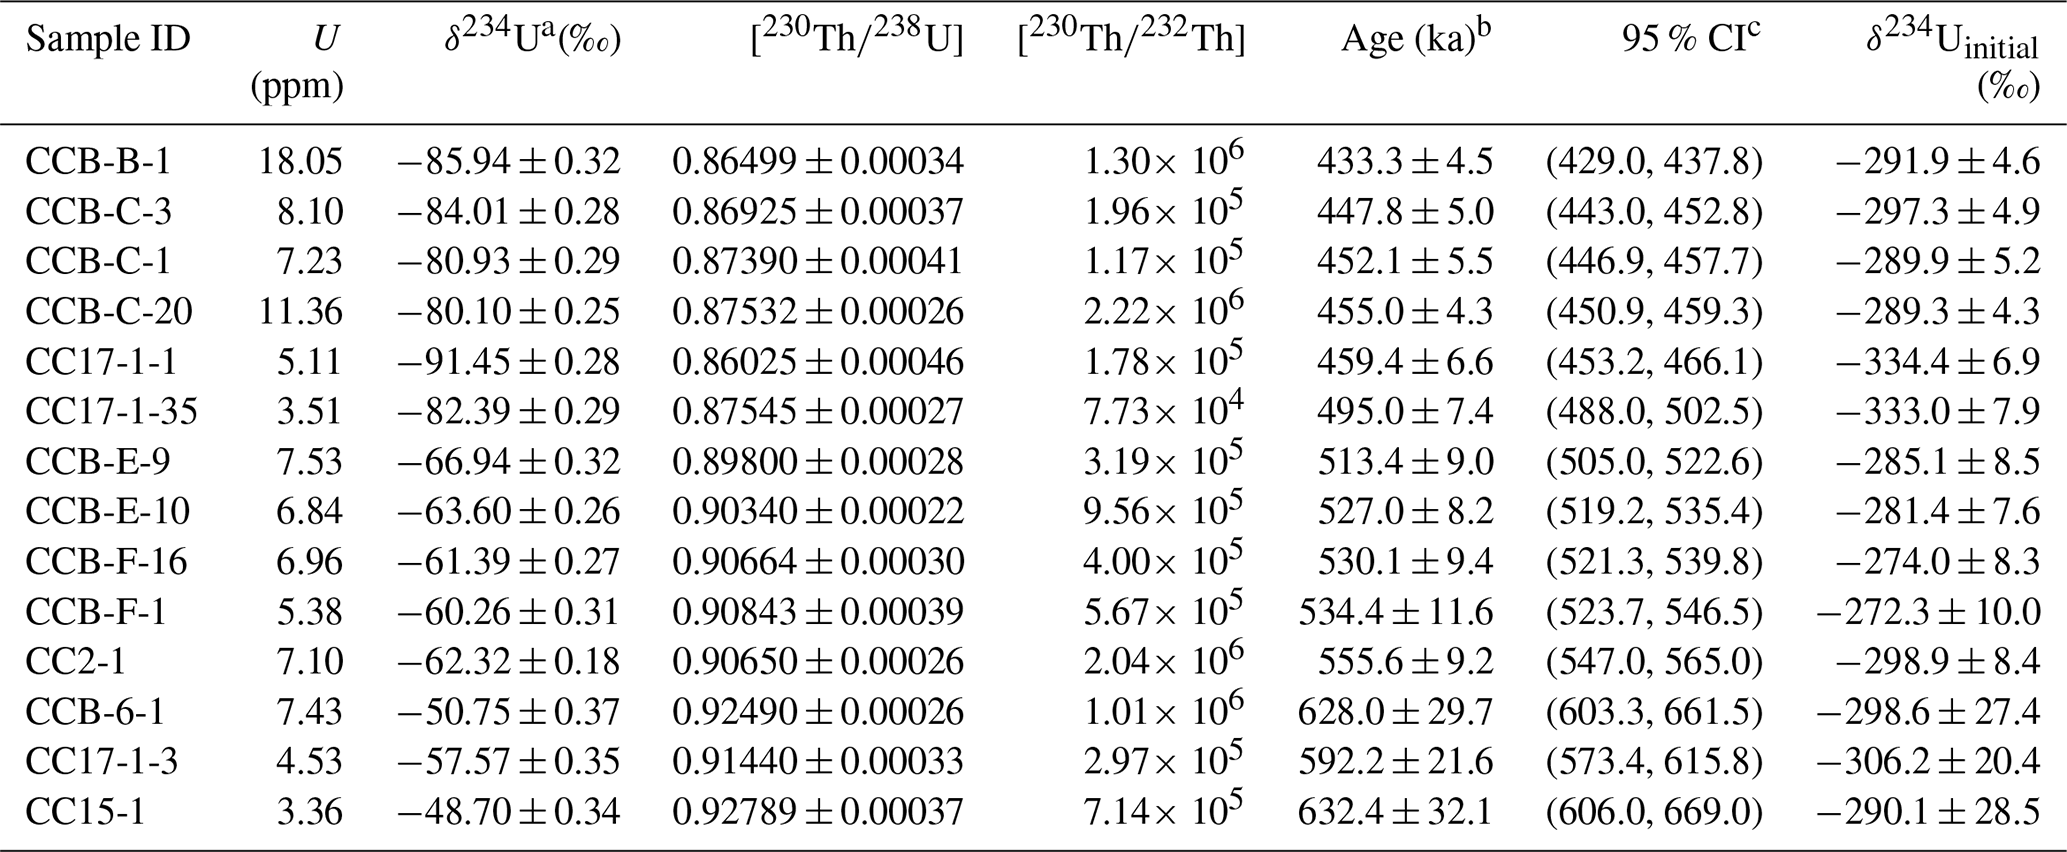
Uncertainties are given at the 2σ level. Decay constant values are (Jaffey et al., 1971), (Cheng et al., 2013), and (Cheng et al., 2013). a . b Uncertainties calculated by first-order algebraic uncertainty propagation (Appendix B). c Calculated by Monte Carlo simulation. More complete U–Th results are available in Tables S2 and S3 of the Supplement.
Data reduction was performed using an offline spreadsheet that implements a tau correction following Pythoud (2022) to account for the slow response time of 1013 Ω resistors before applying the 238U tail correction as described above and mass bias correction based on the exponential law (Russell et al., 1978) using the ratio measured for each sample. The mass bias factor calculated for the U fraction was subsequently used to correct the Th fraction run immediately after, based on the assumption of near-equivalent mass bias behaviour between U and Th isotopes (Potter et al., 2005). This is justified by the consistent mass bias behaviour observed on this instrument, especially over multiple successive analyses (Pythoud, 2022). Finally, corrected U ratios were normalised to CRM-112A, which was periodically analysed throughout each run, using the CRM-112A value of 52.852 ± 0.015 obtained by Cheng et al. (2013). U–Th ages and uncertainties (see Table 1 and Tables S2 and S3 in the Supplement) were then computed using a Python script that calculates ages and age uncertainties using both first-order algebraic uncertainty propagation (Appendix A1 and B) and Monte Carlo approaches (Hellstrom, 1998; Ludwig, 2003) (see the Supplement for further details).
Owing to the very high ratios of the samples analysed in this study, we opted not to correct U–Th or U–Pb ages for initial 230Th in order to simplify age and age uncertainty calculations (i.e. Appendix B). We note, however, that if such a correction were applied it would result in a negligible correction of at most a few years for both U–Th and U–Pb ages.
3.3 U–Pb geochronology
U–Pb dating was performed at the University of Melbourne. Analytical methods built on those published previously (Woodhead et al., 2012; Sniderman et al., 2016) but using the streamlined chemistry procedure described in Engel et al. (2020). Solid calcite samples were repeatedly cleaned by brief (∼ 1 min) immersion in dilute (∼ 0.01 M) multiply distilled HCl, followed by washing in ultra-pure water, before drying in a HEPA-filtered laminar flow hood. The cleaned samples were then individually weighed into pre-cleaned Teflon beakers and treated with sufficient 6 N HCl to ensure complete dissolution. A mixed isotopic tracer, calibrated against EarthTime reference solutions (Condon et al., 2015), was then weighed into the beakers which were each sealed and refluxed on the hotplate for several hours to ensure complete sample-spike equilibration. Samples were then dried down and U and Pb separated from the calcite matrix using the single-column mixed-resin ion exchange technique described in Engel et al. (2020).
Isotope ratios were measured on a Nu Plasma MC-ICPMS using a DSN-100 desolvation unit and MicroMist glass nebuliser, operating with an uptake rate of ∼ 80 µL min−1. Instrumental mass bias effects were monitored and corrected using NIST SRM 981 reference material in the case of Pb and the sample's internal ratio in the case of U.
U–Pb isochrons were fitted using DQPB (Pollard et al., 2023), initially employing the spine robust isochron algorithm (Powell et al., 2020). This algorithm accounts for analytical uncertainties and can accommodate datasets with weighted residuals that depart from a strict Gaussian distribution but converges to the classical least-squares solution of York et al. (2004) for “well-behaved” datasets (i.e. those where data scatter is accounted for by assigned measurement uncertainties). The spine width, s, was used to assess suitability of this algorithm for each dataset in relation to the upper 95 % confidence limit on s (here denoted slim) obtained by simulation of Gaussian-distributed datasets (Powell et al., 2020).
In cases where s clearly exceeded slim, the Robust Model 2 (RM2) algorithm presented in Pollard et al. (2023) was implemented instead. This algorithm ignores analytical uncertainties, inferring a robust dispersion scale from data scatter itself rather than assigned measurement uncertainties. Therefore, it is arguably better suited to datasets containing significant overdispersion (i.e. data scatter in excess of that attributable to assigned measurement uncertainties). However, for isochrons where s only marginally exceeded slim, the spine algorithm was considered likely to provide a more accurate best-fit line than the RM2 algorithm, although in this case the spine uncertainty calculations become potentially unreliable. Thus, where s exceeded slim by less than an arbitrary but reasonable value of 50 %, the spine regression line was retained, but uncertainties were expanded in an attempt to accommodate data scatter above what is reasonably accounted for by measurement uncertainties. This was achieved by multiplying the covariance matrix of the slope and y intercept, Vθ, by . Implementing the RM2 algorithm instead for these datasets does not significantly alter any of the conclusions of this study.
U–Pb ages were calculated as the intercept point between the isochron line and disequilibrium concordia curve on a Tera–Wasserburg diagram, incorporating the measured value from the U–Th analysis into the iterative age-solving procedure (Appendix A2) and assuming initial , [], and [] values equal to 0 (see Fig. 1). Uncertainties were calculated using a Python script that implements the Monte Carlo simulation approach described in Pollard et al. (2023) using 106 iterations (see the Supplement for further details) and also via first-order algebraic uncertainty propagation (Appendix B).
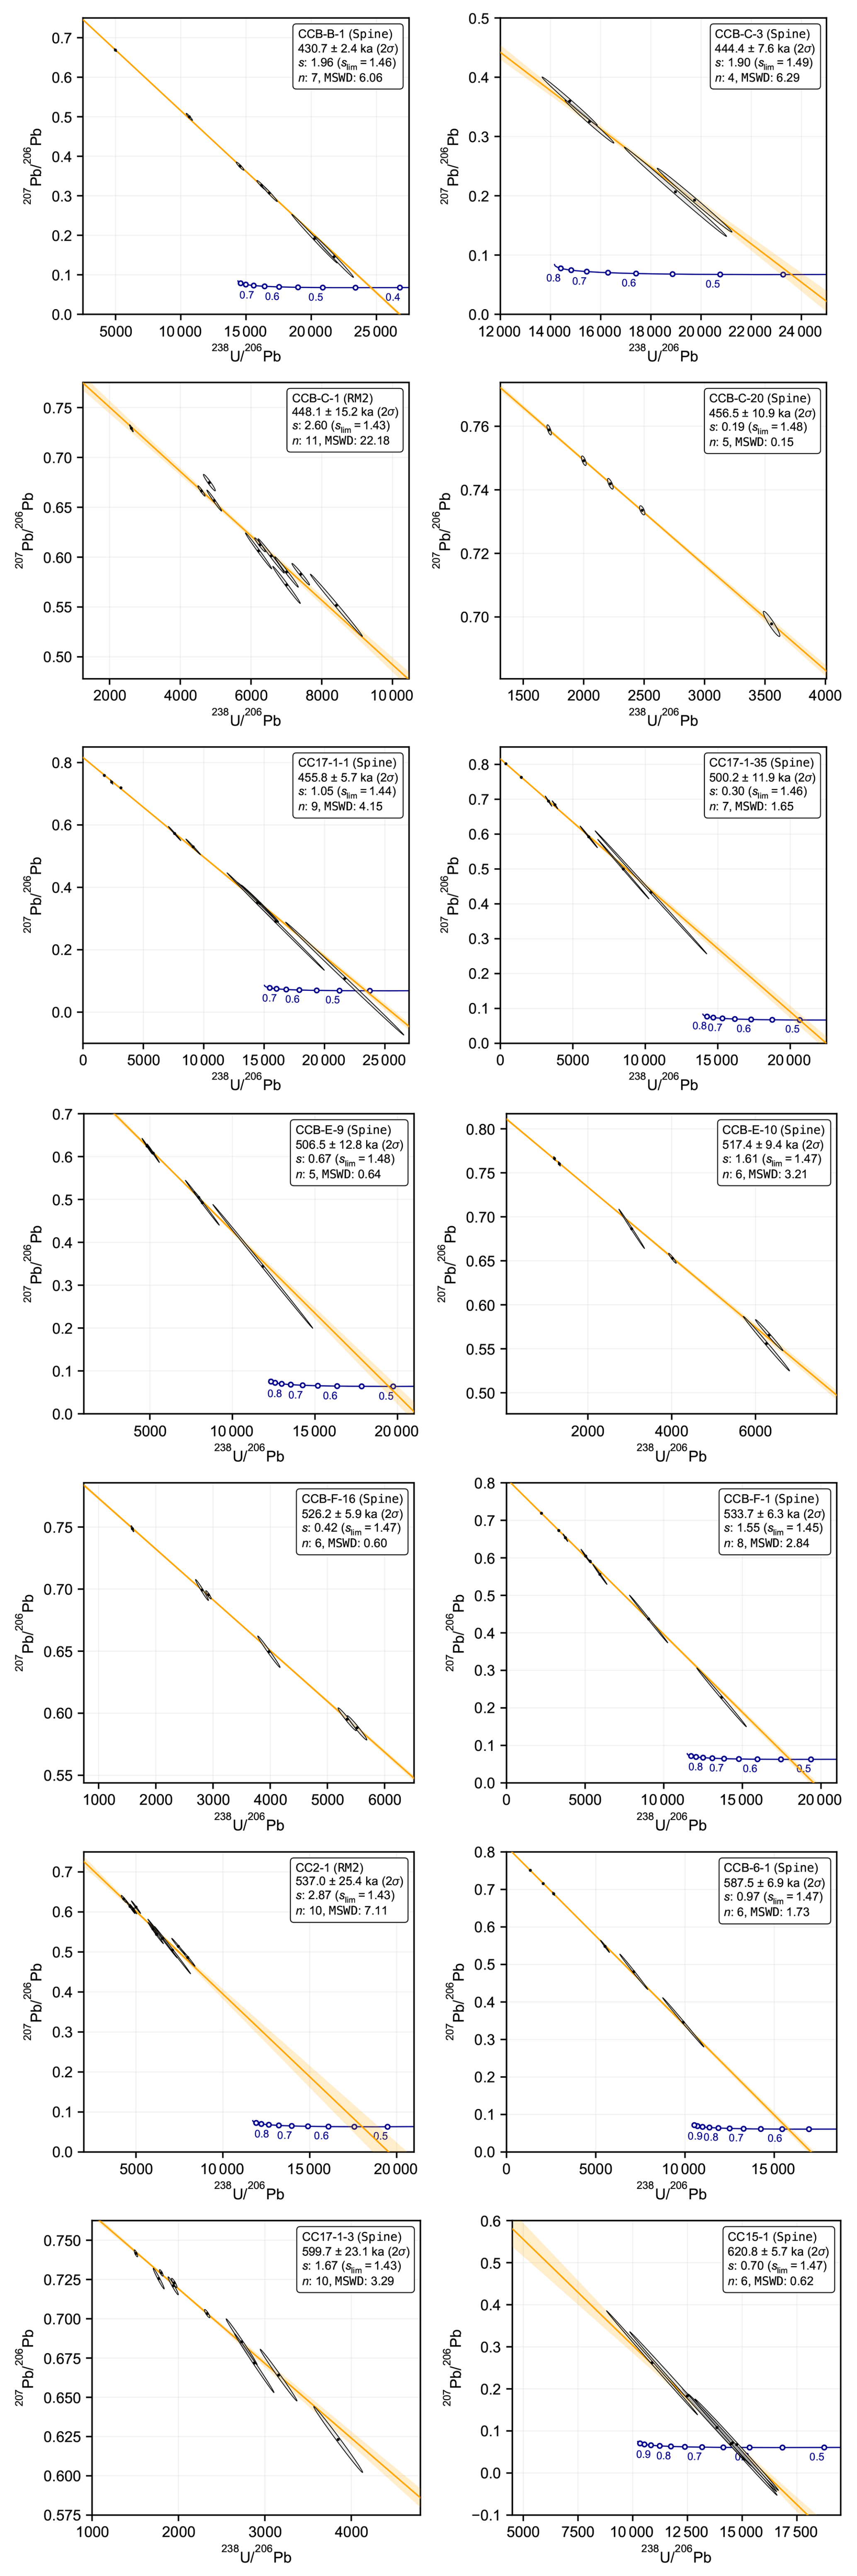
Figure 1U–Pb Tera–Wasserburg isochron diagrams. Measured data points are plotted as 95 % confidence ellipses (grey) along with the fitted isochron lines (orange) and their 95 % confidence bands (orange shading). The dark blue lines show disequilibrium concordia curves, constructed using the measured value and assuming . This Concordia curve is truncated at the youngest age point associated with a physically impossible negative initial activity ratio solution following the approach of McLean et al. (2016). Provided in the text boxes is the spine width, s; the value for a spine regression fit; and the simulated upper 95 % confidence limit on s, slim (see text for further discussion). The MSWD (mean square weighted deviation) for a classical weighted least-squares regression (e.g. York et al., 2004) is also provided for comparison with other datasets. The regression model implemented is indicated in brackets: spine indicates the use of the algorithm described by Powell et al. (2020), and RM2 indicates the use of the Robust Model 2 algorithm (Pollard et al., 2023). The data used to produce these plots are available in Tables S4 and S5 of the Supplement.
For the purpose of determining analytical accuracy, each U–Pb session included analysis of several “synthetic zircon” standards: ET-100Ma, ET-500Ma, and ET-2Ga. These materials, produced by the EarthTime initiative, have nominal U and Pb compositions approximating zircon minerals with ages of 100 Ma, 500 Ma, and 2 Ga but without any matrix (Condon et al., 2008). While they were originally conceived for quality control during TIMS single-zircon analysis and are still routinely used for that purpose (Szymanowski and Schoene, 2020), they are also well-suited to isotope dilution (ID) carbonate U–Pb studies since the quantities of U and Pb being analysed can be controlled to approximate unknowns and the highly radiogenic nature of the Pb involved serves to rapidly identify any anomalous analytical issues, such as unexpected high blanks. In our studies, we pass aliquots of these solutions (typically equating to ∼ 5 ng of radiogenic Pb) through the same column chemistry as our samples. The measured isotopic ratios of these standards analysed during the course of this study were consistent with benchmark TIMS values (Fig. 2).
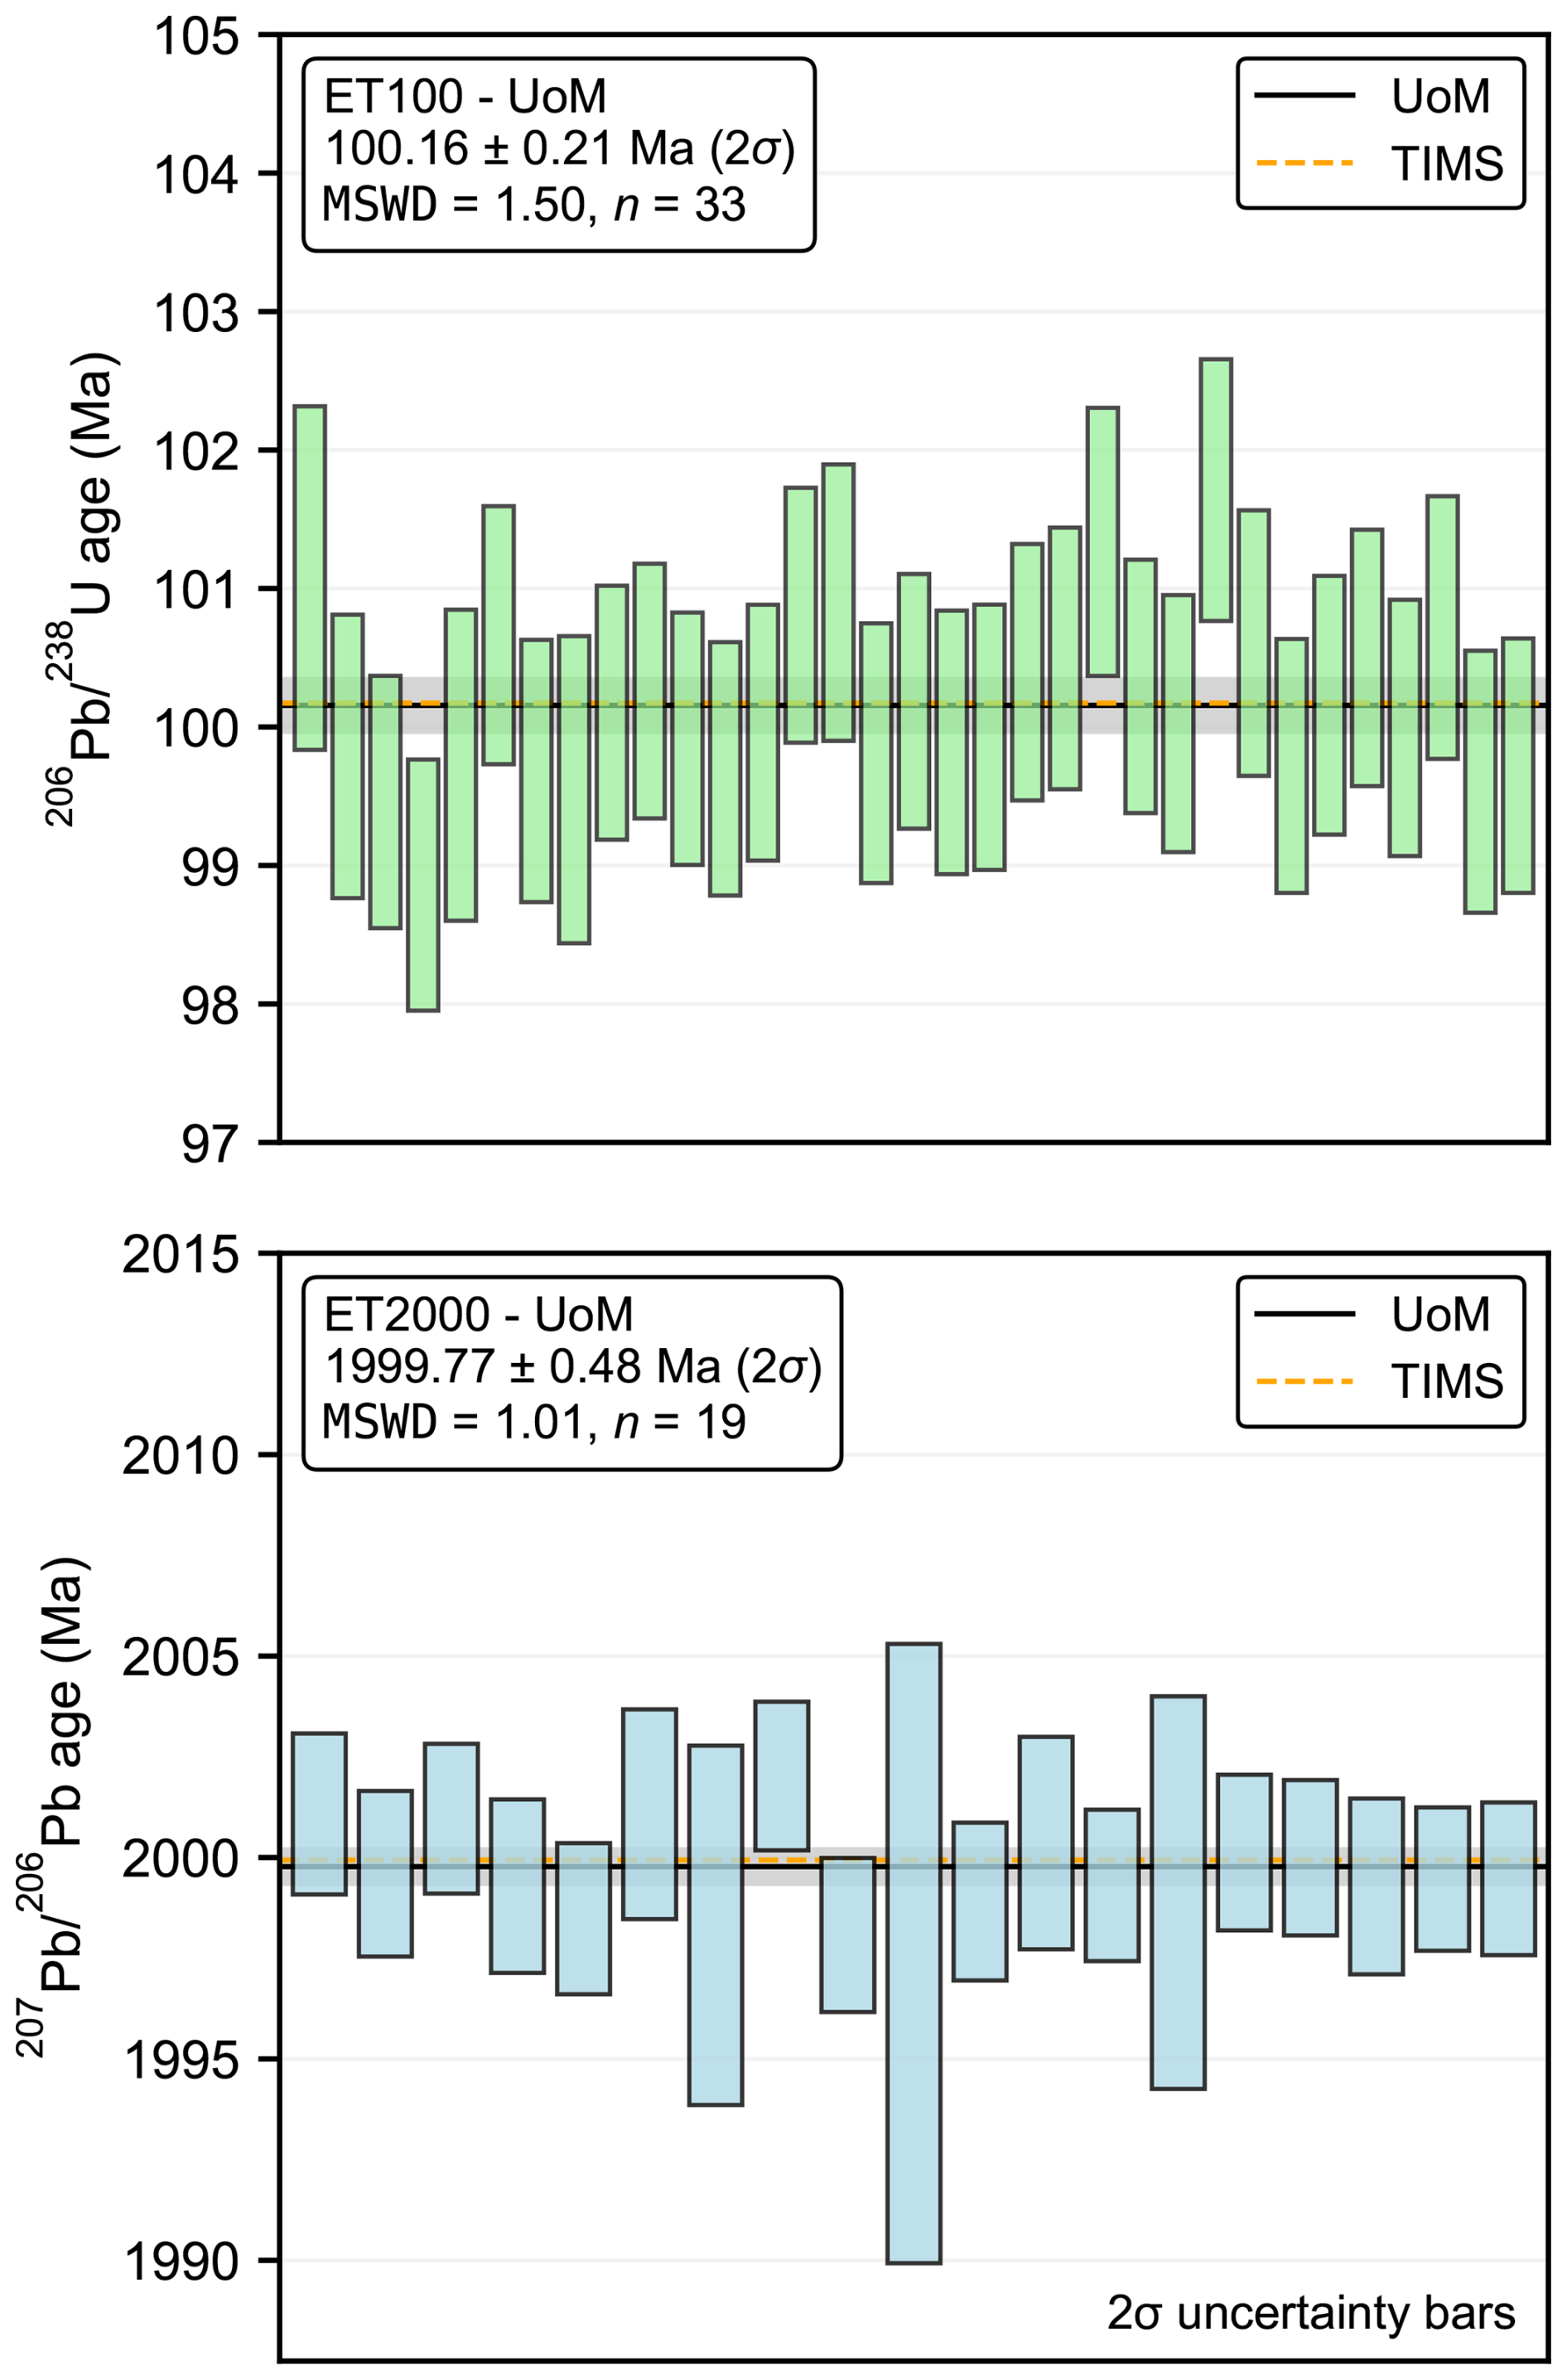
Figure 2Radiogenic and age determinations for EarthTime (ET) “synthetic zircon” standards analysed during the course of this study at the University of Melbourne (UoM) using a similar Pb load to the speleothem samples and identical column chemistry and mass spectrometry procedures. The weighted average age is plotted as the black line with grey shading indicating the 95 % confidence band. Also shown for comparison are the average inter-laboratory TIMS ages obtained by Schaltegger et al. (2021). ages were calculated using .
4.1 Age consistency
We first evaluated age consistency on a pairwise basis. For each sample, we tested if the U–Th and U–Pb ages agreed within their analytical uncertainties using a hypothesis test that amounted to assessing if the age difference was statistically consistent with zero (e.g. Barlow, 1989). The test statistic was calculated as
such that
where tTh and tPb represent the U–Th and U–Pb ages respectively and σΔ is the standard error in the age difference. The latter was calculated via first-order uncertainty propagation as
where and are the standard errors in the U–Th and U–Pb ages and ρ is their correlation coefficient arising from their shared measurement uncertainty (see Appendix B for further details). In most cases this correlation term was relatively minor, and it was negligible in cases where U–Pb regression fitting uncertainties were relatively large. We then obtained a formal p value under the null hypothesis that there is no significant difference between the ages by comparing z against the standard normal distribution.
Table 2Summary of pairwise U–Th versus U–Pb age comparison.
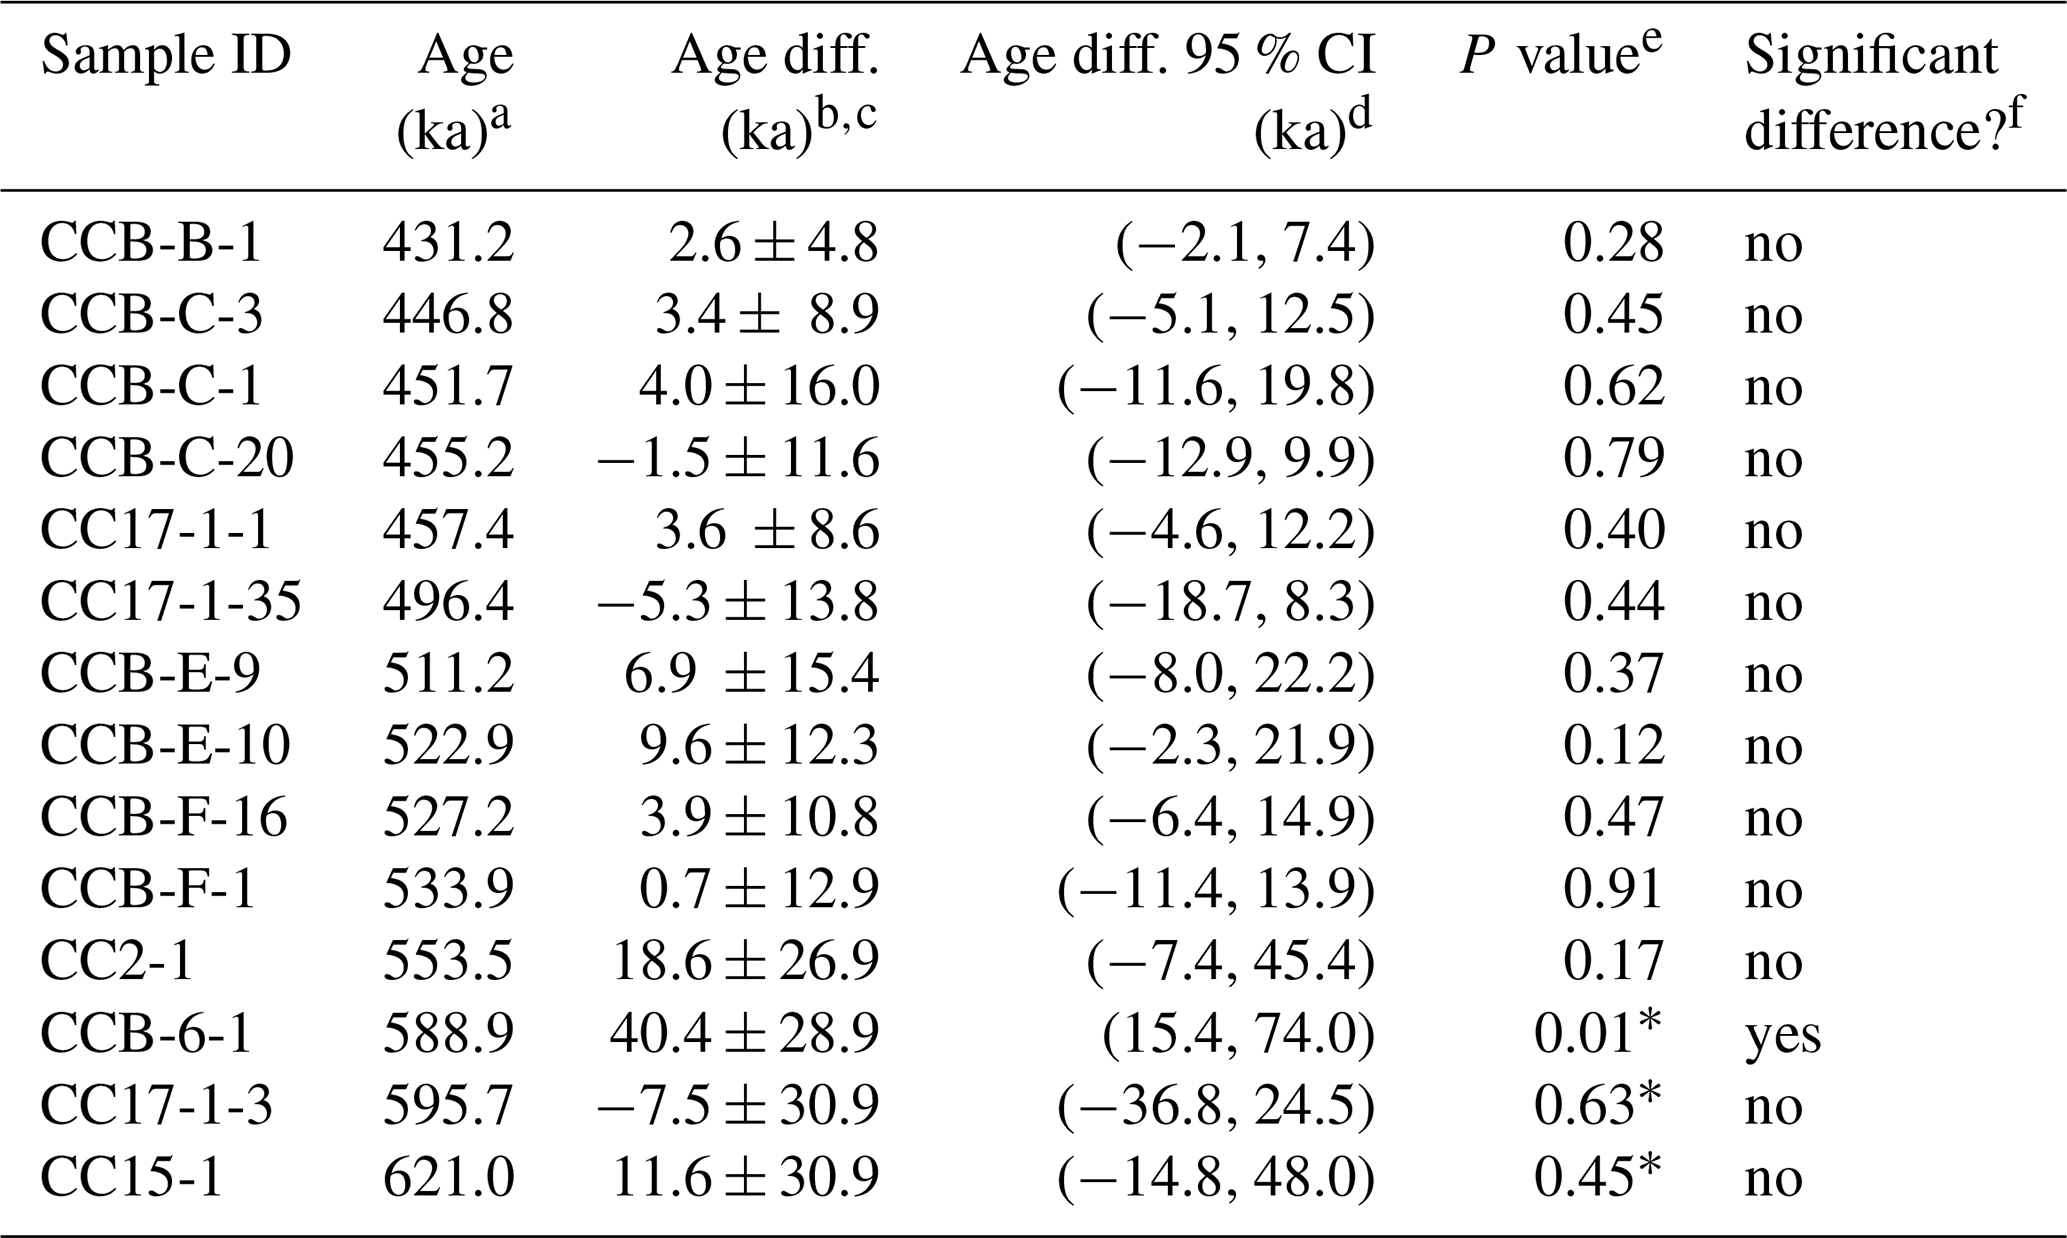
a Weighted average of U–Th and U–Pb ages. b Age difference calculated as tTh−tPb. c Uncertainty (±2σ) calculated by first-order algebraic error propagation. d Calculated by Monte Carlo simulation. e The p value under the null hypothesis in which there is no significant age difference. f Result of the hypothesis test of age consistency (α=0.05 significance level). ∗ The p value should be interpreted as a qualitative indicator only (see text).
Strictly speaking, this approach is only appropriate if uncertainties in both U–Th and U–Pb ages conform to a Gaussian distribution. While this assumption is reasonable for the majority of ages, it is slightly inaccurate for the older U–Th ages (i.e. samples CCB-6-1, CC17-1-3, and CC15-1), where the age uncertainty distributions are positively skewed owing to the non-linearity of the U–Th age equation, which is more apparent for older ages and/or those with larger analytical uncertainties (e.g. Ludwig, 2003). Therefore, for these samples, we instead implemented a Monte Carlo procedure to simulate the age difference distribution (see the Supplement for details). Analogous to the formal hypothesis test, we concluded that the age difference was consistent with zero if the estimated 95 % confidence interval on the Monte Carlo simulated age difference overlapped zero. The results of this pairwise age comparison are given in Table 2 and Fig. 3a.
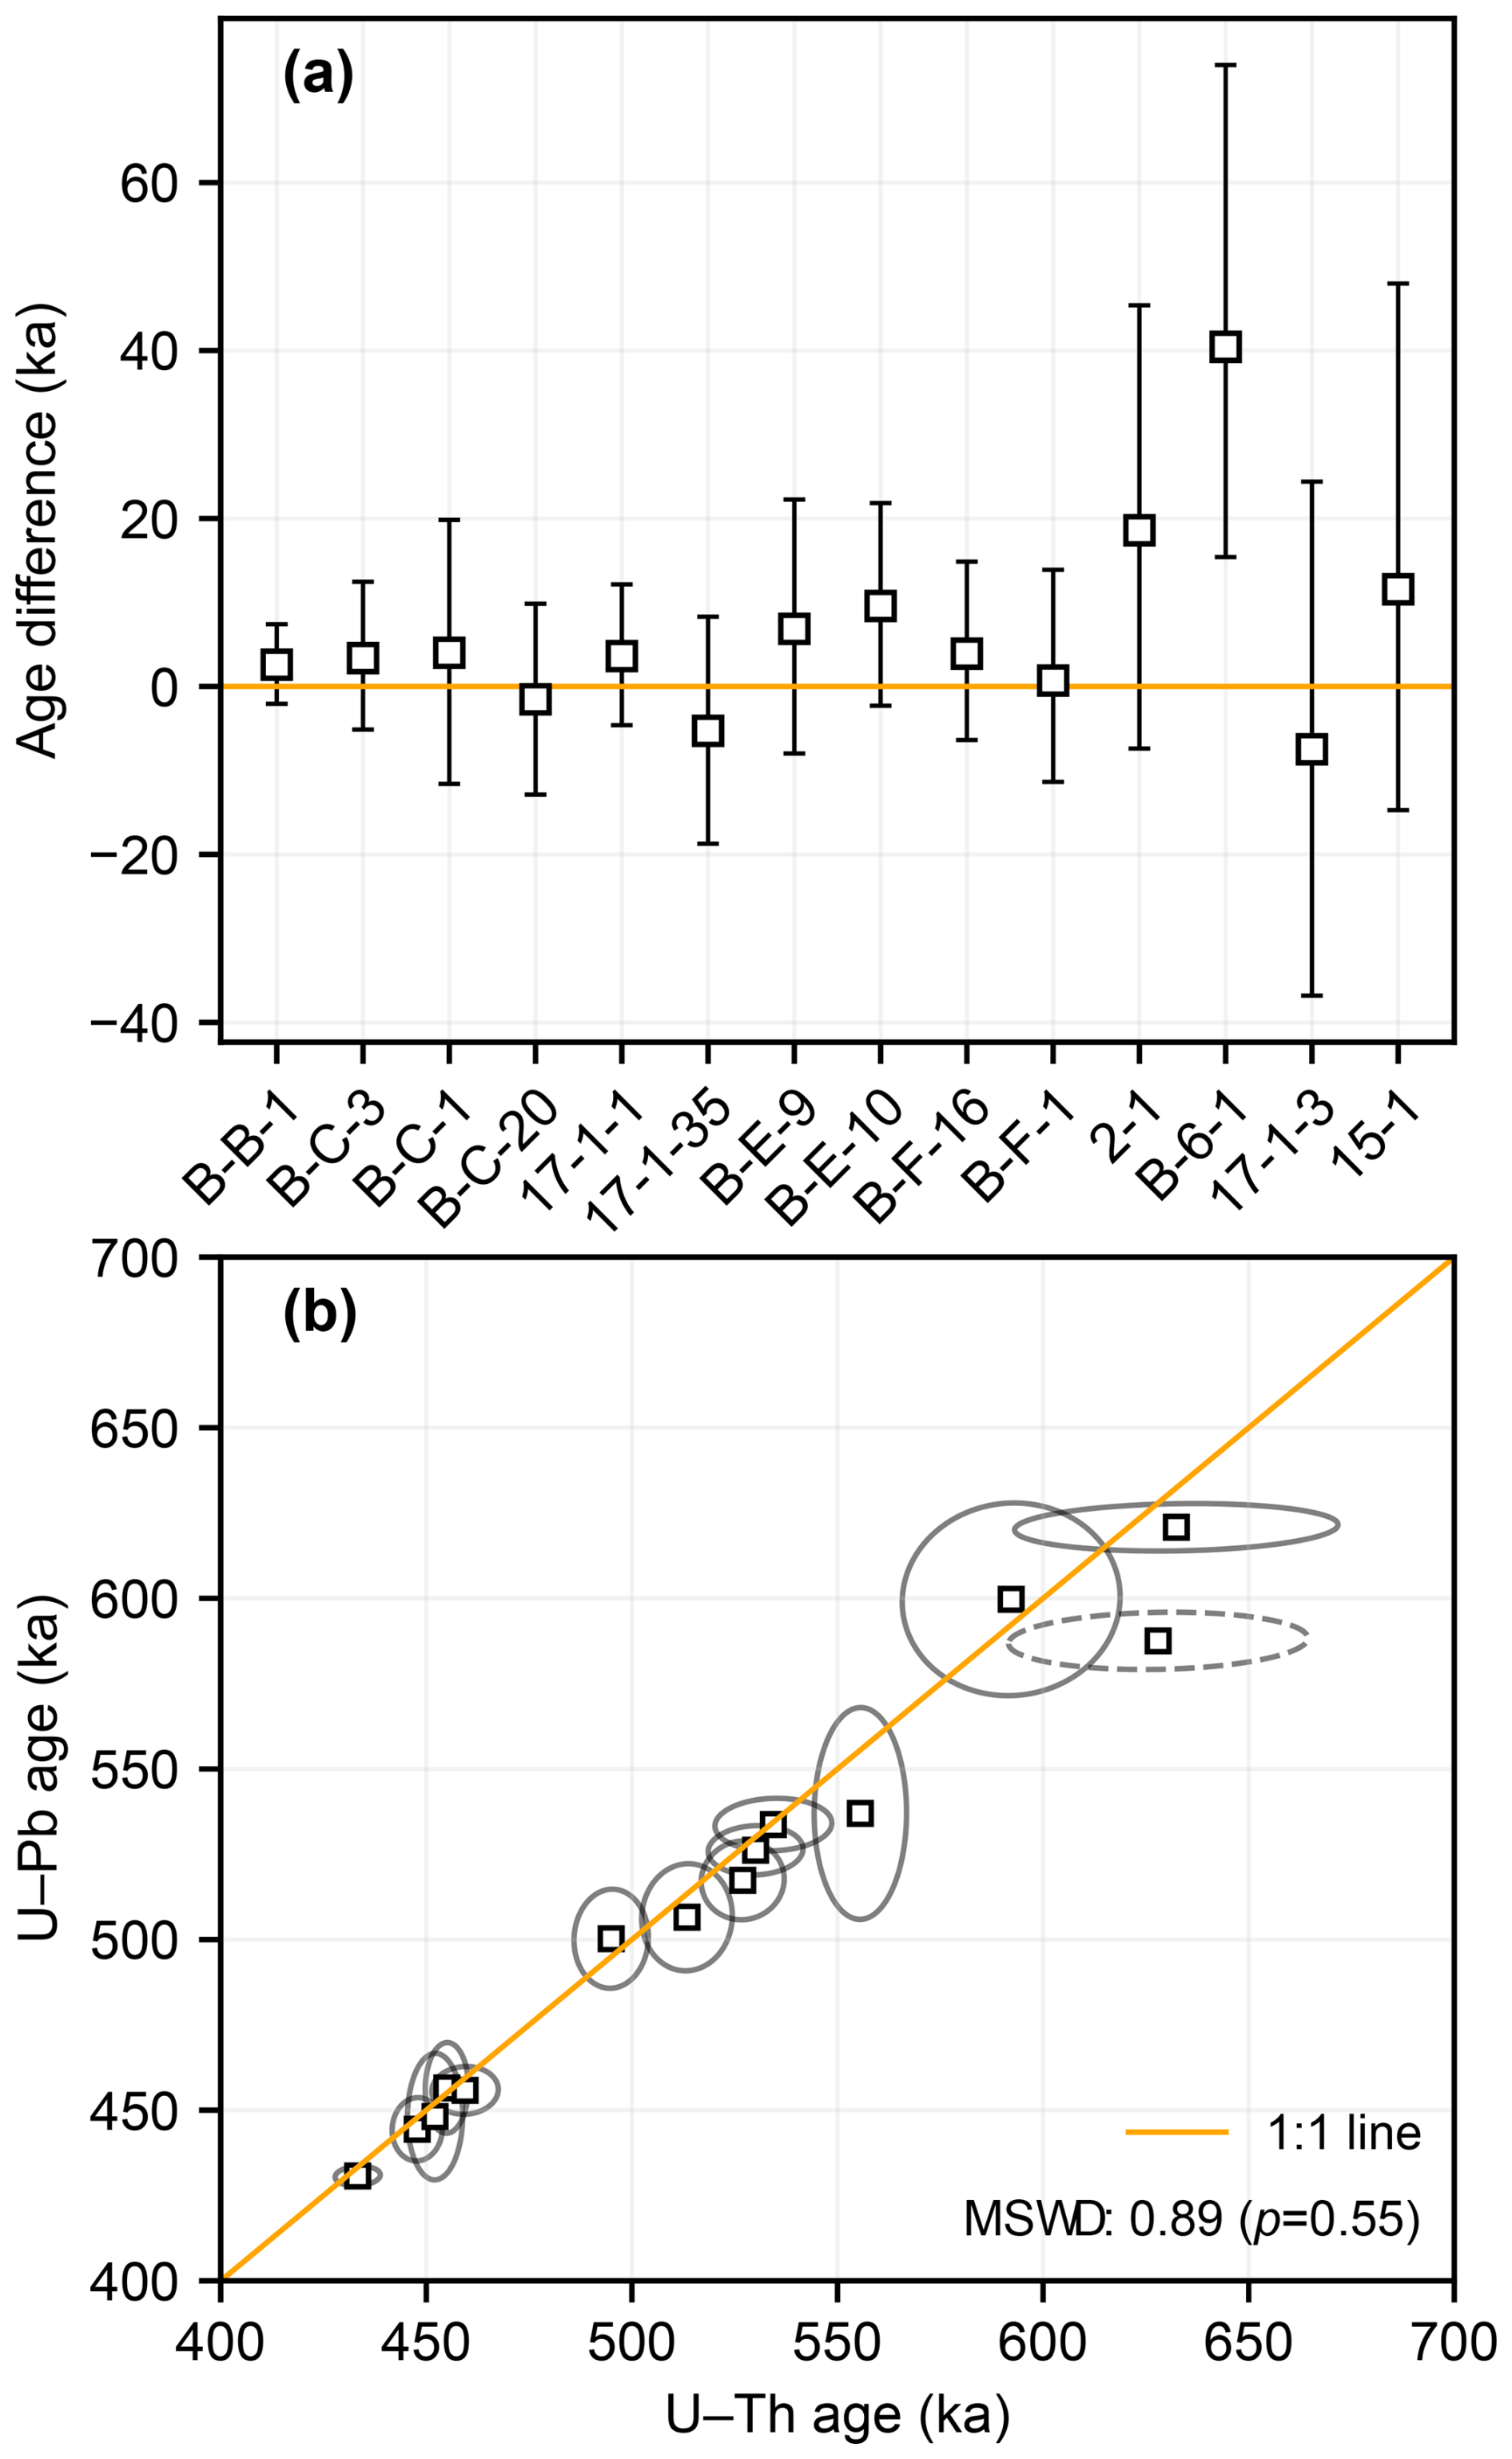
Figure 3Comparison of U–Th and U–Pb age determinations. (a) Age difference for each sample calculated as tTh−tPb. Note that the “CC” prefix of each sample ID has been omitted for brevity. (b) Collective comparison of U–Th and U–Pb ages with each age pair plotted as a 95 % confidence ellipse. The confidence ellipse for sample CCB-6-1, which was found to be inconsistent on a pairwise basis and therefore excluded from the MSWD calculation, is plotted with the dashed outline. Error bars and confidence ellipses are plotted at the 95 % confidence level.
Our results show excellent agreement between the U–Th and U–Pb ages for all samples, with the exception of sample CCB-6-1, where the U–Th age is significantly older than the U–Pb age by 41 + 34 −25 ka (95 % confidence). In this particular case, we consider the U–Pb age to be more reliable for two key reasons. Firstly, the U–Pb isochron is well formed, with good spread in U Pb ratios and data scatter that is consistent with analytical uncertainties (s<slim and p=0.14 for a classical least-squares fit). Secondly, the U–Pb age better conforms with the sample's stratigraphic position when ages from all three stalagmites are aligned to a common depth scale by synchronising their carbon (δ13C) and oxygen (δ18O) stable isotope profiles – noting that there is generally very good agreement between isotopic variations amongst coeval speleothems from the Galleria delle Stalattiti chamber of Corchia Cave (Tzedakis et al., 2018; Bajo et al., 2020). The cause of the anomalously old U–Th age is unclear, but one possibility is that this particular sub-sample was affected by localised open-system behaviour which resulted in post-depositional U loss and thus an older-than-true U–Th age determination. This is known to affect some speleothem samples even if they visually appear pristine (Bajo et al., 2016).
To evaluate agreement between the U–Th and U–Pb ages on a collective basis, we also employed a linear regression approach. If two dating methods are consistent and unbiased, we expect paired age determinations to plot along a 1 : 1 line passing through the origin within their analytical uncertainties. After excluding sample CCB-6-1, which was already found to be inconsistent on a pairwise basis, we fitted a regression line through the age pairs using the weighted least-squares algorithm of York et al. (2004), which accounts for assigned uncertainties in both variables and uncertainty correlation (Fig. 3b). The resulting best-fit regression line had a slope of 0.98 ± 0.07 (2σ), a y-intercept value of 6.0 ± 31 (2σ), and an MSWD (mean square weighted deviation) of 0.50 (n=14, p=0.74). We also assessed goodness of fit to a 1 : 1 line passing through the origin directly, obtaining an MSWD of 0.89 (n=14, p=0.55). These results suggest that the two dating methods are consistent and unbiased over the age interval considered in this study.
One limitation of this approach, however, is that – as noted above – the U–Th age analytical uncertainties for older samples CC15-1 and CC17-1-3 are slightly non-Gaussian, leading to some inaccuracy in regression results obtained by the classical least-squares approach, which assumes strictly Gaussian-distributed uncertainties. Nevertheless, these samples have relatively large age uncertainties that comfortably overlap the best-fit line. We therefore consider the results of this collective comparison to be relatively insensitive to this assumption.
4.2 Age uncertainties
The nature of age uncertainties differs considerably between the two dating methods for the age interval considered in this study. Overall, U–Th age uncertainties are more predictable than the U–Pb age uncertainties and tend to increase in an approximately exponential manner from ∼ 4.5 ka (2σ) at ∼ 450 ka to > 25 ka (2σ) at ∼ 620 ka (see Fig. 4). When U–Th age uncertainties are plotted against U–Th ages, the data tend to follow a simulation line that is based on propagating average and analytical uncertainties obtained in this study through to U–Th age uncertainties. Departures from this trend primarily reflect deviations in analytical uncertainties of one or both of the measured ratios from the average. While the exact trajectory of this line is expected to vary for different analytical protocols, the exponential form is not, provided that initial 230Th is either negligible or reasonably consistent. The trajectory of the line may also depend somewhat on initial values, with lower age precision generally expected to be obtained for samples with lower values and especially values less than unity (e.g. Meckler et al., 2012), all else being equal.
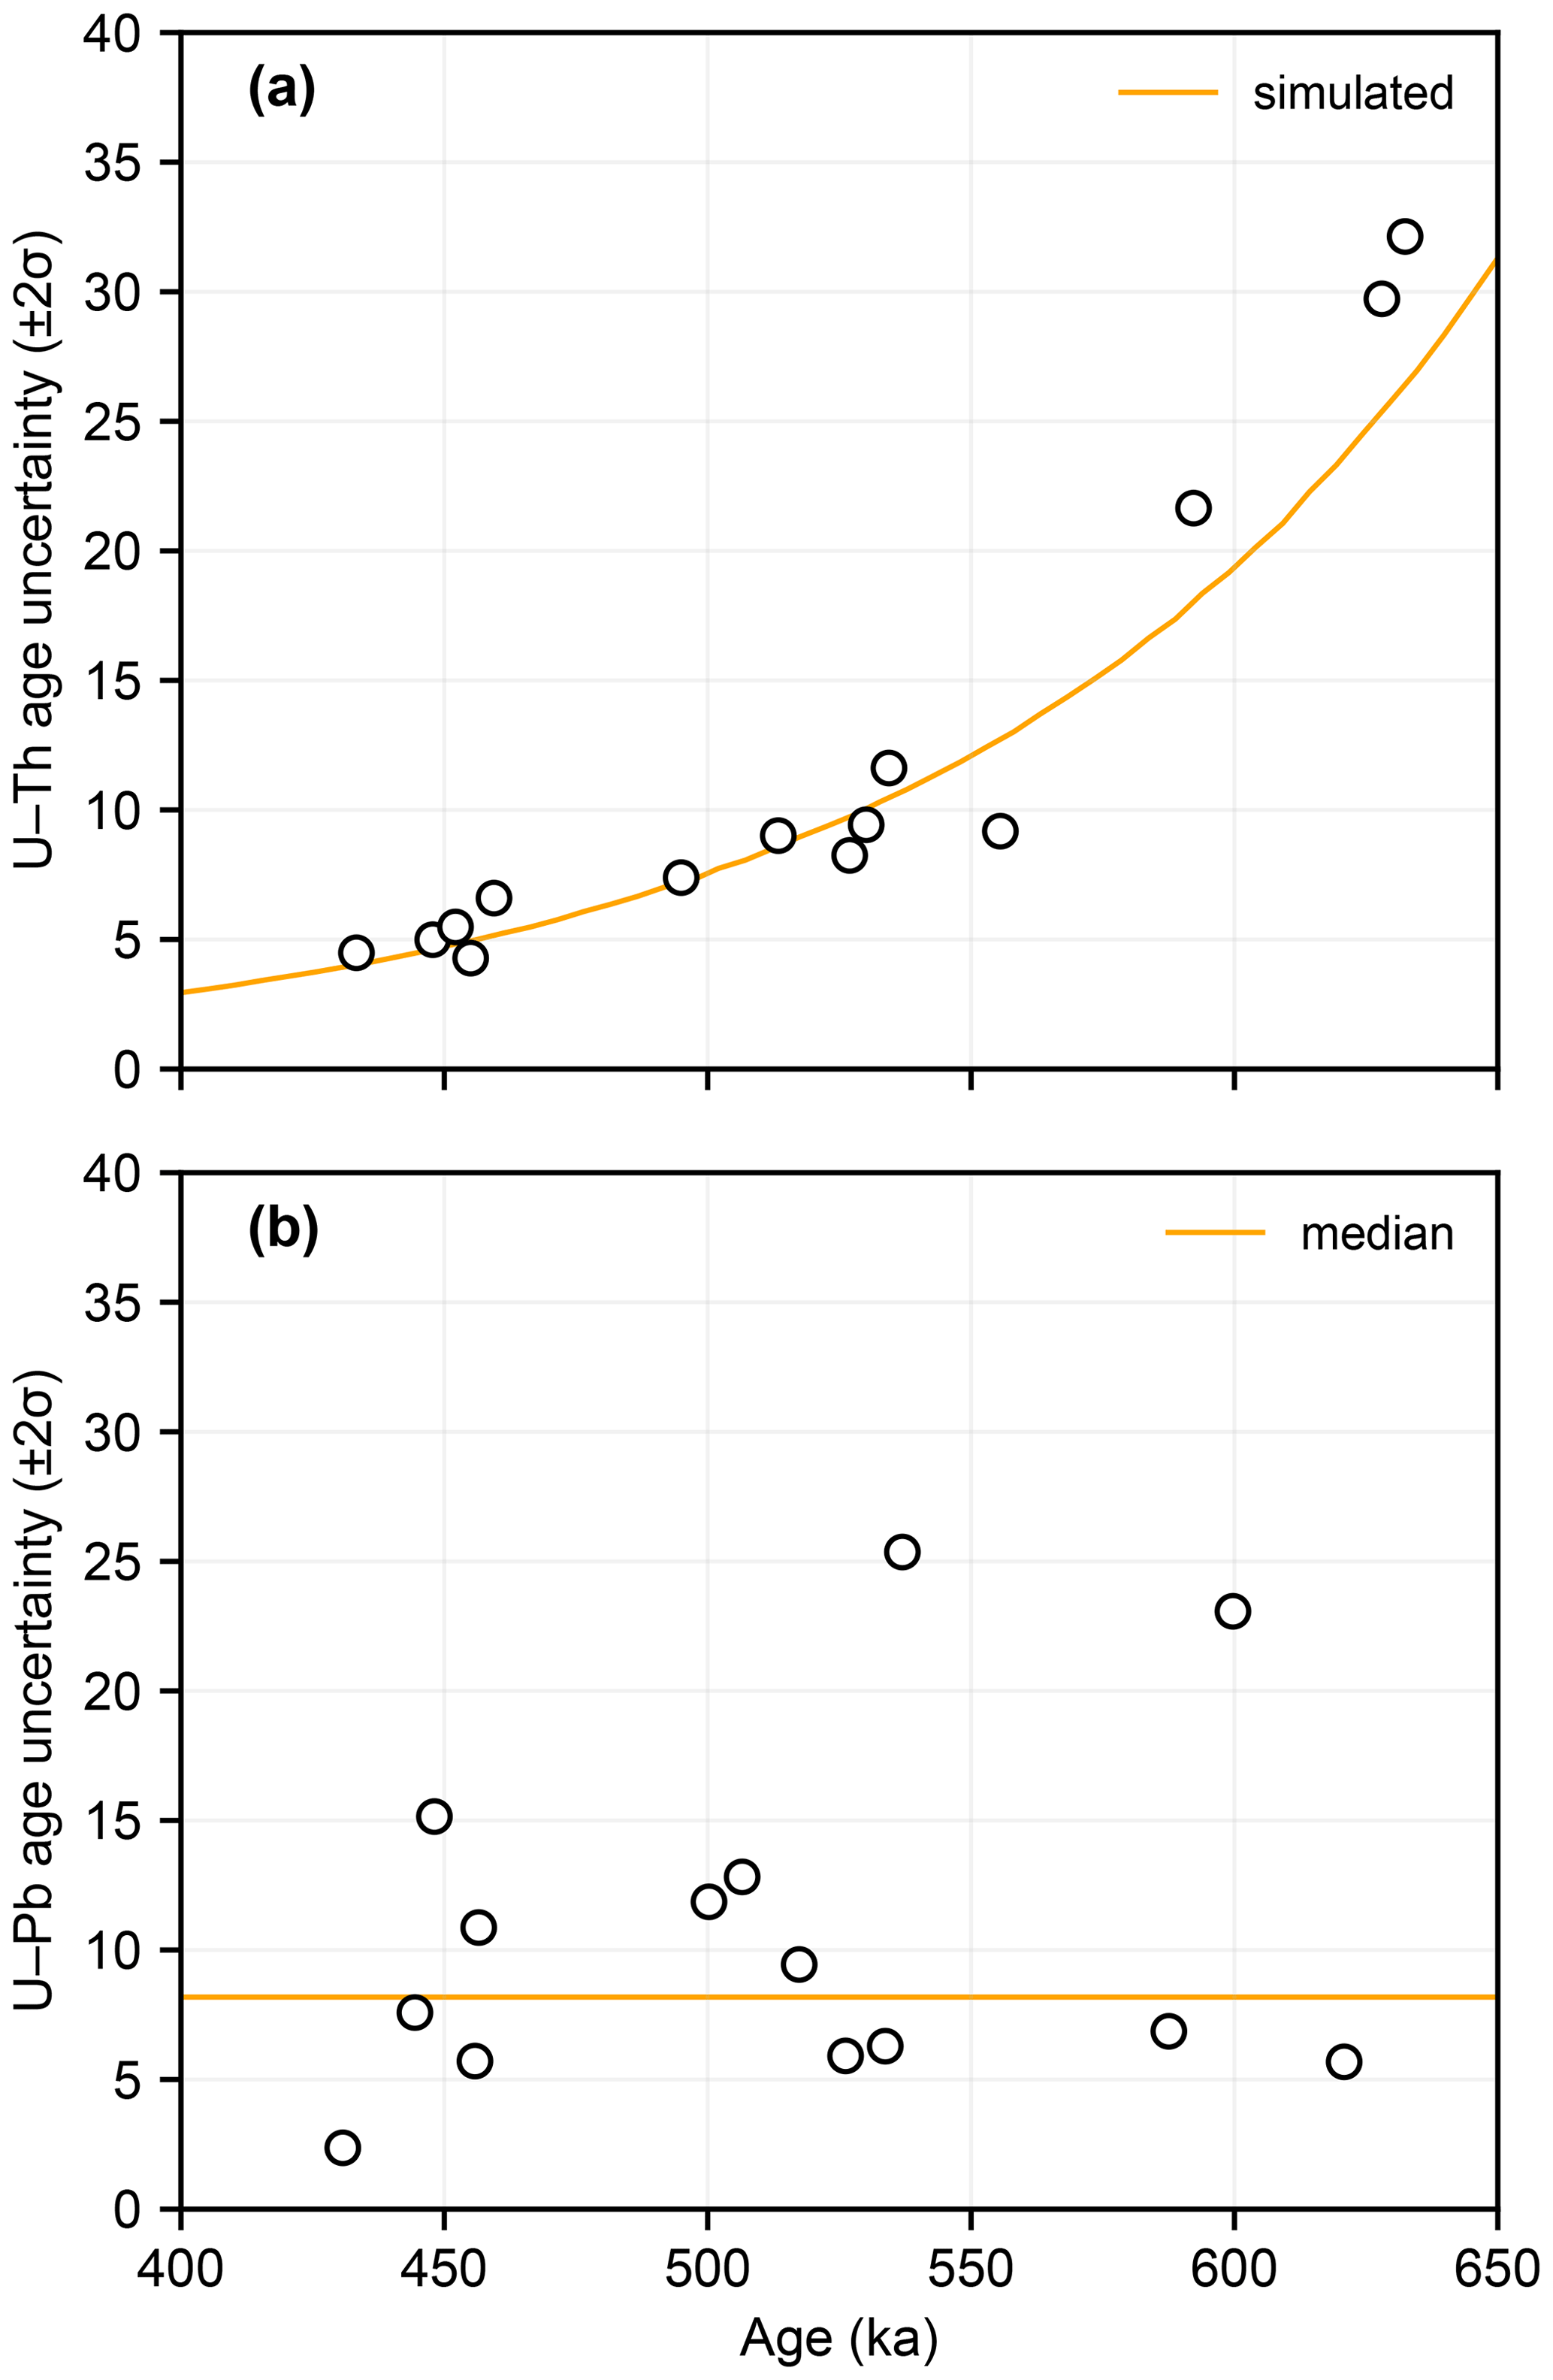
Figure 4Age precision versus age for U–Th and U–Pb age determinations The orange line in panel (a) shows the simulated U–Th age uncertainty calculated based on the average and measurement uncertainties for samples analysed in this study and an assumed value of 0.72, which is typical of Corchia Cave stalagmites within this age range. The orange line in panel (b) shows the median U–Pb age uncertainty.
U–Pb age uncertainties, on the other hand, do not show an obvious trend with increasing age and do not correlate directly with average analytical uncertainties in or isotope ratio measurements. Moreover, there is only a relatively small correlation between U–Pb age uncertainties in this dataset and measurement precision or scatter of data about the isochron, quantified by either the MSWD statistic or its robust variant, s (see the Supplement). Instead, U–Pb age uncertainties appear to depend predominantly on the distribution of data along the isochron, consistent with the findings of previous studies (Woodhead et al., 2012; Engel and Pickering, 2022).
Engel and Pickering (2022) examined factors controlling U–Pb isochron age precision in Middle Pleistocene speleothems from multiple cave sites, including Corchia Cave. They found that uncertainty in Tera–Wasserburg U–Pb isochron ages generally correlates strongly with uncertainty in the isochron slope, which is in turn controlled largely by the spread in Pb U ratios along the isochron line due to variability in inherited Pb content. To quantify the spread of data points along the isochron, Engel and Pickering (2022) defined a metric termed “average isochron distance”, which quantifies the spread of data as the average Euclidean distance between each data point and the centroid of the dataset (, ). Here we adopt an alternative metric based on the least-squares-fitted points2 along the regression line rather than the nominal measured values of the sub-samples. In this context, the use of the least-squares-fitted points helps to better differentiate between the spread of data along the isochron and the scatter about the isochron (e.g. due to “geological” scatter). It also circumvents scaling issues associated with isochron diagram axes spanning vastly different orders of magnitude, as is the case for the Tera–Wasserburg diagram. The metric we adopt is termed “combined isochron spread” and is calculated as
where is the least-squares fitted value of the kth data point and is the centroid of the data points.
In addition to the spread of data points along the isochron, another factor that influences Tera–Wasserburg U–Pb isochron age precision is the location of the data relative to the concordia intercept point. To assess this effect on U–Pb isochron age uncertainties, we define a second metric termed the “average inherited Pb index”, which is calculated as
where y∗ is the value of the concordia intercept point, is the centroid of the data, and y0 is the y-axis intercept point (i.e. the estimated inherited value from the fitted isochron line). Essentially, this is the distance in y between the concordia intercept point and the centroid of the data, normalised to the maximum possible distance that could be obtained for a given age, initial isotopic composition, and initial value.
Consistent with Engel and Pickering (2022), we find that the spread of data along the isochron line is controlled mostly by variation in inherited Pb content rather than U content, with the latter tending to remain relatively constant across speleothem growth layers (see Fig. S4 in the Supplement). We find that U–Pb isochron age uncertainties correlate strongly with uncertainty in the isochron slope, excluding the highly radiogenic (i.e. very low inherited Pb) samples CC15-1 and CCB-C-3, which encompass multiple data points plotting close to, or overlapping, the disequilibrium concordia curve (Fig. 5a). In turn, isochron slope precision correlates with combined isochron spread, although sample CCB-C-20, which has an exceptionally low dispersion of data about the regression line (MSWD = 0.15), clearly does not conform to this general trend (Fig. 5b).
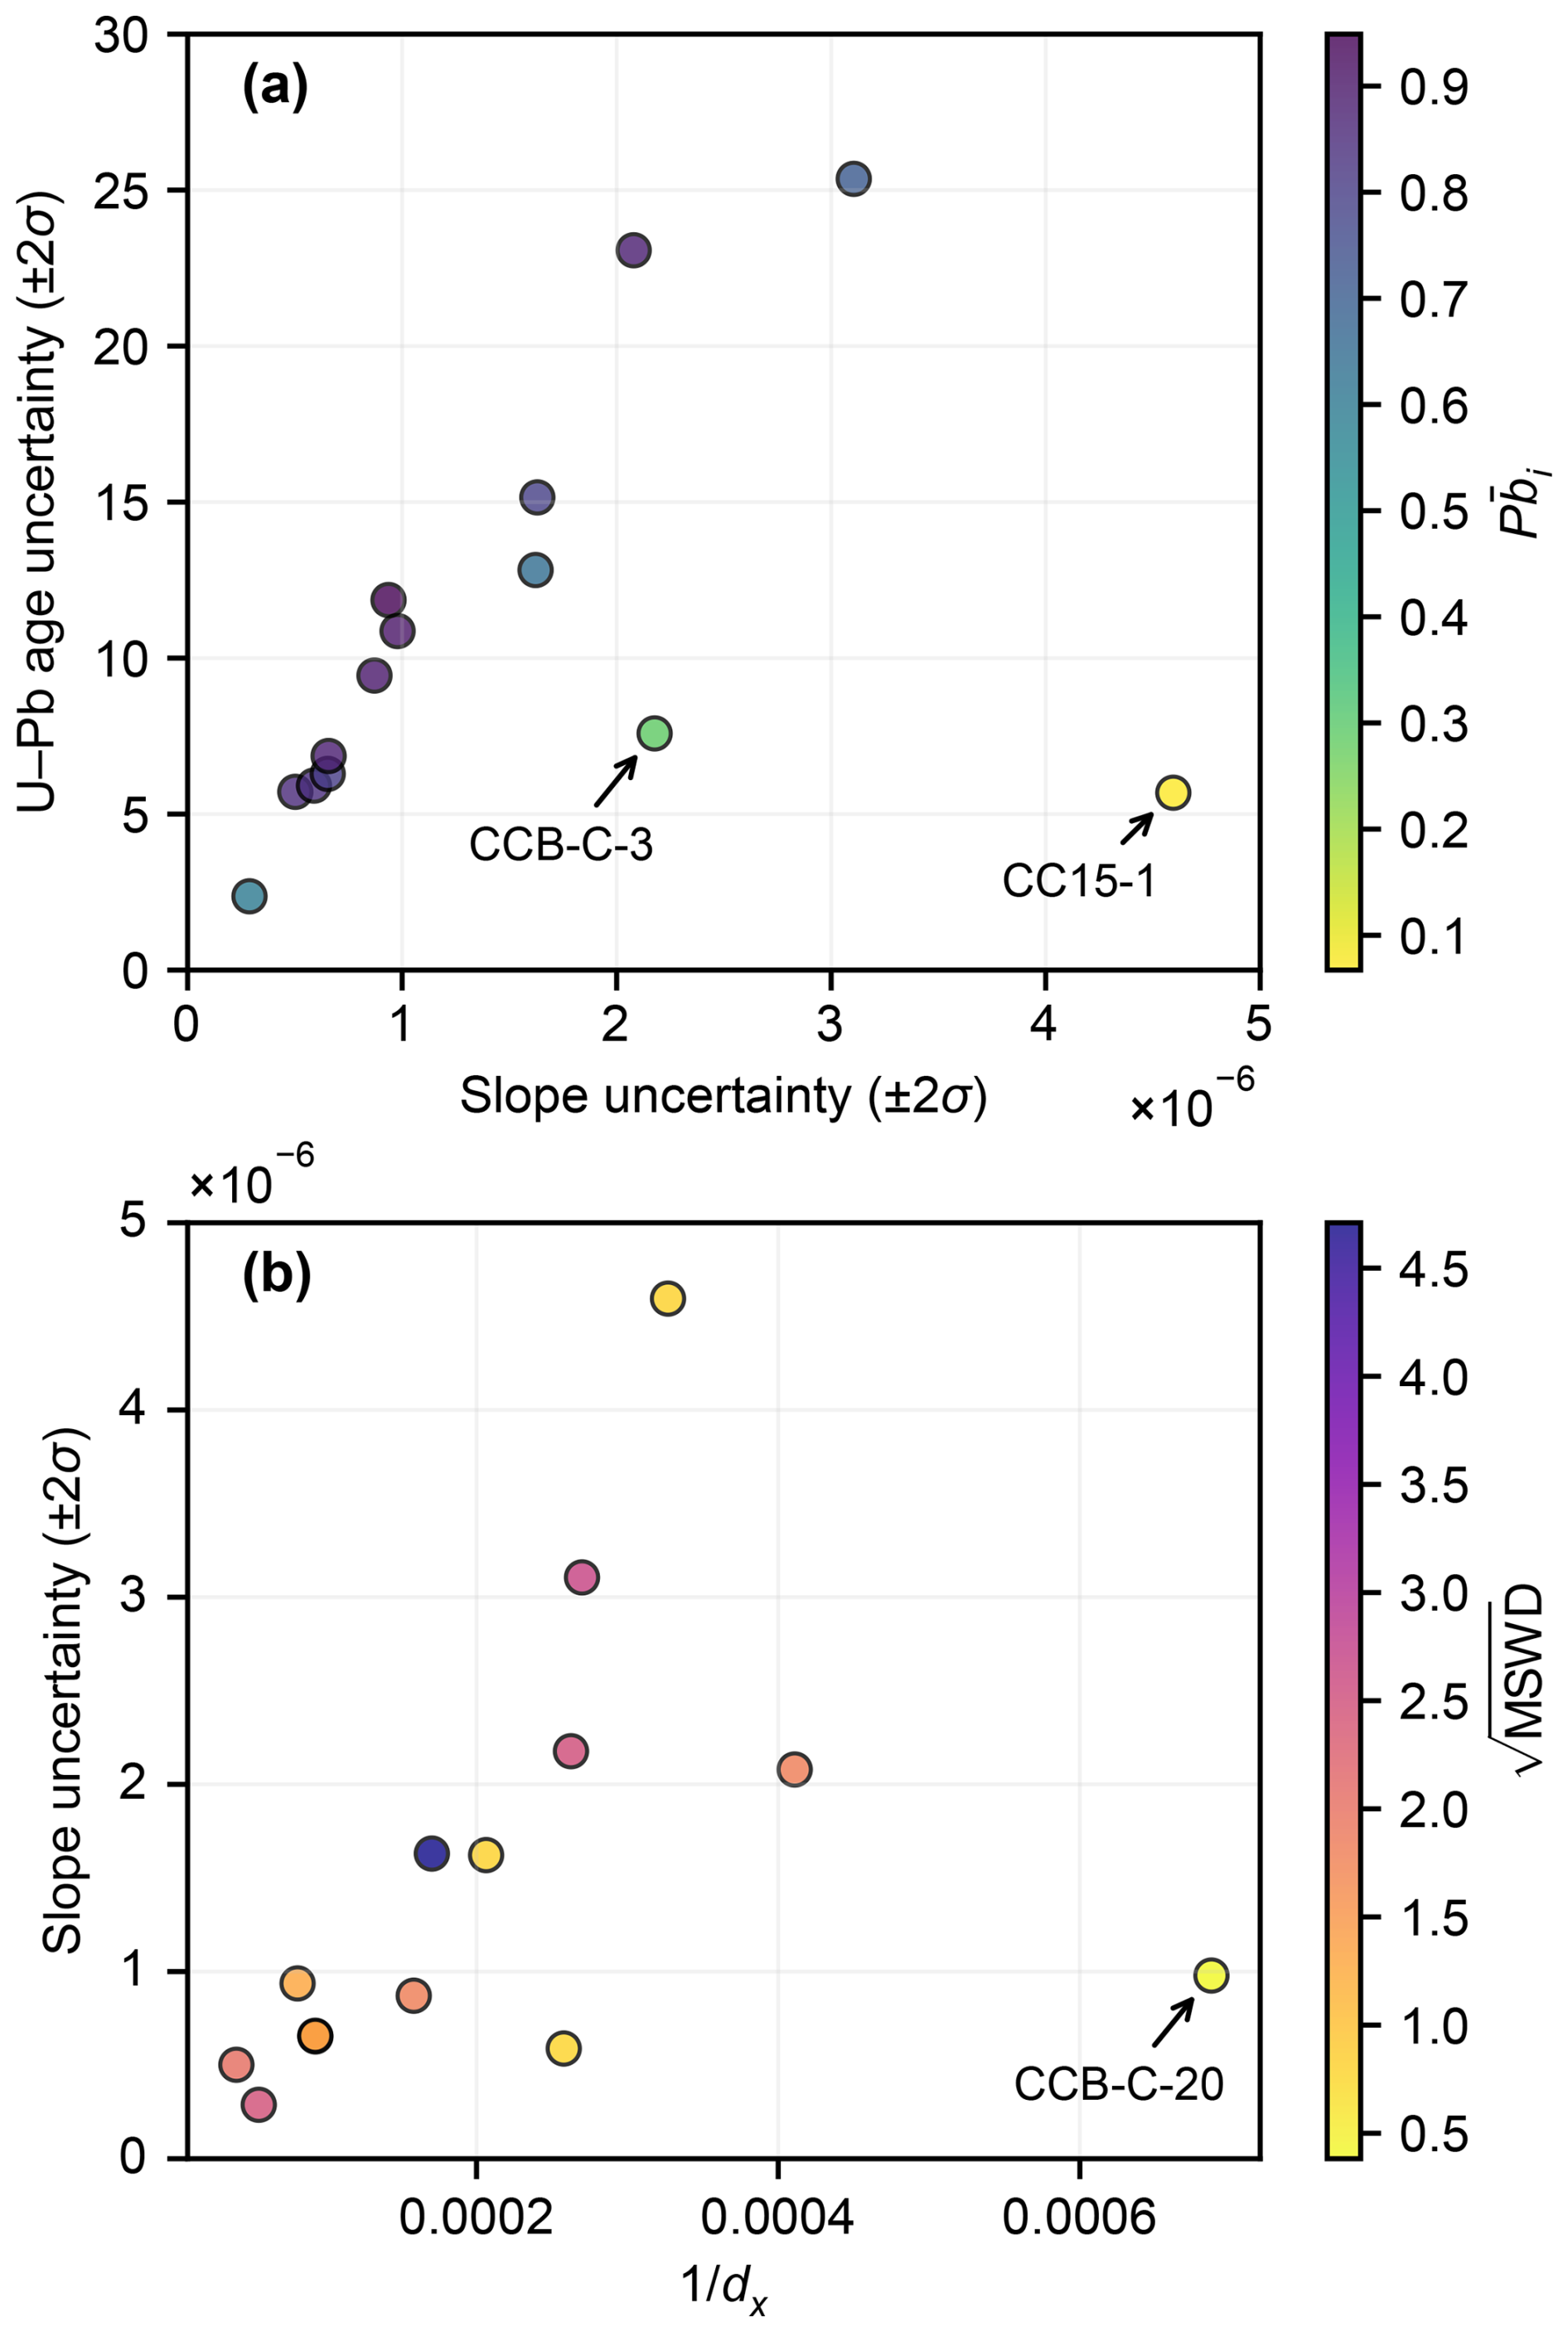
Figure 5Factors affecting U–Pb isochron age precision. (a) U–Pb age uncertainty plotted against isochron slope uncertainty. Markers are coloured according to (i.e. the “inherited Pb index”; see Eq. 5). Age uncertainty generally correlates strongly with uncertainty in the isochron slope, except where isochrons are highly radiogenic (i.e. have very low average inherited Pb). (b) Isochron slope uncertainty plotted against the reciprocal of the “combined isochron spread” (dx) metric (see Eq. 4). Overall, isochron slope uncertainty is correlated with the inverse of combined Pb U spread. An exception to this is sample CCB-C-20, which exhibits very little data scatter about the isochron. Markers are coloured according to , employed here as an indicator of data scatter about the isochron line.
Overall, we find that U–Pb isochron ages of similar average precision can be obtained throughout the ∼ 630–430 ka interval considered in this study provided that the isochron either encompasses data points with reasonable spread in Pb U ratios or includes highly radiogenic material. In practical terms, there are a number of ways in which samples can be pre-screened for suitability in this regard. A number of options were discussed in Woodhead et al. (2012), but advances in both chemical separation procedures (allowing rapid sample throughput) and the development of in situ analytical techniques (e.g. Roberts et al., 2020) have now rendered some of these approaches redundant. Currently, the most accurate and time-efficient methods for assessing suitability for U–Pb dating would appear to be either pre-screening via laser ablation ICPMS (Woodhead and Petrus, 2019), U–Th isotopic analysis using a high-throughput protocol (e.g. Hellstrom, 2003), whereby 232Th is employed as a proxy for inherited Pb (Woodhead et al., 2006) or a simple reconnaissance ID analysis involving a small number (∼ 3) of sub-samples taken from different parts of the growth domain.
4.3 Comparative of age precision
Given that U–Pb age uncertainties do not show an obvious trend with increasing age over the interval considered in this study (Fig. 4), it is reasonable to characterise average expected U–Pb age uncertainties using either a mean (±10.6 ka, 2σ) or median (±8.5 ka, 2σ) value. In this context, however, the median arguably provides a more useful indicator of expected U–Pb age uncertainty because it is less influenced by outliers, e.g. samples CC2-1 and CC17-1-3, which exhibit anomalously large age uncertainties relative to the other isochrons. For this dataset, median U–Pb age precision exceeds expected U–Th precision at ∼ 520 ka, suggesting that U–Pb dating may generally yield higher-precision ages beyond this point. However, caution is needed in generalising this finding to other study sites or sample types, which may be either less suitable to U–Pb geochronology (e.g. higher average inherited Pb) or more suitable to U–Th geochronology (e.g. similar U and Th content but higher initial values). In many cases, it is expected that this crossover point would occur at a somewhat older age.
Furthermore, even in cases where U–Pb dating delivers higher precision for a single age, there may be practical reasons to favour the use of the U–Th method. For example, U–Pb isochron ages are significantly more labour-intensive on a per-age basis (when using precise ID MC-ICPMS and TIMS approaches) compared to U–Th ages because of the need to analyse multiple coeval sub-samples (typically >4). Thus, in applications combining multiple age determination, such as in compiling a depth–age model along the axial length of a speleothem (e,g. Scholz et al., 2012; Bajo et al., 2012), the U–Th method may achieve lower final uncertainties for a given amount of analytical effort, even beyond the U–Th versus U–Pb age precision crossover point.
4.4 Inherited composition
In addition to yielding an age solution, Tera–Wasserburg isochrons yield an estimate of the composition of inherited Pb, assuming this to be invariant across the sub-samples used to construct the isochron (Tera and Wasserburg, 1972; Woodhead et al., 2012). The availability of multiple Tera–Wasserburg isochrons in this study, therefore, provides an opportunity to further assess the consistency or otherwise of the isotopic composition of inherited Pb at Corchia Cave. We find that inherited values are reasonably consistent (weighted mean = 0.8148 ± 0.0012, MSWD = 3.3, n=14, p=0.00) with no apparent trend with age. The elevated MSWD value, however, indicates the data are overdispersed with respect to their analytical uncertainties. If we assume that this overdispersion is due to real variability in the inherited Pb isotopic composition and, furthermore, that this additional component of variability is independent and follows a strict Gaussian distribution (e.g. Ludwig, 2000), we obtain a weighted average of 0.8149 ± 0.0017 (σexcess=0.023). However, the assumption of Gaussian-distributed excess scatter is not necessarily justified by the available data here. These results are reasonably close to the average value of Bajo et al. (2020), who obtained a weighted mean value of 0.8134 ± 0.0048 for Corchia Cave speleothems that grew over the interval ∼ 970–810 ka.
The relative consistency of inherited values observed in this study provides an opportunity to assess the effect of fixing Tera–Wasserburg isochron slopes to a common y-intercept value. If we repeat the U–Pb age calculations with the Tera–Wasserburg isochron slopes fixed at 0.8148, all ages remain within their original unanchored isochron age uncertainties, except for sample CCB-F-1, which returns a marginally older U–Pb age, and CC2-1, which returns a significantly older age. It is worth noting that isochron CC2-1 exhibits poor spread in U Pb ratios and is therefore particularly sensitive to the effect of anchoring the y intercept. Overall, these results suggest that for isochron datasets with limited U Pb variation, anchoring y intercepts to a well-constrained common value may still produce reliable ages at Corchia Cave.
4.5 Speleothem values
In recent years, high-precision U-isotope analyses have revealed significant natural δ238U variations across a range of different materials. These variations are attributed primarily to U fractionation associated with nuclear volume effects rather than classical mass-dependent fractionation (Fujii et al., 2009) and appear to be most pronounced during redox reactions. Notably, during the reduction of soluble U6+ to insoluble U4+, 238U is concentrated in the U4+ state, leaving the insoluble phase with a higher δ238U than the remaining dissolved U. This forms the basis for efforts to employ δ238U of marine sediments as a palaeoredox proxy (e.g. Andersen et al., 2014). Processes such as adsorption (e.g. Weyer et al., 2008) and mineral leaching by strong acids (Stirling et al., 2007; Hiess et al., 2012) have also been observed to induce fractionation, while the oxidation of U is not associated with significant fractionation.
Data acquired over the past ∼ 15 years suggest that the average δ238U of bulk crustal rocks (∼ −0.29 ‰) is practically indistinguishable from that of the deep mantle (∼ −0.31 ‰) (Andersen et al., 2017; Tissot and Dauphas, 2015). The upper mantle is somewhat more enriched in 238U on average due to recycling of altered oceanic crust (Andersen et al., 2015), whereas modern ocean water and marine carbonates are more depleted in 238U (∼ −0.39 ‰; Tissot and Dauphas, 2015). Accessory U minerals show more δ238U variability than bulk crustal rocks, as do materials formed in low-temperature environments (Stirling et al., 2007; Weyer et al., 2008; Hiess et al., 2012).
To date, only a small number of studies have reported δ238U values for speleothems. Stirling et al. (2007) and Cheng et al. (2013) presented δ238U values for speleothems from numerous cave systems and observed highly variable δ238U values ranging from ∼ −0.7 ‰ to +0.4 ‰, although variability within a single speleothem or cave system was significantly lower (Shen et al., 2012). Stirling et al. (2007) also identified a tentative correlation between speleothem δ238U and measured values, suggesting that speleothem 234U disequilibrium and fractionation may be linked by a common weathering control, albeit involving distinct fractionation mechanisms.
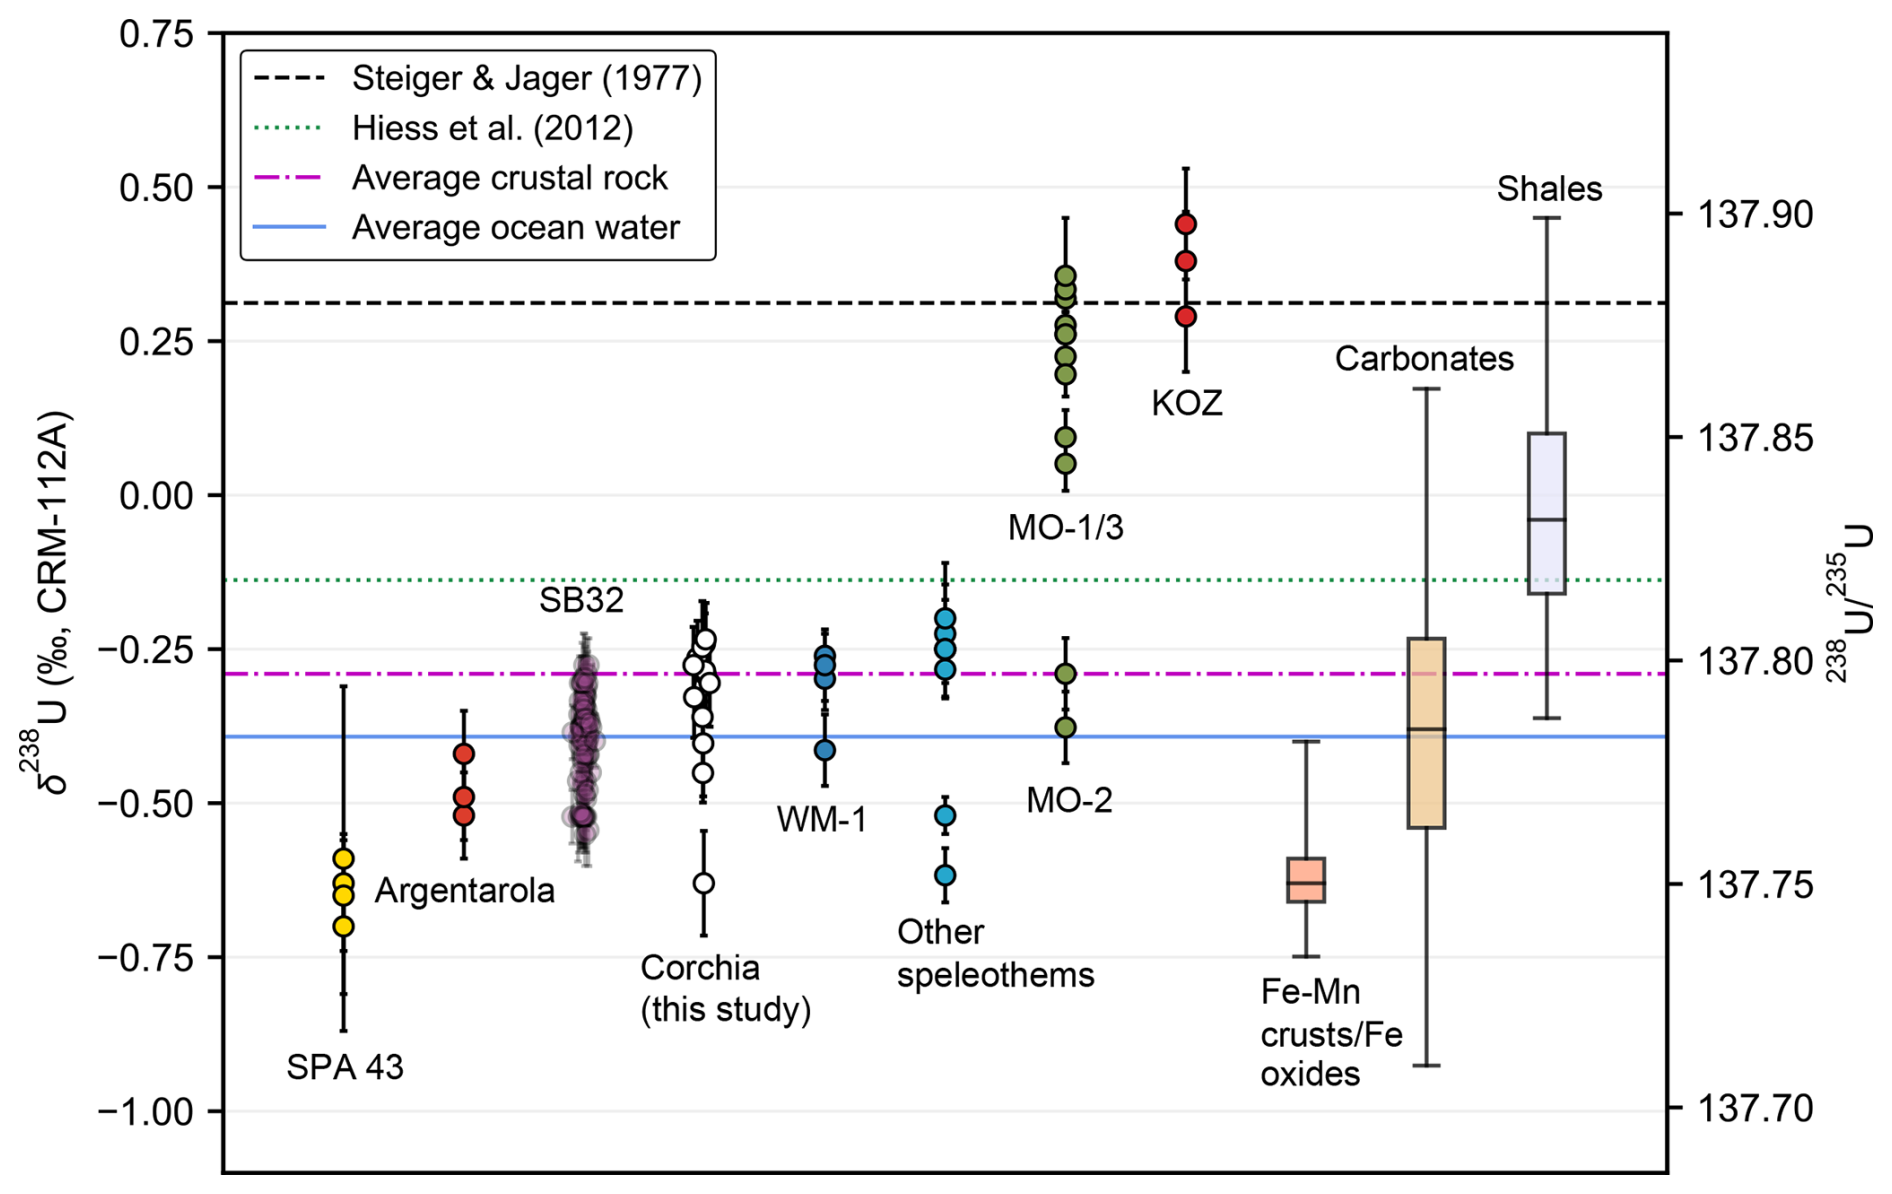
Figure 6Speleothem δ238U data from this study and others. Speleothem samples are grouped according to cave site where more than two analyses are available. Speleothem data analysed by Cheng et al. (2013) include SB32 from Sanbao Cave, central China (e.g. Wang et al., 2008), WM1 from Wilder Mann Cave, Northern Calcareous Alps, Austria (Meyer et al., 2009), and MO-1/2/3 from Leaena's Breath Cave, Nullarbor Plain, Australia (Woodhead et al., 2006). “Other speleothems” include the GBW04412 and GBW04413 stalagmite standards from Wang et al. (2023), the FAB-LIG sample from Stirling et al. (2007), and the Kr3 and CA-1 samples described in Cheng et al. (2013). Speleothem samples analysed by Stirling et al. (2007) include SPA-43 from Spannegal Cave, Austria (e.g. Spötl and Mangini, 2010), Argentaorola from Argentarola Island, central Italy (e.g. Bard et al., 2002), and KOZ. Also shown are the “consensus” value of Steiger and Jäger (1977), the average terrestrial zircon value of Hiess et al. (2012), and the average modern ocean water (−0.39 ‰) and crustal rock (−0.29 ‰) values (Tissot and Dauphas, 2015). The global range of δ238U values for carbonates, Phanerozoic shales, and Fe–Mn crusts/Fe oxides are shown as box plots with “whiskers” indicating the 2.5th and 97.5th percentiles. These data were taken from the Uranium Isotope Database (UID) of Li and Tissot (2023). Absolute values are shown on the right-hand y axis based on the CRM-112A value of 137.837 from Richter et al. (2010).
The use of a high-precision all-Faraday-cup protocol for U–Th measurements in this study, employing 233U–236U double spike for mass bias correction, provides accurate and precise δ238U determinations. Average analytical uncertainty in measured ratios was 0.0006 (2σ), which is adequate for assessing δ238U variability at the sub-per mil level (see Table 1). A comparison of our speleothem δ238U with previous studies (Fig. 6) reveals that most values fall within a range from approximately −0.6 ‰ to −0.2 ‰, consistent with the range observed for carbonate rocks globally (Li and Tissot, 2023). This supports the simple hypothesis that speleothems primarily inherit their composition from carbonate host rocks without significant fractionation. However, two Nullarbor speleothem samples (MO-1/3; Woodhead et al., 2006) and the KOZ samples (Stirling et al., 2007) exhibit elevated δ238U values, suggesting either a more 238U-enriched non-carbonate source of U or the presence of an enriching fractionation process during source water U uptake and/or transport to the site of speleothem deposition. Clearly further studies, ideally involving paired speleothem–bedrock analyses, are required to investigate the cause of these high δ238U values, as well as the primary controls on speleothem δ238U values more generally.
We also compared the δ238U and measured values of the speleothems analysed in this study with data obtained in previous studies to further assess the relationship between speleothem 234U disequilibrium and fractionation (see Fig. S5 in the Supplement). With the inclusion of additional speleothem data, we observed a weaker correlation between δ238U and measured values than Stirling et al. (2007), i.e. R2=0.42 versus R2=0.65, and this correlation becomes negligible if the “high-leverage” KOZ data are excluded. However, for speleothem samples that are presumed to have acted as a closed system with respect to U-series isotopes post deposition, it is more appropriate to compare δ238U values with initial values instead of measured activity ratios, since measured values also depend on sample age. When repeating this comparison using initial values instead of measured values (necessarily excluding a number of samples for which no age data were available), no correlation is observed (R2=0.01). This result is inconsistent with the hypothesis that speleothem 234U disequilibrium and fractionation are linked by a common weathering control.
Regardless of the dominant controls on speleothem δ238U values, the data available thus far show that the U-isotopic composition of most speleothems departs significantly from the conventional value of Steiger and Jäger (1977) and also to a lesser extent the average terrestrial zircon value of Hiess et al. (2012). Using a present-day value of ∼ 137.79 (the weighted average obtained for speleothem samples in this study) in place of the traditional value of 137.88 (Steiger and Jäger, 1977), for either mass bias correction of U–Pb data or in U–Pb age calculation, has a negligible effect on U–Pb ages for young (e.g. Cenozoic) samples. However, when applying the Pb Pb dating approach to older materials, the value adopted can have a significant effect on age accuracy (Stirling et al., 2007; Weyer et al., 2008; Hiess et al., 2012). This is also the case in U–Th dating using an assumed value for either mass bias correction or calculating 238U-based ratios from measured 235U (Stirling et al., 2007; Cheng et al., 2013), although the magnitude of the inaccuracy depends greatly on the specific analytical protocol that is adopted (Shen et al., 2012). The significant departure of speleothem values from 137.88 that is observed here re-iterates the need to pay careful attention to the value that is adopted when dating carbonates under these circumstances.
This comparison of the carbonate U–Th and U–Pb chronometers demonstrates excellent agreement between these dating methods over a significant part of the Middle Pleistocene (∼ 630–430 ka). In addition to establishing consistency, we identify key differences in the performance characteristics of the two dating methods. We find the following:
-
U–Th age uncertainties are reasonably predictable (for a given level of analytical precision and initial Th content) and tend to increase in an approximately exponential manner with age. U–Pb age uncertainties do not increase systematically over this interval but are highly dependent on individual sample characteristics, such as Pb U spread of data points and the availability of highly radiogenic material.
-
The average precision of U–Pb isochron ages surpasses that of U–Th ages prior to the latter reaching its upper age limit. This occurs at ∼ 520 ka for our dataset, although the exact crossover point may vary considerably across different sample types and depositional settings.
-
Even in cases where the precision of U–Pb isochron ages clearly surpasses that of corresponding U–Th age determinations, U–Th dating may still offer some practical advantages, for example, when combining multiple age determinations (e.g. in compiling speleothem depth–age models) because U–Th dating is generally less labour-intensive on a per-age basis.
Overall, these findings highlight the complementary nature of the U–Th and U–Pb dating methods and reaffirm the potential for their combined use in producing accurate and consistent Middle Pleistocene chronologies.
Finally, our assessment of speleothem reveals the following:
-
The majority of speleothem values are consistent with the range observed for carbonate rocks globally, although there are some exceptions.
-
Speleothem values typically depart significantly from the nominal value of 137.88 (Steiger and Jäger, 1977), traditionally adopted as a constant in geochronology. This re-emphasises the need to pay careful attention to the value adopted in data processing and age calculation when it has a significant influence on calculated ages.
-
Further studies are required, ideally involving paired speleothem–bedrock analyses, to better understand the controls on speleothem .
A1 U–Th age equation
The standard U–Th age equation, which assumes negligible initial 230Th and negligible decay of 238U, may be written as
where a08 and a48 denote measured and activity ratios respectively (Broecker, 1963). This equation can be solved for t via iterative methods, such as Newton's method.
A2 U–Pb age equation
The Tera–Wasserburg U–Pb age equation may be written as
where α and β are the y intercept and slope of the fitted isochron line respectively, (such that the superscript ∗ denotes radiogenic Pb), , and U is the present ratio. If initial abundances of intermediate nuclides other than 234U are negligible, then Eqs. (1) and (7) in Pollard et al. (2023) simplify to
where
and
Equation (A3) incorporates a re-arranged version of the 234U age equation that assumes negligible decay of 238U (e.g. Woodhead et al., 2006), but it is also possible to use a version of this equation that does not make this assumption (e.g. Ivanovich and Harom, 1992, p. 780) instead. In this study it makes little difference which form of the equation is adopted, so the simpler version is used. The coefficients ci, hi, and di are “Bateman coefficients” given by the following:
Having fitted a suitable isochron line and obtained a measurement that is representative of the material sampled for Pb U analysis, Eq. (A2) may also be solved for t via iterative methods, such as Newton's method.
U–Th and U–Pb age uncertainties and their uncertainty correlation may be computed via first-order uncertainty propagation. A convenient way to set up these calculations is via the matrix approach outlined in McLean et al. (2011). Starting with Eq. (63) in McLean et al. (2011) we have
where J is the Jacobian matrix of derivatives and V is the covariance matrix of the age equation input variables. These matrices may be written in full as
The derivatives in the first column of J are given by
and
such that
These expressions are equivalent to those given in Ludwig and Titterington (1994). The derivatives in the second column of J are given by
where
The partial derivatives in k2 are
where and are trivial to compute since γ and η are simply composed of sums of exponential terms, and
Having calculated the U–Th and U–Pb age uncertainties, and , and the covariance between them, cov(tTh, tPb), via Eq. (B1), the correlation coefficient is simply given by
All data used for age calculations and statistical analyses are available in the Supplement.
The supplement related to this article is available online at https://doi.org/10.5194/gchron-7-335-2025-supplement.
GZ, RD, II, JH, ER, and TP collected the samples and undertook preliminary analyses to identify those suitable for this study. RLE, HC, MP, and XL, developed the U–Th analytical protocol, and TP, MP, XL, and DP carried out the U–Th analyses. TP, JW, and AW carried out the U–Pb analyses. TP undertook the statistical analyses and wrote the manuscript with contributions from all co-authors.
The contact author has declared that none of the authors has any competing interests.
Publisher's note: Copernicus Publications remains neutral with regard to jurisdictional claims made in the text, published maps, institutional affiliations, or any other geographical representation in this paper. While Copernicus Publications makes every effort to include appropriate place names, the final responsibility lies with the authors.
We are grateful to the Gruppo Speleologico Lucchese for their assistance with the recovery of speleothem samples analysed in this study. We thank Cameron Patrick of the Statistical Consulting Centre, University of Melbourne, for advice on certain aspects of the age comparison. We thank David Richards and one anonymous reviewer for their helpful comments and suggestions that significantly improved earlier versions of this paper.
This research has been supported by the Australian Research Council (grant nos. DP160202969, DP220102133, and FL160100028).
This paper was edited by Norbert Frank and reviewed by David Richards and one anonymous referee.
Andersen, M. B., Stirling, C. H., Potter, E.-K., and Halliday, A. N.: Toward epsilon levels of measurement precision on by using MC-ICPMS, Int. J. Mass Spectrom., 237, 107–118, https://doi.org/10.1016/j.ijms.2004.07.004, 2004. a
Andersen, M. B., Romaniello, S., Vance, D., Little, S. H., Herdman, R., and Lyons, T. W.: A modern framework for the interpretation of 238U 235U in studies of ancient ocean redox, Earth Planet. Sc. Lett., 400, 184–194, https://doi.org/10.1016/j.epsl.2014.05.051, 2014. a
Andersen, M. B., Elliott, T., Freymuth, H., Sims, K. W. W., Niu, Y., and Kelley, K. A.: The terrestrial uranium isotope cycle, Nature, 517, 356–359, https://doi.org/10.1038/nature14062, 2015. a
Andersen, M. B., Stirling, C. H., and Weyer, S.: Uranium isotope fractionation, Rev. Mineral. Geochem., 82, 799–850, https://doi.org/10.2138/rmg.2017.82.19, 2017. a
Bajo, P., Drysdale, R., Woodhead, J., Hellstrom, J., and Zanchetta, G.: High-resolution U–Pb dating of an Early Pleistocene stalagmite from Corchia Cave (central italy), Quat. Geochronol., 14, 5–17, https://doi.org/10.1016/j.quageo.2012.10.005, 2012. a, b
Bajo, P., Hellstrom, J., Frisia, S., Drysdale, R., Black, J., Woodhead, J., Borsato, A., Zanchetta, G., Wallace, M. W., Regattieri, E., and Haese, R.: “Cryptic” diagenesis and its implications for speleothem geochronologies, Quaternary Sci. Rev., 148, 17–28, https://doi.org/10.1016/j.quascirev.2016.06.020, 2016. a
Bajo, P., Borsato, A., Drysdale, R., Hua, Q., Frisia, S., Zanchetta, G., Hellstrom, J., and Woodhead, J.: Stalagmite carbon isotopes and dead carbon proportion (DCP) in a near-closed-system situation: An interplay between sulphuric and carbonic acid dissolution, Geochim. Cosmochim. Ac., 210, 208–227, https://doi.org/10.1016/j.gca.2017.04.038, 2017. a
Bajo, P., Drysdale, R. N., Woodhead, J. D., Hellstrom, J. C., Hodell, D., Ferretti, P., Voelker, A. H. L., Zanchetta, G., Rodrigues, T., Wolff, E., Tyler, J., Frisia, S., Spötl, C., and Fallick, A. E.: Persistent influence of obliquity on ice age terminations since the Middle Pleistocene transition, Science, 367, 1235–1239, https://doi.org/10.1126/science.aaw1114, 2020. a, b, c, d
Bard, E., Antonioli, F., and Silenzi, S.: Sea-level during the penultimate interglacial period based on a submerged stalagmite from Argentarola Cave (Italy), Earth Planet. Sc. Lett., 196, 135–146, https://doi.org/10.1016/S0012-821X(01)00600-8, 2002. a
Barlow, R. J.: A Guide to the Use of Statistical Methods in the Physical Sciences, The Manchester Physics Series, John Wiley & Sons, Chilchester, UK, ISBN 0-471-92294-3, 1989. a
Bender, M. L., Taylor, F. T., and Matthews, R. K.: Helium-uranium dating of corals from middle Pleistocene Barbados reef tracts, Quaternary Res., 3, 142–146, 1973. a
Broecker, W. S.: A preliminary evaluation of uranium series inequilibrium as a tool for absolute age measurement on marine carbonates, J. Geophys. Res., 68, 2817–2834, 1963. a
Chen, J. H., Lawrence Edwards, R., and Wasserburg, G. J.: 238U, 234U and 232Th in seawater, Earth Planet. Sc. Lett., 80, 241–251, https://doi.org/10.1016/0012-821X(86)90108-1, 1986. a
Cheng, H., Lawrence Edwards, R., Shen, C.-C., Polyak, V. J., Asmerom, Y., Woodhead, J., Hellstrom, J., Wang, Y., Kong, X., Spötl, C., Wang, X., and Calvin Alexander, E.: Improvements in 230Th dating, 230Th and 234U half-life values, and U–Th isotopic measurements by multi-collector inductively coupled plasma mass spectrometry, Earth Planet. Sc. Lett., 371–372, 82–91, https://doi.org/10.1016/j.epsl.2013.04.006, 2013. a, b, c, d, e, f, g, h, i, j
Cheng, H., Edwards, R. L., Sinha, A., Spötl, C., Yi, L., Chen, S., Kelly, M., Kathayat, G., Wang, X., Li, X., Kong, X., Wang, Y., Ning, Y., and Zhang, H.: The Asian monsoon over the past 640,000 years and ice age terminations, Nature, 534, 640–646, https://doi.org/10.1038/nature18591, 2016. a, b
Cliff, R. A., Spötl, C., and Mangini, A.: U–Pb dating of speleothems from Spannagel Cave, Austrian Alps: A high resolution comparison with U-series ages, Quat. Geochronol., 5, 452–458, https://doi.org/10.1016/j.quageo.2009.12.002, 2010. a, b
Condon, D., Mclean, N., Schoene, B., Bowring, S., Parrish, R., and Noble, S.: Synthetic U–Pb “standard” solutions for ID-TIMS geochronology, in: Goldschmidt Conference 18, 13–18 July 2008, Vancouver, Canada, https://doi.org/10.1016/j.gca.2008.05.006, 2008. a
Condon, D. J., Schoene, B., McLean, N. M., Bowring, S. A., and Parrish, R. R.: Metrology and traceability of U–Pb isotope dilution geochronology (EARTHTIME tracer calibration part I), Geochim. Cosmochim. Ac., 164, 464–480, https://doi.org/10.1016/j.gca.2015.05.026, 2015. a
Corrick, E. C., Drysdale, R. N., Hellstrom, J. C., Capron, E., Rasmussen, S. O., Zhang, X., Fleitmann, D., Couchoud, I., and Wolff, E.: Synchronous timing of abrupt climate changes during the last glacial period, Science, 369, 963–969, https://doi.org/10.1126/science.aay5538, 2020. a
Denniston, R. F., Asmerom, Y., Polyak, V. Y., McNeill, D. F., Klaus, J. S., Cole, P., and Budd, A. F.: Caribbean chronostratigraphy refined with U-Pb dating of a Miocene coral, Geology, 36, 151–4, https://doi.org/10.1130/G24280A.1, 2008. a
Drysdale, R., Couchoud, I., Zanchetta, G., Isola, I., Regattieri, E., Hellstrom, J., Govin, A., Tzedakis, P. C., Ireland, T., Corrick, E., Greig, A., Wong, H., Piccini, L., Holden, P., and Woodhead, J.: Magnesium in subaqueous speleothems as a potential palaeotemperature proxy, Nat. Commun., 11, 5027, https://doi.org/10.1038/s41467-020-18083-7, 2020. a, b
Drysdale, R. N., Zanchetta, G., Baneschi, I., Guidi, M., Isola, I., Couchoud, I., Piccini, L., Greig, A., Wong, H., Woodhead, J. D., Regattieri, E., Corrick, E., Paul, B., Spötl, C., Denson, E., Gordon, J., Jaillet, S., Dux, F., and Hellstrom, J. C.: Partitioning of Mg, Sr, Ba and U into a subaqueous calcite speleothem, Geochim. Cosmochim. Ac., 264, 67–91, https://doi.org/10.1016/j.gca.2019.08.001, 2019. a, b
Edwards, R. L., Chen, J. H., and Wasserburg, G. J.: 238U-234U-230Th-232Th systematics and the precise measurement of time over the past 500 000 years, Earth Planet. Sc. Lett., 81, 175–192, https://doi.org/10.1016/0012-821X(87)90154-3, 1987. a, b
Edwards, R. L., Gallup, C. D., and Cheng, H.: Uranium-series dating of marine and lacustrine carbonates, in: Uranium-series geochemistry, edited by: Bourdon, B., Turner, S., Henderson, G. M., and Lundstrom, C. C., vol. 52 of Reviews in Mineralogy and Geochemistry, Mineralogical Society of America, Washington, D.C., USA, 363–405, ISBN 0-939950-54-5, 2003. a
Engel, J. and Pickering, R.: The role of inherited Pb in controlling the quality of speleothem U–Pb ages, Quat. Geochronol., 67, 101243, https://doi.org/10.1016/j.quageo.2021.101243, 2022. a, b, c, d, e
Engel, J., Woodhead, J., Hellstrom, J., White, S., White, N., and Green, H.: Using speleothems to constrain late Cenozoic uplift rates in karst terranes, Geology, 48, 755–760, https://doi.org/10.1130/G47466.1, 2020. a, b
Fujii, T., Moynier, F., and Albarède, F.: The nuclear field shift effect in chemical exchange reactions, Chem. Geol., 267, 139–156, https://doi.org/10.1016/j.chemgeo.2009.06.015, 2009. a
Goldstein, S. J. and Stirling, C. H.: Techniques for measuring uranium-series nuclides: 1992–2002, Rev. Mineral. Geochem., 52, 23–57, 2003. a
Hellstrom, J.: Rapid and accurate U Th dating using parallel ion-counting multicollector ICP-MS, J. Anal. Atom. Spectrom., 18, 1346, https://doi.org/10.1039/b308781f, 2003. a
Hellstrom, J. and Pickering, R.: Recent advances and future prospects of the U-Th and U-Pb chronometers applicable to archaeology, J. Archaeol. Sci., 56, 32–40, https://doi.org/10.1016/j.jas.2015.02.032, 2015. a
Hellstrom, J. C.: Late Quaternary Palaeoenvironmental Records from the Geochemistry of Speleothems, North-West Nelson, New Zealand, PhD thesis, Australian National University, Canberra, Australia, https://doi.org/10.25911/5d67b65b7bc2b, 1998. a
Hiess, J., Condon, D. J., McLean, N., and Noble, S. R.: 238U/235U systematics in terrestrial uranium-bearing minerals, Science, 335, 1610–1614, https://doi.org/10.1126/science.1215507, 2012. a, b, c, d, e, f
Isola, I., Zanchetta, G., Drysdale, R. N., Regattieri, E., Bini, M., Bajo, P., Hellstrom, J. C., Baneschi, I., Lionello, P., Woodhead, J., and Greig, A.: The 4.2 ka event in the central Mediterranean: new data from a Corchia speleothem (Apuan Alps, central Italy), Clim. Past, 15, 135–151, https://doi.org/10.5194/cp-15-135-2019, 2019. a
Ivanovich, M. and Harmon, R. S.: Uranium-series disequilibrium: applications to earth, marine, and environmental sciences, second edition, Clarendon Press, UK, ISBN 0-19-854278-X, 1992. a
Jaffey, A. H., Flynn, K. F., Glendeni, L. E., Bentley, W. C., and Essling, A. M.: Precision measurement of half-lives and specific activities of U-235 and U-238, Phys. Rev. C, 4, 1889–1906, 1971. a
Klaus, J. S., Meeder, J. F., McNeill, D. F., Woodhead, J. F., and Swart, P. K.: Expanded Florida reef development during the mid-Pliocene warm period, Global Planet. Change, 152, 27–37, https://doi.org/10.1016/j.gloplacha.2017.02.001, 2017. a
Li, H. and Tissot, F. L. H.: UID: The uranium isotope database, Chem. Geol., 618, 121221, https://doi.org/10.1016/j.chemgeo.2022.121221, 2023. a, b
Ludwig, K. R.: User's manual for Isoplot/Ex v. 2.2, A Geochronological Toolkit for Microsoft Excel, BGC Special Publication 1a, Berkeley, 55, 2000. a
Ludwig, K. R.: Mathematical–Statistical treatment of data and errors for geochronology, in: Uranium-series geochemistry, edited by: Bourdon, B., Turner, S., Henderson, G. M., and Lundstrom, C. C., vol. 52 of Reviews in Mineralogy & Geochemistry, Mineralogical Society of America, Washington, D.C., USA, 631–656, ISBN 0-939950-54-5, 2003. a, b
Ludwig, K. R. and Titterington, D. M.: Calculation of 230Th U isochrons, ages, and errors, Geochim. Cosmochim. Ac., 58, 5031–5042, https://doi.org/10.1016/0016-7037(94)90229-1, 1994. a
Makhubela, T. V. and Kramers, J. D.: Testing a new combined (U,Th)–He and U Th dating approach on Plio-Pleistocene calcite speleothems, Quat. Geochronol., 67, 101234, https://doi.org/10.1016/j.quageo.2021.101234, 2022. a
McLean, N. M., Bowring, J. F., and Bowring, S. A.: An algorithm for U-Pb isotope dilution data reduction and uncertainty propagation, Geochem. Geophy. Geosy., 12, Q0AA18, https://doi.org/10.1029/2010GC003478, 2011. a, b
McLean, N. M., Smith, C. J., Roberts, N. M. W., and Richards, D. A.: Connecting the U–Th and U–Pb Chronometers: New Algorithms and Applications, American Geophysical Union Fall Meeting, 12–16 December 2016, San Francisco, California, USA, V23A-2957, https://ui.adsabs.harvard.edu/abs/2016AGUFM.V23A2957M (last access: 30 July 2025), 2016. a
Meckler, A. N., Clarkson, M. O., Cobb, K. M., Sodemann, H., and Adkins, J. F.: Interglacial hydroclimate in the tropical West Pacific through the Late Pleistocene, Science, 336, 1301–1304, https://doi.org/10.1126/science.1218340, 2012. a
Meyer, M. C., Cliff, R. A., Spotl, C., Knipping, M., and Mangini, A.: Speleothems from the earliest Quaternary: Snapshots of paleoclimate and landscape evolution at the northern rim of the Alps, Quaternary Sci. Rev., 28, 1374–1391, https://doi.org/10.1016/j.quascirev.2009.01.010, 2009. a
Min, K., Mundil, R., Renne, P. R., and Ludwig, K. R.: A test for systematic errors in 40Ar 39Ar geochronology through comparison with U Pb analysis of a 1.1-Ga rhyolite, Geochim. Cosmochim. Ac., 64, 73–98, https://doi.org/10.1016/S0016-7037(99)00204-5, 2000. a
Piccini, L., Zanchetta, G., Drysdale, R. N., Hellstrom, J., Isola, I., Fallick, A. E., Leone, G., Doveri, M., Mussi, M., Mantelli, F., Molli, G., Lotti, L., Roncioni, A., Regattieri, E., Meccheri, M., and Vaselli, L.: The environmental features of the Monte Corchia cave system (Apuan Alps, central Italy) and their effects on speleothem growth, Int. J. Speleol., 37, 153–172, https://doi.org/10.5038/1827-806X.37.3.2, 2008. a, b
Pickering, R., Kramers, J. D., Partridge, T., Kodolanyi, J., and Pettke, T.: U-Pb dating of calcite-aragonite layers in speleothems from hominin sites in South Africa by MC-ICP-MS, Quat. Geochronol., 5, 544–558, https://doi.org/10.1016/j.quageo.2009.12.004, 2010. a
Pickering, R., Dirks, P. H. G. M., Jinnah, Z., de Ruiter, D. J., Churchill, S. E., Herries, A. I. R., Woodhead, J. D., Hellstrom, J. C., and Berger, L. R.: Australopithecus sediba at 1.977 Ma and implications for the origins of the genus Homo, Science, 333, 1421–1423, https://doi.org/10.1126/science.1203697, 2011. a
Pike, A. W. G., Hoffmann, D. L., Pettitt, P. B., García-Diez, M., and Zilhão, J.: Dating Palaeolithic cave art: Why U–Th is the way to go, Quatern. Int., 432, 41–49, https://doi.org/10.1016/j.quaint.2015.12.013, 2017. a
Pollard, T., Woodhead, J., Hellstrom, J., Engel, J., Powell, R., and Drysdale, R.: DQPB: software for calculating disequilibrium U–Pb ages, Geochronology, 5, 181–196, https://doi.org/10.5194/gchron-5-181-2023, 2023. a, b, c, d, e
Potter, E.-K., Stirling, C. H., Andersen, M. B., and Halliday, A. N.: High precision Faraday collector MC-ICPMS thorium isotope ratio determination, Int. J. Mass Spectrom., 247, 10–17, https://doi.org/10.1016/j.ijms.2005.08.017, 2005. a, b
Powell, R., Green, E. C. R., Marillo Sialer, E., and Woodhead, J.: Robust isochron calculation, Geochronology, 2, 325–342, https://doi.org/10.5194/gchron-2-325-2020, 2020. a, b, c
Pythoud, M.: Development of High-Precision Measurements for Uranium and Thorium Isotopes Using a Multi-Collector- Inductively-Coupled Plasma Mass Spectrometer, Master's thesis, University of Minnesota, Minneapolis, USA, https://hdl.handle.net/11299/252314 (last access: 5 August 2025), 2022. a, b, c, d, e, f
Radtke, U., Grün, R., and Schwarcz, H. P.: Electron Spin Resonance Dating of the Pleistocene Coral Reef Tracts of Barbados, Quaternary Res., 29, 197–215, https://doi.org/10.1016/0033-5894(88)90030-0, 1988. a
Regattieri, E., Zanchetta, G., Drysdale, R. N., Isola, I., Hellstrom, J. C., and Dallai, L.: Late glacial to holocene trace element record (Ba, Mg, Sr) from Corchia Cave (Apuan Alps, central Italy): paleoenvironmental implications, J. Quaternary Sci., 29, 381–392, https://doi.org/10.1002/jqs.2712, 2014. a
Reimer, P. J., Austin, W. E. N., Bard, E., Bayliss, A., Blackwell, P. G., Ramsey, C. B., Butzin, M., Cheng, H., Edwards, R. L., Friedrich, M., Grootes, P. M., Guilderson, T. P., Hajdas, I., Heaton, T. J., Hogg, A. G., Hughen, K. A., Kromer, B., Manning, S. W., Muscheler, R., Palmer, J. G., Pearson, C., van der Plicht, J., Reimer, R. W., Richards, D. A., Scott, E. M., Southon, J. R., Turney, C. S. M., Wacker, L., Adolphi, F., Büntgen, U., Capano, M., Fahrni, S. M., Fogtmann-Schulz, A., Friedrich, R., Köhler, P., Kudsk, S., Miyake, F., Olsen, J., Reinig, F., Sakamoto, M., Sookdeo, A., and Talamo, S.: The IntCal20 Northern Hemisphere Radiocarbon Age Calibration Curve (0–55 cal kBP), Radiocarbon, 62, 725–757, https://doi.org/10.1017/RDC.2020.41, 2020. a
Richards, D. A., Bottrell, S. H., Cliff, R. A., Ströhle, K., and Rowe, P. J.: U-Pb dating of a speleothem of Quaternary age, Geochim. Cosmochim. Ac., 62, 3683–3688, https://doi.org/10.1016/S0016-7037(98)00256-7, 1998. a, b, c
Richter, S., Eykens, R., Kühn, H., Aregbe, Y., Verbruggen, A., and Weyer, S.: New average values for the isotope ratios of natural uranium standards, Int. J. Mass Spectrom., 295, 94–97, https://doi.org/10.1016/j.ijms.2010.06.004, 2010. a
Roberts, N. M. W., Drost, K., Horstwood, M. S. A., Condon, D. J., Chew, D., Drake, H., Milodowski, A. E., McLean, N. M., Smye, A. J., Walker, R. J., Haslam, R., Hodson, K., Imber, J., Beaudoin, N., and Lee, J. K.: Laser ablation inductively coupled plasma mass spectrometry (LA-ICP-MS) U–Pb carbonate geochronology: strategies, progress, and limitations, Geochronology, 2, 33–61, https://doi.org/10.5194/gchron-2-33-2020, 2020. a
Russell, W. A., Papanastassiou, D. A., and Tombrello, T. A.: Ca isotope fractionation on the Earth and other solar system materials, Geochim. Cosmochim. Ac., 42, 1075–1090, https://doi.org/10.1016/0016-7037(78)90105-9, 1978. a
Schaltegger, U., Ovtcharova, M., Gaynor, S. P., Schoene, B., Wotzlaw, J.-F., Davies, J. F. H. L., Farina, F., Greber, N. D., Szymanowski, D., and Chelle-Michou, C.: Long-term repeatability and interlaboratory reproducibility of high-precision ID-TIMS U–Pb geochronology, J. Anal. Atom. Spectrom., 36, 1466–1477, https://doi.org/10.1039/D1JA00116G, 2021. a
Scholz, D., Hoffmann, D. L., Hellstrom, J., and Bronk Ramsey, C.: A comparison of different methods for speleothem age modelling, Quat. Geochronol., 14, 94–104, https://doi.org/10.1016/j.quageo.2012.03.015, 2012. a
Scholz, D., Tolzmann, J., Hoffmann, D. L., Jochum, K. P., Spötl, C., and Riechelmann, D. F. C.: Diagenesis of speleothems and its effect on the accuracy of 230Th U-ages, Chem. Geol., 387, 74–86, https://doi.org/10.1016/j.chemgeo.2014.08.005, 2014. a
Shen, C.-C., Wu, C.-C., Cheng, H., Edwards, R. L., Hsieh, Y.-T., Gallet, S., Chang, C.-C., Li, T.-Y., Lam, D. D., Kano, A., Hori, M., and Spötl, C.: High-precision and high-resolution carbonate 230Th dating by MC-ICP-MS with SEM protocols, Geochim. Cosmochim. Ac., 99, 71–86, https://doi.org/10.1016/j.gca.2012.09.018, 2012. a, b
Sniderman, J. M. K., Woodhead, J. D., Hellstrom, J., Jordan, G. J., Drysdale, R. N., Tyler, J. J., and Porch, N.: Pliocene reversal of late Neogene aridification, P. Natl. Acad. Sci. USA, 113, 1999–2004, https://doi.org/10.1073/pnas.1520188113, 2016. a
Spötl, C. and Mangini, A.: Paleohydrology of a high-elevation, glacier-influenced karst system in the Central Alps (Austria), Austrian J. Earth Sc., 103, 92–105, 2010. a
Steiger, R. and Jäger, E.: Subcommission on geochronology: Convention on the use of decay constants in geo- and cosmochronology, Earth Planet. Sc. Lett., 36, 359–362, https://doi.org/10.1016/0012-821X(77)90060-7, 1977. a, b, c, d
Stirling, C. H., Andersen, M. B., Potter, E.-K., and Halliday, A. N.: Low-temperature isotopic fractionation of uranium, Earth Planet. Sc. Lett., 264, 208–225, https://doi.org/10.1016/j.epsl.2007.09.019, 2007. a, b, c, d, e, f, g, h, i, j
Szymanowski, D. and Schoene, B.: U–Pb ID-TIMS geochronology using ATONA amplifiers, J. Anal. Atom. Spectrom., 35, 1207–1216, https://doi.org/10.1039/D0JA00135J, 2020. a
Tera, F. and Wasserburg, G. J.: U-Th-Pb systematics in three Apollo 14 basalts and the problem of initial Pb in lunar rocks, Earth Planet. Sc. Lett., 14, 281–304, https://doi.org/10.1016/0012-821X(72)90128-8, 1972. a, b
Tissot, F. L. H. and Dauphas, N.: Uranium isotopic compositions of the crust and ocean: Age corrections, U budget and global extent of modern anoxia, Geochim. Cosmochim. Ac., 167, 113–143, https://doi.org/10.1016/j.gca.2015.06.034, 2015. a, b, c, d, e
Tzedakis, P. C., Drysdale, R. N., Margari, V., Skinner, L. C., Menviel, L., Rhodes, R. H., Taschetto, A. S., Hodell, D. A., Crowhurst, S. J., Hellstrom, J. C., Fallick, A. E., Grimalt, J. O., McManus, J. F., Martrat, B., Mokeddem, Z., Parrenin, F., Regattieri, E., Roe, K., and Zanchetta, G.: Enhanced climate instability in the North Atlantic and southern Europe during the Last Interglacial, Nat. Commun., 9, 4235, https://doi.org/10.1038/s41467-018-06683-3, 2018. a, b
Vaks, A., Mason, A. J., Breitenbach, S. F. M., Kononov, A. M., Osinzev, A. V., Rosensaft, M., Borshevsky, A., Gutareva, O. S., and Henderson, G. M.: Palaeoclimate evidence of vulnerable permafrost during times of low sea ice, Nature, 577, 221–225, https://doi.org/10.1038/s41586-019-1880-1, 2020. a
Walker, J., Cliff, R. A., and Latham, A. G.: U-Pb isotopic age of the StW 573 hominid from Sterkfontein, South Africa, Science, 314, 1592–1594, https://doi.org/10.1126/science.1132916, 2006. a
Wang, X., Wang, X., Wang, L., Wu, S., Xue, D., Duan, W., Ma, Z., Xiao, J., and Li, X.: Uranium isotope ratios of twenty-nine geological rock reference materials measured by MC-ICP-MS, Geostand. Geoanal. Res., 47, 945–955, https://doi.org/10.1111/ggr.12501, 2023. a
Wang, Y., Cheng, H., Edwards, R. L., Kong, X., Shao, X., Chen, S., Wu, J., Jiang, X., Wang, X., and An, Z.: Millennial- and orbital-scale changes in the East Asian monsoon over the past 224 000 years, Nature, 451, 1090–1093, https://doi.org/10.1038/nature06692, 2008. a
Weyer, S., Anbar, A. D., Gerdes, A., Gordon, G. W., Algeo, T. J., and Boyle, E. A.: Natural fractionation of 238U/235U, Geochim. Cosmochim. Ac., 72, 345–359, https://doi.org/10.1016/j.gca.2007.11.012, 2008. a, b, c, d
Woodhead, J. and Petrus, J.: Exploring the advantages and limitations of in situ U–Pb carbonate geochronology using speleothems, Geochronology, 1, 69–84, https://doi.org/10.5194/gchron-1-69-2019, 2019. a
Woodhead, J., Hellstrom, J., Maas, R., Drysdale, R., Zanchetta, G., Devine, P., and Taylor, E.: U–Pb geochronology of speleothems by MC-ICPMS, Quat. Geochronol., 1, 208–221, https://doi.org/10.1016/j.quageo.2006.08.002, 2006. a, b, c, d, e, f, g
Woodhead, J., Hellstrom, J., Pickering, R., Drysdale, R., Paul, B., and Bajo, P.: U and Pb variability in older speleothems and strategies for their chronology, Quat. Geochronol., 14, 105–113, https://doi.org/10.1016/j.quageo.2012.02.028, 2012. a, b, c, d, e, f
York, D., Evensen, N. M., Martínez, M. L., and De Basabe Delgado, J.: Unified equations for the slope, intercept, and standard errors of the best straight line, Am. J. Phys., 72, 367–375, https://doi.org/10.1119/1.1632486, 2004. a, b, c, d
Zanchetta, G., Drysdale, R. N., Hellstrom, J. C., Fallick, A. E., Isola, I., Gagan, M. K., and Pareschi, M. T.: Enhanced rainfall in the Western Mediterranean during deposition of sapropel S1: stalagmite evidence from Corchia cave (Central Italy), Quaternary Sci. Rev., 26, 279–286, https://doi.org/10.1016/j.quascirev.2006.12.003, 2007. a
Where . Note that the CRM-112A reference material has an equivalent isotopic composition to CRM-145.
The least-squares-fitted points (referred to as “least-squares adjusted” points by York et al., 2004) are the points along the regression line with the highest probability of generating the “uncertainty-perturbed” measured data points assuming that assigned analytical uncertainties are the only reason measured values depart from the isochron line.
- Abstract
- Introduction
- Study site and samples
- Analytical methods
- Results and discussion
- Conclusions
- Appendix A: Age equations
- Appendix B: Age uncertainties and uncertainty correlation
- Data availability
- Author contributions
- Competing interests
- Disclaimer
- Acknowledgements
- Financial support
- Review statement
- References
- Supplement