the Creative Commons Attribution 4.0 License.
the Creative Commons Attribution 4.0 License.
 | 07 Apr 2026
Dating Late Pleistocene pluvial lake shorelines in the Great Basin, USA using rock surface luminescence dating techniques: developing new approaches for challenging lithologies
Christina M. Neudorf
Teresa Wriston
Geraint T. H. Jenkins
Sebastien Huot
This study examines the feasibility of dating pluvial lake beach ridges using rock surface luminescence dating techniques. Dating pluvial lake highstands in the internally drained Great Basin of the United States helps us understand the timing of changes in precipitation and temperature patterns in western North America during the Late Pleistocene. The majority of highstand ages have relied on few radiocarbon ages of shell and/or charcoal sometimes coupled with luminescence dating of sand. Within our study area in the south-central Great Basin, luminescence ages of sand-size particles have successfully dated aeolian influxes of sand during arid intervals, but have not successfully dated the highstand beach ridges, the best preserved of which are largely gravel.
Directly dating when these gravel clasts were last exposed to sunlight via luminescence is ideal but their limestone and volcanic lithologies prove challenging. Initial measurements from these lithologies show that feldspar luminescence signals are suited to single-aliquot regenerative (SAR) dose measurement protocols and show evidence for heterogeneous bleaching of rock surfaces. Polymineral extracts from dissolved limestone clast surfaces from Coal Valley that contain sufficient detrital sediment exhibit infrared signals measured at 50 °C (IR50) with low to moderate fading rates. Single-grain ages from detrital sediment from three clasts, calculated using the central dose model, are statistically consistent with the radiocarbon age estimate of the Pluvial Lake Coal highstand.
Crushed slices from volcanic clasts from Cave Valley could be dated using a high-temperature (290 °C) post-infrared infrared stimulated luminescence (pIRIR) signal with a correction for fading. Many ages obtained from volcanic clast surfaces are observed to be several thousand years younger than the expected age of the ∼ 18–20 ka beach ridge. This suggests that the volcanic rocks have been exposed to light long after the pluvial lake highstand, likely because of bioturbation, and that their most recent burial occurred in response to climatically driven soil formation processes. Comparisons between age-depth profile plateau ages from inside volcanic rocks and independent age control suggest that gravel-sized volcanic rocks were small enough to have been bleached throughout their entire thickness in the pluvial lake beach environment and that pIRIR signals that record the time of beach ridge formation and subsequent soil formation during the Pleistocene-Holocene transition may be preserved within the rock sub-surface.
This study develops novel dating approaches for challenging rock lithologies. Rock surface dating techniques for pluvial lake beach ridges in the Great Basin should be further developed with consideration of local bedrock type(s), clast size, sample collection and preparation methods, gravel bleaching processes in pluvial lake environments and the impact of soil development and bioturbation on study sites.
- Article
(7108 KB) - Full-text XML
-
Supplement
(4128 KB) - BibTeX
- EndNote


1.1 Dating pluvial lake shorelines
During the Pleistocene epoch, pluvial lakes covered vast areas of the arid western United States, including Nevada, western Utah, southeastern Oregon, and eastern California. Most of the pluvial lake basins are found within the hydrologic Great Basin, an area of closed drainage encompassing about 520 000 km2 (Reheis et al., 2014). Great Basin pluvial lake shorelines are invaluable indicators of past hydroclimate conditions and provide baseline data for atmospheric circulation models (Reheis et al., 2014). As such, accurate determinations of the depositional ages of these sediments and related landforms are critical for interpretations of paleoenvironmental conditions. Pluvial lake history is also important for reconstructing the early migration and settlement patterns of people in the western US (Adams et al., 2008). The abundant plants and animals within and near freshwater lakes and marshes have always attracted people. As these systems responded to changing climatic and topographic conditions, their geographic distribution changed in ways that influenced the early mobility of societies (Wriston, 2009). Therefore, reconstructing the timing of pluvial lake highstands, regressions, and expansion and contraction of fringing wetlands, can put archaeological sites into a paleoenvironmental context that helps explain their distribution.
Past studies applying a range of relative and absolute dating techniques to shoreline features have shown serious discrepancies between methods that are difficult to explain (Owen et al., 2007; Redwine et al., 2020). In particular, optically stimulated luminescence (OSL) dating techniques commonly yield inconsistent results with high error (Adams and Rhodes, 2019) or underestimate the expected ages of pluvial highstand beach ridge deposits by thousands of years despite pristine sampling conditions (Owen et al., 2007; Adams, unpublished data). Previous research in Coal Valley, Nevada yielded post-infrared infrared stimulated luminescence 225 °C (pIRIR225) ages that severely underestimate the expected age of the 1522 m above sea level (asl) Lake Coal highstand, which has been dated to 15 873–16 281 cal yr BP using radiocarbon dating (Wriston and Adams, 2020). These were 4.34 ± 0.5 ka (1515.6 m a.s.l.), 3.69 ± 0.42 ka (1513.8 m a.s.l.) and 1.87 ± 0.18 ka (1521.5 m a.s.l.) (Wriston and Adams, 2020). We suspect that the medium sands (180–300 µm) sampled from the beach gravels were actually younger wind-blown sands that translocated into the initially open-work beach ridge gravels after beach ridge formation leading to an age under-estimate. This research investigates the feasibility of dating gravel-size clasts in pluvial beach ridge shorelines to remedy this age discrepancy. Gravels require greater energy to move and should reflect when water flow was strong enough to form the beach ridges. Our project area in Lincoln County, Nevada has beach ridges often comprised of limestone and volcanic rocks. Here, we test and outline novel sample preparation protocols for these materials and investigate the optical properties from polymineral grains extracted from them.
1.2 Luminescence dating rock surfaces
Luminescence dating determines the last time sediments have been exposed to sunlight or heat prior to deposition and burial and provides chronologies for archaeological and geological events (Huntley et al., 1985; Lian and Roberts, 2006; Roberts and Lian, 2015; Woor, 2022). Luminescence dating techniques are commonly applied to silt or sand grains, but in recent years, significant advances have been made in dating rock surfaces (Habermann et al., 2000; Greilich et al., 2005; Vafiadou et al., 2007; Liritzis, 2011; Simms et al., 2011; Sohbati et al., 2012; Freiesleben et al., 2015; Simkins et al., 2016; Khasawneh et al., 2019; Gliganic et al., 2021; Freiesleben et al., 2023, Ageby et al., 2024) as well as mineral grains encased in carbonate deposits, calcarenite and limestone (Rich et al., 2003; Prescott and Habermehl, 2008; Liritzis et al., 2008, 2010; Ageby et al., 2023).
Luminescence ages from rocks are important for sites that lack adequate sand/silt for traditional luminescence dating techniques, in addition to sites that are contaminated by mobile fine grain materials that severely post-date (underestimate) the true age of the landform or archaeological site. Rock surface dating approaches applied to natural deposits, such as beach ridges (Simms et al., 2011), flood gravels (Smith et al., 2023), or moraines (Rades et al., 2018; Yang et al., 2024), most commonly target cobble size clasts, which are sampled under dark or dim red light conditions. Sampling may be done at night and/or with a light-safe tarp or tent to block any ambient sun, moon or traffic/city light that may reset the OSL signal. Once in the laboratory, ∼ 10 mm diameter cores are extracted from the rock, which are then sliced into sub-millimeter slices, and the OSL signal is measured from each slice. This produces a luminescence-depth profile that traces the OSL signal intensity from the rock surface to depth, where the depth of light penetration may be inferred from past bleaching episodes (Fig. 1). Figure 1 shows theoretical luminescence-depth profiles that would be measured after: (i) light exposure of the rock surface, (ii) re-burial of the rock surface after an exposure event, and (iii) after no light exposure or burial of the rock for extensive time. For a rock that had sufficient sun exposure prior to burial, the time of the most recent exposure event can be calculated from the near-surface plateau of the luminescence-depth profile (red line in Fig. 1).
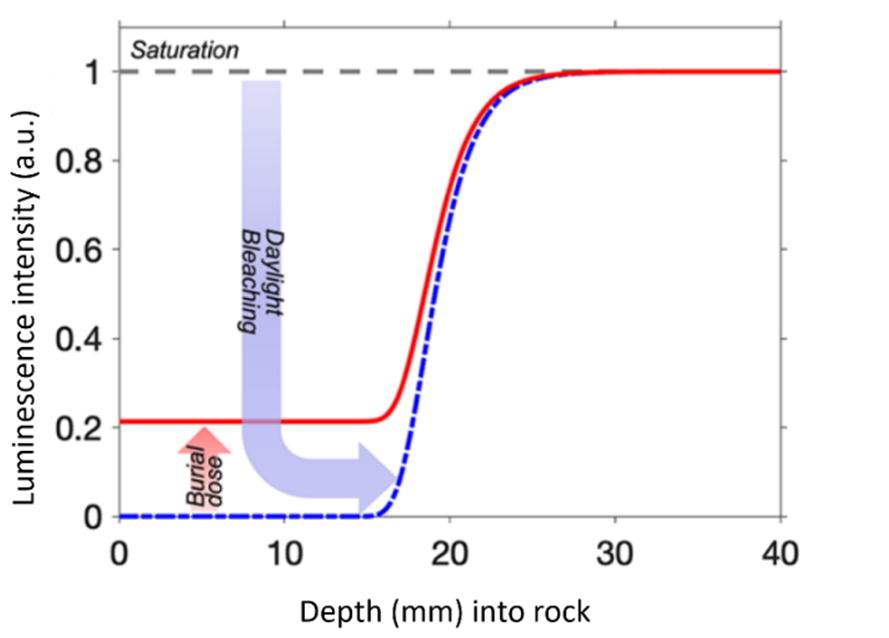
Figure 1Luminescence-depth profiles that are expected after (i) light exposure of the rock surface (s-shaped blue dashed line), (ii) re-burial a rock surface after an exposure event (solid s-shaped red line), and (iii) after no light exposure (straight grey dashed line). From Smith et al. (2023).
Generating an age from rock luminescence-depth profiles requires an estimate of the environmental dose rate at the rock surface, as well as at depth. Dose rate models, therefore, take into account measured dose rates from the rock and surrounding sediments, and use established beta and gamma attenuation factors to calculate dose rates at depth within the rock (e.g., Jenkins et al., 2018; Riedesel and Autzen, 2020).
This study examines the optical and dosimetric properties from clasts collected from pluvial lake beach ridge gravels in Coal, Cave, and Lake valleys, in Lincoln County, Nevada (Figs. 2, S1–S4). In the following discussion, radiocarbon ages are reported in calibrated years before present (cal yr BP) and are calibrated with IntCal 20.14c using Calib 8.2 (Reimer et al., 2020). Luminescence ages are reported in kilo annum (ka), and synthesized ages (that may include a variety of stratigraphic and archaeological evidence) are reported in years ago. The study area is characterized by an arid to semi-arid climate with ∼ 250 mm of annual precipitation, a quarter of which falls during the summer. Great Basin conifer woodland occupies elevations above 1770 m, while desert scrub, including rabbit brush (Chrysothamnus nauseosus, Chrysothamnus viscidiflorus) green ephedra (Ephedra viridis), horsebrush (Tetradymia canescens) and sagebrush (Artemisia nova) dominates elevations of 1500 to 2000 m (Spaulding, 1985). Only sheer cliffs and playa floors are devoid of plants.
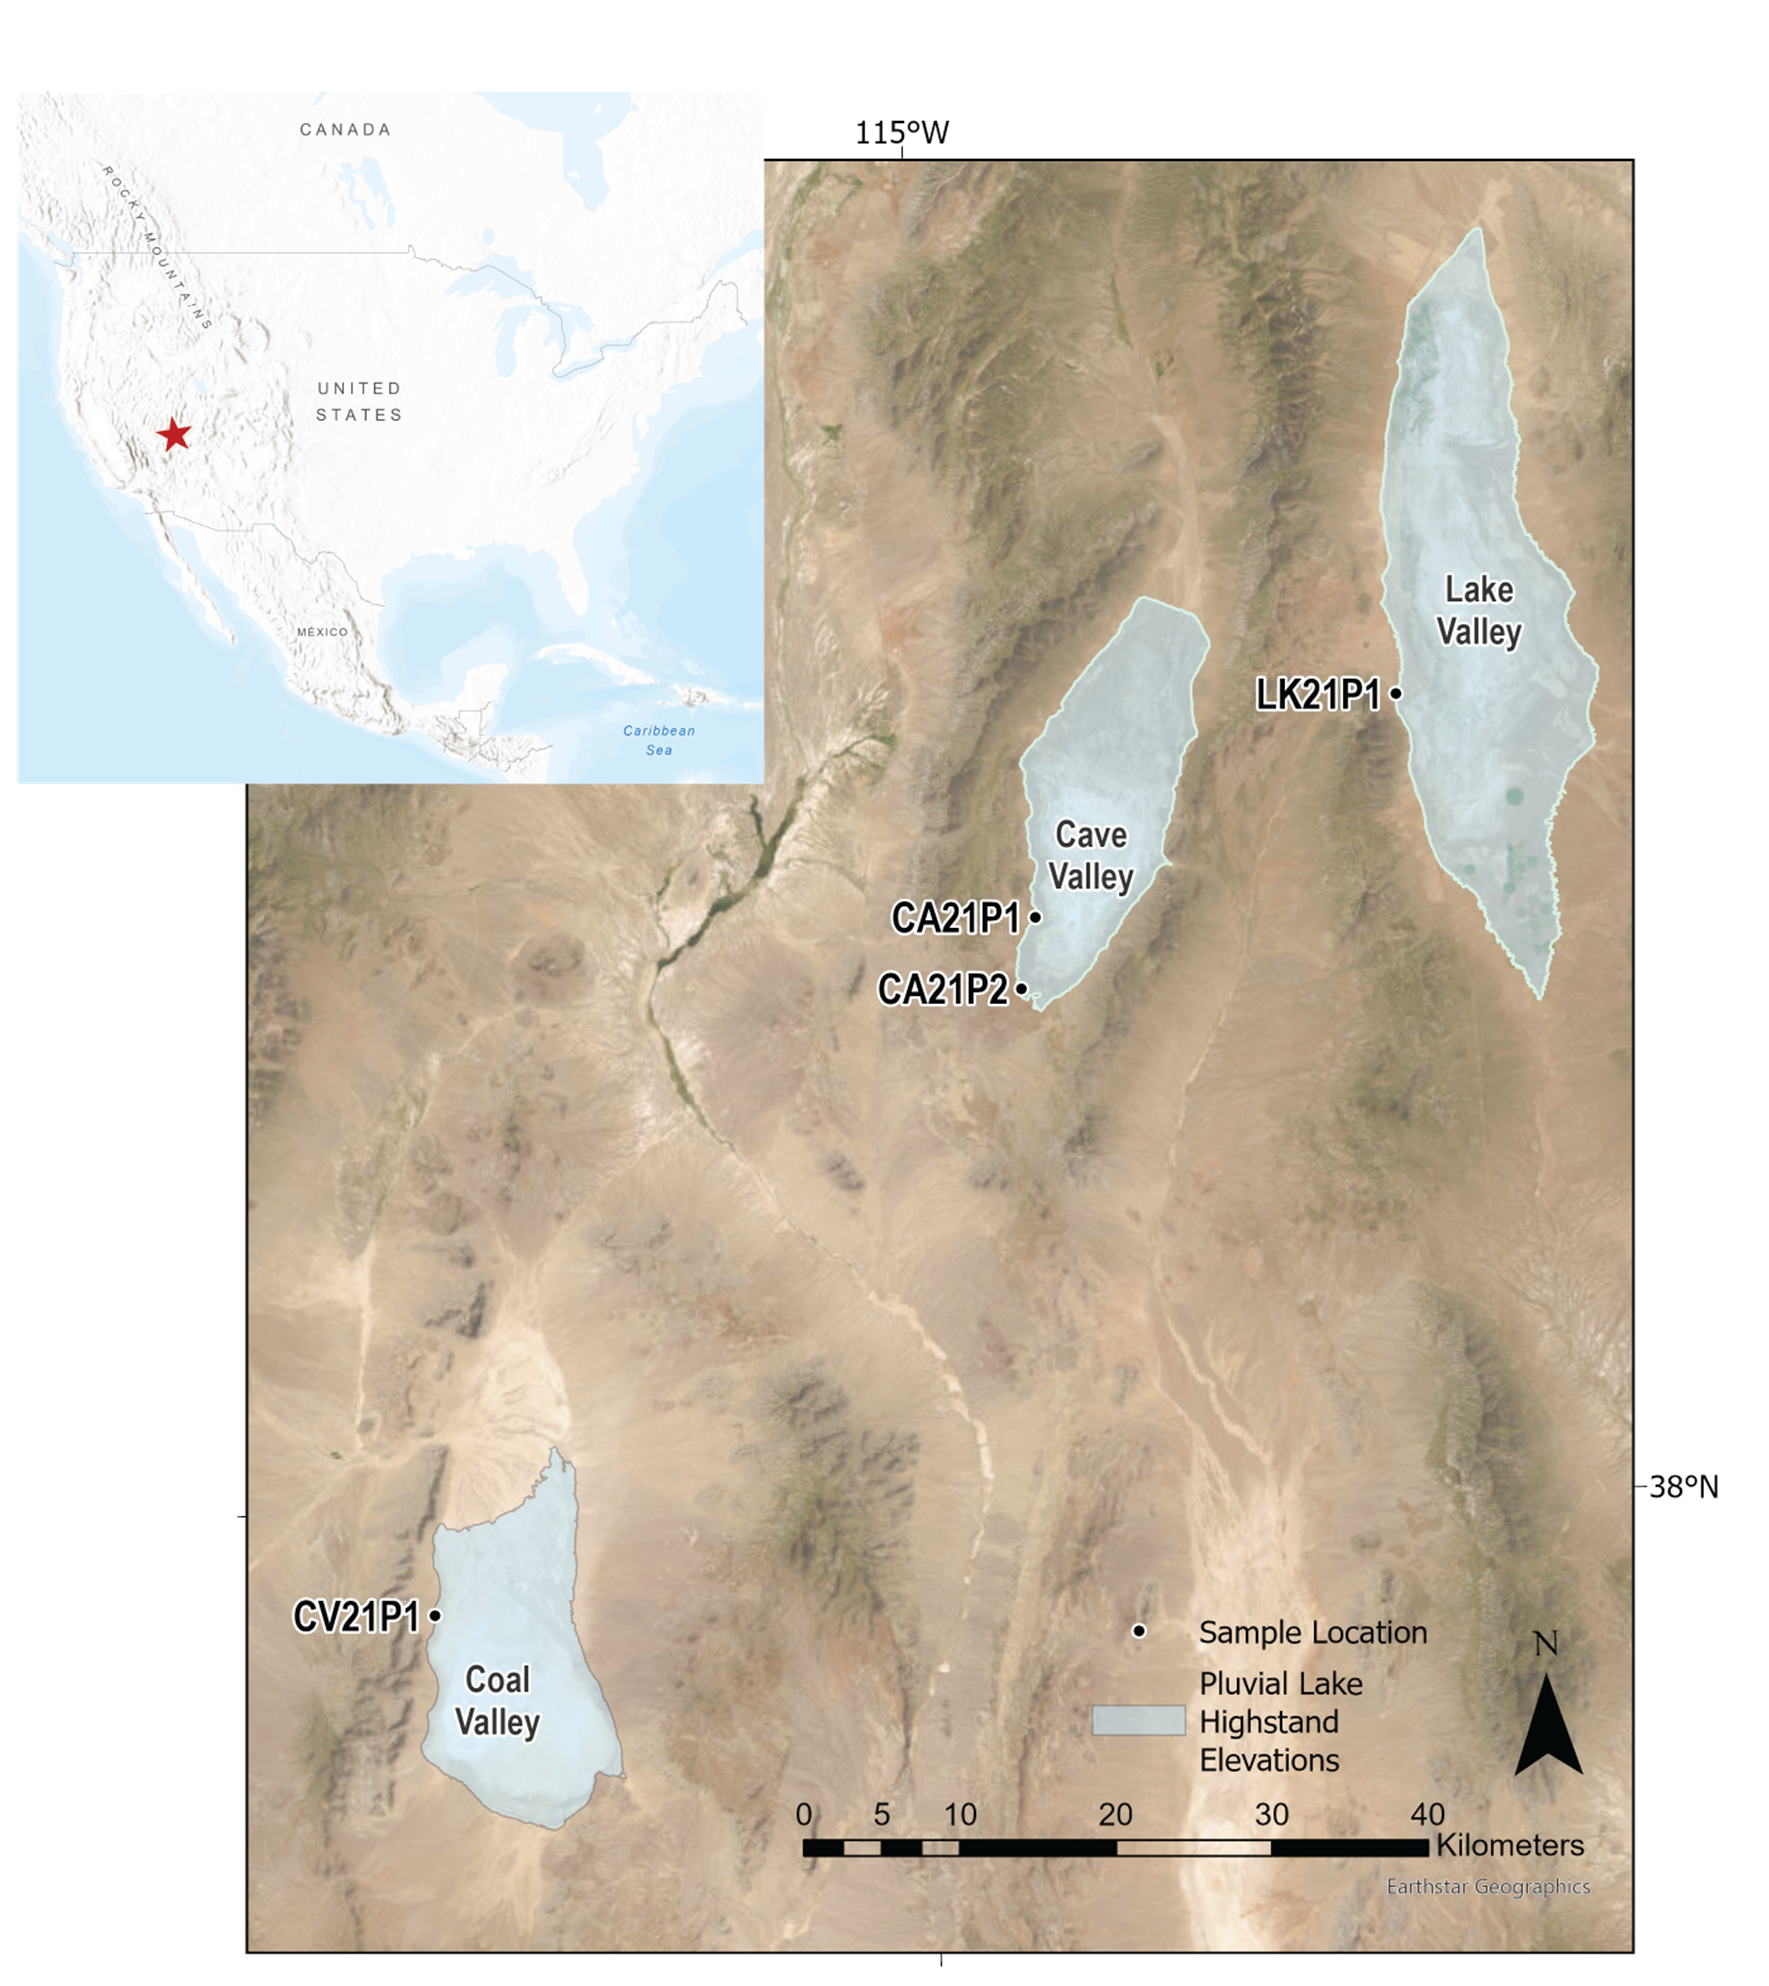
Figure 2Study site locations in Coal, Cave and Lake valleys, Lincoln County, Nevada in relation to pluvial lake highstand elevations. Basemap: ESRI, Maxar, Earthstar Geographics, TomTom, Garmin, FAO, NOAA, USGS, and the GIS User Community | Powered by Esri.
During the last major pluvial period in eastern Nevada, pluvial lakes reached their highstand between ∼ 15 000 and ∼ 20 000 years ago (see highstand ages for lakes Carpenter, Spring, Railroad, Jakes, Newark, Diamond, Franklin, Clover and Waring in Munroe and Laabs (2013), their Table 2). Coal Valley, Cave Valley, and Lake Valley in Lincoln County, all contained pluvial lakes (Pluvial Lakes Coal, Cave, and Carpenter, respectively; Mifflin and Wheat, 1979) and marsh systems during the late Pleistocene (cf. Wriston and Adams, 2020). Warming and drying of these lakes between 14 600 and 12 900 years ago (Rhode and Adams, 2016) was stalled with cooler conditions during the Younger Dryas (ca. 12 900 to 11 700 years ago, Rasmussen et al., 2006). Beginning ca. 8000 years ago (Wriston, 2009), extreme drought dried the lakes, marshes, and springs and wind displaced much of the lake and marsh sediments in the basin floors throughout the Great Basin. The declines in area and productivity of basin wetlands varied spatially and temporally, likely with decadal or century-level fluctuations. The pace and tempo of the lake and wetland decline to modern conditions has yet to be fully reconstructed.
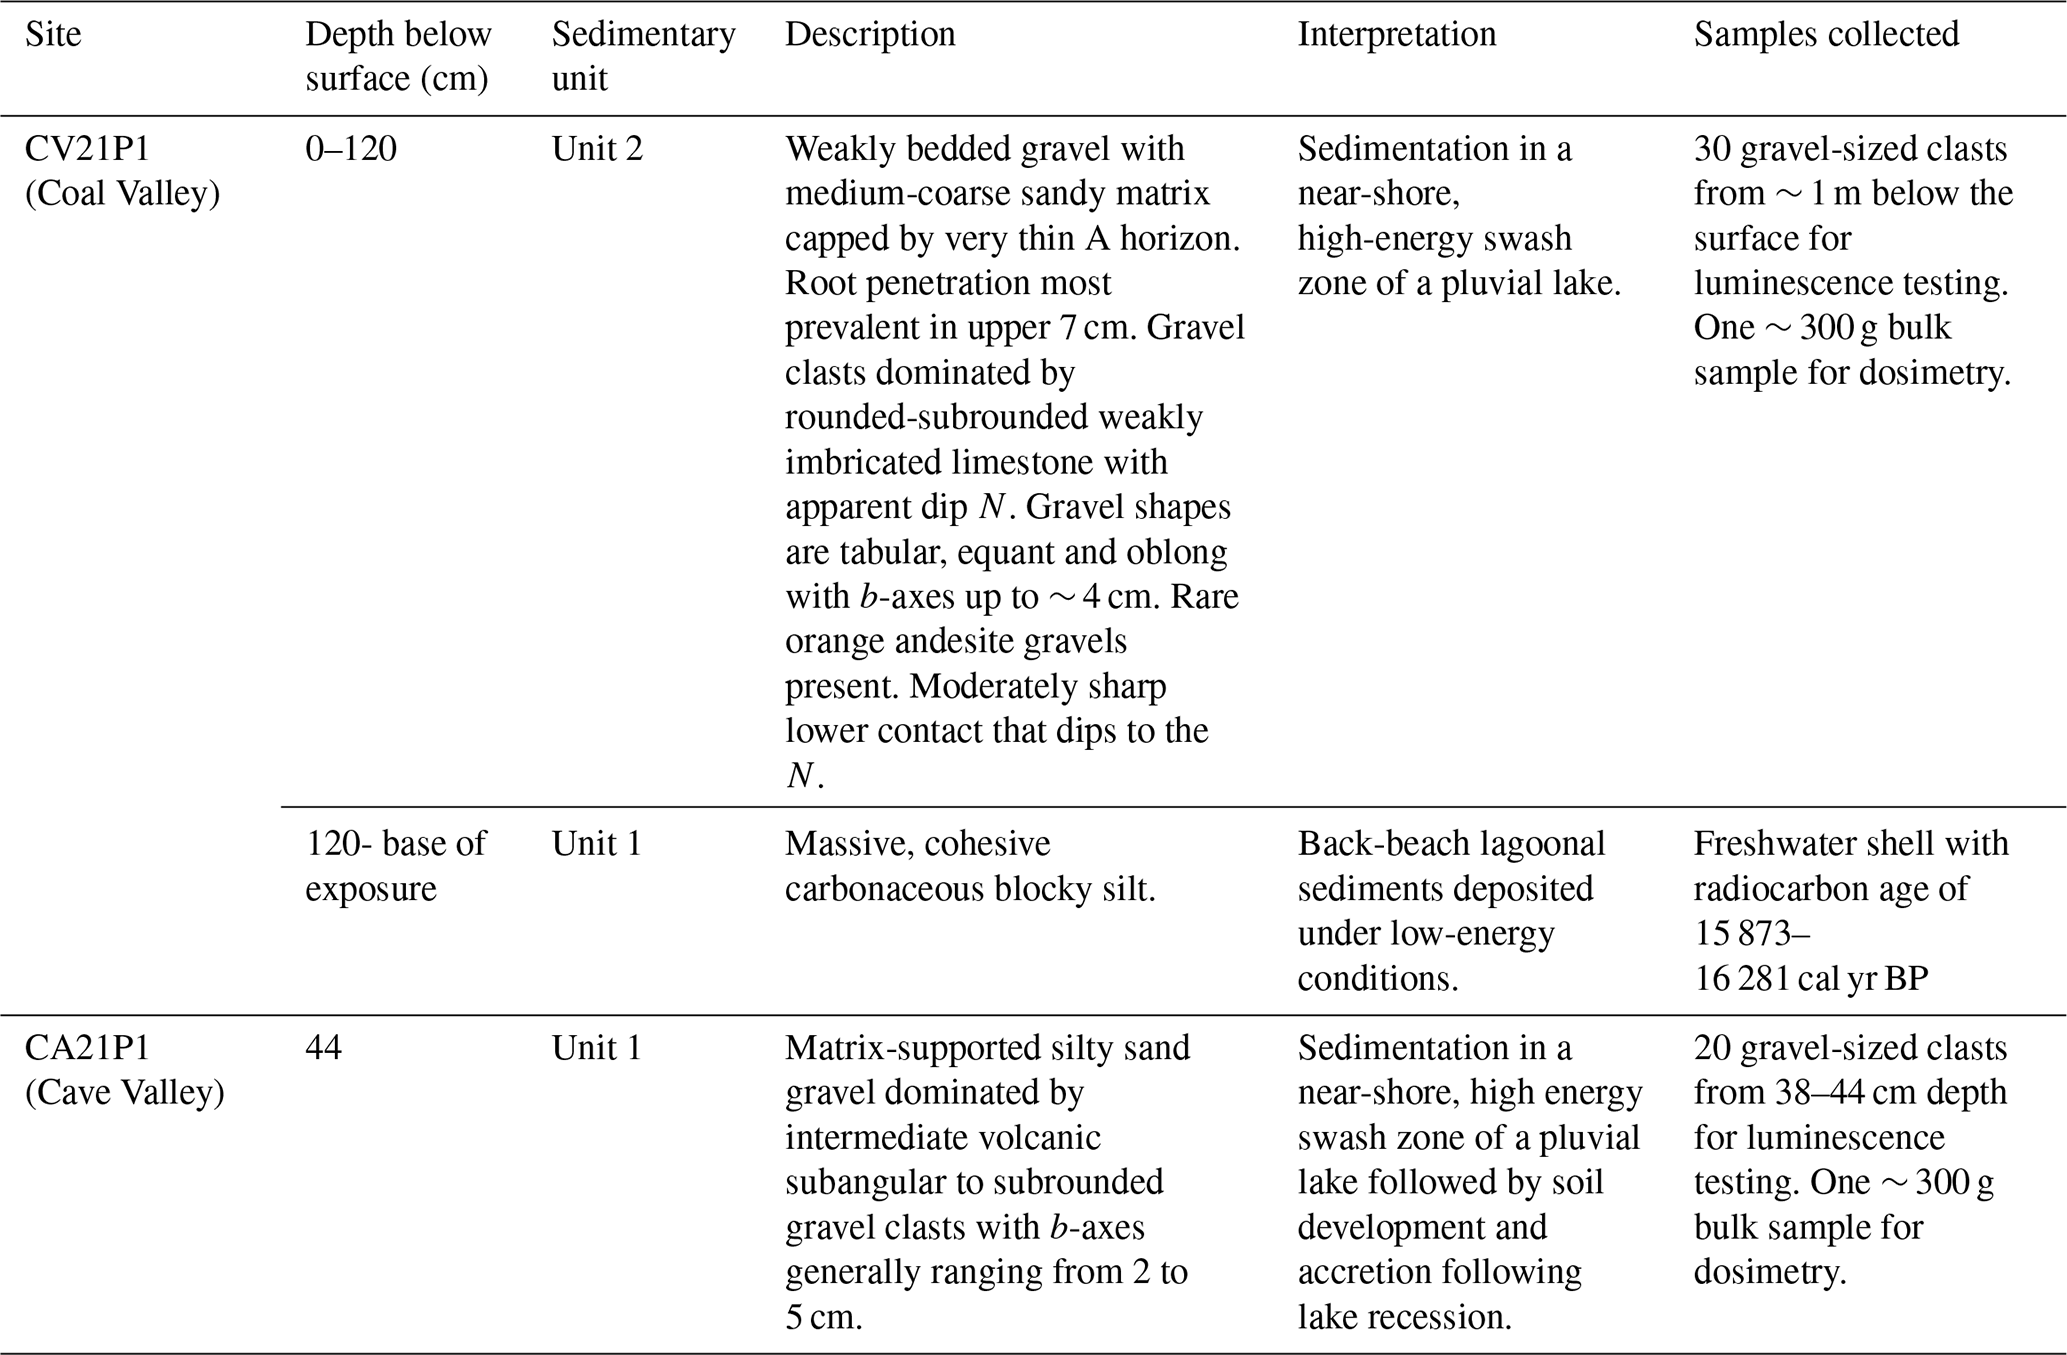
We sampled beach ridges inferred to have been created during the highstand in each basin (Table 1). Geochronological and geomorphic evidence from Coal, Cave, and Lake valleys suggests that pluvial lakes in these basins reached their last highstand sometime between ∼ 16 000 and ∼ 20 000 years ago (Tables 1 and S1). Wriston and Adams (2020) radiocarbon dated the Coal Valley highstand to 16 088 median cal yr BP (13 366 ± 59 BP, D-AMS 029792) using a young freshwater Lymnaeidae Stagnicola sp. shell from backbar lagoonal deposits. The species and size of the dated shell suggest that it is unlikely to suffer from reservoir effects due to the acquisition of old carbon (cf. Pigati et al., 2010). A radiocarbon age of shoreline features from Lake Valley suggests that Lake Carpenter was near its highstand at ca. 17 258 median cal yr BP (14 210 ± 100 BP, Beta-50773; Currey in Lillquist, 1994; Munroe and Laabs, 2013). Duke and Young (2018) report ages of wetland sediments in the lake floor by 12 685 cal yr BP (10 656 ± 48 BP, D-AMS 20244), indicating that the lake had receded before this time and further drying occurred before a 9.27 ± 1.87 ka (USU-2529) inset lake shoreline formed.
Table 1Study site locations in Coal, Cave and Lake valleys.
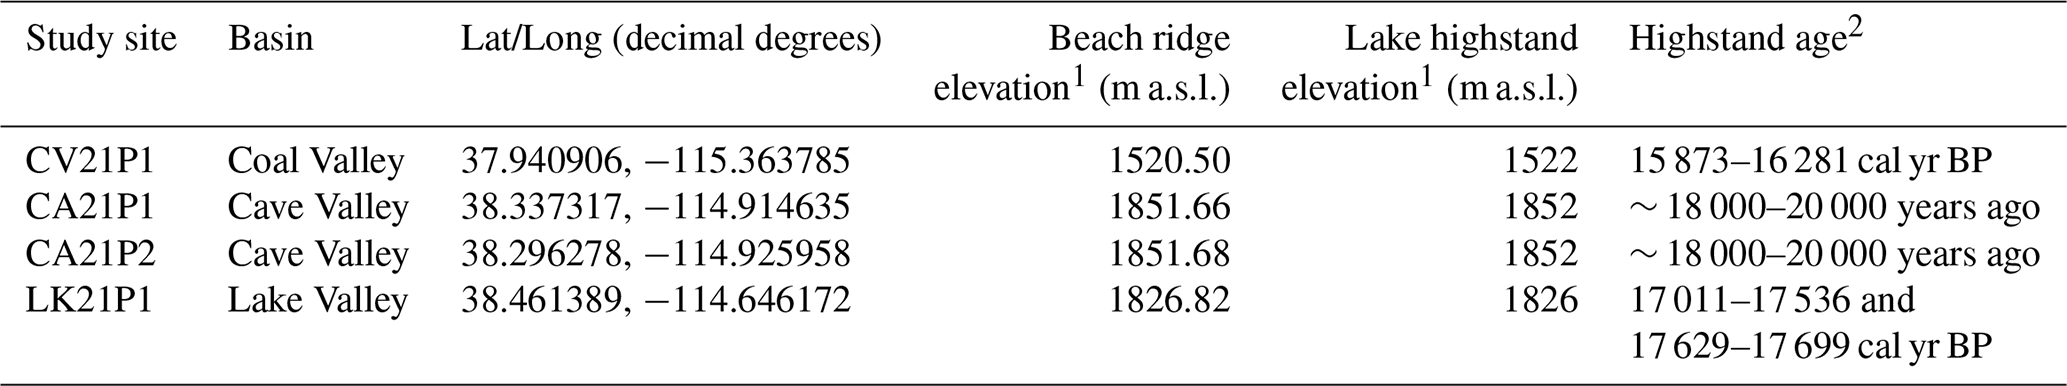
1 Highstand elevations in meters above sea level are interpreted from highest shoreline features in satellite imagery using a arcsec Digital Elevation Model from the USGS National Map (nationalmap.gov) with accuracy of around 0.82 m. The CV21P1 location was surveyed to within 20 cm corrected elevation using a Trimble Nomad during previous work (Wriston and Adams, 2020: 55). 2 Radiocarbon ages for sites CV21P1 and LK21P1 are calibrated using IntCal20 in Calib 8.2 (Reimer et al., 2020). The two age ranges reported for site LK21P1 reflect two age interceptions onto the IntCal20 calibration curve. The radiocarbon age dates a time when Lake Carpenter (Lake Valley) was near (4 m below) its highstand.
The highstand at Cave Valley has never been directly dated; however, GIS computer simulations by Duke and King (2014) that predict the relative chronology of lake desiccation using basin geomorphology and hydrology, suggest that Cave Lake desiccated before neighbouring Lake Carpenter in Lake Valley. Therefore, the highstand of pluvial Lake Cave likely occurred between ∼ 18 000 and ∼ 20 000 years ago (Munroe and Laabs, 2013; Duke and King, 2014; Duke and Young, 2018). During recession of Cave Lake, the distributary system entering Cave Valley from the north would have expanded providing patchy wetland environments likely utilized by people during the Paleoamerican period (Duke and Young, 2018). Dated sediments from this distributary system suggest that it dried up ca. 9422 median cal yr BP (8330 ± 30 BP, Beta-440300) after a mesic period and low lake transgression ca. 11.33 ± 1.68 ka (USU-2527) based on luminescence dating of quartz grains below a gravel bar (Duke and Young, 2018).
Bedrock gravel material types in the study area are dominated by limestones and volcanic rock derived from the local bedrock (Supplement Figs. S5–S7). These lithologies are representative of the bedrock geology of much of Nevada (Crafford, 2007). Limestones, sandstones, and shales formed when Nevada was a broad carbonate shelf during the Paleozoic era. Younger Mesozoic and Cenozoic volcanic flows, tuffaceous rocks, intrusive igneous and sedimentary rocks formed during a subsequent period of complex tectonic movements, volcanic activity, and terrane accretion (Dickinson, 2006).
2.1 Coal Valley
The sampled beach ridge at 1520.5 m above sea level in Coal Valley (site CV21P1) is superimposed on a Quaternary alluvial fan on the western side of Coal Lake basin and is the highest evident shoreline (Fig. S1). This beach ridge was created after the last glacial maximum (Marine Isotope Stage 2) and previously dated to ca. 16 000 years (15 873–16 281 cal yr BP was at 2σ calculated using IntCal20; 13 366 ± 59 RYBP; D-AMS 029792) by Wriston and Adams (2020). It has been incised by a drainage channel exposing sandy beach gravels overlying lagoonal silts and clays. The soils in this area have been mapped as aridisols and entisols of the Ursine-Cliffdown Association that are typified by thin A horizons of very gravelly sandy loam that grade into B or C horizons of gravelly sandy loam (National Cooperative Soil Survey, 2025). The Golden Gate Range west of the CV21P1 sample location is comprised of Lower Mississippian limestones, such as the Joana, Mercury, and Bristol Pass formations underlain by Pilot shale that tops the upper Devonian Devils Gate limestones belonging to the Guilmette Formation (Rowley et al., 2017; Tschaz and Pampayan, 1961, 1970) (Fig. S5).
2.2 Cave Valley
In Cave Valley, two beach ridges were sampled, one on the west side of the basin at 1851.66 m elevation (CA21P1; Fig. S2) and one at the southwestern end of the basin at 1851.68 m elevation (CA21P2; Fig. S3). The pluvial lake highstand is at 1852 m (Table 1). The ridge on the west side of the basin is superimposed on a Quaternary alluvial fan and is the highest of a series of at least six ridges stepping up from the playa. The sampled beach ridge to the south (CA21P2) is wider and flanks a wavecut bench eroded into andesitic and basaltic bedrock. Both localities are dominated by aridisols with gravelly sandy loam A horizons overlying gravelly sandy loam B horizons (National Cooperative Soil Survey, USA). Tschaz and Pampayan (1961, 1970) classify the geology above both sample areas as undifferentiated older volcanics with pockets of Pennsylvanian limestone (Fig. S6). Further west of CA21P1, in the Egan Range, Scotty's Wash quartzite and Chainman shale of upper Mississippian age outcrop and these materials may be found in the pluvial lake reworked alluvial fans near the sample areas (Fig. S6).
2.3 Lake Valley
In Lake Valley, the highest observed beach ridge, superimposed on a Quaternary alluvial fan and bisected by HWY 93, was sampled on the west side of the basin at 1826.82 m a.s.l. (Table 1; Fig. S4). The pluvial lake highstand averages around 1826 m a.s.l. Soils in the area are dominated by aridisols with gravelly ashy loam and sandy loam A horizons overlying B horizons of a similar texture (National Cooperative Soil Survey, 2025).
According to mapping by Tschaz and Pampayan (1961, 1970), the closest bedrock source to the LK21P1 sample site is middle to upper Devonian Guilmette formation Dolomite and Devils Gate Limestones exposed on the north side of Dutch John Mountain (northern margin of the Fairview Range) west of the sample area (Fig. S7). Upslope of this formation is an unconformity topped by upper Devonian Pilot Shale that has another unconformity topped by lower Mississippian Bristol Pass limestones and others. To the northwest of the LK21P1, volcanic rocks (older, undifferentiated) and upper Mississippian Scotty Wash quartzite, sandstone, and shale outcrops amongst the Quaternary age alluvium emanating from the Schell Creek Mountain Range (Fig. S7).
3.1 Sampling in the field
Sampling at all three sites was conducted at night with the aid of dim red (> 660 nm) headlamps. Sample location coordinates were recorded using a survey grade Trimble Geo7X Handheld GNSS System with external antenna. The SW facing natural exposure at Coal Valley was sampled near midnight using a pitched tarp to block light from a partial moon that set at 10:45 GMT−7. The moon shade was also used in the secluded Cave Valley. The sample location in Lake Valley was near a highway and so an open bottomed tent covered with two layers of 152 microns black plastic was used to prevent light exposure.
At Coal Valley, the surface of the natural exposure in the drainage was cleaned, photographed and the sedimentary characteristics recorded. Then at night, the exposure was dug back at least 5 cm to expose rocks that were unlikely to have seen daylight since burial, and 30 of the largest observed gravel clasts were collected at measured depths of approximately ∼ 1 m below the top surface of the ridge. These clasts ranged in thickness (i.e., the shortest dimension that was cored in the laboratory) from 18.5 to 41.9 mm and were all composed of limestone. A bulk sample (∼ 300 g) of the gravel and matrix was also collected for water content and dosimetry measurements.
At Cave Valley, 20 of the largest observed gravel clasts were collected between 38 and 44 cm from the ground surface in an excavated pit at site CA21P1. The clast lithologies were dominated by intermediate volcanic rock and ranged in thickness between ∼ 15 and ∼ 30 mm. A bulk sample (∼ 300 g) of the gravel and matrix was also collected for water content and dosimetry measurements. At site CA21P2, ∼ 100 of the largest observed gravel clasts were collected between 33 and 64 cm depth below the surface, along with another bulk gravel matrix sample for water content and dosimetry. The majority of clasts collected at CA21P2 were a similar size to those at CA21P1 but consisted of darker more mafic or basaltic varieties of volcanic rock.
At Lake Valley, ∼ 100 of the largest observed gravel clasts were collected from ∼ 0.5 m depth below the surface, along with a ∼ 300 g bulk dosimetry sample. These clasts were all composed of limestone and were a similar size range to those collected at Coal Valley. At Cave and Lake Valley sites, the orientation of most rocks were recorded by labelling their top sides with masking tape and marker after wrapping. This was undertaken to allow measurements from the clast upper faces, as these have been shown to record sub-surface bleaching more effectively than the lower face of the clasts (Jenkins et al., 2018). The orientation of some clasts could not be recorded if they fell out of the exposure prior to collection. The sediments in all pits were photographed and their sedimentary characteristics recorded in daylight after sampling was complete.
Given the diversity of rock lithologies present within bedrock surrounding Coal, Cave and Lake valleys, we expected to collect a wider variety of rock types from the sampled beach ridges (e.g., sandstones, siltstones, limestones, intrusive and extrusive igneous rocks). We found, however, that gravels at each beach ridge were dominated by the lithology of the most proximal bedrock outcrop (Figs. S5–S7). Thus, our sample processing and dating protocols presented below were developed only for the limestone and volcanic rocks that we collected at Coal and Cave valleys, respectively.
3.2 Sample preparation
Rock sample preparation for limestone and volcanic gravels required different approaches. The volcanic gravel clasts were cored and sliced following the approaches of Jenkins et al. (2018) and Gliganic et al. (2019), however, given that luminescence signals must be measured from quartz or feldspar minerals and not from carbonates, we prepared the limestone rocks in a manner similar to that of Liritzis et al. (2010) (see below). Minerals extracted from both rock types were not further separated to isolate quartz and feldspar (e.g., Aitken, 1998) due to the small quantities of material available.
3.2.1 Limestones
Sample preparation for limestone rocks from Coal and Lake Valley included the following steps:
-
The outer secondary carbonate coatings observed on the surfaces of some limestone rocks were filed away with a file or Stylo-style Dremel tool. These coatings did not cover the entire rock surface but were patchy and thin (generally < 5 mm thick).
-
The outer 1–2 mm of each side of the limestone clast was dissolved in weak (10 %) hydrochloric (HCl) acid over several hours while monitoring the change in limestone thickness with repeated caliper measurements.
-
Detrital sediment released from the outer 1–2 mm of dissolved limestone (step 2) was collected, wet sieved to extract available grain size fractions between 63–250 µm, and dried for luminescence measurements.
-
The majority of the remaining limestone was dissolved in high-concentration (∼ 36 %) HCl, and the detrital clastic sediment was collected, wet sieved to extract available grain size fractions between 63–250 µm and dried for signal testing and dose recovery tests.
-
The remaining residual limestone rock (∼ 10–20 g) was dried, milled into a fine powder and submitted to ALS Minerals, Reno, NV for U, Th, K and Rb determination using ICP-MS (U, Th, Rb) and ICP-AES (K) (see Sect. 3.6).
This approach to sample preparation for limestone gravel-sized rocks requires the following assumptions:
-
During beach ridge formation, light penetrated the outer 2 mm or more of the limestone surface to bleach the signals from detrital quartz and feldspar minerals.
-
The entire surface of the limestone rocks in the swash zone of the beach were adequately light exposed prior to burial to bleach near-surface quartz/feldspar detrital grains.
-
Limestone surfaces experienced limited or no erosion or dissolution after beach ridge formation and prior to sampling.
-
Beta microdosimetry effects that can lead to scatter in measured grain equivalent dose (De) and age distributions are minor in the limestone and around it.
-
Any U-series disequilibrium that may have existed within the limestone during its formation will have corrected itself (i.e., U-238 daughters with half lives up to ∼ 1600 years will have reached a new equilibrium with the parent) since formation of the limestone during the Devonian.
3.2.2 Volcanics
Volcanic rocks sampled from Cave Valley were prepared using the following approaches. Polymineral grains (i.e., samples that had undergone no mineral separation) were extracted from volcanic gravel-sized rocks in two ways: by coring and slicing (the traditional method), in addition to removal of the entire outer ∼ 1 mm layer from all sides of each rock. This second approach maximized the amount of material that could be used for De measurement:
-
The outer carbonate coating on the volcanic rocks was removed by setting them in a bath of high-concentration (36 %) HCl acid.
-
The rocks were cored using a 10 mm inner-diameter diamond core drill bit. Cores penetrated the entire rock where possible, and where possible, multiple (2–3) cores were extracted from rocks of adequate size. Where the orientation of the rocks were known, rocks were cored on their top surfaces through to their bottom surfaces.
-
Rock cores were sliced into ∼ 1 mm thick slices using a ∼ 0.3 mm thick wafer blade mounted on a low-speed precision cutting saw. The polymineral slices were subsequently crushed gently by hand using an agate mortar and pestle and sieved into distinct grain size fractions between 125 and 250 µm for measurement.
-
The outer ∼ 1 mm layer of the remaining rock was removed using diamond bur bits mounted on a variable-speed Dremel tool.
-
The 32–63 µm polymineral fraction of the dremeled outer ∼ 1 mm rock layers were extracted using suspension settling and Stokes Law, then dried for measurement.
Our sample preparation protocol for volcanic gravels requires the following assumptions:
-
Minerals extracted by coring and slicing require that at least one side (the top or bottom) of the rock was exposed to sunlight long enough prior to burial to yield accurate ages.
-
Minerals extracted from the outer ∼ 1 mm layer of all sides of the rock require that all sides of the rock were adequately exposed to sunlight prior to burial.
3.3 Luminescence measurement
In this study polymineral samples from limestone clasts were measured at the single-grain level, while samples from volcanic clasts were measured using multi-grain aliquots. Multi-grain aliquots of polymineral fractions were mounted onto 10 mm diameter stainless steel discs using silicon oil as an adhesive. Aliquot diameters were 3 mm and their luminescence signals and De measurements were measured in one of two Risø TL/OSL-DA-20 readers equipped with a Sr-90/Y-90 beta radiation source. For single-grain measurements, single grains were mounted onto single-grain discs, each containing one hundred 300 µm diameter holes. Single grains were measured in the same Risø readers using IR lasers.
Tests were conducted to determine whether or not quartz minerals from the samples yielded a datable luminescence signal (Sect. 4.2). For these measurements blue light stimulation was made with a cluster of blue LEDs (NICHIA type NSPB-500AS) with a peak emission at 470 nm and a total power of ∼ 80 mW cm−2 and signals were detected with a bialkali EMI 9235Q photomultiplier tube (PMT) fitted with Hoya U-340 filters that transmit UV light. For feldspar signal measurements from multi-grain aliquots of polymineral sediment, IR stimulation was made with a cluster of Vishay TSFF 5200 IR diodes with peak emission at 870 nm, and maximum power of 115 mW cm−2 at the sample position. Single-grain feldspar signal measurements were made with an IR laser emitting 830 nm at a maximum power of 150 mW cm−2. Corning 7–59 and Schott BG39 filters were used for feldspar signal detection. An additional Schott RG780 filter was mounted in front of the IR laser to reduce background noise during single-grain measurements (Lai et al., 2002).
3.4 Equivalent dose (De) determination
3.4.1 SAR
The equivalent dose (De) was measured using variations of the single aliquot regenerative dose (SAR) protocol (Wallinga et al., 2000; Murray and Wintle, 2000). This protocol measures the sensitivity-corrected natural signal () of each grain/aliquot, followed by sensitivity-corrected regenerative dose signals () measured after a series of increasing laboratory doses (i.e., the dose response curve). The protocol included the measurement of a repeat-dose point (i.e., one regenerative dose point is measured twice) to measure the recycling ratio, and a zero-dose point (i.e. is measured after no dose is given) to measure recuperation. Aliquots/grains were rejected from further analysis if the recycling ratio was beyond 10 % of unity and if recuperation was greater than 5 % of the sensitivity-corrected natural signal. Aliquots/grains were also rejected if their natural test dose signals were less than three times the standard deviation of the background signal.
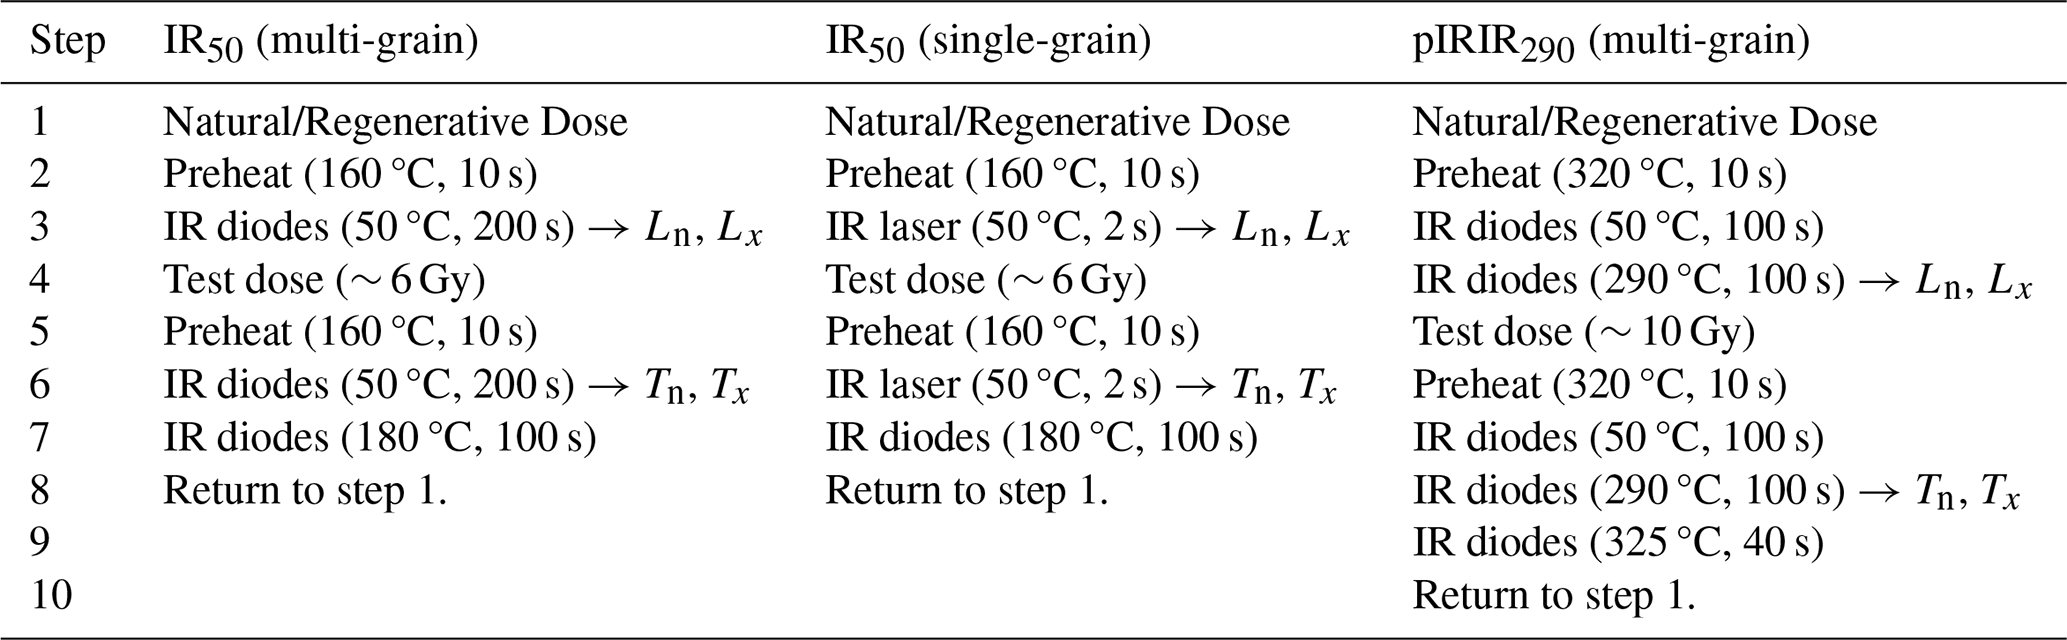
We applied varying SAR protocols during this study to measure the infrared signal measured at 50 °C (IR50 signal) as well as post-infrared infrared (pIRIR) signals measured at a range of temperatures. These protocols are shown in Tables 2 and S2. The IR50 protocol includes low-temperature (160 °C) preheats prior to measurement of the regenerative and test doses, as these have been found in the past to reduce or remove recuperation and improve dose recovery test results (e.g., Neudorf et al., 2015). The pIRIR290 protocol was adapted from Thiel et al. (2011). Because preheats must be equal to, or higher than pIRIR stimulation temperatures (Murray et al., 2009), this protocol includes a high preheat of 320 °C.
3.4.2 Dose recovery tests
In this study, SAR protocols were tested prior to De measurement using dose recovery tests (Aitken, 1994; Roberts et al., 1999). During these tests the sample was bleached using IR or pIRIR stimulation, administered a known laboratory dose to the sample, then measured using the SAR protocol to be tested. The IR50 SAR protocol was tested because, though it can exhibit anomalous fading, it depletes faster during light exposure in nature than pIRIR signals (Thomsen et al., 2008). pIRIR SAR protocols were also tested, as these exhibit lower fading rates, and may be more appropriate for samples with high anomalous fading rates (Thomsen et al., 2008; Buylaert et al., 2009).
Polymineral grains measured at the single-grain (or micro-hole) level in single-grain discs were first bleached simultaneously for 1000 s using IR diodes, then stimulated individually (in each hole) for 2 s using the IR laser. It was found that this second bleach with the IR laser was necessary as the shadowing effects of the holes in the single-grain discs prevented full depletion of the IR50 signal in all grains by the IR diodes. A similar approach has been adopted for single K-feldspar grains by Feathers et al. (2019). Because the available grain size fraction from the rocks was significantly smaller (63–250 µm) than the width of the single-grain disc holes (300 µm) in the reader, it is likely that several (up to 5) grains within each disc hole contributed to the IRSL signal, and the results should be viewed as small multi-grain aliquot data, or “micro-hole” data as termed by Berger et al. (2013).
For the pIRIR protocols, the pIRIR signal was depleted using a pIRIR Ln measurement (Table 2) in order to target the pIRIR traps and avoid leaving a slowly bleaching part of the signal that can remain if the sample is only exposed to daylight or a solar simulator for a finite period of time (e.g., Li and Li, 2011). A disadvantage of this approach is that the bleaching method (the pIRIR Ln measurement) can lead to sensitivity changes that may lead to inaccurate dose recovery test results. For all SAR protocols tested, the protocol was accepted if the ratio of the measured-to-given dose was within 10 % of unity and few aliquots or grains were rejected from analysis due to dim signals, high recuperation or recycling ratios that are not within 10 % of unity. However, these results should be viewed with caution until further experiments can be conducted.
3.5 Anomalous fading
Fading rates were measured using a SAR procedure modified from Auclair et al. (2003). This procedure entails bleaching the sample, administering a known laboratory dose, preheating the sample to a temperature deemed appropriate by the dose recovery tests, then measuring the sensitivity-corrected signal () after a series of delay times ranging from a few minutes to ∼ 10 h.
In this study we measured fading rates from several multi-grain aliquots and/or single grains from each sample, where the fading rate from each aliquot/grain is illustrated using a fading plot of versus delay time in hours (h). Delay time is plotted on a logarithmic scale to account for the fact that feldspar signals fade exponentially. The fading rate of an aliquot/grain is quantified by the slope of the line, termed the g-value, with units of percent per decade, where a decade is a 10-fold increase in delay time (i.e., one increment on a logarithmic scale) (Huntley and Lamothe, 2001). All g-values are normalised to 2 d.
3.6 Dosimetry
The dose rates of the sampled clasts and the surrounding bulk matrix samples were determined in two ways: (i) using measured concentrations of parent radionuclides Uranium (U), Thorium (Th) as well as Potassium (K) and Rubidium (Rb) using inductively coupled plasma mass spectrometry (ICP-MS) (for U and Th) and inductively coupled plasma atomic emission spectroscopy (ICP-AES) (for K), and (ii) using high resolution gamma spectrometry to measure K-40, as well as U-238 and Th-232 radionuclides and their daughter products. This second approach allows us to assess the possibility of secular disequilibrium within the U or Th decay chains that may have led to fluctuations in environmental dose rates through time (Murray et al., 1987; Ivanovich and Harmon, 1992).
Both gravel matrix and gravel rock subsamples from all sites were prepared for ICP-MS and ICP-AES analysis of radionuclide contents by ALS Geochemistry, Reno, NV. These samples were dried and milled to a fine, flour consistency and subsamples used for U, Rb and Th measurement were fused with lithium borate and measured with ICP-MS. K2O was measured from the bulk sample with ICP-AES and converted to % K.
Gravel matrix samples from sites CV21P1 (Coal Valley) and CA21P1 (Cave Valley) were measured using high resolution gamma spectrometry, as well as one sample containing a mix of subsamples from multiple representative limestone gravel rocks from CV21P1. Gamma spectrometry measurements could not be made for individual limestone gravel rocks, because they did not form large enough samples needed (∼ 50 g) for measurement. Samples were dried, ground to a fine powder consistency, then ashed at 450 °C in a muffle furnace for 24 h. They were then emplaced in γ Beakers designed by miDose Solutions, Poland to prevent leakage of Rn gas and stored for a minimum of 21 d to allow the sample to reach equilibrium. After storage, samples were placed on top of a broad energy (BE), planar High Purity Germanium (HPGe) detector and the gamma emission was measured for 7 d. The gamma energy spectrum was analysed to calculate the activities of U-238, Ra-226, Th-232, Pb-210, Ra-224, Ac-228 and K-40 in Bq kg−1.
Dose rates (Gy ka−1) were calculated in the Dose Rate and Age Calculator (DRAC) by Durcan et al. (2015) using the conversion factors of Liritzis et al. (2013) and assumed negligible water contents within the gravel clasts and an average water content of 3.0 ± 1.5 % within gravel matrices. The cosmic dose rate (Gy ka−1) was calculated according to Prescott and Hutton (1994) using sample geographic coordinates and depths below the surface. The internal K content of the sediment and rock minerals measured in this study could not be quantified, so grain (or rock mineral) internal dose rates are assumed to be 10 ± 2 % following Smedley et al. (2012). We recognise that this value may be high for our polymineral samples (Maßon et al., 2025), and that future work should investigate the K contents of grains and minerals that contribute significantly to the luminescence signals detected using our detection windows.
4.1 Beach ridge sedimentology
4.1.1 Coal Valley
Sediments exposed at site CV21P1 reveal two main units including a massive, cohesive blocky silt (Unit 1 – clayey silt) overlain by a weakly bedded gravel with medium-coarse sandy matrix (Unit 2 – sandy beach gravel) (Fig. 3a, Table 3). Gravel clasts rarely exceed 40 mm along their intermediate (b-axis) dimension and lithologies are dominated by limestones derived from outcropping Devonian carbonate shelf deposits to the west (Fig. S5). These sediments are interpreted to represent pluvial lake highstand beach gravels overlying fine-grained sediments that were ponded in a lagoon behind the beach ridge shortly before rising waters deposited the gravels over them (Wriston and Adams, 2020) (Fig. 4). In this interpretation, the gravels and underlying lagoonal deposits are contemporaneous (cf. Adams and Wesnousky, 1998). Therefore, the age of radiocarbon dated shell from the lagoonal deposits (15 873–16 281 cal yr BP) is interpreted to represent the age of the beach gravels that were deposited there during the pluvial Lake Coal highstand.
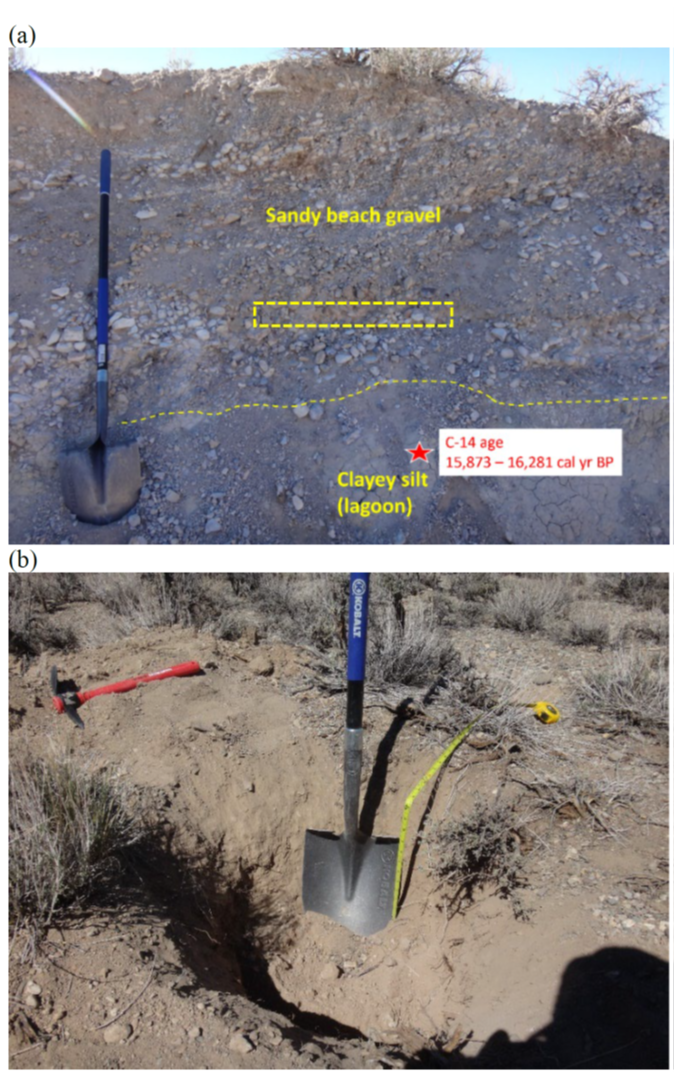
Figure 3(a) Sampled sedimentary exposure CV21P1 in Coal Valley. The zone of sampling is 1 m below the surface and is indicated by the yellow dashed box. (b) Sampled excavation pit from site CA21P1. The silty sand gravel matrix that forms the soil A horizon is exposed in the trench. Gravel clasts were collected at the base of the trench between 38 and 44 cm depth below surface.
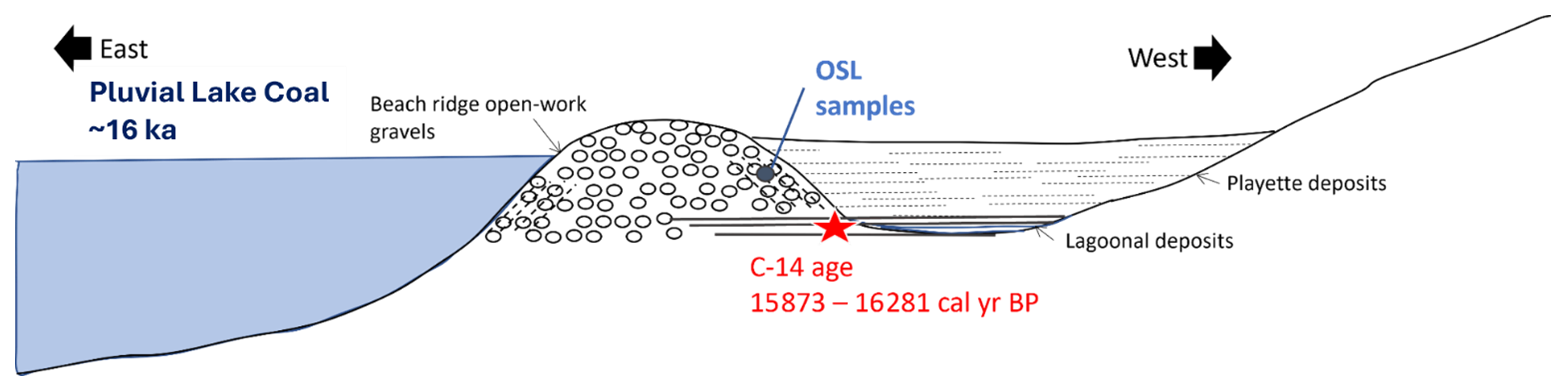
Figure 4Illustration of sampled beach ridge shortly after formation ∼ 16 000 years ago during the Pluvial Lake Coal highstand. Any backwater playette deposits or lagoonal deposits landward of the beach ridge have since eroded away, exposing the beach gravels on the west side of the ridge. Figure not to scale.
Table 3Sedimentary characteristics of beach ridges at sites CV21P1 and CA21P1.
4.1.2 Cave Valley
Sediments exposed in excavation pits at sites CA21P1 and CA21P2 include gravel with silty sand matrix. Sedimentary structures were not visible due to the loose silt that quickly covers exposed sections. Both beach ridge gravels are dominated by volcanic rock lithologies derived from outcropping Miocene and Oligocene flows and tuffaceous sedimentary rock to the west and south, with more felsic varieties appearing more common at CA21P1 (Figs. 3b, S6, Table 3). Gravel clasts were subangular to subrounded with their longest dimensions commonly under 10 cm.
4.1.3 Lake Valley
Sediments exposed in the excavation pit of site LK21P1 include gravel with silty sand matrix. Limestone dominates the rock lithologies, which is derived from neighbouring Devonian lithified carbonate shelf deposits (Fig. S7). Gravel clast sizes were similar to those found in Cave Valley. Samples collected from Lake Valley were not datable (see below), so further discussion of the site sedimentology is not reported here.
4.2 Luminescence signals from limestone and volcanic rocks
Luminescence signals were measured from polymineral samples extracted from a subset of limestones from Coal Valley and Lake Valley as well as volcanic rocks from Cave Valley to determine their brightness and suitability for dating. Measurements were made in both continuous-wave (CW-OSL) and linear-modulation (LM-OSL) modes (details in the Supplement, Sect. S3). Because none of the minerals extracted from five Lake Valley limestone gravels had detectable luminescence signals, we focused our efforts on samples from Coal and Cave valleys. Neither limestone samples nor volcanic rocks contained quartz with a datable fast component, but some rocks from both lithologies exhibited IR signals. Volcanic rocks with the brightest IR signals were typically of the felsic (andesitic or rhyolitic) varieties common at site CA21P1, whereas basalts, like those collected from site CA21P2, had no signal.
4.3 Limestone gravels from Coal Valley
4.3.1 Dose recovery test results
Twenty-one limestone rocks from site CV21P1 were processed for IR signal testing and De measurement (Table 4). Nineteen of these were clasts excavated within the beach ridge at ∼ 1 m depth, and two were cobbles collected from the ground surface (i.e., modern samples). Minerals extracted from seven of these gravels passed dose recovery tests either at the multi-grain or single-grain level, but only three of these (rocks #2, 10, and 18) had sufficient material left for De measurement and enough aliquots/grains that passed SAR rejection criteria. Minerals extracted from the two cobbles collected from the ground surface (rocks #2M and 3M, Table 4) did not have a detectable IR or OSL signal.
Table 4Dose recovery (DRT) and fading test results for polymineral sand grains extracted from limestone rocks from Coal Valley site CV21P1. MG refers to multi-grain analysis and SG refers to single-grain analysis. The IR50 SAR protocol (Table 2) was applied.
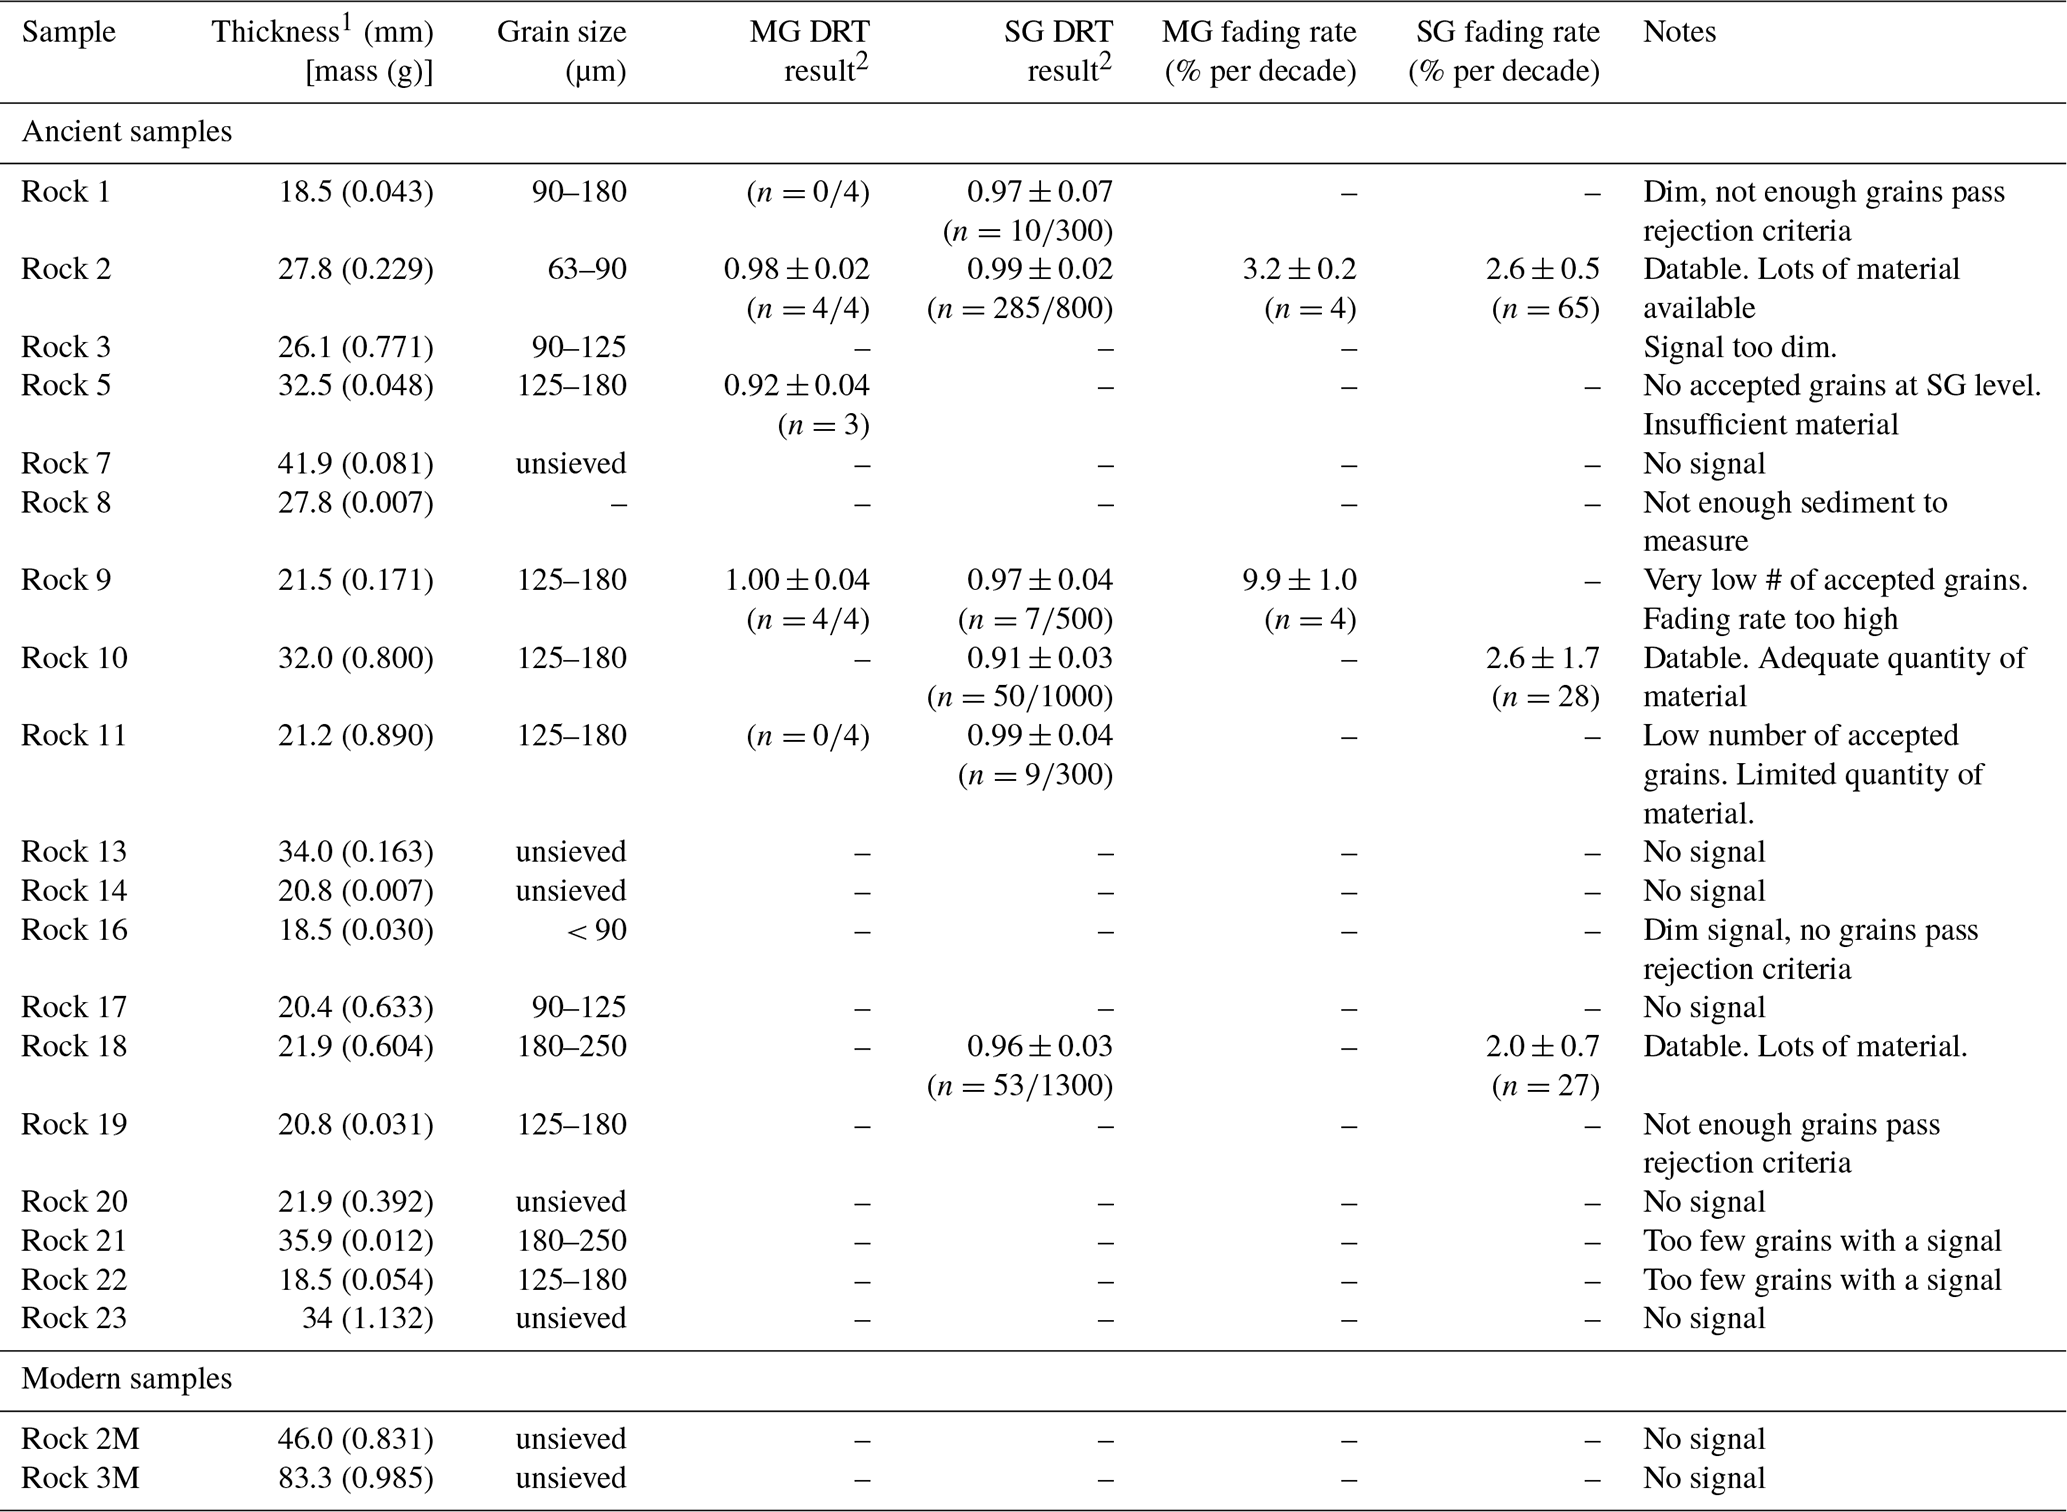
1 Thickness refers to the shortest rock dimension and mass is the mass of polymineral grains extracted from the outer 1–2 mm of the rock. 2 n= # grains or multi-grain aliquots that pass rejection criteria/total number of grains/aliquots measured.
The dose recovery test results for Rocks 2 (63–90 µm), 10 (125–180 µm) and 18 (180–250 µm) are plotted in Fig. S9, where a laboratory dose of ∼ 21 Gy was recovered. Measured σb values were 22 %, 18 % and 17 % for Rocks 2, 10 and 18, respectively, where σb refers to measurement uncertainties that are attributed to instrument reproducibility and grain-to-grain variations in signal properties (Galbraith and Roberts, 2012). Measured-to-given dose ratios were 0.99 ± 0.02, 0.91 ± 0.03 and 0.96 ± 0.03 for Rocks 2, 10 and 18, respectively suggesting that the IR50 SAR protocol is suitable for these samples, and thus these samples were chosen for dating. The 90–125 µm grain size fraction from Rock 2 was also dated in the following sections, but there was not enough material to perform a dose recovery test prior to dating. Thus, a σb value of 22 % has been assumed for this grain size fraction.
4.3.2 Fading test results
Fading measurements for Rocks 2, 10 and 18 were made on the same grains (or small multi-grain aliquots) used for De determination. These included single-grain (i.e., “micro-hole”) measurements of the 63–90 µm fraction from Rock 2 using single-grain discs, and single-grain measurements of the 125–180 µm fraction from Rock 10 and the 180–250 µm fraction from Rock 18. This allows each grain (or small multi-grain aliquot in the case of the 63–90 µm fraction) to be corrected for its own fading rate, which can vary significantly from grain to grain or aliquot to aliquot. An average fading rate was also measured from four 2 mm diameter multi-grain aliquots from the 90–125 µm grain size fraction from Rock 2.
Representative single-grain/small aliquot IR50 signals and fading plots are shown in Fig. S12. The fading rate, or g-value, of each grain/small aliquot was measured using multiple prompt and delayed signal measurements. The weighted mean g-value for Rock 2 (285 micro-hole measurements of the 63–90 µm fraction) is 2.55 ± 0.52 % per decade, which is slightly lower but within 2 standard deviations of that measured from the 90–125 µm grain size fraction from the same rock (3.19 ± 0.15 % per decade). The weighted mean g-value of all single-grain measurements made for Rocks 10 and 18 is 2.65 ± 1.71 and 1.99 ± 0.79 % per decade, respectively.
4.3.3 Radionuclide concentrations
ICP-MS/AES measurements of U, Th, K and Rb were conducted on crushed and milled subsamples of Rocks 2, 10 and 18 as well as a bulk sample of the gravel matrix (Table S8 in the Supplement). All radionuclide contents for the limestone gravels are low relative to values typically obtained for bulk non-carbonaceous sediment, and this is expected given the relatively low concentration of silicate minerals within the limestone. The gravel matrix yielded values that are slightly above those of the rocks, reflecting a higher silicate mineral content.
HPGe measurements of the limestone yielded results that are in range of those measured using ICP-MS/AES, while measurements made from the gravel matrix deviate somewhat from the ICP-MS/AES results. To check the calibration of our HPGe detector, measurements were made on a standard prepared by Murray et al. (2015) that was measured by 23 different laboratories (Table S9, Fig. S16A and B). Our results are within 20 % of those previously published.
Radionuclide activity ratios for the U and Th series in the limestone and gravel matrix samples are reported in Table S10 and plotted in Figs. S16C–F and S17. The gravel matrix sample from CV21P1 shows elevated Pb-210 activity relative to U-238 and Ra-226, while the Ra-226 U-238 ratio approximates unity and the Ra-224 Ac-228 ratio falls within 20 % of unity. Given that the gravel matrix sample was collected from loose, porous medium-coarse sandy gravels ∼ 1 m below the surface, we interpret the elevated Pb-210 values to reflect the translocation of atmospheric Pb-210 that has leached down to the level of sampling during rain events (Murray, 1996). The Ra-226 U-238 and Ra-224 Ac-228 ratios from the gravel matrix otherwise suggest that the deposit approximates secular equilibrium. Radionuclide activity ratios calculated from the limestone rocks are well within 20 % of unity, suggesting that our assumption that any U-disequilibrium that may have existed within the limestone during its formation will have corrected itself since Devonian times (Sect. 3.2.1).
4.3.4 Dose rate modelling
Alpha, beta and gamma dose rates have been calculated for all limestone rocks as well as the gravel matrix from site CV21P1 (Table S13). Dose rates were calculated from both the ICP-MS/AES and HPGe measured radionuclide concentrations. As expected for carbonate-rich materials, all dose rates are low, ranging from ∼ 1.2 to ∼ 1.9 Gy ka−1. HPGe measurements from limestone rocks yielded alpha, beta and total dose rates within the range of results obtained from ICP-MS/AES analysis. HPGe measurements of the gravel matrix underestimate the ICP-MS/AES beta and gamma results leading to a ∼ 24 % reduction in the total dose rate.
Dose rates were calculated for the outermost ∼ 2 mm of each limestone taking into account the measured alpha, beta and gamma dose rates from each rock, beta and gamma dose rates from the surrounding bulk gravel matrix as well as cosmic rays from outer space. Dose rates for each rock were modelled using the approach of Riedesel and Autzen (2020), which incorporates experimentally derived attenuation factors for granite, assuming that the rock is shaped like a sphere. This approach yields total dose rates that are lower than those calculated using earlier approaches that assume laterally infinite beta and gamma dose rates for both the rock and surrounding sediment (e.g., Jenkins et al., 2018) (see Sect. S8 for a comparison). To check that the beta and gamma attenuation factors of Riedesel and Autzen (2020) are appropriate for our limestone samples, the elemental concentrations of 4 representative limestone subsamples were measured by XRF and used to calculate attenuation factors using Geant4 simulations. These simulations generated attenuation factors that matched those published by Riedesel and Autzen (2020) for granite (Martin Autzen, personal communication, 2024), and so we apply them to our dose rate models in our study.
Modelled alpha, beta and gamma dose rates with depth into Rocks 2, 10 and 18 are shown in Fig. 5. These are based on radionuclide concentrations measured by ICP-MS/AES (Sect. 4.3.3). Similar dose rate with depth models were also calculated using the radionuclide contents determined using HPGe. The total dose rate used for calculating the age of detrital mineral grains within the outer 2 mm layer of each limestone rock is an average value highlighted in green in Fig. 5.
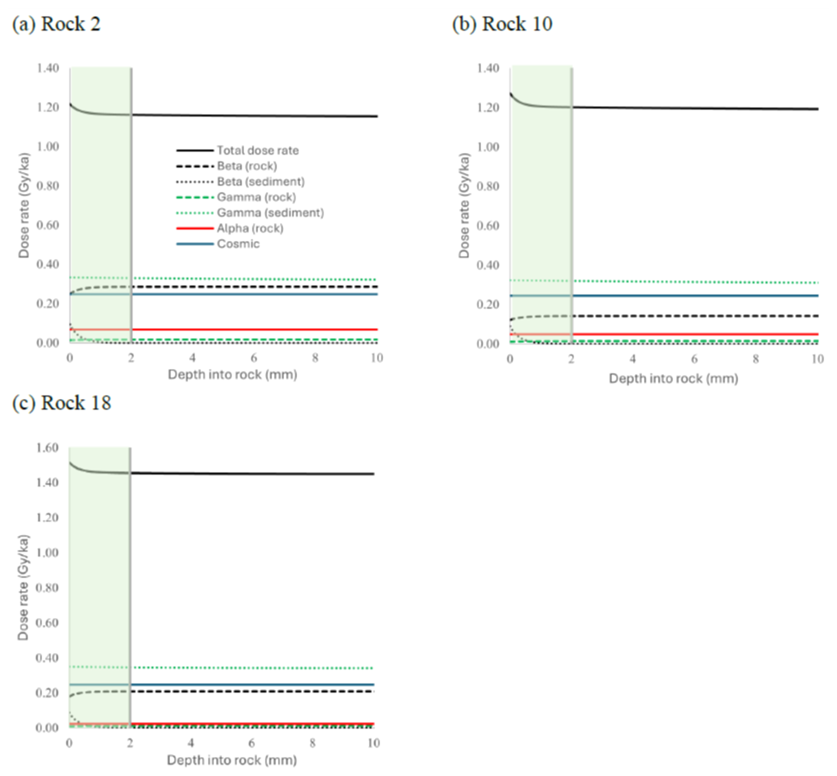
Figure 5Modelled dose rates for limestone rocks from site CV21P1 following the method of Riedesel and Autzen (2020) and radionuclide concentration data obtained from ICP-MS/AES. The average dose rate for the outer 2 mm of the rocks (green shading) was used for age calculation. The total dose rate includes an internal dose rate component due to an assumed internal K content of 10 ± 2% after Smedley et al. (2012) for measured feldspar grains.
4.3.5 Limestone luminescence age distributions
The De and luminescence ages were measured from polymineral grains from Rocks 2, 10 and 18; these rocks passed dose recovery tests (Sect. 4.3.1). The De was measured from two grain sizes from Rock 2 (63–90 and 90–125 µm fractions), the 125–180 µm fraction from Rock 10, and the 180–250 µm fraction from Rock 18. De was measured using the IR50 SAR protocol in Table 2 for single-grains, and each grain (or small multi-grain aliquot) was corrected for its own fading rate using the correction model of Huntley and Lamothe (2001) for all samples except for the 90–125 µm fraction from Rock 2. All aliquots from the 90–125 µm fraction of Rock 2 were corrected for fading using an average fading rate measured from medium sized multi-grain aliquots (Sect. 4.3.2). As Fig. S13 shows, single-grain fading corrections have the effect of magnifying single-grain age errors for older grains within the distribution, and this is attributed to the limited precision with which we can measure single-grain fading rates.
The fading-corrected aliquot age distributions are shown in Fig. 6 where the cumulative distribution plot is superimposed on a kernel density estimate (KDE) curve. Overdispersion values (OD) for the fading-corrected data are reported in Table 5. These have been calculated using the central dose model of Galbraith et al. (1999) after taking into account the measured σb value in dose recovery tests (Sect. 4.3.1) and record the level of spread in the data that can be attributed to environmental factors during burial, such as incomplete re-setting of grain signals by sunlight or heterogeneities in the dose rate field that lead to grain-to-grain variations in acquired dose (Galbraith and Roberts, 2012).
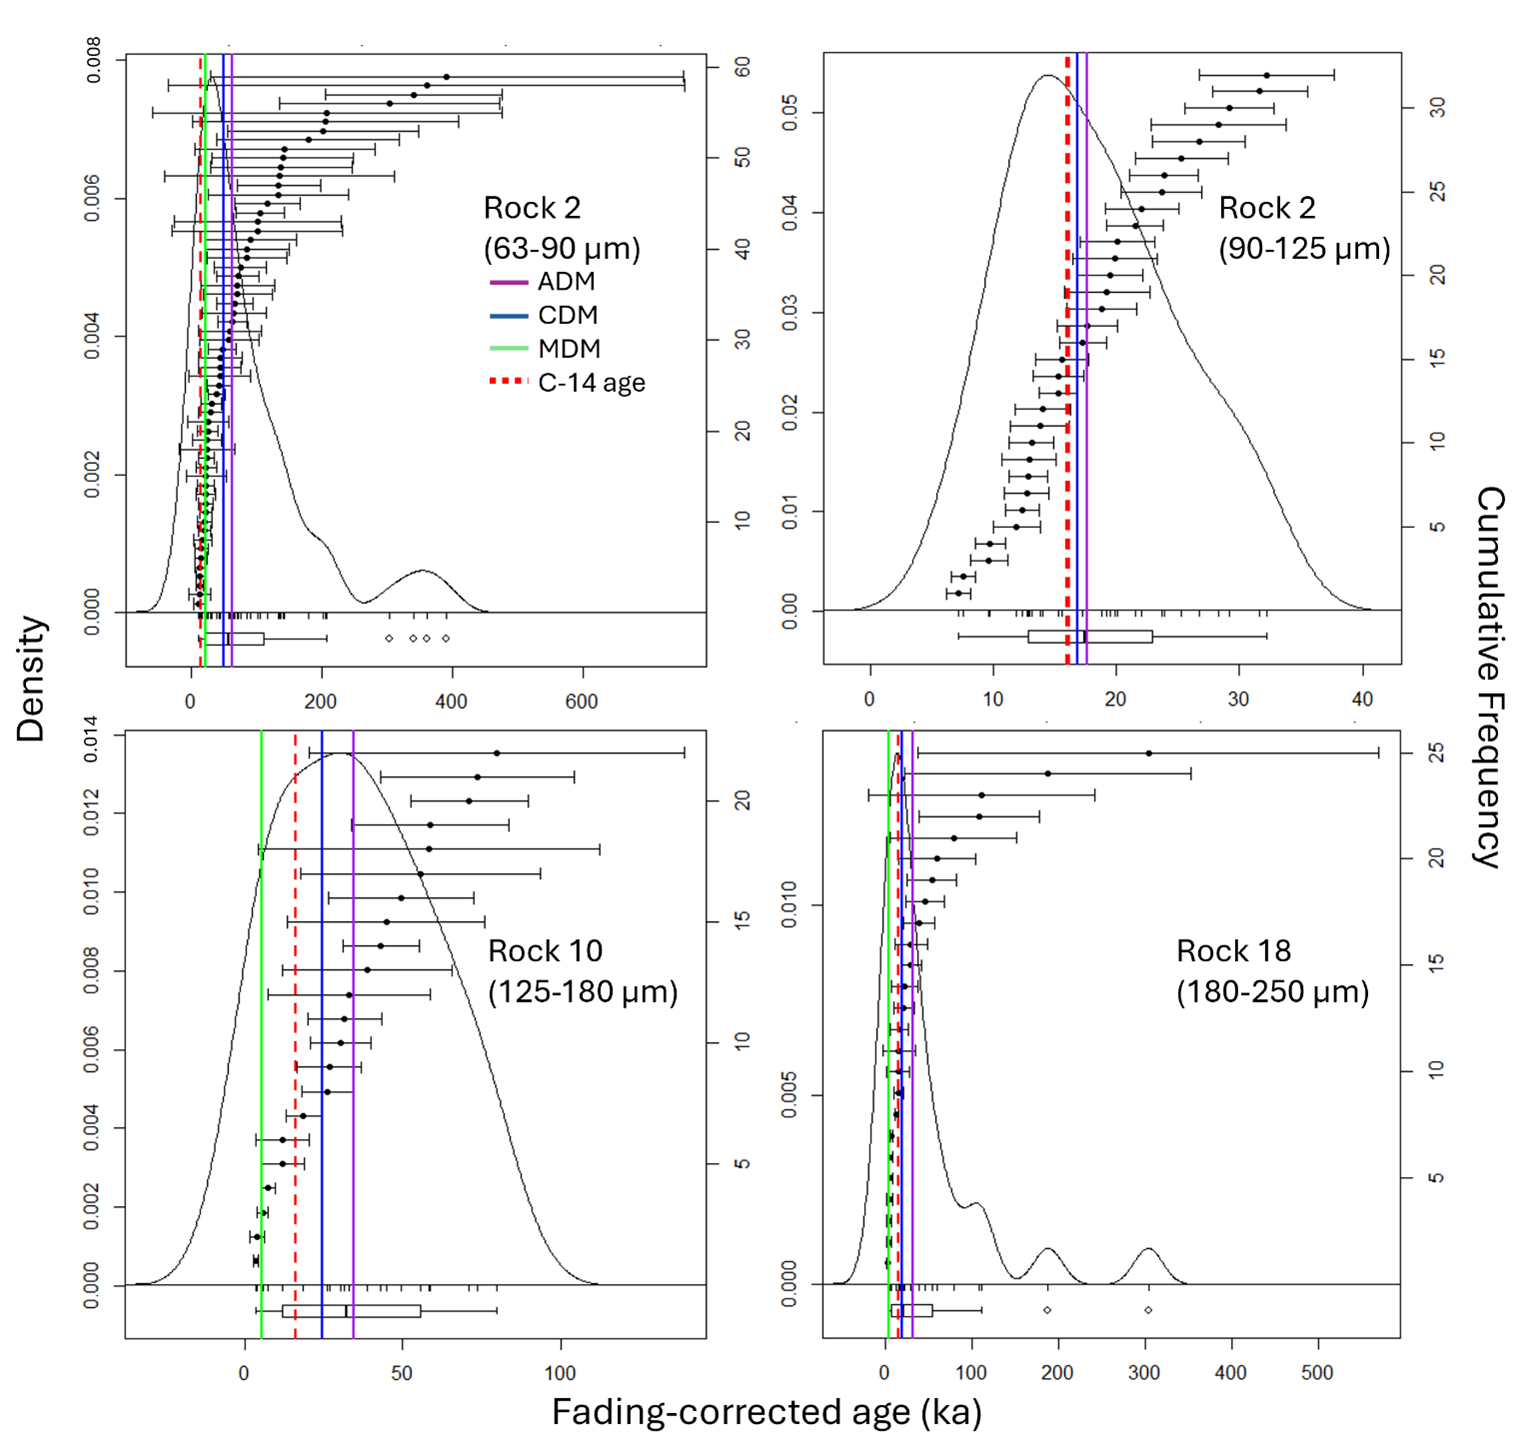
Figure 6CDM, MDM and ADM model results superimposed on the age distribution KDE plot. The radiocarbon age for site CV21P1 is indicated as a dashed red line. Ages have been calculated using dose rates determined through ICP-MS/AES. Single-grain fading-corrections have been applied to all datasets accept for the 90–125 µm fraction from Rock 2, where all aliquots have been corrected using an average g-value obtained from multi-grain aliquot fading measurements (Sect. 4.3.2).
Given that most rock dating studies derive ages from rock (primarily granite, sandstones, quartzites, and volcanics) slices, rather than single-grains or small aliquots, the relationship between single-grain/aliquot age distribution shapes, OD, and depositional process for rocks is not known and has not been examined in the same way these relationships have been examined for traditional sediment dating studies (e.g., King et al., 2014). We provide preliminary interpretations of these data that should be solidified by future testing. The OD of the 90-125 µm fraction of Rock 2 is 30 % and it shows a symmetrical KDE curve, which may indicate that most grains have been sufficiently bleached prior to burial (cf. Arnold and Roberts, 2009, Table 4 for quartz). The OD of all other samples are much higher, ranging from 66 % to 99 %, and may record incomplete bleaching as well as scatter that is the result of beta microdosimetry effects. KDE curves for the fading-corrected data are nearly symmetrical for Rock 10, possibly indicating that most scatter is due to beta microdosimetry effects (Mayya et al., 2006), while those of Rocks 2 and 18 show a slight positive skew that may record beta microdosimetry effects as well as incomplete bleaching of grains.
4.3.6 Age models
Statistical models have been developed for calculating a sample De value from a distribution of single-grain De values (e.g., Galbraith et al., 1999; Galbraith and Roberts, 2012; Guérin et al., 2017). These models are based on assumptions regarding the depositional history and composition of the sample analysed. Single-grain ages in this study were calculated using the minimum dose (MDM) and central dose (CDM) models of Galbraith et al. (1999) as well as the more recently developed average dose (ADM) model of Guérin et al. (2017). A description of the assumptions behind each model are outlined in Sect. S9.
4.3.7 Age results
All calculated ages are summarized in Table 5 and plotted in Figs. 6 and 7 alongside the radiocarbon age for the freshwater shell collected from the lagoonal silts (Unit 1). The radiocarbon age plots closest to the CDM ages for limestone Rocks 2 (90–125 µm, ICP-MS/AES) and 18, overlapping at 1σ, and agrees with CDM ages calculated for Rock 10 at 2σ. At 2σ the radiocarbon age also overlaps with MDM ages for Rock 2 (63–90 µm), as well as ADM ages for Rock 2 (90–125 µm, ICP-MS/AES) and Rock 18 (Table 5).
Table 5Calculated ages (at 1σ) for limestone gravels from site CV21P1 in Coal Valley. The calibrated 2σ radiocarbon age obtained from lagoonal deposits underlying the gravel gravels is 15 873–16 281 cal yr BP. Luminescence age values that agree with the radiocarbon age within 1σ are highlighted in bold; those ages agreeing with the radiocarbon age at 2σ are bold and italicized.
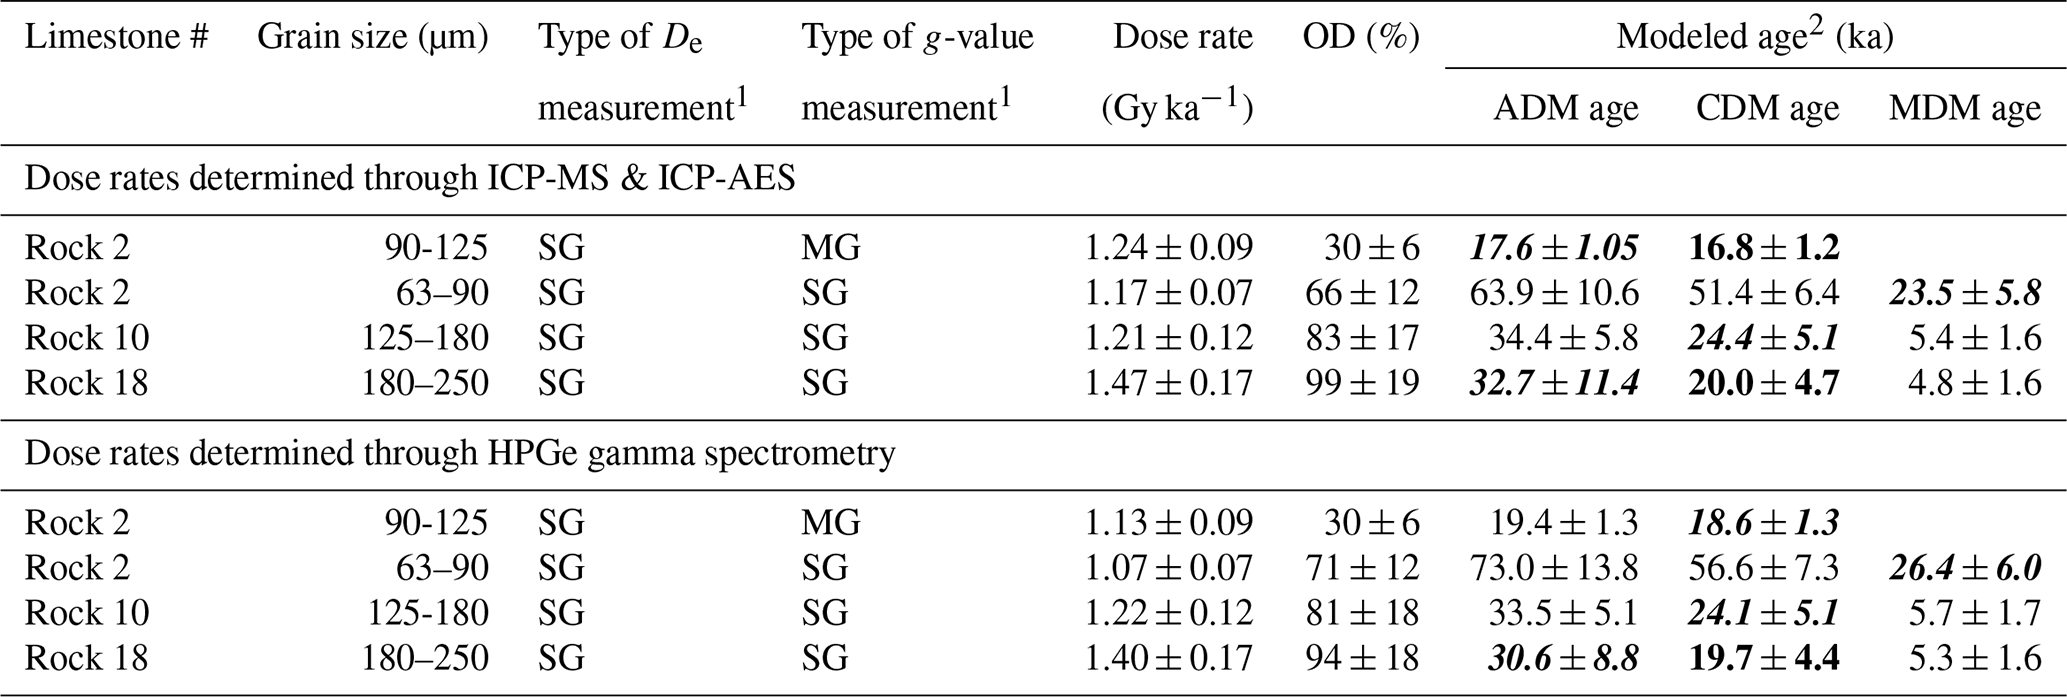
1 SG = single-grain, MG = multi-grain aliquot. Because the available grain size fraction from the rocks was significantly smaller (63–250 µm) than the width of the single-grain disc holes (300 µm), it is likely that more than one grain within each hole contributed to the IRSL signal, and the results should be viewed as small multi-grain aliquot data, or “micro-hole” data as termed by Berger et al. (2013). 2 σb (σb) values (as defined by Galbraith and Roberts, 2012) applied during age modelling were estimated for all samples using dose recovery tests. These are 0.22 for Rock 2 (90–125 µm fraction), 0.22 for Rock 2 (63–90 µm fraction), 0.18 for Rock 10 and 0.17 for Rock 18.
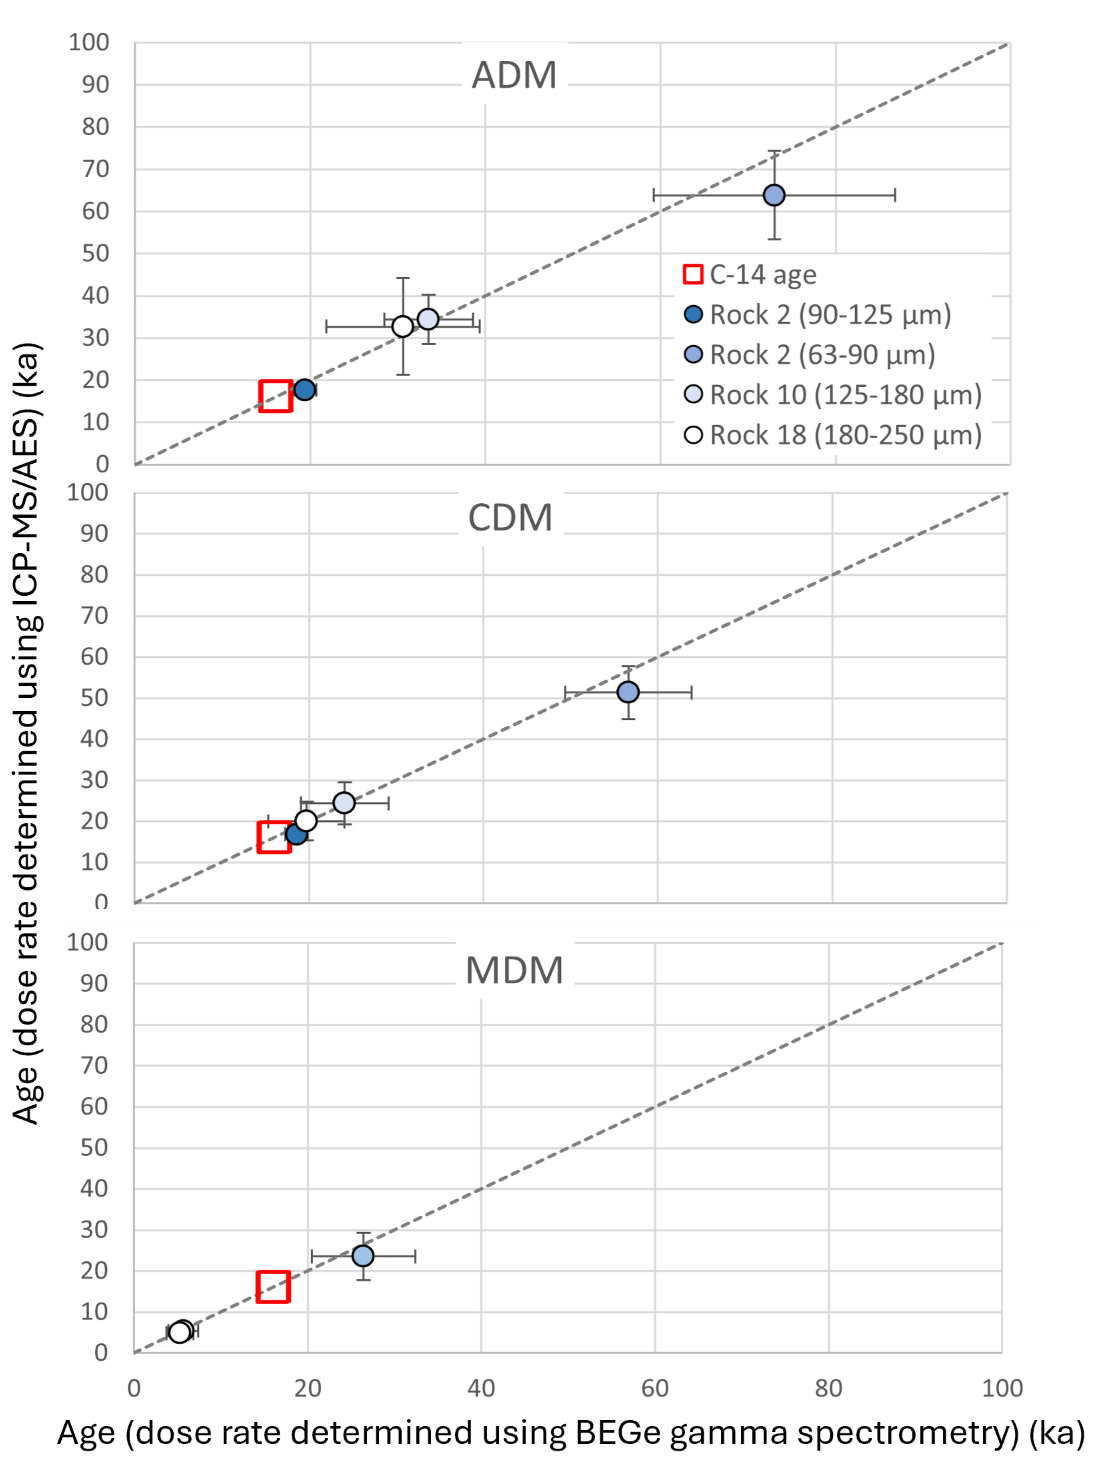
Figure 7CDM, MDM and ADM ages plotted with the radiocarbon age from Unit 1 that are all from the same Coal Valley profile CV21P1. Ages determined using ICP-MS/AES dose rates are plotted against those determined using HPGe dose rates using a BE Germanium detector (BEGe). The radiocarbon age limits are delineated in red and represent 1σ. Luminescence age error bars are plotted at 1σ.
Figure 7 shows the relationship between ages determined using ICP-MS/AES dose rates and those determined using HPGe dose rates. These results must be viewed with caution as the HPGe measurements could not be made from each individual limestone sample, but rather were made from one milled sample that combined limestone pieces from multiple rocks from the site. The method of dose rate determination impacted the oldest ages of those compared, where the ICP-MS/AES method resulted in slightly younger age estimates relative to the HPGe method, however ages derived from both dose rate measurement methods agree within 1σ.
4.4 Volcanic gravels from Cave Valley
4.4.1 Dose recovery test results
Preliminary dose recovery tests were conducted on 3 mm diameter multi-grain aliquots from all volcanic rocks from Cave Valley that exhibited an IR signal. These were all collected from site CA21P1. Pieces of each rock sample were ground and sieved into 32–63 µm grain size fractions prior to measurement. Each aliquot was bleached using a pIRIR Ln measurement (Table 2), then administered a ∼ 40 Gy beta dose prior to measurement using SAR. The pIRIR protocols tested included the 180, 225 and 290 °C protocols (Tables 2, S2), and results obtained from both the IR50 and pIRIR signals from each protocol were plotted (three aliquots per rock) (Fig. S10) and tabulated (Table S6). Despite some outlying values of the measured-to-given dose, most aliquots passed the dose recovery test suggesting that, after signal sensitisation during the Ln measurement, feldspars in these rocks were suitable for SAR.
After assessment of volcanic rock fading rates (Sect. 4.4.2) and rock characteristics (i.e., the composition of Rock 14, below), additional dose recovery tests were conducted on Rocks 4, 7, 11, 12, 13 and 18 using only the PIRIR290 protocol, as this was the only protocol to yield acceptable fading rates (see Sect. 4.4.2). These tests were conducted on the ground and suspension-settled 32–63 µm grain size fraction (24 aliquots per sample) and were used to estimate a σb value. IR50 and pIRIR290 signals from all rocks passed dose recovery tests, yielding measured-to-give dose ratios within 10 % of unity and σb values equal to 12 ± 4 % or less (Fig. S11, Table S6). Cutting and coring of Rock 14 revealed that most of this rock was composed of cryptocrystalline quartz (chert). This chert does not have a luminescence signal, so Rock 14 was not processed further.
4.4.2 Fading test results
Measurements of anomalous fading were conducted on the 32–63 µm fractions tested above. As expected, fading rates were the highest for the IR50 signal (up to ∼ 40 % per decade), and generally decreased with increasing pIRIR signal temperature (Fig. S15). The pIRIR290 signal yielded an average g-value of 3.3 ± 0.7 % per decade, with individual aliquot fading rates varying from 0 to ∼ 12 % per decade, while the pIRIR180 and IR50 signals yielded average g-values of 10.3 ± 0.9 and 23.1 ± 1.8 % per decade, respectively. We chose the highest temperature pIRIR protocol tested (pIRIR290) to minimise fading as much as possible, and thus additional fading tests using the pIRIR225 protocol were not pursued.
4.4.3 Radionuclide concentrations
ICP-MS/AES and HPGe measurements for volcanic Rocks 4, 7, 11, 12, 13 and 18 are shown in Table S11. As expected, radionuclide concentrations are much higher than those observed in limestone (Sect. 4.3.3). The HPGe results in Table S11 agree with the ICP-MS/AES results within 1σ for U and K, and within 2σ for Th. Radionuclide activity ratios for U in the gravel matrix collected from site CA21P1 show elevated levels of Pb-210 relative to U-238 that is likely atmospheric and sourced from recent rain events (Table S12, Fig. S18) (Murray, 1996). All other activity ratios fall within 20 % of unity, suggesting that disequilibrium in the U and Th decay chains is limited or negligible.
4.4.4 Dose rate modelling
The modelled dose rates for the dated volcanic rocks from Cave Valley are shown in Fig. 8, and calculated dose rates for both rocks and the gravel matrix are tabulated in Table S14. Calculated dose rates for the gravel matrix from site CA21P1 are high, with a total dose rate equal to ∼ 5 Gy ka−1 (Table S14). Dose rates calculated for all volcanic rocks using ICP-MS/AES radionuclide concentrations are also high, ranging from ∼ 6.2 to ∼ 7.4 Gy ka−1 (Table S14).
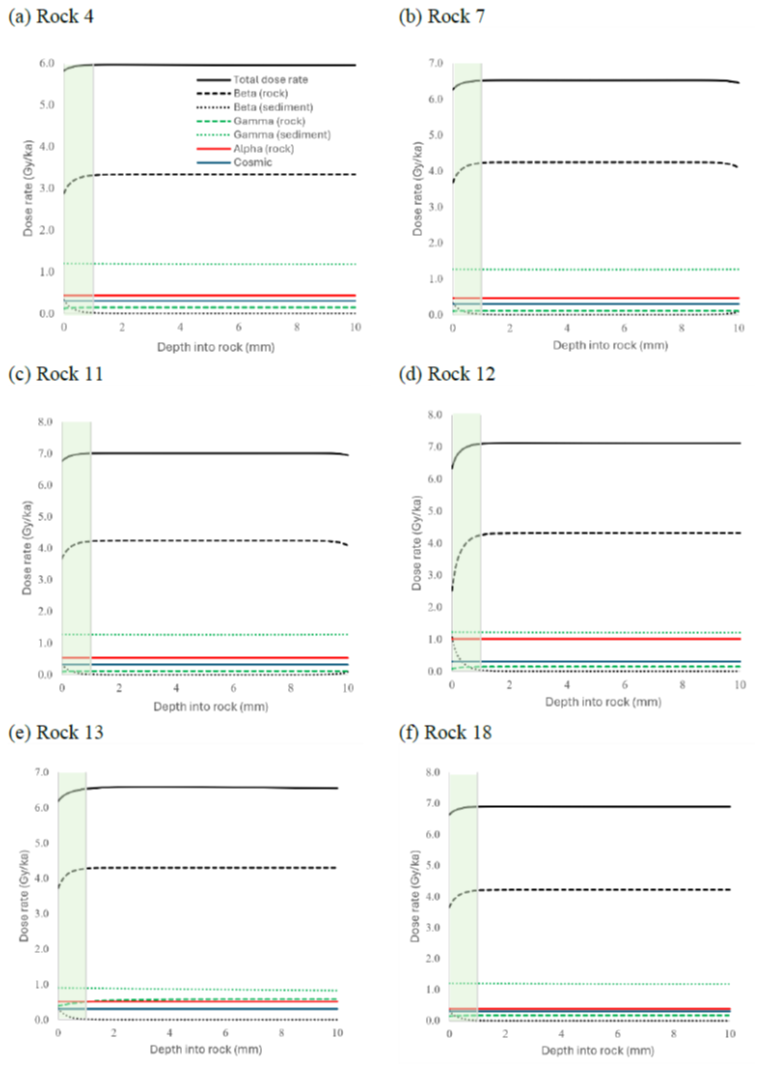
Figure 8Modelled dose rate with depth into gravel surfaces for rocks from CA21P1 in Cave Valley. Models are based on ICP-MS/AES measurements and the grain size measured from crushed rock slices. The average dose rate for the outer-most slice of the rocks was calculated using the beta, gamma and alpha dose rates within the shaded green region.
4.4.5 Rock surface luminescence age distributions
The outer ∼ 1 mm layer (dremeled 32–63 µm fraction) of Rocks 4, 7, 11, 12, 13 and 18 was measured for De using the pIRIR290 protocol for multi-grain aliquots in Table 2. Measurements were made on 3 mm diameter multi-grain aliquots, each containing ∼ 2600 grains. Aliquot De values (not corrected for anomalous fading) were divided by the average calculated dose rate within 1 mm of the gravel surface to obtain ages for both the IR50 and pIRIR290 signals. The pIRIR290 ages were corrected for fading using the model of Huntley and Lamothe (2001) using g-values calculated from four multi-grain aliquot fading measurements from each rock (Table S7).
As expected, IR50 uncorrected ages are significantly younger than pIRIR290 uncorrected ages (Figs. 9 and 10) and this is attributed to the high rate of fading of the IR50 signal as well as the lower bleaching rate of the pIRIR290 signal. Fading-corrected aliquot pIRIR290 age distributions for the dremeled outer rock surfaces are plotted in Figs. 9 and 10. Weighted mean surface ages for each rock were calculated using CDM and are shown in Figs. 9 and 10 as well as in Table 6.
Table 6Volcanic rock fading-corrected ages from CA21P1 in Cave Valley. “Oriented” rocks were sampled with their top and bottom surfaces recorded. The expected age of the pluvial lake highstand in Cave Valley is ∼ 18 000–20 000 years, and ages consistent with this at 1σ are in bold.
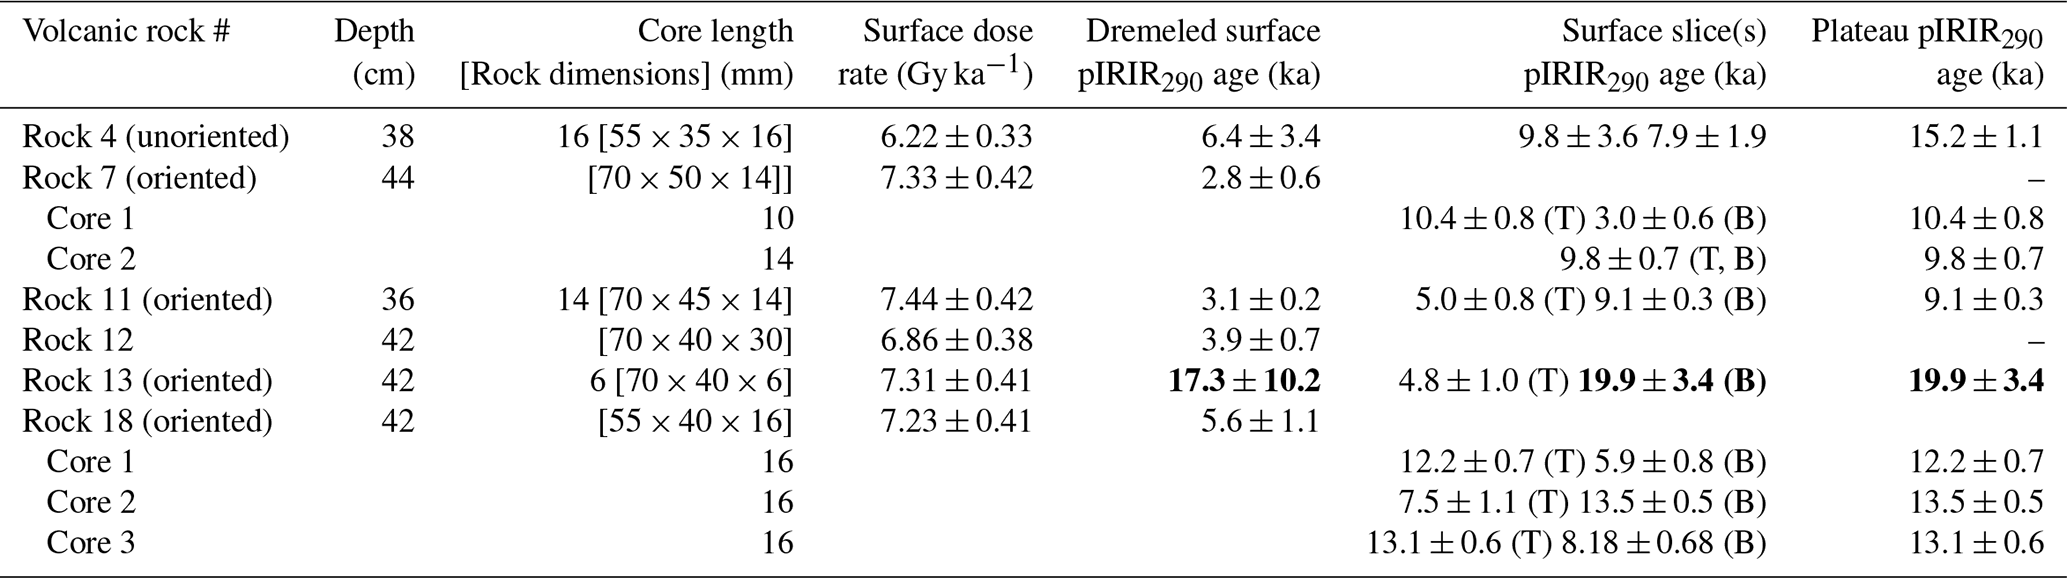
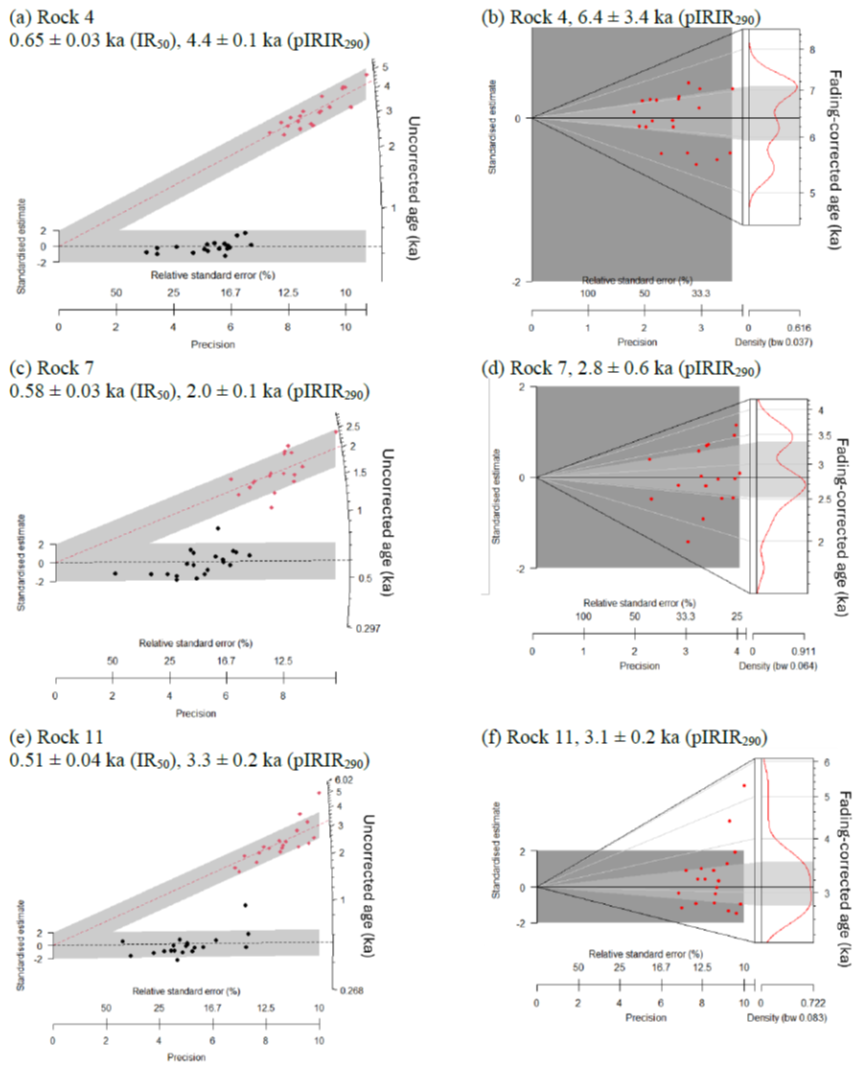
Figure 9Uncorrected (left) and fading-corrected (right) age distributions from polymineral grains extracted from the outer ∼ 1 mm layer of volcanic Rocks 4, 7 and 11 (∼ 2500 grains per aliquot, 32–63 µm fraction) from CA21P1 in Cave Valley. Corrections apply the fading correction model of Huntley and Lamothe (2001). Black dots are IR50 data (younger age group in each radial plot on the left), red dots are pIRIR290 data (older age group in each radial plot on the left, and fading-corrected ages on the right).
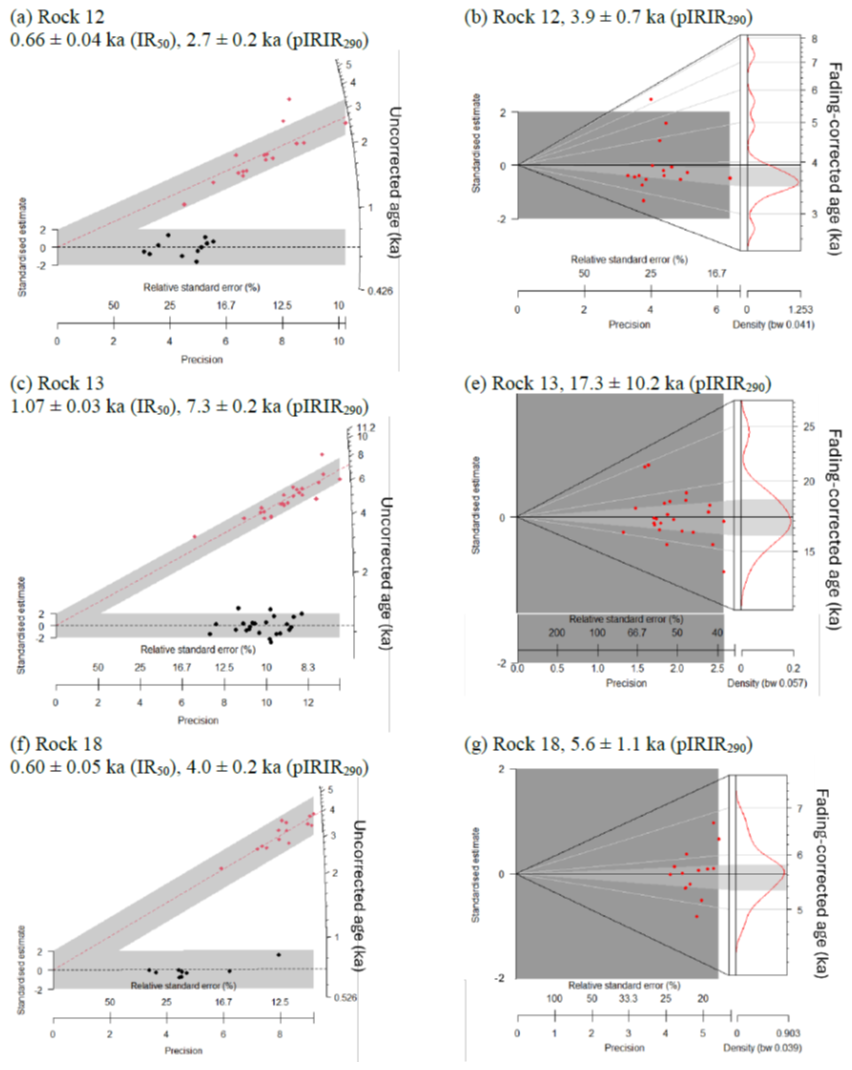
Figure 10Uncorrected (left) and fading-corrected (right) age distributions from polymineral grains extracted from the outer 1 mm layer of volcanic Rocks 12, 13 and 18 (∼ 2500 grains per aliquot, 32–63 µm fraction) from CA21P1 in Cave Valley. Corrections apply the fading correction model of Huntley and Lamothe (2001). Black dots are IR50 data (younger age group in each radial plot on the left), red dots are pIRIR290 data (older age group in each radial plot on the left, and fading-corrected ages on the right).
4.4.6 Rock age-depth profiles
De was measured from rock core slices using the same pIRIR290 SAR protocol that was used for volcanic rock surfaces (Figs. S20, S21). Some slices could not be measured due to limited sample material or dim signals and aliquots that failed SAR aliquot rejection criteria. Due to irregular rock surfaces and heterogeneities in rock hardness, slice thicknesses varied. As expected, IR50 De values consistently underestimate the pIRIR290 De values in all rocks, and that includes those De values measured from the surface (i.e., top- or bottom-most) slice. Several rock pIRIR290 De profiles (Rock 4, Rock 7 core 1, Rock 11, Rock 13, Rock 18 core 2) rise with depth into the rock at either the top or bottom side. For example, the Rock 7, core 1 pIRIR De profile starts at its lowest point at the bottom surface of the rock (left), then rises with depth into the rock (Fig. S20B). The IR50 De profiles of the same rocks typically rise in a similar pattern, but at a much lower rate, yielding much more subdued (flatter) profiles. Similar patterns have been observed in IR50 and pIRIR luminescence-depth profiles reported elsewhere (e.g., Sohbati et al., 2015; Freiesleben et al., 2015; Jenkins et al., 2018).
Aliquot slice De values were divided by depth-attenuated dose rates calculated in Sect. 4.4.4 to derive age-depth profiles (Figs. 11–13). Age-depth profiles generally show similar patterns to those observed in the De profiles; here we plot them using a logarithmic scale on the y-axis so that the IR50 age-depth profile shape is vertically enhanced. The uncorrected IR50 and pIRIR290 age-depth profiles, as well as the fading-corrected pIRIR290 age-depth profiles further support our interpretation above that gravels experienced short-term, heterogeneous light exposure to their surfaces prior to burial. Clear, plateaus that intersect the rock surface suggestive of a long-term bleaching event prior to gravel burial (such as that shown in Fig. 1) are absent.
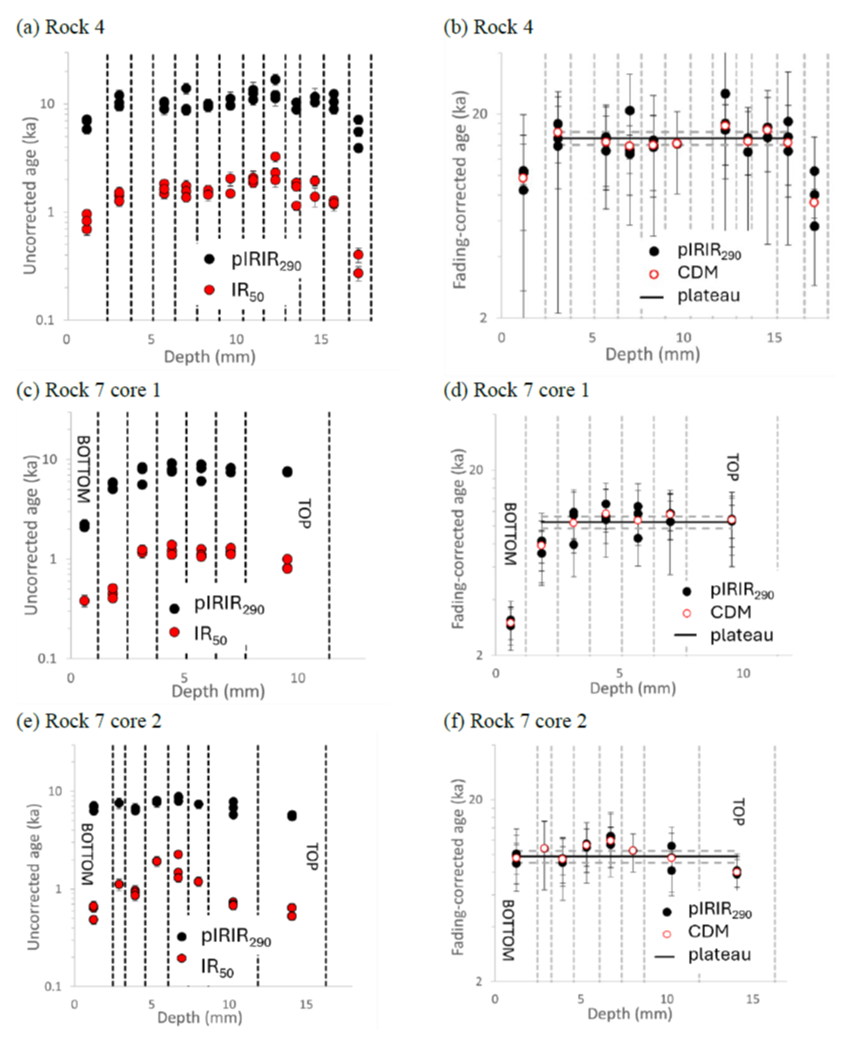
Figure 11Uncorrected (left) and fading-corrected (right) age-depth profiles for volcanic Rocks 4 and 7 from CA21P1. Vertical dashed lines denote slice boundaries. Aliquots contain ∼ 125 grains each of the 125-250 µm fraction. Top and bottom of the rock indicated for oriented samples. The horizontal lines indicate the plateau age ± 1σ. On the right, black dots are pIRIR290 aliquot ages and red hollow circles are CDM weighted mean ages for each slice. The y-axes are plotted on a log scale.
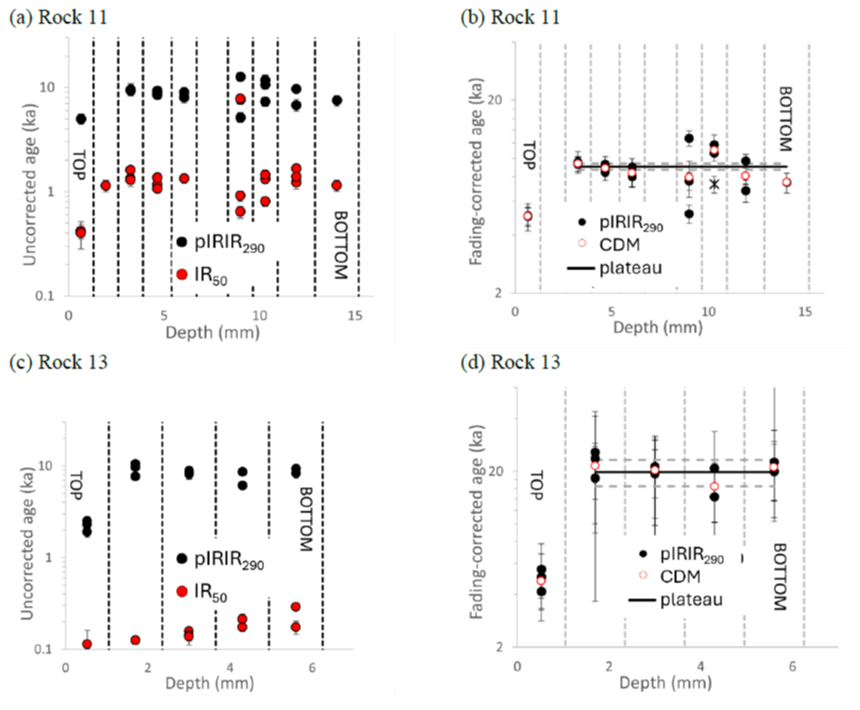
Figure 12Uncorrected (left) and fading-corrected (right) luminescence-depth profiles for volcanic Rocks 11 and 13 from CA21P1. Vertical dashed lines denote slice boundaries. Aliquots contain ∼ 125–165 grains each of the 125–250 µm fraction. The horizontal lines indicate the plateau age ± 1 σ. Black dots are pIRIR290 aliquot ages, X symbols are rejected aliquots, and red hollow circles are CDM weighted mean ages for each slice. The y-axes are plotted on a log scale.
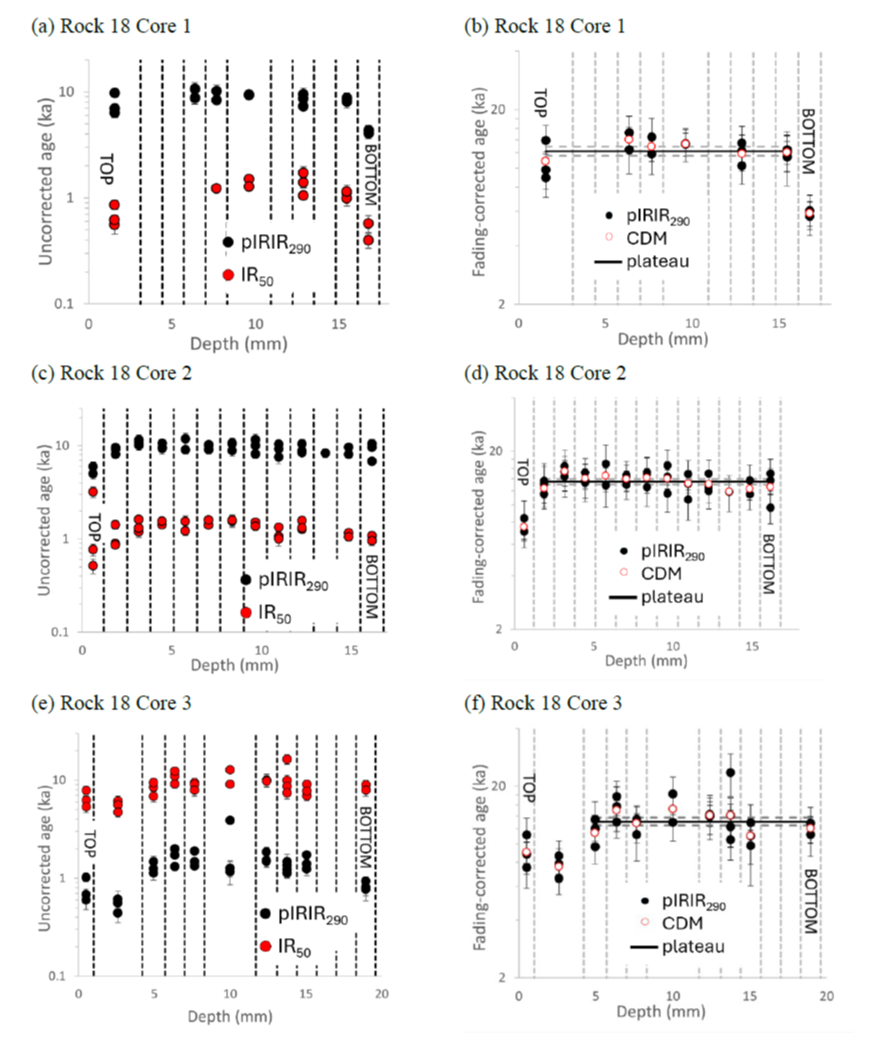
Figure 13Uncorrected (left) and fading-corrected (right) luminescence-depth profiles for 3 cores from Rock 18 from CA21P1. Vertical dashed lines denote slice boundaries. Aliquots contain ∼ 125 grains each of the 180–250 µm fraction. Top and bottom of the rock indicated. The horizontal lines indicate the plateau age ± 1 σ. On the right, black dots are pIRIR290 aliquot ages and red hollow circles are CDM weighted mean ages for each slice. The y-axes are plotted on a log scale.
Attempts to apply a light bleaching model to the luminescence signal depth profiles to predict pre-burial profile shapes (e.g., Freiesleben et al., 2015; Khasawneh et al., 2019) were unsuccessful; due to the scatter in the data and relative paucity of data points from each rock, model results were overly sensitive to parameter starting values. Therefore, plateaus were detected in the data using the statistical test for homogeneity of Galbraith (2003) following the approach of Gliganic et al. (2021). Using this approach, we identified statistically consistent populations of pIRIR290 ages within each slice and rejected outlying values. Then slice ages in each depth profile (each calculated using CDM) were systematically tested against each other to identify plateaus within each age-depth profile (Figs. 11–13). Plateau ages were then calculated by applying CDM to all statistically consistent groups of ages (Table 6).
4.4.7 Dremeled rock surface age results
Weighted mean pIRIR290 ages for the dremeled outer ∼ 1 mm layer of each volcanic rock (32–63 µm grain size fraction) are summarized in Table 6 and Fig. 14a. The pIRIR290 fading-corrected ages range from ∼ 3 to ∼ 17 ka, where all rocks except for Rock 13 dates to the mid-late Holocene between ∼ 3 and 6 ka. The CDM weighted mean of all volcanic rock surface ages, excluding the low-precision, high outlying value from Rock 13, is 3.7 ± 0.4 ka.
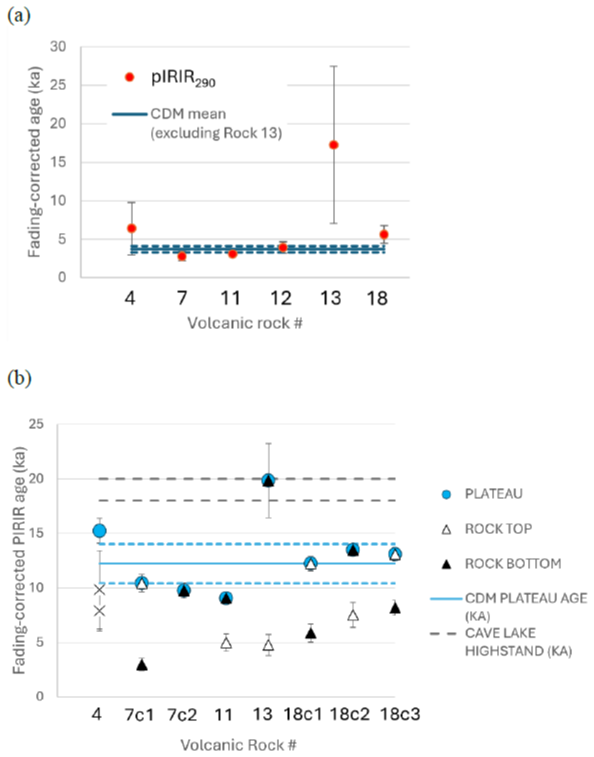
Figure 14(a) Weighted mean ages of CA21P1 samples calculated from 32–63 µm polymineral grains extracted from the outer ∼ 1 mm of the rock surfaces using a Dremel tool. Each rock age (red dot) is the weighted mean of 5 to 24 multi-grain aliquot ages. The horizontal lines mark the CDM weighted mean (3.7 ± 0.4 ka) of all rock surface ages at ±1σ excluding the low-precision, high outlying value from Rock 13. (b) pIRIR290 rock surface slice ages and plateau ages from CA21P1 samples. Rock 4 was not oriented, so both surface slices are shown as “x” symbols. The top and/or bottom of cores 7c1, 7c2, 11, 13, 18c1, 18c2 and 18c3 are consistent with the plateau age. The 180–250 µm polymineral fraction was measured using 3 mm diameter aliquots (∼ 125 grains per aliquot). Ages are the CDM weighted mean of the measured multi-grain aliquot ages. The blue horizontal lines mark the CDM weighted mean age of all plateau ages ±1σ; this is 12.2±0.9 ka. The horizontal gray dashed lines show the maximum and minimum expected ages of the Cave Lake highstand.
4.4.8 Age-depth profile results
Rock surface ages were calculated from the outer-most slices of each rock core (125–250 µm sized grains from the top, bottom or sides of the rocks), as well as from statistically consistent slice ages (the plateaus) within each age-depth profile (Table 6, Fig. 14b). Again, fading-corrected surface slice ages vary widely with pIRIR290 ages ranging from ∼ 3 to ∼ 20 ka. The rock surface slice ages are generally equal to, or older than the dremeled surface ages discussed in Section 4.4.7 above, suggesting that rock slices may contain unbleached, residual signal as a result of irregular cut rock surfaces. Rock top and bottom age values show significant variability within and between rocks suggesting that sun exposure was not uniform across rock surfaces prior to burial and/or the rocks experienced phases of re-mobilization prior to final emplacement.
Weighted mean ages calculated from age-depth profile plateaus range from ∼ 9 to ∼ 20 ka and show consistency from core to core in Rocks 7 and 18 where more than one core was taken (Table 6, Fig. 14b). The CDM weighted mean age of all plateau ages is 12.2 ± 0.9 ka.
Luminescence dating approaches applied in this study were highly dependent on the lithology of the rocks available to date. Gravel lithologies in pluvial lake beach ridges are dominated by the lithology of the closest bedrock outcrops that provided rock for shoreline transport. These materials vary significantly from site to site and from valley to valley. In our study this necessitated the development of two very different dating approaches – one for limestone in Coal Valley and one for volcanic rock in Cave Valley. The results obtained from each site are discussed below.
5.1 Coal Valley
5.1.1 Significance of limestone rock ages
Luminescence ages derived from limestone gravels from Coal Valley varied significantly from rock to rock and even showed dependence on measured grain size within the same rock (compare ages for grain size fractions 63–90 µm and 90–125 µm for Rock 2, Table 5). This variability is likely attributed to non-unform bleaching of rock surfaces, variability of rock light transmission properties (Ou et al., 2018), differences in chemical or physical weathering, as well as beta microdosimetry effects that result from non-uniform rock composition (Meyer et al., 2018).
Calculated CDM ages were most likely to agree with the independent age control, while ADM ages tended to overestimate the expected age (Table 5, Fig. 7). The congruency between the CDM ages of Rocks 2 (90–125 µm fraction), 18 and 10 suggest that their surfaces were reasonably well bleached. The anomalously old age obtained from the 63–90 µm grain size fraction from Rock 2 is more difficult to reconcile but may be indicative of incomplete bleaching of finer grains that were more susceptible to clumping than their coarser grain counterparts. MDM ages straddle the radiocarbon age estimate of the deposit, again with the 63–90 µm fraction from Rock 2 yielding the oldest calculated MDM age (Table 5, Fig. 7). MDM ages that appear to post-date the time of beach ridge formation may not be derived from grains inside the limestone at all, but rather, despite our efforts to remove outer carbonate coatings, may be contaminating grains that became cemented onto the limestone surface as part of a pedogenic carbonate coating.
5.1.2 Challenges
The main challenge dating limestone clasts relate to the limited quantity of detrital grains available for dating (Table 4, column 2). Limestone formations in Nevada can vary in their detrital sediment content but are commonly associated with, or interbedded with, sandstones and shales (e.g., Rowley et al., 2017; Hurtubise and Bray, 1988). The concentration of detrital sediment available within limestone rocks for dating varies from location to location, and this necessitates the need for testing for viable luminescence signals from each site, perhaps with some guidance from local geological maps. Quartz signals from polymineral grain extracts exhibited no fast component in any of the limestone gravels tested, so further analysis was restricted to feldspar. Grains that do have an IR signal, however, were typically well suited to SAR, and had moderate fading rates that are relatively easy to correct for, even at the single-grain level.
5.1.3 The single-grain advantage
For limestone gravels, it is preferable to apply the single-grain approach as opposed to measuring larger multi-grain aliquots, primarily because the single-grain approach requires relatively small amounts of material, but also because it produces a high-resolution age distribution for each sample that can be examined for evidence for incomplete bleaching of grains or other sources of scatter. Past research shows that it is common for rocks to experience only partial sun exposure prior to burial on one or more sides (e.g., Meyer et al., 2018; Smith et al., 2023), so single-grain dating, and perhaps the MDM model, should allow us to target grains that are more likely date the most recent bleaching event. However, we must keep in mind that the relationship between single-grain age distribution shapes, overdispersion (OD), rock transport and depositional history, and chemical and physical weathering of limestone rock surfaces, has yet to be examined in detail, and should be the focus of future research.
5.2 Cave Valley
5.2.1 Luminescence signals of volcanic rocks
Luminescence signals suitable for dating are most likely to be found in volcanic rocks that are intermediate to felsic in composition and contain a higher concentration of K-rich feldspars. Such types of rock are common in Lincoln County, with intermediate silicic ash flow tuffs and other tuffaceous sedimentary rocks covering more of Nevada than any other type of rock (Crafford, 2007). Intermediate and felsic volcanic rocks are best represented at site CA21P1 in our study.
5.2.2 Sources of variability in age-depth profiles
Volcanic rock surface ages and age-depth profiles from site CA21P1 suggest heterogeneous light exposure on rock surfaces. The variability in rock surface ages, where clast tops often appear younger or older than clast bottoms, and the variability between age-depth profiles from within the same rock (Table 6, Fig. 14), are consistent with observations made at other sites (e.g., Rades et al., 2018; Souza et al., 2019; Smith et al., 2023) and are indicative of incomplete bleaching of all rock sides prior to burial. Bleaching rates in rocks are dependent on rock surface aspect, light transmission of the rock, daylight spectrum, intensity, and duration of exposure (Ou et al., 2018; Smedley et al., 2021; Furhmann et al., 2022).
Variability in age-depth profiles may also be attributed to rock composition. Rocks that are light in color, and fine-grained, with a homogeneous mineral composition over the scale of analysis, are anticipated to be better and more uniformly bleached than rocks that are dark in color, coarse-grained, and have a heterogeneous composition over the scale of analysis (Ou et al., 2018; Meyer et al., 2018). Heterogeneities in the dose rate field within gravels and near gravel surfaces could also lead to micro-beta dosimetry effects that are not accounted for in our dose rate models.
5.2.3 Evidence of soil accretion after the pluvial lake highstand
The oldest ages of the dataset from Cave Valley approach ∼ 20 ka (Rock 13) (Table 6). This supports the inference that the beach ridge at site CA21P1 formed no earlier than Marine Isotope Stage (MIS) 2. However, an unexpected finding of this study was the large number of anomalously young ages obtained from volcanic gravel surfaces from site CA21P1. Gravel surface ages obtained from pIRIR290 signals suggest that many gravel surfaces were light exposed long after the last pluvial lake highstand in Cave Valley, and even as recently as the late Holocene (Table 6, Fig. 14). Given that our sampling depth at this site was less than 0.5 m below the present-day surface, this must be due, in part, to (i) bioturbation, and possibly (ii) post-burial light exposure of gravels in what were initially open-work gravels near the beach ridge surface after beach ridge formation.
Soils in dust-influenced arid and semi-arid regions of the American west are thought to form by accretionary processes where dust influxes increase soil volume and inflationary strain (McFadden, 2013). In this accretion-inflationary mode of profile development (also known as AIP), dust becomes trapped by vegetation, desert pavement stones, or irregular, rocky surfaces, then translocates down the soil profile thickening the Bt and Bk horizons. Increases in dust flux during the Holocene have been linked to a 20 cm rise in ancient Pleistocene desert pavement surfaces on lava flows in the Cima Volcanic Field in the Mohave Desert, California (McFadden et al., 1987). Thermoluminescence (TL) ages of ∼ 12–13.5 and 5 ka were obtained from Bwk and Av soil horizons, respectively, that are situated on 560 ka lava flows. These ages were attributed to the continuous supply of aeolian materials to the soils during the Late Pleistocene, with an increase in dust flux during the early to middle Holocene (McFadden et al., 1998).
Lake level reconstructions in our study area suggest that Cave Lake receded from its highstand ∼ 18 000–20 000 years ago (Duke and King, 2014), consistent with the plateau age of Rock 13 (Fig. 14). Initially these gravels may have been open-work gravels where large pore spaces allowed light penetration to some depth below the beach surface, allowing for the bleaching of near-surface rocks after ∼ 18 000 years ago. As the climate conditions became more arid from 14 600 to 12 900 years ago (Rhode and Adams, 2016), and again after the Younger Dryas, dust accumulation would have facilitated the establishment of soil and shrubland vegetation (t1 in Fig. 15). Root penetration and burrowing animals would have created a zone of bioturbation below the surface. Given that roots of Great Basin desertscrub species (Spaulding, 1985) can extend several feet below the surface to access water at depth, this depth of disturbance likely extended up to a meter or more and likely pushed gravels at the surface down to the depth of sampling. Plateau ages from inside Rocks 4, 7, 11 and 18 (Fig. 14b) coincide with the desiccation of lakes in the region between ∼ 14 600 and ∼ 9400 years ago (Rhode and Adams, 2016; Duke and Young, 2018) and may record burial of these gravels by newly exposed and wind-transported playa silt and sand. The mid-late Holocene ages derived from rock surfaces (Fig. 14a and b) likely record more recent temporary heterogeneous light exposure of the rocks as they are re-mobilised in the bioturbation zone of the soil.
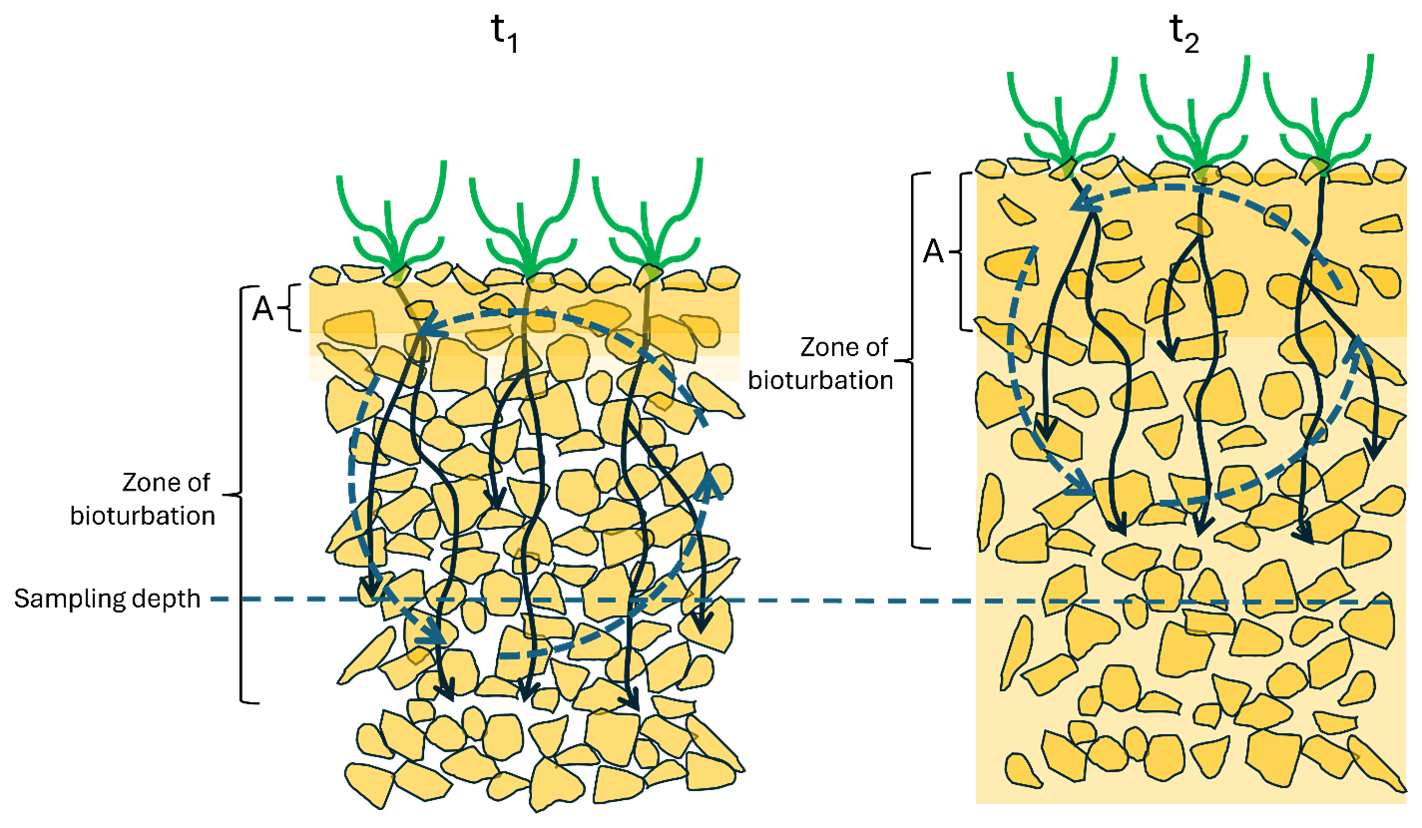
Figure 15Schematic illustrating the accretionary-inflationary mode of soil profile development on the beach ridge at site CA21P1. Initial establishment of an A soil horizon after beach ridge abandonment in the late Pleistocene-early Holocene is shown as “t1”. Increases in dust influx ∼ 8–4 ka (t2) cause accretion of the A horizon and translocation of fines to depth. As the soil surface rises, the zone of bioturbation rises preventing surface clasts reaching the depth of sampling after ∼ 3 ka.
During the Middle Holocene Drought (∼ 8–4 ka) (Wriston, 2009; Steponaitis et al., 2015), dust influx to the beach ridge soils likely intensified (cf. McFadden et al., 1992). We infer that accretion-inflationary processes contributed to volume expansion of the soil raising its surface above the original Late-Pleistocene open-work gravel surface level (t2, Fig. 15). This implies that gravel clasts sampled at ∼ 38–44 cm depth in this study, if not bioturbated, would have been several centimetres closer to the original open-work gravel surface prior to accretion. The youngest volcanic rock surface ages cluster between ∼ 2.8 and ∼ 6.4 ka. This suggests that the number of surface gravel clasts pushed down to the depth of sampling decreased substantially after ∼ 3 ka as the A horizon thickened and the substrate became less permeable. This implies that by the late-Holocene the soil surface and the zone of subsurface bioturbation had risen above the level of sampling (t2, Fig. 15).
5.2.4 Significance of volcanic rock plateau ages
All fading-corrected pIRIR290 plateau ages from volcanic rocks from site CA21P1 are finite, with no evidence of saturation (Figs. 11–13 and 14b). In previous studies where cobble-sized rocks are dated, the highest plateau identified near the centre of the rock luminescence-depth profile is typically interpreted to record “saturation” (Fig. 1). “Saturation” refers to the area where bleaching has never occurred, and the luminescence signal has reached an equilibrium, where signal loss due to fading (for feldspars) is in equilibrium with signal gained via irradiation. However, in some cases, if the rocks dated are small enough, and if light exposure is long enough, light can penetrate the entire thickness of the rock, leading to a flattening of the plateau. Lehmann et al. (2018) showed that the inflection point of the IR50 luminescence-depth curve migrates to 3–4 mm depth after 20 to 140 years of sun exposure for coarse grained orthogneiss. Ou et al. (2018) found that after 91 days of sun exposure, the pIRIR225 signal was bleached to half of its initial intensity at a depth of ∼ 1.8 mm for a dark grey, fine grained indurated sedimentary greywacke. Furhmann et al. (2022) depleted the pIRIR225 signal to a depth of over 2 mm in granite exposed to the sun for 108 d. Evidence for internal bleaching of IR50 signals in rocks of thicknesses ranging from ∼ 15 to ∼ 23 mm has been shown by Souza et al. (2019) for samples collected from a modern beach and a ∼ 2000-year-old sandy beach ridge in Denmark. pIRIR signals are known to bleach at a slower rate than IR50 signals, but nonetheless, this begs the question as to whether the Cave Valley beach gravel rocks are small enough such that the pIRIR290 signal was completely depleted throughout their thickness in the swash or near-shore zone of the lake environment prior to burial.
Despite the susceptibility of gravels to re-working in the soil zone, the age range of our rock plateau ages suggests that pIRIR290 signals inside gravel rocks may serve as more reliable geochronometers for the time of beach ridge formation and initial soil development at the late-Pleistocene-Holocene transition than the signals measured at the rock surfaces. Such a scenario could occur if gravels in the swash zone of the lake, or emplaced at or near the surface of an abandoned beach ridge, were sun-exposed for long enough periods to completely deplete their pIRIR290 signals throughout their thickness prior to final burial (cf. Souza et al., 2019). In this scenario, the pIRIR290 signal that accumulates at the centre of the gravels during burial may be less prone to depletion during subsequent brief periods of sun exposure during bioturbation events, which preferentially depletes the signal near the surface of exposed rock surfaces.
5.2.5 The impact of soil development
The ∼ 18 000–20 000 year old Cave Lake highstand is thought to have preceded the Lake Coal highstand 15 873–16 281 cal yr BP (Duke and King, 2014; Wriston and Adams, 2020), however despite this, most Cave Lake rock surface and internal plateau luminescence ages post-date the highstand of Lake Coal as well as the model-equivalent rock surface ages from the Coal Valley beach ridge (Tables 5 and 6). This is likely due in part to the depth of sampling; at Cave Valley the sampling depth (< 0.5 m) was less than that at Coal Valley (1 m) and clearly within the zone of the A/B soil horizon, thus increasing our chances of sampling bioturbated material. When sampling pluvial lake gravel beach ridges, efforts should be made to sample at depths of ∼ 1 m or greater. Natural exposures of beach ridge sediments such as those sampled at Coal Valley are rare in the Great Basin, and so deeper sampling may require the use of mechanical equipment.
Dose rates for Cave Valley were calculated assuming that the present geochemistry of the samples have been consistent during the burial history of the beach ridge. This assumption is problematic given the shallow (< 0.5 m) sampling depth within soils that would have developed shortly after beach ridge abandonment and continued to evolve during the Holocene. Accretion-inflationary soil profiles are dynamic, characterized by cumulic growth as well as pedogenic modification. As the soil develops, it increasingly influences infiltration rates, depths of water movement, and thus, rates and processes of carbonate translocation and accumulation for the entire soil (McFadden et al., 1992, 1998). Future luminescence sampling should ideally focus on primary beach ridge sediments below any soil development until pedogenic effects on time-averaged dose rates are better understood.
This study examined the feasibility of dating pluvial lake beach ridges using rock surface dating techniques. The geology of the Great Basin is dominated by rock lithologies that pose challenges for luminescence dating and the lack of natural exposures make sampling below soils and zones of bioturbation difficult. Tests and measurements from two prominent rock types, limestone and volcanic rock, show promise. Select limestone clasts were found to have adequate quantities of detrital sediment preserved near their surfaces for dating. Polymineral extracts from limestones exhibited IR50 signals with low to moderate fading rates and properties suited to SAR, and ages calculated using the central dose model tend to agree with the independent age control. Volcanic clasts exhibited IR50 and pIRIR signals with high fading rates and could only be dated using a high-temperature pIRIR290 signal with a fading correction. However, comparisons between age-depth profile plateau ages calculated from inside volcanic rocks and independent age control suggests that pIRIR290 signals preserved in the rock sub-surface may record the time of beach ridge formation or initial soil development during the late-Pleistocene-Holocene transition.
Comparisons between rock age estimates and independent age control show that both limestone and volcanic gravel-sized clasts are commonly incompletely bleached but also can yield some ages that post-date the time of the pluvial lake highstand. Anomalously young ages from limestones may result from contamination of polymineral extracts with grains that have adhered to the limestone surface in pedogenic carbonate coatings. Young ages obtained from volcanic rocks suggest that most rock surfaces have been exposed to light long after the pluvial lake highstand, likely because of bioturbation. The youngest volcanic rock surface ages provide a constraint on the timing of pedogenisis and reworking at the sampling depth and perhaps record a climatically driven phase of soil development.
Rock surface luminescence dating techniques for pluvial lake beach ridges in the Great Basin should be further developed to build on this work. We recommend preliminary testing of the optical properties of local rock lithologies comprising the site, followed by mechanical excavation to depths below zones of pedogenesis and bioturbation. Experiments should be designed to examine sample collection and preparation methods, gravel bleaching processes in pluvial lake environments and the impact of soil development and bioturbation on sampled sites.
Data generated during the course of this project is available upon request.
The supplement related to this article is available online at https://doi.org/10.5194/gchron-8-223-2026-supplement.
Project conceptualization, fieldwork and sample collection was conducted by CMN and TW. Experiments were designed by CMN with contributions from GTHJ and SH. All experiments and data analyses were conducted by CMN. The manuscript was prepared by CMN with contributions from all authors.
The contact author has declared that none of the authors has any competing interests.
Publisher's note: Copernicus Publications remains neutral with regard to jurisdictional claims made in the text, published maps, institutional affiliations, or any other geographical representation in this paper. The authors bear the ultimate responsibility for providing appropriate place names. Views expressed in the text are those of the authors and do not necessarily reflect the views of the publisher.
Special thanks to Helena Middleton, Saige Howard, Mojtaba Elahifard, Sara Zeitoun, Devon Ardesco and Niko Mastik for help preparing the samples. We thank Dr. Kenneth D. Adams for his geomorphological insights and age controls in Coal Valley and R. Jake Hickerson, the BLM Basin-and-Range National Monument Archaeologist, who facilitated and encouraged our work.
This work was supported by funding from the Lincoln County Archaeology Initiative (Round 12) to TW and CMN, NSF Laboratory Technician Support (grant no. 1914566) and support from Everick Heritage Pty Ltd. to CMN.
This paper was edited by Sumiko Tsukamoto and reviewed by two anonymous referees.
Adams, K. D. and Rhodes, E. J.: Late Pleistocene to present lake-level fluctuations and Pyramid and Winnemucca lakes, Nevada, USA, Quaternary Res., 92, 146–164, https://doi.org/10.1017/qua.2018.134, 2019.
Adams, K. D. and Wesnousky, S. G.: Shoreline processes and the age of the Lake Lahontan highstand in the Jessup embayment, Nevada, Geol. Soc. Am. Bull., 110, 1318–1223, https://doi.org/10.1130/0016-7606(1998)110<1318:SPATAO>2.3.CO;2, 1998.
Adams, K. D., Goebel, T., Graf, K., Smith, G. M., Camp, A. J., Briggs, R. W, and Rhode, D.: Late Pleistocene and early Holocene lake-level fluctuations in the Lahontan Basin, Nevada: Implications for the distribution of archaeological sites, Geoarchaeology, 23, 608–643, https://doi.org/10.1002/gea.20237, 2008.
Ageby, L., Brill, D., Angelucci, D. E., Brückner, H., and Klasen, N.: Investigating optical dating of carbonate-rich cobbles from a river terrace: A pilot study from the Mula Valley, Spain, Radiat. Meas., 166, 106962, https://doi.org/10.1016/j.radmeas.2023.106962, 2023.
Ageby, L., Shanmugavela, J., Jain, M., Murray, A. S., and Rades, E. F.: Towards the optically stimulated luminescence dating of unheated flint, Quat. Geochronol., 79, 101471, https://doi.org/10.1016/j.quageo.2023.101471, 2024.
Aitken, M. J.: Optical dating: a non-specialist review, Quaternary Sci. Rev., 13, 503–508, https://doi.org/10.1016/0277-3791(94)90066-3, 1994.
Aitken, M. J.: An Introduction in Optical Dating: The Dating of Quaternary Sediments by the Use of Photon-Stimulated Luminescence, Oxford, UK, Oxford University Press, 267 pp., https://doi.org/10.1093/oso/9780198540922.001.0001, 1998.
Arnold, L. J. and Roberts, R. G.: Stochastic modelling of multi-grain equivalent dose (De) distributions: Implications for OSL dating of sediment mixtures, Quat. Geochronol., 4, 204–230, https://doi.org/10.1016/j.quageo.2008.12.001, 2009.
Auclair, M., Lamothe, M., and Huot, S.: Measurement of anomalous fading for feldspar IRSL using SAR, Radiat. Meas., 37, 487–492, https://doi.org/10.1016/S1350-4487(03)00018-0, 2003.
Berger, G. W., Doran, P. T., and Thomsen, K. J.: Micro-hole and multigrain quartz luminescence dating of Paleodeltas at Lake Fryxell, McMurdo Dry Valleys (Antarctica), and relevance for lake history, Quat. Geochronol., 18, 119–134, https://doi.org/10.1016/j.quageo.2013.04.002, 2013.
Buylaert, J. P., Murray, A. S., Thomsen, K. J., and Jain, M.: Testing the potential of an elevated temperature IRSL signal from K-feldspar, Radiat. Meas., 44, 560–565, https://doi.org/10.1016/j.radmeas.2009.02.007, 2009.
Crafford, A. E. J.: Geologic Map of Nevada, U.S. Geological Survey Data Series 249, 1 CD-ROM, 46 pp., 1 plate, https://pubs.usgs.gov/ds/2007/249/ (last access: January 2025), 2007.
Dickinson, W. R.: Geotectonic evolution of the Great Basin, Geosphere 2, 353–368, https://doi.org/10.1130/GES00054.1, 2006.
Duke, D. and King, J.: A GIS model for predicting wetland habitat in the Great Basin at the Pleistocene-Holocene transition and implications for Paleoamerican archaeology, J. Archaeol. Sci., 49, 276–291, https://doi.org/10.1016/j.jas.2014.05.012, 2014.
Duke, D. and Young, D. C.: A historic context for Paleoamerican archaeology, Bureau of Land Management Report No. 8111 CRR NV 040-15-2113, Lincoln County Archaeological Initiative, Round 7, 2018.
Durcan, J. A., King, G. E., and Duller, G. A. T.: DRAC: Dose rate and age calculator for trapped charge dating, Quat. Geochronol., 28, 54–61, https://doi.org/10.1016/j.quageo.2015.03.012, 2015.
Feathers, J., More, G. M., Quinteros, P. S., and Burkholder, J. E.: IRSL dating of rocks and sediments from desert geoglyphs in coastal Peru, Quat. Geochronol., 49, 177–183, https://doi.org/10.1016/j.quageo.2018.07.009, 2019.
Freiesleben, T., Sohbati, R., Murray, A., Jain, M., Khasawneh, S., Hvidt, S., and Jakobsen, B.: Mathematical model quantifies multiple daylight exposure and burial events for rock surfaces using luminescence dating, Radiat. Meas., 81, 16–22, https://doi.org/10.1016/j.radmeas.2015.02.004, 2015.
Freiesleben, T. H., Thomsen, K. J., and Jain, M.: Novel luminescence kinetic models for rock surface exposure dating, Radiat. Meas. 160, 106877, https://doi.org/10.1016/j.radmeas.2022.106877, 2023.
Furhmann, S., Meyer, M. C., Gliganic, L. A., and Obleitner, F.: Testing the effects of aspect and total insolation on luminescence depth profiles for rock surface exposure dating, Radiat. Meas. 153, 106732, https://doi.org/10.1016/j.radmeas.2022.106732, 2022.
Galbraith, R.: A simple homogeneity test for estimates of dose obtained using OSL, Ancient TL, 21, 75–77, 2003.
Galbraith, R. F. and Roberts, R. G.: Statistical aspects of equivalent dose and error calculation and display in OSL dating: An overview and some recommendations, Quat. Geochronol., 11, 1–27, https://doi.org/10.1016/j.quageo.2012.04.020, 2012.
Galbraith, R. F., Roberts, R. G., Laslett, G. M., Yoshida, H., and Olley, J. M.: Optical dating of single and multiple grains of quartz from Jinmium rock shelter, northern Australia: Part I, experimental design and statistical models, Archaeometry, 41, 339–364, 1999.
Gliganic, L. A., Meyer, M. C., May, J.-H., Aldenderfer, M. S., and Tropper, P.: Direct dating of lithic surface artifacts using luminescence, Science Advances, 7, eabb3424, https://doi.org/10.1126/sciadv.abb3424, 2021.
Gliganic, L. G., Meyer, M. C., Sohbati, R., Jain, M., and Barrett, S.: OSL surface exposure dating of a lithic quarry in Tibet: Laboratory validation and application, Quaternary Geochronol., 49, 199–204, https://doi.org/10.1016/j.quageo.2018.04.012, 2019.
Greilich, S., Glasmacher, U. A., and Wagner, G. A.: Optical dating of granitic stone surfaces, Archaeometry, 47, 645–665, https://doi.org/10.1111/j.1475-4754.2005.00224.x, 2005.
Guérin, G., Christophe, C., Philippe, A., Murray, A. S., Thomsen, K. J., Tribolo, C., Urbanova, P., Jain, M., Guibert, P., Mercier, N., Kreutzer, S., and Lahaye, C.: Absorbed dose, equivalent dose, measured dose rates, and implications for OSL age estimates: Introducing the Average Dose Model, Quat. Geochronol., 41, 163–173, https://doi.org/10.1016/j.quageo.2017.04.002, 2017.
Habermann, J., Schilles, T., Kalchgruber, R., and Wagner, G. A.: Steps toward surface dating using luminescence, Radiat. Meas., 32, 847–851, 2000.
Huntley, D. J. and Lamothe, M.: Ubiquity in anomalous fading in K-feldspars and the measurement and correction for it in optical dating, Can. J. Earth Sci., 38, 1093–1106, https://doi.org/10.1139/e01-013, 2001.
Huntley, D. J., Godfrey-Smith, D. I., and Thewalt, M. L. W.: Optical dating of sediments, Nature, 313, 105–107, https://doi.org/10.1038/313105a0, 1985.
Hurtubise, D. O. and du Bray, E. A.: Stratigraphy and structure of the Seaman Range and Fox Mountain, Lincoln and Nye Counties, Nevada, US Geological Survey Bulletin 1988-B, 31 pp., https://doi.org/10.3133/b1988B, 1988.
Ivanovich, M. and Harmon, R. S.: Uranium-Series Disequilibrium (2nd ed.), Oxford: Clarendon Press, https://doi.org/10.1007/1-4020-4496-8_333, 1992.
Jenkins, G. T. H., Duller, G. A. T., Roberts, H. M., Chiverrell, R. C., and Glasser, N. F.: A new approach for luminescence dating glaciofluvial deposits – High precision optical dating of cobbles, Quaternary Sci. Rev. 192, 263–273, https://doi.org/10.1016/j.quascirev.2018.05.036, 2018.
Khasawneh, S., Murray, A., and Abudanah, F.: A first radiometric chronology for the Khat Shebib megalithic structure in Jordan using the luminescence dating of rock surfaces, Quat. Geochronol., 49, 205–210, https://doi.org/10.1016/j.quageo.2018.02.007, 2019.
King, G. E., Robinson, R. A. J., and Finch, A. A.: Towards successful OSL sampling strategies in glacial environments: deciphering the influence of depositional processes on bleaching of modern glacial sediments from Jostedalen, Southern Norway, Quaternary Sci. Rev., 89, 94–107, https://doi.org/10.1016/j.quascirev.2014.02.001, 2014.
Lai, Z-P., Arnold, L., Stokes, S., Bailey, R., and Fattahi, M.: Detection of far-red IRSL from loess, Ancient TL, 20, 41–46, https://doi.org/10.26034/la.atl.2002.346, 2002.
Lehmann, B., Valla, P. G., King, G. E., and Herman, F.: Investigation of OSL surface exposure dating to reconstruct post-LIA glacier fluctuations in the French Alps (Mer de Glace, Mont Blanc massif), Quat. Geochronol., 44, 63–74, https://doi.org/10.1016/j.quageo.2017.12.002, 2018.
Li, B. and Li, S.-H.: Luminescence dating of K-feldspar from sediments: A protocol without anomalous fading correction, Quaternary Geochronol., 6, 468–479, https://doi.org/10.1016/j.quageo.2011.05.001, 2011.
Lian, O. B. and Roberts, R. G.: Dating the Quaternary: progress in luminescence dating of sediments, Quaternary Sci. Rev., 25, 2449–2468, https://doi.org/10.1016/j.quascirev.2005.11.013, 2006.
Lillquist, K. D.: Late Quaternary Lake Franklin: Lacustrine chronology, coastal geomorphology, and hydro-isostatic deflection in Ruby Valley and northern Butte Valley, Nevada, PhD thesis, Department of Geography, University of Utah. 185 pp., 1994.
Liritzis, I.: Surface dating by luminescence: An overview, Geochronometria, 38, 292–302, https://doi.org/10.2478/s13386-011-0032-7, 2011.
Liritzis, I., Sideris, C., Vafiadou, A., and Mitsis, J.: Mineralogical, petrological and radioactivity aspects of some building material from Egyptian Old Kingdom monuments, J. Cult. Herit., 9, 1–13, https://doi.org/10.1016/j.culher.2007.03.009, 2008.
Liritzis, I., Drivaliari, N., Polymeris, G. S., and Katagas, Ch: New quartz technique for OSL dating of limestones, Mediterr. Archaeol. Ar., 10, 81–87, 2010.
Liritzis, I., Singhvi, A. K., Feathers, J. K., Wagner, G. A., Kadereit, A., Zacharias, N., and Li., S.-H.: Luminescence Dating in Archaeology, Anthropology, and Geoarchaeology – An Overview, Springer Briefs in Earth System Sciences, 70 pp., https://doi.org/10.1007/978-3-319-00170-8, 2013.
Maßon, L. A. E., Riedesel, S., Opitz, S., Zander, A., Bell, A., Cieszynski, H., and Reimann, T.: How much K is OK? Evaluating different methods for K-concentration determination and the effect of the internal K concentration on feldspar luminescence dating, Geochronology, 7, 475–492, https://doi.org/10.5194/gchron-7-475-2025, 2025.
Mayya, Y. S., Morthekai, P., Murari, M. K., and Singhvi, A. K.: Towards quantifying beta microdosimetric effects in single-grain quartz dose distribution, Radiat. Meas., 41, 1032–1039, https://doi.org/10.1016/j.radmeas.2006.08.004, 2006.
McFadden, L. D.: Strongly dust-influenced soils and what they tell us about landscape dynamics in vegetated arid lands of the southwestern United States, in: The Web of Geological Sciences: Advances, Impacts, and Interactions, edited by: Bickford, M. E., Geol. S. Am. S., 500, 501–532, https://doi.org/10.1130/2013.2500(15), 2013.
McFadden, L. D., Wells, S. G., and Jercinovich, M. J.: Influences of eolian and pedogenic processes on the origin and evolution of desert pavements, Geology, 54, 504–508, https://doi.org/10.1130/0091-7613(1987)15<504:IOEAPP>2.0.CO;2, 1987.
McFadden, L. D., Wells, S. G., Brown, W. J., and Enzel, Y.: Soil genesis on beach ridges of pluvial Lake Mojave: Implications for Holocene lacustrine and eolian events in the Mojave Desert, Southern California, Catena, 19, 77–97, https://doi.org/10.1016/0341-8162(92)90018-7, 1992.
McFadden, L. D., McDonald, E. V., Wells, S. G., Anderson, K., Quade, J., and Forman, S. L.: The vesicular layer and carbonate collars of desert soils and pavements: formation, age and relation to climate change, Geomorphology, 24, 101–145, https://doi.org/10.1016/S0169-555X(97)00095-0, 1998.
Meyer, M. C., Gliganic, L. A., Jain, M., Sohbati, R., and Schmidmair, D.: Lithological controls on light penetration into rock surfaces – Implications for OSL and IRSL surface exposure dating, Radiat. Meas., 120, 298–304, https://doi.org/10.1016/j.radmeas.2018.03.004, 2018.
Mifflin, M. D. and Wheat, M. M.: Pluvial Lakes and Estimated Pluvial Climates of Nevada. Nevada Bureau of Mines and Geology Bulletin 94, Mackay School of Mines, University of Nevada, Reno, https://pubs.nbmg.unr.edu/Pluvial-lakes-and-estimated-plu-p/b094.htm (last access: January 2025), 1979.
Munroe, J. S. and Laabs, B. J. C.: Temporal correspondence between pluvial lake highstands in the southwestern US and Heinrich Event 1, J. Quaternary Sci., 28, 49–58, https://doi.org/10.1002/jqs.2586, 2013.
Murray, A. S.: Developments in optically stimulated luminescence and photo-transferred thermoluminescence dating of young sediments: Application to a 2000-year sequence of flood deposits, Geochim. Cosmochim. Ac., 60, 565–576, https://doi.org/10.1016/0016-7037(95)00418-1, 1996.
Murray, A. S., Buylaert, J.-P., Thomsen, K. J., and Jain, M.: The effect of preheating on the IRSL signal from feldspar, Radiat. Meas., 44, 554–559, https://doi.org/10.1016/j.radmeas.2009.02.004, 2009.
Murray, A. S. and Wintle, A. G.: Luminescence dating of quartz using an improved single-aliquot regenerative-dose protocol, Radiat. Meas., 32, 57–73, https://doi.org/10.1016/S1350-4487(99)00253-X, 2000.
Murray, A. S., Martin, R., Johnston, A., and Martin, P.: Analysis for naturally occurring radionuclides at environmental concentrations by gamma spectrometry, J. Radioan. Nucl. Ch. Ar., 115, 263–288, https://doi.org/10.1007/BF02037443, 1987.
Murray, A., Buylaert, J.-P., and Thiel, C.: A luminescence dating intercomparison based on a Danish beach-ridge sand, Radiat. Meas., 81, 32–38, https://doi.org/10.1016/j.radmeas.2015.02.012, 2015.
National Cooperative Soil Survey (NCSS): Web Soil Survey, https://websoilsurvey.sc.egov.usda.gov/App/WebSoilSurvey.aspx, last access: March 2025.
Neudorf, C. M., Lian, O. B., Walker, I. J., Shugar, D. H., Eamer, J. B. R., and Griffin, L. C. M.: Toward a luminescence chronology for coastal dune and beach deposits on Calvert Island, British Columbia central coast, Canada, Quat. Geochronol., 30, 275–281, https://doi.org/10.1016/j.quageo.2014.12.004, 2015.
Ou, X. J., Roberts, H. M., Duller, G. A. T., Gunn, M. D., and Perkins, W. T.: Attenuation of light in different rock types and implications for rock surface luminescence dating, Radiat. Meas., 120, 305–311, https://doi.org/10.1016/j.radmeas.2018.06.027, 2018.
Owen, L. A., Bright, J., Finkel, R. C., Jaiswal, M. K., Kaufman, D. S., Mahan, S., Radtke, U., Schneider, J. S., Sharp, W., Singhvi, A. K., and Warren, C. N.: Numerical dating of a Late Quaternary spit-shoreline complex at the northern end of Silver Lake playa, Mojave Desert, California: A comparison of the applicability of radiocarbon, luminescence, terrestrial cosmogenic nuclide, electron spin resonance, U-series and amino acid racemization methods, Quatern. Int., 166, 87–110, https://doi.org/10.1016/j.quaint.2007.01.001, 2007.
Pigati, J. S., Miller, D. M., Bright, J., Mahan, S. A., Nekola, J. C., and Paces, J. B.: Radiocarbon Dating of Small Terrestrial Gastropods in North America, Quat. Geochronol., 5, 519–532, https://doi.org/10.1016/j.quageo.2010.01.001, 2010.
Prescott, J. R. and Habermehl, M. A.: Luminescence dating of spring mound deposits in the southwestern Great Artesian Basin, northern South Australia, Aust. J. Earth. Sci., 55, https://doi.org/10.1080/08120090701689340, 167–181, 2008.
Prescott, J. R. and Hutton, J. T.: Cosmic ray contributions to dose rates for luminescence and ESR dating: large depths and long-term time variations, Radiat. Meas., 23, 497–500, https://doi.org/10.1016/1350-4487(94)90086-8, 1994.
Rades, E. F., Sohbati, R., Lüthgens, C., Jain, M., and Murray, A. S.: First luminescence-depth profiles from boulders from moraine deposits: Insights into glaciation chronology and transport dynamics in Malta valley, Austria, Radiat. Meas., 120, 281–289, https://doi.org/10.1016/j.radmeas.2018.08.011, 2018.
Rasmussen, S. O., Andersen, K. K., Svensson, A. M., Steffensen, J. P., Vinther, B. M., Clausen, H. B., Siggaard-Andersen, M.-L., Johnsen, S. J., Larsen, L. B., Dahl-Jensen, D., Bigler, M., Röthlisberger, R., Fischer, H., Goto-Azuma, K., Hansson, M. E., and Ruth, U.: A new Greenland ice core chronology for the last glacial termination, J. Geophys. Res., 111, D06102, https://doi.org/10.1029/2005JD006079, 2006.
Redwine, J. R., Burke, R. M., Reheis, M. C., Bowers, R. J., Bright, J., Kaufman, D. S., and Forester, R. M.: Middle and late Pleistocene pluvial history of Newark Valley, central Nevada, USA, Geol. S. Am. S., 536, 357–397, https://doi.org/10.1130/2019.2536(18), 2020.
Reheis, M. C., Adams, K. D., Oviatt, C. G., and Bacon, S. N.: Pluvial lakes in the Great Basin of the western United States a view from the outcrop, Quaternary Sci. Rev., 97, 33–57, https://doi.org/10.1016/j.quascirev.2014.04.012, 2014.
Reimer P., Austin, W. E. N., Bard, E., Bayliss, A., Blackwell, P. G., Bronk Ramsey C., Butzin, M., Edwards, R. L., Friedrich, M., Grootes, P. M., Guilderson, T. P., Hajdas, I., Heaton T. J., Hogg, A., Kromer, B., Manning S. W., Muscheler, R., Palmer, J. G., Pearson, C., van der Plicht, J., Reim Richards, D. A., Scott E. M., Southon, J. R., Turney, C. S. M., Wacker, L., Adolph, F., Büntgen, U., Fahrni, S., Fogtmann-Schultz, A., Friedrich R., Köhler, P., Kudsk, S., Miyake, F., Olsen, J., Sakamoto, M., Sookdeo, A., and Talamo, S.: The IntCal20 Northern Hemisphere Radiocarbon Age Calibration Curve (0–55 cal kBP), Radiocarbon, 62, 725–757, https://doi.org/10.1017/RDC.2020.41, 2020.
Rhode, D. and Adams, K. D.: Landscapes in transition: A paeleoenvironmental context for Lincoln County, Nevada, Bureau of Land Management Report No. 8111 CRR NV 040-16-2140, Caliente Field Office, Caliente, NV, 2016.
Rich, J., Stokes, S., Wood, W., and Bailey, R.: Optical dating of tufa via in situ aeolian sand grains: a case example from the Southern High Plains, USA, Quaternary Sci. Rev., 22, 1145–1152, https://doi.org/10.1016/S0277-3791(03)00021-0, 2003.
Riedesel, S. and Autzen, M.: Beta and gamma dose rate attenuation in rocks and sediment, Radiat. Meas., 133, 106295, https://doi.org/10.1016/j.radmeas.2020.106295, 2020.
Roberts, R. G., Galbraith, R. F., Olley, J. M., Yoshida, H., and Laslett, G. M.: Optical dating of single and multiple grains of quartz from Jinmium Rock Shelter, northern Australia: Part II, Results and implications, Archaeometry, 41, 365–395, https://doi.org/10.1111/j.1475-4754.1999.tb00987.x, 1999.
Roberts, R. G. and Lian, O. B.: Illuminating the past, Nature, 520, 438–439, https://doi.org/10.1038/520438a, 2015.
Rowley, P. D., Dixon, G. L., Mankinen, E. A., Pari, K. T., McPhee, D. K., McKee, E. H., Burns, A. G., Watrus, J. M., Ekren, E. B., Patrick, W. G., and Brandt, J. M.: Geology and Geophysics of White Pine and Lincoln Counties, Nevada, and Adjacent Parts of Nevada and Utah: The Geologic Framework of Regional Groundwater Flow Systems, Nevada Bureau of Mines and Geology Report 56, 146 pp., https://pubs.nbmg.unr.edu/Geol-geophys-White-Pine-Lincoln-p/r056.htm (last access: March 2025), 2017.
Simkins, L. M., DeWitt, R., Simms, A. R., and Briggs, S.: Investigation of optically stimulated luminescence behavior of quartz from crystalline rock surfaces: A look forward, Quat. Geochronol., 36, 161–173, https://doi.org/10.1016/j.quageo.2016.09.002, 2016.
Simms, A. R., DeWitt, R., Kouremenos, P., and Drewry, A. M.: A new approach to reconstructing sea levels in Antarctica using optically stimulated luminescence of cobble surfaces, Quat. Geochronol., 6, 50–60, https://doi.org/10.1016/j.quageo.2010.06.004, 2011.
Smedley, R. K., Duller, G. A. T., Pearce, N. J. G., and Roberts, H. M.: Determining the K-content of single-grains of feldspar for luminescence dating, Radiat. Meas., 47, 790–796, https://doi.org/10.1016/j.radmeas.2012.01.014, 2012.
Smedley, R. K., Small, D., Jones, R. S., Brough, S., Bradley, J., and Jenkins, G. T. H.: Erosion rates in a wet, temperate climate derived from rock luminescence techniques, Geochronology, 3, 525–543, https://doi.org/10.5194/gchron-3-525-2021, 2021.
Smith, L. N., Sohbati, R., and Jain, M.: Rock surface luminescence dating of gravel determines the age of a glacial outburst megaflood, Glacial Lake Missoula, Montana, USA, Geology, 51, 323–328, https://doi.org/10.1130/G50721.1, 2023.
Sohbati, R., Murray, A. S., Buylaert, J.-P., Almeida, N. A. C., and Cunha, P. P.: Optically stimulated luminescence (OSL) dating of quartzite cobbles from the Tapada do Montinho archaeological site (east-central Portugal), Boreas, 41, 452–462, https://doi.org/10.1111/j.1502-3885.2012.00249.x, 2012.
Sohbati, R., Murray, A. S., Porat, N., Jain, M., and Avner, U.: Age of a prehistoric “Rodedian” cult site constrained by sediment and rock surface luminescence dating techniques, Quat. Geochronol., 30, 90–99, https://doi.org/10.1016/j.quageo.2015.09.002, 2015.
Souza, P. E., Sohbati, R., Murray, A. S., Kroon, A., Clemmensen, L. B., Hede, M. U., and Nielsen, L.: Luminescence dating of buried cobble surfaces from sandy beach ridges: a case study from Denmark, Boreas, 48, 841–855, https://doi.org/10.1111/bor.12402, 2019.
Spaulding, W. G.: Vegetation and Climates of the last 45,000 years in the Vicinity of the Nevada Test Site, South-Central Nevada, U.S. Geological Survey Professional Paper, 1329, https://doi.org/10.3133/pp1329, 1985.
Steponaitis, E., Andrews, A., McGee, D., Quade, J., Hsieh, Y-T., Broecker, W. S., Shuman, B. N., Burns, S. J., and Cheng, H. Mid-Holocene drying of the U.S. Great Basin recorded in Nevada speleothems, Quaternary Sci. Rev., 127, 174–185, https://doi.org/10.1016/j.quascirev.2015.04.011, 2015.
Thiel, C., Buylaert, J.-P., Murray, A., Terhorst, B., Hofer, I., Tsukamoto, S., and Frechen, M.: Luminescence dating of the Stratzing loess profile (Austria) – Testing the potential of an elevated temperature post-IR IRSL protocol, Quat. Int., 234, 23–31, https://doi.org/10.1016/j.quaint.2010.05.018, 2011.
Thomsen, K. J., Murray, A. S., Jain, M., and Bøtter-Jensen, L.: Laboratory fading rates of various luminescence signals from feldspar-rich sediment extracts, Radiat. Meas., 43, 1474–1486, https://doi.org/10.1016/j.radmeas.2008.06.002, 2008.
Tschanz, C. M. and Pampeyan, E. H.: Preliminary Geologic Map of Lincoln County, Nevada. U.S. Geological Survey, Mineral Investigations Field Studies Map MF-206, 1:200,000, https://doi.org/10.3133/mf206, 1961.
Tschanz, C. M. and Pampeyan, E. H.: Geologic Map of Lincoln County, Nevada, Nevada Bureau of Mines and Geology, Bulletin, 73, 1:250,000, https://pubs.nbmg.unr.edu/Geol-mineral-Lincoln-Co-p/b073.htm (last access: March 2025), 1970.
Vafiadou, A., Murray, A. S., and Liritzis, I.: Optically stimulated luminescence (OSL) investigations of rock and underlying soil from three case studies, J. Archaeol. Sci., 34, 1659–1669, https://doi.org/10.1016/j.jas.2006.12.004, 2007.
Wallinga, J., Murray, A., and Wintle, A.: The single-aliquot regenerative-dose (SAR) protocol applied to coarse-grain feldspar, Radiat. Meas., 32, 529–533, https://doi.org/10.1016/S1350-4487(00)00091-3, 2000.
Woor, S.: Optically stimulated luminescence dating of ancient landscapes. Nature Reviews Earth & Environment, 3, 362, https://doi.org/10.1038/s43017-022-00307-7, 2022.
Wriston, T.: The Middle Holocene Period and Great Basin Archaeology: Past Ideas, Current Trends, and Future Research, in: Past, Present and Future Issues in Great Basin Archaeology: Essays in Honor of Don D. Fowler, edited by: Hockett, B., Bureau of Land Management, Nevada Cultural Resource Series No. 20, U.S. Department of the Interior, Washington D.C, 218–241, 2009.
Wriston, T. and Adams, K. D.: LCAI Coal Valley Archaeological and Geomorphological Research: Pluvial Lake Coal and Paleoindians. BLM Report No. 8111 NV-04-17-2170 on file at the BLM, Ely District Office, 2020.
Yang, K., Ou, X., Li, Y., Jenkins, G. T. H., Yao, P., Tang, D., Xu, Y., Xie, J., Zeng, L., and Liu, X.: Luminescence dating of cobbles buried in moraines from the source area of the Litang River (Konglongluo Valley), eastern Tibetan Plateau, Quat. Geochronol., 82, 101547, https://doi.org/10.1016/j.quageo.2024.101547, 2024.