
the Creative Commons Attribution 4.0 License.
the Creative Commons Attribution 4.0 License.
 | 14 Sep 2026
Causes and mitigation of U–Pb fractionation during LA-ICP-MS analyses of zircon using nanosecond excimer laser systems
Donald W. Davis

Heriberto Rochin-Banaga
This work investigates the causes of ablation bias in U–Pb dating of zircon by laser ablation inductively coupled mass spectrometry (LA-ICP-MS) and possible methods for correction. PbU ablation bias occurs due to the relative volatility of Pb and changes with pulse count (pit depth). Measurements of NIST glass and zircon include significant ablation bias when scanned but since this is constant with time it is possible to determine variations in instrument bias by ablating under fixed conditions. Integrated signal profiles measured using laser pulses at 0.2 Hz combined with modelling of PbU fractionation suggest that the earliest PbU measurements (first 10 pulses) are affected by decreasing fractionation from a melt pool as it becomes increasingly depleted in Pb. This trend is opposed by deposition of depleted material as fallback, which dominates early signal loss. The fractionation sequence from the first 10 or so pulses is therefore chaotic. Ratios from the following 50 or so pulses show an approximately linear increase in fractionation. Normalized data from these pulses give trends with higher intercepts and lower slopes for standards with higher radiation damage during the same session. Fractionation and signal decay subsequently rise more slowly but remain linear, probably because fractionation is dominated by deposition in the deepening pit. An ablation fractionation model is proposed based on the drop in measured ZrO signal but this cannot be used to estimate accurate bias-free 206Pb238U ratios because of the number of unconstrained parameters. The best approach for calibrating against an unknown is a direct comparison of all or part of the standard ratio profile with the sample profile after multiplication by a calibration factor. The factor that results in the best fit should represent a ratio of unbiased 206Pb238U between standard and sample. Software is included to process and calibrate data. Data from Precambrian zircon with well-established 207Pb206Pb ages suggest that radiation damage below the metamict state results in little bias to discordance. Reverse discordance from metamict zircon appears to be approximately proportional to U concentration. Increased accuracy of 206Pb238U ages using nanosecond laser systems can most likely be achieved through instrument design improvements rather than data processing.
- Article
(12431 KB) - Full-text XML
- BibTeX
- EndNote


Laser ablation inductively coupled plasma mass spectrometry (LA-ICP-MS) has proved to be a powerful analytical approach for U–Pb geochronology because of the speed and scale of analyses (less than 1 min at a scale of tens of µm in situ). It has led to a large increase in the number of publications on dating zircon, as well as applications to hydrogenic and biogenic minerals like calcite and phosphate (Koch and Gunter, 2011) The internal precision is limited to about 1 % for a single analysis with quadrupole mass analyzers but can be better for rapid switching or multi-collector sector instruments and the rapidity of analyses makes it relatively easy to generate large amounts of data that can be averaged.
Because of the complexity of the analytical processes, LA-ICP-MS is often treated like a “black box” by users (including the authors). This may lead to the adoption of empirical analytical protocols whose basis is poorly understood. A significant problem compared to isotope dilution is assuring the accuracy of data, especially where ages depend on PbU measurement such as samples younger than Mesoproterozoic (e.g. zircon) or samples that contain significant common Pb (e.g. calcite). This is because measurement biases for 206Pb238U ratios are normally high and must be corrected, usually by measuring standards with known ratios and assuming the same ablation bias as for the sample.
The most significant sources of PbU measurement bias are mass fractionation, ionization efficiency, oxidative loss of U and ablation bias. The first three occur in the plasma (as well as the MS for mass fractionation) and are referred to here as instrument bias, while the fourth is a result of interaction of the laser with the sample. A common procedure is to correct for the first three biases using a glass standard such as NIST612 (Jochum et al., 2011) but these are also affected by ablation bias, which can only be corrected using a “matrix-matched” standard, which is usually the same mineral as the sample but with a precisely known age measured by isotope dilution thermal ionization mass spectrometry (ID-TIMS). There can be problems with this that compromise accuracy even when measurements produce precise results. Glass standards are subject to significant PbU ablation biases (see below). Measuring a standard of similar mineralogy to the sample may not adequately correct for ablation bias for samples such as calcite, which can have quite variable compositions, or zircon, which can have variable states of crystallinity due to radiation damage.
A series of experiments, interpretations and suggestions are presented to better understand the causes of PbU ablation bias in zircon during LA-ICP-MS measurements and suggest ways that this bias can be mitigated to improve accuracy of U–Pb ages. Working hypotheses will be advanced to explain results of measurements. Even if these explanations are not all strictly valid, they may provide a starting point for understanding the causes of bias and how to accurately correct it. We hope that our observations and arguments will at least provide some insight to the community and inspire further efforts.
U–Pb isotopic analyses were conducted at the University of Toronto using an Agilent 7900 ICP-MS and an NWR193UC excimer laser ablation system (https://www.icpmslasers.com/files/Data-Sheets/NWR193-Brochure-U-17331-b.pdf, last access: 9 September 2026). The plasma was maintained at a power input of 1250 W, giving a temperature of about 6000 °C. The laser was normally run at a frequency of 10 Hz with fluence of 3.5 J cm−2, subsequently referred to as standard conditions. Some experiments were run at a frequency of 0.5 Hz in order to access results from the earliest pulses. Beam diameter was varied as noted for the experiments described below. Initial tuning and measurement of plasma characteristics were carried out using NIST610 ablated along scan lines. The He flow rate was set at 1000 mL min−1 and nebulizer Ar flow rate was adjusted to give of 0.5 % or less, except where otherwise noted. N2 gas was not added (Hu et al., 2008). All data were measured in the same lab under variable specified conditions.
Standards include NIST610 and NIST612 glasses. Zircon standards include Keuhl Lake (KL) from a zircon megacryst in the same deposit as standard 91 500 (1065 Ma; Caulfield et al., 2025; Wiedenbeck et al., 1995; Royal Ontario Museum object number ROMESM16401), DD91-1 zircon, a relatively high-U (300 ppm) zoned 2682±1.2 Ma zircon (Davis, 2002) and DD85-17, a relatively low U (100 ppm) zoned 3002±3 Ma zircon (Tomlinson et al., 2003). KL is mostly unzoned and has a very low degree of radiation damage as revealed by Raman scattering (Das and Davis, 2010). Although the KL sample has not been directly dated by ID-TIMS, it has been analyzed many times against other ID-TIMS dated zircon standards and given ages indistinguishable from 91 500. Grains were mounted in epoxy, polished and imaged with backscattered electrons (BSE) using a JEOL JSM6610-Lv scanning electron microscope.
3.1 Instrument bias: mass fractionation and differential ionization
It is important to understand the sources of all signal biases to optimize and improve measurement methods. For example, if ablation bias proved to be identical and therefore predictable for a large class of samples under similar laser conditions, knowing the instrument bias would eliminate the need to measure a standard.
The plasma in an ICP torch is maintained by the transfer of radio frequency energy from a surrounding coil to electrons, which collide with and ionize Ar atoms that then also absorb enough energy to maintain a temperature of about 6000 °C (Koch and Gunter, 2011). Analyte injected into the plasma through the torch is rapidly volatilized and ionized. Levels of ionization depend on the ionization potential of the element and are given by the Saha equation (Drake, 2018; Houk, 1986).
In order to be detected, the ionized atom or molecule must make its way from the plasma at atmospheric pressure, through the orifice in the sampling cone, then through the orifice in the skimmer cone into a high vacuum region without losing its charge by collision with the wall or another species having a lower ionization energy. This is the reason that extraction efficiency is much less than 100 %. The extraction efficiency is dependent on atomic or molecular weight, favoring heavier species (Niu and Houk, 1996). This, along with ionization efficiency, imposes the measurement bias of about minus 25 %–35 % on the 206Pb238U ratio (measured under low oxide conditions) that we observe in measurements below, which is the largest single source of bias.
Calibration using a matrix-matched primary standard should correct both instrument and ablation bias except that ablation bias increases with pulse count (pit depth) and can be sensitive to the structural state of the mineral. Horn et al. (2000) injected a calibrated nebulized solution of 205Tl238U along with the ablation stream but did not obviously correct for different ionization efficiencies of Tl and Pb. Another approach might be to nebulize and inject a calibrated PbU solution between sample runs. The solution might have to also contain an appropriate concentration of Zr to match the composition of the sample.
A convenient approach is to use laser scans but these are not free of ablation bias. Scans of NIST-610, 612 and 614 gave 206Pb238U ratios biased relative to accepted values (Jochum et al., 2011) by −23.4 %, −23.9 % and −23.0 %, respectively, whereas two scans of the Keuhl Lake zircon (KL) near the start and at the end the session gave biases of −27.6 % and −27.3 % (Supplementary Data file 1 at https://osf.io/c8j3k/?view_only=f5c96dd8c9244629879f420d5762b74e, last access: 9 September 2026). Although the three glasses appear to have the same ablation bias, it is about 4 % higher than that from zircon. Practical scan rates result in the superposition of multiple ablation spots and the scan should develop a V shaped profile since its central line receives many more pulses than the edges. The edge of each individual pulse has a relatively high brightness under BSE, concentrated at the edge of the scan where the pulse edges converge (Fig. 1). As noted by Nasdala et al. (2006) for zircon, the brightness of BSE response increases with the degree of atomic disorder. This suggests deposition of Pb-depleted melt around the edge of the ablation footprint or the removal of melt that had previously formed within it. If the absolute instrument bias can be determined once using a solution, the offset between it and total measured bias should remain the same for a given set of laser operating conditions, providing a relatively easy way to routinely measure instrument bias.
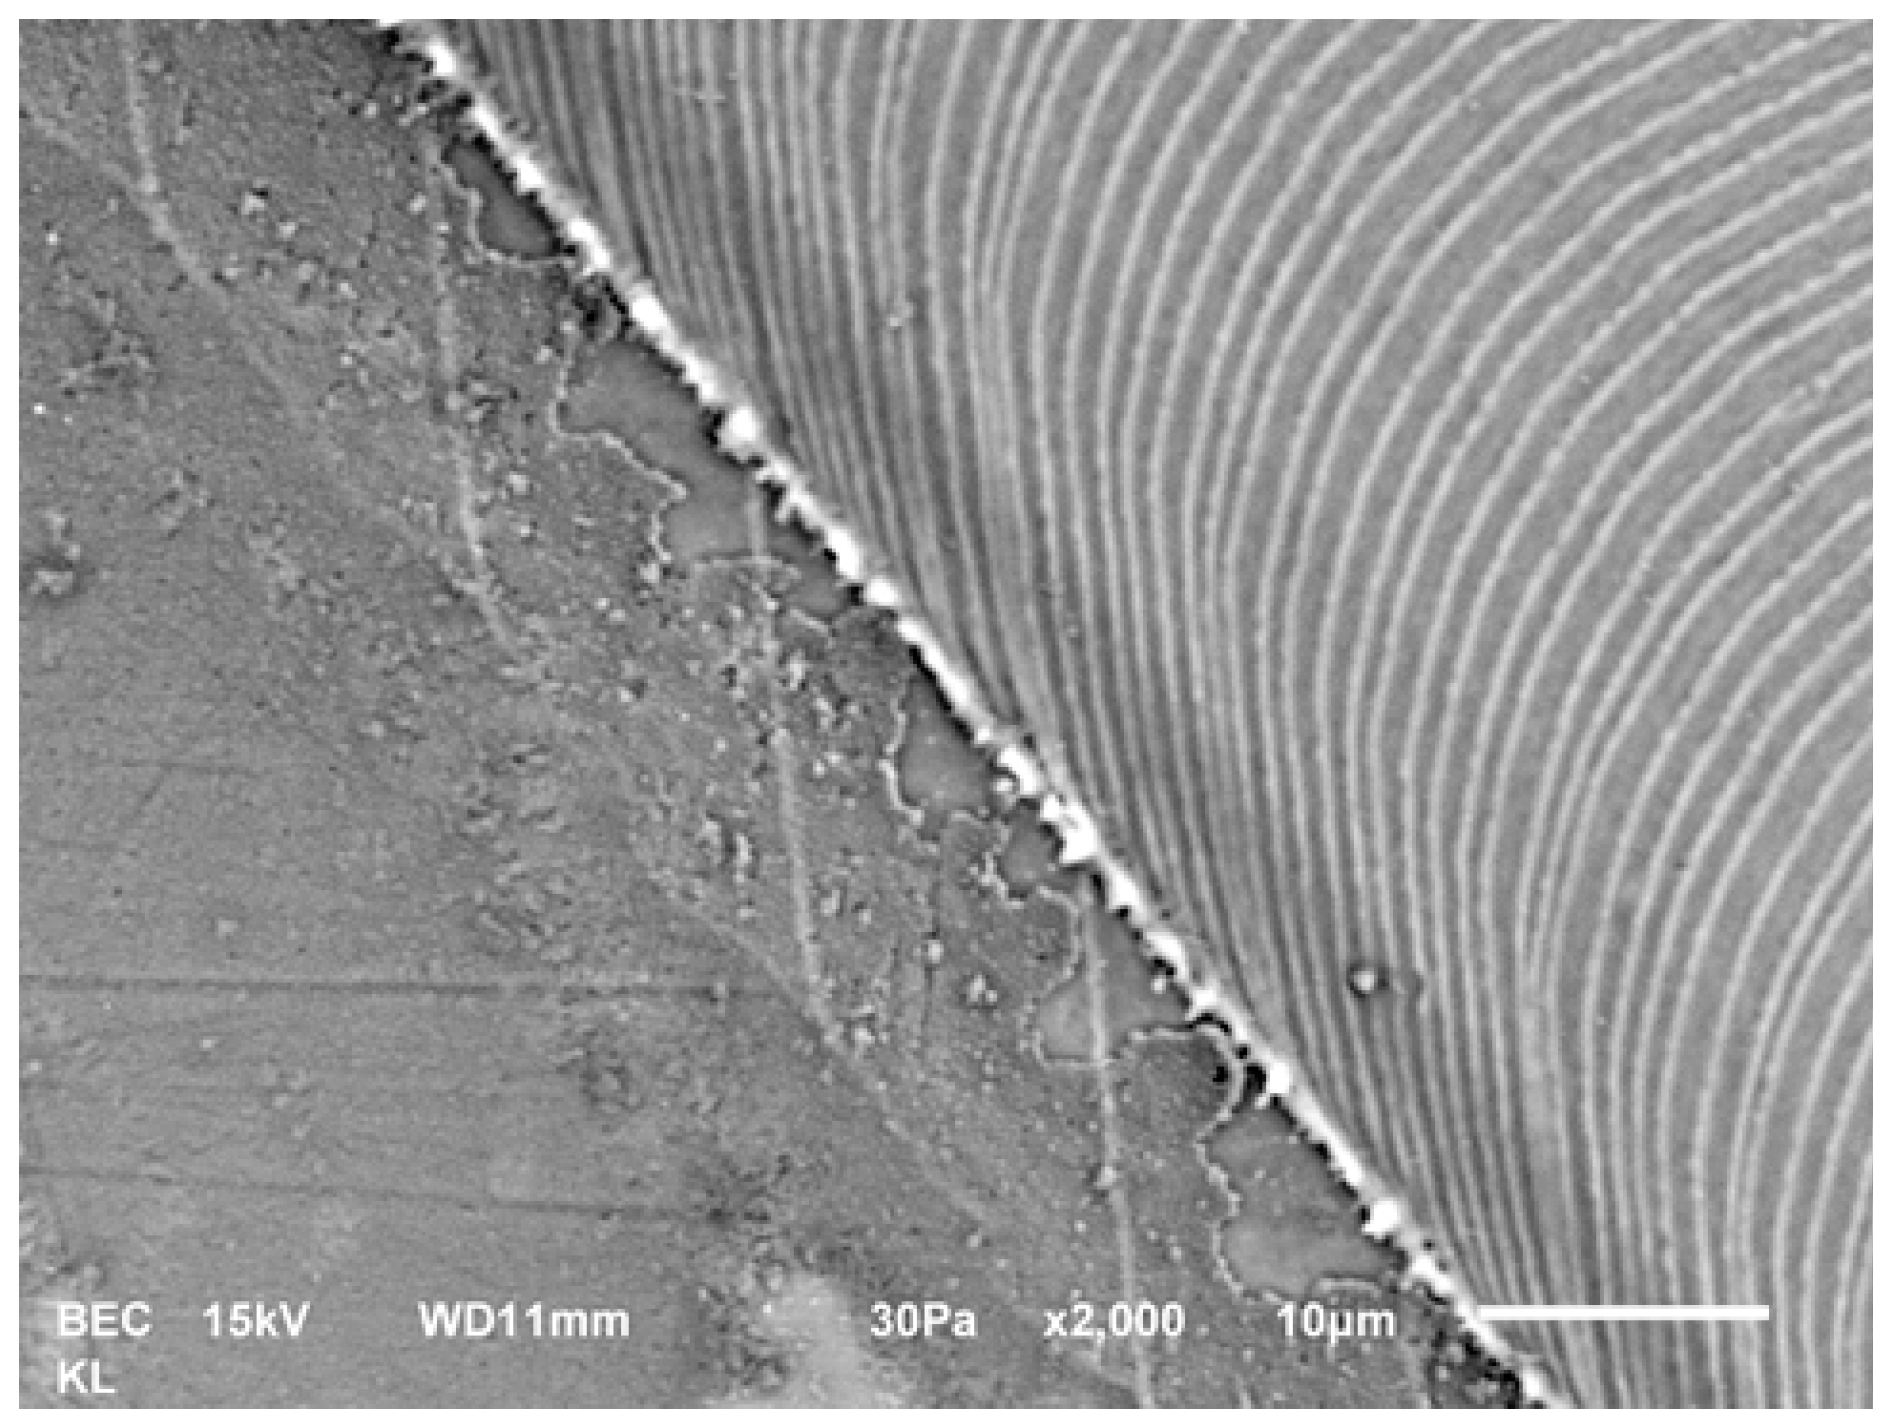
Figure 1BSE high contrast image showing one side of a laser scan of KL. Bright fragments of melt are seen concentrated along the edge of the scan and ejected from it. These may be depleted in Pb relative to U contributing to a positive 206Pb238U measurement bias.
3.2 Ablation bias
3.2.1 Understanding the ablation process
It has long been noted that during spot ablation of zircon, time resolved analytical (TRA) measurements of 206Pb238U are found to increase especially for relatively narrow spots. The bias increases as a function of the aspect ratio of the pit with an early rapid rise changing to a slower linear rise, eventually levelling off and then dropping as emission becomes much weaker (Paton et al., 2010; Eggins et al., 1998). Downhole fractionation appears to be reduced with shorter pulse duration, the femtosecond laser showing less fractionation than nanosecond lasers (Kimura et al., 2015).
Ablation bias still appears to be poorly understood. It depends on interaction of the sample with the laser, rather than plasma conditions, and is the most limiting for accuracy. Eggins et al. (1998) measured the fractionation of volatile Pb and Bi over refractory U and Th as a function of ablation pit depth in NIST612, as well as the geometry of the pit. They showed that Bi/Th increases with pit depth (downhole fractionation) until an aspect ratio (depth/surface diameter) of about 3:1 where the bottom of the pit had tapered to a diameter of about of that at the surface and signal intensity was reduced by an order of magnitude. Subsequently, downhole fractionation reversed with Bi/Th decreasing. They concluded that the principal mechanism for elemental fractionation is condensation of the more refractory elements on the walls of the pit. In contrast, Kroslakova and Günther (2007), after aerosol dilution experiments, concluded that elemental fractionation is at least partly a result of interaction of the ablated material with the plasma.
The ZrO2–SiO2 phase diagram determined by Butterman and Foster (1967) shows the appearance of a melt, consisting of ZrO2 and an SiO2-rich liquid, at about 2250 °C for the zircon composition with a single liquid above 2400 °C. As shown by Davis (2008), zircon decomposes leaving these two phases below 1500 °C in the presence of excess silica. Kosler et al. (2005) concluded that during ablation of zircon the retention of U in the dissociated ZrO2 phase with release of volatile Pb is the reason for increasing PbU implying that fractionation in zircon is an effect of mineralogical changes in the target. However, this does not explain why the least ablation bias is seen at the start of a 206Pb238U time resolved analytical (TRA) profile for zircon.
It is instructive to carry out a rough calculation of the expected temperature increase of the target during ablation. This should be a function of the laser energy flux, expected absorption volume and specific heat of the mineral. A typical laser configuration delivers about 30 µJ per pulse to a 30 µm diameter target. Assuming that the energy is absorbed in a 0.1 µm layer, roughly consistent with observed ablation rates, a target with a heat capacity typical of zircon (0.75 ), would be exposed to energy an order of magnitude greater than that required for melting (estimated temperature increase of about 10 000 °C assuming constant specific heat). At this energy flux, it is likely that all minerals boil and produce a transient ablation cloud.
A thorough study of ablated particle composition and size distributions determined using time of flight mass spectrometry is given in Adamson et al. (2026). For the purpose of modelling the PbU fractionation process, we consider four components: a melt pool at the base of the pit, an ablation cloud whose composition reflects measured laser induced elemental fractionation (LIEF; Adamson et al., 2026), fallback material that accumulates around the pit, and deposit within the pit. The cloud consists of melt droplets with a range of sizes and compositions. One might expect that fallback material would accumulate a relatively high proportion of large particle sizes and that the finer particles would be preferentially entrained into the plasma. Adamson et al. (2026) selectively ablated fallback material using low laser fluence (dusting) and found that it delivered a higher proportion of fine material into the plasma than that from the pit. However, since the fallback material was re-ablated, this may not represent its original particle distribution. Both Adamson et al. (2026) and Kaser et al. (2025) show that average fallback material is enriched in volatile elements including Pb, but this does not rule out the possibility that fallback could contain a dominant fraction of depleted material during part of the ablation process.
Melt, along with Pb vapour, should boil off during irradiation down to a depth at the base of the pit where temperature falls below the boiling point, then be quenched by rapid loss of heat to the mount leaving a Pb-depleted layer. Zircon ablation pits typically show a layer of what appears to be solidified melt at the base and along the walls (Fig. 2). Although this relies on morphology rather than high-resolution analytical techniques, we assume that it is mostly glass. The glass layer may not be visibly obvious with relatively undamaged zircon but it can be made obvious by rotating the laser beam around a circle within the pit as shown in Fig. 2B, which has the effect of creating flow-like structures.
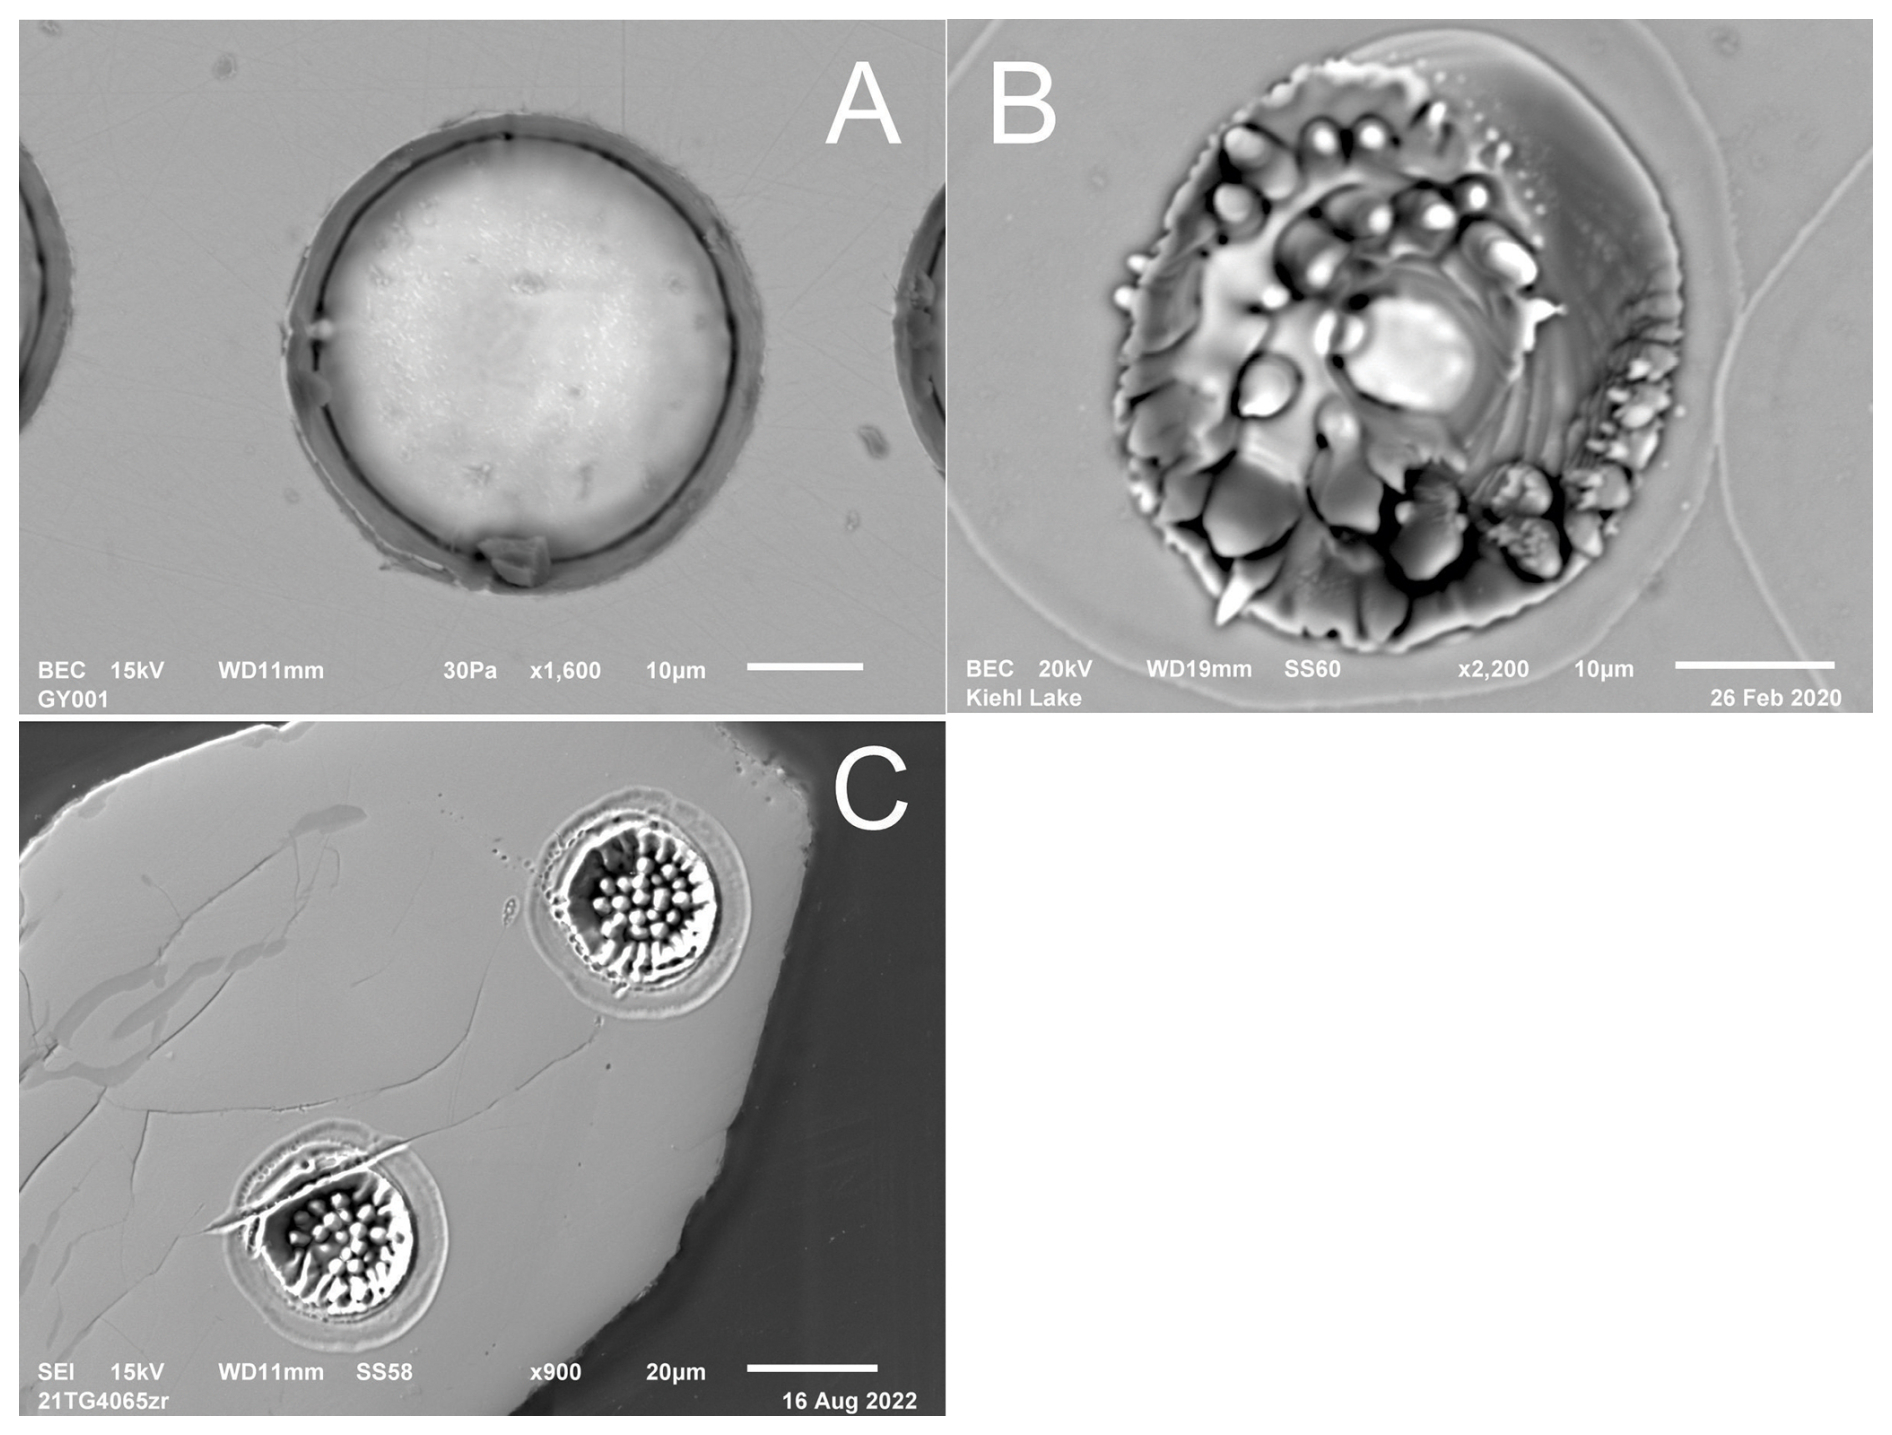
Figure 2SEM images intended to show that ablation pits in zircon contain a melt phase. (A) Electron backscatter image of laser ablation pit in KL zircon. (B) Same as A except that the laser beam was rotated once around a path half the radius of the pit. This shows that despite the flat surface seen at the base of the pit in A, the sample was melted. (C) Secondary electron image (SEI) of ablation pits in high-U Archean zircon that is much more damaged than KL. Irregular solidified melt is seen along the walls and base of the pits.
To test the hypothesis of a Pb depleted melt, a wide (130 µm) pit was ablated into KL zircon with 200 pulses at 10 Hz, 3.5 J cm−2. It was hoped to form a melt layer around the wall that was thick enough to sample (10 µm or greater). However, the wall layer proved to be only a few microns wide. Examination of the pit shows that the sides are smooth and somewhat wavy in shape whereas the base is partly floored by an irregular layer of what appears to be solidified congealed melt lying on top of a smooth surface (Fig. 3A). Material in the pit was analyzed by passing a 30 µm beam across it under standard conditions (see Fig. 3A for scan footprint). The scan shows an order of magnitude reduction in 238U signal intensity within the pit, (Fig. 3B) which is partly due to defocusing but may also be because of limited coupling of the laser to the highly uneven surface. Most importantly, there is a decrease in 206Pb238U ratio of up to 40 % (Fig. 3C, Supplementary Data File 2) with wall-adjacent material showing the lowest values in both emission and ratios. It is therefore clear that the basal melt is depleted in Pb and might represent at least part of the reservoir that balanced emitted Pb-enriched material.
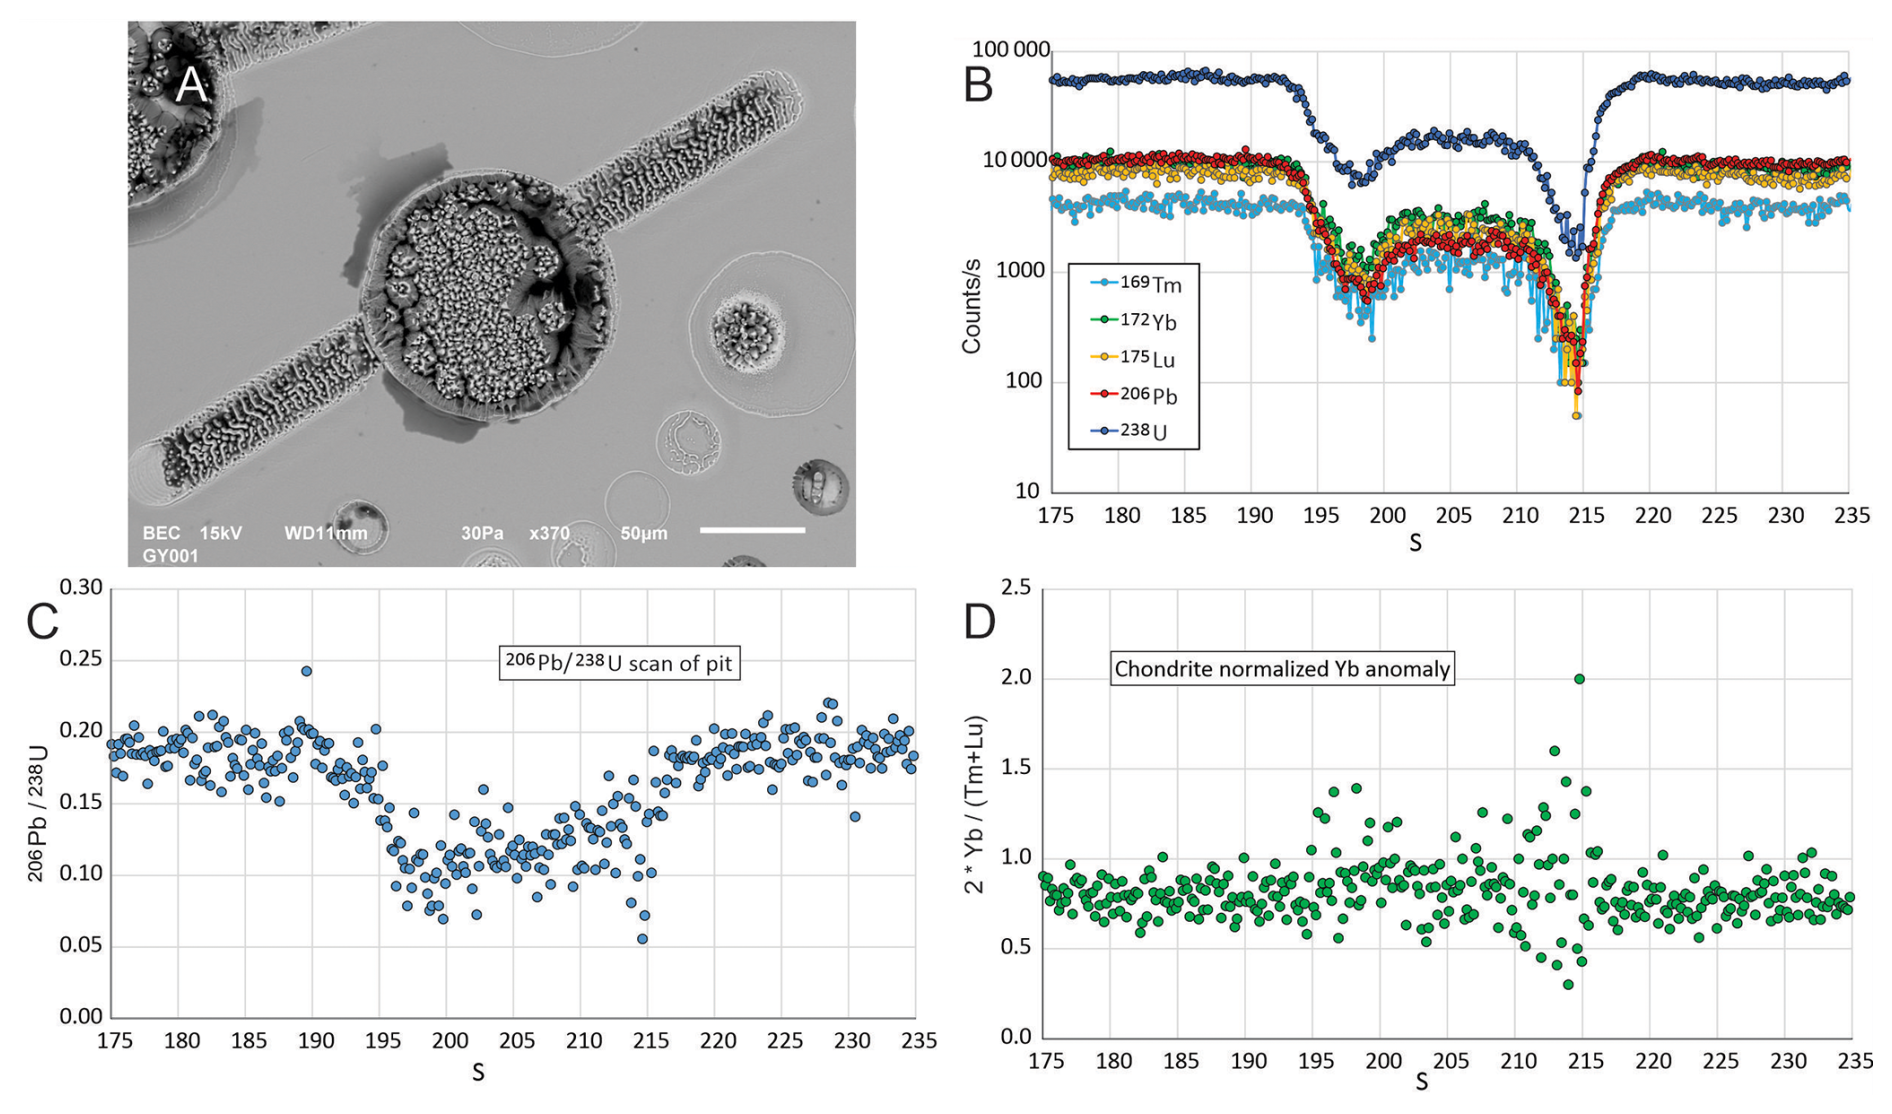
Figure 3(A) 130 µm pit floored by an irregular solidified melt layer crossed by a 30 µm scan line. (B) Trace element signals from the scan. (C) 206Pb238U ratios show a depletion of Pb relative to U across the bottom of the pit. (D) 172Yb signal shows no clear anomaly relative to the average of less volatile 169Tm and 175Lu above and below it, indicating that Yb is insufficiently volatile to act as a proxy for Pb during ablation.
A potential approach to correcting ablation bias might be to measure the ratio of another pair of elements of different volatility, besides Pb and U, on the same grain. A possible candidate is Yb since it is the most volatile of the rare earth elements. HREE are enriched in zircon and are easily measured in most cases. If one could detect Yb/Yb* significantly higher than 1 (Yb* is the interpolated value of measurements of chondrite-normalized Tm and Lu, the adjacent REE below and above Yb) and could demonstrate a proportional relationship with PbU bias, the latter could be corrected. Unfortunately, no significant Yb anomaly was detected in zircon within the percent resolution of our data (Fig. 3D), indicating that Yb is insufficiently volatile compared to Pb.
The usual way to correct for all biases is to measure a standard of similar composition (matrix-matched) under the same conditions as the sample, fit all or part of the 206Pb238U time resolved analysis (TRA) profile for the standard to a curve, extrapolate it to zero time to determine the total bias correction, and apply this to the unknown using a similar extrapolation of its data (Paton et al., 2010; Gehrels et al., 2008). A complication with zircon is that, although most natural zircon is of similar composition, the crystal structure can be damaged by alpha recoil associated with the decay of isotopes in the U and Th decay series. In cases of old high-U zircon the crystal structure can be reduced to a disordered (metamict) state, which should reduce the melting temperature, increase the amount of ablated material and modulate the profile. Zircon commonly shows oscillatory zoning of U, which can cause variability in damage and degree of melting by the laser. A mitigating factor is that highly damaged zircon is likely to be Precambrian in age where, because of the shape of the U–Pb concordia curve, ages determined from 207Pb206Pb ratios are much more accurate and precise than those based on 206Pb238U measurements. Isotope ratios from a single element are much less biased by ablation than those involving Pb and U so the TRA profiles for 207Pb206Pb are usually constant over the course of an analysis. As the sample age becomes younger, 207Pb206Pb age precision is increasingly degraded because of the shallow angle of the concordia curve relative to the Pb isotope ratio measurement line. For Phanerozoic ages the 206Pb238U system must be relied on but younger zircon should generally have less damage, especially if samples are annealed before being ablated. Taking data from scan lines rather than spots is one approach to mitigating this problem but may also be affected by some degree of ablation bias (Fig. 1). In any case scans are not possible with most zircon, which consists of grains no more than a few hundred microns in size, which may have complex structures that need to be analyzed with spots.
The mechanism of progressive PbU fractionation must be understood for there to be any possibility of using complete data sets to accurately constrain the unbiased value of the 206Pb238U ratio. Potentially useful information can be inferred about the ablation process from the cross-sections of actual pits documented by Eggins et al. (1998) using NIST612. The 300 pulse pit (Fig. 6 in Eggins et al., 1998) is most comparable in dimensions to a typical analytical pit in zircon. Although the NIST612 glass has a much lower melting point than zircon, we assume that ablation produces zircon pits that are at least qualitatively similar.
All pits are slightly flared at the mount surface with diameter decreasing as the base is approached. The walls of the pit appear to be covered by a uniform thickness (about 5 µm) of brighter material, which consists of two thinner (about 0.2 of the total wall thickness) relatively bright sub-layers on the outside and inside, with a greyer layer in between. The available SEM images do not permit ruling out the possibility that at least one of the layers represents an imaging artifact. If so, this is most likely to be the inner layer. The outer layer has the highest and most consistent brightness. Both bright layers merge into a single convex-shaped layer over the base.
The inside exposed surface of the pit can be seen in Fig. 3b of Eggins et al. (1998) to consist of flow banded material, which could represent deposit or wall melt from the ablation plume. The brightness of secondary electron images is usually a result of electrons being emitted from surfaces at high angle. This suggests that the thin bright layers or layer, if only one, enclose numerous surfaces left from fracturing or boiling.
The pit sections in Eggins et al. (1998) were exposed by ablating between two pieces of NIST610 glass fitted together along polished surfaces. It is therefore conceivable that the exposed wall features might have resulted from penetration of the ablation cloud along the connecting surface but they seem much too regular to be explained this way.
Based on Fig. 2 of Eggins et al. (1998), the diameter of the laser beam is about equal to the opening of the pit. The sheath of glass observed at the edges of pits in zircon (Fig. 2, this work), approximately corresponds in thickness to the pit wall layers seen in Fig. 6 of Eggins et al. (1998). Their thickness remains constant with depth in pits over a wide range of aspect ratios.
The volume of the inner layers on the walls is roughly comparable to what might be expected from deposits left inside during excavation of the pit based on the assumption that deposit is proportional to wall area relative to the area of the pit opening as well as the observed drop in signal intensity. Wall area increases as the pit deepens, sequestering more deposit, but its thickness should not change rapidly and the fluted shape of the wall near the surface may have been eroded out by expansion of the ablation cloud.
Wall deposits may be represented by the 2 inner layers while the outer bright layer represents the edges of the basal layer at previous depths, covered with semi-liquid deposit. The photos of cross sections in Eggins et al. (1998) also show the buildup of fallback deposit, which continues to accumulate past aspect ratios well above those used for zircon analysis.
To summarize, three reservoirs are recognized as possible contributors to PbU signal fractionation: basal melt, wall deposit and fallback. Volatilization of melt at the base (bright outer layer in Fig. 6 of Eggins et al., 1998) is probably the main if not the only contributor to the signal and may be the only reservoir affected by recycling. Pb is considerably more volatile than U and significant evaporation should occur from boiling melt at the base. Ignoring the effect of fallback, melt from the first pulse should be relatively depleted in Pb, producing a complimentary high 206Pb238U signal. Re-ablation of the Pb depleted melt by the second pulse should produce a signal with lower 206Pb238U bias and so forth until the melt fractionation reaches isotopic equilibrium with the sample and there is no signal fractionation. This by itself would predict an initial high and decreasing PbU fractionation but observed signal fractionation profiles are increasing, at least past the first few pulses, is so the effect of melt fractionation must be offset by other factors, most likely recycling.
Experiments collecting the ablated fraction show that it consists of solidified micro-droplets (Kosler et al., 2005), which would have an enormous surface area. Although their interiors should be Pb-depleted, they provide the main surface onto which Pb vapour is likely to condense and therefore should provide a Pb-enriched signal. The strong positive relationship between ablation bias and aspect ratio of the pit suggests that deposition of part of the ablation cloud either on the pit wall and/or as fallback plays a major role. Larger melt droplets should be less depleted in Pb and should be preferentially deposited as fallback. Smaller droplets may be deposited against the walls of the pit and if not recycled would contribute to fractionation of the signal.
A simple conceptual sketch of one possible excavation process is shown in Fig. 4A. The first laser pulse leaves a shallow (∼0.1 µm) pit with a Pb-depleted layer on the base and a small amount of possibly Pb-enriched material along the rim wall as well as fallback material deposited outside the pit, which cannot be recycled. As mentioned above, fallback is visually seen to accumulate throughout an analysis. This complicates modelling if fallback contains significant fractionated material. An argument against this would be that the coarsest particles are likely to contribute to fallback whereas the finest are most likely to have lost Pb and should be entrained in the He flow. Fallback should not increase with pit depth so it is difficult to see it as a primary cause of increasing fractionation. We therefore choose to ignore fallback in the modelling and assume that it is constant after the first few pulses.
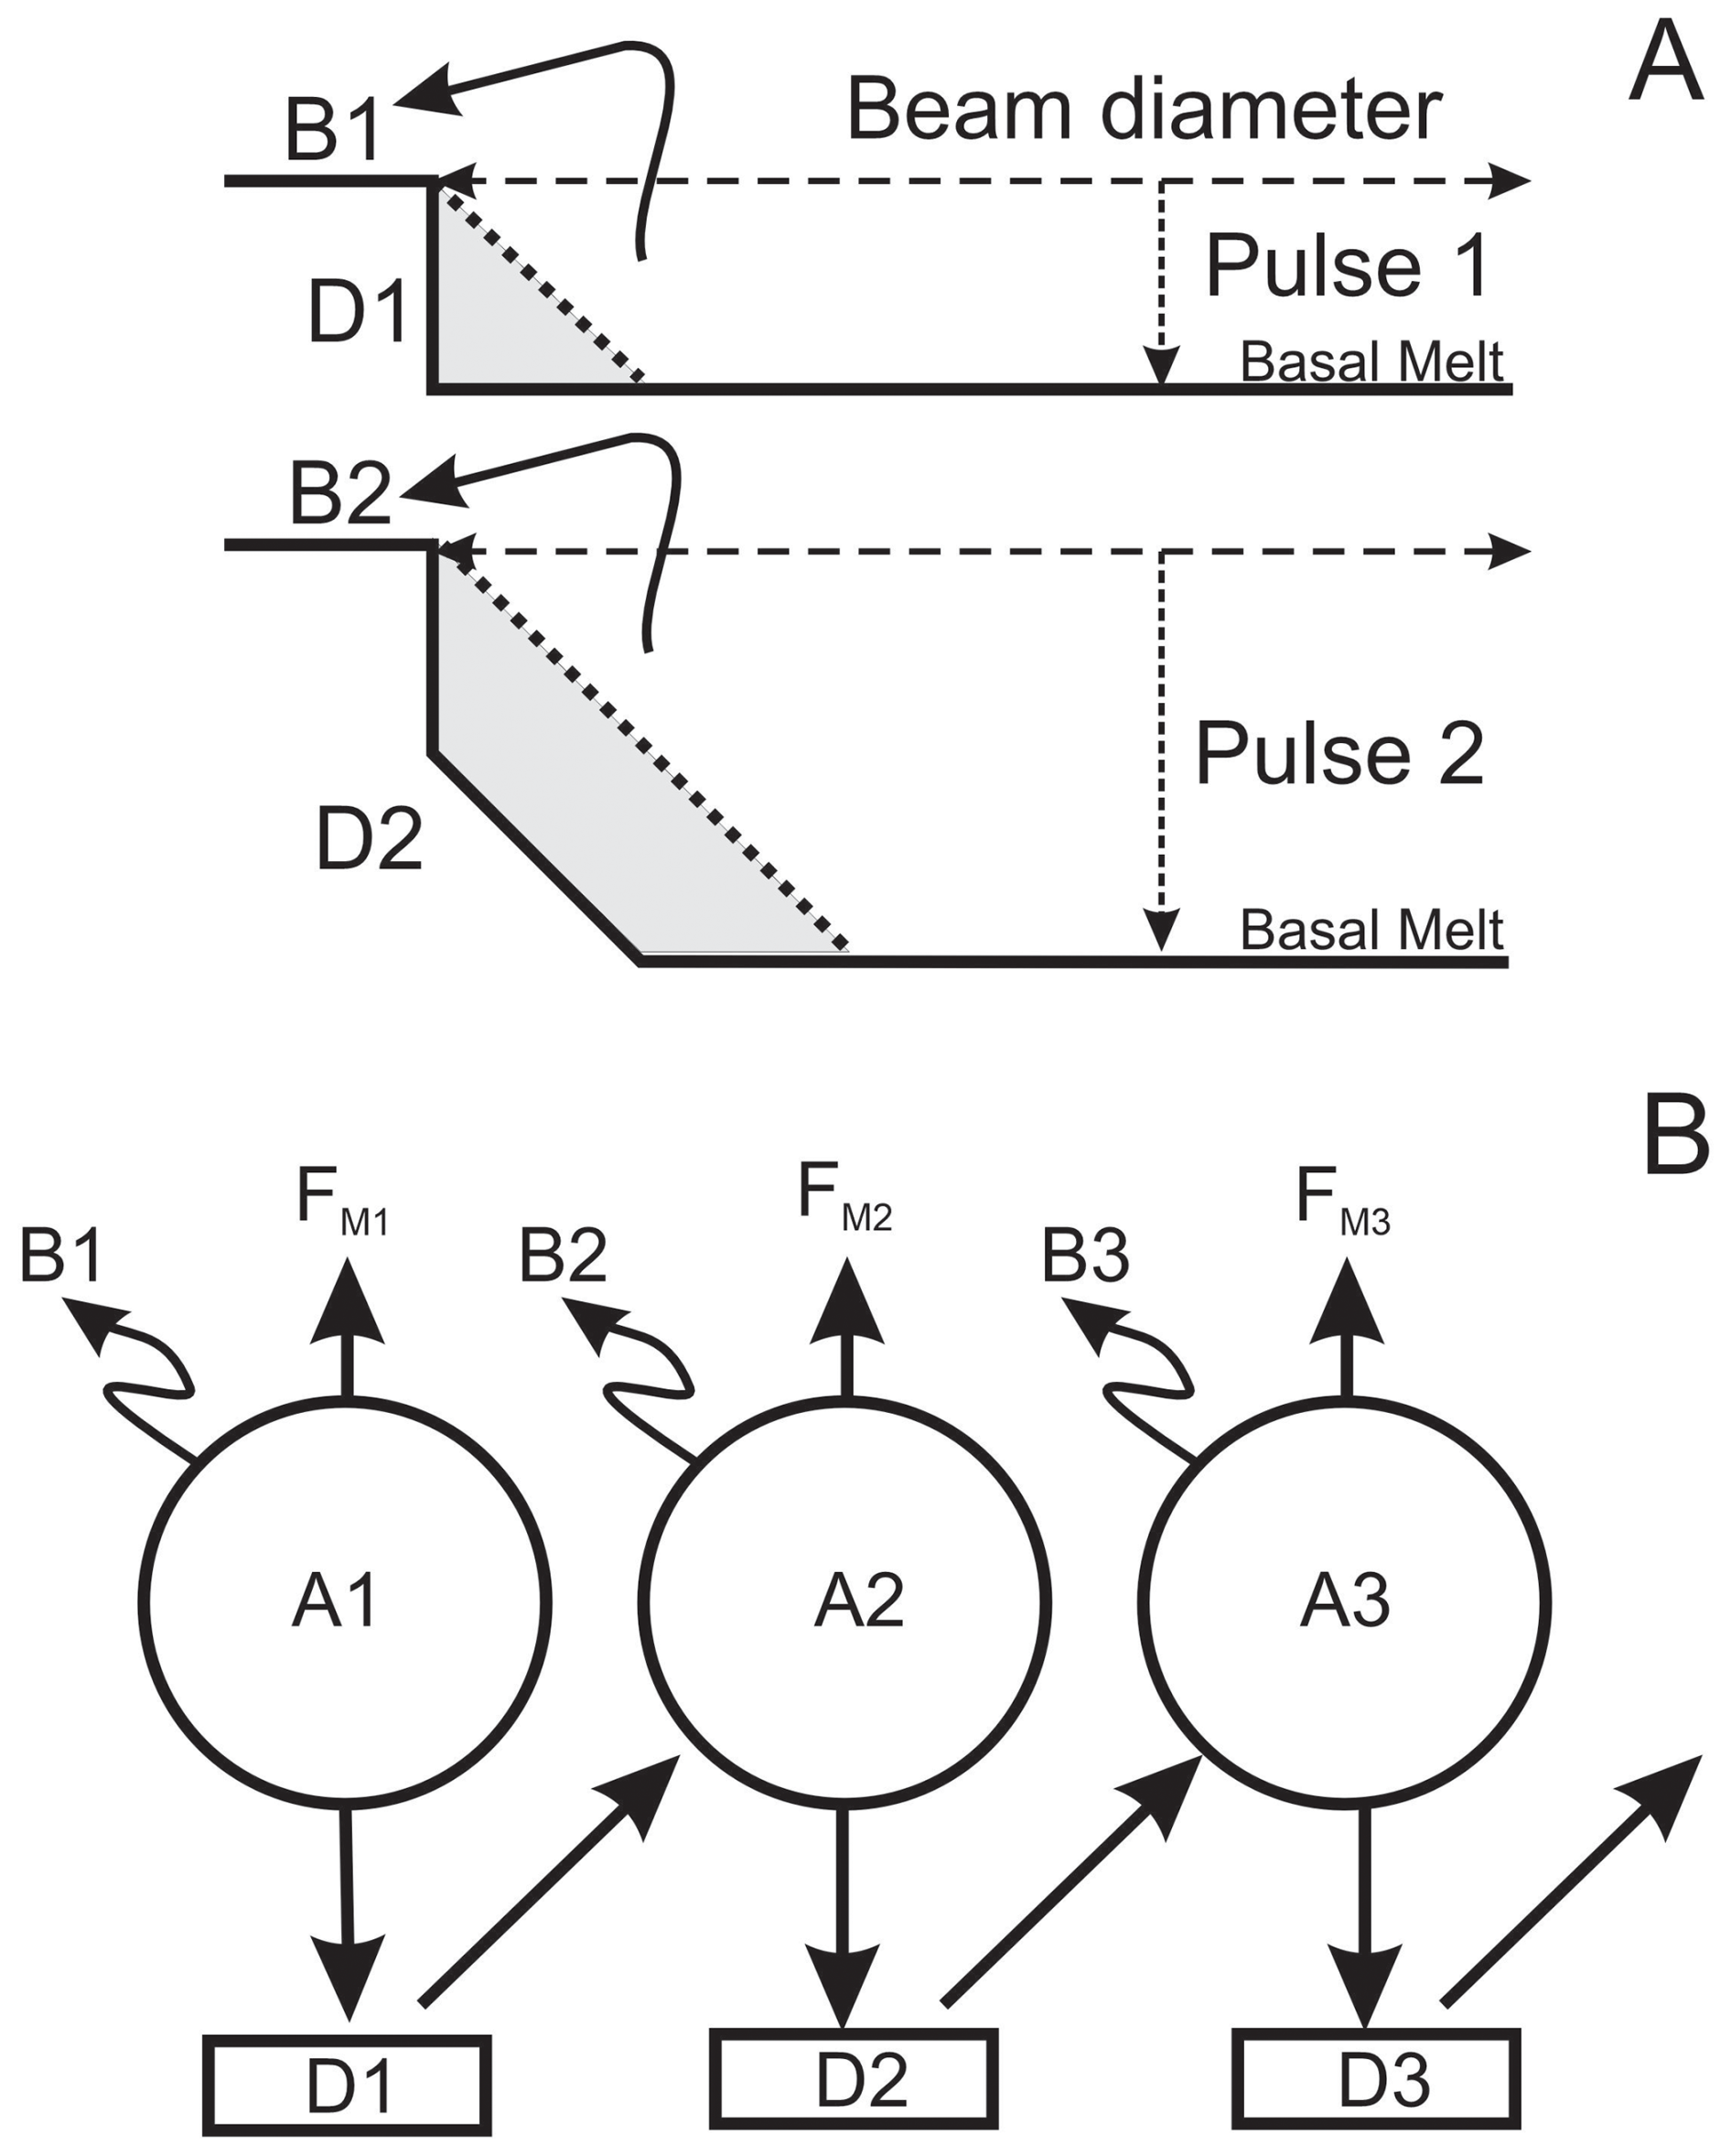
Figure 4(A) Schematic illustration of the model showing the effect of the first two laser pulses on a zircon sample as seen from the edge of a cross section of an ablation pit. D is the depth excavated per laser pulse. Pb-depleted ablated material (melt) deposited in the pit is shown in grey. The second pulse is assumed to re-ablate the residue left from the first but this consumes energy at the edge of the beam, causing the pit to taper with depth. (B) Effects of the first laser pulses on measured composition. The first ablation cloud (A1) leaves a Pb-depleted deposit in the pit (D1) and fallback (B1), which increases its PbU ratio. The second pulse can re-evaporate D1 plus pristine material, leaving a second Pb-depleted deposit (D2) as well as fallback (B2). Absorption of Pb-depleted D1 will reduce the Pb enrichment effect on the composition of the cloud that deposits D2. Fallback should produce an increment of Pb-enrichment.
In Fig. 4A the second laser pulse ablates much of the depleted material in the base of the pit while material previously deposited on the walls absorbs energy from the beam while being re-ablated, which results in the diameter of the flat base decreasing with depth. This exact process is unrealistic since it implies total recycling of deposit in the pit and recursive modelling results in a pit that narrows much too fast, with the base disappearing at an aspect ratio (depth/diameter) of about 0.2. However, recycling might be limited by the steep angle of the wall. The schematic process shows that narrowing of the pit could in part be an effect of sculpting the target material rather than just the buildup of deposit. Since PbU ablation bias rises with pit depth, it is likely that fractionated ablated material is progressively deposited against the pit wall and not recycled. In Fig. 4A, this implies that the beam does not efficiently couple to the steep surface of the deposit.
As shown schematically in Fig. 4B, successive laser pulses will form clouds of ablated target material, some of which may include a proportion of previously fractionated deposits, which would impose a Pb-depleted fractionation on the cloud. Formation of new deposit from the cloud, either within the pit or as fallback, will impose a net Pb-enrichment, which is what is measured. As mentioned above, most pit deposit might also not be recycled because of the steep angle of its surface relative to the laser beam. The relative amount of material deposited on the wall and as fallback, possibly modified by variable PbU fractionation and degrees of re-ablation of previous deposits, should be proportional to the difference between the measured signal attenuation curve and what the signal would be if there was no deposition, assuming that equal amounts of material are ablated by each pulse. The conceptual model suggests that emission might be lowered as the basal area of the pit becomes smaller. This would be partly offset if the outer beam rim is reflected off the sloping wall onto the base. Eggins et al. (1998) noted that the excavation rate of pits increased with pit depth, although their measured rate of increase was not sufficient to maintain the same ablation volume with each pulse.
3.2.2 Measuring ablation bias
238U could be used to represent the ablation signal if its concentration were uniform. However, U is typically zoned in zircon. Hf was also found to be zoned, following a similar pattern to U. A Zr or Si oxide species must be used so as not to overload the detector. Si-oxides have a high background due to the use of a silica plasma torch. 90Zr16O typically produces a signal 106(ZrO+) comparable to that from 238U and is therefore ideal. The suggestion that the 206Pb238U profile is controlled by increasing sequestration of depleted material is supported by the fact that the ZrO signal loss (1 minus the signal normalized to an assumed zero-loss value), has a similar (inverted) shape to the 206Pb238U profile at least for undamaged zircon. This is illustrated below with data on zircon grains from samples KL and DD91-1.
To acquire useful data from the earliest pulses, measurements were carried out in which single laser pulses were fired at the sample spot each 5 s (0.2 Hz) and the signals continuously measured on 106ZrO (10 ms), 206Pb (20 ms) and 238U (10 ms). A similar single-pulse approach was suggested by Cottle et al. (2009) for routine dating of zircon. To assure stable emission, the laser was left running at 10 Hz with the beam blocked, and a 5 s warm-up time assigned between single pulses. One spot was programmed with 300 passes (pulse plus warmup), which required 1500 s to fully analyze. Software to remove baseline noise and integrate each pulse is given in Supplementary Data File 3 along with results. The pulse profiles were averaged to give the instrument response functions for each mass signal, which are found to be indistinguishable after normalization (Fig. 5). If Pb continuously evaporated from a melt phase within the pit, the average 206Pb curve should appear broader than the others, which is not the case. Similar measurements were carried out at 10 Hz on the same samples and gave similar 206Pb238U profiles after signal stabilization.
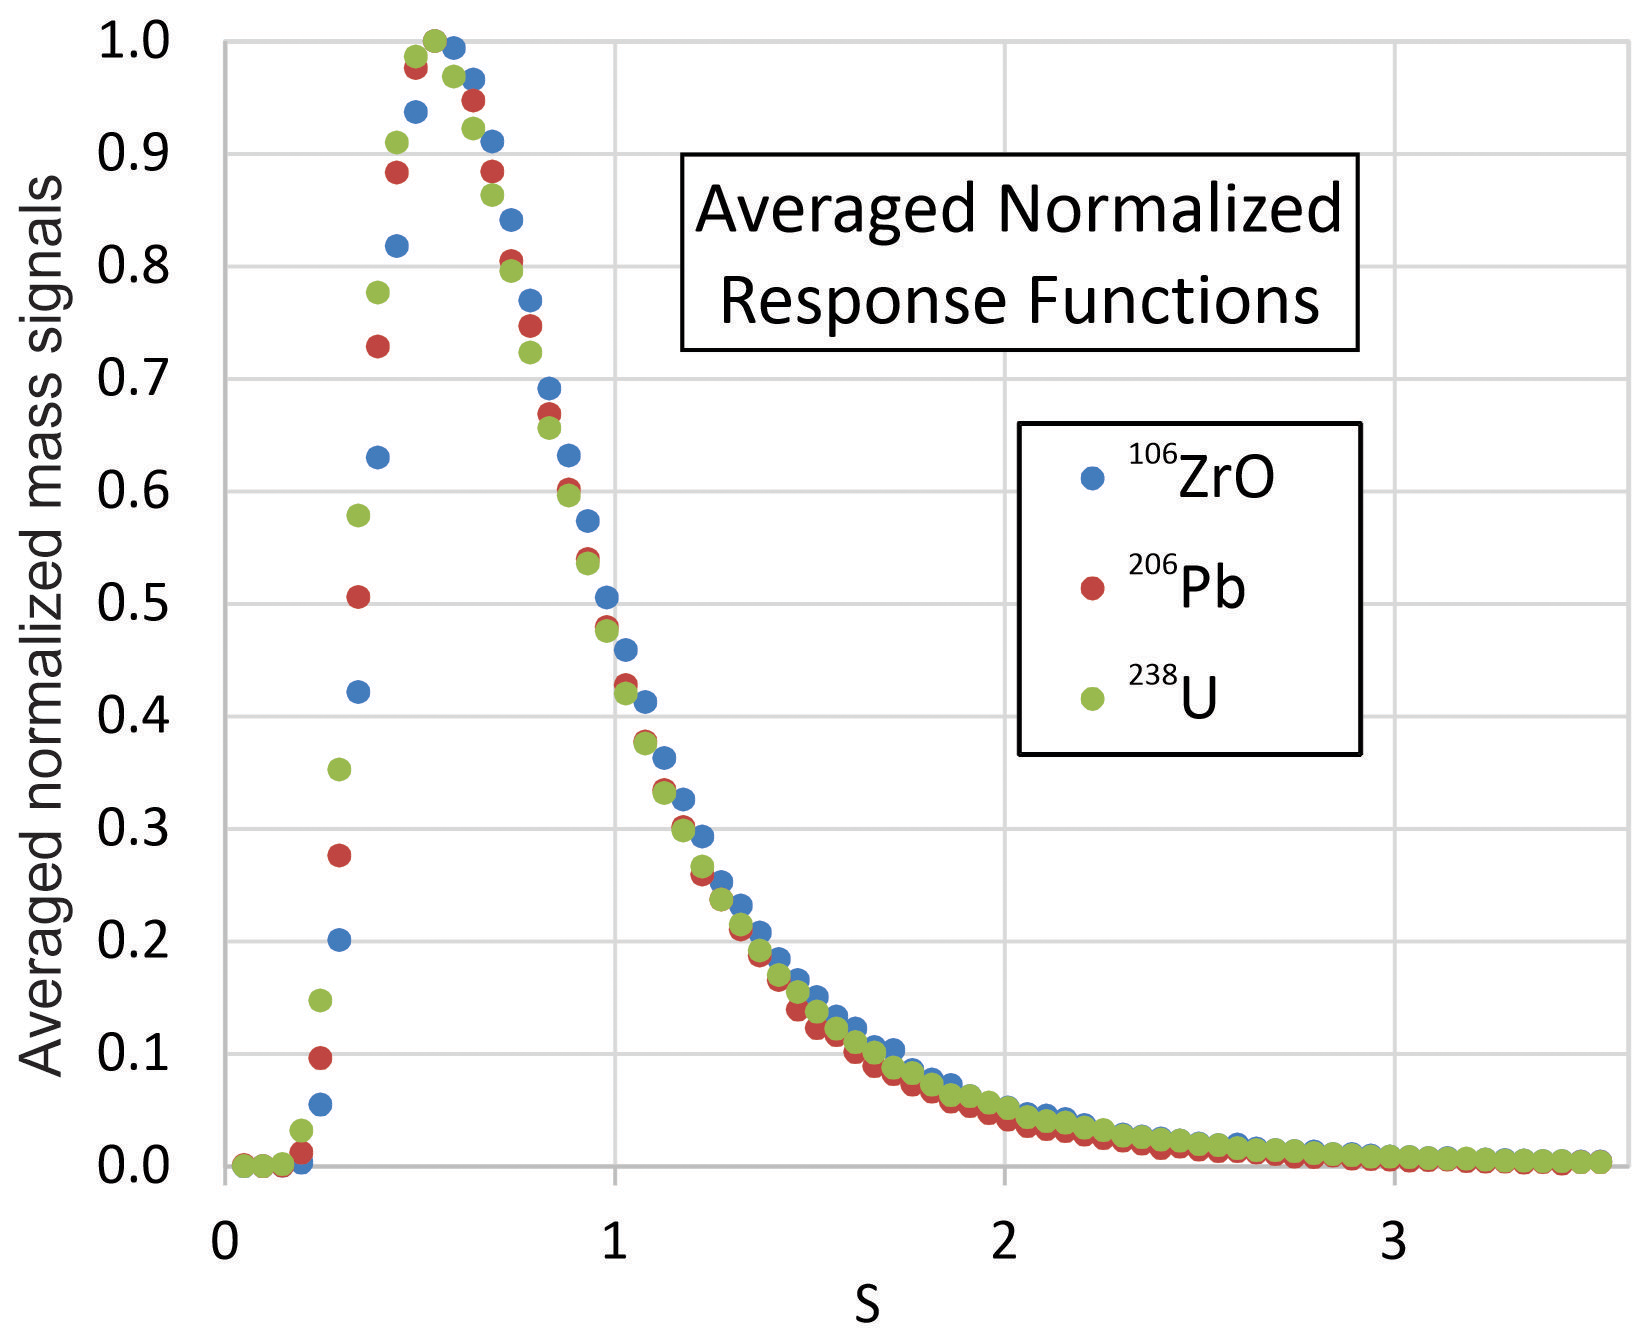
Figure 5Averaged progressive single shot signal responses normalized to highest values for masses from KL.
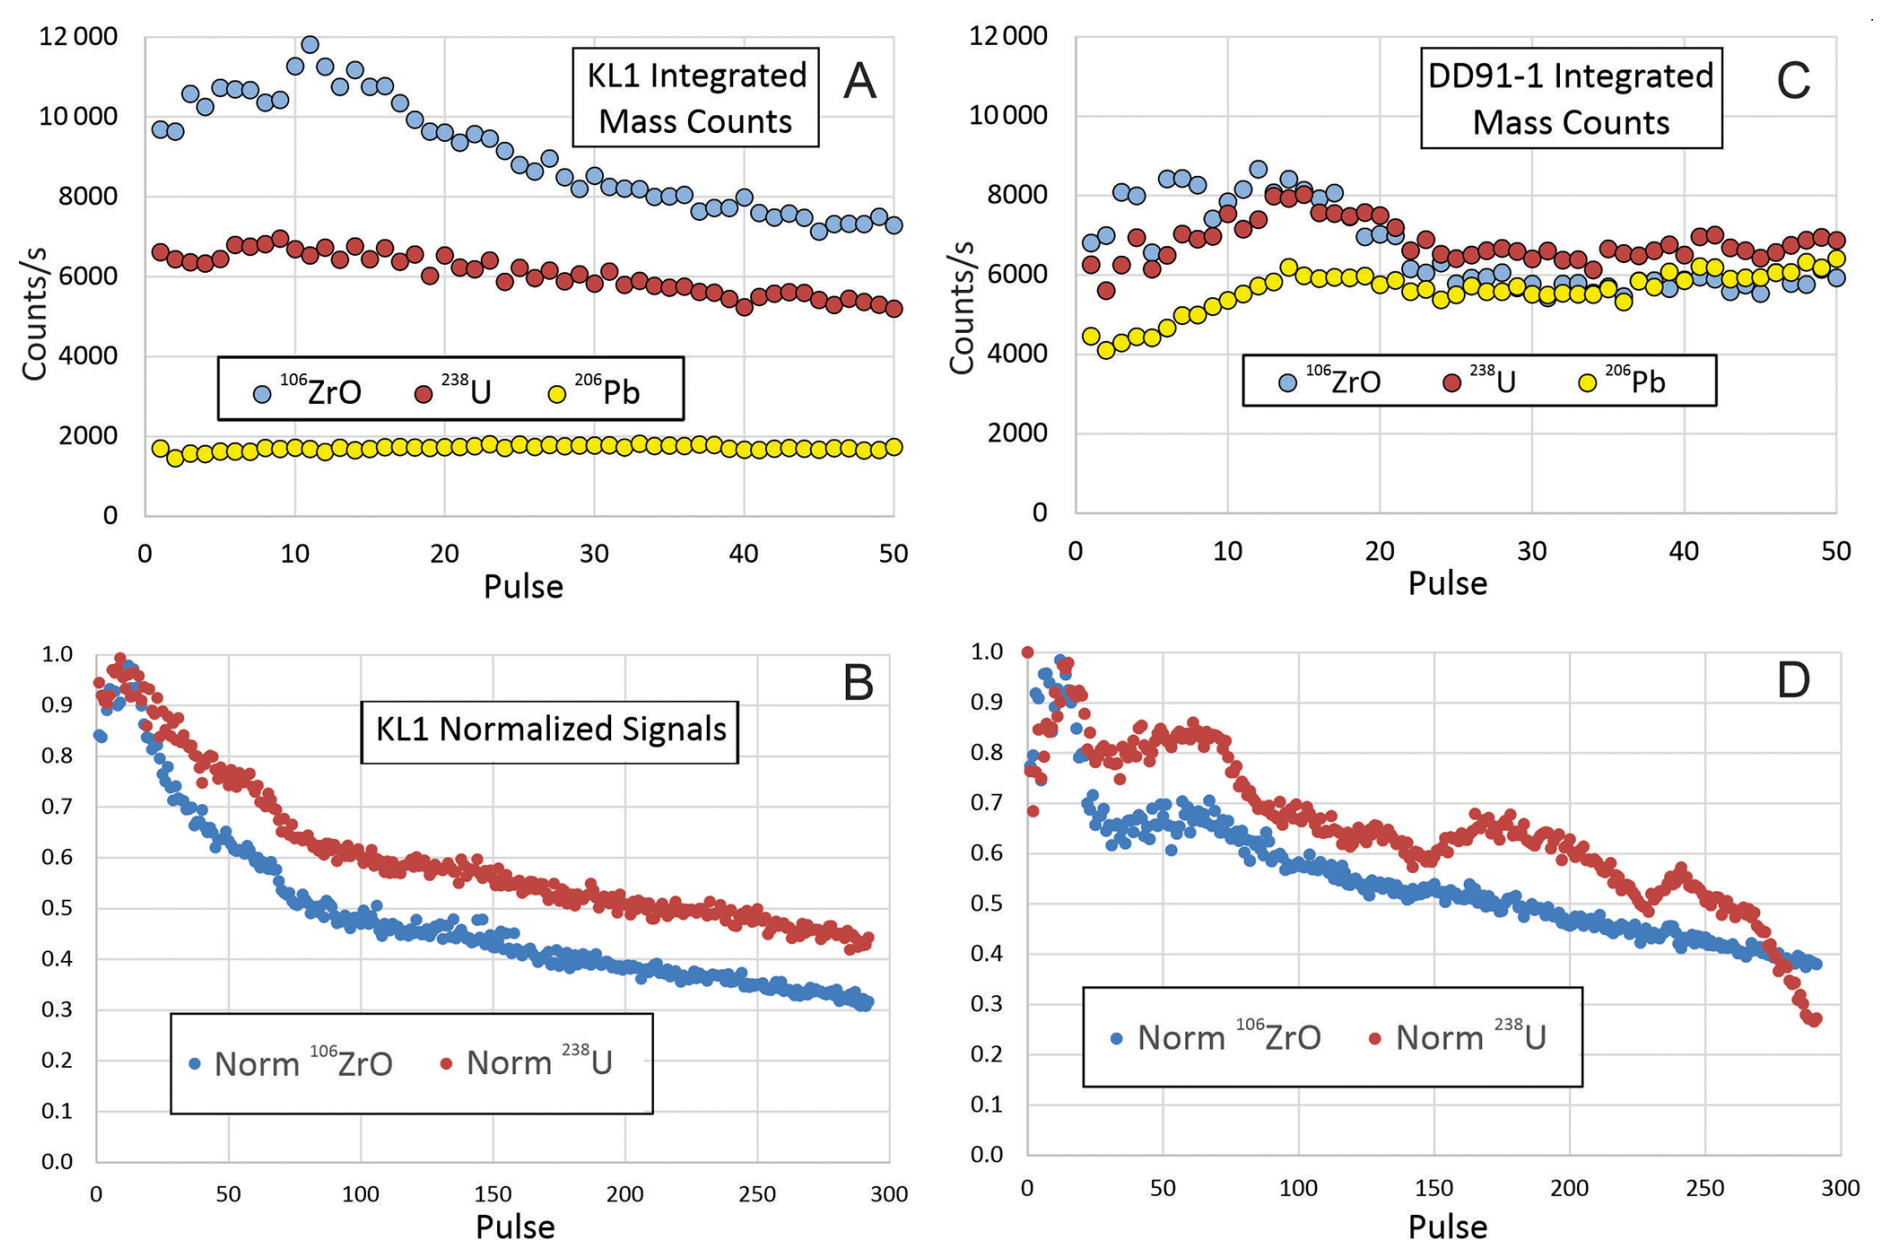
Figure 6Signal profiles for 0.2 Hz analysis on standards KL (A, B) and DD91-1 (C, D). (A, C) signals in counts per second for the early parts of the analyses showing relatively constant or slightly increasing intensity for the first 11 pulses. (B, D) signals normalized to values at the 11th pulse (highest 106ZrO),
Analytical profiles for 106ZrO and 238U from KL and DD91-1 are shown in Fig. 6A, B and C, D, respectively. Data are presented in Supplementary Data File 3. The assumed zero-loss signal intensities used for normalization of ZrO and U are taken as the maximum recorded signals (Fig. 6A and C). For both samples the ZrO intensity is found to increase to a maximum at around 10 pulses and then decrease. It is common with data taken at 10 Hz to see a rapid signal rise over the first half-second followed by a more gradual rise that peaks over 1–2 s and then begins to decrease as with the 0.2 Hz data. The 0.2 Hz data show that this peak is not just a property of the transfer function but of the actual signal. This might be a result of increasing coupling of the laser but it more likely suggests that fallback is the largest component of loss when the pit is shallow and ablation cloud expansion has a large lateral component. Successively larger proportions of ablated material might remain in the deepening pit, while the fraction of material contributing to fallback might be expected to decrease as the pit deepens and the ablation cloud is directed more strongly upward. Since the pit always has an opening equal to the beam diameter, some material will always escape. Therefore, the pit must continuously deepen and, with successive pulses, an increasing proportion of the ablated material might be deposited on the walls. This requires that the base of the pit become progressively narrower as confirmed by Eggins et al. (1998).
The main difference between the signal profiles for KL and DD91-1 is that U zoning in DD91-1 creates fluctuations relative to the ZrO curve (Fig. 6B vs. D). The ZrO curve from DD91-1 also shows an increase between pulse numbers 30 and 70. This corresponds to an increase in U concentration so it might reflect higher radiation damage leading to evaporation of more sample by each pulse or fluctuations in the proportion of fallback, the effect of which is discussed below.
Assuming that the total amount of ablated material with each pulse is constant, the drop in ZrO signals with pulse number should reflect sequestration of material within the pit and as fallback. If this material were melted, it may have lost some Pb due to volatilization, which would be reflected as an increase in measured 206Pb238U, as observed in the ratio profiles for the KL and DD91-1 samples (orange dots in Fig. 7). These show a rapid increase in bias early in the analysis followed by a more gradual quasi-linear increase, which is characteristic of most profiles for zircon.
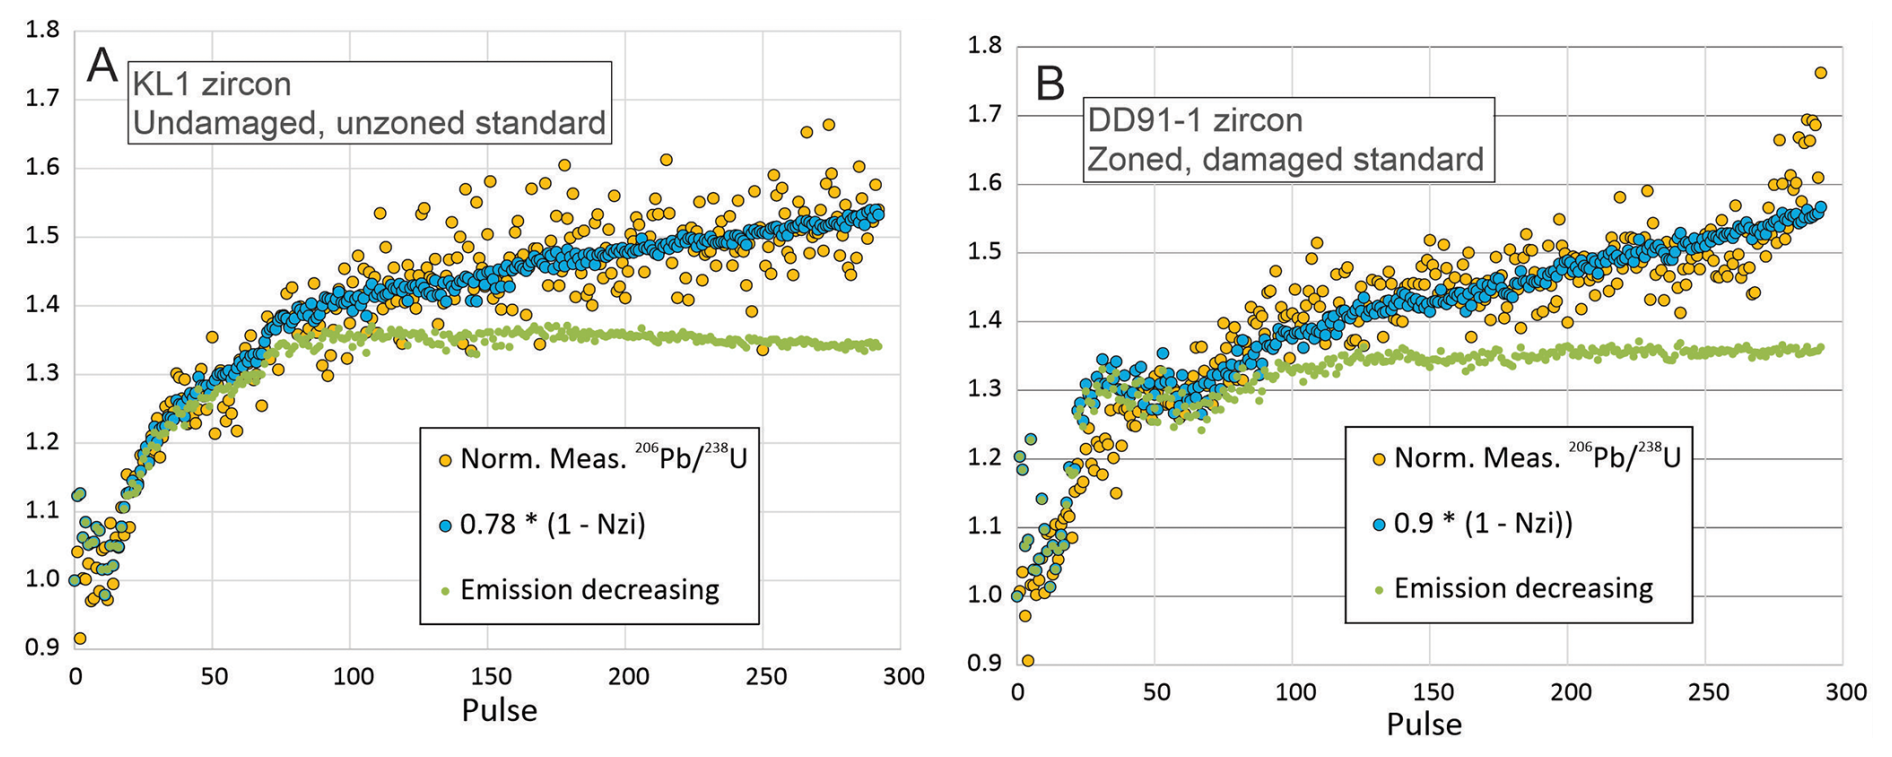
Figure 7Signal profiles for 0.2 Hz analysis on standards KL (A) and DD91-1 (B). 206Pb238U profiles (orange circles) normalized to estimates of instrument-biased true values compared to profiles of ablation deposits scaled by Pb depletion values chosen to maximize fit to ratio profiles (blue circles). Green dots are the same profiles assuming that ablated mass is proportional to area of the base of the pit with a final aspect ratio of 0.8
3.2.3 Modelling ablation bias
The measured 206Pb238U profiles are compared to a function based on 1 minus the normalized ZrO signals shown in Fig. 9B and D (blue dots in Fig. 7). Calculations are shown in Supplementary Data File 3. There are 3 free parameters that can be varied to optimize the fit between the measured and calculated profiles, assuming they are constant over the course of the ablation. One is the normalization factor () which is set at the maximum count rate and represents a minimum estimate. The two others are the proportion of Pb vapourized from deposited material and the proportion of recycling of previous deposits. A higher value for would uniformly elevate the curve. This is unlikely because the early parts of the two curves fit quite closely using minimum estimates for . The choice of higher values for cannot be offset by decreasing the proportion of vapourized Pb. The presence of Pb-enriched fallback (Adamson et al., 2026; Kaser et al., 2025) would not modify the ablation bias profile if fallback sampled equal proportions of ablated material. This is least likely to be the case during the early part of ablation when the proportion of fallback should be decreasing, as argued above from early increasing signal strength. Assuming that the maximum signal is approximately the time at which fallback becomes a constant proportion of the emitted material, it should have no subsequent effect on the fractionation profile.
Multiplying the normalized ZrO depletion curve for KL by 0.78 results in a good fit over most of the measured profile, while a factor of 0.90 optimizes the fit for the DD91-1 curve (blue dots in Fig. 7). These factors could represent the fraction of Pb lost from the deposits assuming that there is no recycling.
Both curves are inconsistent with the inference that emission is proportional to the exposed area of the base and therefore decreases. As discussed above, ablation pits are normally seen to taper with depth (Eggins et al., 1998). The green dots in Fig. 7 show the effect of progressively reducing the diameter of the base of the pit down to 0.8 of that at the surface. This would result in progressive decrease of the normalization factor (the total amount of material ablated per pulse), which would result in lower rates of deposition in the equations in SD File 3, causing the latter half of the 206Pb238U profiles to turn over and begin decreasing. Even if Pb loss were total, the ratio profile would turn over and would rise too fast near the beginning. Recycling would have the effect of further suppressing rise in the profile.
The above data show that in general if not always in detail there appears to be a consistent relationship between the observed 206Pb238U profiles and signal decay curves for zircon. This suggests the possibility of modelling 206Pb238U bias. The mathematical expression of a general model for progressive fractionation of 206Pb238U from zircon using the observed signal decay as a proxy for sequestration of fractionated deposit is developed in Appendix 1 and formulated in Excel in Supplementary Data File 3 as a series of recursive equations. These calculate the Pb fractionation of an ablation cloud after absorbing a previously fractionated target, and the measured value after sequestration of material as pit deposit and fallback. The Pb loss factor Li per pulse is 0 if there is no Pb loss and 1 if Pb loss is total. The proportion of recycling per laser pulse, Ci, in the equations can vary from no (0) to complete (1) recycling where each successive pulse completely ablates the previous deposit. Recycling can only occur within the pit.
The early part of measured profiles is discussed in detail in the next section. Bias does not show the initial decreasing trend expected from fractionation of basal melt. This is most likely due to high recycling of melt when the pit is shallow. PbU ratios from the first ten pulses, during which Pb-depletion in the basal melt approaches an equilibrium value such that the vapour is unfractionated, are simulated in the model by decreasing the recycling factor progressively from 0.9–0, which removes what would otherwise be a downward trend in modelled ratios (Fig. 8, Supplementary Data File 3).
Measured ratios are affected by instrument bias, which is constant, and ablation bias, which varies with pulse count. In the model (Fig. 8), 1 means no ablation bias. The measured ratios must be normalized to a number that is adjusted to provide an optimum fit to the model. The optimum normalization factor should be the product of the unbiased 206Pb238U ratio (a function of age) with the instrument bias. The instrument bias can be removed and the unknown age determined after dividing by the optimum normalization factor found from measurements of a standard of known age measured during the same session.
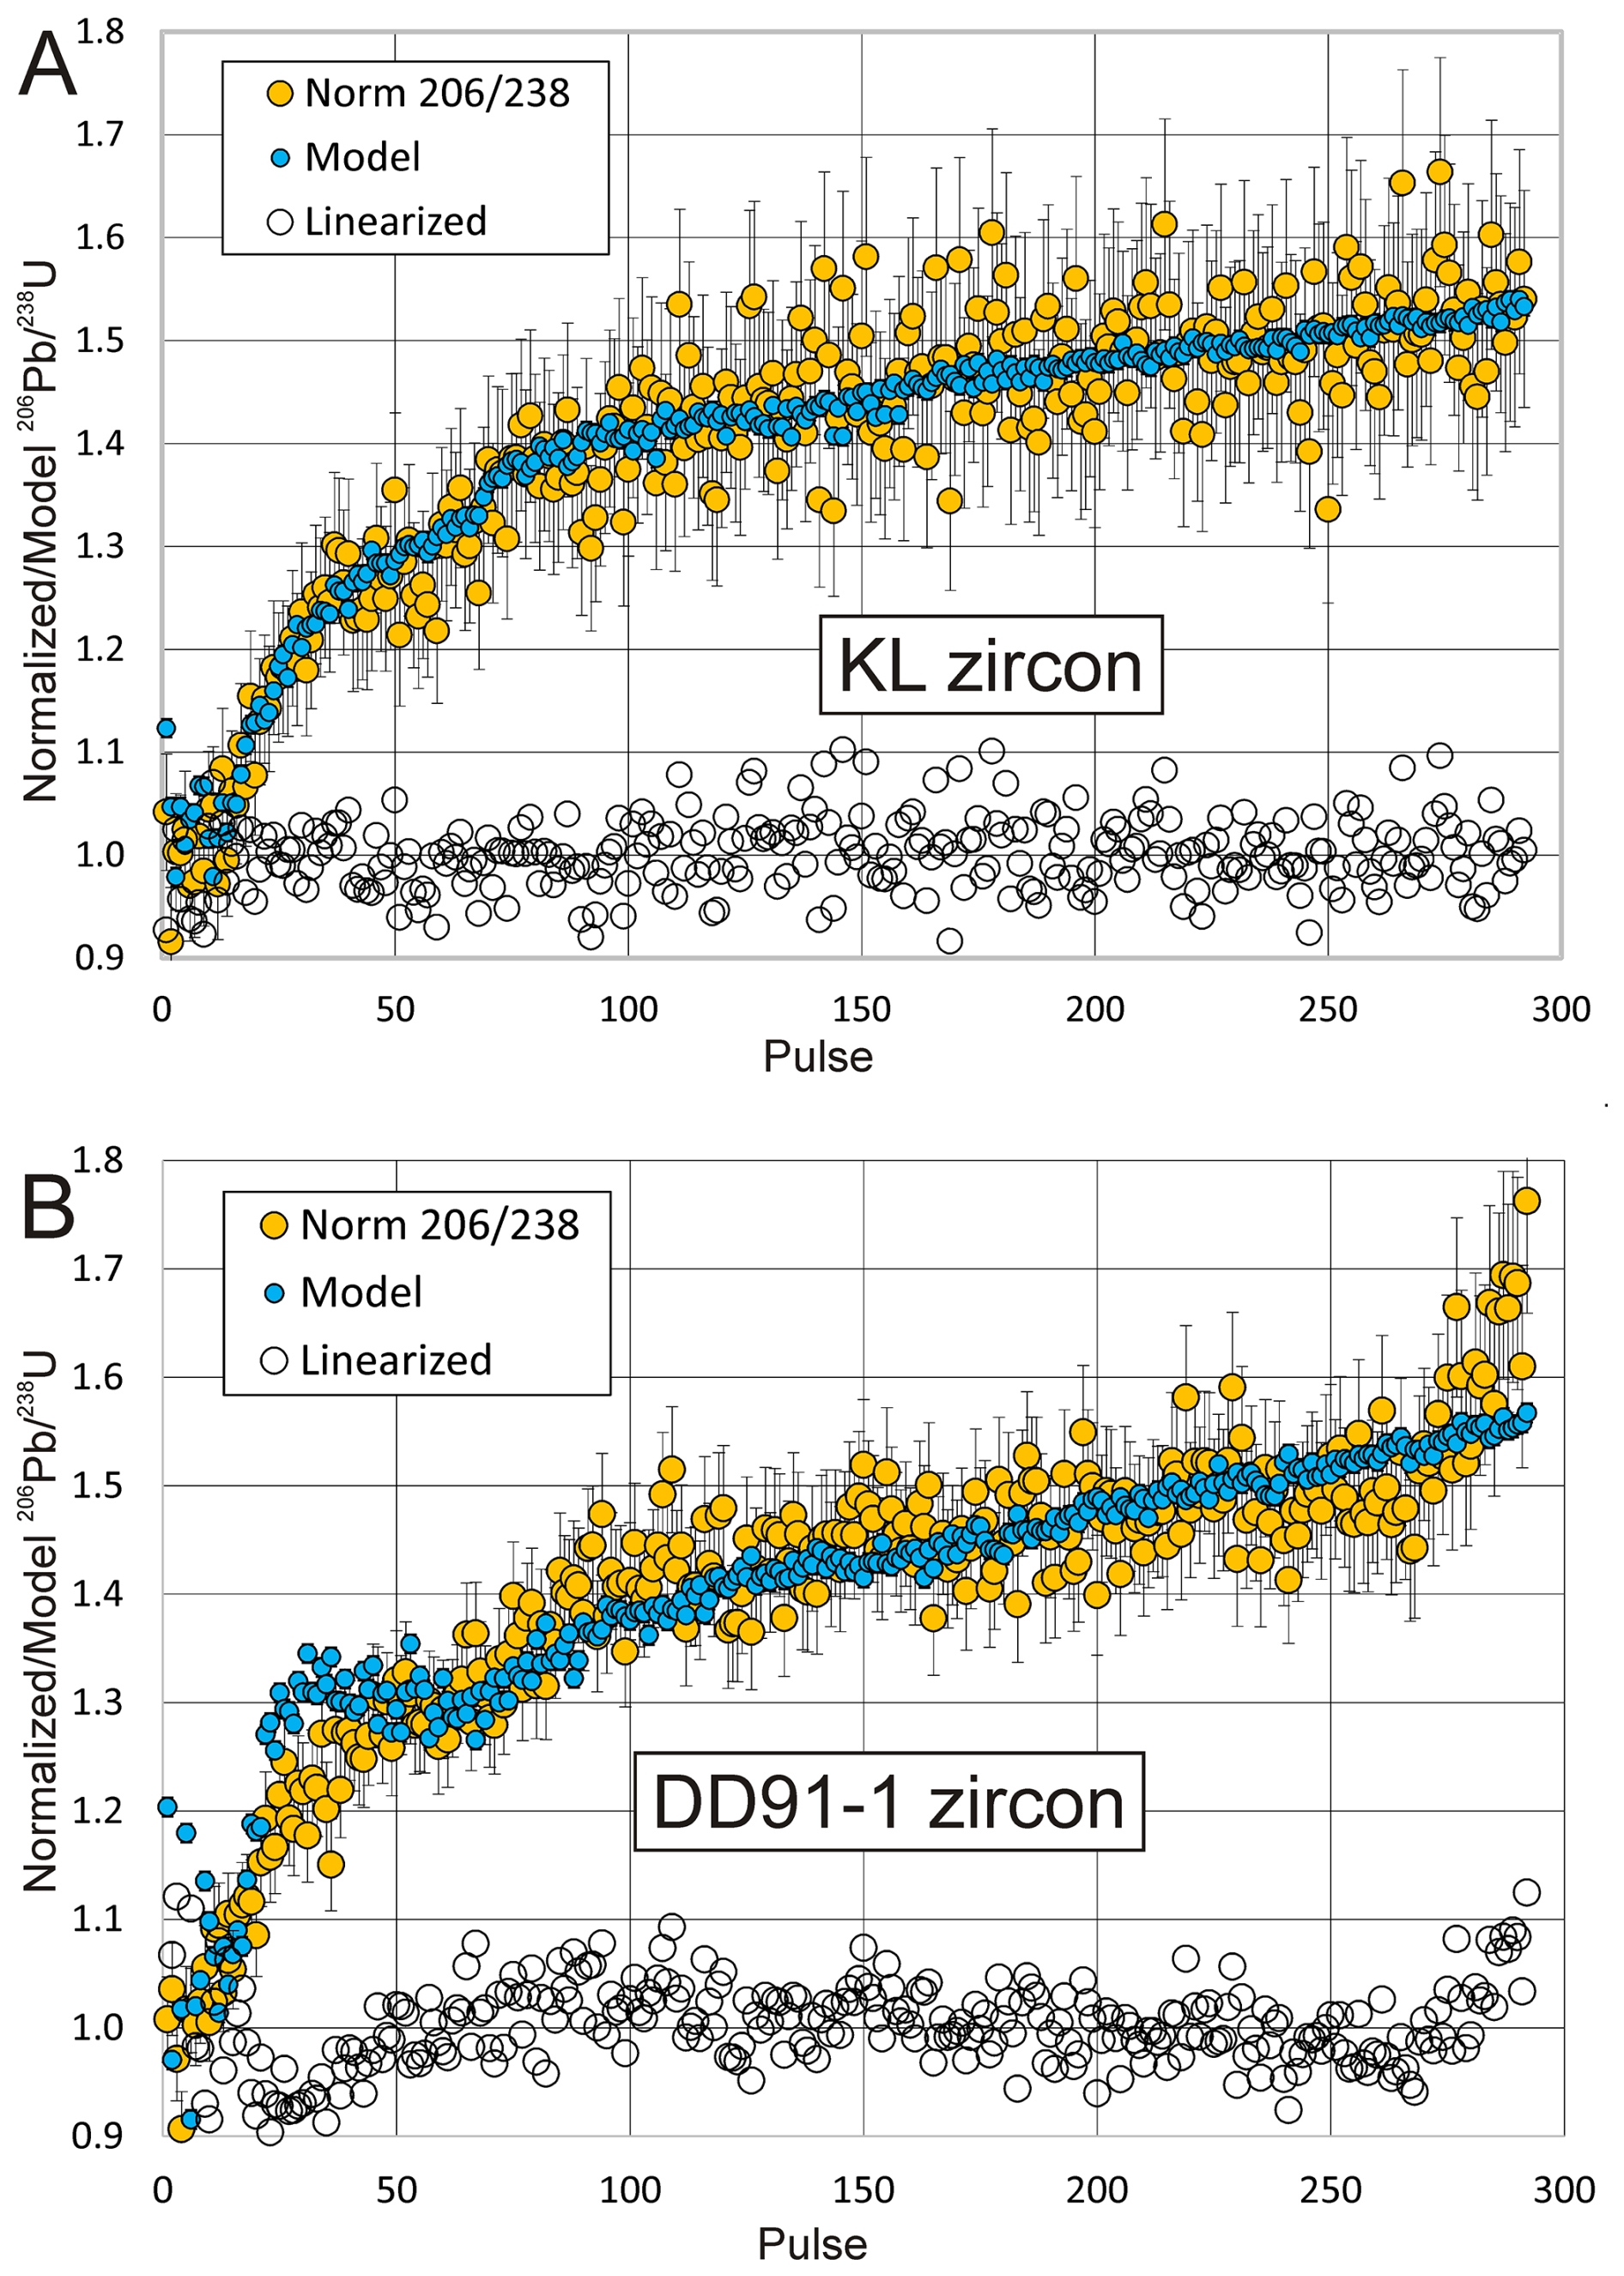
Figure 8Normalized measured 206Pb238U ratio profiles and modelling results from 0.2 Hz analyses of zircon KL-1 (A) and DD91-1 (B). Normalization factors, were taken from the mean of the first 10–12 data shown Fig. 12. Pb loss is taken as constant at 0.78 for (A) and 0.9 for (B). Recycling is zero except for the first 10 pulses as explained in the text. Linearized data are explained in the text. Error bars represent 1 sigma estimates based on counts.
As expected from the match between deposit retention and ratio profiles, the model for KL data in Fig. 8A can be made to fit the normalized ratio profile quite well with a loss factor of 0.78 and zero recycling of deposits while the best fit for DD91-1 data in Fig. 8B requires a loss factor of 0.90 with zero recycling. Increasing the recycling factor suppresses the fractionation profile similarly to decreasing the loss factor, but there is reason to suspect that the beam cannot couple to the steep wall of the pit, hence cannot re-ablate fractionated deposits, and that deposited material is quite fractionated in PbU.
The model for DD91-1 data shows an anomaly between pulses 25–50 where both ZrO and U signals begin to increase, but this is not reflected in the measured ratio profile. The increase in ZrO emission between pulses 30–60 (Fig. 6D) suggests that this zone is more damaged resulting in the pulses ablating more material. This would effectively raise the normalization factor which, if included in the calculations, would reduce or nullify change in the trend of the ratios. ZrO and U profiles from both samples (Fig. 6C and 6D) show a discontinuity in slope at about 60 pulses, following a short (40–60 pulse) period of stasis. This corresponds to the beginning of a short rapid increase in measured ratios, which subsequently slows to follow an extended linear trend.
The rapid increase in 206Pb238U at the end of the measured profile for DD91-1 (Fig. 8B) cannot be explained by the model. This is associated with a drop in U signal but no change in the ZrO trend (Fig. 6D). The best explanation may be beam intersection with a significantly older core. Even though cores have never previously been noted in this sample, it is from an intrusion in metasedimentary rock which contains abundant older detrital zircon (Davis, 2002).
The aim of fitting data to a curve, whether empirical in conventional calibration or model-dependent, is to remove biases on all data, allowing them to be averaged to determine a more precise value for the 206Pb238U ratio. Elaborating on the previous description, it is necessary to normalize each measurement in the ratio profile by a factor, R0, that provides the closest match (minimum MSWD) between data and model. R0 should then be the 206Pb238U ratio corrected for ablation bias (although still affected by instrument bias). An error on R0 could be determined from all the data by dividing the measured ratio values by the corresponding model value as shown by the “linearized” points in Supplementary Data File 3. A realistic model should result in a randomly scattered distribution of adjusted measured data that fits a horizontal line. The weighted mean of this distribution should then give the best estimate of unbiased 206Pb238U ratio and error based on all data. Unfortunately, this approach is not practical because there are too many degrees of freedom. In addition to uncertainty about the choice of a normalizing factor for the ZrO signal, fitting a model to the data also requires choosing Li and Ci factors (i is the pulse number). For example, a theoretical ablation model could be forced to exactly match data points by adjusting Li, and Ci for each laser pulse using an arbitrary R0 value but this would be meaningless. Similarly, adjusting one or two constant model parameters can produce acceptable fits with variable estimates of the unbiased ratio so this is also meaningless without independent knowledge of the parameters. Despite the apparent effectiveness of modelling in this case, it cannot by itself provide accurate correction of ablation bias. However, it provides a mathematical platform for testing ideas against observed data so might help improve understanding of the ablation process.
3.2.4 Consistency of early ratios
As mentioned, melting and partial volatilization of basal melt at the beginning of an analysis should result in a high, decreasing ablation bias of signals from the earliest pulses as the basal melt reservoir becomes more negatively fractionated (Fig. 3C). Eventually, negative fractionation of the melt reaches an equilibrium value where it offsets fractionation of the signal, which should result in an unfractionated signal, except that the early downward melt fractionation trend is opposed by deposition of fractionated fallback, forcing signal fractionation upward. Given these opposing factors it is surprising that fractionation usually seems to increase most rapidly near the beginning.
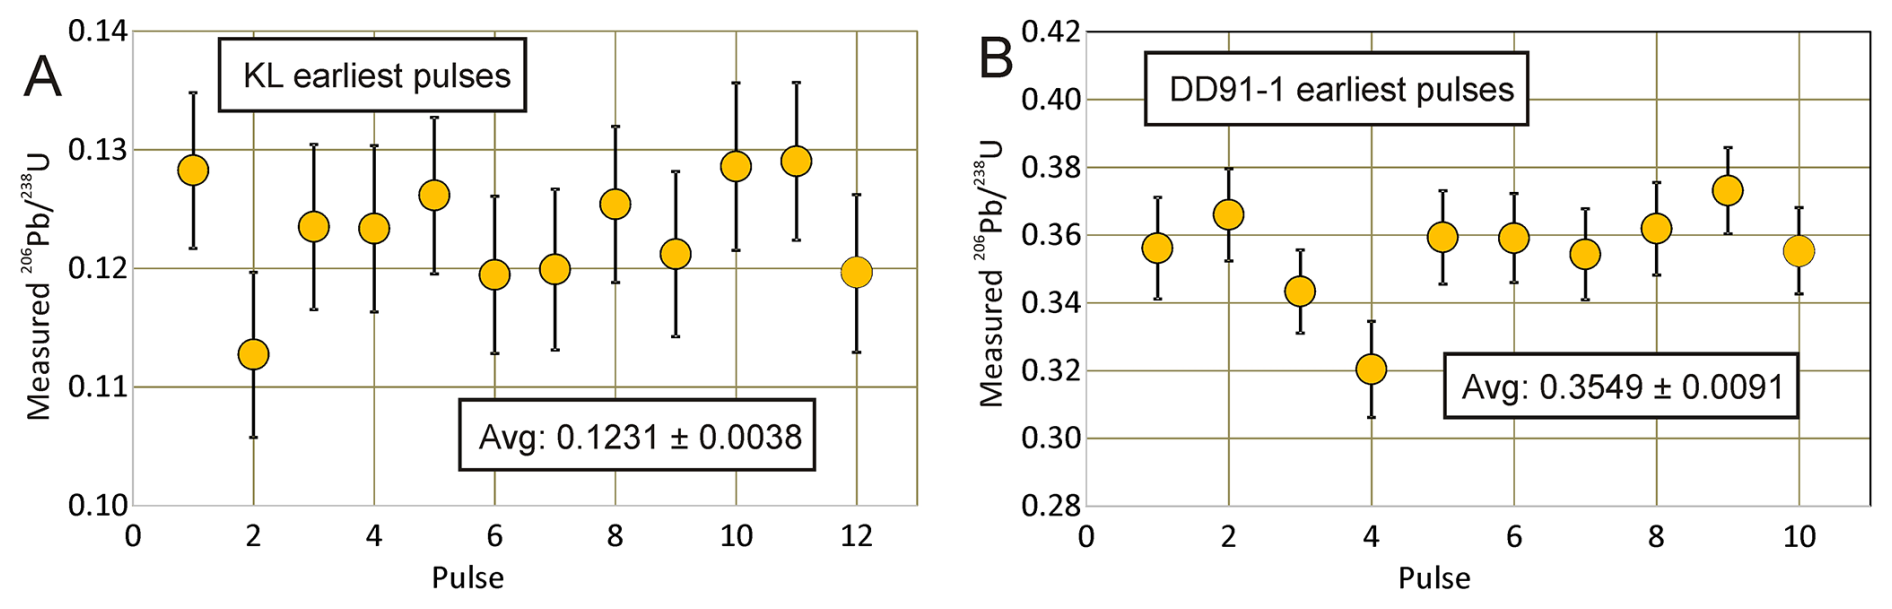
In fact, there is a notable mismatch to the main fractionation profile over the first 10 pulses from both of the above standard samples in which the ratio measurements show no consistent increase (Fig. 9). For KL, the average of the first 10 absolute 206Pb238U measurements is 0.1231±0.0038, which corresponds to a instrument bias of −31.5 %. while for DD91-1 it is 0.3549±0.0091, corresponding to a instrument bias is −31.2 %, showing that results in this case are consistent. The first 10 pulses correspond to an anomalous period of increasing emission, which might be explained by rapidly decreasing fallback, but this does not explain the quasi-constant ratios. This may reflect an unstable balance between upward fractionation due to fallback deposition of Pb-depleted deposit and entrainment of Pb-depleted material from a shallow melt pool.
To evaluate fractionation before the reduction in slope of the 206Pb238U profile, measurements of the first 60 pulses were conducted on KL, DD91-1 and a relatively low-U but zoned Archean standard, DD85-17, using laser frequencies of 0.2 and 10 Hz. Results from the first 5 pulses of the 10 Hz runs are omitted because the signals have not stabilized. The data set shown in Fig. 10A was acquired during a different session from that in Fig. 10B so instrument biases (Y-intercept) cannot be compared between them but should be similar for data from a single session. The number of pulses analyzed was between 50 and 60. Spot sizes are given in the “Summary” sheet of Supplementary Data File 4.
Data in Fig. 10 are averages of 4–6 runs for each sample. Data from individual runs are shown in Supplementary Data Files 4 and 5 for runs carried out at 0.2 and 10 Hz, respectively. Although the average ratios show a linear increase, about half the individual 0.2 Hz runs show 206Pb238U ratios in the first ten pulses that do not obviously increase or increase more slowly than ratios from subsequent pulses. The y axis intercept of the average regression line from DD91-1 is distinctly (∼5 %) higher than intercepts from the average KL and DD85-17 data (Fig. 10A and B). One might expect a higher slope from a more damaged zircon such as DD91-1. KL should be the least damaged because of its relative age and U concentration but DD85-17 shows the lowest intercept and slope. The variability of intercepts within a single session suggests that apparent ablation bias from the earliest pulses can be chaotic and may be affected by radiation damage. Therefore, this approach cannot be used to precisely remove instrument biases by comparing to a zircon standard.
3.2.5 Theoretical summary of ablation process
Based on limited experimental evidence, a possible theory to explain a typical ablation bias profile might be as follows. 206Pb238U measurements from the first ten or so laser pulses are dominated by an initial positive and decreasing bias as well as a relatively large proportion of fallback. Because fallback should be dominated by larger melt droplets, it should be depleted in Pb, forcing the signal toward positive fractionation in opposition to the effect of the basal melt. As negative fractionation of the basal melt increases, positive fractionation of its vapour decreases. The effect of depositing negatively fractionated fallback then dominates, driving the profile rapidly upward. As the pit becomes deeper, directing the ablation plume upward, fallback may decrease and its fractionation may become positive if its composition becomes more similar to that of the average plume. From this point changes in fractionation may be dominated by deposition of depleted ablated material on the wall of the deepening pit resulting in a linear trend for the measured profile.
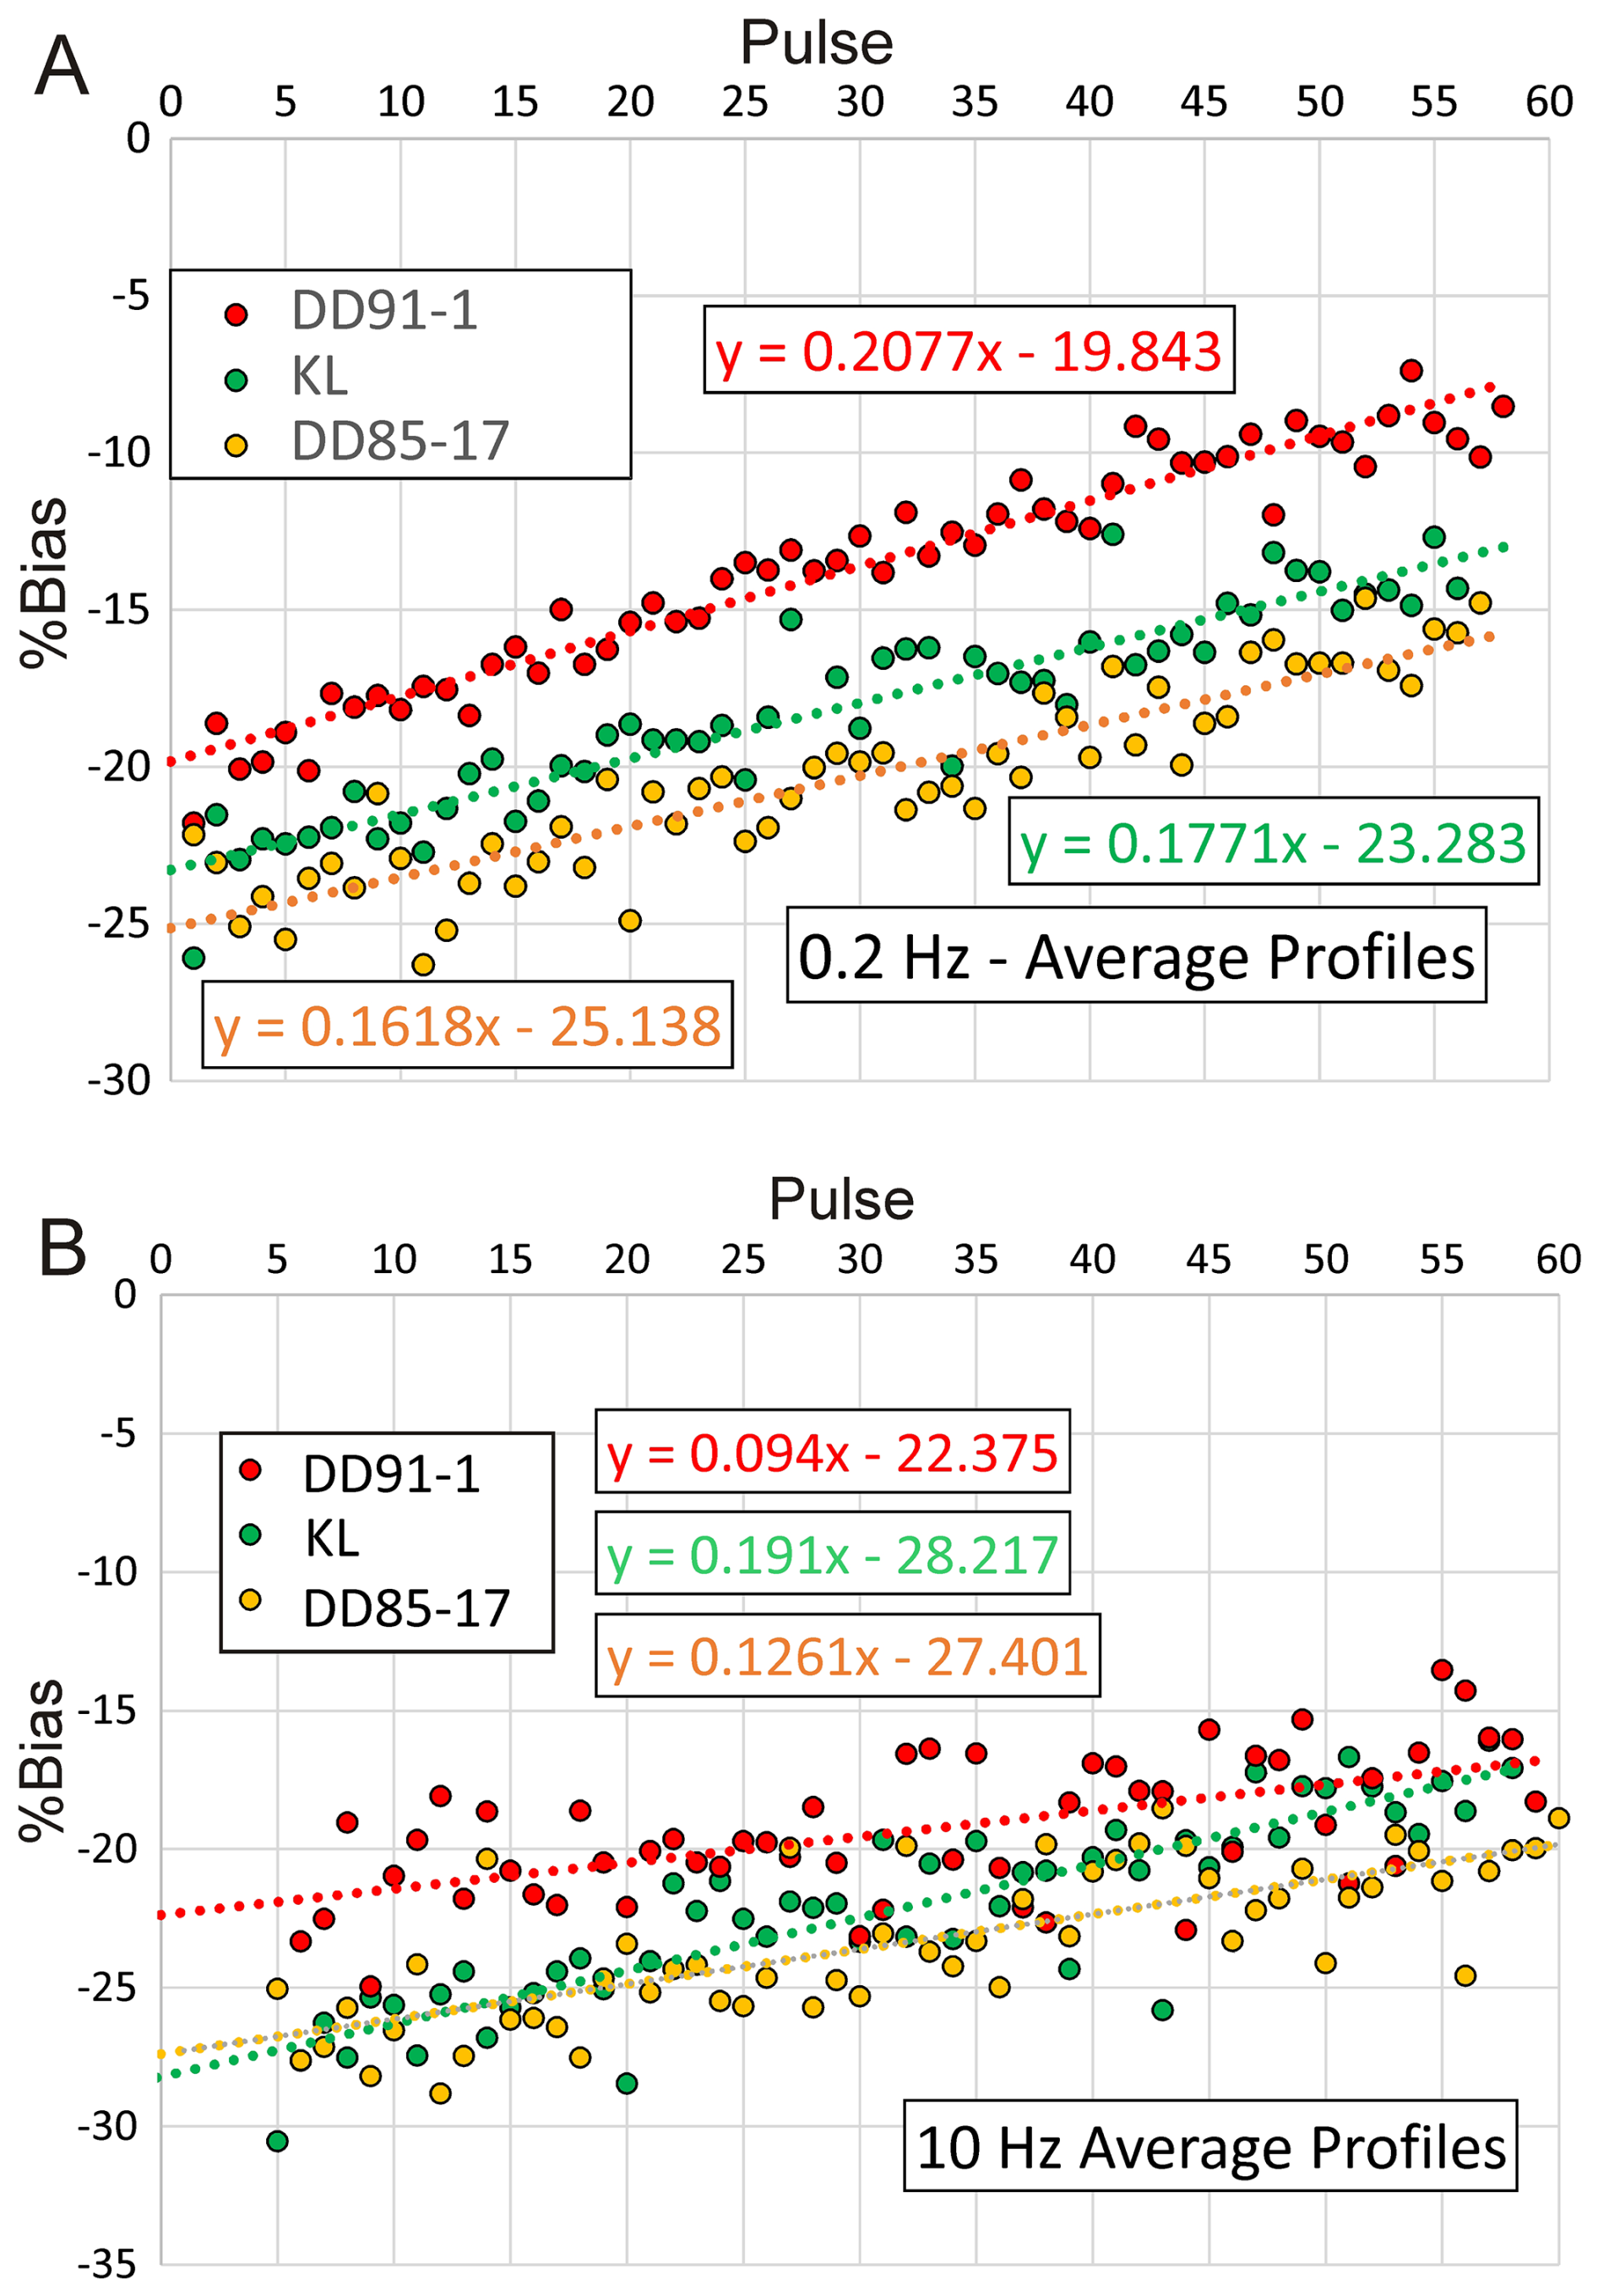
Figure 10Percent difference between the measured and true 206Pb238U ratios of three zircon standards for data acquired at (A) 0.2 Hz and (B) 10 Hz. Each set of symbols represents an average of analyses on 4 spots. Analyses shown in A and B were carried out during different sessions with different instrument bias.
3.2.6 Correcting PbU bias
The Y-intercept of data from the early (rapidly increasing) phase of a ratio profile appears to be affected by the structural state of the zircon and so does not appear to provide a well-constrained estimate of instrument bias. It is notable that both ratio profiles show a linear increase from about 100 to at least 250 pulses corresponding to a linear decrease in ZrO signal. Gehrels et al. (2008) proposed regressing the later linear section of profile data and using the Y-intersections of a standard and a sample to determine the unknown age. If both are affected by the same biases these will cancel, giving the ratio between unknown and known values of 206Pb238U. In this case, the ratio calculated from the intercepts is +0.9 % (higher) than the true ratio, which is accurate within measurement errors although our ablation pits are probably much deeper than those of Gehrels et al. (2008).
A more conservative estimate might to compare the averages of all, or most of, the 206Pb238U profiles. Despite profiles for the KL and DD91-1 standards not being identical, the ratio of the averages is only 0.2 % different from the ratio based on the accepted ages of the standards when the profiles are terminated at 260 pulses before the anomalous increase for DD91-1.
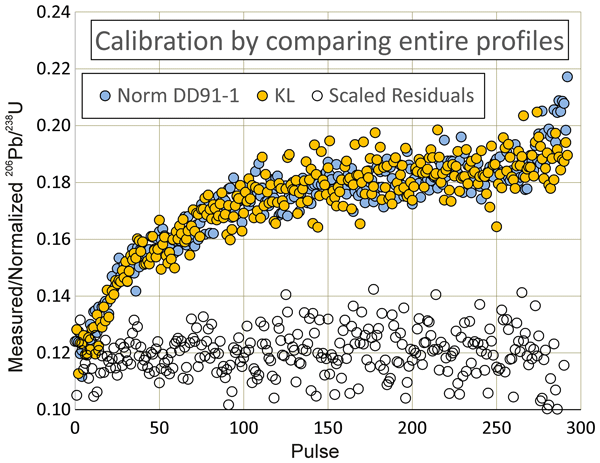
The most comprehensive way to calibrate a sample of unknown age using a standard should be to directly compare the fractionation profiles. This is done by multiplying each of the 206Pb238U data in the fractionation curve from the standard by a factor that gives a minimum MSWD between the two data sets. This approach is shown on Fig. 11. Calculations are shown in Supplementary Data File 3, KL Data sheet, columns BJ-BQ. Since this requires direct comparison between the two fractionation profiles, it reveals whether or to what extent standard and sample are an appropriate match. The normalized profile for DD91-1 is a remarkably close visual match for that of KL before the rapid increase in ratios in the last 30 pulses of the DD91-1 profile. Omitting this part, gives a calculated ratio 0.8437, which is +0.15 % different from the true ratio. Given the differences between the normalized ZrO profiles found for KL and DD91-1 (Fig. 8), it seems surprising that the shapes of the measured ratio profiles for both zircon samples fit so well (Fig. 11), which suggests that we still have a limited picture of the ablation process.
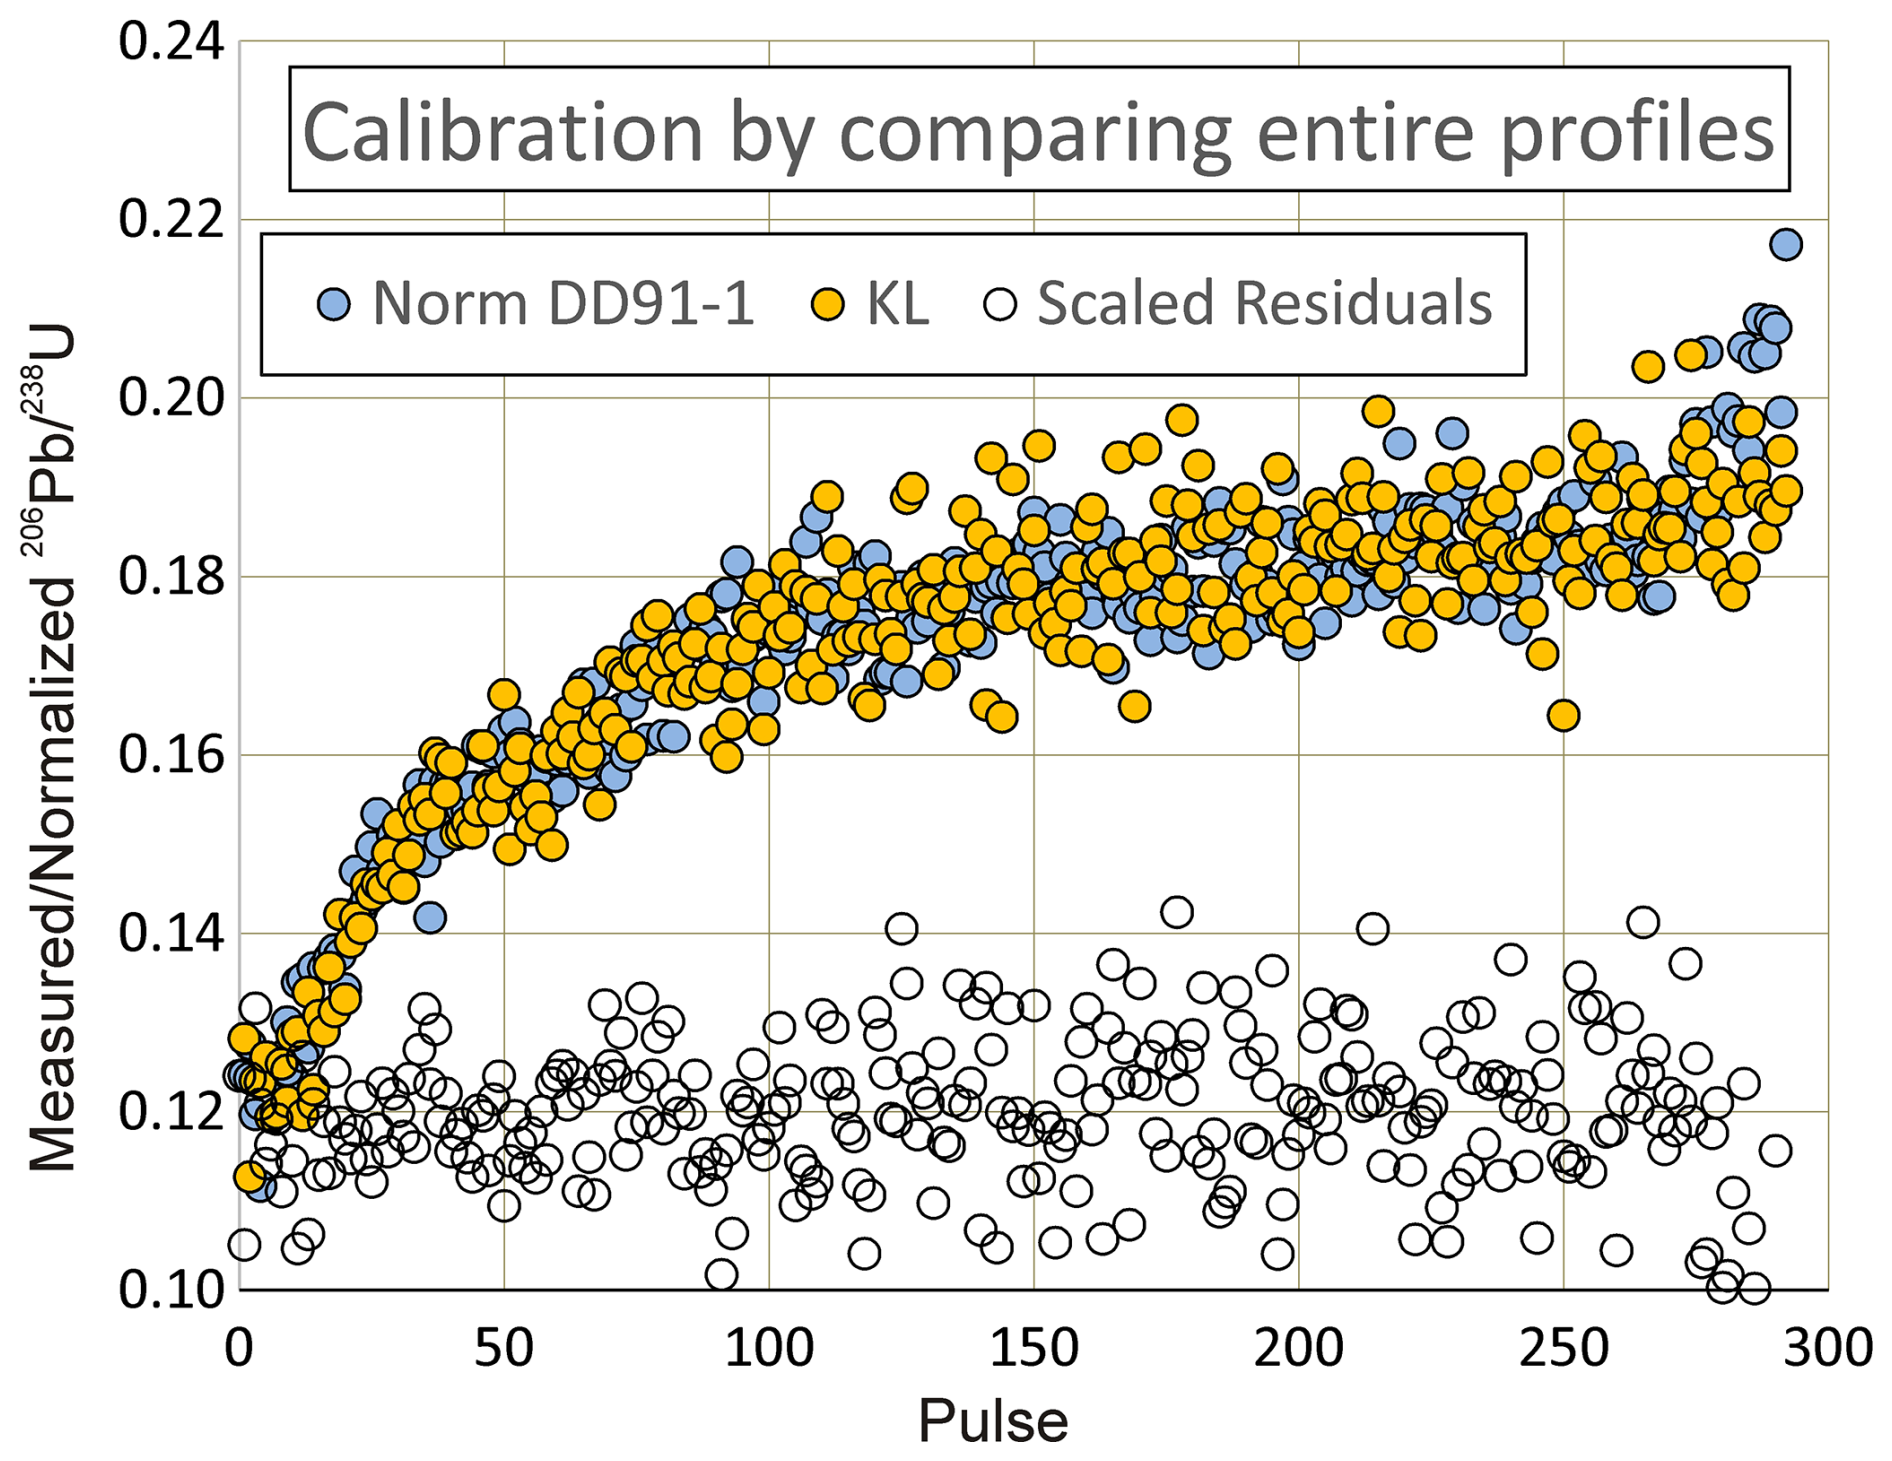
Figure 11Comparison of measured KL ratio profile (taken as the standard) with measured DD91-1 profile (taken as the unknown) normalized to minimize the sum of squares of differences between corresponding data points (residuals). These are scaled so they are visible on the plot. The residual for two overlapping data would plot on the 0.12 line. Omitting the last 30 data, a normalization factor of 2.868 gives the minimum sum of residuals. The inferred 206Pb238U value is 0.15 % different from the accepted ratio.
A program has been written to easily process U–Pb data according to the above method of matching 206Pb238U profiles between sample and standard. Data are entered into an Excel spreadsheet and processed using Visual Basic for Applications (VBA). The program, called UTILAZ (University of Toronto Isotopes Laser Ablation of Zircon) along with instructions, is given in Supplementary Data File 6. The program allows editing of data. The average 206Pb238U profile from standard measurements before and after a sample measurement is adjusted by a calibration factor calculated so that the sum of squares of the differences between sample and standard data is minimized between chosen limits of the profile. The approach proposed by Paton et al. (2010) and used in Iolite is similar except that it involves smoothing profiles using cubic splines. Matching sample and normalized standard profiles gives results that are very similar, but not identical, to just dividing the averages of the two profiles, but the comparison approach provides a better way to calculate errors from dispersion of the data as the square root of the mean of squares of differences between sample and standard data divided by their number.
The program is applied to Precambrian zircon in Supplementary Data File 6, which includes raw data. KL is chosen as the standard and, as mentioned, should be the least damaged, while JG-diorite, DD85-17 and DD91-1 are Archean with DD91-1 having significantly higher U. Sample 21CB1242 has the highest U concentration and appears to be completely metamict. Alteration is clearly visible in BSE images and was avoided at the surface. 88Sr was measured as a proxy for alteration at depth. “Standard” analytical conditions were applied with beam diameter of 30 µm.
Results are summarized in Table 1 (Supplementary Data File 7) and Fig. 12. Discordance is calculated as the percent difference between the 206Pb238U ratio of a concordant point with the measured 207Pb206Pb ratio, and the 206Pb238U ratio of the datum (positive if below the concordia curve). The shapes of 206Pb238U profiles for non-metamict samples generally match well with their adjusted standard profiles. Although their calibrated 206Pb238U data scatter somewhat outside of errors, the averages are all within ±1 % even though these grains should have been affected by a range of radiation damage. 206Pb238U profiles from the metamict zircon are somewhat flatter than those from the standard and the calibrated data show reverse discordance from −6 % to −19 %.
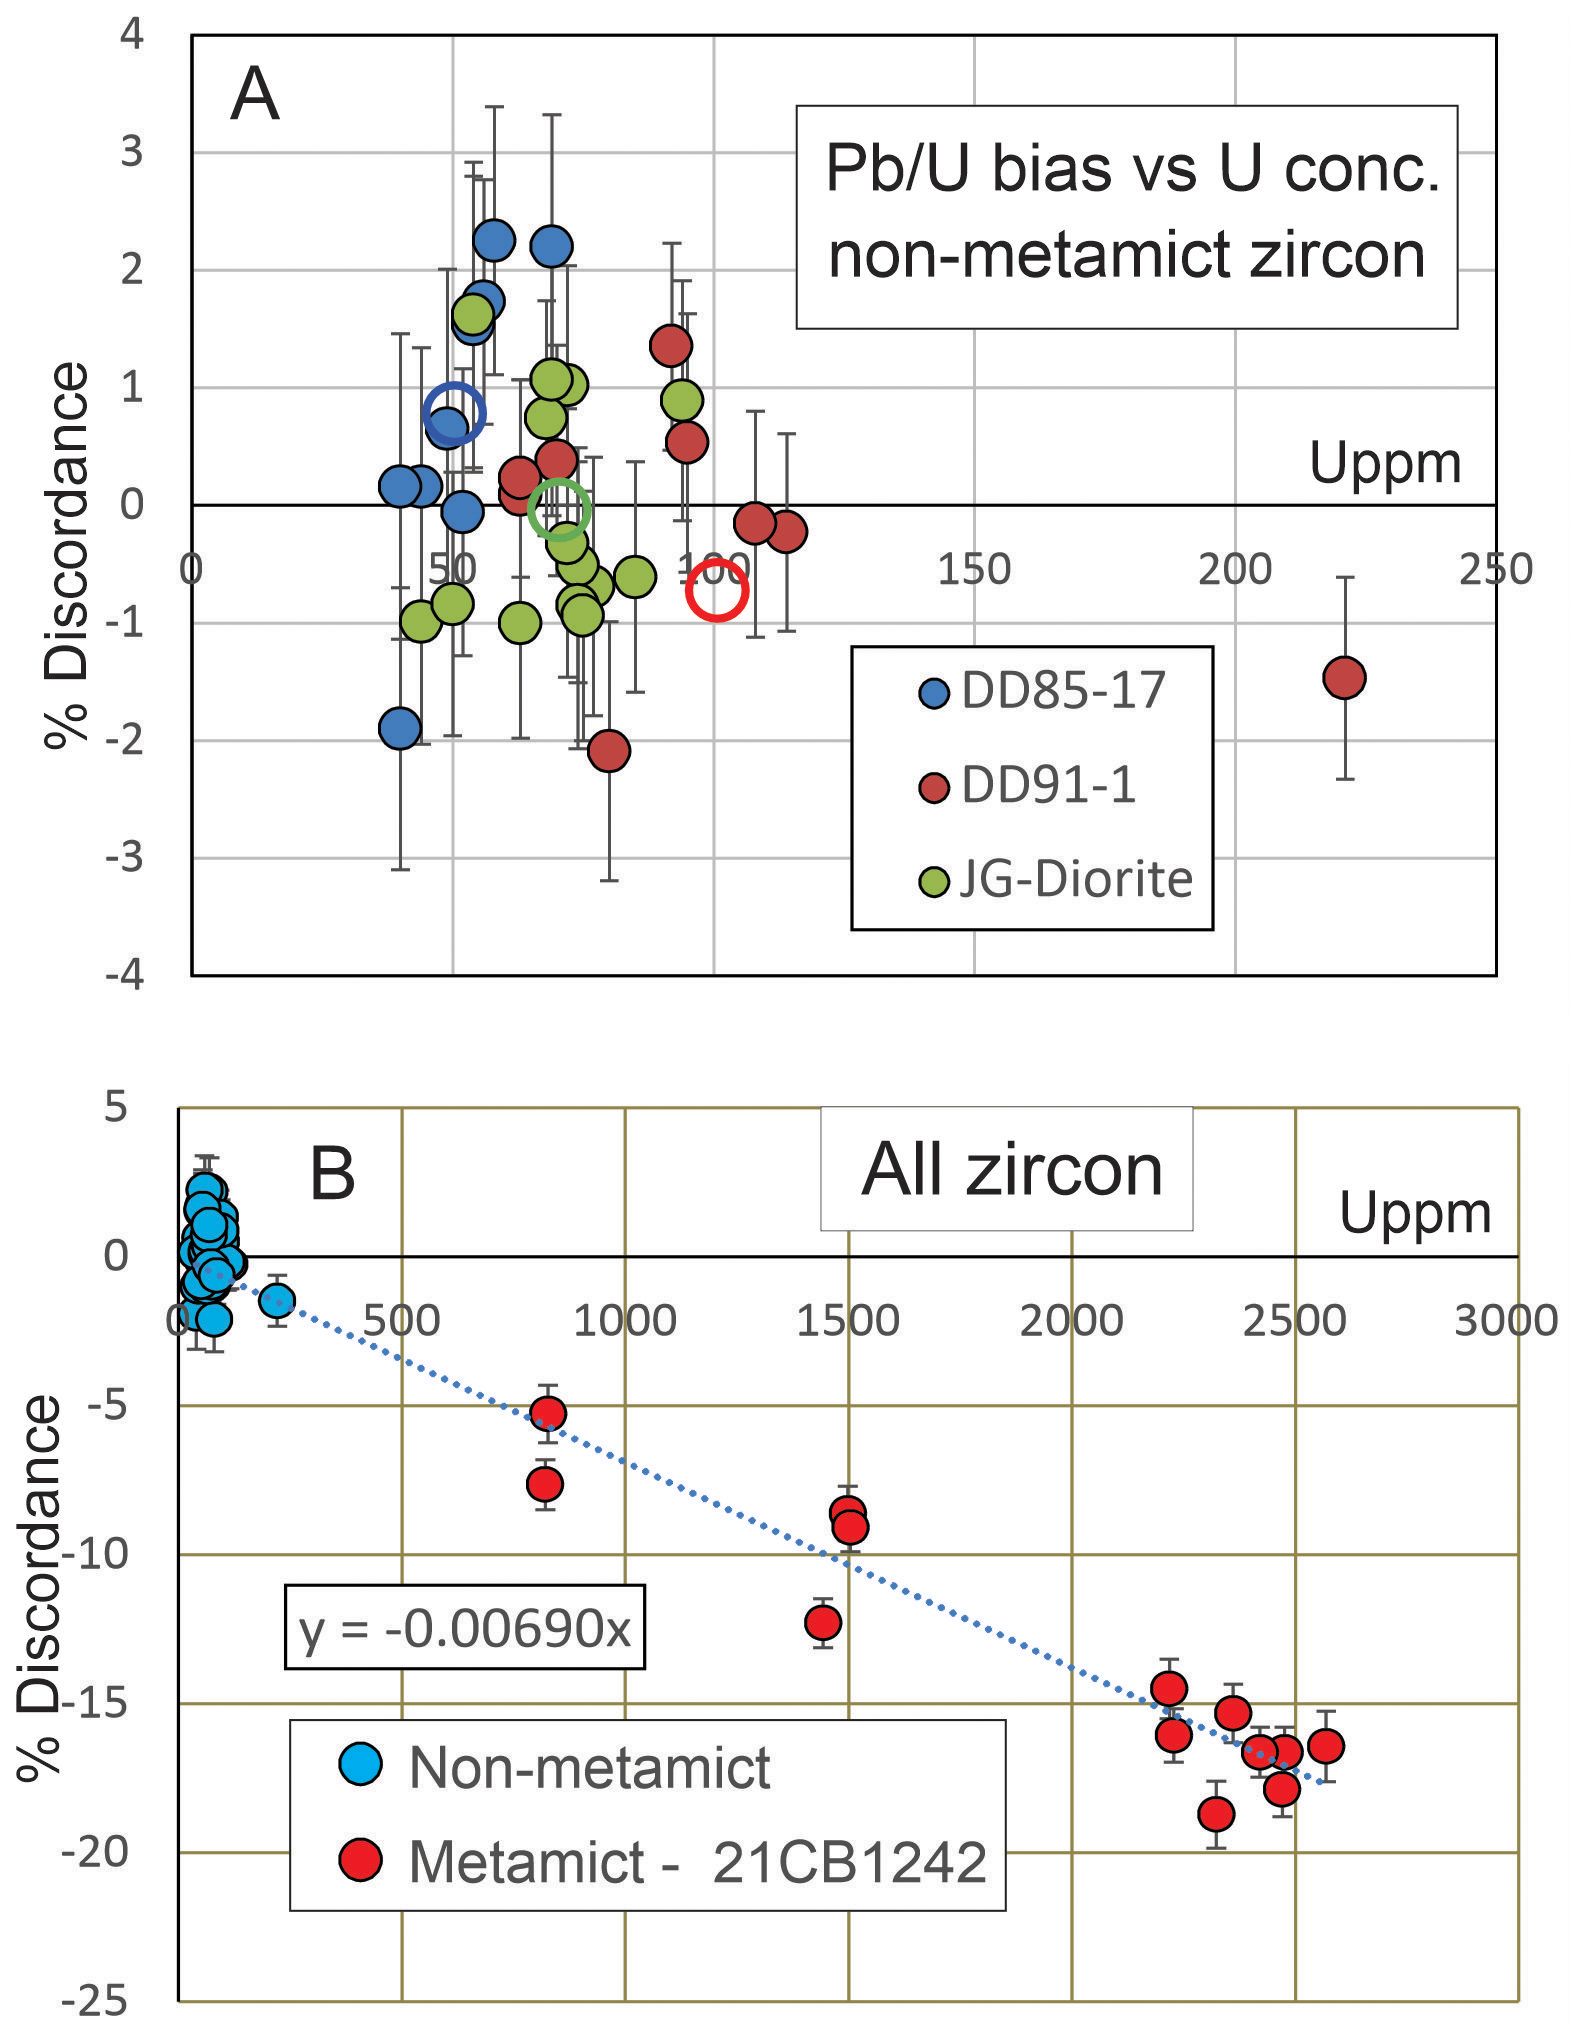
Figure 12Results of UTILAZ data reduction on zircon with variable ages, U concentrations and radiation damage. Error bars represent 2 sigma. KL was used as the standard. (A) Data from non-metamict zircon. Open symbols represent averages. (B) Data from metamict zircon U (>500 ppm) show a roughly linear relationship between U concentration and negative discordance. The regression line is forced through the origin.
Metamict zircon might be expected to ablate more rapidly, resulting in a deeper pit and more fractionation than the relatively undamaged standard. This should result in a larger and more rapidly decaying ZrO signal, which is generally the case (Supplementary Data File 6). The UTILAZ program includes the ability to adjust calibration factors according to ZrO signal profiles, which were fitted to exponential functions to calculate normalized decay signal profiles as in the previous models. Adjusting the standard calibration results in an over-correction for the data from the metamict zircon and makes the non-metamict zircon data more discordant. These results are not shown but can be replicated using the software. The average ZrO signals from all measurements are roughly constant (Supplementary Data File 6). They show no correlation with U concentration and damage, which seems surprising if metamictization results in greater ablation volumes. Higher fallback could be an explanation, but this is contradicted by the fact that data from the metamict zircon show a correlation between reverse discordance and U concentration (Fig. 12B). This might serve as a first-order correction to 206Pb238U bias even though its cause remains unclear.
Measurement biases on 206Pb238U in LA-ICP-MS can be divided into instrument-induced and ablation-induced. Line scans of NIST glass standards are affected by higher ablation bias than scans on a megacrystic zircon standard such as Keuhl Lake (91500).
Down-hole fractionation of measured 206Pb238U during laser ablation of minerals is a result of the release of volatile Pb during boiling of the ablated sample followed by sequestration of Pb-depleted melt droplets as fallback around the pit and along pit walls. PbU fractionation during the first 10 or so laser pluses is the result of approach to isotopic equilibrium between Pb-depleted melt and Pb-enriched vapour, opposed by deposition of Pb-depleted material. These might produce apparently constant ratios but the results are chaotic and the measured ratios will always be biased toward high PbU. Subsequently, the effect of Pb-depleted fallback dominates, leading to a rapid rise in measured 206Pb238U ratios. This is followed by a slower rate of increase after about 80 pulses as sequestration along the wall of the pit becomes dominant and finally a linear increase in ratios that corresponds to a linear decrease in signal strength. The measured profile can be broadly modelled using the 106ZrO and 238U signal profiles as a proxy for the amount of sequestered material and the effect of U zoning. Models suggest a high degree of removal of Pb from the ablation cloud and a low degree of re-ablation (recycling) of sequestered material. However, modelling cannot accurately constrain the unbiased ratio (age) because of unconstrained variations in these two parameters. Extrapolation of early data profiles (first 60 pulses) appears to be ineffective for constraining the ablation bias-free 206Pb238U value. They give instrument bias values that do not agree for different zircon samples and that may be influenced by crystal damage.
A variety of approaches for calibrating PbU ages using standards include comparing average 206Pb238U values, Y-intercepts of linear sections of profiles (Gehrels et al., 2008) or preferably, normalizing the sample profile until it matches the standard profile as closely as possible. Software is provided for data reduction based on this approach, which seems effective provided samples are not metamict.
The easiest approach to determine the instrument bias during a session is with laser line scans of megacrystic zircon standards or NIST glasses. The offset in 206Pb238U due to ablation bias during the scan under the same ablation conditions would need to have been empirically determined beforehand. It is worth noting, however, that scan measurements are carried out during the most chaotic period of ablation, before the melt has achieved isotopic equilibrium, which may compromise reproducibility.
In general, there seems to be little prospect of improving the accuracy of 206Pb238U ages using nanosecond laser ablation systems, by modelling, or other data processing methods. However, design modifications to reduce the size of the ablation chamber and improve transport efficiency might reduce fallback along with PbU fractionation and improve sensitivity. With current instruments, the 1 sigma accuracy of interpreted 206Pb238U ages is unlikely to be better than ±1 % for any measurement precision without a much better understanding of the ablation process. It is recommended that all published papers where results depend on accurate 206Pb238U ages preserve raw data files (counts or c/s versus time per isotope) in an accessible repository where they can be reprocessed, if necessary, as methods and understanding improve.
The model output is presented in Supplementary Data File 4, columns AK : AM, for two samples in different worksheets. Although measurements are not synchronized with firing of the laser, both have approximately similar cycle lengths so measurements can be taken to approximate outputs from sequentially fired pulses. It is assumed that the mass of sample ablated is constant for each pulse (probably not the case for zoned zircon with variable damage) and that the normalized emission profiles for ZrO () and U () are specified (Column AB), where i is the laser pulse number. The normalization factors are the ZrO and U signals that would be measured if there were no loss to the pit or fallback (pulse 0, Cells AB1 and AC1, respectively). These are not precisely known but are approximated by the highest recorded signal, which is a minimum estimate.
Fractionation Fi for each laser pulse i is defined as (206Pb238U)cloud, deposit, signal(206Pb238U)sample. It is calculated in the model partly from user-defined values of a Pb loss factor Li (column AN). Li=0 means no Pb loss while Li=1 means complete removal of Pb from a deposit following pulse i.
The cloud is the plume immediately after ablation and before any deposition in the pit or as fallback. This ablation cloud may incorporate (recycle) some of the previous deposit. The effect of recycling on the cloud fractionation is quantified by another assigned parameter Ci that varies from 0 (only primary material ablated) to 1 (signal consists entirely of re-ablated deposit). C1 should be 0 since there is no deposit for the first pulse to recycle. The second pulse will ablate new material plus a portion of the previous fractionated deposit in the pit according to the recycling factor C2. Again, it is assumed that each pulse ablates an equal mass of material. It is also assumed that wall deposits are only momentarily liquid so that material deposited on the wall cannot mix with earlier deposits and is uniquely available for recycling by the following pulse. There is no major difference if deposits are assumed to homogenize.
The model assumes that PbU fractionation is principally driven by deposition of Pb-depleted deposit from the ablation cloud as measured by the decrease in normalized ZrO signal with each pulse (column AB). This is simplistic, at least near the beginning, because evaporative Pb-loss from melt should produce decreasingly positive fractionated signals for the first few pulses until the residual melt becomes sufficiently negatively fractionated, as seen in Fig. 6C. This effect is not observed in the signals except perhaps in the tendency of the earliest measured ratios to show unchanging values (Fig. 12), suggesting a balance between positive and negative fractionation processes, or in variable y axis intercepts (Fig. 13).
The PbU composition of the cloud from the first pulse (F1cloud) is set at 1 in the model. As mentioned, actual F1cloud>1 because of Pb-evaporation from the first melt and subsequently lowered by recycling of the fractionated melt. This is simulated in the model by decreasing the recycling factor from 0.9–0 over the first 10 pulses (Cells AO5:AO14), which results in ratios whose trend roughly matches observation, except for the first pulse.
“Deposit” is the proportion of material lost from the ZrO signal either as fallback or deposition in the pit. It is assigned a PbU fractionation value for each pulse, which can be varied to fit the signal profile. “Signal” is what gets measured. It has higher PbU than the cloud if there is removal of fractionated deposit.
If most Pb is removed from a deposit, F for the deposit will be close to 0 and >1 for the cloud from which it was derived, which then becomes the measured signal. F will be <1 in a cloud if the pulse that produced it recycled some depleted deposit. After deposition of Pb-depleted material, F for the signal should be >1, provided all the previous deposit was not recycled. As mentioned, the Pb loss factor of the deposit, Li, must be specified in the model for each laser pulse i.
First deposit fractionation (pulse 1):
The proportion of deposit relative to ablated material is quantified by the normalized signal curve for ZrO as ). Its effect on fractionating the first ablation cloud, which produces the measured fractionation, is:
a number that should be slightly greater than 1.
If there is recycling, U zoning may affect the 206Pb238U profile because recycled deposit can have a different U concentration from the cloud. For example, if U is increasing this dilutes the effect on the ablation cloud of recycling fractionated deposit because the ablated material has higher U and Pb concentration. The fractionation factor of the ablation cloud from the second pulse (A2) after absorbing part of the previous deposit should be:
The last two factors represent the ratio of U concentration in the previous deposit to that in the subsequent ablation cloud. These weight the effect of absorbing part of the deposit. This should be a small effect unless U concentration varies rapidly.
The second ablation cloud will form a second deposit depleted according to the assigned second depletion L2 and the fractionation factor of the cloud (, slightly less than 1):
Formation of this deposit imposes a fractionation on the second ablation cloud, which should normally overcome the effect of partially recycling the previous deposit and be slightly greater than 1.
This is the measured fractionation for the second pulse. Modeled values of normalized 206Pb238U ratios with each successive laser pulse are calculated using these recursive formulas in Supplementary Data File 4 where the general forms are:
Cloud fractionation factor:
(after absorbing previous i−1 deposit)
It is assumed that wall deposits are only momentarily liquid after deposition so a new pit deposit can only mix with the previous deposit:
Note that and C1=0 so .
Supplementary data files 1–7 available through the following link: https://osf.io/c8j3k/?view_only=f5c96dd8c9244629879f420d5762b74e (Davis and Banaga, 2026).
DWD is principally responsible for the design of experiments and interpretation of data. HRB carried out measurements and helped with interpretation.
The contact author has declared that neither of the authors has any competing interests.
Publisher's note: Copernicus Publications remains neutral with regard to jurisdictional claims made in the text, published maps, institutional affiliations, or any other geographical representation in this paper. The authors bear the ultimate responsibility for providing appropriate place names. Views expressed in the text are those of the authors and do not necessarily reflect the views of the publisher.
Helpful reviews by D. Rubatto, Andrew Kylander-Clark and an anonymous reviewer are gratefully acknowledged. Some imaging and sample preparation were carried out with Muhammad Nur Aflah Ahmad Zul Kamal. Colin Bray is acknowledged for instrument maintenance. The authors acknowledge the assistance of Sandra Kamo, director of the Jack Satterly Geochronology Laboratory in providing funding for carrying out the analyses. Laboratory facilities were maintained and made available by Corliss Sio and Colin Bray.
This paper was edited by Daniela Rubatto and reviewed by Andrew R. Kylander-Clark and one anonymous referee.
Adamson, M. N., Cottle, J. M., and Kylander-Clark, A. R. C.: A Mechanistic study of matrix effects in zircon U–Th/Pb geochronology using single-particle laser ablation time-of-flight mass spectrometry, Chem. Geol., 707, 123325, https://doi.org/10.1016/j.chemgeo.2026.123325, 2026.
Butterman, W. C. and Foster, W. R.: Zircon stability and the ZrO2–SiO2 phase diagram, Am. Mineral., 52, 880–885, 1967.
Caulfield, J. T., Allen, C. M., Ubide, T., Nguyen, A., and Cathey, H. E.: Compositional heterogeneity in 91 500, GJ-1/89 and TEMORA-2 zircon reference materials, Chem. Geol., 674, 122580, https://doi.org/10.1016/j.chemgeo.2024.122580, 2025.
Cottle, J. M., Horstwood, M. S. A., and Parrish, R. R.: A new approach to single shot laser ablation analysis and its application to in situ PbU geochronology, J. Anal. At. Spectrom., 24, 1355–1363, https://doi.org/10.1039/b821899d, 2009.
Das, A. and Davis, D. W.: Response of Precambrian zircon to the chemical abrasion (CA-TIMS) method and implications for improvement of age determinations, Geochim. Cosmochim. Ac., 74, 5333–5348, 2010.
Davis, D. W.: Sub-million-year age resolution of Precambrian igneous events by thermal extraction-thermal ionization mass spectrometer Pb dating of zircon: Application to crystallization of the Sudbury impact melt sheet, Geology, 36, 383–386, 2008.
Davis, D. W.: U–Pb geochronology of Archean metasediments in the Pontiac and Abitibi subprovinces, Quebec, constraints on timing, provenance and regional tectonics, Precambrian Res., 115, 97–117, 2002.
Davis, D. W. and Banaga, H. R.: Supplementary Data Files 1–7, OSF [data set], https://osf.io/c8j3k/?view_only=f5c96dd8c9244629879f420d5762b74e, last access: 9 September 2026.
Drake, R. P.: Properties of High-Energy-Density Plasmas, in: High-Energy-Density Physics: Foundation of Inertial Fusion and Experimental Astrophysics, Graduate Texts in Physics, edited by: Drake, R. P., Springer International Publishing, Cham, 51–114, https://doi.org/10.1007/978-3-319-67711-8_3, ISBN 978-3-319-67711-8, 2018.
Eggins, S. M., Kinsley, L. P. J., and Shelley, J. M. G.: Deposition and element fractionation processes during atmospheric pressure laser sampling for analysis by ICP-MS, Appl. Surf. Sci., 127–129, 278–286, 1998.
Gehrels, G. E., Valencia, V. A., and Ruiz, J.: Enhanced precision, accuracy, efficiency, and spatial resolution of U–Pb ages by laser ablation–multicollector–inductively coupled plasma–mass spectrometry, Geochem. Geophy. Geosy., 9, Q03017, https://doi.org/10.1029/2007GC001805, 2008.
Horn, I., Rudnick, R. L., and McDonough, W. F.: Precise elemental and isotope ratio determination by simultaneous solution nebulization and laser ablation-ICP-MS: application to U–Pb geochronology, Chem. Geol., 167, 405–425, 2000.
Houk, R. S.: Mass Spectrometry of Inductively Coupled Plasmas, Anal. Chem., 58, 97A–105A, 1986.
Hu, Z., Gao, S., Liu, Y., Hu, S., Chena, H., and Yuan, H.: Signal enhancement in laser ablation ICP-MS by addition of nitrogen in the central channel gas, J. Anal. Atom. Spectrom., 23, 1093–1101, https://doi.org/10.1039/b804760j, 2008.
Jochum, K. P., Weis, U., Stoll, B., Kuzmin, D., Yang, Q., Raczek, I., Jacob, D. E., Stracke, A., Birbaum, K., Frick, D. A., Günther, D., and Enzweiler, J.: Determination of Reference Values for NIST SRM 610–617 Glasses Following ISO Guidelines, Geostand. Geoanal. Res., 35, 397–429, https://doi.org/10.1111/j.1751-908X.2011.00120.x, 2011.
Kaser, D., Van Acker, T., Koch, J., Hattendorf, B., and Gunter, D.: Evaluation of laser-induced and ICP-induced elemental fractionation using laser ablation-ICP TOF-MS, J. Anal. Atom. Spectrom., 40, 2408–2417, https://doi.org/10.1039/d5ja00173k, 2025.
Kimura, J.-I., Chang, Q., Itano, K., Iizuka, T., Vaglarov, B., S., and Tani, K.: An improved U–Pb age dating method for zircon and monazite using 200/266 nm femtosecond laser ablation and enhanced sensitivity multiple-Faraday collector inductively coupled plasma mass spectrometry, J. Anal. Atom. Spectrom., 30, 494–505, 2015.
Koch, J. and Günter, D.: Review of the State-of-the-Art of Laser Ablation Inductively Coupled Plasma Mass Spectrometry, Appl. Spectrosc., 65, 155A-162A, https://doi.org/10.1366/11-06255, 2011.
Kosler, J., Wiedenbeck, M., Wirth, R., Hovorka, J., Sylvester, P., and Mikova, J.: Chemical and phase composition of particles produced by laser ablation of silicate glass and zircon – implications for elemental fractionation during ICP-MS analysis, J. Anal. Atom. Spectrom., 20, 402–409, https://doi.org/10.1039/b416269b, 2005.
Kroslakova, I. and Gunther, D.: Elemental fractionation in laser ablation-inductively coupled plasma-mass spectrometry: Evidence for mass load induced matrix effects in the ICP during ablation of a silicate glass, J. Anal. Atom. Spectrom., 22, 21–62, https://doi.org/10.1039/b606522h, 2007.
Nasdala, L., Kronz, A., Hanchar, J. M., Tichomirowa, M., Davis, D. W., and Hofmeister, W.: Effects of natural radiation damage on back-scattered electron images, Am. Mineral., 91, 1739–1746, https://doi.org/10.2138/am.2006.2241, 2006.
Niu, H. and Houk, R. S.: Fundamental aspects of ion extraction in inductively coupled plasma mass spectrometry, Spectrochim. Acta B, 51, 779–815, 1996.
Paton, C., Woodhead, J. D., Hellstrom, J. C., Hergt, J. M., Greig, A., and Maas, R.: Improved laser ablation U–Pb zircon geochronology through robust downhole fractionation correction, Geochem. Geophy. Geosy., 11, 36, https://doi.org/10.1029/2009GC002618, 2010.
Tomlinson, K. Y., Davis, D. W., Stone, D., and Hart, T. R.: U–Pb age and Nd isotopic evidence for crustal recycling and Archean terrane development in the south-central Wabigoon subprovince, Canada, Contrib. Mineral. Petr., 144, 684–702, https://doi.org/10.1007/s00410-002-0423-0, 2003.
Wiedenbeck, M., Allé, P., Corfu, F., Griffin, W. L. Meier, M., Oberli, F.,von Quadt, A., Roddick, J. C., and Spiegel, W.: Three natural zircon standards for U–Th–Pb, Lu–Hf, trace element and REE analyses, Geostandards Newslett., 19, 1–23, 1995.