
the Creative Commons Attribution 4.0 License.
the Creative Commons Attribution 4.0 License.
 | 20 Oct 2026
On the effects of ageing and annealing on the apatite and fission-track etch rates
Raymond Jonckheere

Florian Trilsch
Jie Liu
Pengfei Zhai
Thorsten Nagel
Fission tracks in apatite must be etched for counting and measuring with an optical microscope. Track etching is described with the aid of two velocities: the track etch rate vT and the apatite etch rate vR. The efficiencies of track counts, the selection of confined tracks, and the distinctive shapes of etched tracks depend on the values of vT and vR; vR is also an indicator of the apatite composition and annealing kinetics. Despite their importance, measurements of vT and vR have been lacking. We here report measurements of vT and vR and investigate factors controlling them. The results support a constant core model, i.e., a constant vT over most of the track length. The host-confined-track intersections, c axis angles, and track-etch rates have near-identical distributions across all experiments. Neither lab annealing of induced tracks nor geological ageing of fossil tracks has a significant effect on vT. Overall, for a one-step etch protocol, the lengths of fission tracks exhibit a weak positive correlation with their track etch rates and effective etch times. The effect is however too small to be significant for geological applications. When using a step-etch protocol, the etchant advances at a finite rate along tracks etched during preceding steps. This broadens the effective-etch-time and track-length distributions, while the summed immersion times overestimate the aggregate effect of the procedure. In contrast to vT, vR exhibits clear variation related to damage from self-irradiation in the case of fossil tracks and to a minor extent from neutron irradiation in the case of induced tracks. Greater vR shorten the access times to confined tracks, increasing their effective etch times. This implies a need for caution when using the track openings for assessing annealing rates.
- Article
(6555 KB) - Full-text XML
-
Supplement
(5069 KB) - BibTeX
- EndNote


The fission-track method is a useful tool for dating rocks and retracing their low-temperature thermal histories. It is based on counting and measuring the damage trails from uranium fission in minerals. Apatite is the most studied mineral, and the focus of this investigation. Fission tracks in apatite shorten and fade over a range of temperatures relevant to geological processes such as basin subsidence and uplift, erosional and tectonic unroofing, thrust tectonics, and hydrocarbon maturation. Apatite grains separated from a rock are mounted in resin, polished, and etched for examination with an optical microscope. Etching creates channels along the damage trails left by the fission fragments. In contrast to unetched tracks, with nanometre diameters, etched tracks have micrometre diameters, suitable for counting and measuring. From the outset, track etching has been described in terms of two velocities: the etch rate, vT, of the damaged lattice along the track and the bulk etch rate, vB, of the undamaged apatite in other directions (Fleischer and Price, 1964; Hurford, 2019). Their values determine the etching and counting efficiencies of different crystal faces (Gleadow, 1981; Tagami and O'Sullivan, 2005), and the roundedness of the confined track tips (Ketcham and Tamer, 2021). These factors determine which grains are suitable for counting and dating and which tracks are suitable for measurement and time-temperature modelling.
Little is known for certain about the factors that affect the apatite and track etch rates. It is known that vB is anisotropic (Gleadow, 1981), and also depends on the apatite composition (Burtner et al., 1994; Carlson et al., 1999). We know less about vT, which is assumed constant (Laslett et al., 1984) or related to the track radius or damage density (Ketcham and Tamer, 2021; Li et al., 2023). Following principles of crystal growth and dissolution (Gross, 1918; Heimann, 1975, 1982), we redefined the apatite etch rate (vR) as the displacement rate of a plane surface as a whole instead of that of each point on the surface (vB; Jonckheere et al., 2019, 2022). We examined how vR varies with composition (Trilsch et al., 2023; Fu et al., 2024) and with orientation, noting steep minima parallel and perpendicular to the c axis (Aslanian et al., 2021). Here we investigate factors affecting vR and vT. Section 2 focuses on the variation of vT along tracks, Sect. 3 on the effect of annealing, and Sect. 4 on that of ageing on vR and vT. The discussion is based on the cumulative frequencies of the measured quantities. Additional scatter plots and histograms are presented in the Supplement.
2.1 Experiment
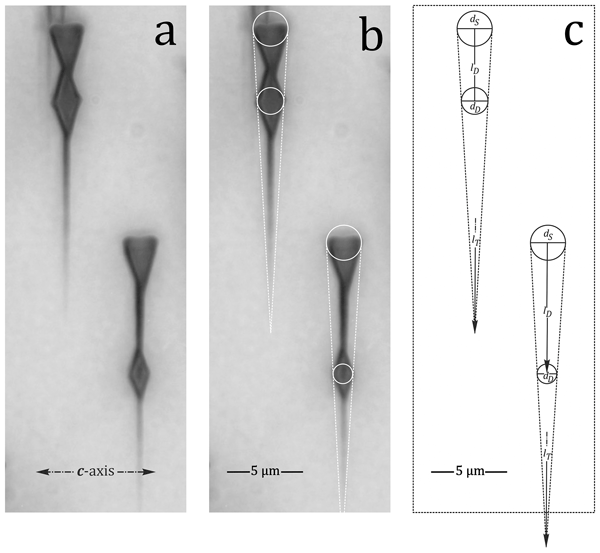
This experiment was carried out on a single crystal of the Durango apatite from Mexico (Foshag, 1929; Young et al., 1969; McConnell, 1973). Durango apatite contains 7–22 ppm U and 150–380 ppm Th (Boyce and Hodges, 2005; Enkelmann et al., 2005a) and has a fission-track age of ∼ 31.5 Ma (Jonckheere et al., 1993; Jonckheere, 2003; Enkelmann et al., 2005b; Jonckheere et al., 2015, 2024a). We mounted a prism section of Durango apatite in resin, ground, and polished it with 6, 3, and 1 µm diamond suspensions and a 0.04 µm silica suspension to expose a flat internal surface. We covered the mount with a 180 µm Al degrader foil and 12 µm PET film, and irradiated it perpendicular to the c axis and at dip angle with 25.0 MeV amu−1 86Kr-ions at the HIRFL in Lanzhou, operated by the Institute of Modern Physics of the Chinese Academy of Sciences (Fig. 1). We etched the mount in 5.5 M HNO3 at 21 °C for s to reveal the ion tracks (Fig. 2). The sample had a sealed natural crack extending from the surface to tens of microns below it. Although no etchant could penetrate along it, the crack nevertheless constituted a break in the apatite lattice. The intersections of the Kr tracks with the crack are therefore convex, like their intersections with the surface, causing etch figures bounded by the fastest-etching faces to develop (Aslanian et al., 2021; Jonckheere et al., 2022). This produces uniform etch pits at the apatite surface, one side of which, with length Dpar, is parallel to the c axis (Burtner et al., 1994). The same process takes place on either side of the crack, giving rise to diamond-shaped etch figures, whose size decreases with increasing distance along the track from its surface intersection (Fig. 2a).
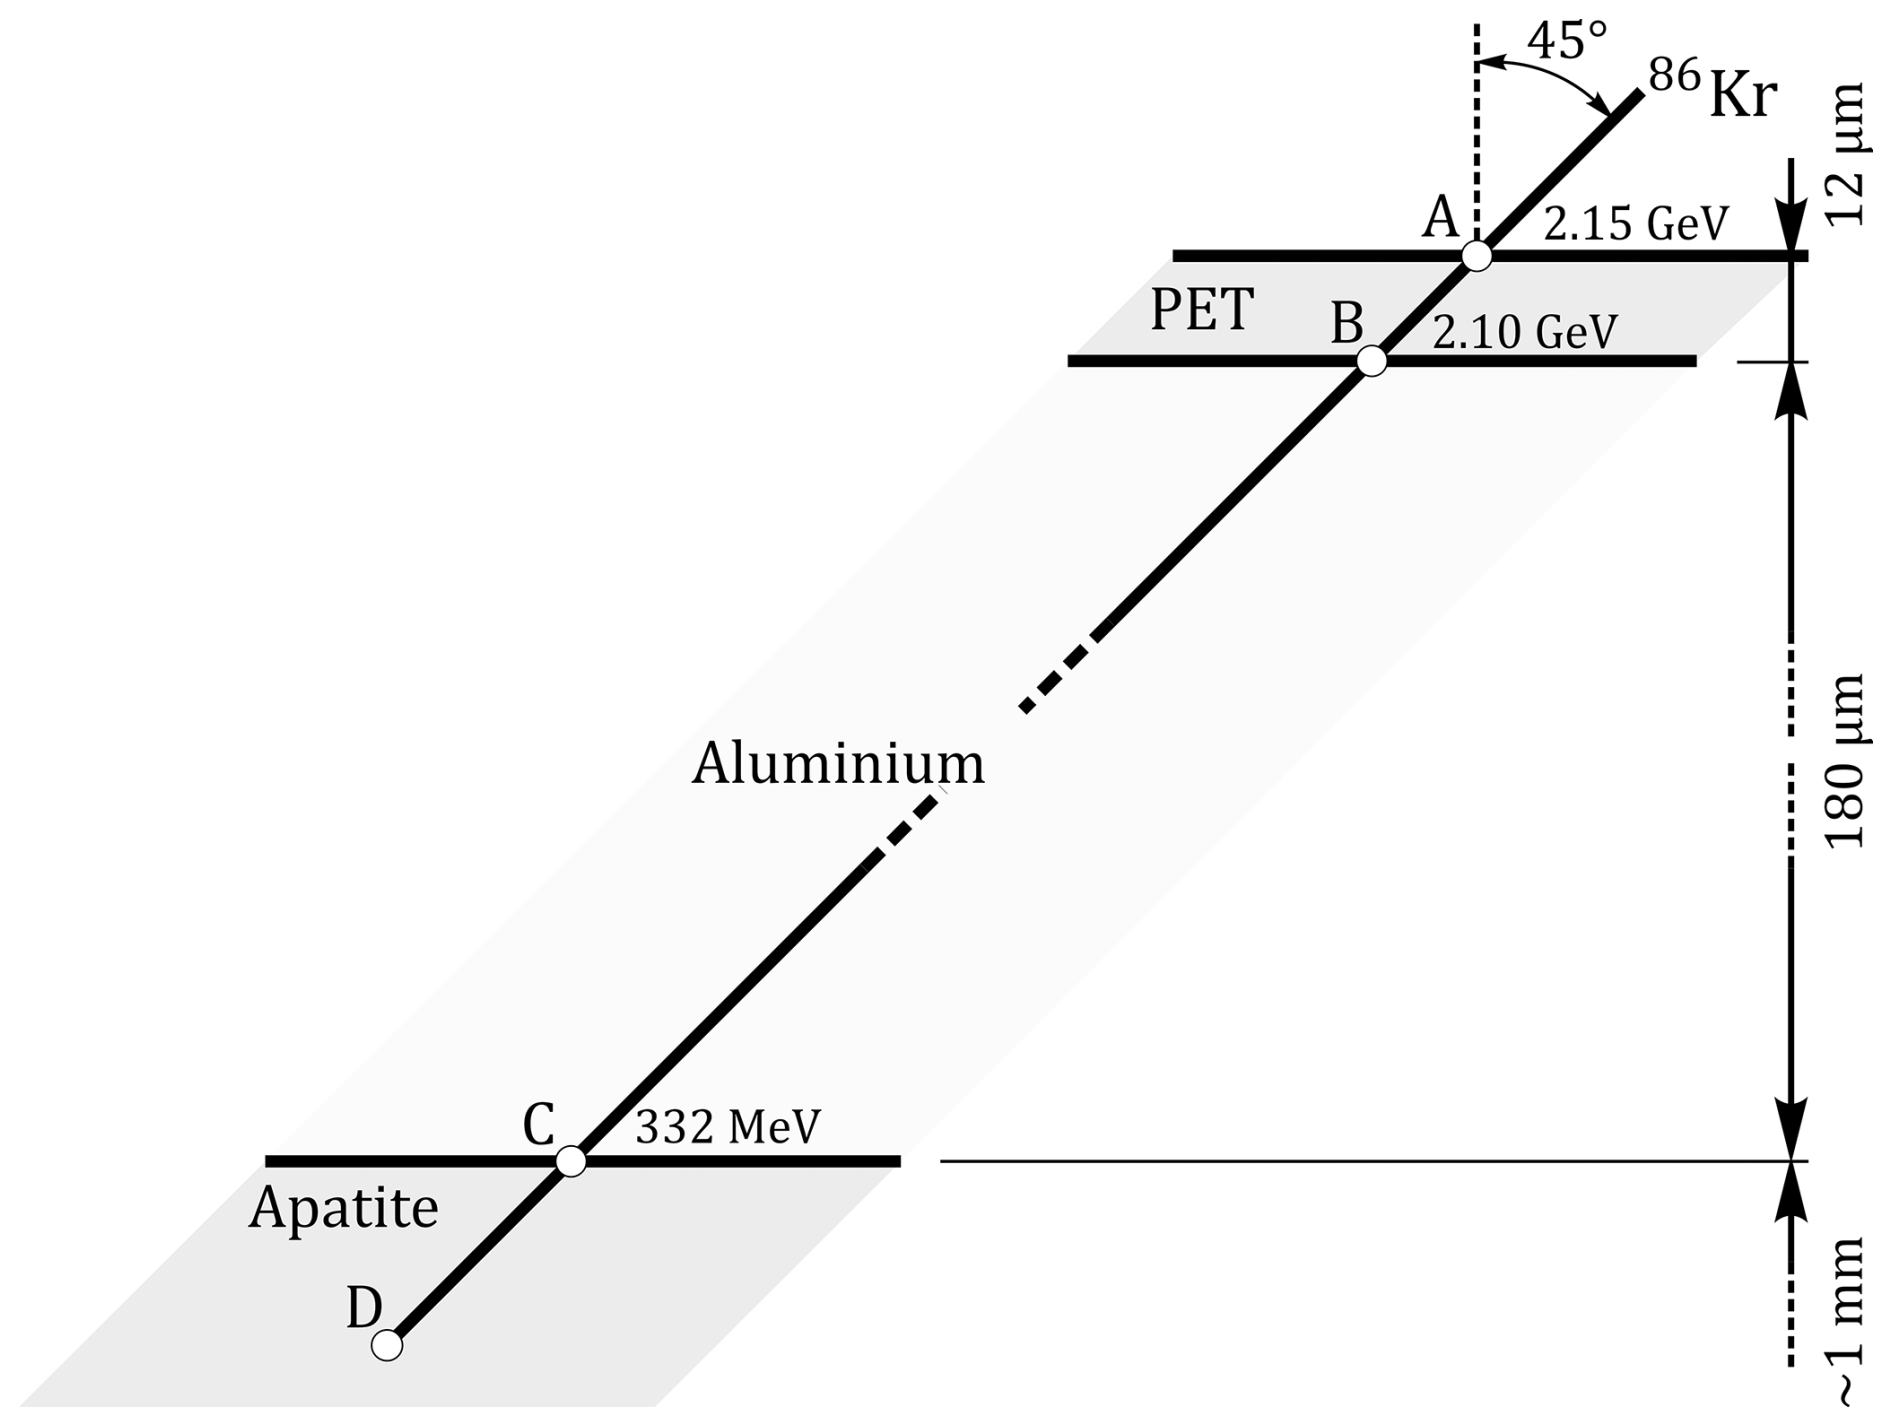
Figure 1Kr irradiation: a prism section of an unannealed single Durango apatite is covered with a 180 µm Al degrader and a 12 µm PET film, and irradiated perpendicular to the apatite c axis and at dip angle with 25.0 MeV amu−1 86Kr. The samples were etched in 5.5 M HNO3 at 21 °C for s to reveal the tracks.
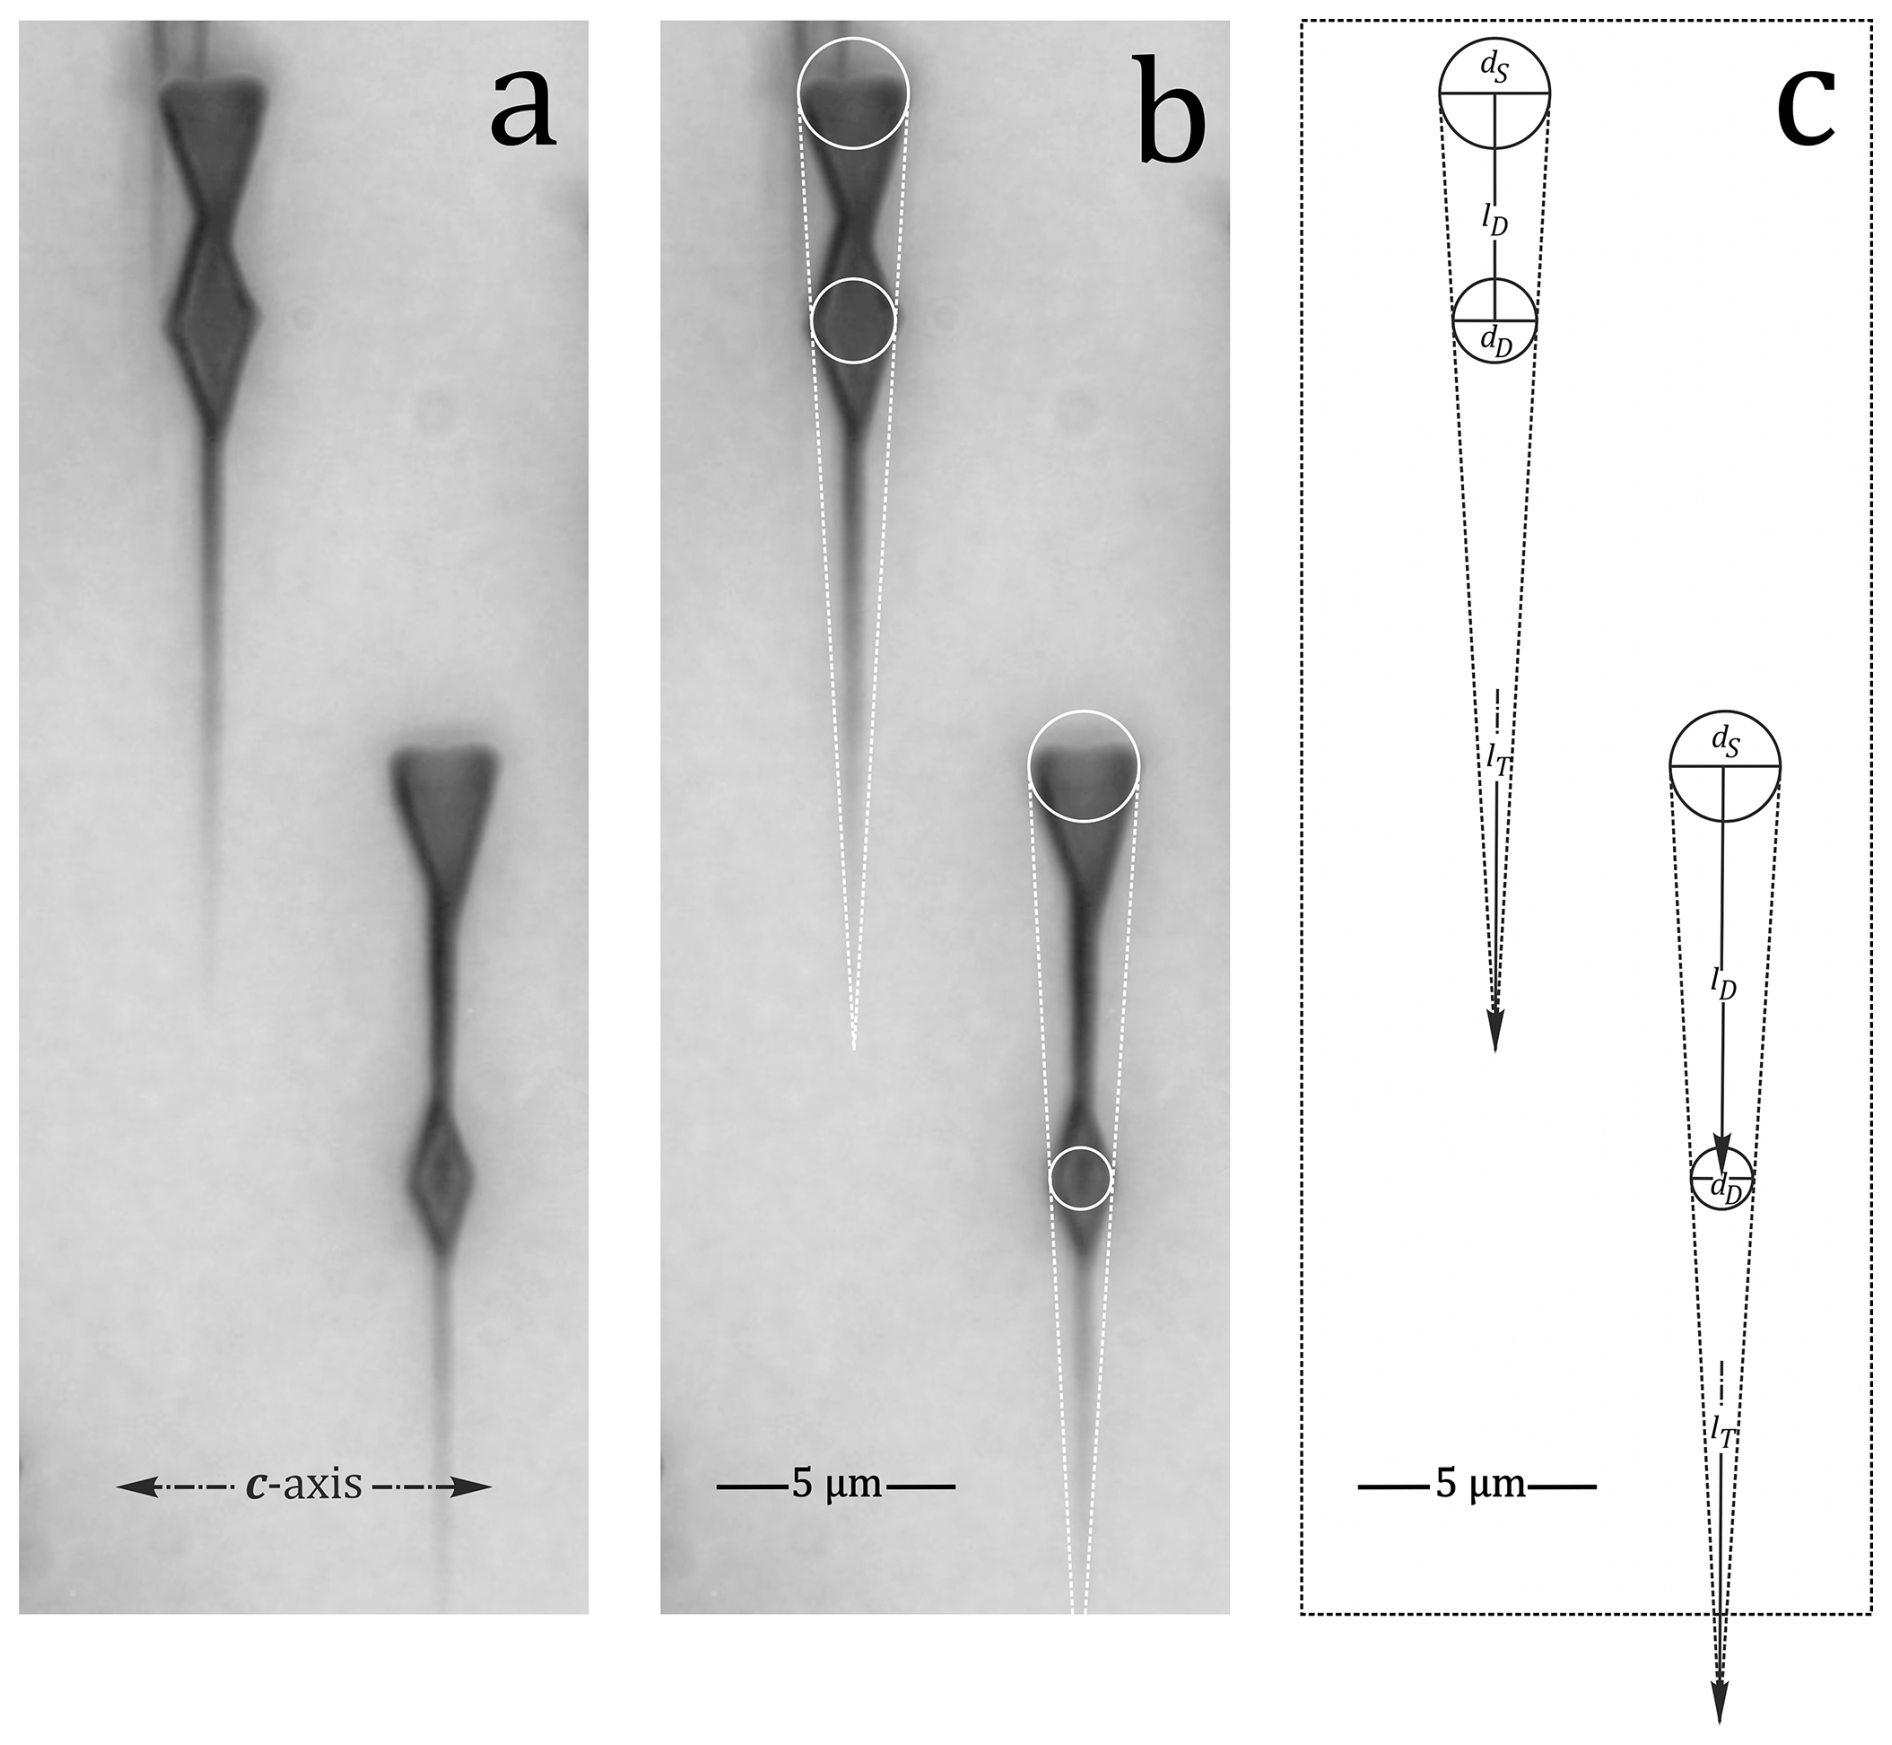
Figure 2Compressed image stack of Kr-tracks perpendicular to the c axis, intersecting an apatite prism face (a, b); their measurements are shown in (c): dS and dD are the diameters of circles tangent to the outside edges of the triangle- and diamond-shaped etch figures at their intersections with the surface and with a crack; lD is the distance between their centres, and lT the measured distance to the end of the etched section.
From the diameters (dS, dD) of circles tangent to their outside edges (Fig. 2b, c), and the immersion time (tI) we calculate the effective etch time , and access time, , of each diamond shape, i.e., the time that the etchant needs to advance from the surface to the crack. After correcting for dip, the etched distance to the crack is and the total etched length is .
2.2 Results
Table 1 reports the measurements for the 20, 30, and 40 s cumulative immersion times. Figure 3a plots dD against l; Fig. 3b shows histograms of the calculated lengths lM. The solid lines in Fig. 3a are geometric mean regression lines anchored at the mean values of dS. These means have negligible error compared with the individual dD values, because dS (Dpar) exhibits almost no variation and was measured for each track and immersion time. Table 1 lists the slopes (s) of the regression lines, along with their d axis and l axis intercepts, and the calculated track etch rates: .
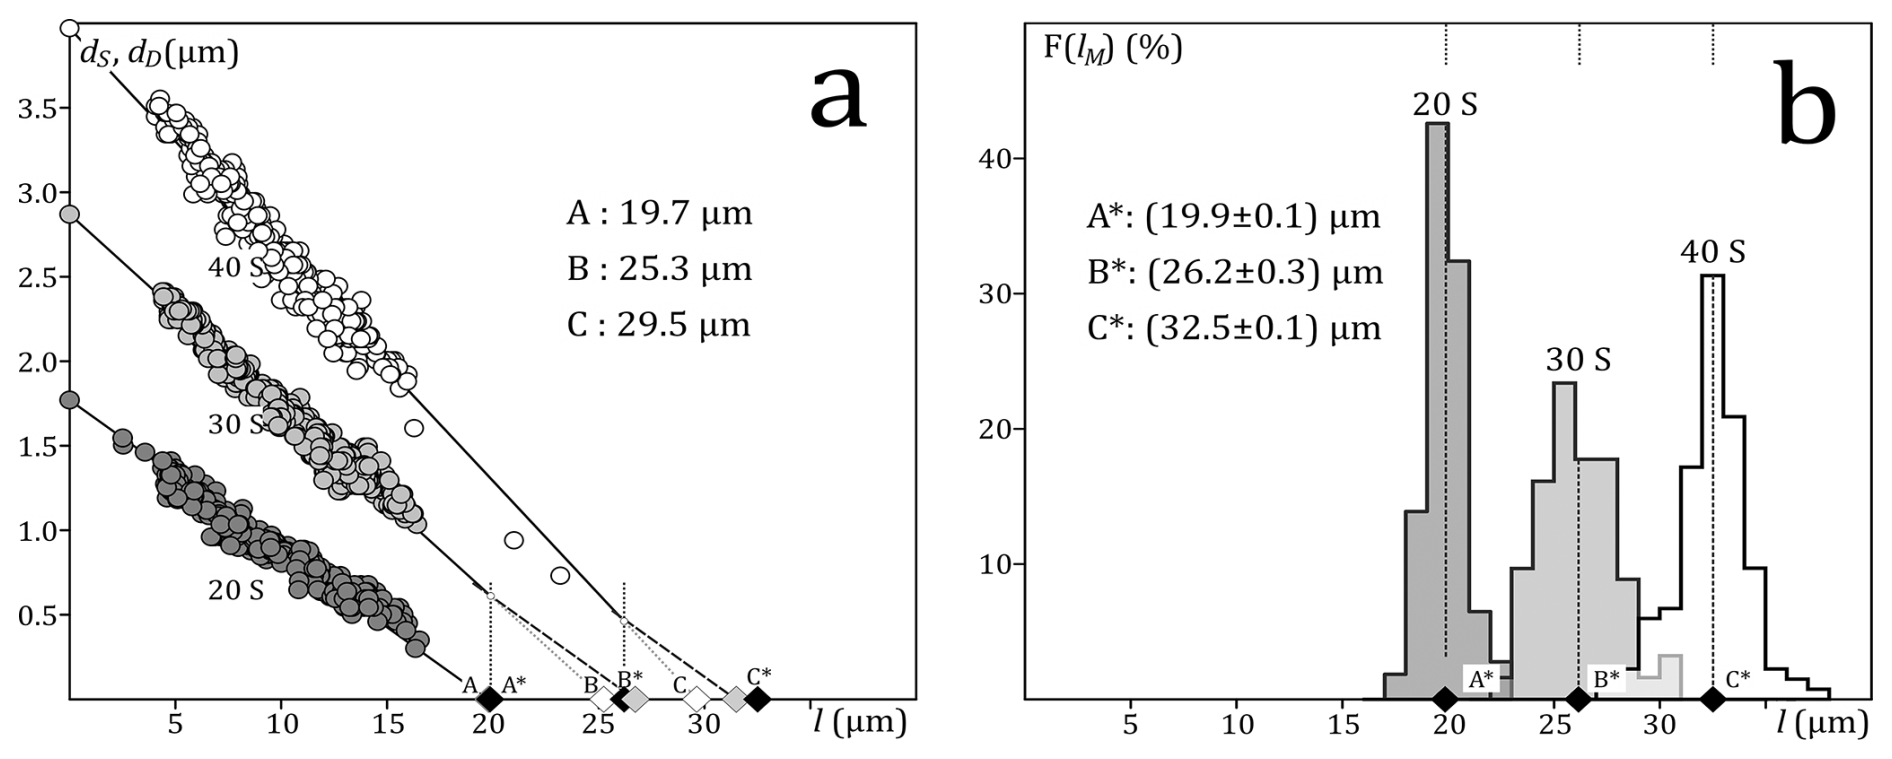
Figure 3Results of the Kr-track length and size measurements. (a) Diamond sizes (dD) plotted against distance along the track () for 20 s (dark), 30 s (light), and 40 s (white) immersion. The intercepts (dS) at l=0 are the average Dpar. The solid lines are geometric mean regression lines anchored at dS. The white diamonds at A (20 s; hidden), B (30 s), and C (40 s) are the intersections (lI) of the regression lines with the l axis. The black diamonds at A* (20 s), B* (30 s), and C* (40 s) are the corresponding measured lengths (lM; b). The dashed lines and grey diamonds (lE) are extrapolations of the 30 and 40 s values at A* and B*, assuming that the unetched sections beyond A* and B* etch at the rate calculated from the 20 s data. (b) Histograms of the measured track lengths () for 20 s, (20+10) s, and (30+10) s etching in 5.5 M HNO3 at 21 °C. A*, B*, and C* are the mean lengths plotted in (a) (black symbols).
Table 1Measurements of Kr-tracks in a Durango apatite prism face etched 20, 30, and 40 s in 5.5 M HNO3 at 21 °C. tI (s): immersion time; nT: number of tracks; sR: slopes of geometric mean regression lines, anchored at dS, fitted to dD vs. l (Fig. 3a); vT (µm min−1): rate of etchant advance calculated from sR; dS (µm) and lI (µm): d and l axis intercepts of the regression lines; lM (µm): mean measured lengths (Fig. 3b) lE(µm): calculated mean etched length, assuming a constant track etch rate vT (Fig. 3a); tM (s): immersion times corresponding to the measured mean lengths and calculated etch rates.

2.3 Discussion
The vT value for the initial 20 s immersion (vT ≈60 µm min−1) is the actual track etch rate. The value is comparable with that for induced fission tracks at high angles to the c axis in a prism section of Durango apatite (Fig. 5c in Jonckheere et al., 2024b). The values for 30 and 40 s immersion measure the fast but finite rate of etchant advance along pre-etched tracks. The sum of the immersion times of a step-etch experiment therefore overestimates the effective cumulative etch time. For the Kr tracks, this amounts to ≳4 s for the 10 s step following the initial 20 s immersion; i.e., the time required to travel the length (≈ 20 µm) of the pre-etched track section at vT≈275 µm min−1 s). Step-etching thus broadens the effective-etch-time distributions of ion and fission tracks (Fig. 8 of Trilsch et al., 2023; Fig. 6a of Jonckheere et al., 2024b).
The difference between the measured mean length and the l axis intercept of the regression line for the first 20 s step (lM−lI) is negligible but increases at each subsequent step (Table 1; Fig. 3). This is because the high etch rates during later steps relate to the track sections etched during the preceding step but not to the unetched sections beyond them, which etch at the normal rate vT. We corrected the expected lengths (lE), based on the measured lengths and etch rates in Table 1 (caption of Fig. 3). The accord between the revised and measured lengths (lM−lE) and between the revised and actual immersion times (tM−tI) is reasonable, considering the uncertainties. In particular the high etch rates of the pre-etched sections affect the calculations because they are obtained from the small differences between the slopes of the regression lines fitted to the 20, 30, and 40 s data. The calculation assumes a constant vT over the entire etched track length up to 40 s (constant core; Tamer and Ketcham, 2020a). The results in Fig. 3a and Table 1 support this assumption.
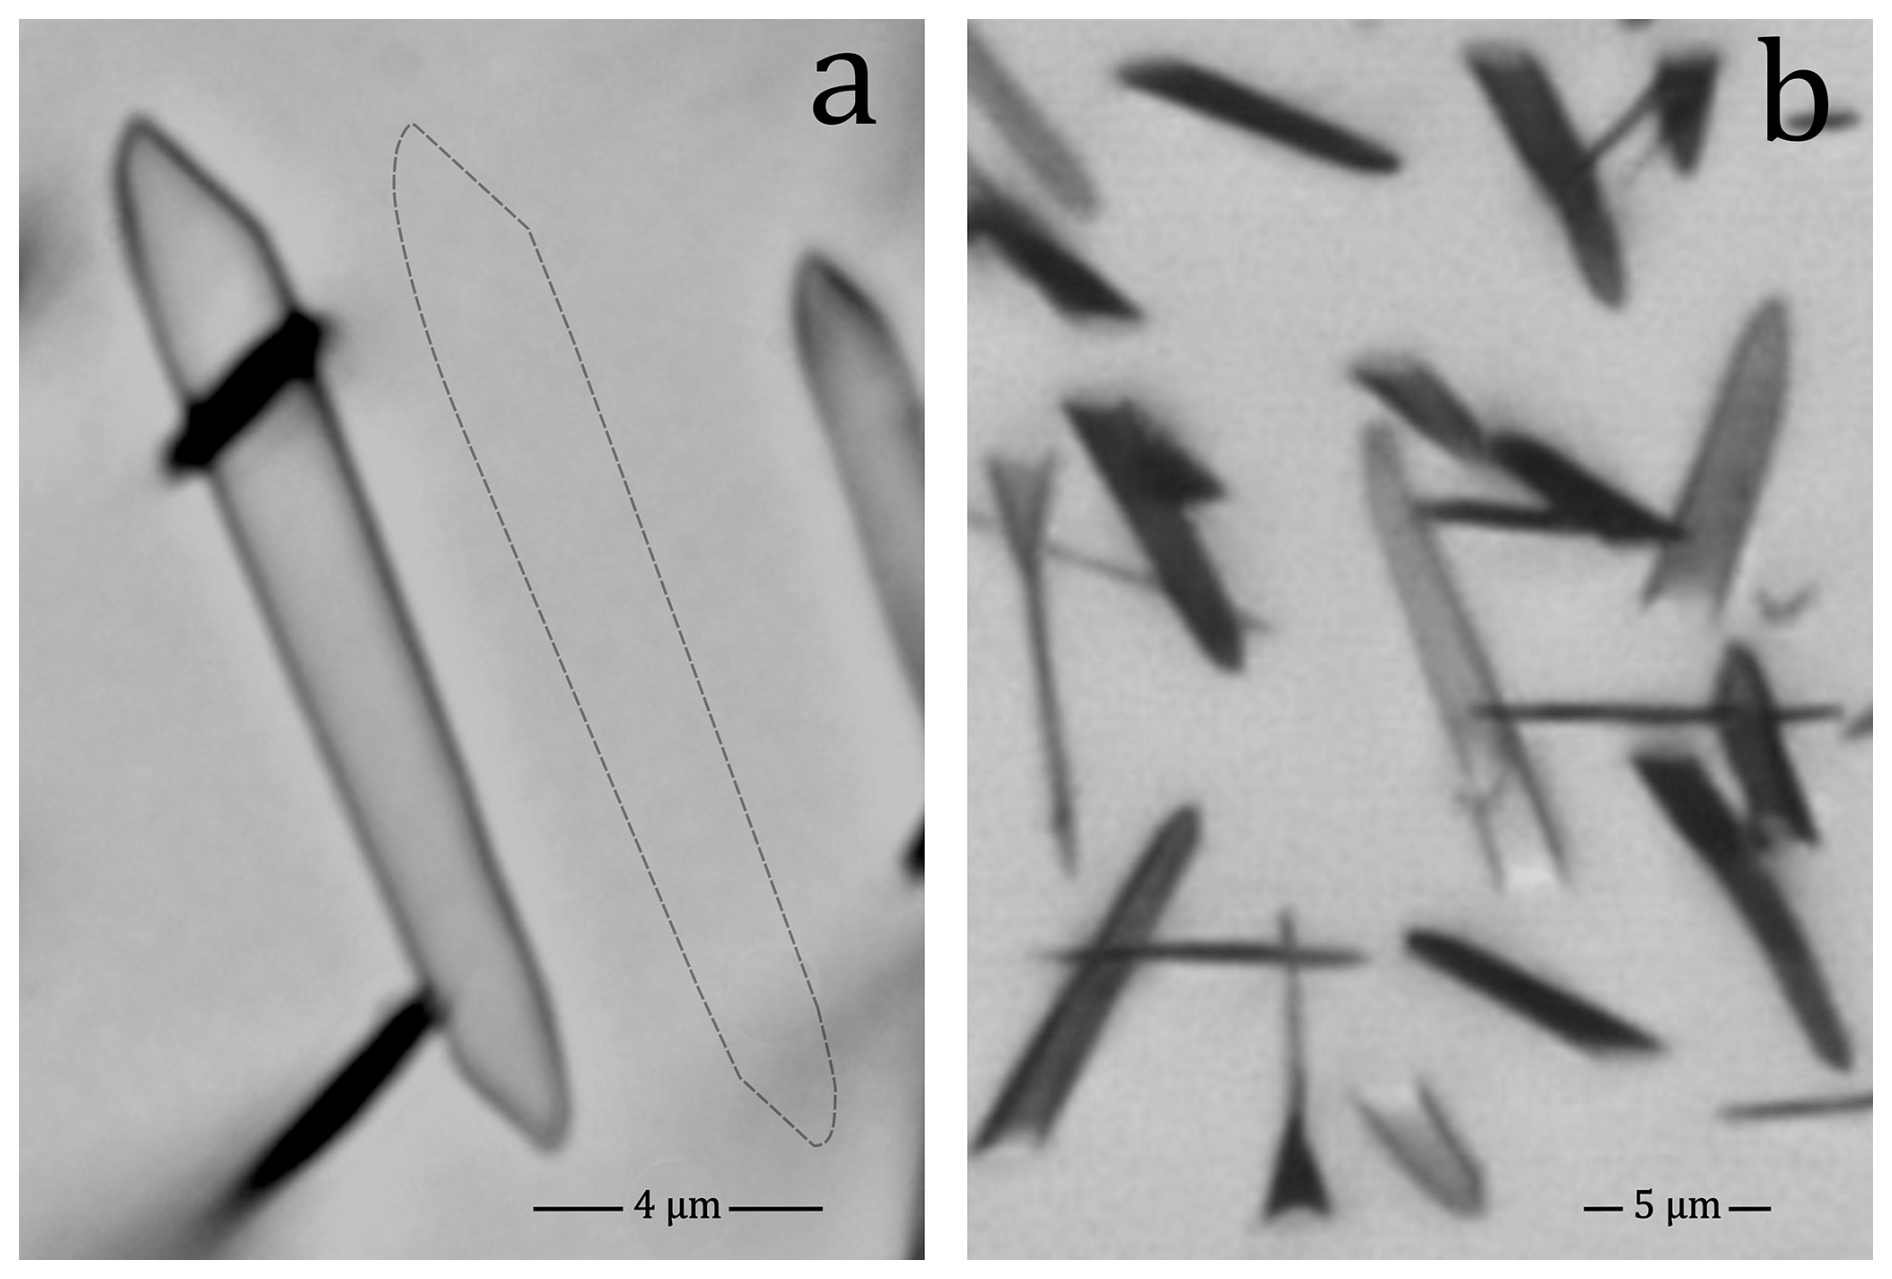
Figure 4Etched fission tracks in an apatite prism face showing the characteristic straight-sided outline, consistent with constant vT: (a) horizontal confined track; (b) compressed image stack of surface tracks (etched 20 s in 5.5 M HNO3 at 21 °C).
A constant vT is consistent with the fact that fission tracks in apatite have straight sides, lacking curvature (Fig. 4a and b; “motorboat effect”; Fleischer et al., 1969, 1975; Paretzke et al., 1973; Somogyi and Szalay, 1973; Durrani and Bull, 1987; Nikezić, 2000; Nikezić and Yu, 2003; 2004). This means that vT is unrelated to the local stopping power (Tamer and Ketcham, 2020a; Ketcham and Tamer, 2021), or to the radius of the latent track (Li et al., 2012, 2014). The most compelling indication is that etched confined tracks show no constriction, interruption or other modification in their midsections, even though the effective fission fragment charges, and thus stopping power and track radius are assumed to be near zero at the locus of the fissioned nucleus (Li et al., 2023). We have earlier reported that the average fission track etch rate varies with Dpar (Fu et al., 2024) and with the track orientation, with minima parallel and perpendicular to the c axis, analogous to the apatite etch rate vR (Jonckheere et al., 2024b). This suggests that vT is more related to the chemical characteristics of the track detector than to the properties of the fission fragments.
The fact that the mean etch pit size increases less in relation to the immersion time during the initial 20 s immersion, than during the subsequent 10 s immersions (Table 1; ) is due to an etch induction time related to polishing damage (Jonckheere and Van den haute, 1996, their Fig. 19).
3.1 Experiment
To investigate the effects of partial annealing on vT and vR, we carried out track measurements on four prism sections of Durango apatite that had been pre-annealed, neutron-irradiated and, all but one, re-annealed to create induced-track populations with mean lengths of ∼16 µm (sample 21-2), ∼14 µm (21-4), ∼12 µm (21-1), and ∼10 µm (21-3). The irradiation and annealing conditions are given in Ketcham et al. (2015). The track densities measured in transmitted and reflected light are reported in Aslanian et al. (2022). The samples were mounted in resin, polished with 6, 3, and 1 µm diamond and 0.04 µm silica suspensions, and etched for 20 s in 5.5 M HNO3 at 21 °C (Carlson et al., 1999). The confined tracks were imaged and measured as in Jonckheere (2023). The measurements included the track lengths, orientations, widths, cone-angles, the positions of the host track intersections (iP), and Dpar. We calculated the effective etch times and the apatite and track etch rates using the equations of Aslanian et al. (2021) and Fu et al. (2024).
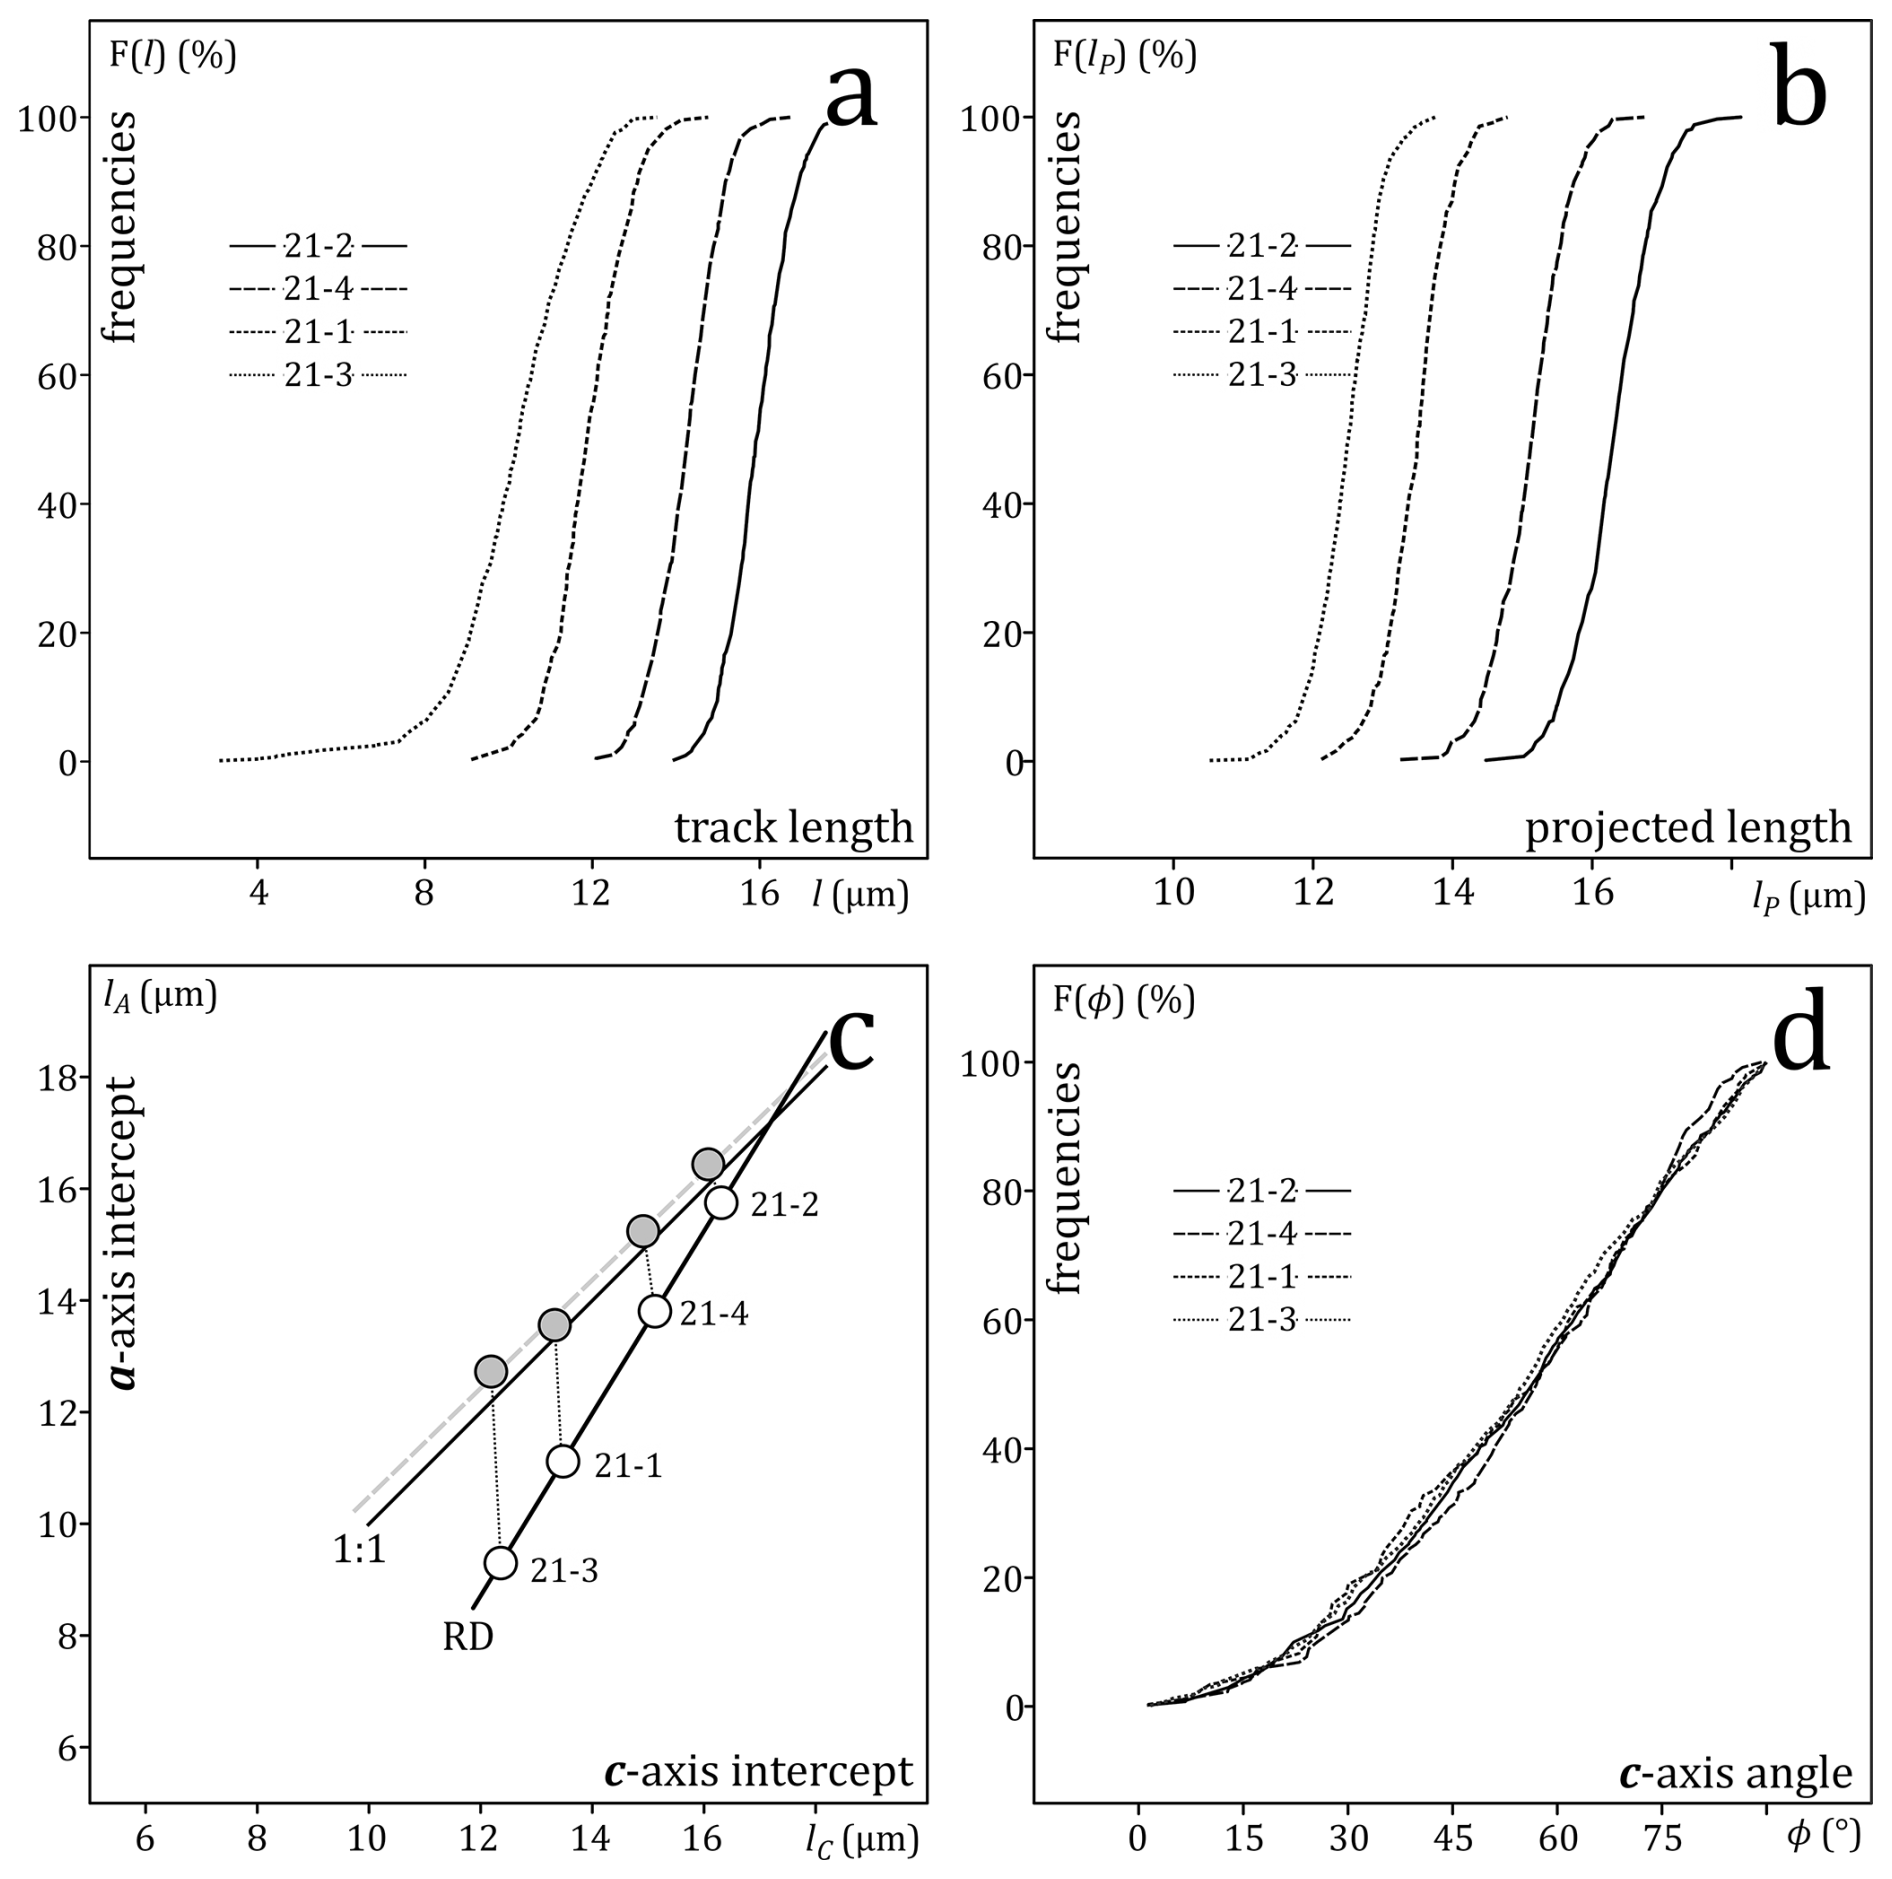
Figure 5(a) Cumulative frequencies of the lengths (l) of horizontal induced confined tracks in prism faces of four Durango apatites with increasing degrees of annealing, distributed as part of an inter-lab experiment (Ketcham et al., 2015; 21-2: unannealed; 21-4: annealed 10 h at 240 °C; 21-1: annealed 10 h at 288 °C; 21-3: annealed 10 h at 310 °C). (b) Cumulative frequencies of the c axis projected lengths (lP). (c) The a axis (lA) vs. c axis intercepts (lC) of ellipses fitted to the length (l) vs. c axis angle (ϕ) data (white; RD: ; empirical relationship of Donelick et al., 1999), and of regression lines fitted to the c axis projected length (lP) vs. c axis angle (ϕ) (grey; 1:1: isotropic line: lA=lC); (d) cumulative frequencies of the c axis angles.
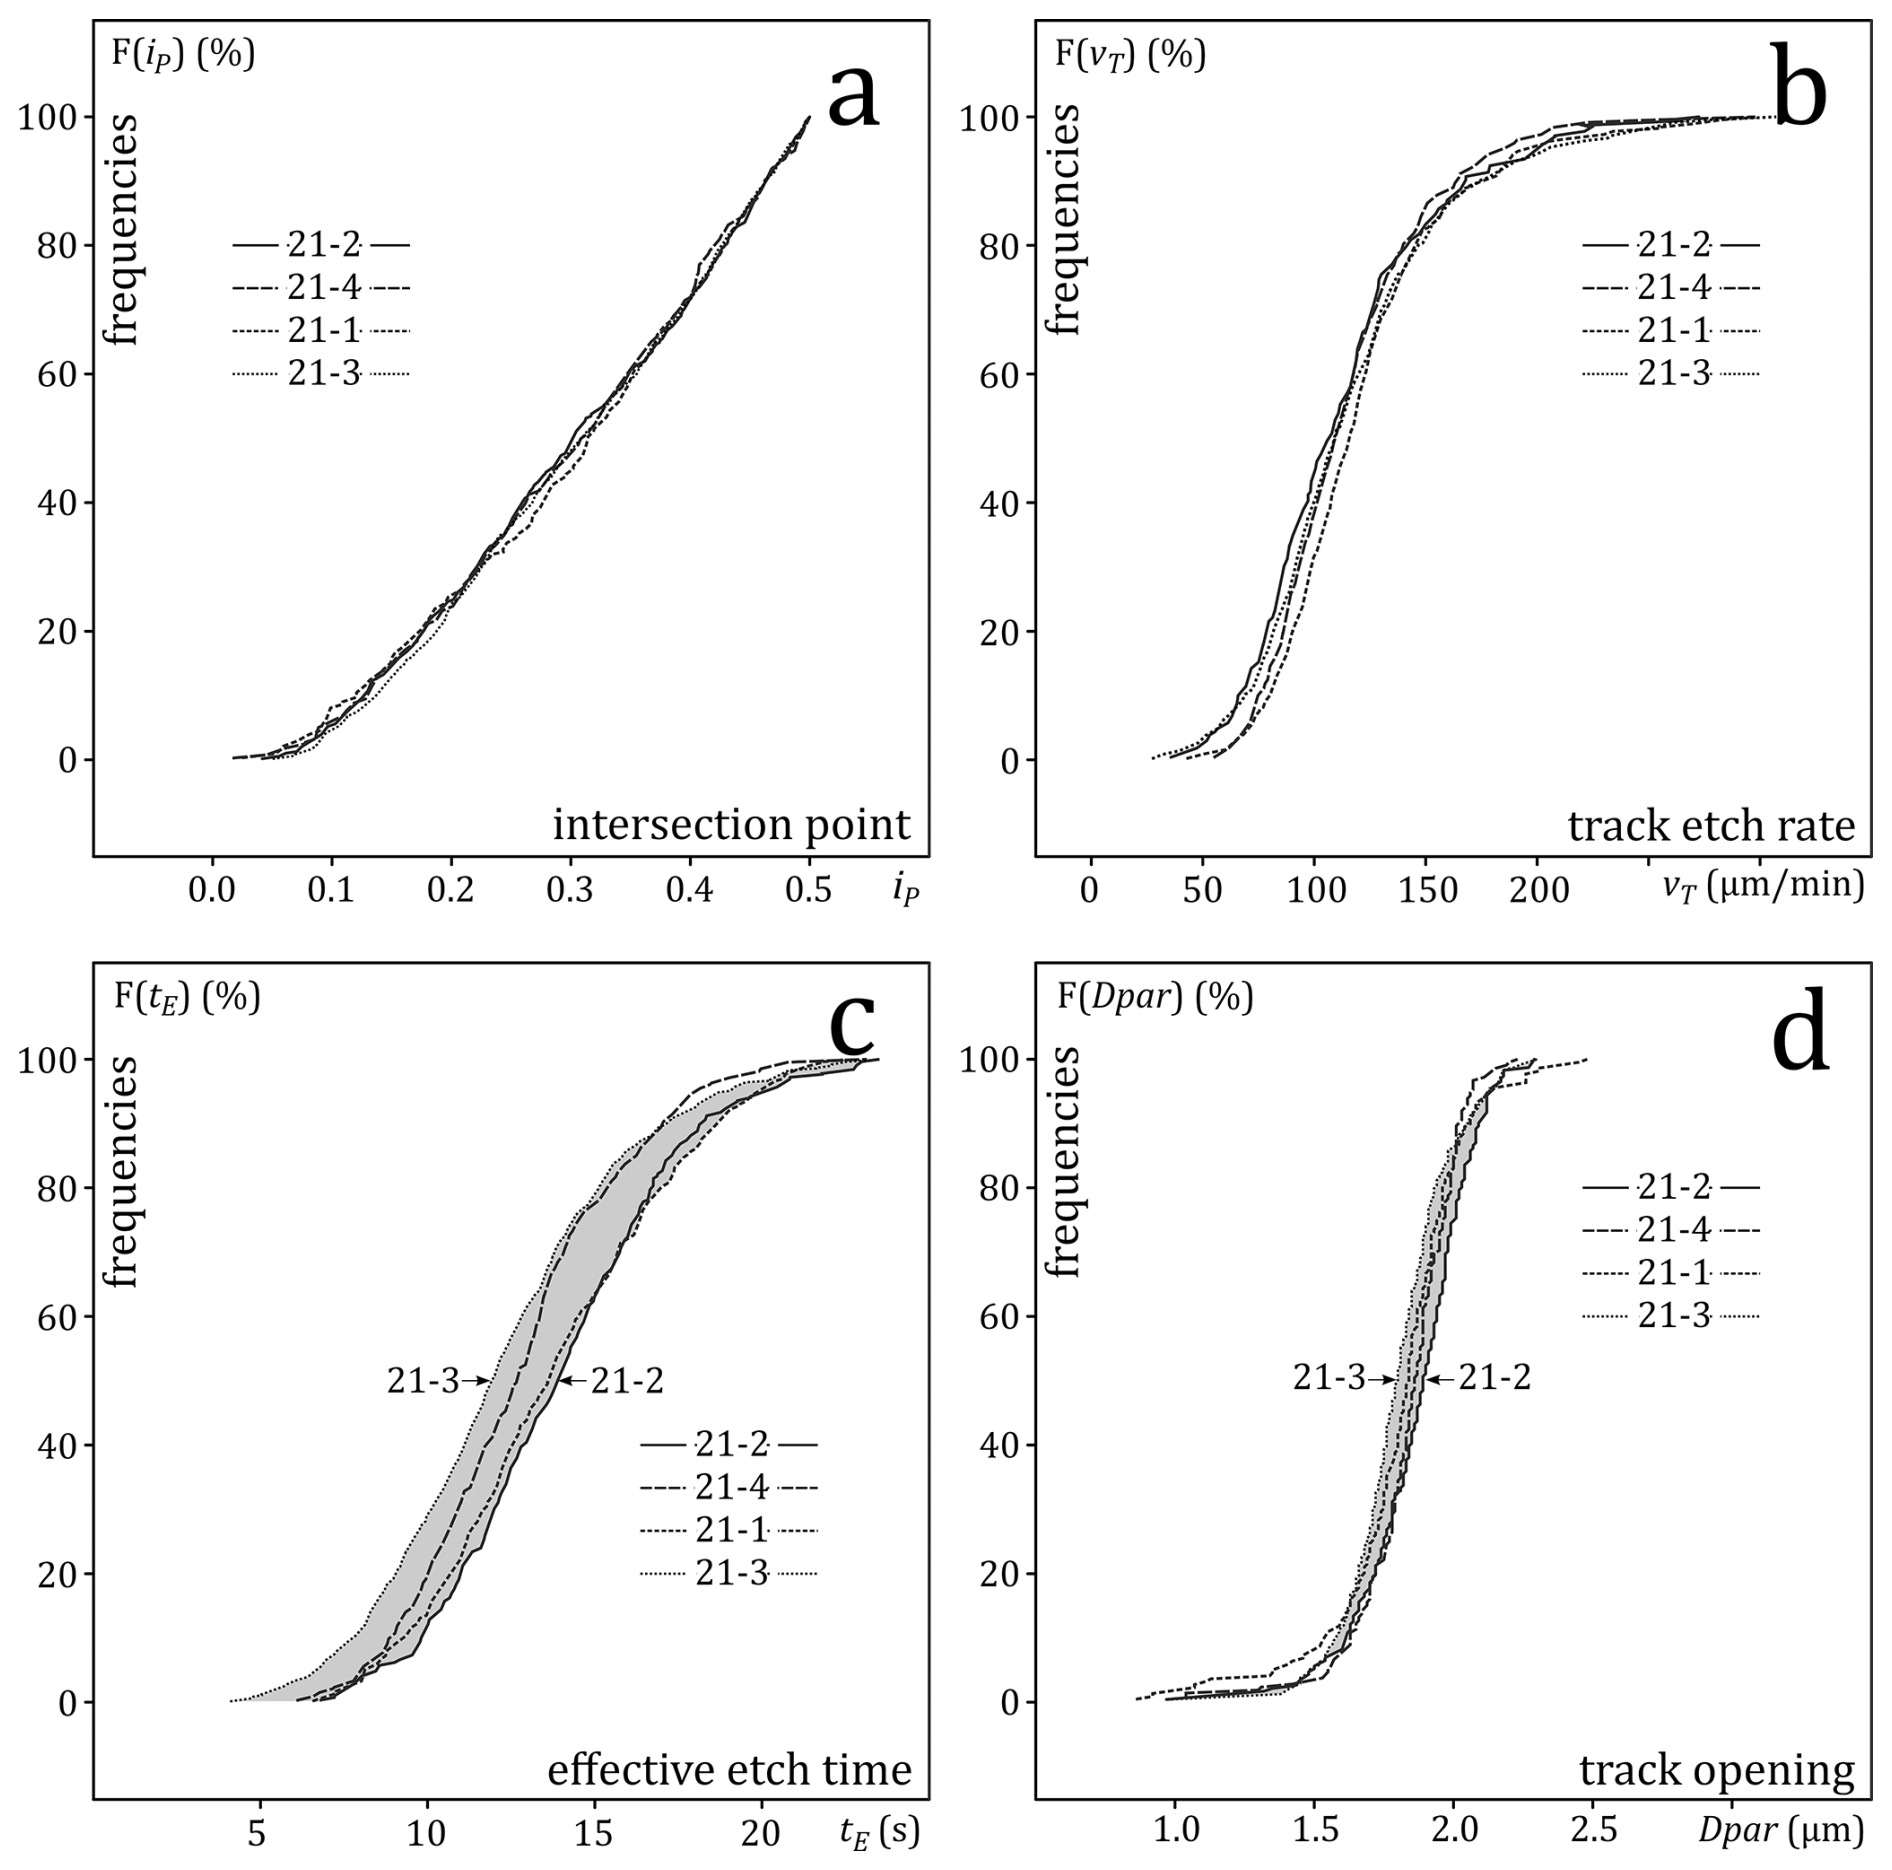
Figure 6(a) Cumulative frequencies of the intersections (iP) between host-track and confined track, measured from the intersection to the closest track tip and normalised to the confined track length. (b) Cumulative frequencies of the calculated track etch rates (vT). (c) Cumulative frequencies of the calculated effective etch times (tE). (d) cumulative frequencies of the size of the track surface intersections parallel to the c axis (Dpar).
3.2 Results
Figures 5 and 6 show the cumulative distributions of the measured track properties for different annealing stages, and Table 2 lists the main statistics. It is worth noting that the angular (azimuth) distribution remains unchanged after partial annealing (Fig. 5d). This is similar to the results of Ketcham (2003), except that our data cover mean track lengths from 15.9 to 10.1 µm, before c axis projection. The intersection-point distribution (distance from host track intersection to the nearest confined track tip) is also unaffected by annealing (Fig. 6a). In each sample, the number of intersections decreases from the centre towards the track tips (Fig. S4 in the Supplement) but there is no evidence that, in relative terms, short tracks are differently affected than long tracks. The decrease from the centre towards the tips could be attributed to the fact that a confined tracks intersected near its tip cannot be measured if it is obscured by the host track. In that case, one would expect that, in relative terms, the effect is greater for short tracks than for long tracks, which is not corroborated. One might conjecture that there is a countervailing bias of some sort, perhaps related to a change of the track etch rate due to annealing. We rule this out because our evidence shows that there is no vT-change, and because it is improbable that two unquantifiable biases exactly cancel (Fig. 6a). We therefore prefer to consider a factor that is constant across the annealing stages and mean lengths. There is e.g., the fact that it takes twice as long to etch a track intersected at one tip than a track intersected in its centre to the point that both tips are etched so that the track is accepted for measurement. Tracks intersected between their tips and centre will require an intermediate etching time. This could account for the gradual decrease of the intersection point frequencies starting from the track centre towards the track tips. This supports a constant-core vT-model, as a linear model entails that the time required to reach the furthest tip depends sensitively on the intersection point. These observations are counter to expectation based on length bias and anisotropic annealing (Galbraith et al., 1990; Donelick et al., 1999; Galbraith, 2002; Ketcham, 2003). It has been established that track selection is not just a matter of geometrical biases, but that etching and observer biases must also be taken into consideration. According to Aslanian et al. (2021) and Jonckheere (2023), the selection of a confined track depends on whether it exceeds a threshold width, which is not affected by annealing.
3.3 Discussion
The cumulative vT-distributions are the same after 10 h annealing at 240 °C (21-4), 288 °C (21-1), and 310 °C (21-3; Fig. 6b) as that of unannealed induced tracks (21-2), despite experiencing mean length reductions of ∼2, ∼4, and ∼ 6 µm. This contradicts the finding that partial annealing of induced tracks at 235 to 280 °C causes up to a doubling of vT (Ketcham and Tamer, 2021). Taken together with the fact that vT exhibits no variation along the tracks (Sect. 2) and is unaffected by lab-annealing, the observations that vT correlates with Dpar (Fu et al., 2024) and varies with the angle to the apatite c axis (Jonckheere et al., 2024b) underscore the fact that vT is more a function of the detector properties than of the damage densities along the fission fragment trajectories.
The median effective etch time of the unannealed tracks (21-2) is 2 s longer than that of the most annealed (21-3; Fig. 6c). Both intermediate samples lie between the extremes, albeit in reverse order. Given that their track and apatite etch rates are almost the same, one might expect that tE correlates with the reciprocal track densities. That of 21-3 is of 21-2 (Aslanian et al., 2022); the average separation between a host track and a potential confined track in 21-3 is thus greater than in 21-2. However, this must not be the case for the measured tracks, selected on the basis of their widths. For an average vT of ∼ 2 µm s−1 (Table 2: ∼ 120 µm min−1), a ∼2 s tE-difference corresponds to a ∼4 µm length difference in the etchant trajectories from the host track intersections to the confined-track tips. If the host track intersects a confined track in the middle, we have 2×4 µm = 8 µm; if it intersects it at the tip and etches in one direction, we have 4 µm. The average is (4 µm+8 µm) = 6 µm. This is correlates well with the ∼ 6 µm mean-length difference between 21-2 and 21-3.
Table 2Measurements of confined tracks in unannealed and part-annealed prism faces of Durango apatite etched for 20 s in 5.5 M HNO3 at 21 °C. LSTD: length standard; NC: number of confined track lengths; lM: mean length (µm); sM: standard deviation (µm); l50: median; lP: mean of c axis-projected lengths (µm); sP: standard deviation of the c axis-projected lengths (µm); lP50: median projected length; (lC, lA): c axis and a axis intercepts of ellipses fitted to length vs. orientation data (µm); (lPC, lPA): c axis and a axis intercepts of regression lines fitted to projected-length vs. orientation data (µm). ND: Number of Dpar-measurements; Dpar: mean Dpar (µm); sD: standard deviation (µm); D50: median (µm); NE: number of effective-etch-time measurements; tE: mean effective etch time (s); sE: standard deviation (s); t50: median effective etch time (s); NVT: number of track etch rate measurements; vT: mean track etch rate (µm min−1); sT: standard deviation (µm min−1); v50: median track etch rate (µm min−1). Numbers in brackets are standard errors on the last digit, which are ≪1 µm due to the law of large numbers, i.e., the error of the mean decreases with the square root of the number of measurements. Moreover, the cited errors reflect the precision of the measurements, which is not limited by the Abbé rule relating to their resolution (Bobroff, 1986; Copeland et al., 2018).
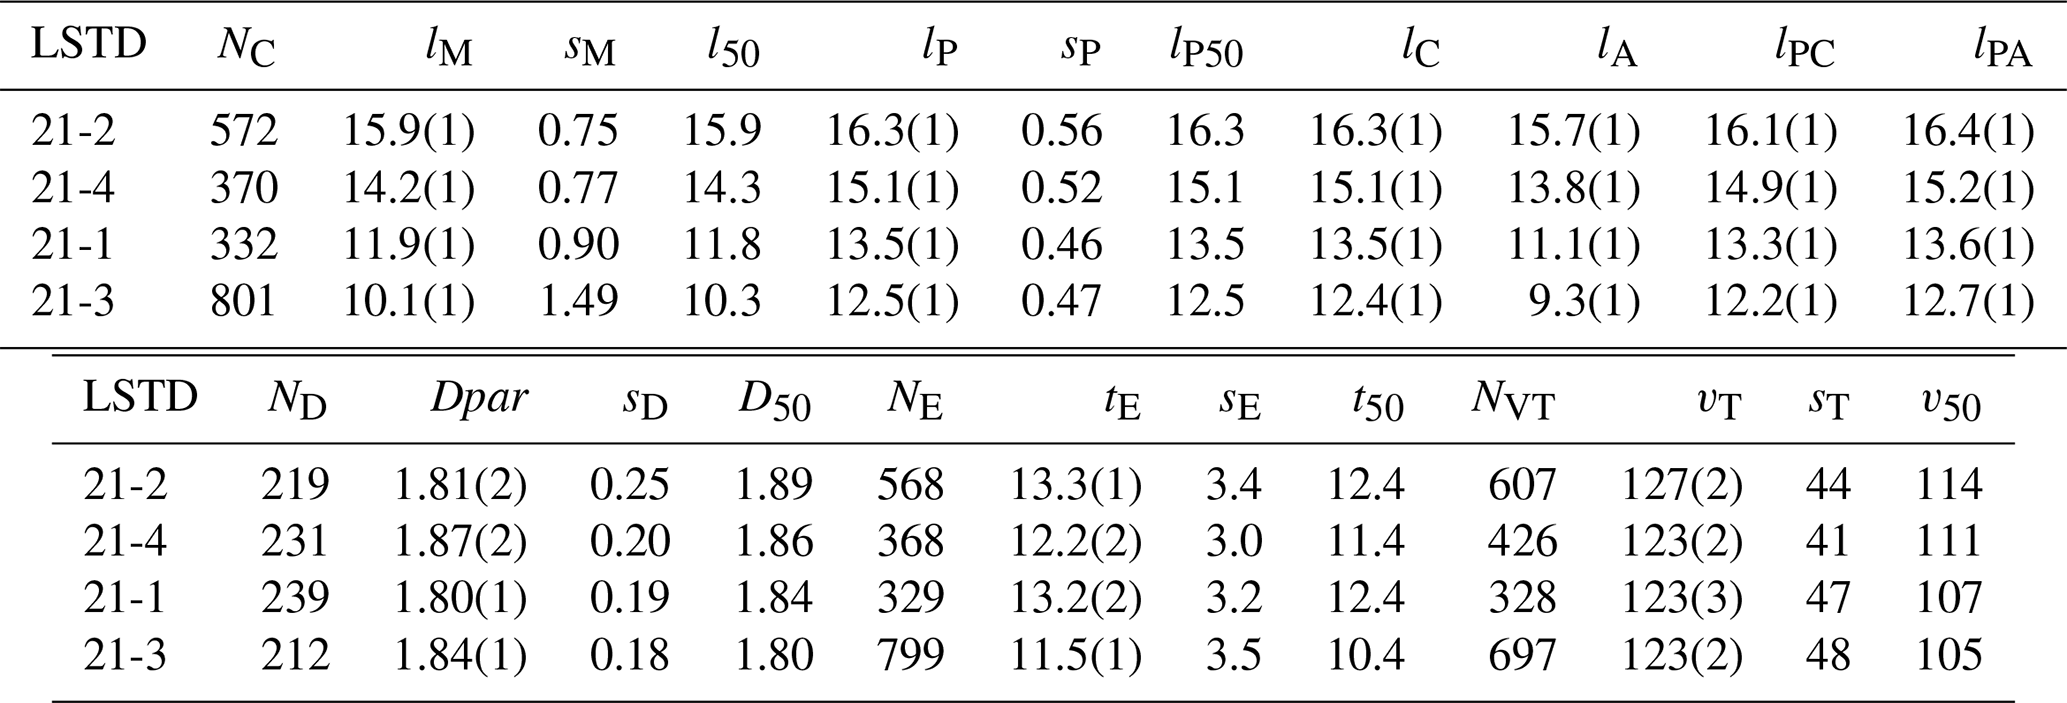
All samples have narrow Dpar-distributions with medians (D50) decreasing from 1.89 µm for the unannealed apatite (21-2) to 1.80 µm for the most annealed (21-3). The difference is small but reflects a systematic shift of the Dpar-distribution to lower values with increasing annealing (Fig. 6d). Because Dpar is proportional to the apatite etch rate, it suggests a thermal relaxation of irradiation-induced strain from recoils following (n, γ)-reactions or uranium fission and track formation (Rivera et al., 2011; Dufour and Toulemonde, 2016; Schauries, 2018; Rymzhanov et al., 2019). Assuming Arrhenius kinetics, the D50-ratio () of the most annealed and unannealed samples represents an activation energy increase for apatite etching of 118(27) J mol−1, or 1.22(28) meV per atom. If an individual point defect stores ∼1 eV, the lowering of the apatite etch-rate results from annealing one in a thousand () defects created by irradiation.
Assuming Arrhenius kinetics, the rate factor (kD) and activation energy (ED) for defect annealing are given by:
wherein tA=36 000 s is the annealing time (10 h). For a pre-exponential factor k0=1013 s−1, this gives:
wherein R=8.314 J °C−1 mol−1 is the gas constant, and TA=310 °C the annealing temperature of 21-3. For comparison, we calculated corresponding nominal rate factors (kF) and activation energies (EF) for fission-track annealing using the fractional length reduction, , to measure progress. The calculation shows that EF increases from 181(1) kJ mol−1 at 240 °C to 202(1) kJ mol−1 at 310 °C (Table 3). These are indicative average values, conditional on the assumed Arrhenius kinetics and the pre-exponential constant (k0). Without, therefore, attaching undue physical meaning to the numerical results, the calculation bears out that fission-track annealing and the lowering of the apatite etch rate due to partial elimination of point defects both occur under the annealing conditions to which the samples were exposed. On the whole, point defects begin to anneal at time-temperature conditions at which fission-track annealing is already well advanced.
Table 3Activation energies for fission-track annealing. TAN: annealing temperature in °C and in K; tAN: annealing time in hours and in seconds; FF: fractional annealing ; kF: rate factor; EF: activation energy. Errors are 1σ.

For a constant-core model and high average track etch rate (vT≈120 µm min−1; Table 2), the exact value of vT and the precise point from where a confined track begins to etch are of little consequence. For the same reason, the effect of multiple host track intersections, even occurring at the same time and far apart, is minimal. This is not so for a linear vT-profile with a central maximum (∼1.7 µm s−1; unannealed induced tracks) decreasing to vR towards the track tips (Ketcham and Tamer, 2021). In that case, short tracks intersected towards one end are more likely than longer tracks to be etched at the opposite end to a point that satisfies an operator's selection criteria. This would produce a correlation between the track length and the position of the host track intersection (Fig. 8 of Jonckheere, 2023). The correlation would decrease depending on the extent of length reduction and the increase of the track etch rate following partial annealing (Ketcham and Tamer, 2021).
It is reasonable to suppose that the lengths of individual confined tracks depend to some extent on their host track intersections (iP), track etch rates (vT), and effective etch times (tE). To exclude spurious correlations due to length anisotropy, we plotted the c axis-projected lengths (lP) against iP, vT and tE. Regression lines to the lP-vs.-iP plots of 21-2 and 21-4 have small positive slopes whereas those to the lP-vs.-iP plots of 21-1 and 21-3 have small negative slopes, indicating the absence of a significant correlation (Fig. S7). Regression lines to the lP-vs.-vT plots of all the samples have small positive slopes (Fig. S8). Because of the large vT-range (50-250 µm min−1; Fig. S5), this can add on average 0.1–0.3 µm to the lengths of fast-etching tracks compared to those of slow-etching tracks. Regression lines to three out of four lP-vs.-tE plots (except 21-4; Fig. S9) have weak positive slopes, which, nevertheless, add on average 0.1–0.3 µm to the lengths of well-etched tracks (tE≈20 s) compared to those of underetched tracks (tE≈5 s). Because the independent variables are not free from measurement error, least squares regression underestimates the true slopes and overestimates the intercepts of the regression lines due to attenuation bias. If half of the measured variation of vT and tE is true variation and the remainder due to measurement error, the true slopes would be twice as high, and the lP-ranges, should be doubled. We nevertheless conclude that, for practical purposes, within a sample of confined tracks selected for measurement, the intersection points, the track etch rates and the effective etch times have little effect on the length distribution (20 s; 5.5 M HNO3; 21 °C). This does not mean, however, that they have no effect on the sampling itself, i.e., on the distinction between tracks selected for measurement and those that are not. E.g., the effective etch time influences the widths of confined tracks, and so their qualification for measurement.
4.1 Experiment
We studied the FC1 and AS3 apatites from the Duluth intrusive complex in Minnesota to investigate the effects of geological ageing. FC1 and AS3 are reference materials and proposed age standards with fission-track ages of 820(27)–882(44) Ma (FC1), and 924(36)–989(31) Ma (AS3; Iwano et al., 2019; Cogné and Gallagher, 2021; Härtel et al., 2022, 2023; Jonckheere et al., 2024a). Their interest lies in the fact that they are old and have long low-temperature thermal histories, and so accumulated extensive radiation damage, the most important factor responsible for ageing. Based on the data of Härtel et al. (2023), the total accumulated alpha dose for FC1 is α g−1 (0.8–1.0 dpa), although it is not known what fraction of the damage survived till the present. We are not aware of such data for AS3.
We annealed an aliquot of FC1 and AS3 for 24 h at 450 °C, and irradiated it with thermal neutrons in channel Y4 of the BR1 reactor in Mol, Belgium. We mounted irradiated and untreated fractions of each sample in resin, and ground, polished and etched them using the techniques described in Sect. 3.1. As there also, we measured the track lengths, orientations, widths, cone-angles, and Dpar, but not the host track intersections, and calculated the effective etch times and the apatite and track etch rates.
4.2 Results
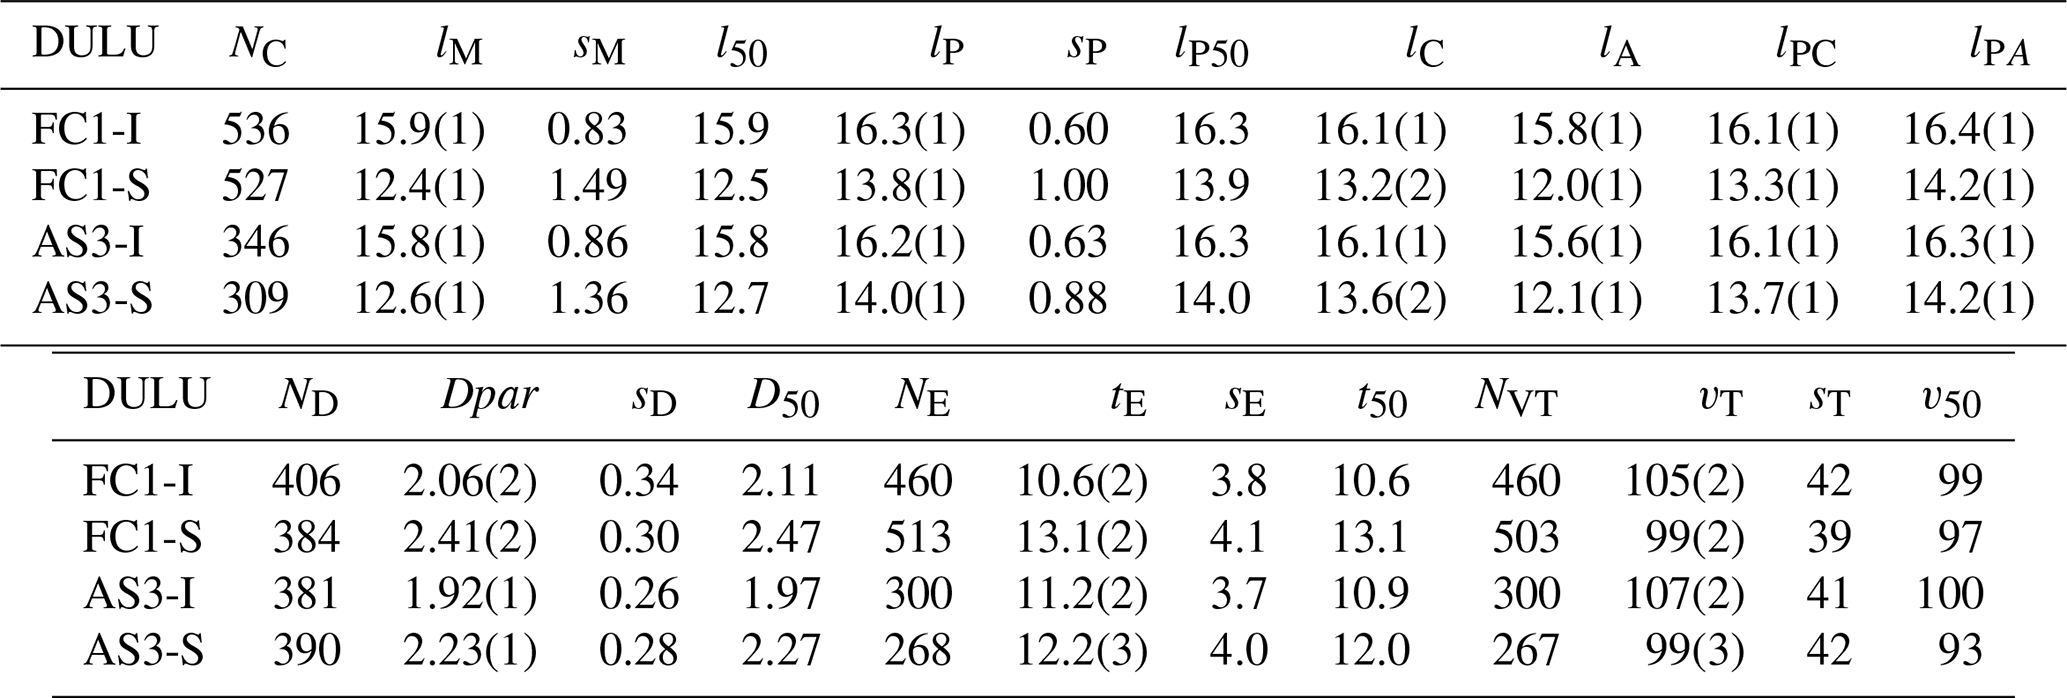
Consistent with their similar Dpar-values, the induced-track length distributions of FC1 and AS3 are almost identical. The fossil tracks in both samples underwent >20 % shortening; both fossil-track length distributions are also similar, although those in FC1 are somewhat shorter. We interpret this difference as significant; c axis projection highlights the greater fraction of short tracks (Table 4; Fig. 7a, b). The semi-axes of ellipses fitted to the induced-track data are close to the trend for unannealed apatites (Donelick et al., 1999); those fitted to the fossil-track data reveal them to be somewhat less anisotropic than induced tracks of the same mean length (Fig. 7c). This could be due to different length bias affecting high- and low-angle tracks, different angular distributions, which control the relative weights of the constituent populations, or under-etching (Jonckheere, 2023; Jonckheere et al., 2024b). However, the angular distributions of the fossil, as well as induced, tracks are almost identical (Fig. 7d) and the effective etch times of the fossil tracks are 1–2 s longer than those of the induced (Table 4; Fig. 8b). This argues against experimental factors, leaving length-bias as the likeliest cause, barring unknown differences between fossil and induced tracks.
Table 4Measurements of fossil and induced confined tracks in FC1 and AS3 (DULU: Duluth) apatite, etched for 20 s in 5.5 M HNO3 at 21 °C. See Table 2 for symbols.
4.3 Discussion
As in the case of the annealed Durango samples, the vT-distributions of all the Duluth samples are almost identical (Fig. 8a). The ∼5 % difference between the means for the fossil and the induced tracks (Table 4) is too small to be considered significant at this stage. The overall agreement is striking given that the track etch rates vT are calculated from the apatite etch rates vR (Fu et al., 2024):
wherein s12 is the distance between two inscribed circles, with diameters d1 and d2, touching opposite sides of the confined track, and vRS is the apatite etch rate perpendicular to the track axis. Dpar-measurements indicate that the apatite etch rate differs 7 %–8 % between FC1 and AS3 and 16 %–17 % between the fossil and induced tracks (Table 4). We applied the empirical correlation between Dpar and vR (Trilsch et al., 2023; Fu et al., 2024) for calculating the apatite etch rate of each sample:
[Dpar]S and [Dpar]D refer to the sample and to Durango apatite, and vRD is the etch rate of Durango (Aslanian et al., 2021). The agreement between the vT-distributions of FC1 and AS3 is perhaps unsurprising. Both are from the Duluth complex anorthosite series, albeit from locations >100 km apart, and, according to their ages and track length distributions, both had similar thermal histories. The less obvious finding is that, in contrast to the substantial length reduction, ageing, or geological low-temperature annealing, appears to have had a minimal effect on the etch rates of the fossil tracks.
As in the case of the annealed Durango samples, the average effective etch-times (tE) of FC1 and AS3 are just over half the immersion time (tI=20 s; Table 4). The means, medians and standard deviations for both induced-track samples are similar, those for both fossil-track samples somewhat less so, reflecting their geological histories. There is, on the other hand, a definite offset between the tE-distributions of the fossil and induced tracks (Fig. 8b, d), which is not due to vT. The longer effective etch times of the fossil tracks are instead due to the greater vR of the unannealed grains, which allow faster etchant access to the confined tracks. There are contributing factors: the much higher fossil than induced track densities (Jonckheere et al., 2024a) lowers the average separation between the host tracks and confined tracks; on the other hand, the shorter fossil- than induced-track lengths have an opposite effect. It is difficult to separate these factors because the stock of confined tracks is sampled using the experimenter's track selection criteria.
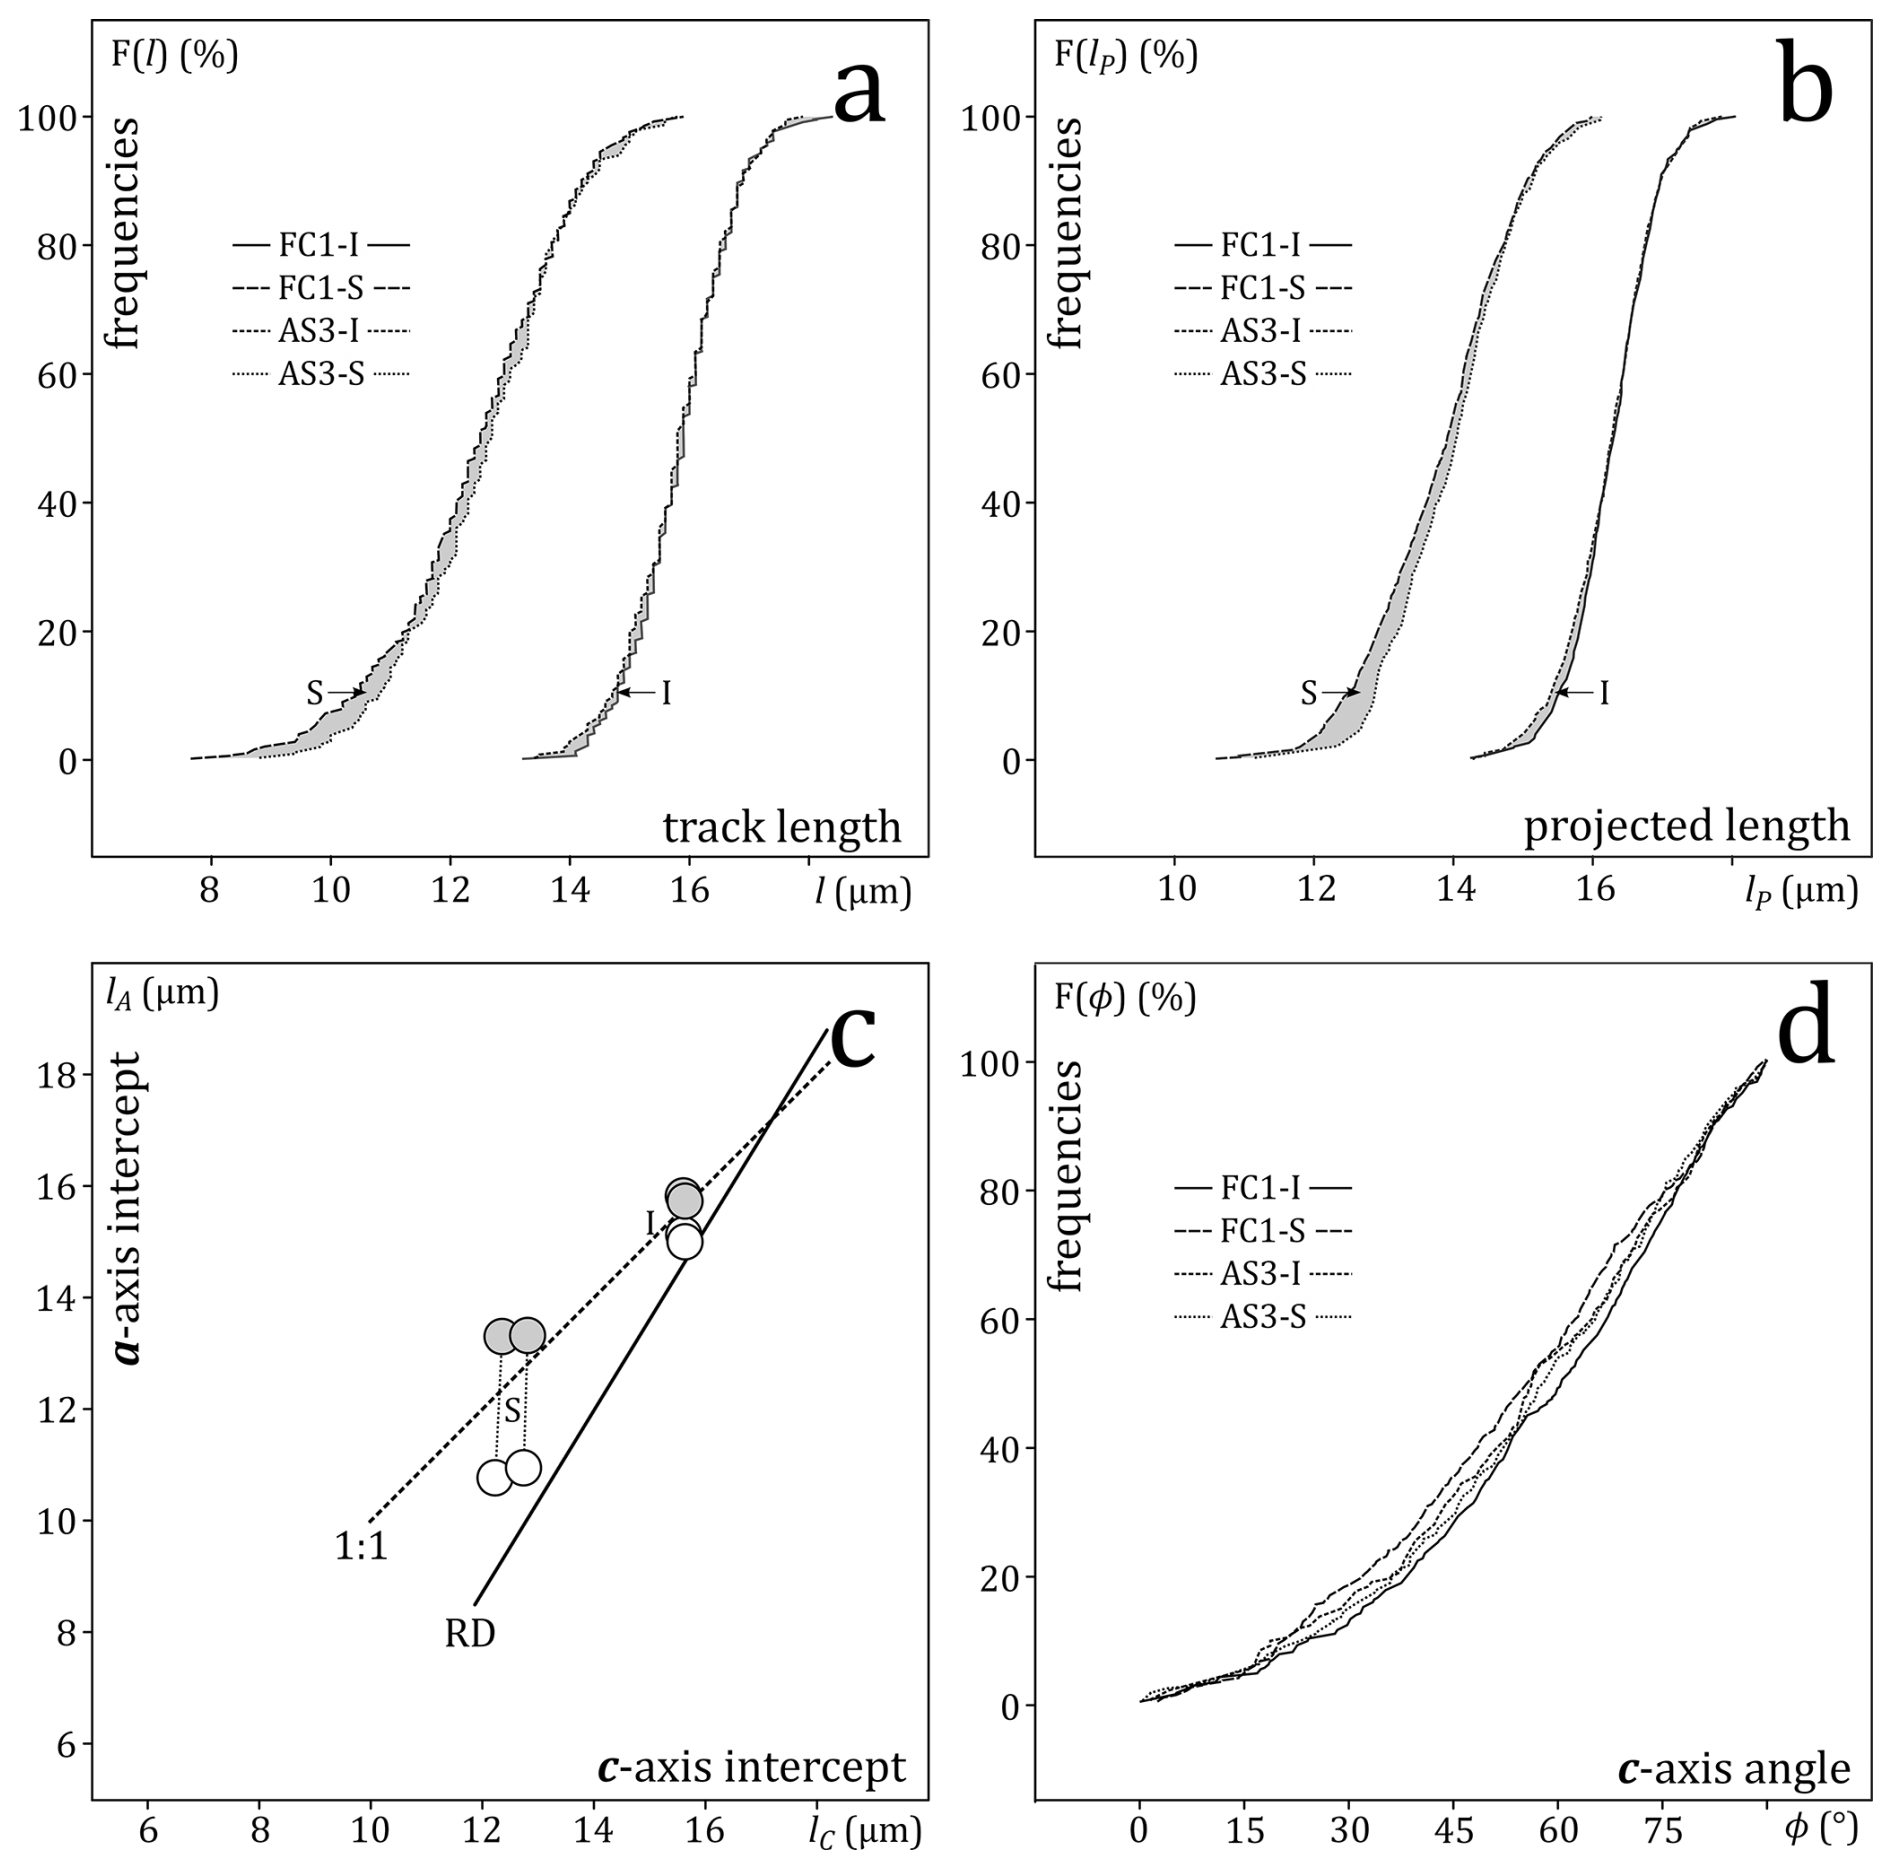
Figure 7(a) Cumulative frequencies of the lengths of fossil (S) and induced (I) confined tracks in prism faces of FC-1 and AS-3 apatites from the Duluth complex, Minnesota, USA (Iwano et al., 2019; Härtel et al., 2023). (b) Cumulative frequencies of the c axis projected lengths of FC-1 and AS-3. (c) a axis vs. c axis intercepts of ellipses fitted to the lengths and regression lines fitted to the c axis projected length vs. c axis angle (white: induced; grey: fossil; RD and 1:1 as in Fig. 5); (d) cumulative frequencies of the c axis angles.
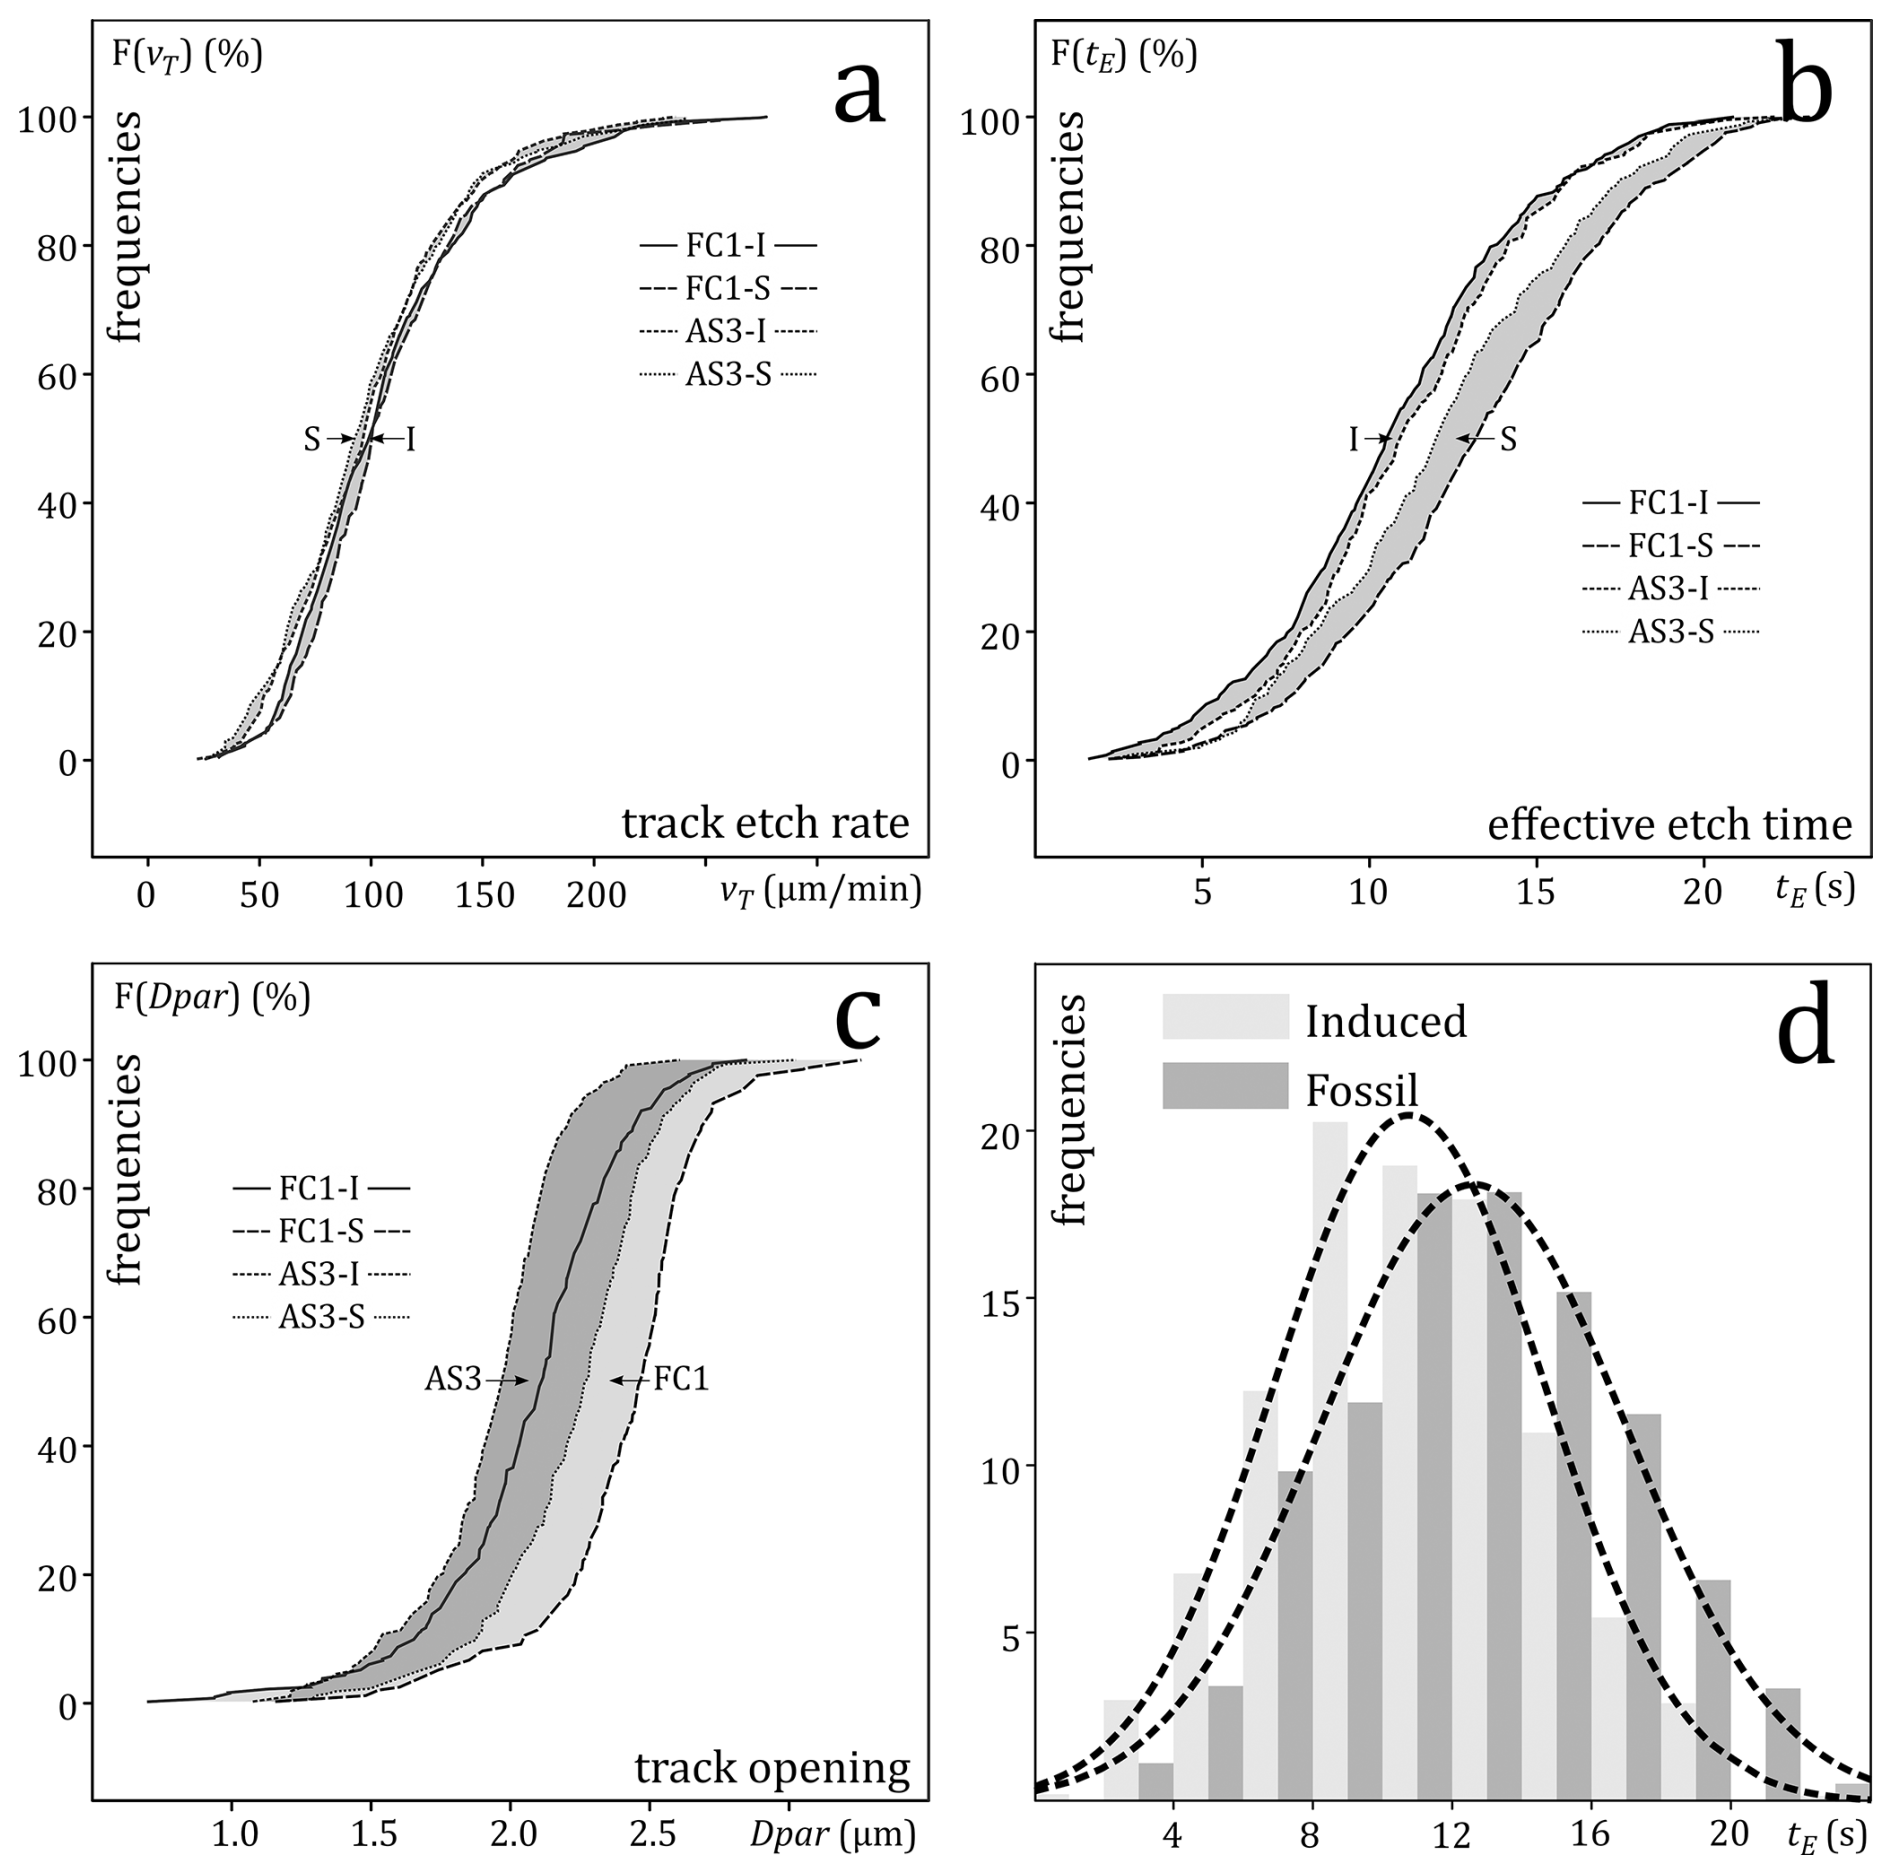
Figure 8(a) Cumulative frequencies of the track etch rates of fossil (S) and induced (I) confined tracks in the FC-1 and AS-3 apatites (b) Cumulative frequencies of the effective etch times of fossil and induced tracks (c) cumulative frequencies of the sizes of the track surface intersections (Dpar) of fossil and induced tracks. (d) Histograms of the effective etch times of the combined fossil and induced tracks of FC-1 and AS-3.
The major difference between samples FC1 and AS3, and between the fossil and induced tracks in each, is between their Dpar-values (Table 4; Fig. 8c). The fossil-track values are ∼16 % (AS3) and ∼ 17 % (FC1) greater than those of induced tracks. We propose that this is due to distributed radiation damage from α-disintegration of 238U, 235U, 232Th, and 147Sm, and from collateral recoils from 238U-fission, accumulated over geological time. The resulting lattice damage increases the overall apatite etch rate, producing larger Dpar. Figure 9 shows the openings of fossil and induced tracks in FC1. The ageing of the fossil-track samples appears to have had a greater effect on the widths (Dper) than on the lengths (Dpar) of the track-surface intersections. This support the radiation damage idea: Dpar depends on the etch rates of fast etching faces while Dper depends on that of slow-etching prism faces flanking each track to either side (Jonckheere et al., 2020, 2022). This can account for the doubling of Dper while Dpar increases <20 % (Fig. 9b), as slow-etching faces are more susceptible to radiation damage than fast etching faces (Jonckheere et al., 2019; their Fig. 4). Tamer and Ketcham (2020b), in contrast, found no difference between the Dpar of fossil and induced tracks in the Durango, Fish Canyon Tuff, and Tioga apatites. Depending on uncertain estimates of the U, Th-concentrations and damage accumulation ages, it is just possible that the FC1 apatite is, or once was, past the first damage percolation point, whereas the younger samples are, or were, not.
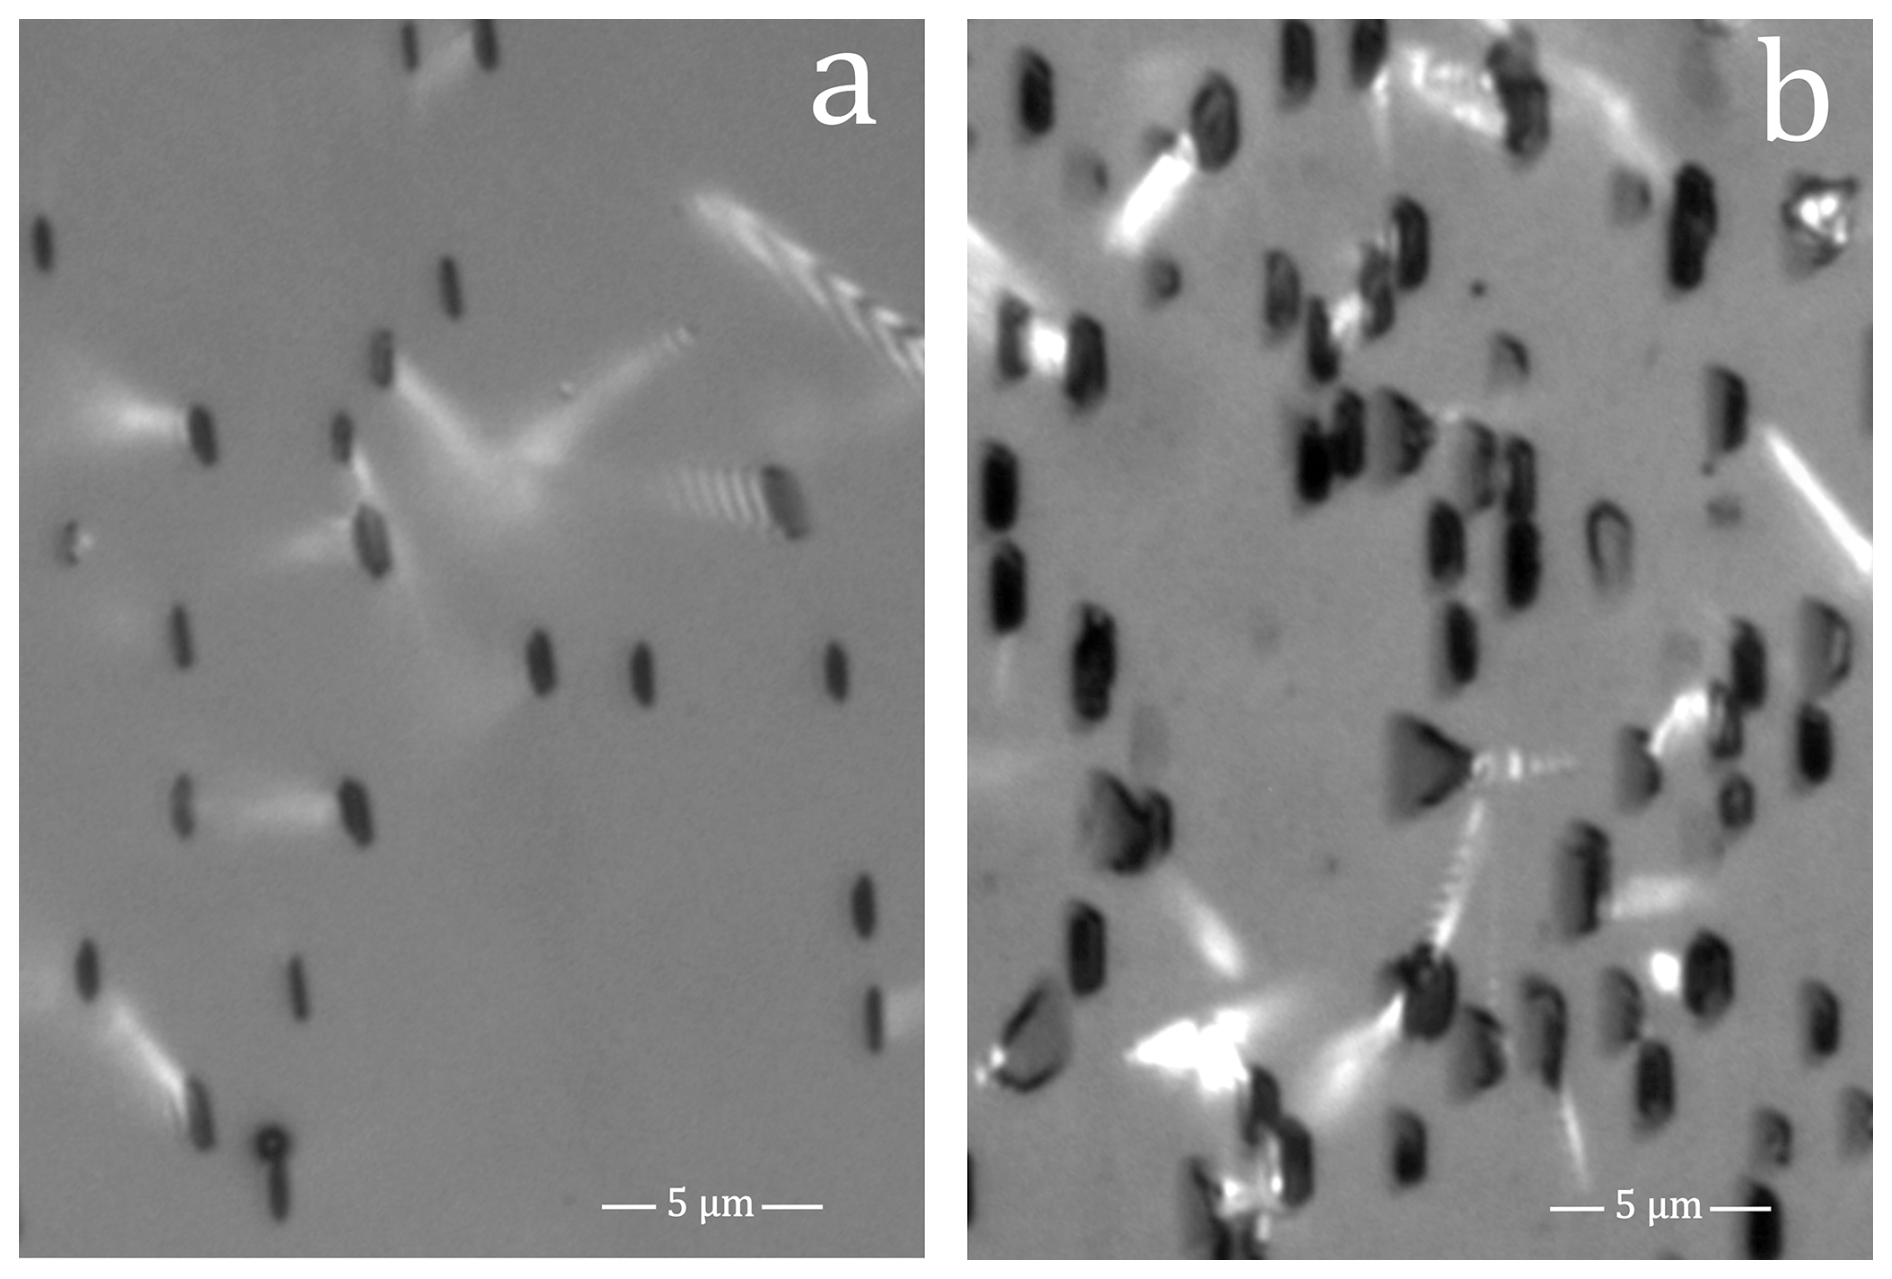
Figure 9Reflected-light images of the openings of induced (a) and fossil (b) tracks in prism faces of the FC1 apatite (etched 20 s in 5.5 M HNO3 at 21 °C).
Figure S15 plots the c axis-projected lengths (lP) of individual confined tracks against their effective etch times (tE), and Fig. S16 against their track etch rates (vT). The results for the induced tracks in FC1-I and AS3-I are in part similar to those for the unannealed Durango sample (21-2; Table 2). As in sample 21-2, the variation of vT adds 0.1–0.2 µm to the lengths of the fastest etching tracks, compared to those of the slowest etching tracks. In contrast, the variation of tE causes a 0.6 µm length difference over the full tE-range, compared to 0.1 µm for 21-2. The results for the fossil tracks in AS3-S are similar to those for the induced tracks in AS3-I (0.2 µm length difference due to vT; 0.6 µm due to tE), but those for the fossil tracks in FC1-S are not (0.7 µm length difference due to vT; 0.2 µm due to tE). On the whole, the vT- and tE-variation between tracks has little effect on the length distribution of a confined track population etched in a single 20 s step. However, as mentioned, the ordinary least squares regression underestimates the true slopes of the regression lines.
Our measurements and microscopic observations indicate that vT is constant over most of the length of ion and fission tracks in apatite (constant core model; Tamer and Ketcham, 2020a). This suggests that there is a threshold damage above which vT does not increase, e.g., an amorphous core raises vT to a value that does not depend on the work expended to create it (i.e., the amorphous state is an end state). However, that is not within the scope of our investigation. On the other hand, reconciling straight-sided etched surface and confined tracks with something other than a constant vT requires a different and more complex etch model than any proposed to date. We report 3588 of vT-values, consistent with earlier results, based on measurements of the track widths and shapes. These are the only estimates in existence except for predetermined vT-profiles fitted to 28 track lengths. Since the track length integrates the along-track vT-variation over the full immersion time, it is improbable that the latter approach has more than the most indirect and tenuous bearing on vT. It is therefore no surprise that the preferred linear model conflicts with the observed track shapes, in contrast with ours which is consistent with the straight sided confined track in Fig. 4a, and surface tracks in Fig. 4b. No conceivable other model does that. Our results also revealed that the etchant advances at a high but finite rate along pre-etched tracks. This implies that the summed immersion times of step-etch experiments are overestimates, and that step-etching broadens the effective-etch-time distribution (Jonckheere et al., 2024b; their Fig. 6a). It also implies that successive etch steps cause vT to be underestimated to an increasing extent (Jonckheere et al., 2024b; their Fig. 5c). The low average vT of fossil tracks in Durango apatite of Aslanian et al. (2021; ∼75 µm min−1) is therefore not in conflict with the present results.
The distributions of host-track intersections (iP), c axis angles (ϕ), and track-etch rates (vT) are almost identical across all measurements. There is a noticeable offset between the average vT of the Durango and Duluth samples, but this must not mean that it is of fundamental importance. The calculation of vT requires vR, which was measured for Durango (Aslanian et al., 2021) and some other apatites but not for FC1 and AS3, whose etch rates were estimated from their Dpar-values, relative to that of Durango (Trilsch et al., 2023; Fu et al., 2024). The difference between Durango and Duluth could be within the uncertainties, which could also account for the small difference between the fossil and induced tracks in FC1 and AS3. The near-identical iP-, ϕ-, and vT-distributions are difficult to explain, but suggest that the confined-track selection is dominated by a criterion that is more or less independent of the track densities or lengths. The confined-track width is such a criterion that is moreover little affected by annealing (Jonckheere, 2023).
In contrast to the track etch rate vT, the apatite etch rate vR shows marked variation. This is most obvious from the Dpar-values of the fossil and induced tracks in FC1 and AS3, but also from those of the annealed induced tracks in Durango apatite. In the case of the fossil tracks, the Dper Dpar-ratio increases as well as Dpar. It is therefore probable that the Dpar-increases are related to lattice damage, from the natural background radiation in the fossil-track samples and from neutron irradiation in the induced-track samples. Dper Dpar-ratios could offer a means of assessing damage densities in apatite if their effect can be separated from chemical effects on Dpar. On the other hand, Dpar-variation implies a need for caution when using Dpar for estimating apatite annealing rates. The greater vR of the Duluth samples with fossil tracks increases the rate of advance of the etchant along the slowest section of its course down the host track (vT), across to the confined track (vR; widening of the host track) and along the confined track to each tip (vT). Confined tracks in fast etching apatites therefore have shorter access times and, in consequence, longer effective etch times.
Since the earliest fission track studies, all etch models have been based on two velocities: vT, the rate of advance along the damaged track core, and vR, the rate of retreat of the undamaged material. These velocities are more than conceptual: their values define the efficiencies of the track counts (Tagami and O'Sullivan, 2005) and thresholds for confined-track selection (Ketcham and Tamer, 2021; Jonckheere, 2023). They also provide the basis for explaining the shapes of etched tracks (Jonckheere et al., 2022). On its own, vR is an important indicator of chemical composition and annealing kinetics (Dpar; Burtner et al., 1994). Actual measurements of vT and vR have however long been missing.
The reported measurements show that some long-standing assumptions concerning apatite and fission-track etching are not corroborated by the evidence. The track etch rate vT is little dependent on the track forming process (), and is little affected by either lab or geological annealing. In contrast, the apatite etch rate vR, besides its dependence on composition, does seem to be somewhat affected by annealing and in some samples by ageing. This revised picture has practical implications for the interpretation of track etching, track selection, and the estimation of thermal histories.
Data are available as Excel files Krypton.xlsx (Sect. S2), Durango.xlsx (Sect. S3), and Duluth.xlsx (Sect. S4) in the Supplement.
The supplement related to this article is available online at https://doi.org/10.5194/gchron-8-645-2026-supplement.
Concept, funding and administration: RJ, TN; data curation, statistics, discussion and interpretation: RJ, FT, JL, PZ; manuscript text, figures and tables: RJ, FT, TN; replies to reviews and revision: RJ, FT.
The contact author has declared that none of the authors has any competing interests.
Publisher's note: Copernicus Publications remains neutral with regard to jurisdictional claims made in the text, published maps, institutional affiliations, or any other geographical representation in this paper. The authors bear the ultimate responsibility for providing appropriate place names. Views expressed in the text are those of the authors and do not necessarily reflect the views of the publisher.
We thank the accelerator staff at the Heavy Ion Research Facility Lanzhou of the Institute of Modern Physics of the Chinese Academy of Sciences for their expert handling of the Kr-irradiation. We are indebted to Hideki Iwano for providing generous aliquots of the FC1 and AS3 Duluth apatites.
This research has been supported by the Deutsche Forschungsgemeinschaft (grant no. JO 358/6).
This open-access publication was funded by the TU Bergakademie Freiberg.
This paper was edited by Ryan Ickert and reviewed by Richard A. Ketcham and one anonymous referee.
Aslanian, C., Jonckheere, R., Wauschkuhn, B., and Ratschbacher, L.: A quantitative description of fission-track etching in apatite, Am. Mineral., 106, 518–526, https://doi.org/10.2138/am-2021-7614, 2021.
Aslanian, C., Jonckheere, R., Wauschkuhn, B., and Ratschbacher, L.: Short communication: Experimental factors affecting fission-track counts in apatite, Geochronology, 4, 109–119, https://doi.org/10.5194/gchron-4-109-2022, 2022.
Bobroff, N.: Position measurement with a resolution and noise-limited instrument, Rev. Sci. Instrum., 57, 1152–1157, https://doi.org/10.1063/1.1138619, 1986.
Boyce, J. W. and Hodges, K. V.: U and Th zoning in Cerro de Mercado (Durango, Mexico) fluorapatite: Insights regarding the impact of recoil redistribution of radiogenic 4He on thermochronology, Chem. Geol., 219, 261–274, https://doi.org/10.1016/j.chemgeo.2005.02.007, 2005.
Burtner, R. L., Nigrini, A., and Donelick, R. A.: Thermochronology of Lower Cretaceous source rocks in the Idaho-Wyoming thrust belt, AAPG Bull., 78, 1613–1636, https://doi.org/10.1306/A25FF233-171B-11D7-8645000102C1865D, 1994.
Carlson, W. D., Donelick, R. A., and Ketcham, R. A.: Variability of apatite fission-track annealing kinetics: I. Experimental results, Am. Mineral., 84, 1213–1223, https://doi.org/10.2138/am-1999-0901, 1999.
Cogné, N. and Gallagher, K.: Some comments on the effect of uranium zonation on fission track dating by LA-ICP-MS, Chem. Geol., 573, 120226, https://doi.org/10.1016/j.chemgeo.2021.120226, 2021.
Copeland, C. R., Geist, J., McGray, C. D., Aksyuk, V. A., Liddle, J. A., Ilic, B. R., and Stavis, S. M.: Subnanometer localization accuracy in widefield optical microscopy, Light Sci. Appl., 7, 31, https://doi.org/10.1038/s41377-018-0031-z, 2018.
Donelick, R. A., Ketcham, R. A., and Carlson, W. D.: Variability of apatite fission-track annealing kinetics: II. Crystallographic orientation effects, Am. Mineral., 84, 1224–1234, https://doi.org/10.2138/am-1999-0902, 1999.
Dufour, C. and Toulemonde, M.: Models for the description of track formation, in: Ion Beam Modification of Solids: Ion-Solid Interaction and Radiation Damage, edited by: Wesch, W. and Wendler, E., Springer International Publishing, Cham, 63–104, https://doi.org/10.1007/978-3-319-33561-2_2, 2016.
Durrani, S. A. and Bull, R. K.: Solid State Nuclear Track Detection: Principles, Methods and Applications, Pergamon Press, Oxford, 304 pp., ISBN 9780080206059, 1987.
Enkelmann, E., Jonckheere, R., and Ratschbacher, L.: Absolute measurements of the uranium concentration in thick samples using fission-track detectors, Nucl. Instrum. Methods Phys. Res. Sect. B, 229, 489–498, https://doi.org/10.1016/j.nimb.2005.01.003, 2005a.
Enkelmann, E., Jonckheere, R., and Wauschkuhn, B.: Independent fission-track ages (ϕ-ages) of proposed and accepted apatite age standards and a comparison of ϕ-, Z-, ζ- and ζ0-ages: Implications for method calibration, Chem. Geol., 222, 232–248, https://doi.org/10.1016/j.chemgeo.2005.07.009, 2005b.
Fleischer, R. L. and Price, P. B.: Techniques for geological dating of minerals by chemical etching of fission fragment tracks, Geochim. Cosmochim. Ac., 28, 1705–1714, https://doi.org/10.1016/0016-7037(64)90017-1, 1964.
Fleischer, R. L., Price, P. B., and Woods, R. T.: Nuclear-particle-track identification in inorganic solids, Phys. Rev., 188, 563–567, https://doi.org/10.1103/PhysRev.188.563, 1969.
Fleischer, R. L., Price, P. B., and Walker, R. M.: Nuclear Tracks in Solids: Principles and Applications, University of California Press, Berkeley, 604 pp., https://doi.org/10.1525/9780520320239, 1975.
Foshag, W. F.: Mineralogy and geology of Cerro Mercado, Durango, Mexico, Proc. U.S. Natl. Mus., 74, 1–27, https://doi.org/10.5479/si.00963801.74-2768.1, 1929.
Fu, H., Trilsch, F., Jonckheere, R., and Ratschbacher, L.: Compositional effects on the etching of fossil confined fission tracks in apatite, Am. Mineral., 109, 2026–2036, https://doi.org/10.2138/am-2024-9331, 2024.
Galbraith, R. F.: Some remarks on fission-track observational biases and crystallographic orientation effects, Am. Mineral., 87, 991–995, https://doi.org/10.2138/am-2002-0723, 2002.
Galbraith, R. F., Laslett, G. M., Green, P. F., and Duddy, I. R.: Apatite fission track analysis: geological thermal history analysis based on a three-dimensional random process of linear radiation damage, Philos. Trans. R. Soc. Lond. A, 332, 419–438, https://doi.org/10.1098/rsta.1990.0124, 1990.
Gleadow, A. J. W.: Fission-track dating methods: What are the real alternatives?, Nucl. Tracks, 5, 3–14, https://doi.org/10.1016/0191-278X(81)90021-4, 1981.
Gross, R.: On the theory of growth and dissolution processes of crystalline matter, Abh. Math.-Phys. Kl. Königl. Sächs. Ges. Wiss. Leipzig, 35, 137–202, 1918 (in German).
Härtel, B., Jonckheere, R., Krause, J., and Ratschbacher, L.: Spurious age-eU associations in thermochronological data, Earth Planet. Sc. Lett., 599, 117870, https://doi.org/10.1016/j.epsl.2022.117870, 2022.
Härtel, B., Matthews, W. A., and Enkelmann, E.: Duluth Complex FC1 apatite and zircon: Reference materials for (U-Th)/He dating?, Geostand. Geoanal. Res., 47, 669–681, https://doi.org/10.1111/ggr.12492, 2023.
Heimann, R. B.: Dissolution of Crystals: Theory and Practical Application, Applied Mineralogy, 8, Springer, Vienna, 270 pp., https://doi.org/10.1007/978-3-7091-3402-3, 1975 (in German).
Heimann, R. B.: Principles of chemical etching – the art and science of etching crystals, in: Silicon Chemical Etching, edited by: Grabmaier, J., Crystals: Growth, Properties and Applications, 8, Springer, Berlin, Heidelberg, 173–224, https://doi.org/10.1007/978-3-642-68765-5_3, 1982.
Hurford, A. J.: An historical perspective on fission-track thermochronology, in: Fission-Track Thermochronology and Its Application to Geology, edited by: Malusà, M. G. and Fitzgerald, P. G., Springer, Cham, 3–23, https://doi.org/10.1007/978-3-319-89421-8_1, 2019.
Iwano, H., Danhara, T., Yuguchi, T., Hirata, T., and Ogasawara, M.: Duluth Complex apatites: Age reference material for LA–ICP–MS-based fission-track dating, Terra Nova, 31, 247–256, https://doi.org/10.1111/ter.12393, 2019.
Jonckheere, R.: On the densities of etchable fission tracks in a mineral and co-irradiated external detector with reference to fission-track dating of minerals, Chem. Geol., 200, 41–58, https://doi.org/10.1016/S0009-2541(03)00116-5, 2003.
Jonckheere, R. and Van den haute, P.: Observations on the geometry of etched fission tracks in apatite; implications for models of track revelation, Am. Mineral., 81, 1476–1493, https://doi.org/10.2138/am-1996-11-1219, 1996.
Jonckheere, R., Mars, M., Van den haute, P., Rebetez, M., and Chambaudet, A.: The apatite from Durango, Mexico: Analysis of a standard mineral for fission-track dating, Chem. Geol., 103, 141–154, https://doi.org/10.1016/0009-2541(93)90297-V, 1993 (in French).
Jonckheere, R., Van den haute, P., and Ratschbacher, L.: Standardless fission-track dating of the Durango apatite age standard, Chem. Geol., 417, 44–57, https://doi.org/10.1016/j.chemgeo.2015.09.014, 2015.
Jonckheere, R., Wauschkuhn, B., and Ratschbacher, L.: On growth and form of etched fission tracks in apatite: A kinetic approach, Am. Mineral., 104, 569–579, https://doi.org/10.2138/am-2019-6762, 2019.
Jonckheere, R., Aslanian, C., Wauschkuhn, B., and Ratschbacher, L.: Some geometrical properties of fission-track-surface intersections in apatite, Am. Mineral., 105, 1355–1364, https://doi.org/10.2138/am-2020-7271, 2020.
Jonckheere, R., Aslanian, C., Wauschkuhn, B., and Ratschbacher, L.: Fission-track etching in apatite: A model and some implications, Am. Mineral., 107, 1190–1200, https://doi.org/10.2138/am-2022-8055, 2022.
Jonckheere, R., Aslanian, C., Fu, H., and Trilsch, F.: Sampling confined fission tracks for constraining geological thermal histories, Minerals, 14, 1016, https://doi.org/10.3390/min14101016, 2024a.
Jonckheere, R., Härtel, B., and Iwano, H.: Fission-track age calibration: Phi and Zeta, never the twain shall meet?, Chem. Geol., 648, 121898, https://doi.org/10.1016/j.chemgeo.2023.121898, 2024b.
Jonckheere, R. C.: On etching, selection and measurement of confined fission tracks in apatite, Geochronology Discuss. [preprint], https://doi.org/10.5194/gchron-2023-13, 2023.
Ketcham, R. A.: Observations on the relationship between crystallographic orientation and biasing in apatite fission-track measurements, Am. Mineral., 88, 817–829, https://doi.org/10.2138/am-2003-5-610, 2003.
Ketcham, R. A. and Tamer, M. T.: Confined fission-track revelation in apatite: how it works and why it matters, Geochronology, 3, 433–464, https://doi.org/10.5194/gchron-3-433-2021, 2021.
Ketcham, R. A., Carter, A., and Hurford, A. J.: Inter-laboratory comparison of fission track confined length and etch figure measurements in apatite, Am. Mineral., 100, 1452–1468, https://doi.org/10.2138/am-2015-5167, 2015.
Laslett, G. M., Gleadow, A. J. W., and Duddy, I. R.: The relationship between fission track length and track density in apatite, Nucl. Tracks, 9, 29–38, https://doi.org/10.1016/0735-245X(84)90019-X, 1984.
Li, W., Lang, M., Gleadow, A. J. W., Zdorovets, M. V., and Ewing, R. C.: Thermal annealing of unetched fission tracks in apatite, Earth Planet. Sc. Lett., 321–322, 121–127, https://doi.org/10.1016/j.epsl.2012.01.008, 2012.
Li, W., Kluth, P., Schauries, D., Rodriguez, M. D., Lang, M., Zhang, F., Zdorovets, M., Trautmann, C., and Ewing, R. C.: Effect of orientation on ion track formation in apatite and zircon, Am. Mineral., 99, 1127–1132, https://doi.org/10.2138/am.2014.4669, 2014.
Li, W., Shen, Y., Zhou, Y., Zhai, P., Nan, S., Liu, J., and Ewing, R. C.: Unexpectedly narrower track diameter at site of fission event, Earth Planet. Sc. Lett., 616, 118217, https://doi.org/10.1016/j.epsl.2023.118217, 2023.
McConnell, D.: Apatite: Its Crystal Chemistry, Mineralogy, Utilization and Geologic and Biologic Occurrences, in: Applied Mineralogy, vol. 5, edited by: Fréchette, V. D., Kirsch, H., Sand, L. B., and Trojer, F., Springer-Verlag, Vienna, 111 pp., https://doi.org/10.1007/978-3-7091-8314-4, 1973.
Nikezić, D.: Three-dimensional analytical determination of the track parameters, Radiat. Meas., 32, 277–282, https://doi.org/10.1016/S1350-4487(00)00034-2, 2000.
Nikezić, D. and Yu, K. N.: Three-dimensional analytical determination of the track parameters: over-etched tracks, Radiat. Meas., 37, 39–45, https://doi.org/10.1016/S1350-4487(02)00129-4, 2003.
Nikezić, D. and Yu, K. N.: Formation and growth of tracks in nuclear track materials, Mater. Sci. Eng. R Rep., 46, 51–123, https://doi.org/10.1016/j.mser.2004.07.003, 2004.
Paretzke, H. G., Benton, E. V., and Henke, R. P.: On particle track evolution in dielectric track detectors and charge identification through track radius measurement, Nucl. Instrum. Methods, 108, 73–80, https://doi.org/10.1016/0029-554X(73)90637-X, 1973.
Rivera, A., Garcia, G., Olivares, J., Crespillo, M. L., and Agulló-López, F.: Elastic (stress–strain) halo associated with ion-induced nano-tracks in lithium niobate: Role of crystal anisotropy, J. Phys. D Appl. Phys., 44, 475301, https://doi.org/10.1088/0022-3727/44/47/475301, 2011.
Rymzhanov, R. A., Gorbunov, S. A., Medvedev, N., and Volkov, A. E.: Damage along swift heavy ion trajectory, Nucl. Instrum. Methods Phys. Res. Sect. B, 440, 25–35, https://doi.org/10.1016/j.nimb.2018.11.034, 2019.
Schauries, D.: Ion Tracks in Apatite and Quartz and Their Behaviour with Temperature and Pressure, Springer Theses, Springer, Cham, 166 pp., https://doi.org/10.1007/978-3-319-96283-2, 2018.
Somogyi, G. and Szalay, S. A.: Track-diameter kinetics in dielectric track detectors, Nucl. Instrum. Methods, 109, 211–232, https://doi.org/10.1016/0029-554X(73)90265-6, 1973.
Tagami, T. and O'Sullivan, P. B.: Fundamentals of fission-track thermochronology, Rev. Mineral. Geochem., 58, 19–47, https://doi.org/10.2138/rmg.2005.58.2, 2005.
Tamer, M. T. and Ketcham, R. A.: Is low-temperature fission-track annealing in apatite a thermally controlled process?, Geochem. Geophys. Geosyst., 21, e2019GC008877, https://doi.org/10.1029/2019GC008877, 2020a.
Tamer, M. T. and Ketcham, R. A.: The along-track etching structure of fission tracks in apatite: Observations and implications, Chem. Geol., 553, 119809, https://doi.org/10.1016/j.chemgeo.2020.119809, 2020b.
Trilsch, F., Fu, H., Jonckheere, R., and Ratschbacher, L.: Effective etch times of fossil fission tracks in geological apatite samples and impact on temperature-time modeling, Lithosphere, 2023, lithosphere_2023_339, https://doi.org/10.2113/2023/lithosphere_2023_339, 2023.
Young, E. J., Myers, A. T., Munson, E. L., and Conklin, N. M.: Mineralogy and geochemistry of fluorapatite from Cerro de Mercado, Durango, Mexico, U.S. Geol. Surv. Prof. Pap., 650-D, D84–D93, https://doi.org/10.3133/pp650D, 1969.