the Creative Commons Attribution 4.0 License.
the Creative Commons Attribution 4.0 License.
 | 07 May 2020
Extended-range luminescence dating of quartz and alkali feldspar from aeolian sediments in the eastern Mediterranean
Galina Faershtein
Naomi Porat
Ari Matmon
Optically stimulated luminescence (OSL) of quartz is an established technique for dating late Pleistocene to late Holocene sediments. Unfortunately, this method is often limited to up to 100 ka (thousands of years). Recent developments in new extended-range luminescence techniques show great potential for dating older sediments of middle and even early Pleistocene age. These methods include thermally transferred OSL (TT-OSL) and violet stimulated luminescence (VSL) for quartz and post-infrared infrared stimulated luminescence (pIRIR) for feldspar. Here we investigate the luminescence behaviour of the TT-OSL, VSL, and pIRIR signals of quartz and feldspar minerals of aeolian sediments of Nilotic origin from the eastern Mediterranean. We sampled a 15 m thick sequence (Kerem Shalom) comprising sandy calcic palaeosols, which is part of a sand sheet that covers an extensive region in south-western Israel. Dose recovery and bleaching experiments under natural conditions indicated that the pIRIR250 signal is the most suitable for dating the Nilotic feldspar. Luminescence intensity profiles revealed natural saturation of the three signals at the same depth of ∼6 m, indicating that ages of samples below that depth are minimum ages. Using TT-OSL and pIRIR250, a minimum age of 715 ka for the base of the section was obtained, suggesting aeolian sand accumulation along the eastern Mediterranean coastal plain already since the early Pleistocene. Our results indicate that both TT-OSL and pIRIR250 can accurately date aeolian sediments of Nilotic origin up to 200 ka and that minimum ages can be provided for older samples up to the early Pleistocene.
- Article
(5939 KB) - Full-text XML
-
Supplement
(513 KB) - BibTeX
- EndNote


Dating clastic sediments of Pleistocene age, particularly of middle and early Pleistocene, is an ongoing challenge. Several methods are available, but each has its limits. Magnetostratigraphy is binary (reverse or normal polarity with several excursions) and has low resolution (extended periods with no reversals; Singer, 2014). Cosmogenic radionuclide (CRN) burial ages (Gosse and Phillips, 2001) could suffer from unknown inherited ratios and complex post-burial production, which would result in underestimation or overestimation of the ages and carry large uncertainties (e.g. Granger, 2006, Davis et al., 2012). U–Th and U–Pb isotopic systems are restricted to pure carbonates (not common in clastic environments), while the former is limited to ∼500 ka (Bourdon et al., 2003) and Ar–Ar dating requires the presence of volcanoclastic deposits (Kelley, 2002).
Luminescence dating, especially optically (blue) stimulated luminescence (OSL) on quartz, is an established and reliable dating technique for terrestrial and shallow marine sediments of late Pleistocene to late Holocene timescale (Wintle and Adamiec, 2017). The OSL method is especially essential in arid areas where there is a lack of organic material for 14C dating. This method indicates the last exposure of the mineral (quartz or alkali feldspar) grains in the sediments to sunlight. The luminescence signal accumulates over time due to environmental ionization radiation, as electrons are trapped in defects within the mineral lattice. The age is calculated from the ratio of the equivalent dose (De) to the environmental dose rate (Dr). The (blue) OSL is limited by the saturation of the luminescence signal, occurring at ∼ 150 Gy in most cases (e.g. Chapot et al., 2012).
Over the last decade several novel methods were proposed in order to extend the range of the luminescence dating into the middle and even early Pleistocene. These include thermally transferred OSL (TT-OSL; Wang et al., 2006a) and violet stimulated luminescence (VSL; Jain, 2009) for quartz and post-infrared infrared stimulated luminescence (pIRIR) at elevated temperatures (up to 290 ∘C; Thomsen et al., 2008) for alkali feldspars. Initial results suggested the potential for dating sediments of up to 1 Ma age (Wang et al., 2006b; Ankjærgaard et al., 2013; Buylaert et al., 2012). Nevertheless, a more comprehensive investigation revealed different limitations of using these signals. For example, the TT-OSL signal is thermally unstable, producing therefore only minimum ages after a few hundred thousand years (Adamiec et al., 2010; Shen et al., 2011; Chapot et al., 2016; Faershtein et al., 2018); it appears that the natural growth of the VSL signal cannot be properly described with the single aliquot regenerative (SAR; Murray and Wintle, 2000) constructed dose response curve (DRC) generally used for De determination (Ankjærgaard et al., 2016; Ankjærgaard, 2019). There is evidence of age overestimation for the pIRIR290 and athermal signal loss (termed anomalous fading) issues for the pIRIR signals measured at lower temperatures (Lowick et al., 2012; Tsukamoto et al., 2017). The potential and limits of these methods in dating early and middle Pleistocene sediments were tested in several locations around the globe (e.g. Zander and Hilgers, 2013; Arnold et al., 2015).
The eastern Mediterranean coastal plain is mostly underlain by Pliocene-marine and Pleistocene shallow marine and aeolian sediments of Nilotic origin (Gvirtzman et al., 1984; Almagor et al., 2000; Crouvi et al., 2008; Amit et al., 2011; Muhs et al., 2013), which are rich in quartz and contain smaller amounts of feldspar. Both minerals have excellent luminescence properties, and in the last 20 years they have been extensively used for dating in this region (e.g. Porat et al., 1999, 2004, 2008). The youngest of these sediments, close to the Mediterranean coastline, has been comprehensively dated in the past by luminescence methods (quartz OSL and feldspar IRSL50), mostly up to 70 ka (e.g. Porat et al., 2004; Mauz et al., 2013, and references within). Recently, extended-range luminescence techniques (TT-OSL and pIRIR), as well as CRN burial dating, added new middle and early Pleistocene ages to the local chronology (e.g. Davis et al., 2012; Harel et al., 2017; Shemer et al., 2018). The new data strongly suggest sediment accretion since the late Pliocene to early Pleistocene, associated with a westward shift of the coastline (Harel et al., 2017). In order to deepen our understanding of the sedimentological evolution of the coastal plain, we investigate the suitability of the extended-range dating methods to date the local Nilotic sediments.
A representative exposure of the Pleistocene aeolian sediments is located at the sand sheet of Kerem Shalom (KR), 13 km from the Gaza Strip coastline (Fig. 1). This is a 15 m thick section (exposed in a trench) composed of seven sandy calcic palaeosol units, which have been described in detail by Zilberman et al. (2007). In brief, the units are (from the base) unit 1 – friable sand with four amalgamated well-developed Bk calcic horizons (stage III–IV); unit 2 – sand with well-developed Bk calcic horizon (stage III–IV); unit 3 – sand with two calcic palaeosols (stage III–IV); unit 4 – silty sand with clay horizon at the top; unit 5 – silty sand with stage III Bk calcic horizon at the top; unit 6 – friable sand at the bottom and a palaeosol with Bk calcic horizon at the top (stage II–III); unit 7 – friable sand with some carbonate nodules and pottery fragments at the top. The depositional units are separated by sharp contacts and contain evidence of bioturbation such as burrows and rhyzolites.
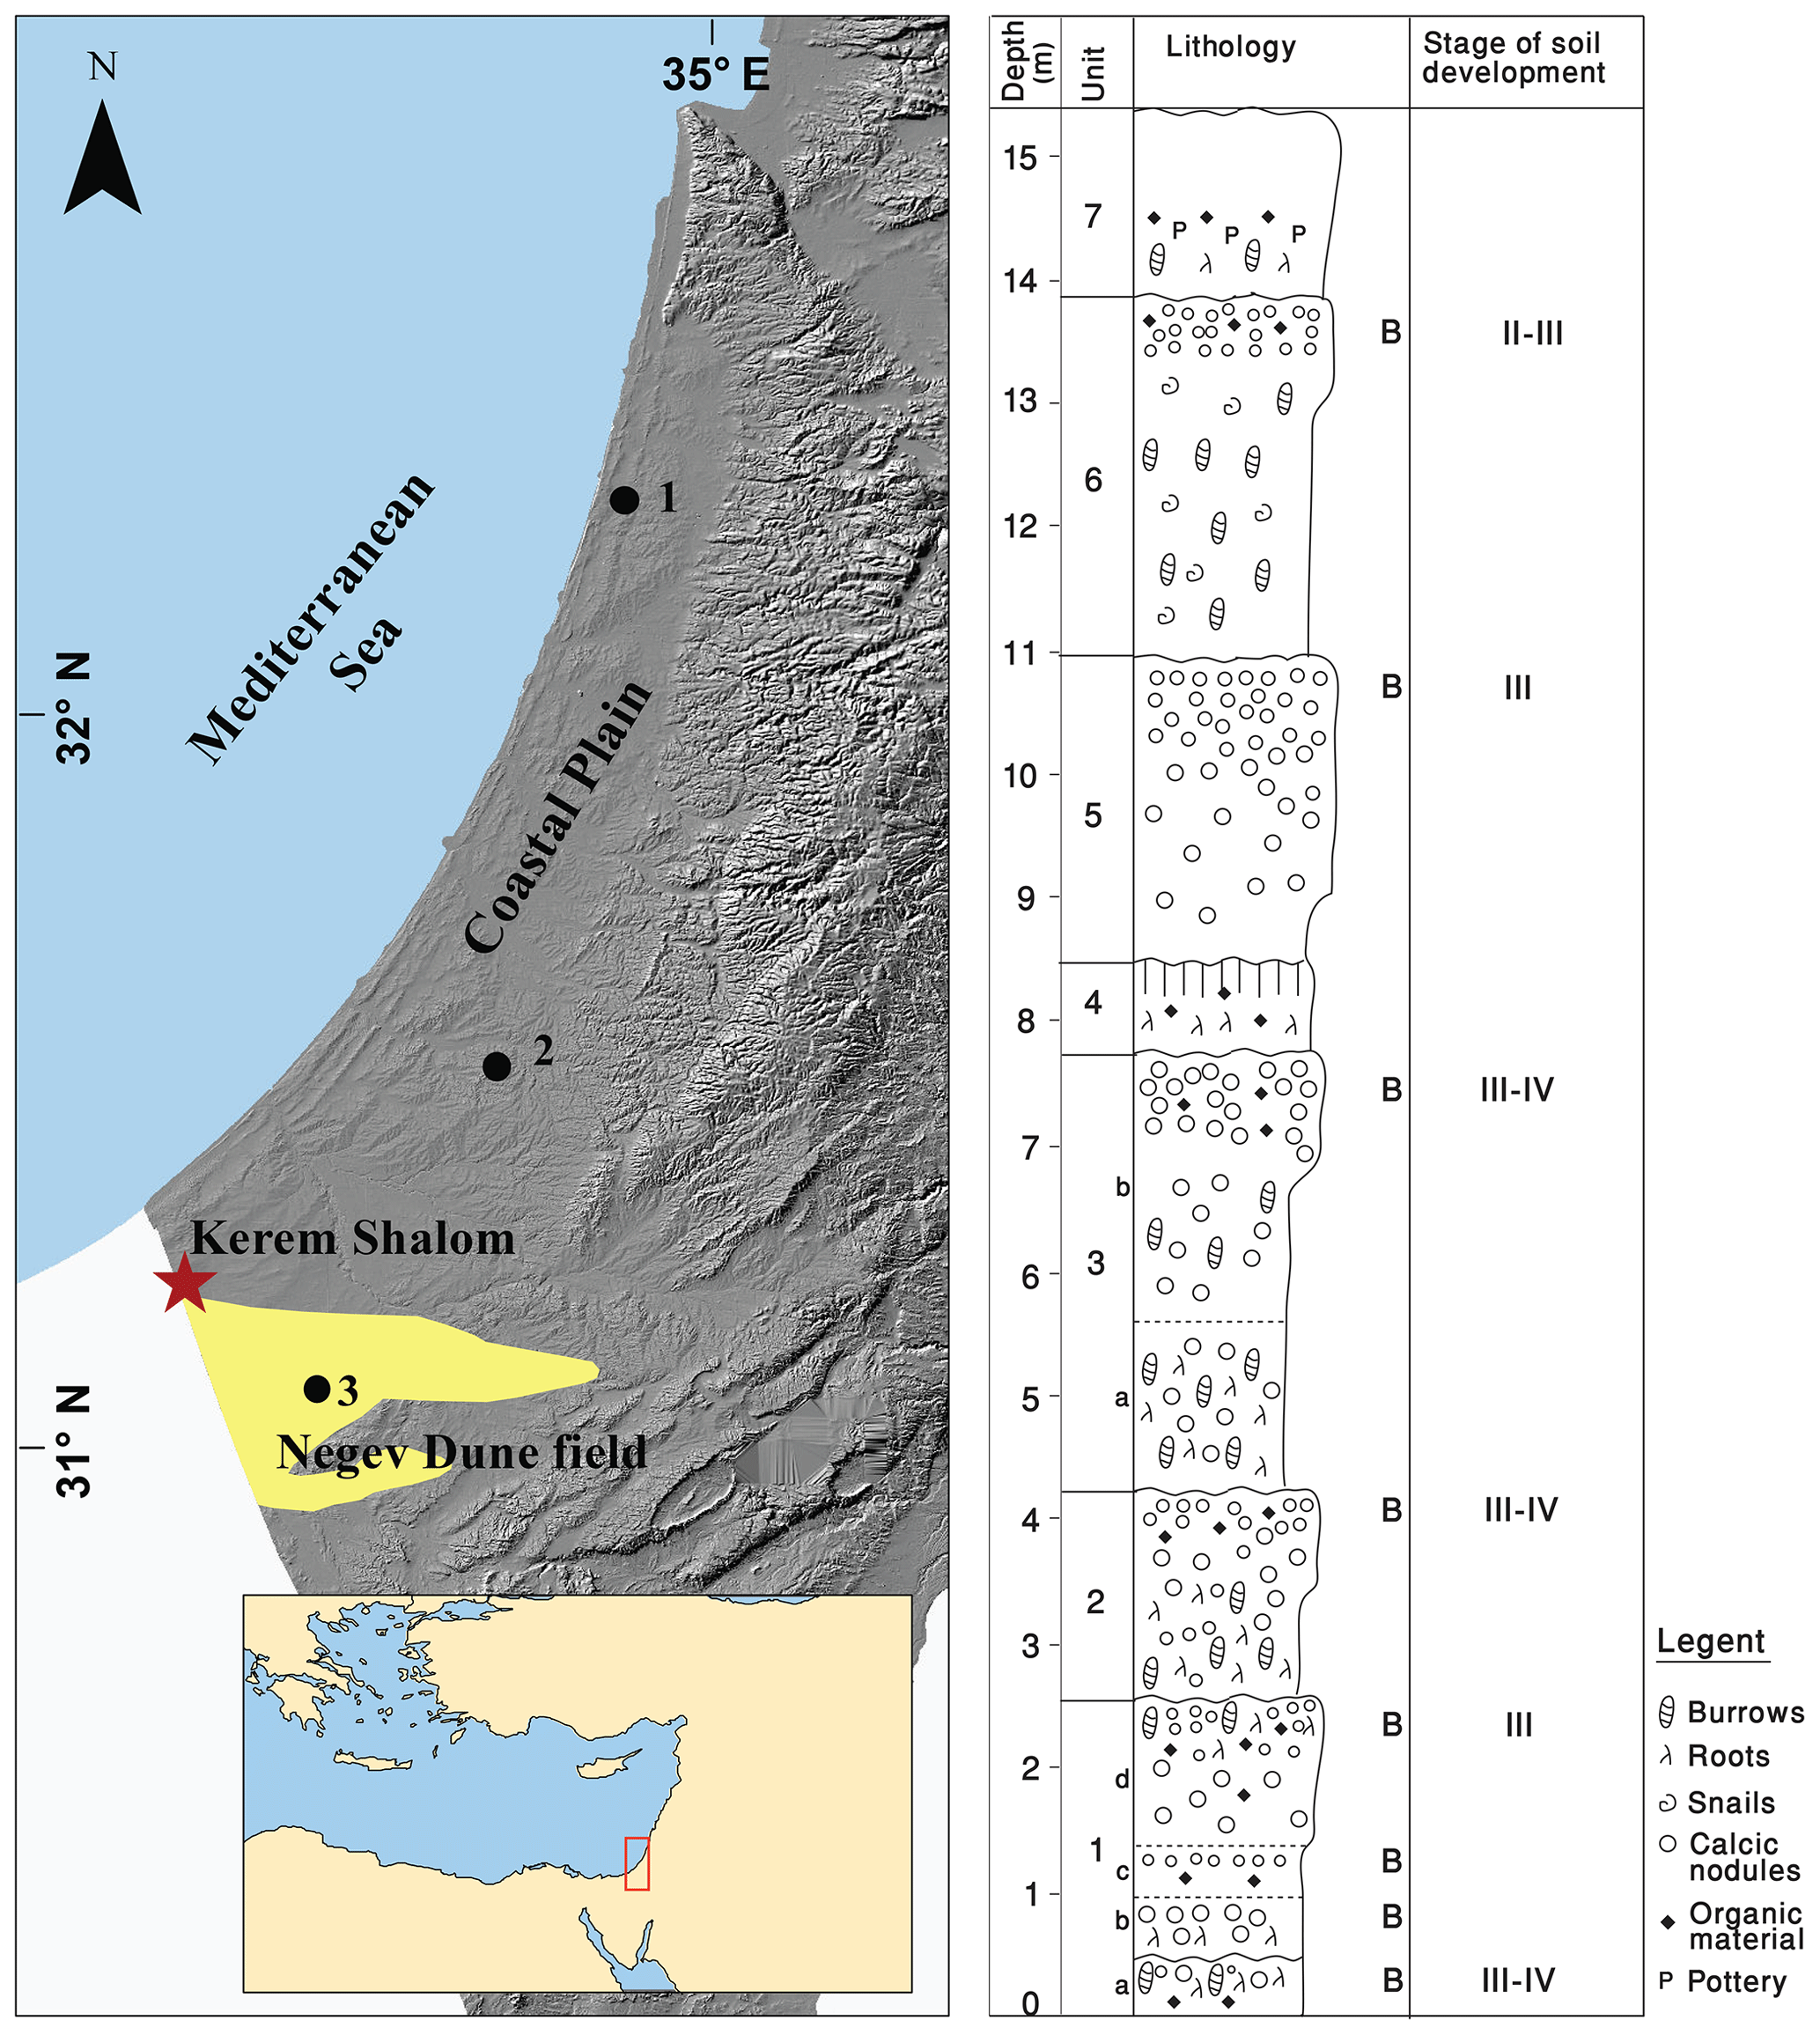
Figure 1Location map of Kerem Shalom denoted as star (digital elevation model from Hall, 1997) and stratigraphic section from Zilberman et al. (2007). The Negev dune field is marked in yellow. Other samples used in this study are from Shefayim (1), Ruhama (2), and the Negev dune field (3). Inset – location of the coastal plain in the eastern Mediterranean.
This distinct sequence reflects a cyclic process, which starts with relatively rapid deposition of aeolian sand and continues with a long period of stability associated with the growth of vegetation, dust accumulation, and soil development (Zilberman at al., 2007). The section was previously dated with OSL to between 480 and 13 ka (Zilberman et al., 2007); however, Faershtein et al. (2019) showed that the OSL ages should be considered minimum ages for all samples below 2 m due to natural signal saturation.
It was recently demonstrated that the quartz OSL from KR is thermally stable with excellent luminescence properties (Faershtein et al., 2018). Preliminary palaeomagnetic measurements suggested reverse polarity at the base of the section (Hagai Ron, personal communication, 2006). Thus, the KR sediments allow us to test the extended-range dating methods. The low environmental dose rates of the sand layers, ∼0.5 Gy kyr−1 for quartz and ∼1.0 Gy kyr−1 for K-feldspar, predict equivalent doses of 390 and 780 Gy for quartz and feldspar, respectively, for the lowest sample (15.3 m). Theoretically the extended-range methods could easily measure such doses. Therefore, the KR section is a perfect sequence for testing the applicability of these methods for the eastern Mediterranean sediments originating from the Nile. This paper presents a comprehensive investigation of the luminescence behaviour of TT-OSL, VSL, and pIRIR signals for these sediments. Bleaching and dose recovery experiments are performed; the section is dated with TT-OSL and pIRIR250 (using SAR protocols); and VSL multiple aliquot additive dose (MAAD) DRC is constructed. The reliability of the ages and their geological implications are discussed.
Sixteen samples were collected from the KR section by drilling 30 cm deep holes horizontally into the sediment. After discarding the sediment from the outer 10 cm, the samples for chemical analysis and luminescence measurement were further treated. In addition, a modern sample was collected from the top bed in a nearby pit (KR-17).
Sample preparation and measurements were carried out under weak orange-red light. The separation procedure included wet sieving to 74–105, 88–125, or 125–150 µm; dissolving carbonate with 8 % HCl solution; and magnetic separation using a LB-1 Frantz magnetic separator at a current of 1.4 A on the magnet (Porat, 2006). For quartz, 3 g of the non-magnetic fraction went through etching in concentrated 40 % HF solution for 40 min and additional soaking in 16 % HCl overnight to dissolve any fluorides which may have precipitated (Porat et al., 2015). The alkali feldspar was extracted from 5 g of the non-magnetic fraction by density separation to <2.58 g cm−3 with heavy liquid (sodium polytungstate) and short etching for 10 min with 10 % HF solution (Porat et al., 2015; for details see the Supplement). Due to lack of material, feldspar was not extracted for sample KR-4.
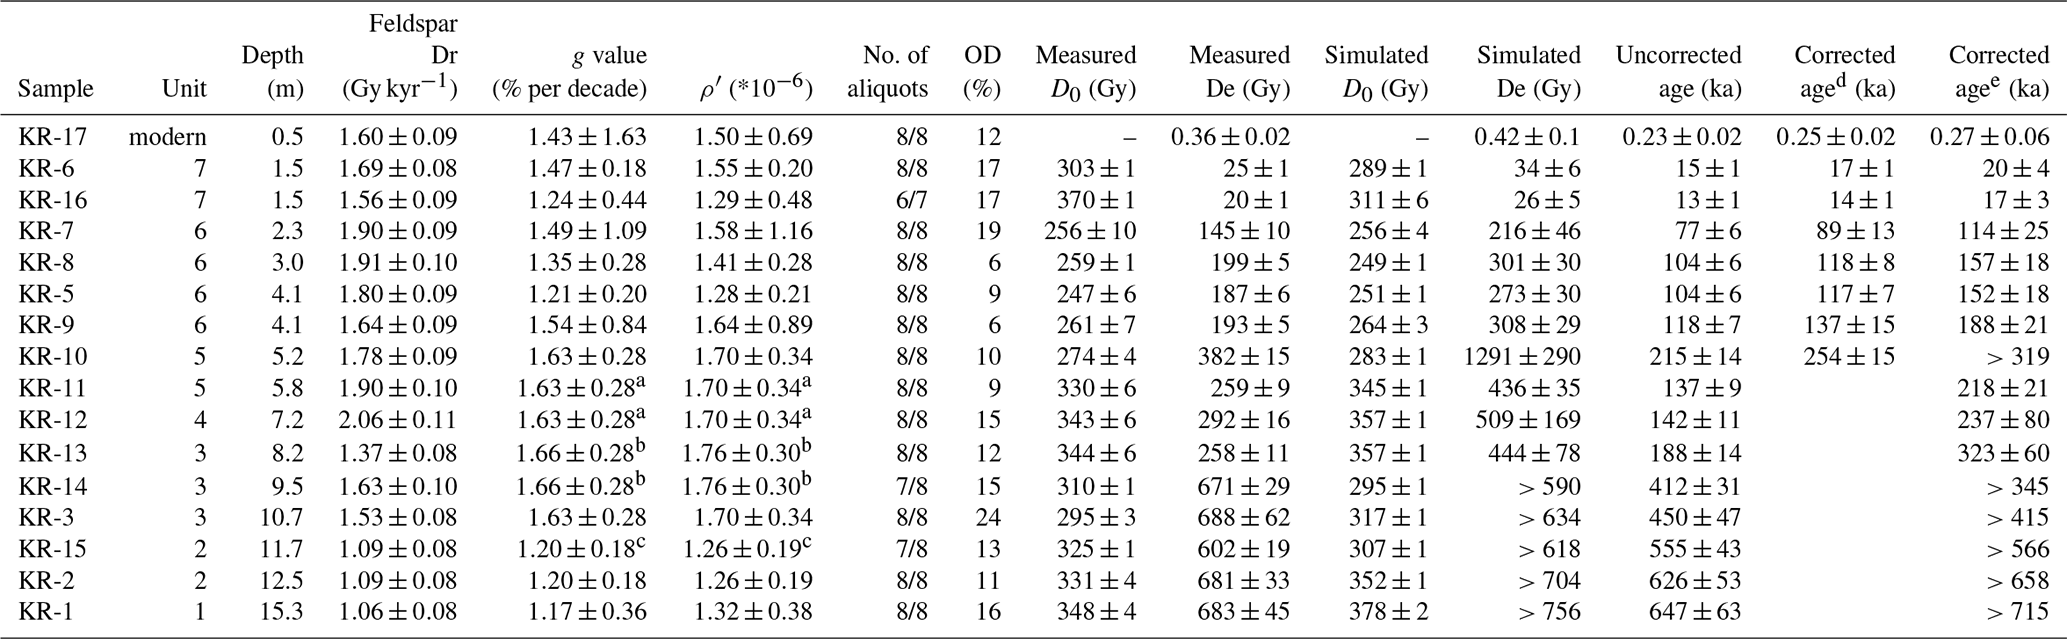
Alpha, beta, and gamma dose rates were calculated from the concentration of the radionuclides U, Th, and K measured by ICP-MS (inductively coupled plasma mass spectrometry; for U and Th) and ICP-OES (inductively coupled plasma atomic emission spectroscopy; for K), with uncertainties of 5 %, 10 %, and 3 %, respectively. Internal K content in the feldspars was estimated at 12.5 %±0.5 % (Huntley and Baril, 1997). The a value was estimated at 0.15±0.05, an average of the values given for alkali feldspar by Balescu et al. (2007) and Rendell et al. (1993). Gamma and cosmic dose rates were measured in the field with a portable gamma counter. Water content was estimated at 5 %±2 % as typical of sands in this arid region (Zilberman et al., 2007). The dose rates data are presented in Table 1.
Table 1Dose rate data for the KR samples. Internal K content in the feldspars was estimated at 12.5 %±0.5 % (Huntley and Baril, 1997, giving internal dose rates of 0.309±0.054, 0.368±0.66, or 0.474±0.047 Gy kyr−1 for 74–105, 88–125, or 125–150 µm, respectively). Water content was estimated at 5 %±2 % (Zilberman et al., 2007). Uncertainties in K, U, and Th contents are 3 %, 5 %, and 10 %, respectively. Gamma and cosmic dose rates were measured in the field with a portable gamma counter.

All measurements were undertaken using (thermoluminescence) TL/OSL DA-12 or DA-20 readers, equipped with blue LEDs (470 nm), a solid state violet (405 nm) laser diode, and IR diodes (870 nm) for stimulation, delivering 37–59 mW cm−2, 90 mW, and 126–144 mW cm−2 to the sample, respectively. Irradiation was by calibrated 90Sr β sources with dose rates of 0.04 or 0.97 Gy s−1, respectively. Detection was through 7.5 mm U-340 filters for quartz and a combination of Schott BG-39 and Corning 7-59 filter packs for feldspar. For TT-OSL and VSL, 5 mm aliquots on aluminium discs were used for measurements, unless stated otherwise. For feldspar, 2 mm aliquots on stainless-steel cups were used.
The SAR protocol was applied for De determination for the TT-OSL and pIRIR (Porat et al., 2009; Thiel et al., 2011). Measurement details are listed in Table 2. Average De values and errors were calculated using the central age model (CAM) after removing distinct outliers (Galbraith and Roberts, 2012).
Table 2Measurement protocols and details of quartz TT-OSL and VSL and feldspar pIRIR signals used in this study.

Based on the bleaching and dose recovery experiments (Sect. 3.2.3 and 3.3.2), the 280 ∘C preheat temperature and 250 ∘C stimulation temperature were used for the pIRIR De measurements. Anomalous fading was assessed through fading experiments (as in Auclair et al., 2003) measured on three sensitized aliquots (through several SAR cycles) for most samples. IRSL response to a 100 Gy β dose (normalized to a 30 Gy test dose response) was repeatedly measured after storage for 15 min and up to 48 to 84 h. The g value (% per decade), normalized for 2 d, and the recombination centre density (ρ′) were determined using the analyse_FadingMeasurement R function (Kreutzer and Burow, 2019) following the IRSL luminescence decay model of Huntley (2006). The averages with standard deviations of the g value and ρ′ were further used for fading corrections. For samples KR-11 to KR-15, the fading rates were not measured and their g value and ρ′ were assessed from the nearest samples. Fading corrections of Huntley and Lamothe (2001) and Kars et al. (2008) were both applied to the final calculations. The Huntley and Lamothe (2001) correction was used on samples from the upper 6 m, as it is suitable only for the linear part of the DRC. It was preformed using the g value with the calc_FadingCorr R function (Kreutzer, 2019). The Kars et al. (2008) correction reconstructs a natural simulated DRC and projects the natural IRSL onto this DRC to produce the fading-corrected age. The calc_Huntley2006 R function was used (King and Burow, 2019). This function requires the laboratory DRC with Ln∕Tn and the ρ′ parameter for the simulated DRC construction. First, the calc_Huntley2006 was applied to all aliquots of the oldest sample KR-1, which were previously used for De determination. Then the function was applied using the average Ln∕Tn value (with standard deviation) and a combined DRC of these aliquots. As the average output parameters were almost identical (0 %–4 % difference; Table S2 in the Supplement), the average Ln∕Tn and the combined DRCs were used for all other samples.
The DRC constructed by the SAR protocol, which is the most commonly used for De determination, fails to mimic the natural growth of the VSL signal (Ankjærgaard et al., 2016). This difference is attributed to sensitivity changes during preheat, which is applied prior to the violet stimulation in the measurement protocol (Table 2). On the other hand, a DRC constructed on a modern sample using a MAAD approach (Aitken, 1998) is much closer to the natural DRC (Ankjærgaard et al., 2016; Ankjærgaard, 2019). Adopting the MAAD approach, a MAAD DRC was constructed for the modern sand sample DF-13 with an OSL age of 40±10 years (Roskin et al., 2011a; Table S3). Forty-eight fresh aliquots were prepared and divided into eight groups. Each group of aliquots was irradiated with increasing beta doses (0, 50, 100, 200, 400, 600, 800, 1000 Gy). The VSL signal of the aliquots was then measured and normalized to the VSL signal of a 490 Gy test dose (Table 2) to construct a MAAD DRC (Fig. 2). The DRC can be fitted equally well with an exponential plus linear (R2=0.997) and double exponential (R2=0.999) function. When fitted with the exponential plus linear function, the characteristic dose of the exponential component is Gy. For the double exponential function, the characteristic doses are Gy and Gy. These values are significantly lower than the D0 value obtained by Ankjærgaard et al. (2019) for a combined natural DRC from Chinese loess samples ( Gy for a double saturating exponential with a constant vertical offset). It is possible that the MAAD DRC constructed here does not reach saturation, resulting in a lower D0 value.
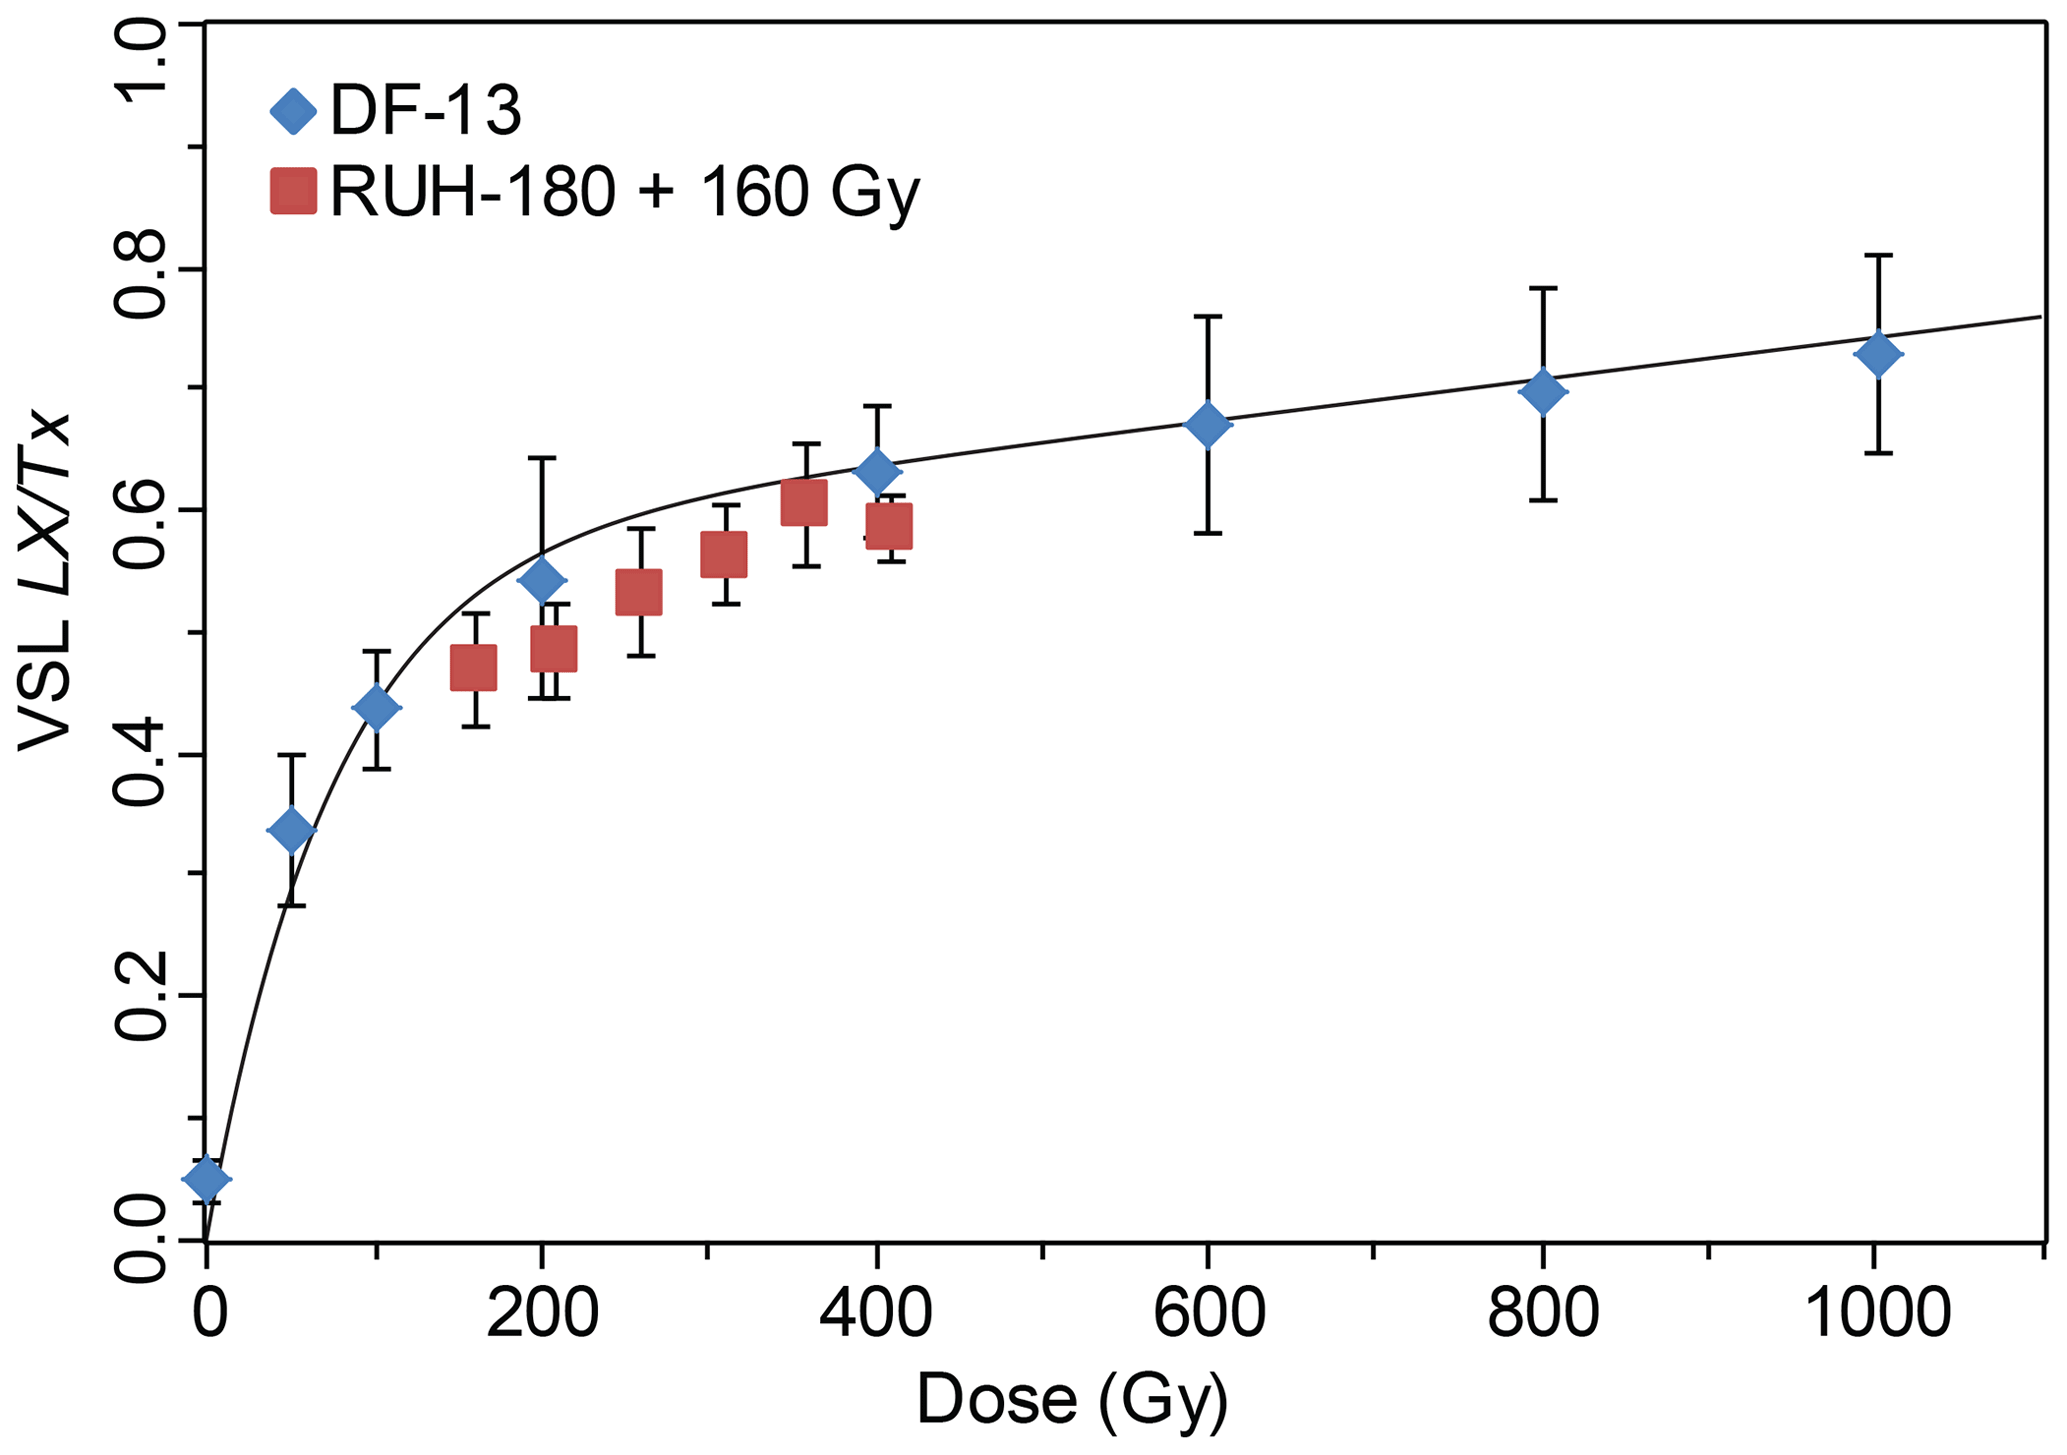
Figure 2VSL multiple aliquot additive dose (MAAD) DRCs of a modern sand sample (DF-13) fitted with an exponential plus linear function, and of sample RUH-180 (shifted by 160 Gy). Note that the two DRCs overlap.
Based on the results of Ankjærgaard et al. (2016), which suggest that the MAAD DRC is comparable to the natural DRC, it is expected that MAAD DRCs constructed for different samples (of the same source) would be comparable to each other as well. In order to explore this assumption as an alternative route for using the MAAD approach for VSL dating, a MAAD DRC was constructed also for sample RUH-180 from the Ruhama section, about 50 km to the north-east from KR (Fig. 2; Table S3). The TT-OSL De value of this sample is 163±15 Gy, corresponding to 126±5 ka, within the reliable dating range of the TT-OSL method (Faershtein et al., 2018); therefore, it was used as an age control. The RUH-180 MAAD DRC was plotted on top of the DF-13 MAAD DRC after shifting each dose point by 160 Gy (Fig. 2). It is clear that when assuming a De value of 160 Gy for RUH-180, the two MAAD DRCs overlap. It seems that comparison of a sample's MAAD DRC with the DRC of a modern sample is the right step toward developing the VSL dating method. Perhaps the sliding technique used for infrared radiofluorescence (IR-RF) can also be used (Erfurt and Krbetschek, 2003; Frouin et al., 2017). This direction was not investigated further and is beyond the scope of this paper.
Most experiments were conducted on the KR samples. However, due to small sample size, some of the tests were performed on samples from other sites, on aeolian sediments also originating from the Nile. For additional information regarding these samples, see the Supplement.
3.1 Luminescence signals and dose response curves
Representative luminescence signals and DRCs of the KR samples are shown in Fig. 3, displaying good luminescence properties: for all samples, the OSL signal is dominated by the fast component, recycling ratios are mostly within 5 % of unity, and there is no significant feldspar contamination in the quartz grains as insured by the negligible IR depletion ratio (Duller, 2003). However, the De values of most samples are above ∼150 Gy, which is considered the upper limit for OSL dating of Nilotic quartz (Faershtein et al., 2019; Table 3).
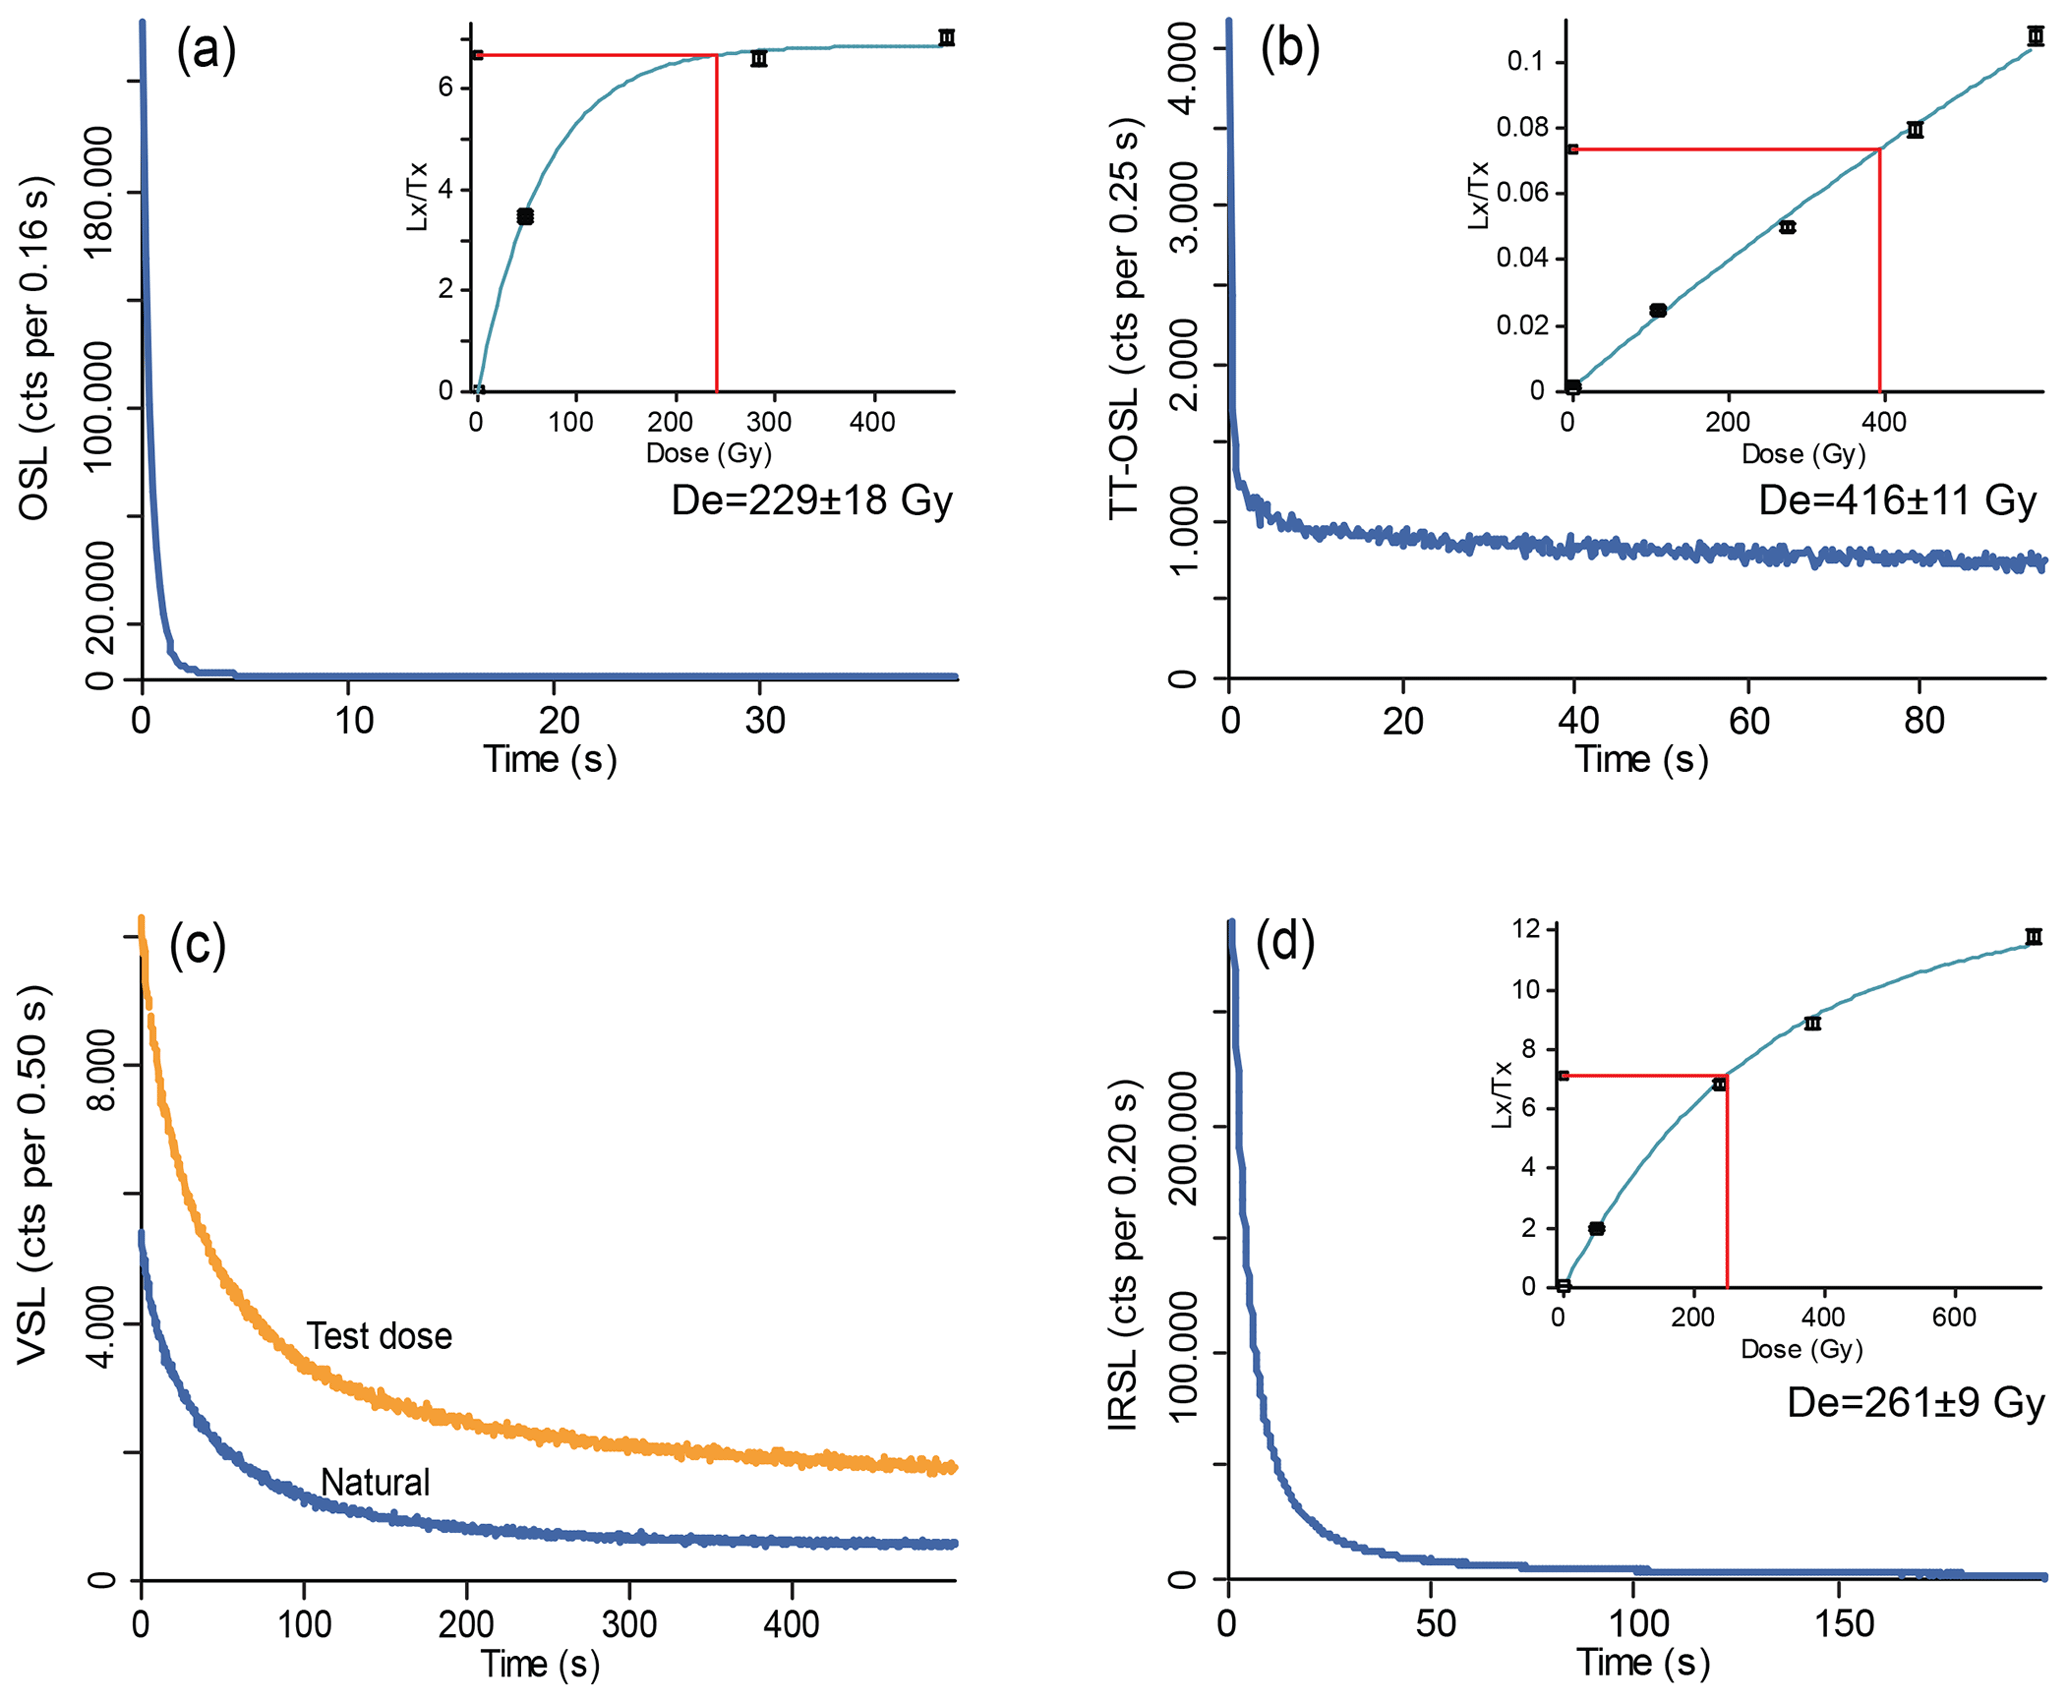
Figure 3Representative natural luminescence signals of OSL (a), TT-OSL (b), VSL (c), and pIRIR250 (d) of sample KR-13 (from the depth of 8.2 m). The insets show the dose response curves fitted with a single exponential function. Two or three points overlap at the lowest dose point (recycling points). No dose response curve was constructed for the VSL signal. OSL signal and DRC are from data by Zilberman et al. (2007) based on measurements of a 5–6 mm aliquot. Note that the pIRIR250 De is significantly lower than the TT-OSL De.
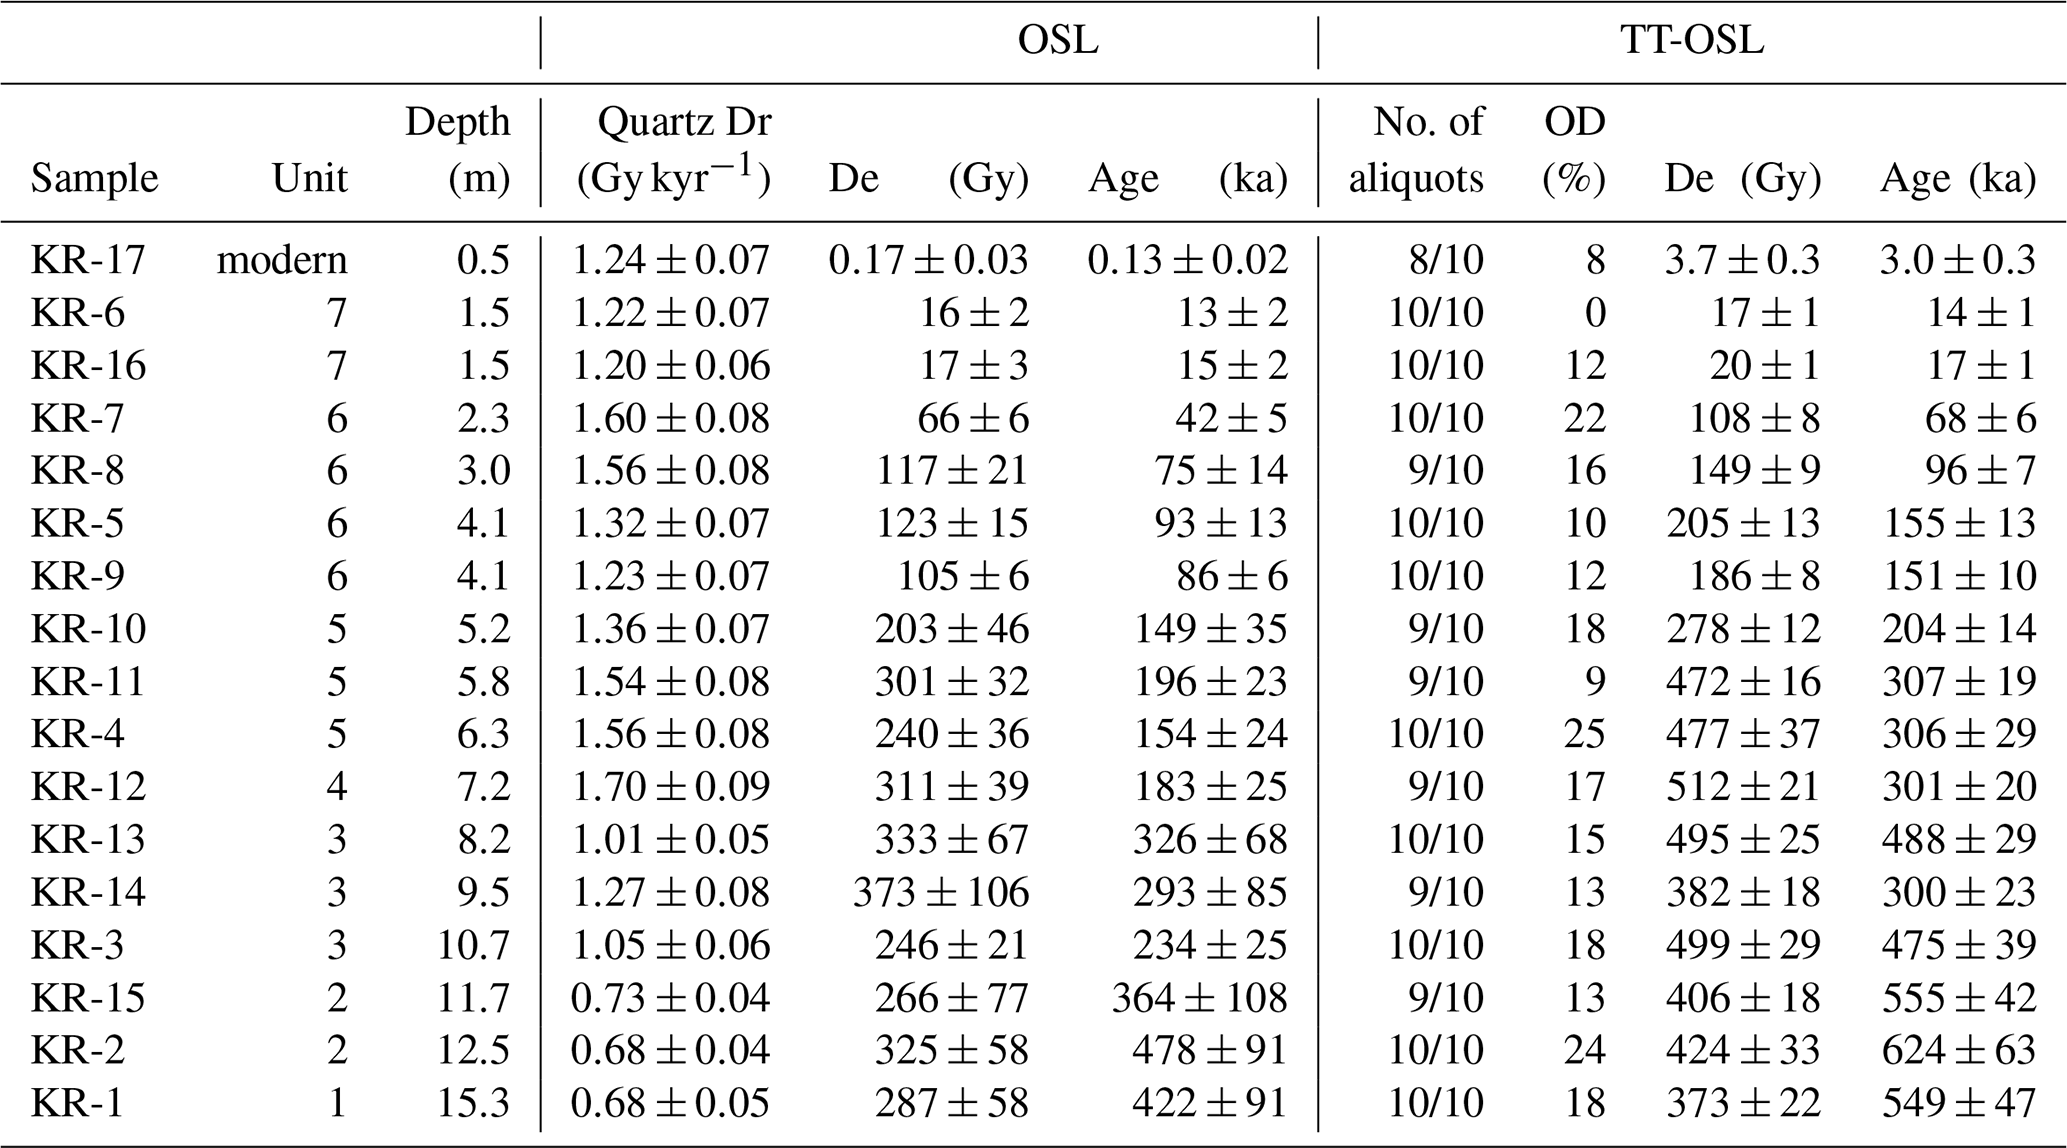
Table 3TT-OSL dating results of the Kerem Shalom samples. No. of aliquots represents the number of aliquots used for De determination out of those measured. Average De values and errors were calculated using the CAM after removing distinct outliers (Galbraith and Roberts, 2012). OSL De and ages are from Zilberman et al. (2007) for comparison.
The TT-OSL signal is significantly dimmer than the OSL signal, and the background level is 15 %–25 % of the natural signal. The laboratory DRC grows linearly up to high doses (at least 600 Gy), with good recycling ratios, within 10 %, for most measured aliquots. The VSL signal decays slowly to a background level which is ∼10 % of the natural signal. The natural VSL signal and a response to a 490 Gy test dose have a similar shape. No SAR DRCs were constructed for the VSL signal, as discussed in Sect. 2. The pIRIR250 signal is bright and is reduced to 10 % within 20 s. The recycling ratios are within the acceptable 10 % of unity and recuperation is smaller than 2 % (except for the modern sample). The laboratory-constructed DRC reaches the 2D0 (85 % of saturation; Wintle and Murray, 2006) threshold at 700–800 Gy. Average fading rate measured for the pIRIR250 signal is 1.4 %±0.2 % per decade.
3.2 Bleaching
Bleaching experiments were performed under natural sunlight, during the sunny and cloudless eastern Mediterranean summer. Freshly prepared aliquots were covered with a transparent Plexiglas and left outside for various time durations, at a spot which receives direct sunlight for 8 h a day. Experiment details for each signal are listed in Table 4.
Table 4Bleaching and dose recovery experimental details. For sample details, see Table S3. No. of aliquots represents the number of aliquots measured under each experimental condition.

a Assuming that the VSL De is similar to the TT-OSL De estimate of 280 Gy. b Using late subtraction. c For pIRIR225, pIRIR250, and pIRIR290, respectively.
3.2.1 TT-OSL
Sample RUH-300 (Table S3), from the Ruhama site, was used for the experiment. This sample has OSL and TT-OSL De values of 214±11 Gy and 264±11 Gy, respectively. Early- and late-background signal subtractions were used for comparison to check for better separation of the bleachable component. Figure 4a presents the bleaching experiment results. There is no significant difference between the bleaching rates calculated using early and late backgrounds. The normalized TT-OSL signal decreased to 50 % after ∼4 h of exposure to direct sunlight. Further exposure to sunlight reduced the signal to 20 % after 64 h (8 d) and to 11 % after 148 h (18.5 d). These results are in agreement with those of Tsukamoto et al. (2008) and Porat et al. (2009). The relatively slow bleaching rate of the TT-OSL signal suggests that this signal is suitable for dating aeolian sediments that experience prolonged exposure to sunlight during transport prior to final sedimentation. Indeed, very low TT-OSL De values of 2–4 Gy were measured on modern aeolian samples from the region (e.g. KR-17 and DF-13; Table S3). High residual doses of over 100 Gy were reported elsewhere for fluvial sediments (Hu et al., 2010; Duller et al., 2015), implying low suitability of the TT-OSL signal for dating such sediments. Nevertheless, samples of early-to-middle Pleistocene age from different sedimentation environments are in agreement with control ages (Arnold et al., 2015). Therefore, it seems that bleaching issues are not significant for dating samples in this time range.

Figure 4Bleaching experimental results for TT-OSL (a), VSL (b), and pIRIR (c) signals. Each data point is an average of three aliquots (four for VSL). The TT-OSL signal was defined as first 1 s minus the following 4 s for early subtraction and first 1 s minus the last 5 s for late subtraction.
3.2.2 VSL
The bleaching of the VSL signal was investigated using sample KR-10. It was chosen since it is considerably old but homogeneous based on TT-OSL De distribution (TT-OSL Gy; OD=18 %). The results show that after 120 h of solar bleaching, the residual VSL signal is ∼15 % (Fig. 4b). Assuming that the VSL De should be similar to the TT-OSL De estimate of 280 Gy, these 15 % correspond to ∼42 Gy. Fitting the data suggests that 20 h of sunlight are required to reduce the VSL signal by 50 %. Previous studies reported lower residual signals of 6–35 Gy after bleaching in a solar simulator (Ankjærgaard et al., 2013; Hernandez and Mercier, 2015). The natural signal Ln∕Tn of a modern sample from the region, DF-13, was found to be 3.5 % of the Ln∕Tn of KR-10, corresponding to ∼10 Gy, implying sufficient bleaching in nature under suitable conditions. Also, VSL ages in agreement with other luminescence ages were reported from the coastal plain of Israel (Porat et al., 2018). Therefore, it seems that bleaching in nature is adequate probably due to long exposure to sunlight throughout the aeolian transport.
3.2.3 pIRIR
The bleaching of the pIRIR signals was investigated using sample KR-8. The IRSL50 (measured as part of the pIRIR290) and pIRIR signals, measured after the different bleaching durations, are shown in Fig. 4c. The IRSL50 signal dropped to 1 % after 4 h of exposure. The pIRIR signals are bleached to a lesser degree, yet all three signals were bleached to less than 10 % after 4 h and to less than to 2 % after 64 h of exposure to direct sunlight. This implies a full signal resetting of the pIRIR signals at deposition for aeolian sediment.
3.3 Dose recovery
3.3.1 TT-OSL
Samples RUH-40 and RUH-90 were used for dose recovery experiments (Table S3). These are the two uppermost samples from the Ruhama site with TT-OSL De values of 42±2 Gy and 53±3 Gy, respectively. Prior to the dose recovery measurements, fresh aliquots were bleached by sunlight for 10 and 18.5 d for RUH-90 and RUH-40, respectively (Table 4). Three doses were recovered: 200, 450, and 700 Gy. After a 10 h pause, the TT-OSL De was measured using the SAR protocol (Table 2). Early and late background subtractions were used for comparison.
Using late background subtraction for the TT-OSL signal yielded a much better recovery than early background subtraction (Fig. 5a); the latter overestimated the given doses by 16 %–77 %. Using late background, the 450 Gy given dose was perfectly recovered. For the other two doses, 200 and 700 Gy, the late background subtraction resulted in overestimation of 32 %–37 % and 8 %, respectively. The recovery ratios of the 200 Gy dose are almost identical for the two samples, 1.32 and 1.37. In order to check whether there is a significant residual dose, which might affect the recovered dose, the De values of two additional aliquots of RUH-40, bleached for 18.5 d, were measured. It appears that a small residual dose of 6–7 Gy still remains after the prolonged sun bleaching; however, this is only 1.5 %–3.5 % of the given dose in our experiment and cannot explain the substantial overestimation for the 200 Gy recovery. Porat et al. (2009) carried out a dose recovery experiment on a modern sample from KR (KR-17). They achieved a better recovery for the 700 Gy dose, which might be explained by slightly different measurement conditions. In both experiments there is some overestimation at the lower doses, which is less significant for the high doses that TT-OSL is usually used for measuring.
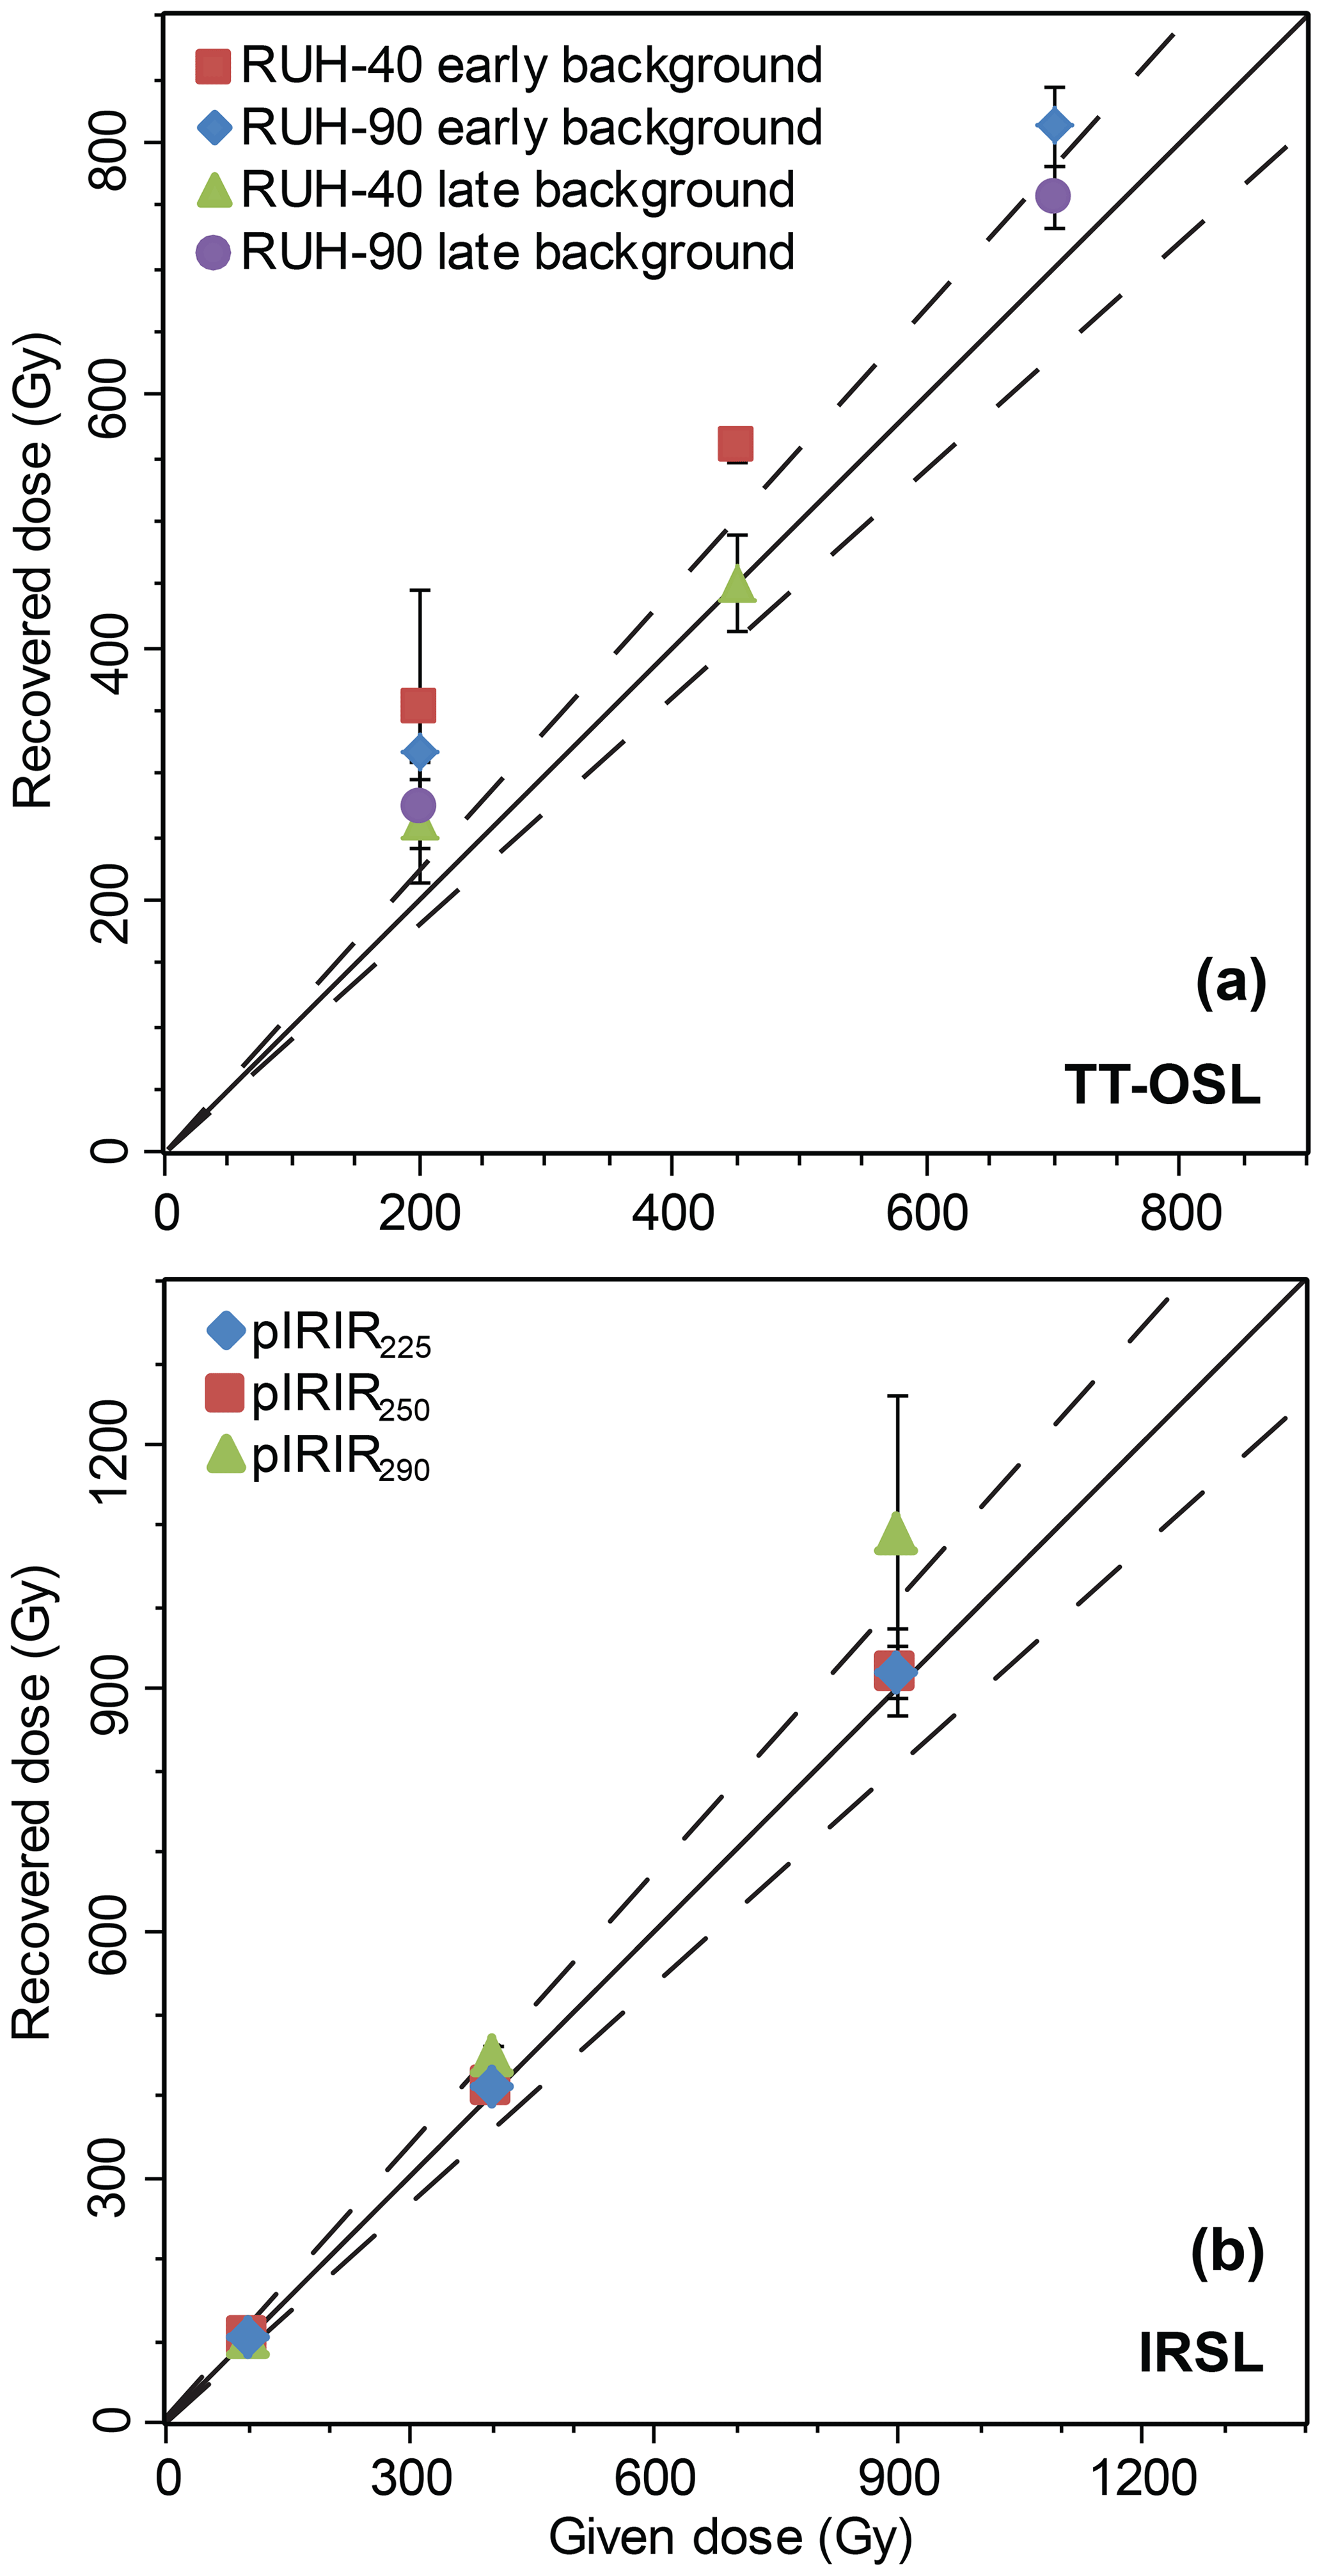
Figure 5Dose recovery experimental results for the TT-OSL (a) and pIRIR (b) signals. Each data point is an average of three or four aliquots. The solid lines are % (dashed lines).
3.3.2 pIRIR
A modern coastal sample was used for this experiment (ML-D-13; Table S3). Beta doses of 100, 400, and 900 Gy were given and recovered after a pause of 25–48 h. For all the recovered doses, a test dose of 30 Gy was used. The pIRIR225,250 signals show excellent recovery of 97 %–102 % for the three given doses with good recycling ratios (Fig. 5b). pIRIR290 results show some overestimation at 400 Gy and significant overestimation at 900 Gy, 120 % of the given dose. Fading measurements of the three pIRIR signals indicated low g values of <1.6 % per decade for the three signals. Overall, the pIRIR250 signal displays a preferable balance between bleaching time and the ability to recover a known dose. Thus, it was further used for De determination.
3.4 Natural saturation profiles
In long, continuous profiles, natural saturation of the luminescence signals can be observed by plotting the natural signals of samples against their depth (Liu et al., 2016). Faershtein et al. (2019) constructed such profiles for the KR section using the OSL and TT-OSL signals (Fig. 6). Now we added the natural saturation profiles for the VSL and pIRIR250 signals. Natural signals (normalized to the corresponding test dose) of four aliquots were measured for each sample (Table 2) and plotted against sample depth (Fig. 6).
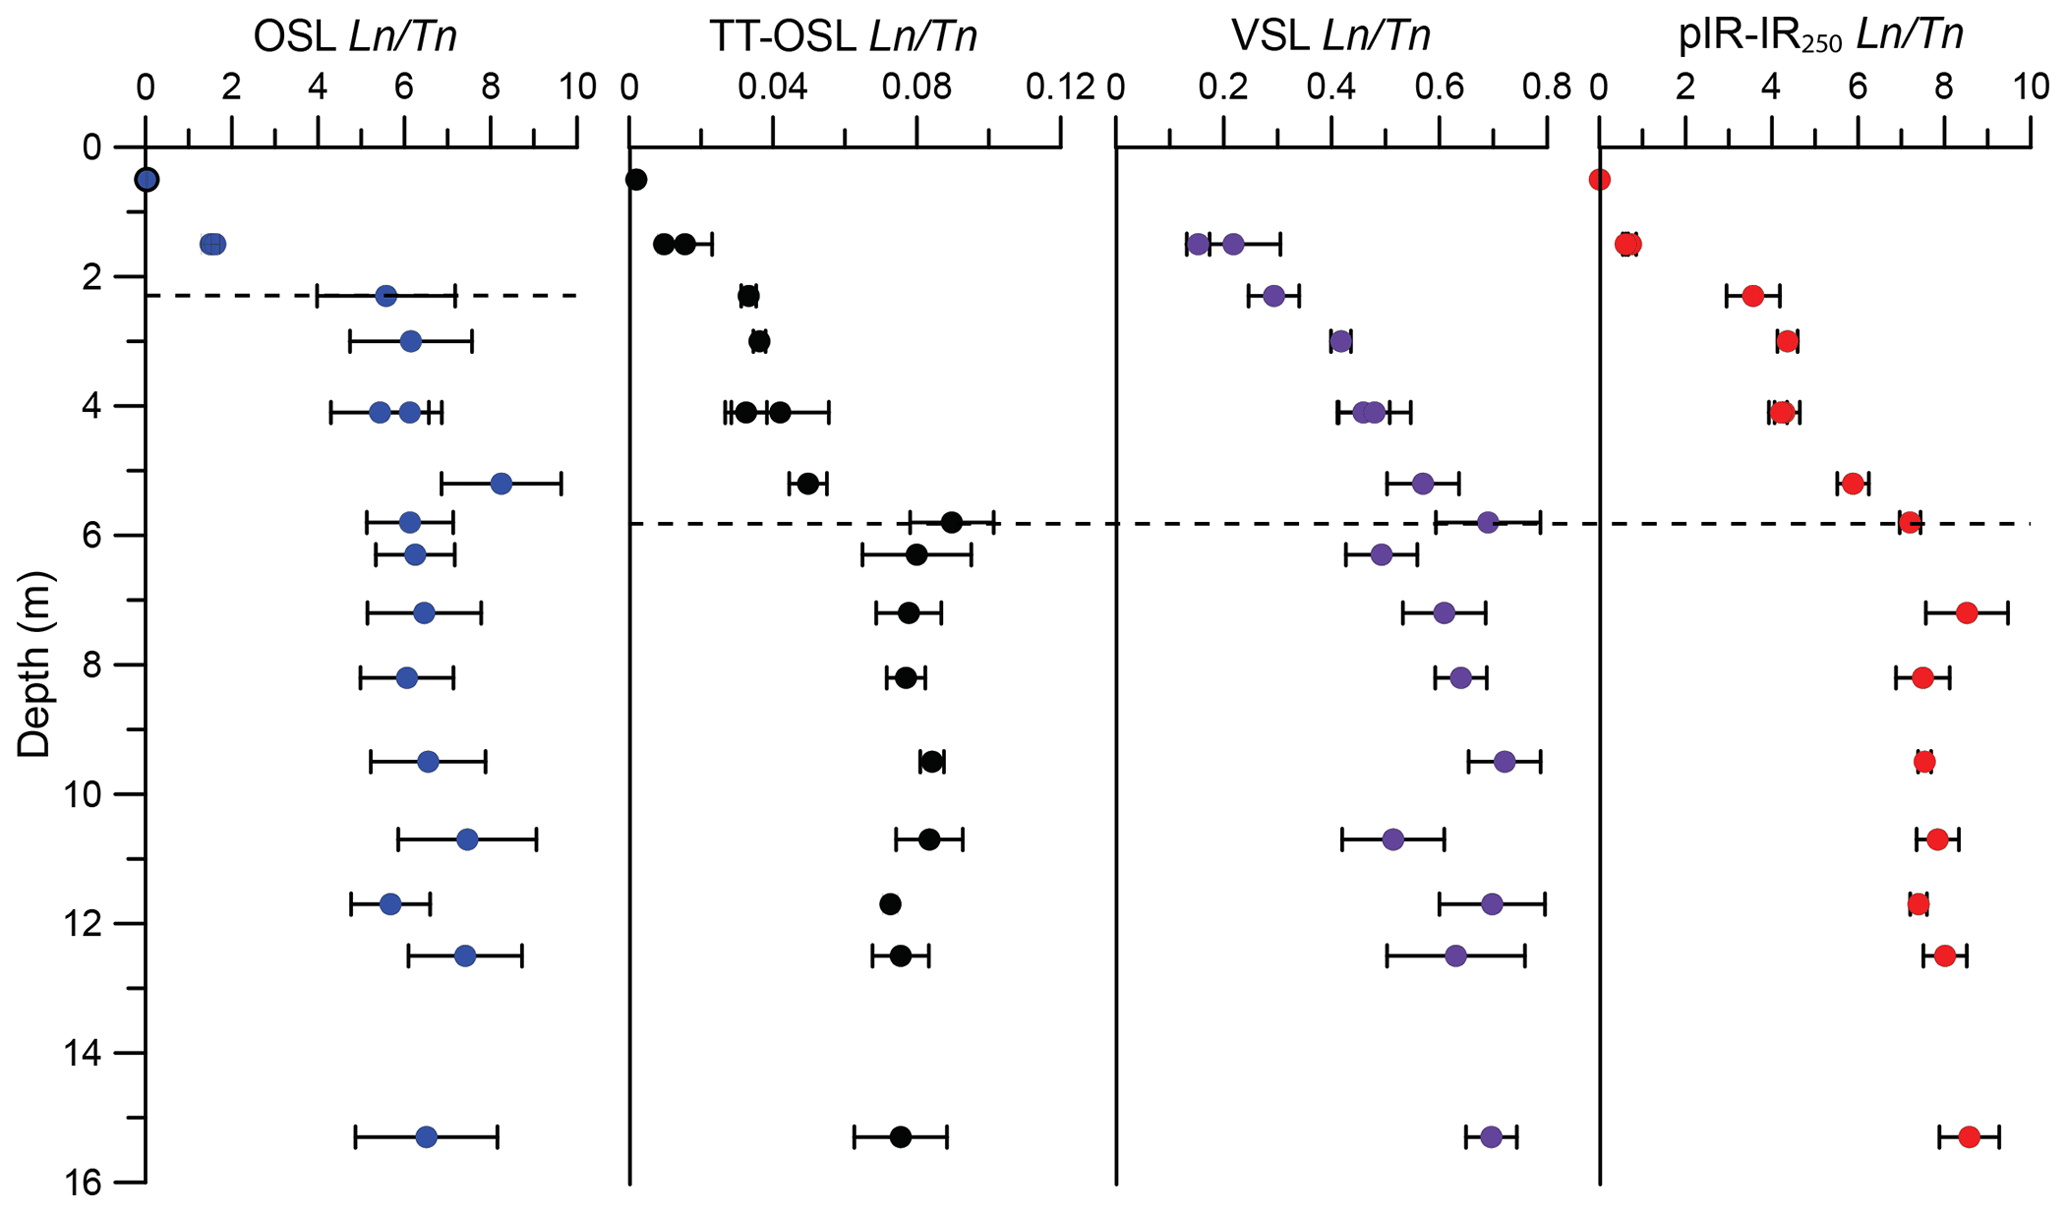
Figure 6Natural saturation profiles of OSL, TT-OSL, VSL, and pIRIR250 signals. The normalized natural luminescence signals of samples are plotted against their depth. Each data point is an average with standard deviation of four aliquots. OSL and TT-OSL data are modified after Faershtein et al. (2019). The dashed lines are saturation depths of the signals.
It was shown by Faershtein et al. (2019) that the natural OSL signal at the KR section increases for samples up to 2 m depth, and from there downwards it is constant. As the section is composed of seven superimposed well-developed calcic palaeosols, each requiring prolonged time to develop, rapid sedimentation of the lower 13 m is not likely. Rather, the natural OSL signal of these samples has stopped growing over time and is saturated. The saturation depth of the OSL signal emphasizes that the OSL ages reported by Zilberman et al. (2007) are minimum ages (except for the upper three samples). The natural TT-OSL (Faershtein et al., 2019) and pIRIR250 signals grow to a depth greater than the OSL – up to ∼6 m; however, they are constant for deeper samples (Fig. 6). Regarding the VSL signal, it is harder to determine the depth at which the signal stops growing. Although, the Ln∕Tn level at 4.1 m is similar to the Ln∕Tn level at 6.3 and 10.7 m, there is a clear growth trend from the surface up to 5.8 m depth (Fig. 6), similar to TT-OSL and pIRIR250, suggesting that this is the saturation depth. There are four palaeosols below that depth; therefore, it is unlikely that all deeper samples are of the same age, implying field signal saturation.
It is remarkable that the three signals (TT-OSL, VSL, and pIRIR250) reach their maximum luminescence at the same depth. One explanation could be that they reach natural saturation at the same dose. To explore this option, we examined the natural saturations of these three signals at the Luochuan loess section in China, where natural DRCs were constructed (Chapot et al., 2016; Ankjærgaard et al., 2016; Li et al., 2018). There, natural DRCs suggest field saturation at about 2000 Gy for both TT-OSL and VSL. Seemingly, data support the similar saturation dose at KR. However, the two signals have different thermal stabilities. Faershtein et al. (2018) showed that for sediments with different environmental dose rates, the thermally unstable TT-OSL signal reaches saturation at different doses. Indeed, for the KR sediments (average dose rate of 1.2±0.3 Gy kyr−1), the natural TT-OSL signal saturates at ∼550 Gy (Faershtein et al., 2019), a much lower dose than at Luochuan. Regarding the thermal stability of the VSL source trap, Ankjærgaard et al. (2013) reported a lifetime of 1011 years (at 10 ∘C), implying that the natural saturation dose should not be affected by the sediment's dose rate; thus, it is expected to be at a comparable dose everywhere. For the pIRIR signal (stimulated at 225 ∘C), the natural DRC at Luochuan reaches the 2D0 threshold at ∼900 Gy, a much lower dose than the TT-OSL and VSL signals. To conclude, it is not likely that the three signals would reach natural saturation at the same dose at the KR section.
An alternative explanation for multiple signals reaching saturation at 6 m depth is a significant pause in sedimentation, whereby the sediments below 6 m are much older than those above 6 m. There is some field evidence supporting this option: soil unit 5, below the saturation depth, has a highly developed calcic Bk horizon (stage III), which requires tens of thousands of years to form (Birkeland, 1999); the unit has a higher clay and silt content compared to the other palaeosols (Zilberman et al., 2007), suggesting long surface exposure with clay enrichment of the sand, also requiring tens of thousands of years (Gile et al., 1966; Danin and Yaalon, 1982). It is also possible that significant erosion happened between sedimentation of units 5 and 6, exposing the saturated sediments. In both cases, field saturation at 6 m indicates that accurate dating can be provided only for the upper part of the section.
Another way to assess the evolution of the natural OSL, TT-OSL, and pIRIR signals is to construct a semi-natural DRC, by plotting the natural signals against the laboratory-measured De values, as was demonstrated for the OSL and TT-OSL signals at KR (Faershtein et al., 2019). The three signals display a common behaviour: the natural signal grows with measured De up to a certain value and then stays constant, indicating that the laboratory signals grow beyond natural saturation (Fig. 7). The OSL Ln∕Tn reaches its maximum value at a relatively low dose of about 100 Gy. When the KR data are combined with many other sites with quartz of Nilotic origin, it is evident that the natural OSL reaches the 2D0 limit at ∼140 Gy (Faershtein et al., 2019), somewhat higher than the KR section when plotted alone. This suggests that when possible, a multi-site comparison is needed for regional characteristics of the luminescence behaviour.
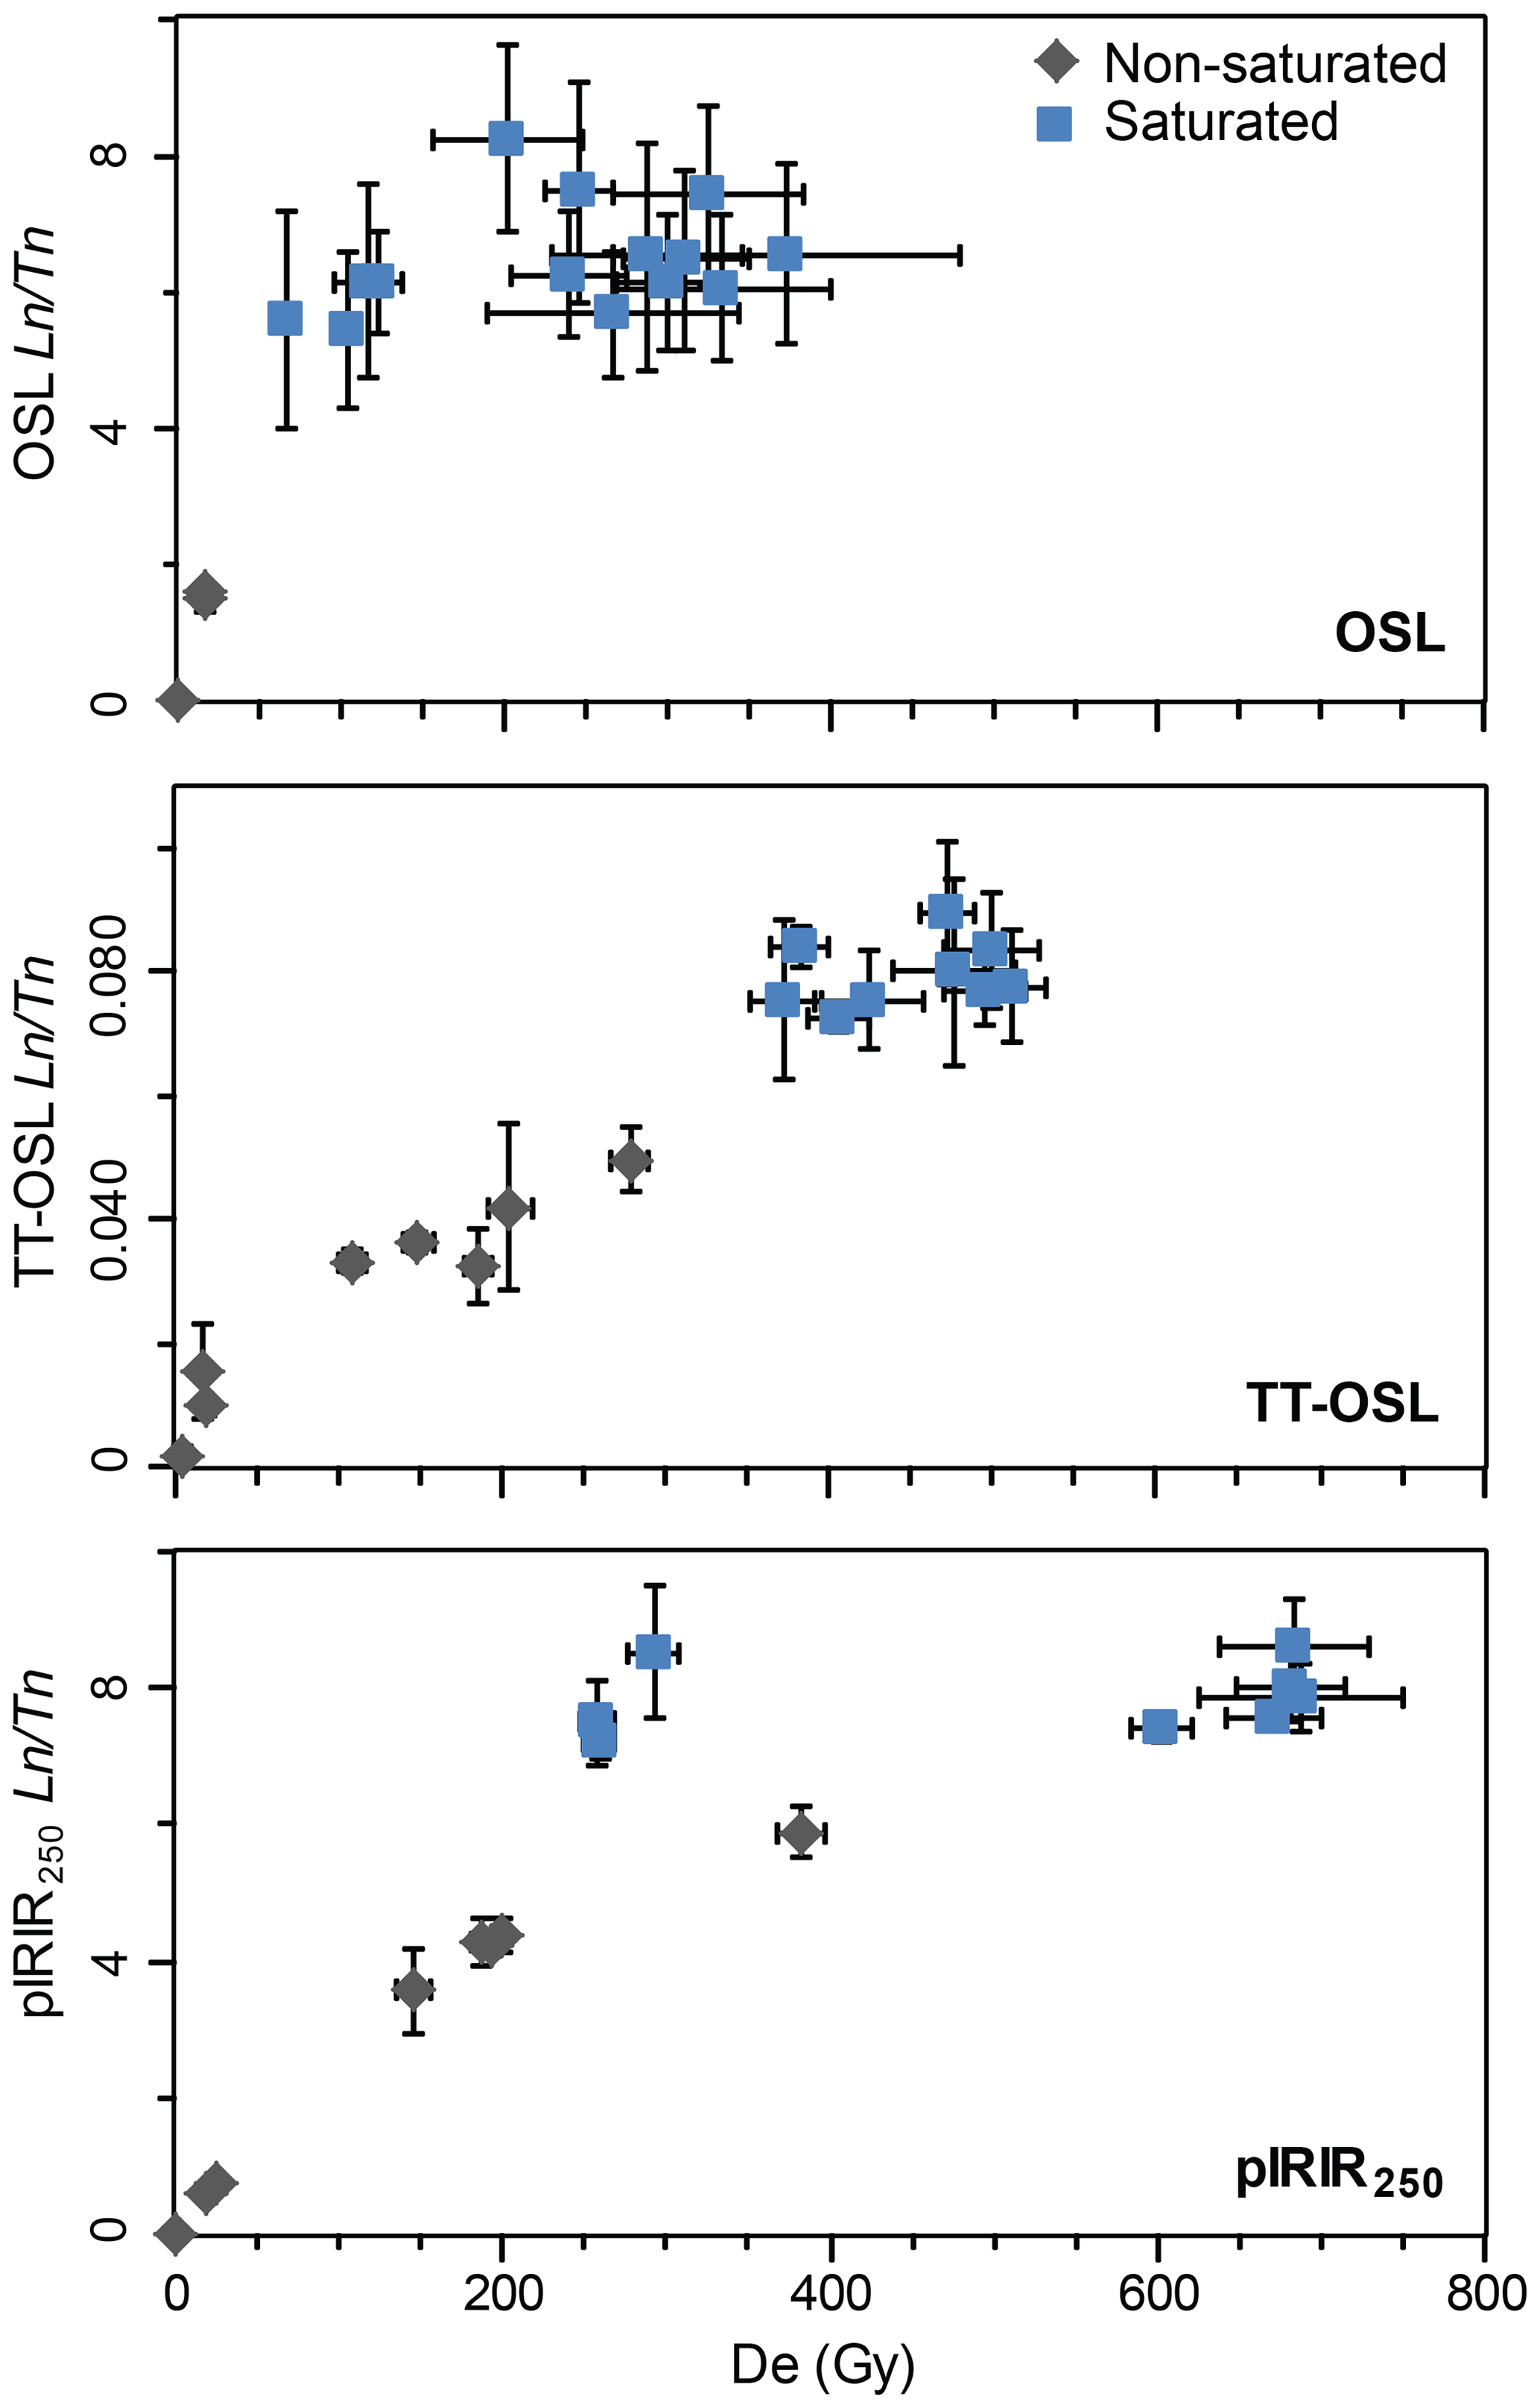
Figure 7Semi-natural DRCs of OSL, TT-OSL, and pIRIR250. The normalized natural signals of samples are plotted against their laboratory-measured equivalent doses. The Ln∕Tn values are averages of four aliquots with standard deviation. OSL and TT-OSL data are modified after Faershtein et al. (2019). Samples above the saturation depth (2 m for OSL and 6 m for TT-OSL and pIRIR250) are in grey.
The TT-OSL Ln∕Tn grows to about 400 Gy and is constant for higher doses up to 500 Gy, beyond which there are no De values (Fig. 7b). The growth of the TT-OSL signal in nature is limited by the low thermal stability of its traps. The lifetime of its main source trap under the environmental conditions at KR was calculated to about 550 ka using both field and laboratory data (Faershtein et al., 2018, 2019); this short lifetime explains the absence of higher De values. Closer examination of the saturated samples reveals that for samples with higher environmental dose rate the De is higher and the TT-OSL ages are younger, as expected from the model simulations of Faershtein et al. (2018; Table 3).
Regarding pIRIR250, it seems that the natural signal grows up to 260 Gy and is constant for higher De values. However, the non-saturated sample KR-10 has a higher De value of 382±15 Gy (Fig. 7c). This suggests that, perhaps, samples KR-11 to KR-13 are outliers with saturated pIRIR250 signals and relatively low De values of 260–290 Gy. In that case, the natural saturation level is reached at 600 Gy, which is still low compared to the saturation level of the natural DRC constructed for the Luochuan section in China (for pIRIR225; Li et al., 2018). The natural signal growth is limited by anomalous fading (Wintle, 1973; Thomsen et al., 2008). The g values of the KR samples range between 1.2 % and 1.7 % per decade, which are considered low and usually do not require correction (Buylaert et al., 2012). Nevertheless, fading rates increase over geological time at high absorbed doses (Huntley and Lian, 2006; Wallinga et al., 2007) and should be corrected for (Li et al., 2019). Field saturation of the pIRIR signals is expected when equilibrium between trap filling due to ionizing radiation and electron escape through tunnelling is achieved (Huntley and Lian, 2006). This is expected to happen at lower doses than the laboratory saturation dose (Li et al., 2018). There are no other published pIRIR250 ages from the area; therefore, it is not clear whether the limit of 600 Gy is characteristic of the local feldspar or it is site dependent. It is possible that pIRIR signals stimulated at different temperatures have different saturation levels. pIRIR290 ages (corresponding to De values as high as 1600 Gy) in agreement with expected ages were reported elsewhere (Buylaert et al., 2012; Thiel et al., 2012; Zander and Hilgers, 2013).
Overall, inspection of the natural signals can be very informative and increase our confidence in distinguishing between reliable ages below saturation limit and samples that are already saturated. Construction of natural saturation profiles, as demonstrated here, can reveal saturated samples and treat them accordingly.
3.5 TT-OSL and pIRIR250 ages
The TT-OSL ages range between 3.0±0.3 ka for the modern sample to 624±63 ka at a depth of 12.5 m (Table 3). The ages are in stratigraphic order excluding one significant reversal at 8 m depth. There is another minor reversal at the base of the section, although the ages agree within error. The natural saturation profile revealed constant Ln∕Tn for the lower part of the section with clustered De values of 400–500 Gy (Figs. 6, 7), yet the ages increase with depth (Fig. 8). This can be explained by the decrease in environmental dose rate with depth (Table 1). The TT-OSL ages below 6 m mirror the changes in dose rates with depth (Fig. 8).

Figure 8TT-OSL ages and pIRIR250 uncorrected and corrected (Huntley and Lamothe, 2001; Kars et al., 2008) ages. All ages below 6 m should be treated as minimum ages. Some of the pIRIR250-corrected ages after Kars et al. (2008) are indicated as 2D0 ages (of the natural simulated DRC); therefore, they are presented as minimum ages. On the right, quartz environmental dose rates are presented. Note that the TT-OSL ages below 6 m mirror the dose rate pattern.
The uncorrected pIRIR250 ages range between 0.23±0.02 ka for the modern sample to 647±63 ka for the lowermost sample (15.3 m; Table 5). The ages increase with depth, although there is one reversal at 5 m depth. There is a good agreement between the TT-OSL and the uncorrected pIRIR250 ages up to 6 m depth (except for samples KR-5,9 at 4.1 m depth), where the signals reach their maximum Ln∕Tn. At this depth ages of ∼200 ka are obtained. From 6 m downwards the TT-OSL ages are mostly older that the uncorrected pIRIR250 ages. The ages converge again for the lowermost four samples at depths of 11–15 m.
The fading correction of Huntley and Lamothe (2001) was applied for samples from the upper 6 m (Table 5). The g values vary between 1.17±0.36 and 1.66 %±0.28 % per decade, increasing the ages by 9 %–18 % (Table S4). The fading-corrected pIRIR250 ages are between 0.25±0.02 ka and 254±15 ka. The Kars et al. (2008) correction was applied to all samples. The ρ′ values range between and (Table S4). For most samples, the simulated D0 values agree within 10 % with the laboratory-measured D0 values. The fading-corrected pIRIR250 ages range between 0.27±0.06 ka and 323±60 ka, with 17 %–72 % correction. The fading-corrected pIRIR250 ages after Kars et al. (2008) tend to be higher than the TT-OSL ages up to 6 m. For the samples at 6–11 m depth, for which the uncorrected pIRIR250 ages are younger than the TT-OSL ages, the fading correction does not compensate for the age difference. For the lower five samples, the Ln∕Tn values are above the saturation level of the natural simulated DRC (Fig. 9). Their fading-corrected ages were determined to be older than the natural simulated 2D0 (up to >715 Gy).
Table 5pIRIR250 dating results of the Kerem Shalom. Uncorrected and fading-corrected ages are presented.
a: g value and ρ′ of KR-10; b: g value and ρ′ of KR-3; c: g value and ρ′ of KR-2. d: fading correction after Huntley and Lamothe (2001). e: fading correction after Kars et al. (2008).
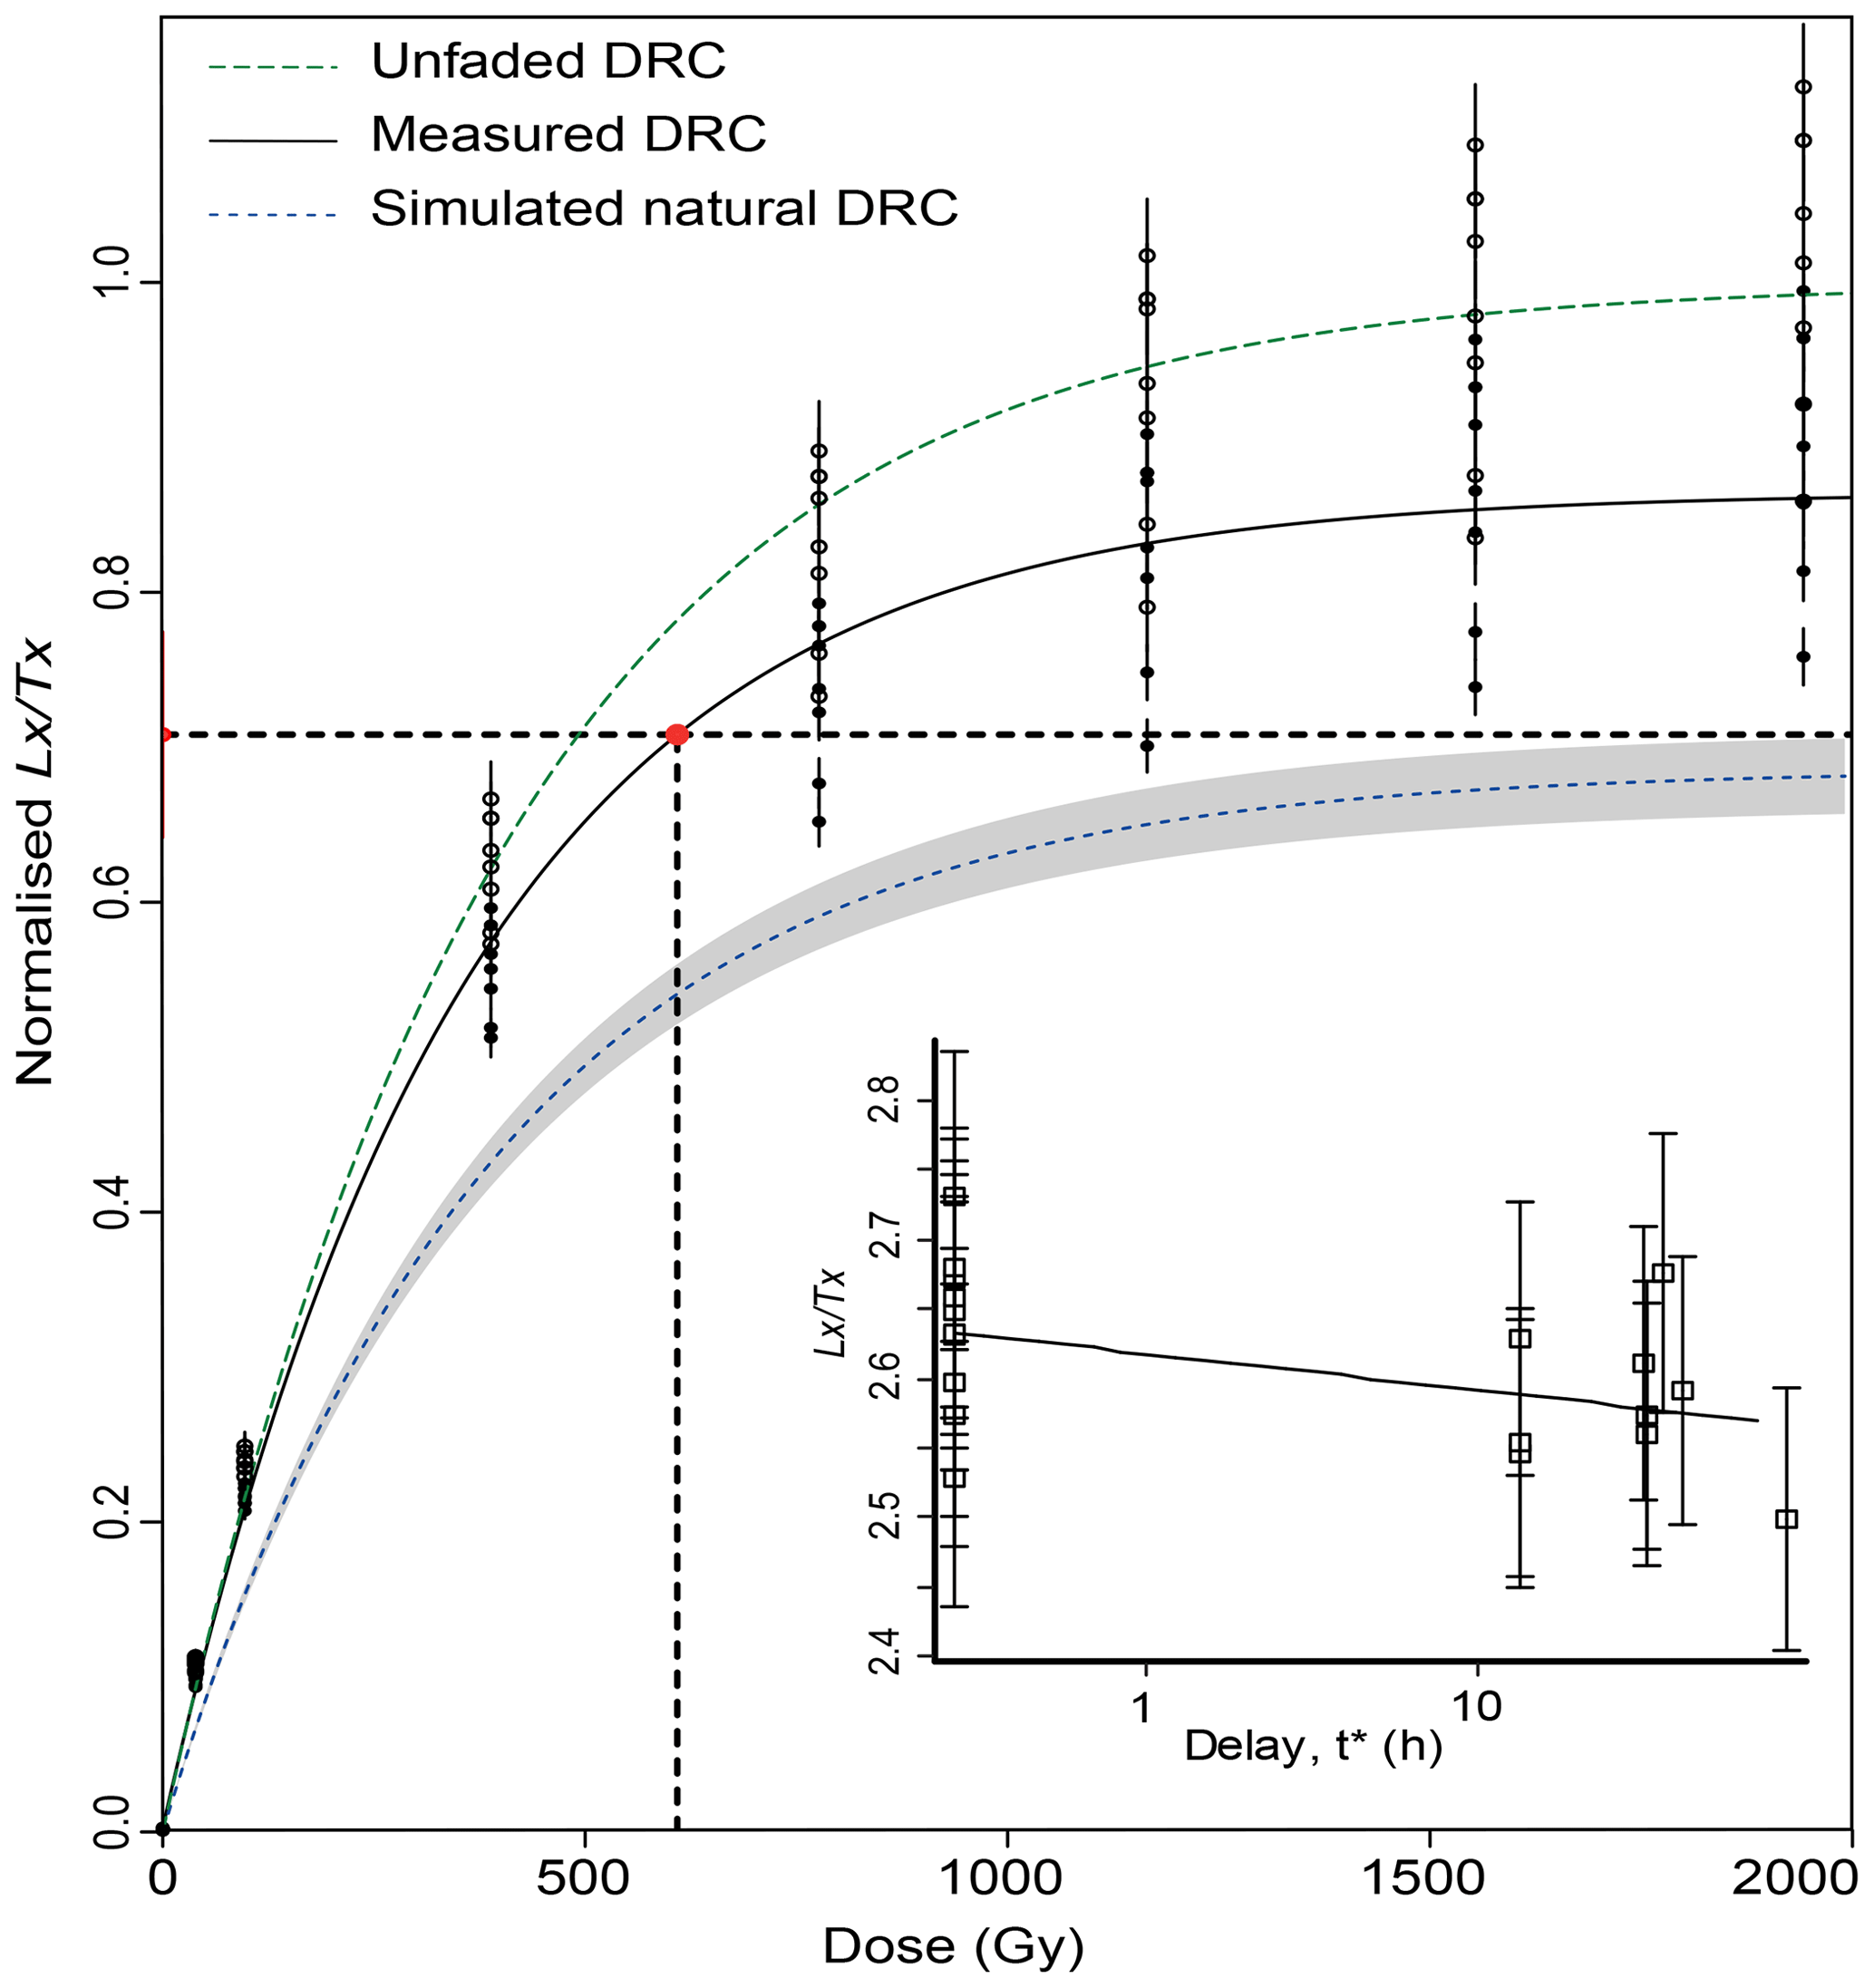
Figure 9Results of the fading correction after Kars et al. (2008) for sample KR-1. Measured, unfaded, and fading-corrected (simulated natural) DRCs are presented. For this sample, the Ln∕Tn is above the saturation level of the natural simulated DRC. Inset – fading rates measurement results (following Auclair et al., 2003) for this sample: g value (% per decade) and ().
The final chronology of the entire KR section was constructed as follows: for the upper 6 m, uncorrected pIRIR250 ages were used, as they are in excellent agreement with the TT-OSL ages (Fig. 10). It is feasible that for the KR samples no fading correction is needed for samples younger than the field saturation level. For samples below 6 m, the two signals are in field saturation as was indicated by the natural saturation profiles (Fig. 6). Thus, the ages are minimum ages. As the fading rates increase with time (Wallinga et al., 2007), pIRIR250-corrected ages after Kars et al. (2008) were used for these field saturated feldspar samples. As the TT-OSL and the pIRIR methods are limited by a different factor (thermal and athermal signal loss), there is no reason to prefer one method over another; hence, the older age is considered the minimum age of the samples. The combined ages are in stratigraphic order (Fig. 10), except for one reversal at 9.5 m depth (KR-14). Duplicate samples at 1.5 and 4.1 m depths (KR-6, 16 and KR-5, 9, respectively) have similar TT-OSL and uncorrected pIRIR250 ages, confirming the reproducibility of the two signals.
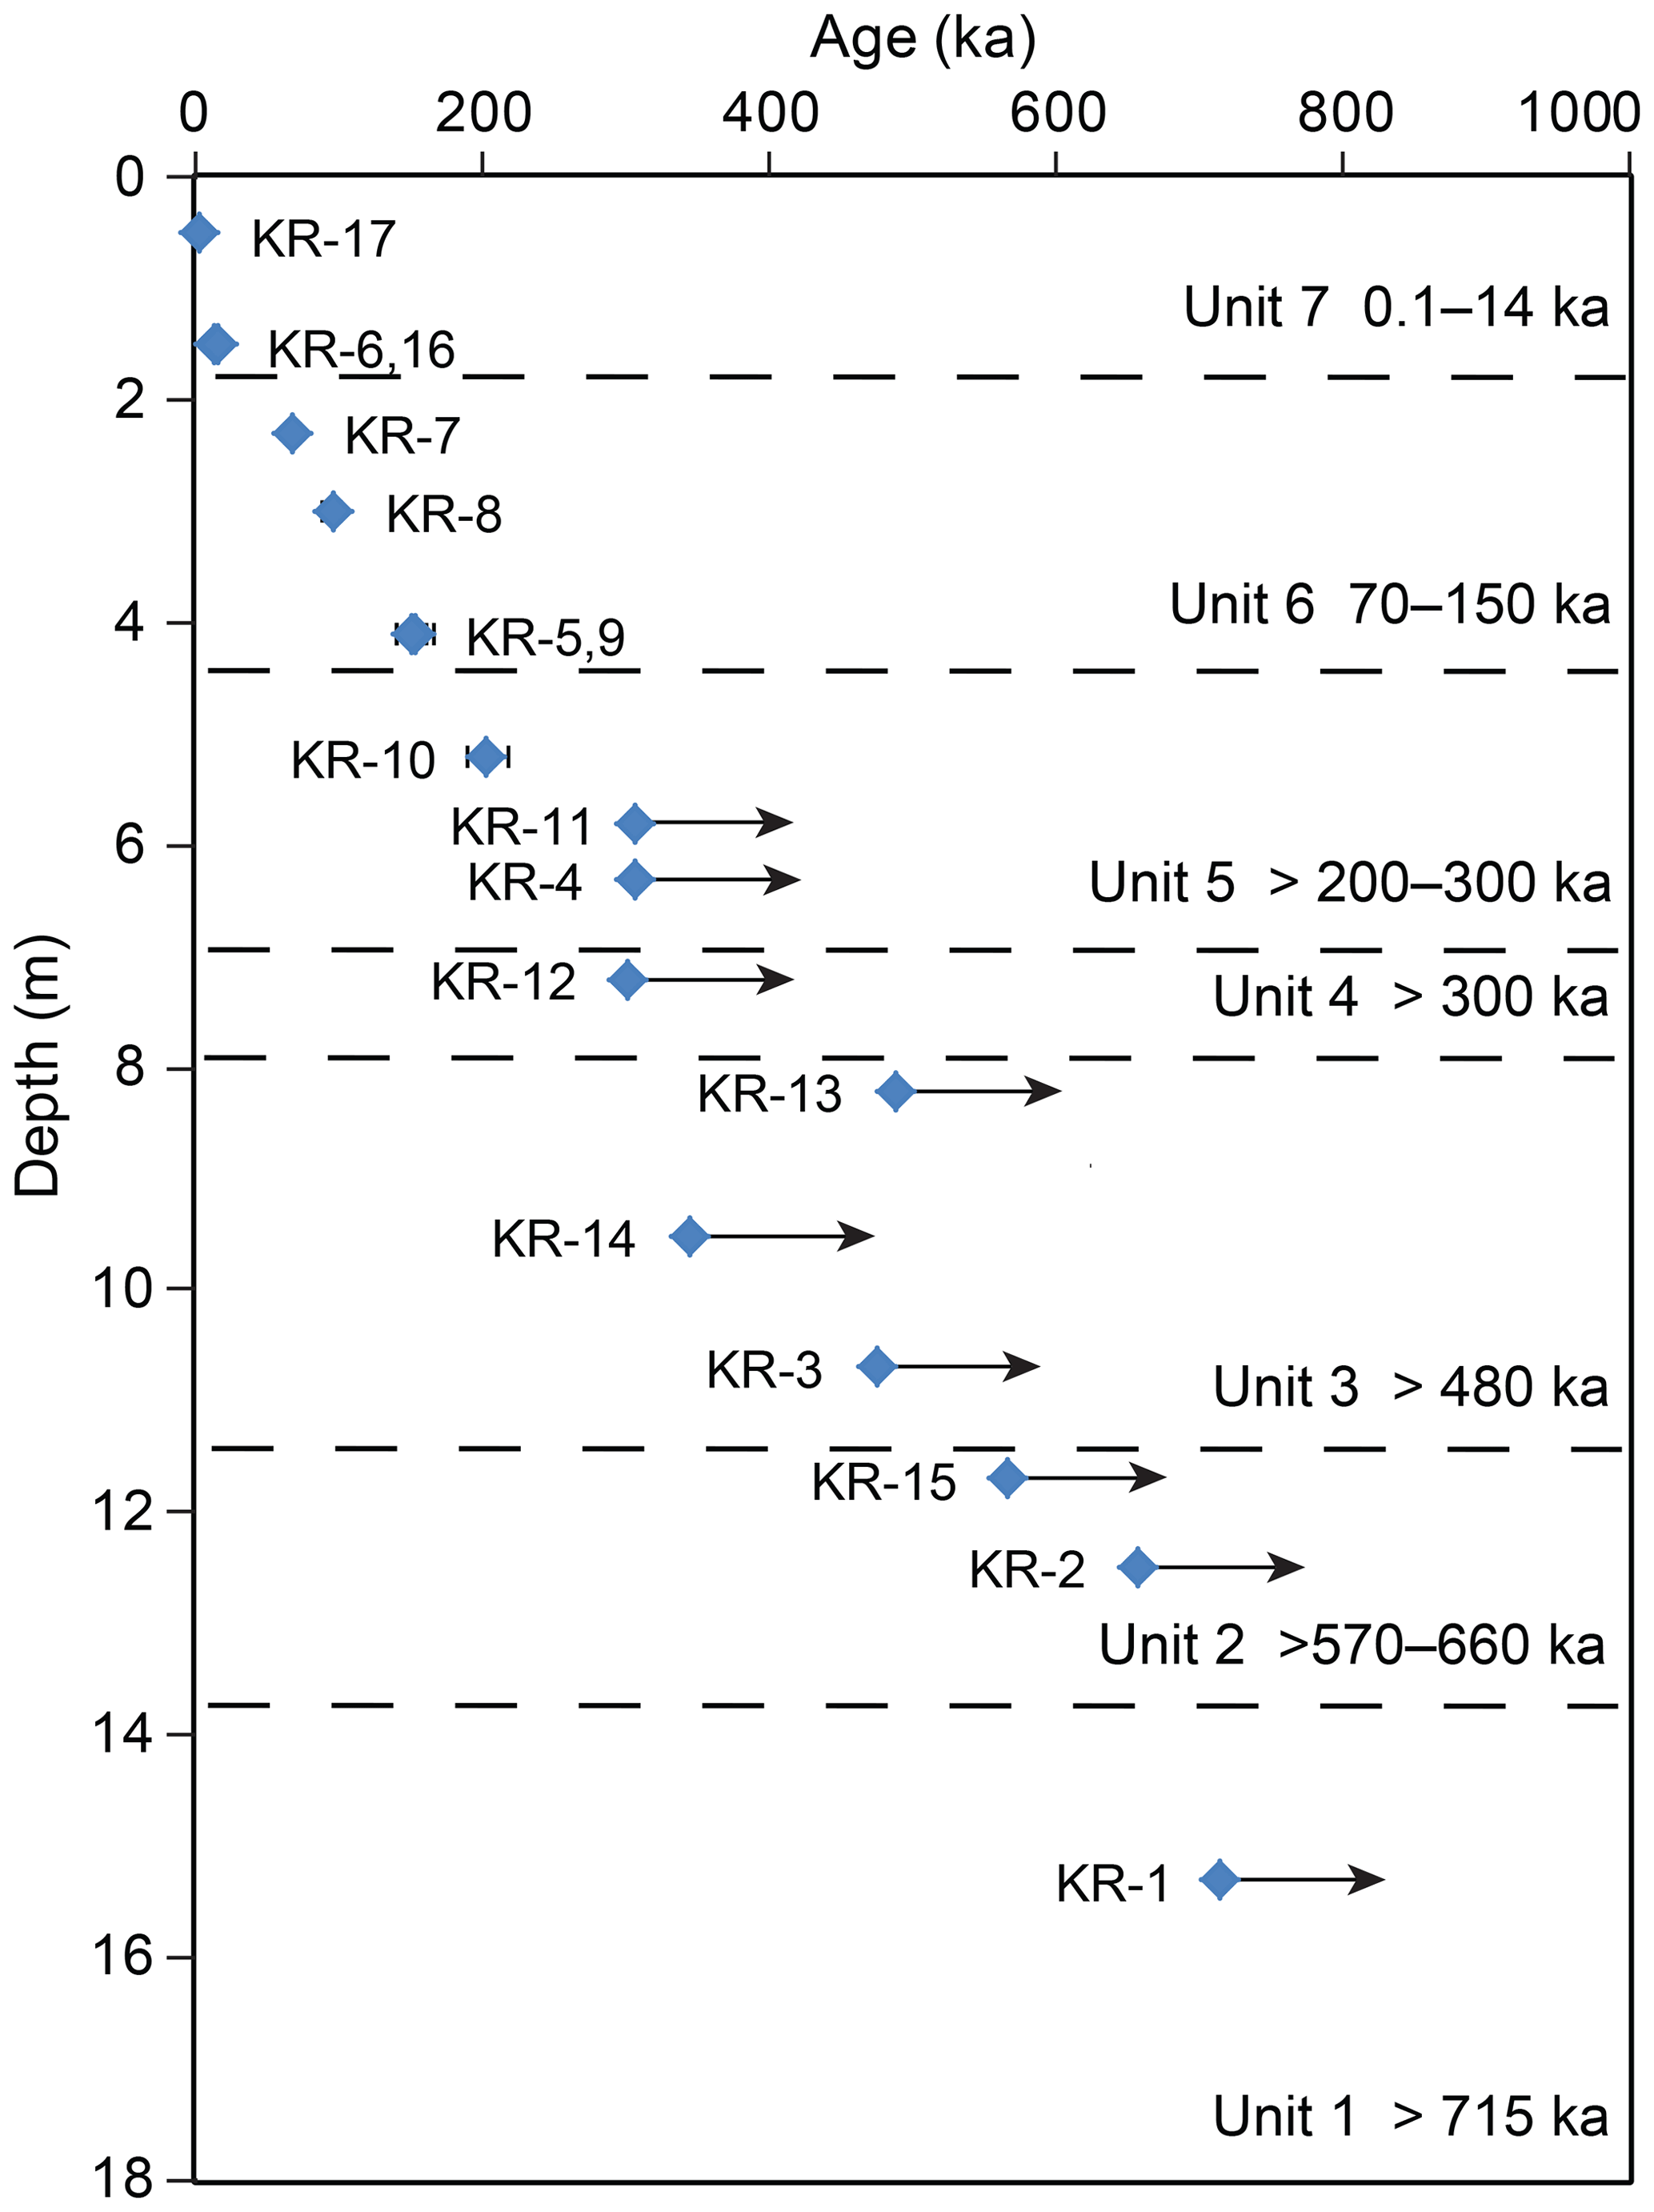
Figure 10KR combined luminescence chronology. Ages above 6 m are based on uncorrected pIRIR250 ages, while ages below 6 m are the oldest of TT-OSL or Kars et al. (2008) corrected pIRIR250 ages. The ages of all samples below 6 m are minimum ages.
3.6 VSL MAAD ages
Ankjærgaard et al. (2016) suggested interpolating the natural VSL signals of samples on a MAAD DRC, of a modern sample, in order to obtain their De values. Following this approach, the natural signals of the KR samples were projected onto the MAAD DRC of DF-13 (Fig. 2) fitted with the exponential plus linear and double exponential functions. The resulting De values were further translated into ages using the sample dose rates (Fig. 11). For the exponential plus linear fit, the errors in the De values, and subsequently on the ages, are 20 %–110 % (Table S5). The large errors may be attributed to the low slope of the linear component and the relatively large errors in the Ln∕Tn resulting from the weak signal. De values obtained with the double exponential function are slightly different (up to 15 %) from those obtained with the exponential plus linear function, with even larger errors (up to 500 %; Table S5). The VSL ages obtained by the exponential plus linear function were used for comparison with the other luminescence ages (Fig. 11). These ages are slightly lower than the TT-OSL and the uncorrected pIRIR250 ages for the upper 6 m of the section. The ages of the lower samples are inconclusive due to the large errors.
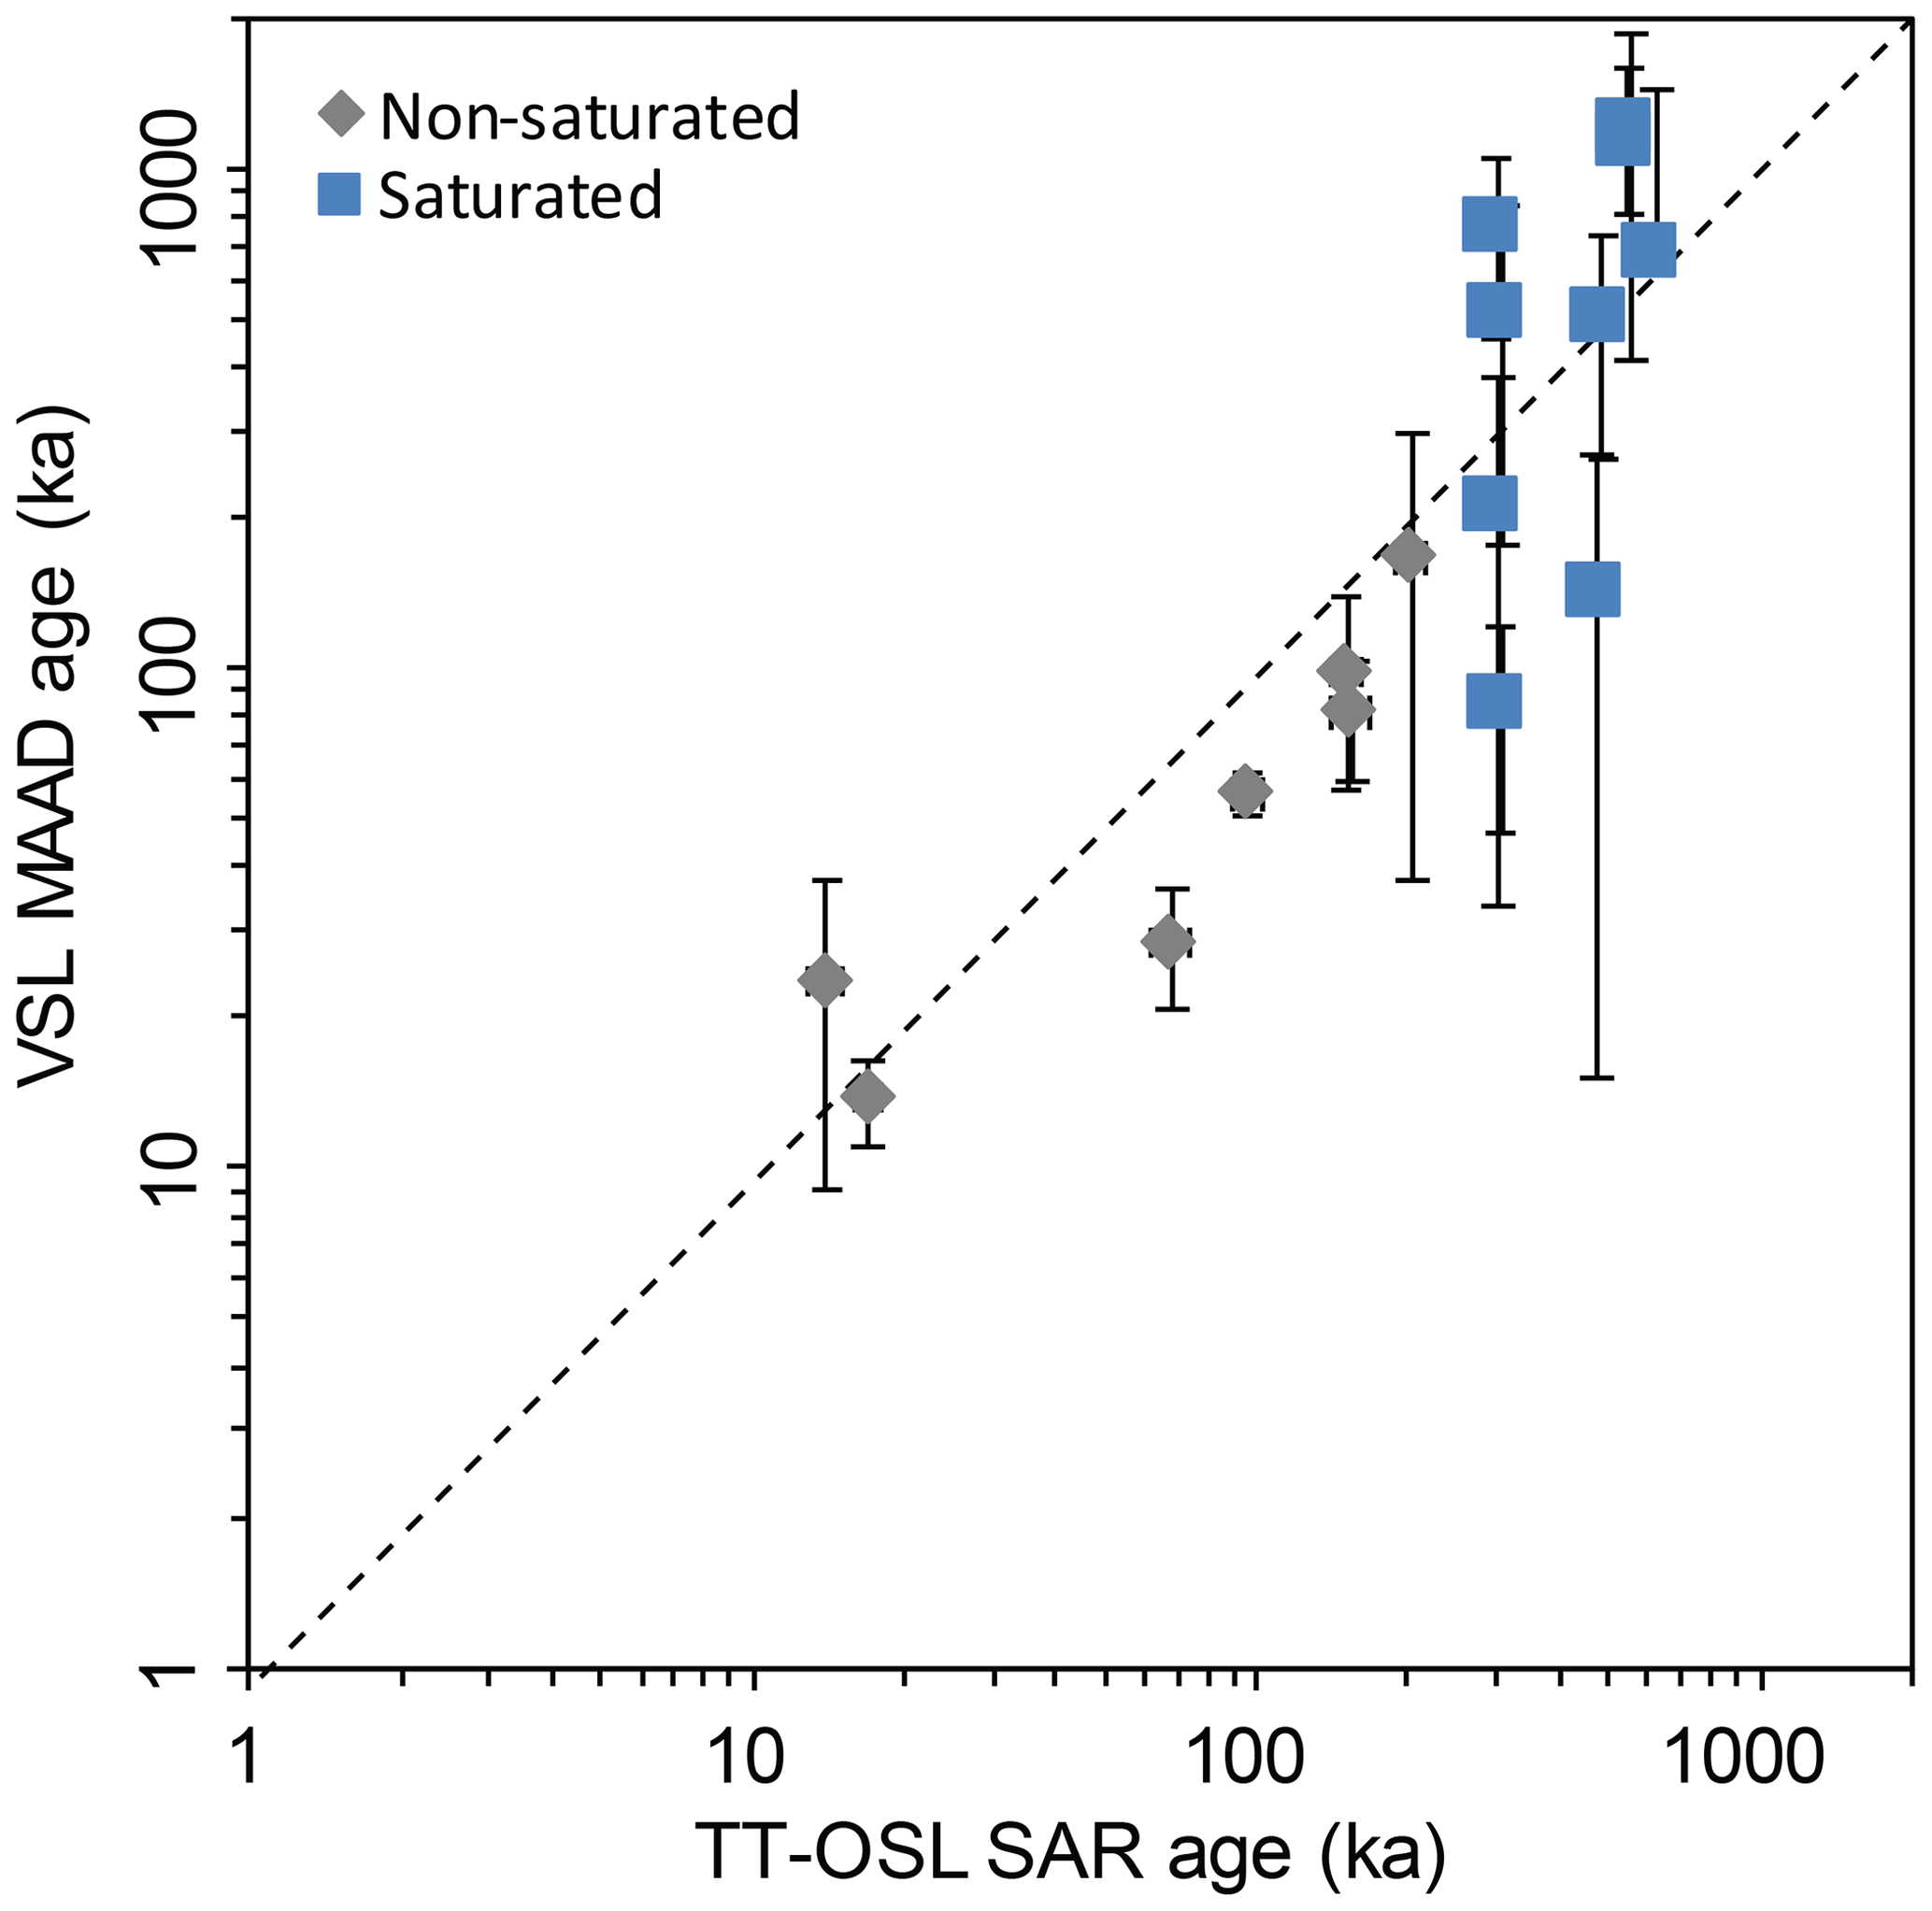
Figure 11VSL ages, obtained by projecting the Ln∕Tn values of the samples on the MAAD DRC of a modern sample (DF-13), plotted against TT-OSL SAR ages. Samples above the saturation depth (6 m) are in grey. The dashed line is the 1:1 ratio.
3.7 Geological implications
The KR outcrop presents a unique glimpse into the Pleistocene subsurface in the surrounding flat landscape. The sequence is nearly complete: although the contacts between the depositional units are sharp, the soil profiles are only missing their uppermost part (A and upper B horizons), implying minor erosion, probably due to deflation (Zilberman et al., 2007). Cyclic deposition was proposed, whereby sand deposition is followed by a stable period during which the calcic palaeosols developed, followed by minor erosion by deflation (Zilberman et al., 2007). This scenario is now refined, based on the new and improved chronology.
The ages for the lower two-thirds of the section (units 1–5) are not accurate as the units are too old for precise luminescence dating. However, important information can still be deduced from the well-dated units 6 and 7. Unit 6 is 3 m thick and was deposited during 80 ka (70–150 ka) at an average rate of 4 cm kyr−1 through glacial and interglacial cycles (MIS 6–4, marine isotope stages). Thus, a straightforward correlation between deposition of the KR sequence and Pleistocene climatic cycles cannot be made. The stable period, in which the stage II-III palaeosol of unit 6 was developed, continued for at least 55 ka (70–14 ka), the time difference between the deposition of units 6 and 7. The soils that cap the underlying units (1–5) are more mature (stage III–IV), implying longer stable periods between the earlier depositional cycles. Faershtein et al. (2018) demonstrated that the evolution of the TT-OSL apparent age with time results in increasing age underestimation. Thus, it can be reasonably assumed that the time intervals between the minimum ages of the units represent the minimal time periods between their deposition. It appears that at least ∼60–100 ka (differences in the minimum ages of the palaeosol units) separate the two depositional cycles (Fig. 10). This is in agreement with previous studies, which suggest that development of III–IV stage calcic soil can take tens of thousands of years (Gile et al., 1981; Birkeland, 1999). When these gaps between units are summed up, the total time required for the deposition of the seven units can be 800 ka.
When surfaces are stable, bioturbation is active, resulting in significant mixing that brings grains to the surface where their luminescence signal is reset, and this inserts bleached grains tens of centimetres below the surface (e.g. Bateman et al., 2007). Thus, one can expect the A and upper B horizons to be kept relatively bleached all the time. Assuming rapid deposition of the sand in each sandy palaeosol unit (Zilberman et al., 2007), this mixing can explain the relatively young age of sample KR-10 at the top of unit 5 (∼200 ka). While the rest of the samples from this unit are saturated with respect to TT-OSL and pIRIR250 signals, sample KR-10 is only close to saturation. If the stable period between deposition of units 5 and 6 is as long as 100 ka, bioturbation can cause the significant age underestimation of the upper part of the unit.
Overall, it is suggested that units 4 and 5 were deposited at >300 ka, unit 3>480 ka, unit 2>570–660 ka, and unit 1>715 ka. This implies that the accumulation of KR sand sheet has begun already in the early Pleistocene. The reversed polarity measured for unit 1 (Hagai Ron, personal communication, 2006) supports the early Pleistocene onset of the KR sequence.
The KR sand sheet is located at the boundary between two aeolian provinces: the Negev dune fields to the south and the coastal plain to the north. Aeolian sediments have been transported to the region by winds generally blowing from the west at least since the middle Pleistocene (Enzel et al., 2008, 2010; Roskin et al., 2011b). The extensive Negev dune field, which was stabilized after 18 ka (Roskin et al., 2011a), overlies late middle-to-late Pleistocene palaeosols dated to 100–200 ka (Roskin et al., 2013). The absence of sediments dated to between 18 and 100 ka was explained by long-term aeolian landscape equilibrium rather than erosion. During the stabilization after 18 ka, dunes over 10 m high were generated only 7 km south of KR (Roskin et al., 2011a). At the same time, at KR unit 7 which is only 1.5 m thick was deposited, indicating that, despite the proximity, the KR section is different from the dune field province. In fact, the KR sediments are chronologically more comparable to the coastal plain aeolian province (Zilberman et al., 2007). For example, during the deposition of unit 6 at KR, contemporaneous Kurkar ridges (aeolianite) were deposited along the coastal plain in several pulses at 50–150 ka (Frechen et al., 2002, 2004; Porat et al., 2004; Sivan and Porat, 2004; Harel et al., 2017). Later, during the stable period between the deposition of units 6 and 7 (14–70 ka), the Natanya Hamra soil developed along the coastal plain (13–57 ka; Porat et al., 2004; Shtienberg et al., 2017), also representing a stable period. The Kurkars and Hamra were dated mostly with IRSL50; therefore, their ages are most likely underestimated. In general, the accumulation rates at KR are low compared to the main aeolian province, perhaps due to the distance from the main sand source on the coast.
Calcic soils, similar to the KR palaeosols, usually developed in semi-arid climate with annual rainfall of at least 200–250 mm per year (Birkeland, 1999), but some calcic precipitation can also be found in drier areas in sandy sediments (Amit and Harrison, 1995). According to Zilberman et al. (2007), the KR palaeosols represent two climatic phases: a drier and windy climate during which the sand was delivered from the coast and accumulated, and a second, less windy and more humid climate in which vegetation was present on top of the sands, enabling dust trapping and soil development. This hypothesis goes along with increased precipitation recorded by speleothem growth at 150–200 and 13–85 ka (Vaks et al., 2006). The speleothem record also suggests increased precipitation at 123–137 ka, during the deposition of unit 6.
Wind velocity could have controlled the grain size of supplied sediment. It is suggested that during the windy and drier phases, sand was supplied to the area, while during the less windy phase, silt was supplied to the site as dust. Zilberman et al. (2007) dated two grain-size fractions from sample KR-7 (top of unit 6) to 42 and 55 ka for 74–105 µm and 150–177 µm, respectively. They attributed the age difference to a later penetration of the silt into the sandy soil. This sample was collected from a depth of 2.3 m, and therefore it is probably saturated with respect to the OSL signal. In the current study, only the 74–105 µm fraction of the sample was dated by TT-OSL and pIRIR250 to 68±6 and 77±6 ka, respectively. Hence, the age difference between the two grain sizes cannot be verified. Silty aeolian sediments from the northern Negev, known as primary loess, were dated by OSL mostly to 11–70 ka (Crouvi et al., 2008). These ages correspond to De values of 23–127 Gy, within the reliable range for the Nilotic quartz (Faershtein et al., 2019). These ages are consistent with silty dust supply during the stable period between the deposition of the KR units 6 and 7.
A comprehensive investigation of the luminescence behaviour of quartz TT-OSL, VSL, and feldspar pIRIR signals of eastern Mediterranean sediments of Nilotic origin was conducted using samples from the KR section. Bleaching experiments under direct sunlight showed relatively rapid bleaching for the pIRIR signals and slower bleaching rates for the TT-OSL and VSL signals, suggesting that these two signals should be used for dating mainly aeolian sediments. Nevertheless, on a timescale of early-to-middle Pleistocene, sediment from other sedimentological environments can be dated with TT-OSL. Dose recovery experiments showed adequate recovery for TT-OSL and indicated that the pIRIR signal measured at 250 ∘C is the most suitable for dating the local sediments. Natural saturation profiles indicated that the natural TT-OSL, VSL, and pIRIR250 signals of all samples deeper than 6 m are saturated. Therefore, the TT-OSL and pIRIR250 signals used for dating of these samples provide minimum ages. Construction of such profiles is recommended on a local and a regional scale in order to reveal saturated samples. Comparison between TT-OSL and pIRIR250 ages shows that no fading correction is needed for the pIRIR250 ages below natural saturation. Our results indicate that accurate ages can be provided for geological and prehistoric samples of late middle Pleistocene age (up to 200 ka).
The multiple-signal luminescence dating extended the dating range of the KR section into the early Pleistocene. Minimum ages of the lower units indicate that stable periods of soil development between each sand sedimentation cycle lasted for at least 60 ka. The chronology of the KR section associates its sediments mainly to the coastal plain sedimentological provinces. This means that the sedimentary sequence of the coastal plain is probably older than was previously thought.
The data can be received by communicating with the corresponding author.
The supplement related to this article is available online at: https://doi.org/10.5194/gchron-2-101-2020-supplement.
GF conducted the study and prepared the article with input from all co-authors. NP and AM supervised and assisted GF through the study.
The authors declare that they have no conflict of interest.
We thank Ezra Zilberman for fruitful discussions and feedback during the work on this article. Two anonymous reviewers are acknowledged for their insightful comments on a previous version of this article.
This research was supported by the Israel Ministry of Energy (grant no. 214-17-005), and by the Israel Science Foundation (grant no. 1871/16).
This paper was edited by Julie Durcan and reviewed by two anonymous referees.
Adamiec, G., Duller, G. A. T., Roberts, H. M., and Wintle, A. G.: Improving the TT-OSL SAR protocol through source trap characterization, Rad. Measure., 45, 768–777, 2010.
Aitken, M. J.: An Introduction to Optical Dating: the Dating of Quaternary Sediments by the Use of Photon-stimulated Luminescence, Oxford University Press, 1998.
Almagor, G., Gill, D., and Perath, I.: Marine sand resources offshore Israel, Mar. Georesour. Geotechnol., 18, 1–42, 2000.
Amit, R. and Harrison, B.: Biogenic calcic horizon development under extremely arid conditions Nizzana sand dunes, Israel, in: Arid Ecosystems, edited by: Blume, H. P. and Berkowicz, S. M., Adv. Geoecol., 28, 65–88, 1995.
Amit, R., Enzel, Y., Crouvi, O., Simhai, O., Matmon, A., Porat, N., McDonald, E., and Gillespie, A. R.: The role of the Nile in initiating a massive dust influx to the Negev late in the middle Pleistocene, Bulletin, 123, 873–889, 2011.
Ankjærgaard, C.: Exploring multiple-aliquot methods for quartz violet stimulated luminescence dating, Quaternary Geochronol., 51, 99–109, 2019.
Ankjærgaard, C., Jain, M., and Wallinga, J.: Towards dating Quaternary sediments using the quartz Violet Stimulated Luminescence (VSL) signal, Quaternary Geochronol., 18, 99–109, 2013.
Ankjærgaard, C., Guralnik, B., Buylaert, J. P., Reimann, T., Yi, S. W., and Wallinga, J.: Violet stimulated luminescence dating of quartz from Luochuan (Chinese loess plateau): agreement with independent chronology up to 600 ka, Quaternary Geochronol., 34, 33–46, 2016.
Arnold, L. J., Demuro, M., Parés, J. M., Pérez-González, A., Arsuaga, J. L., de Castro, J. M. B., and Carbonell, E.: Evaluating the suitability of extended-range luminescence dating techniques over early and Middle Pleistocene timescales: published datasets and case studies from Atapuerca, Spain, Quaternary Int., 389, 167–190, 2015.
Auclair, M., Lamothe, M., and Huot, S.: Measurement of anomalous fading for feldspar IRSL using SAR, Rad. Measure., 37, 487–492, 2003.
Balescu, S., Ritz, J. F., Lamothe, M., Auclair, M., and Todbileg, M.: Luminescence dating of a gigantic palaeolandslide in the Gobi-Altay mountains, Mongolia, Quaternary Geochronol., 2, 290–295, 2007.
Bateman, M. D., Boulter, C. H., Carr, A. S., Frederick, C. D., Peter, D., and Wilder, M.: Preserving the palaeoenvironmental record in drylands: bioturbation and its significance for luminescence-derived chronologies, Sed. Geol., 195, 5–19, 2007.
Birkeland, P. W.: 1999: Soils and Geomorphology, Oxford Univ. Press, New York, 430 p., 2007.
Bourdon, B., Turner, S., Henderson, G. M., and Lundstrom, C. C.: Introduction to U-series geochemistry, Rev. Mineral. Geochem., 52, 1–21, 2003.
Buylaert, J. P., Jain, M., Murray, A. S., Thomsen, K. J., Thiel, C., and Sohbati, R.: A robust feldspar luminescence dating method for Middle and Late Pleistocene sediments, Boreas, 41, 435–451, 2012.
Chapot, M. S., Roberts, H. M., Duller, G. A. T., and Lai, Z. P.: A comparison of natural-and laboratorygenerated dose response curves for quartz optically stimulated luminescence signals from Chinese Loess, Rad. Measure., 47, 1045–1052, 2012.
Chapot, M. S., Roberts, H. M., Duller, G. A. T., and Lai, Z. P.: Natural and laboratory TT-OSL dose response curves: testing the lifetime of the TT-OSL signal in nature, Rad. Measure., 85, 41–50, 2016.
Crouvi, O., Amit, R., Enzel, Y., Porat, N., and Sandler, A.: Sand dunes as a major proximal dust source for late Pleistocene loess in the Negev desert, Israel, Quaternary Res., 70, 275–282, 2008.
Danin, A. and Yaalon, D. H.: Silt plus clay sedimentation and decalcification during plant succession in sands of the Mediterranean coastal area of Israel, Israel J. Earth Sci., 31, 101–109, 1982.
Davis, M., Matmon, A., Rood, D. H., and Avnaim-Katav, S.: Constant cosmogenic nuclide concentrations in sand supplied from the Nile River over the past 2.5 m.y., Geology, 40, 359–362, 2012.
Duller, G. A. T.: Distinguishing quartz and feldspar in single grain luminescence measurements, Rad. Measure., 37, 161–165, 2003.
Duller, G. A., Tooth, S., Barham, L., and Tsukamoto, S.: New investigations at Kalambo Falls, Zambia: Luminescence chronology, site formation, and archaeological significance, J. Human Evolut., 85, 111–125, 2015.
Enzel, Y., Amit, R., Dayan, U., Crouvi, O., Kahana, R., Ziv, B., and Sharon, D.: The climatic and physiographic controls of the eastern Mediterranean over the Late Pleistocene climates in the southern Levant and its neighboring deserts, Global Planet. Change, 60, 165–192, 2008.
Enzel, Y., Amit, R., Crouvi, O., and Porat, N.: Abrasion-derived sediments under intensified winds at the latest Pleistocene leading edge of the advancing Sinai-Negev erg, Quaternary Rese., 74, 121–131, 2010.
Erfurt, G. and Krbetschek, M. R.: IRSAR-a single-aliquot regenerative-dose dating protocol applied to the infrared radiofluorescence (IR-RF) of coarse-grain K-feldspar, Ancient TL, 21, 17–23, 2003.
Faershtein, G., Guralnik, B., Lambert, R., Matmon, A., and Porat, N.: Investigating the thermal stability of TT-OSL main source trap, Rad. Measure., 119, 102–111, 2018.
Faershtein, G., Porat, N., and Matmon, A.: Natural saturation of OSL and TT-OSL signals of quartz grains from Nilotic origin, Quaternary Geochronol., 49, 146–152, 2019.
Frechen, M., Neber, A., Dermann, B., Tsatskin, A., Boenigk, W., and Ronen, A.: Chronostratigraphy of aeolianites from the Sharon Coastal Plain of Israel, Quaternary Int., 89, 31–44, 2002.
Frechen, M., Neber, A., Tsatskin, A., Boenigk, W., and Ronen, A.: Chronology of Pleistocene sedimentary cycles in the Carmel Coastal Plain of Israel, Quaternary Int., 121, 41–52, 2004.
Frouin, M., Huot, S., Kreutzer, S., Lahaye, C., Lamothe, M., Philippe, A., and Mercier, N.: An improved radiofluorescence single-aliquot regenerative dose protocol for K-feldspars, Quaternary Geochronol., 38, 13–24, 2017.
Galbraith, R. F. and Roberts, R. G.: Statistical aspects of equivalent dose and error calculation and display in OSL dating: an overview and some recommendations, Quaternary Geochronol., 11, 1–27, 2012.
Gile, L. H., Peterson, F. F., and Grossman, R. B.: Morphological and genetic sequences of carbonate accumulation in desert soils, Soil Sci., 101, 347–360, 1966.
Gile, L. H., Hawley, J. W., and Grossman, R. B.: Soils and geomorphology in the basin and range area of southern New Mexico – guidebook to the desert project. New Mexico Bureau of Mines and Mineral Resources, Memoir, 39, 222, 1981.
Gosse, J. C. and Phillips, F. M.: Terrestrial in situ cosmogenic nuclides: theory and application, Quaternary Sci. Rev., 20, 1475–1560, 2001.
Granger, D. E.: A review of burial dating methods using 26Al and 10Be, Geol. Soc. Am. Special Paper, 415, 1–16, 2006.
Gvirtzman, G., Shachnai, E., Bakler, N., and Ilani, S.: Stratigraphy of the Kurkar Group (Quaternary) of the coastal plain of Israel, GSI, Current Res., 1983–84, 70–82, 1984.
Hall, J.: Digital Shaded-Relief Map of Israel and Environs, 1 : 500 000, Israel Geological Survey, 1997.
Harel, M., Amit, R., Porat, N., and Enzel, Y.: Evolution of the Southeastern Mediterranean coastal plain, in: Quaternary of the Levant Environments, Climate Change, and Humans, edited by: Enzel, E. and Bar-Yosef, O., Cambridge University Press, 433–445, 2017.
Hernandez, M. and Mercier, N.: Characteristics of the post-blue VSL signal from sedimentary quartz, Rad. Measure., 78, 1–8, 2015.
Hu, G., Zhang, J. F., Qiu, W. L., and Zhou, L. P.: Residual OSL signals in modern fluvial sediments from the Yellow River (HuangHe) and the implications for dating young sediments, Quaternary Geochronol., 5, 187–193, 2010.
Huntley, D. J.: An explanation of the power-law decay of luminescence, J. Phys. Condensed Matter, 18, 1359–1365, 2006.
Huntley, D. J. and Baril, M. R.: The K content of the K-feldspars being measured in optical dating or in the thermoluminescence dating, Ancient TL, 15, 11–13, 1997.
Huntley, D. J. and Lamothe, M.: Ubiquity of anomalous fading in K-feldspars and the measurement and correction for it in optical dating, Can. J. Earth Sci., 38, 1093–1106, 2001.
Huntley, D. J. and Lian, O. B.: Some observations on tunnelling of trapped electrons in feldspars and their implications for optical dating, Quaternary Sci. Rev., 25, 2503–2512, 2006.
Jain, M.: Extending the dose range: probing deep traps in quartz with 3.06 eV photons, Rad. Measure., 44, 445–452, 2009.
Kars, R. H., Wallinga, J., and Cohen, K. M.: A new approach towards anomalous fading correction for feldspar IRSL dating - tests on samples in field saturation, Rad. Measure., 43, 786–790, 2008.
Kelley, S.: K-Ar and Ar-Ar dating, Rev. Mineral. Geochem., 47, 785–818, 2002.
King, G. E. and Burow, C.: calc_Huntley2006(): Apply the Huntley (2006) model. Function version 0.4.1, in: Luminescence, edited by: Kreutzer, S., Burow, C., Dietze, M., Fuchs, M. C., Schmidt, C., Fischer, M., and Friedrich, J., Comprehensive Luminescence Dating Data AnalysisR package version 0.9.5, available at: https://CRAN.R-project.org/package=Luminescence (last access: January 2020), 2019.
Kreutzer, S.: calc_FadingCorr(): Apply a fading correction according to Huntley & Lamothe (2001) for a given g-value and a given tc. Function version 0.4.2, in: Luminescence, edited by: Kreutzer, S., Burow, C., Dietze, M., Fuchs, M. C., Schmidt, C., Fischer, M., and Friedrich, J., Comprehensive Luminescence Dating Data AnalysisR package version 0.9.5, available at: https://CRAN.R-project.org/package=Luminescence (last access: January 2020), 2019.
Kreutzer, S. and Burow, C.: analyse_FadingMeasurement(): Analyse fading measurements and returns the fading rate per decade (g-value). Function version 0.1.11, in: Luminescence, edited by: Kreutzer, S., Burow, C., Dietze, M., Fuchs, M. C., Schmidt, C., Fischer, M., and Friedrich, J., Comprehensive Luminescence Dating Data Analysis R package version 0.9.5, https://CRAN.R-project.org/package=Luminescence (last access: January 2020), 2019.
Li, Y., Tsukamoto, S., Long, H., Zhang, J., Yang, L., He, Z., and Frechen, M.: Testing the reliability of fading correction methods for feldspar IRSL dating: A comparison between natural and simulated-natural dose response curves, Rad. Measure., 120, 228–233, 2018.
Li, Y., Tsukamoto, S., Shang, Z., Tamura, T., Wang, H., and Frechen, M.: Constraining the transgression history in the Bohai Coast China since the Middle Pleistocene by luminescence dating, Mar. Geol., 416, 105980, https://doi.org/10.1016/j.margeo.2019.105980, 2019.
Liu, J., Murray, A. S., Buylaert, J. P., Jain, M., Chen, J., and Lu, Y.: Stability of fine grained TT-OSL and post-IR IRSL signals from a c. 1 Ma sequence of aeolian and lacustrine deposits from the Nihewan Basin (northern China), Boreas, 45, 703–714, 2016.
Lowick, S. E., Trauerstein, M., and Preusser, F.: Testing the application of post IR-IRSL dating to fine grain waterlain sediments, Quaternary Geochronol., 8, 33–40, 2012.
Mauz, B., Hijma, M. P., Amorosi, A., Porat, N., Galili, E., and Bloemendal, J.: Aeolian beach ridges and their significance for climate and sea level: Concept and insight from the Levant coast (East Mediterranean), Earth-Sci. Rev., 121, 31–54, 2013.
Muhs, D. R., Roskin, J., Tsoar, H., Skipp, G., Budahn, J. R., Sneh, A., Porat, N., Stanley, J. D., Katra, I., and Blumberg, D. G.: Origin of the Sinai–Negev erg, Egypt and Israel: mineralogical and geochemical evidence for the importance of the Nile and sea level history, Quaternary Sci. Rev., 69, 28–48, 2013.
Murray, A. S. and Wintle, A. G.: Luminescence dating of quartz using an improved single-aliquot regenerative-dose protocol, Rad. Measure., 32, 57–73, 2000.
Porat, N.: Use of magnetic separation for purifying quartz for luminescence dating, Ancient TL, 24, 33–36, 2006.
Porat, N., Zhou, L. P., Chazan, M., Noy, T., and Horwitz, L. K.: Dating the lower Paleolithic open air site of Holon, Israel, by luminescence and ESR techniques, Quaternary Res., 51, 328–341, 1999.
Porat, N., Wintle, A. G., and Ritte, M.: Mode and timing of kurkar and hamra formation, central coastal plain, Israel, Israel J. Earth Sci., 53, 13–25, 2004.
Porat, N., Sivan, D., and Zviely, D.: Late Holocene embayment infill and shoreline migration, Haifa Bay, Eastern Mediterranean, Israel J. Earth Sci., 57, 21–31, 2008.
Porat, N., Duller, G. A. T., Roberts, H. M., and Wintle, A. G.: A simplified SAR protocol for TT-OSL, Rad. Measure., 44, 538–542, 2009.
Porat, N., Faershtein, G., Medialdea, A., and Murray, A. S.: Re-examination of common extraction and purification methods of quartz and feldspar for luminescence dating, Ancient TL, 33, 22–30, 2015.
Porat, N., Jain, M., Ronen, A., and Horwitz, L. K.: A contribution to late Middle Paleolithic chronology of the Levant: New luminescence ages for the Atlit Railway Bridge site, Coastal Plain, Israel, Quaternary Int., 464, 32–42, 2018.
Rendell, H., Yair, A., and Tsoar, H.: Thermoluminescence dating of period of sand movement and linear dune formation in the northern Negev, Israel, in: The Dynamics and Environmental Context of Aeolian Sedimentary Systems, edited by: Pye, K., 72, 69–74, 1993.
Roskin, J., Porat, N., Tsoar, H., Blumberg, D. G., and Zander, A. M.: Age, origin and climatic controls on vegetated linear dunes in the northwestern Negev Desert (Israel), Quaternary Sci. Rev., 30, 1649–1674, 2011a.
Roskin, J., Tsoar, H., Porat, N., and Blumberg, D. G.: Palaeoclimate interpretations of Late Pleistocene vegetated linear dune mobilization episodes: evidence from the northwestern Negev dunefield, Israel, Quaternary Sci. Rev., 33, 3364–3380, 2011b.
Roskin, J., Katra, I., Porat, N., and Zilberman, E.: Evolution of Middle to Late Pleistocene sandy calcareous paleosols underlying the northwestern Negev Desert Dunefield (Israel), Palaeogeogr. Palaeoclimatol. Palaeoecol., 387, 134–152, 2013.
Shemer, M., Crouvi, O., Shaar, R., Ebert, Y., Matmon, A., ASTER Team, Horwitz, L.K., Eisenmann, V., Enzel, Y., and Barzilai, O.: Geochronology, paleogeography, and archaeology of the Acheulian locality of `Evron Landfill in the western Galilee, Israel, Quaternary Res., 91, 729–750, 2018.
Shen, Z. X., Mauz, B., and Lang, A.,: Source-trap characterization of thermally transferred OSL in quartz, J. Physics D, 44, 295405, https://doi.org/10.1088/0022-3727/44/29/295405, 2011.
Shtienberg, G., Dix, J. K., Roskin, J., Waldmann, N., Bookman, R., Bialik, O. M., Porat, N., Taha, N., and Sivan, D.,: New perspectives on coastal landscape reconstruction during the Late Quaternary: A test case from central Israel, Palaeogeogr. Palaeoclimatol. Palaeoecol., 468, 503–519, 2017.
Singer, B. S.: A Quaternary geomagnetic instability time scale, Quaternary Geochronol., 21, 29–52, 2014.
Sivan, D. and Porat, N.: Evidence from luminescence for late Pleistocene formation of calcareous aeolianite (kurkar) and palaeosol (hamra) in the Carmel coast, Israel, Palaeogeogr. Palaeoclimatol. Palaeoecol., 211, 95–106, 2004.
Thiel, C., Buylaert, J. P., Murray, A. S., Terhorst, B., Hofer, I., Tsukamoto, S., and Frechen, M.: Luminescence dating of the Stratzing loess profile (Austria) – Testing the potential of an elevated temperature post-IR IRSL protocol, Quaternary Int., 234, 23–31, 2011.
Thiel, C., Buylaert, J. P., Murray, A.S., Elmejdoub, N., and Jedoui, Y.: A comparison of TT-OSL and post-IR IRSL dating of coastal deposits on Cap Bon peninsula, north-eastern Tunisia, Quaternary Geochronol., 10, 209–217, 2012.
Thomsen, K. J., Murray, A. S., Jain, M., and Bøtter-Jensen, L.: Laboratory fading rates of various luminescence signals from feldspar-rich sediment extracts, Rad. Measure., 43, 1474–1486, 2008.
Tsukamoto, S., Duller, G. A. T., and Wintle, A. G.: Characteristics of thermally transferred optically stimulated luminescence (TT-OSL) in quartz and its potential for dating sediments, Rad. Measure., 43, 1204–1218, 2008.
Tsukamoto, S., Kondo, R., Lauer, T., and Jain, M.: Pulsed IRSL: A stable and fast bleaching luminescence signal from feldspar for dating Quaternary sediments, Quaternary Geochronol., 41, 26–36, 2017.
Vaks, A., Bar-Matthews, M., Ayalon, A., Matthews, A., Frumkin, A., Dayan, U., Halicz, L., Almogi-Labin, A., and Schilman, B.: Palaeoclimate and location of border between Mediterranean climate region and the Saharo-Arabian Desert as revealed by speleothems from the northern Negev Desert, Israel, Earth Planet. Sci. Lett., 249, 384–399, 2006.
Wallinga, J., Bos, A. J., Dorenbos, P., Murray, A. S., and Schokker, J.: A test case for anomalous fading correction in IRSL dating, Quaternary Geochronol., 2, 216–221, 2007.
Wang, X. L., Wintle, A. G., and Lu, Y. C.: Thermally transferred luminescence in fine-grained quartz from Chinese loess: basic observations, Rad. Measure., 41, 649–658, 2006a.
Wang, X. L., Lu, Y. C., and Wintle, A. G: Recuperated OSL dating of fine-grained quartz in Chinese loess, Quaternary Geochronol., 1, 89–100, 2006b.
Wintle, A. G.: Anomalous fading of thermoluminescence in minerals, Nature, 245, 143–144, 1973.
Wintle, A. G. and Murray, A. S.: A review of quartz optically stimulated luminescence characteristics and their relevance in single aliquot regeneration dating protocols, Rad. Measure., 41, 369–391, 2006.
Wintle, A. G. and Adamiec, G.: Optically stimulated luminescence signals from quartz: a review, Rad. Measure., 98, 10–33, 2017.
Zander, A. and Hilgers, A.: Potential and limits of OSL, TT-OSL, IRSL and pIRIR290 dating methods applied on a Middle Pleistocene sediment record of Lake El'gygytgyn, Russia, Clim. Past, 9, 719–733, https://doi.org/10.5194/cp-9-719-2013, 2013.
Zilberman, E., Porat, N., and Roskin, J.: The Middle to Late-Pleistocene sand sheet sequence of Kerem Shalom, western Negev – an archive of coastal sand incursion, Geological Survey of Israel Report, 23 p., 2007.