the Creative Commons Attribution 4.0 License.
the Creative Commons Attribution 4.0 License.
 | 11 Sep 2020
Delayed and rapid deglaciation of alpine valleys in the Sawatch Range, southern Rocky Mountains, USA
William Caffee
Avriel D. Schweinsberg
Jason P. Briner
Eric M. Leonard
We quantify retreat rates for three alpine glaciers in the Sawatch Range of the southern Rocky Mountains following the Last Glacial Maximum using 10Be ages from ice-sculpted, valley-floor bedrock transects and statistical analysis via the BACON program in R. Glacier retreat in the Sawatch Range from at (100 %) or near (∼83 %) Last Glacial Maximum extents initiated between 16.0 and 15.6 ka and was complete by 14.2–13.7 ka at rates ranging between 35.6 and 6.8 m a−1. Deglaciation in the Sawatch Range commenced ∼2–3 kyr later than the onset of rising global CO2 and prior to rising temperatures observed in the North Atlantic region at the Heinrich Stadial 1–Bølling transition. However, deglaciation in the Sawatch Range approximately aligns with the timing of Great Basin pluvial lake lowering. Recent data–modeling comparison efforts highlight the influence of the large North American ice sheets on climate in the western United States, and we hypothesize that recession of the North American ice sheets may have influenced the timing and rate of deglaciation in the Sawatch Range. While we cannot definitively argue for exclusively North Atlantic forcing or North American ice sheet forcing, our data demonstrate the importance of regional forcing mechanisms for past climate records.
- Article
(16250 KB) - Full-text XML
- BibTeX
- EndNote


Alpine glaciers worldwide underwent substantial retreat in response to climate warming during the last deglaciation (Shakun et al., 2015; Palacios et al., 2020). However, the general trend of warming through the last deglaciation was interrupted by internally forced and regionally heterogeneous climate changes such as the cool Heinrich Stadial 1 (17.5–14.7 ka), abrupt warming into the Bølling–Allerød period (14.7–12.9 ka), and the Younger Dryas cold period (12.9–11.7 ka) all centered in the North Atlantic region (NGRIP members, 2004; Rasmussen et al., 2014). To thoroughly characterize the influence of these climatic oscillations, their expression throughout the Northern Hemisphere is often investigated using records of mountain glaciation (Ivy-Ochs et al., 2006; Schaefer et al., 2006; Young et al., 2011; Shakun et al., 2015; Marcott et al., 2019; Young et al., 2019). Mountain glacier deposits serve as suitable archives since mountain glaciers are particularly sensitive to changes in climate (e.g., Oerlemans, 2005; Roe et al., 2017). Furthermore, where deposits are carefully mapped and dated, quantitative retreat or thinning rates of glaciers can be compared to records of climatic forcings. Statistical approaches to quantify retreat and thinning rates have been previously applied to ice sheets (e.g., Johnson et al., 2014; Jones et al., 2015; Koester et al., 2017; Small et al., 2018; Lesnek et al., 2020) but only for a few mountain glaciers (e.g., Hofmann et al., 2019).
In the western United States (US; Fig. 1), mountain glaciers expanded out of the high elevations of the Rocky Mountains, the Sierra Nevada, and many other smaller ranges during the Last Glacial Maximum (LGM; Porter et al., 1983; Pierce, 2003). During the last deglaciation, many glaciers retreated from their extended LGM positions and eventually melted from their cirques during the late glacial to early Holocene (e.g., Munroe and Laabs, 2017; Marcott et al., 2019). Yet, the temporal and spatial patterns of retreat throughout the western US and their relationship to hemispheric and global forcing are still a subject of debate. Glaciers in the western US may have retreated in response to increasing global temperature forced by rising atmospheric CO2 concentrations, thus broadly synchronous with other mountain glaciers around the world (e.g., Shakun et al., 2015; Marcott et al., 2019). However, some evidence suggests a delay of deglaciation until the Bølling due to either persistent stadial conditions (e.g., Young et al., 2011) or as a response to increased local moisture supply to some glaciers from nearby pluvial lakes (e.g., Laabs et al., 2009).
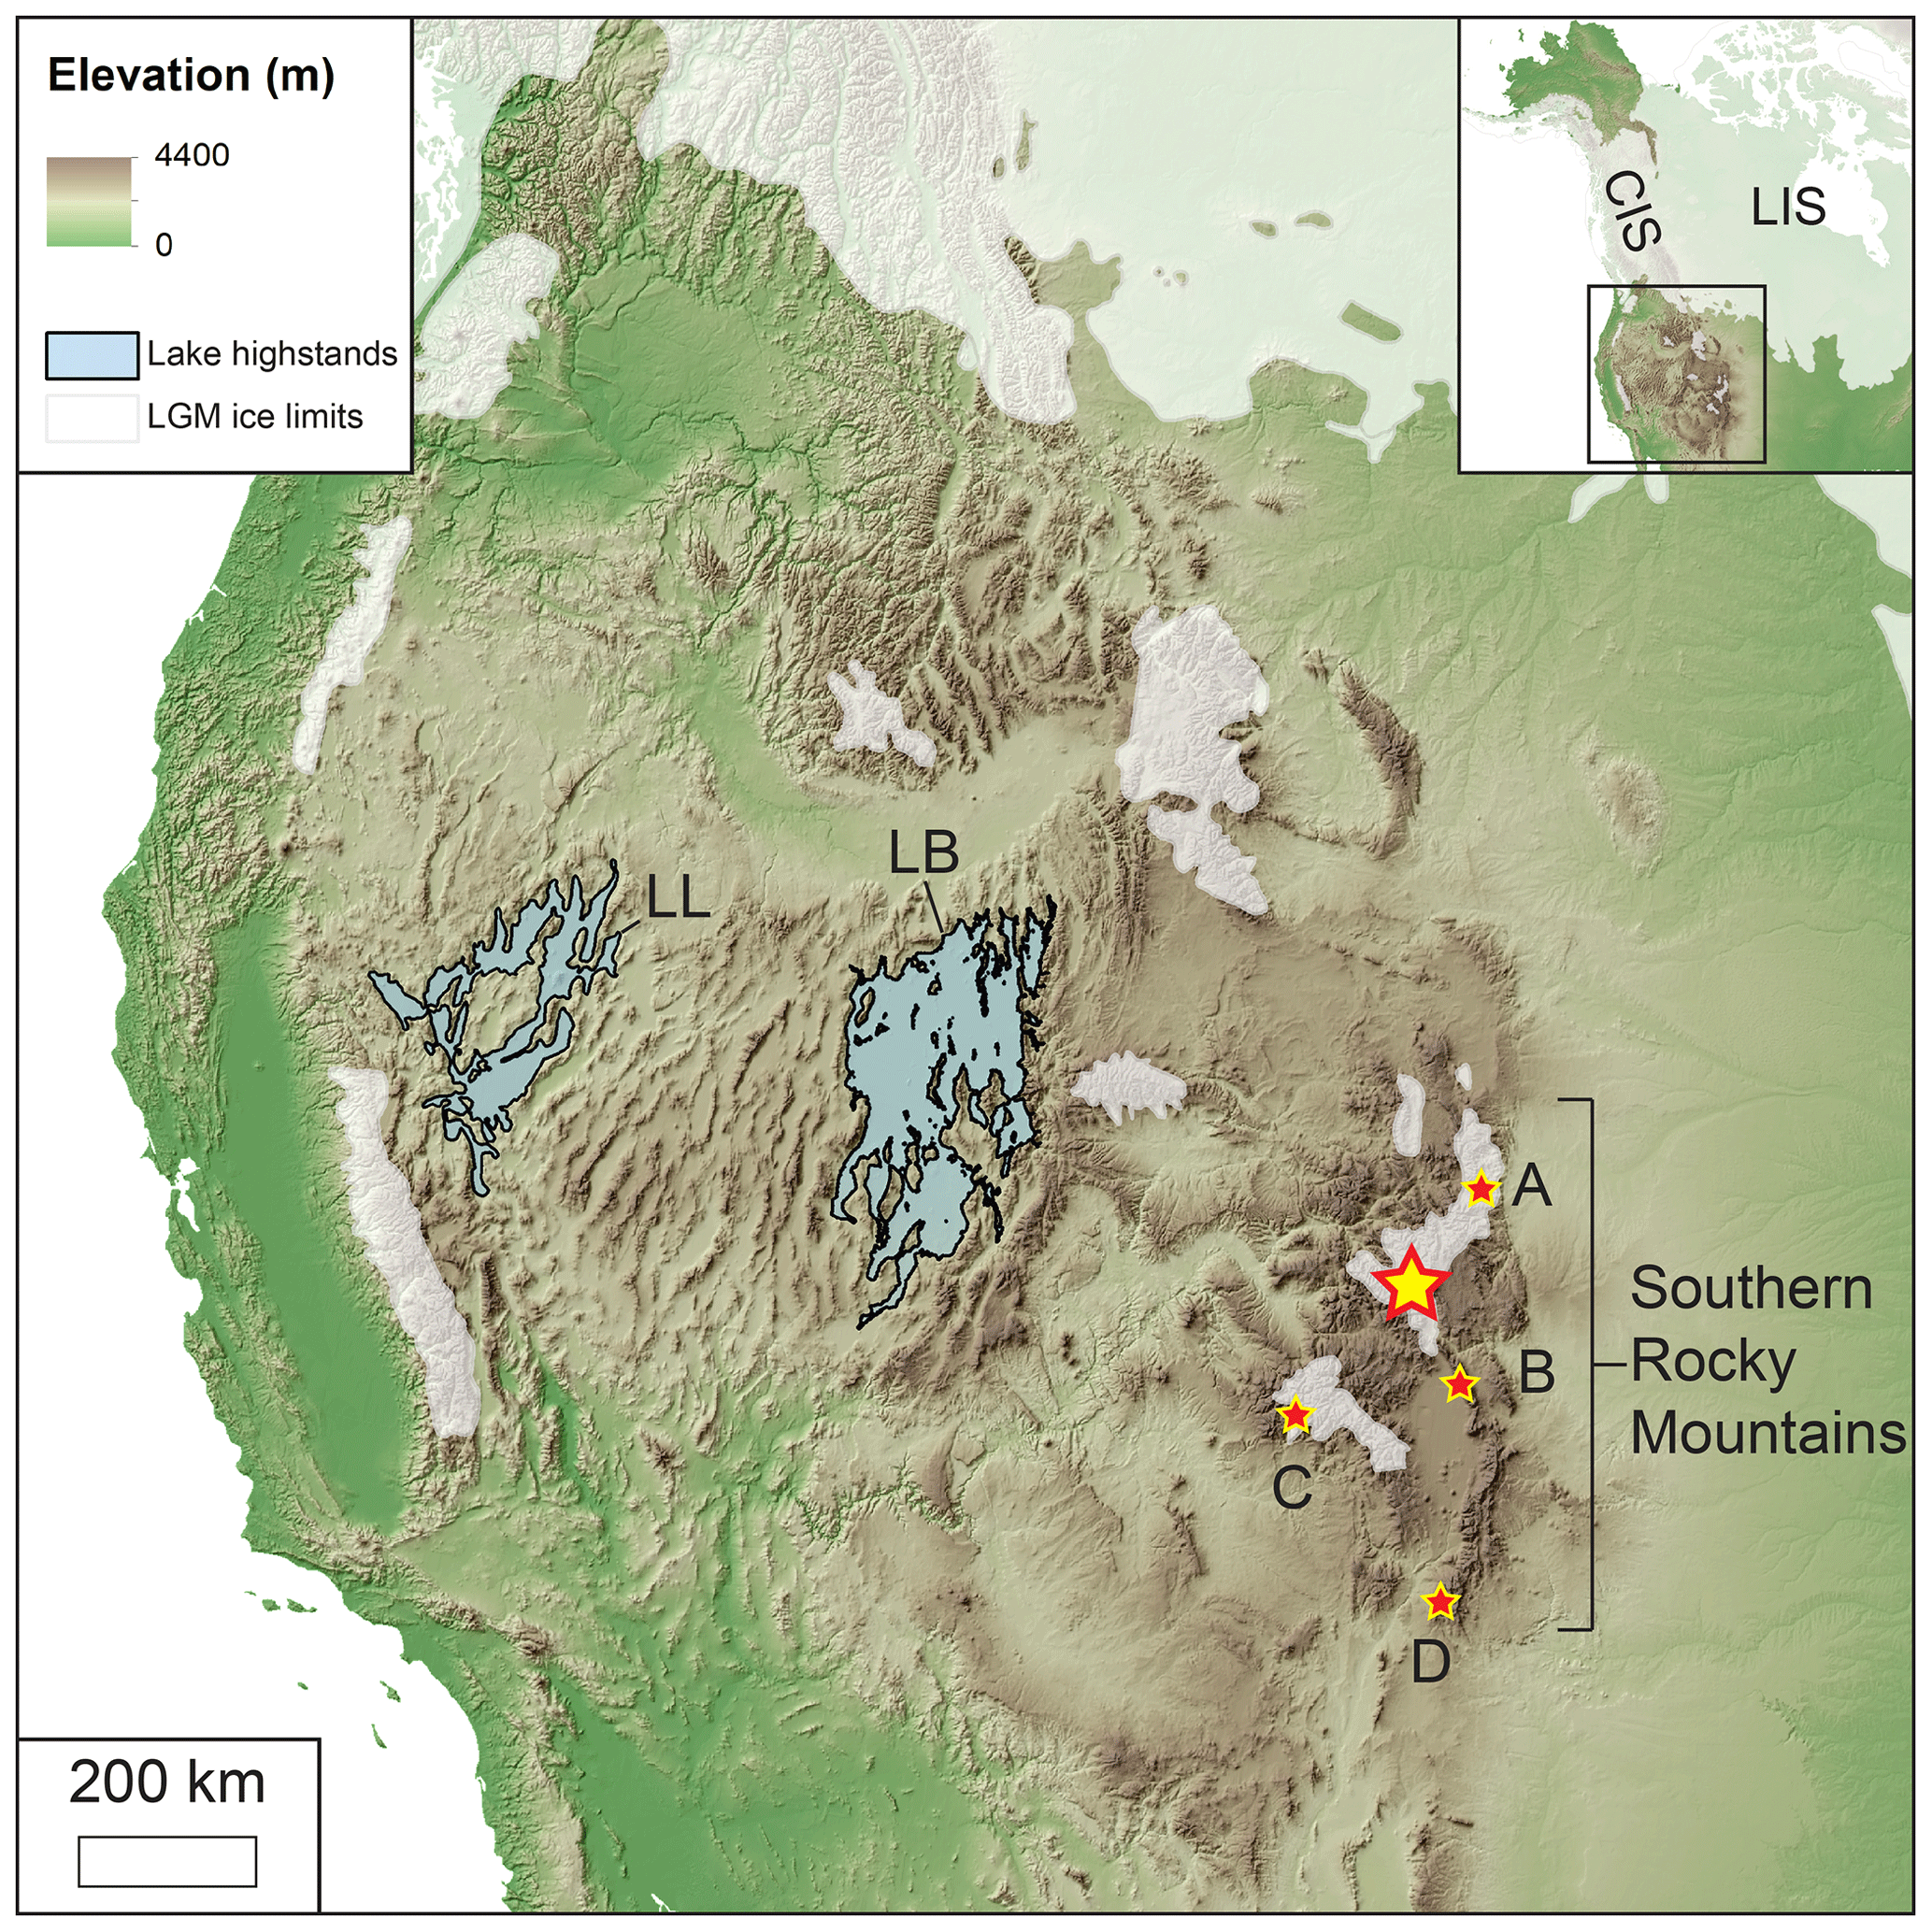
Figure 1Key moraine chronologies from the southern Rocky Mountains and locations of glaciation centers and large pluvial lakes in the western US following the Last Glacial Maximum (LGM). LL: Lake Lahontan, LB: Lake Bonneville, A: Colorado Front Range, B: Sangre de Cristo Mountains, C: San Juan Mountains, and D: Winsor Creek valley, New Mexico. The largest star corresponds to our field site in the Sawatch Range. LGM ice limits are from Dalton et al. (2020). The inset is of the western portion of North America. CIS: Cordilleran Ice Sheet, LIS: Laurentide Ice Sheet.
Over a decade of work has resulted in detailed moraine chronologies in three adjacent alpine valleys in the Sawatch Range of central Colorado (Fig. 2; Briner, 2009; Young et al., 2011; Shroba et al., 2014; Leonard et al., 2017b; Schweinsberg et al., 2020). While these studies primarily focused on mapping and dating the range-front moraines and associated outwash terraces, a transect of ages from bedrock samples in Lake Creek valley (Fig. 2) documented rapid retreat between 15.6±0.7 and 13.7±0.2 ka (Leonard et al., 2017b; Schweinsberg et al., 2020). Schweinsberg et al. (2020) suggested a possible link between North Atlantic climate forcing and the rapid deglaciation observed in Lake Creek valley, but similar transects from adjacent valleys are lacking to bolster or refute this hypothesis.
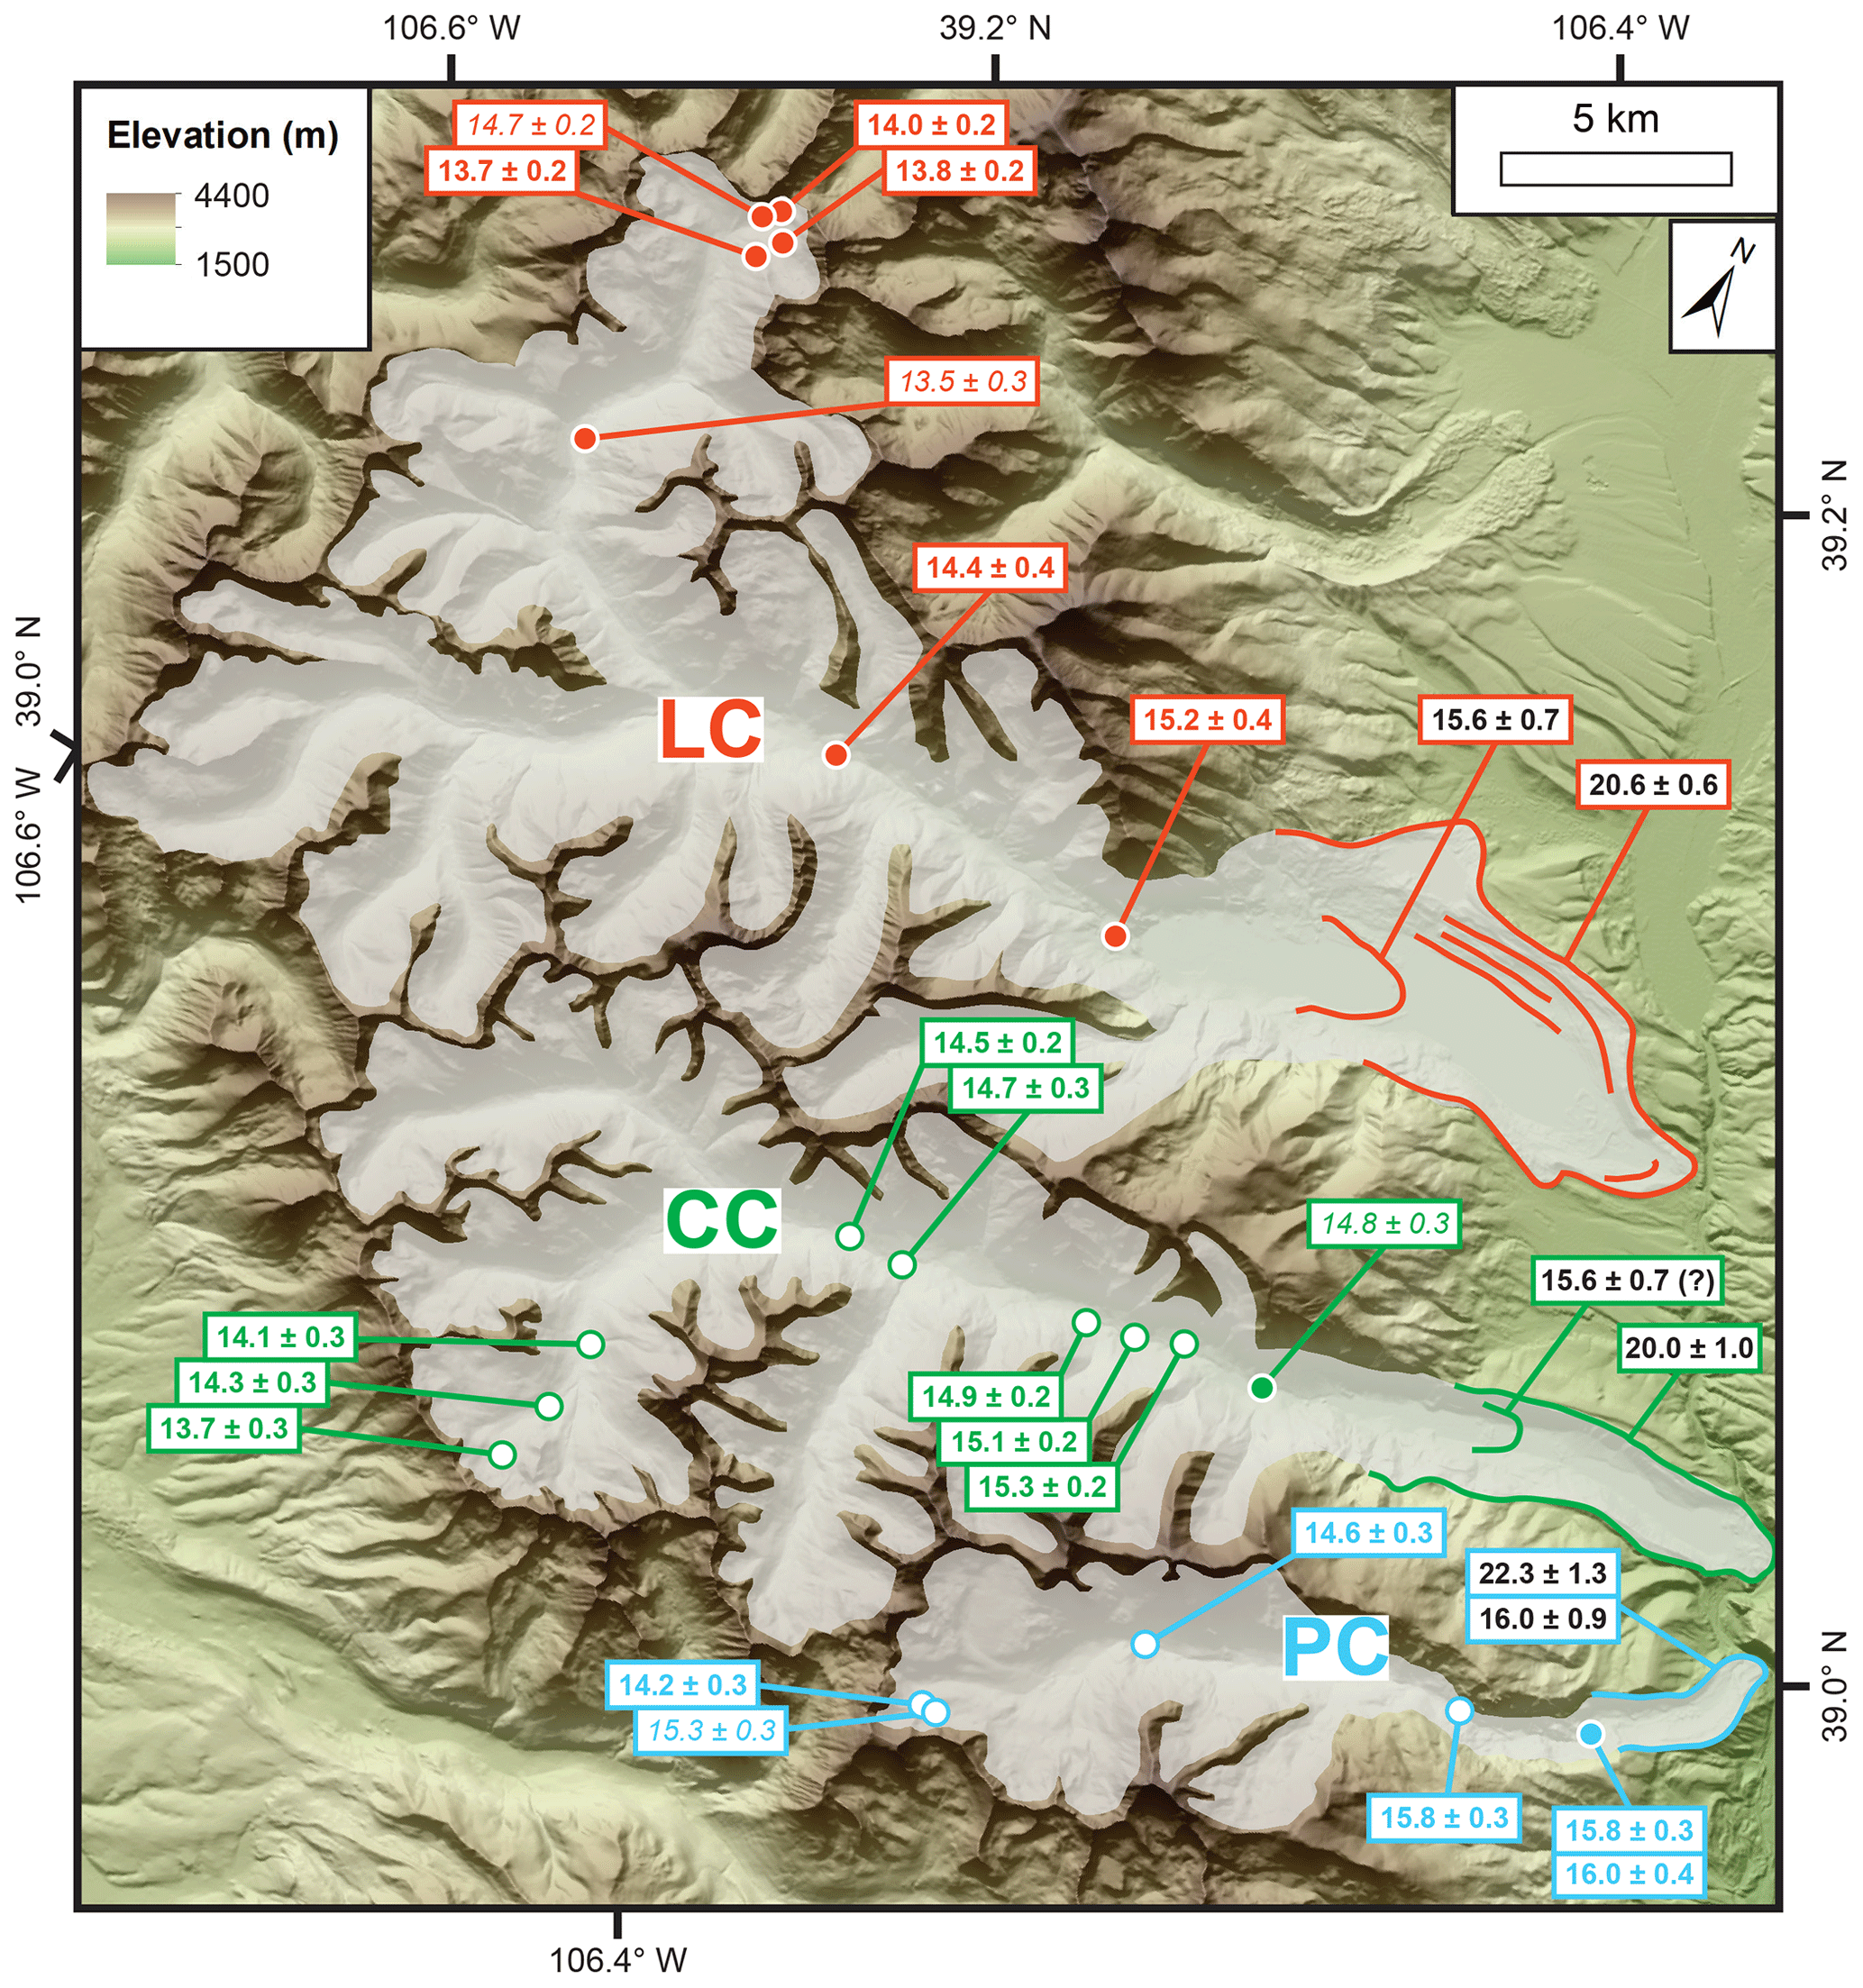
Figure 2Ice-sculpted bedrock 10Be ages from Lake Creek (LC; orange), Clear Creek (CC; green), and Pine Creek valleys (PC; blue). New ages are open circles and previously published ages are closed. Bedrock ages with italicized labels are suspected outliers. Included are LGM and recessional moraines (solid colored lines and labels with black text) with reported ages for the LGM moraines in all three valleys, including the younger mode in Pine Creek valley at 16.0±0.9 ka (n=7; Young et al., 2011) and a recessional moraine in Lake Creek valley at 15.6±0.7 ka (n=5; Schweinsberg et al., 2020). There is a similar, undated recessional moraine in Clear Creek valley that we hypothesize is also ∼16 ka. Ice-sculpted bedrock ages reported here include analytical uncertainty, and moraine ages are reported as the mean and 1 standard deviation. Glaciers at their mapped LGM extents are delineated in gray.
Here, we combine 12 new cosmogenic 10Be exposure ages with 10 previously published 10Be ages from bedrock samples along transects in three adjacent alpine valleys in the Sawatch Range, southern Rocky Mountains (Fig. 2). By dating bedrock sites along valley transects, we characterize the timing and pace of glacier retreat during the last deglaciation. We calculate rates of deglaciation for each valley with best-fit time–distance plotting using the R program BACON (Fig. 4). Our results suggest that glaciers in the Sawatch Range may have been influenced more heavily by regional forcing than by global CO2 concentrations.
The high peaks of south-central Colorado and northern New Mexico compose the southern end of the Rocky Mountain Range in North America and were home to many alpine glaciers during multiple glaciations throughout the Pleistocene (Fig. 1; Pierce, 2003; Leonard et al., 2017b; Marcott et al., 2019; Laabs et al., 2020; ages discussed below are recalculated using the Promontory Point production rate calibration of Lifton et al., 2015, and the LSDn scaling model of Lifton et al., 2014). Transects of 10Be ages from bedrock along valley axes exist for a few valleys in the upper Boulder Creek drainage in the Front Range, Colorado (Benson et al., 2004; Ward et al., 2009; Dühnforth and Anderson, 2011). While some evidence from the Boulder Creek drainages may suggest delayed deglaciation, chronologic scatter in the ages makes it difficult to determine the exact timing and how quickly glaciers retreated to their cirques. Existing ages from one valley, the Sangre de Cristo Range in south-central Colorado, suggest that a glacier there remained at or readvanced to near its LGM terminus at ∼16 ka but then retreated to its cirque in a period of ∼2 kyr (Leonard et al., 2017a). In the Animas River valley of the San Juan Mountains, southwest Colorado, existing 10Be ages indicate that glacier retreat began as early as ∼19 ka, with complete retreat of nearly 70 % of the total valley length beginning ∼16 ka and finishing by ∼12.7 ka (Guido et al., 2007). Relatively early initial retreat of the glacier in the Animas River valley is contingent on dating at a single site. Near Baldy Peak in northern New Mexico, LGM moraines and what appear to be cirque moraines have been surveyed in the Winsor Creek valley (Armour et al., 2002; Marcott et al., 2019). 10Be ages from the cirque, ∼4 km up-valley from the LGM moraines, range from 15.8 to 14.3 ka, suggesting that the glacier retreated to near its cirque within that interval. The recessional and LGM moraines remain undated so it is difficult to know when the glacier began retreating. In summary, while there is some chronologic scatter in ages from these sites, there is evidence to suggest that some glaciers in the southern Rocky Mountains remained relatively expanded through the beginning of the last deglaciation and were delayed in their retreat. However, once retreat was underway, all sites observed thus far reveal that glaciers completely retreated at least up to their cirques prior to the Younger Dryas cold period with no evidence for subsequent moraine deposition.
Prominent moraines originally mapped as part of the surficial geologic map of the Granite 7.5′ quadrangle (updated by Shroba et al., 2014) exist at the mouths of multiple glacially sculpted valleys within the Sawatch Range (e.g., Briner et al., 2009; Young et al., 2011; Brugger et al., 2019a; Schweinsberg et al., 2020). Of these, moraines deposited at the mouths of three adjacent valleys, Lake Creek, Clear Creek, and Pine Creek, have been thoroughly surveyed and dated (Fig. 2; Briner, 2009; Young et al., 2011; Schweinsberg et al., 2020). The moraine chronologies reported thus far reveal that following the LGM (which culminated between ∼22 and 19 ka), a recessional moraine at 82 % of the LGM position sampled in the Lake Creek system was deposited at 15.6±0.7 ka (Schweinsberg et al., 2020). There is a similar-appearing moraine at 83 % of the LGM position in Clear Creek valley. Although it is undated, we tentatively correlate this moraine in Clear Creek valley with the moraine dated to 15.6±0.7 ka in Lake Creek valley. Finally, there is no recessional moraine in Pine Creek valley, but a cluster of ages at 16.0±0.9 ka from the LGM moraine suggest that the glacier readvanced to or remained at its LGM extent until nearly the same time when glaciers in the other two valleys deposited recessional moraines (Briner, 2009; Young et al., 2011). Young et al. (2011) argued that since all three glaciers are east-facing and in close proximity – yet show differences in the timing of LGM culmination between the valleys – it is possible that non-climatic factors, such as glacier hypsometry, may have influenced the timing and extent of LGM culminations. While there are preexisting 10Be ages measured in a transect along Lake Creek Valley that track the retreat of the glacier through the last deglaciation, the other two valleys have not yet been surveyed. As such, it remains unclear if glacier hypsometry also influenced the timing and pace of deglaciation between all three adjacent valleys.
Sample collection for 10Be dating from Clear Creek and Pine Creek valleys was conducted in the summers of 2017 and 2018. A total of 12 samples were collected from exposed, glacially sculpted bedrock surfaces along the Clear Creek (n=8) and Pine Creek (n=4) valley floors, spanning from just within range-front moraines up to each respective cirque (Figs. 2 and 3). Bedrock surfaces located in the bottoms of valley floors – where glacial erosion is maximized – were specifically targeted since the potential for incomplete scouring of these surfaces can lead to inherited nuclides and ages that are older than expected.
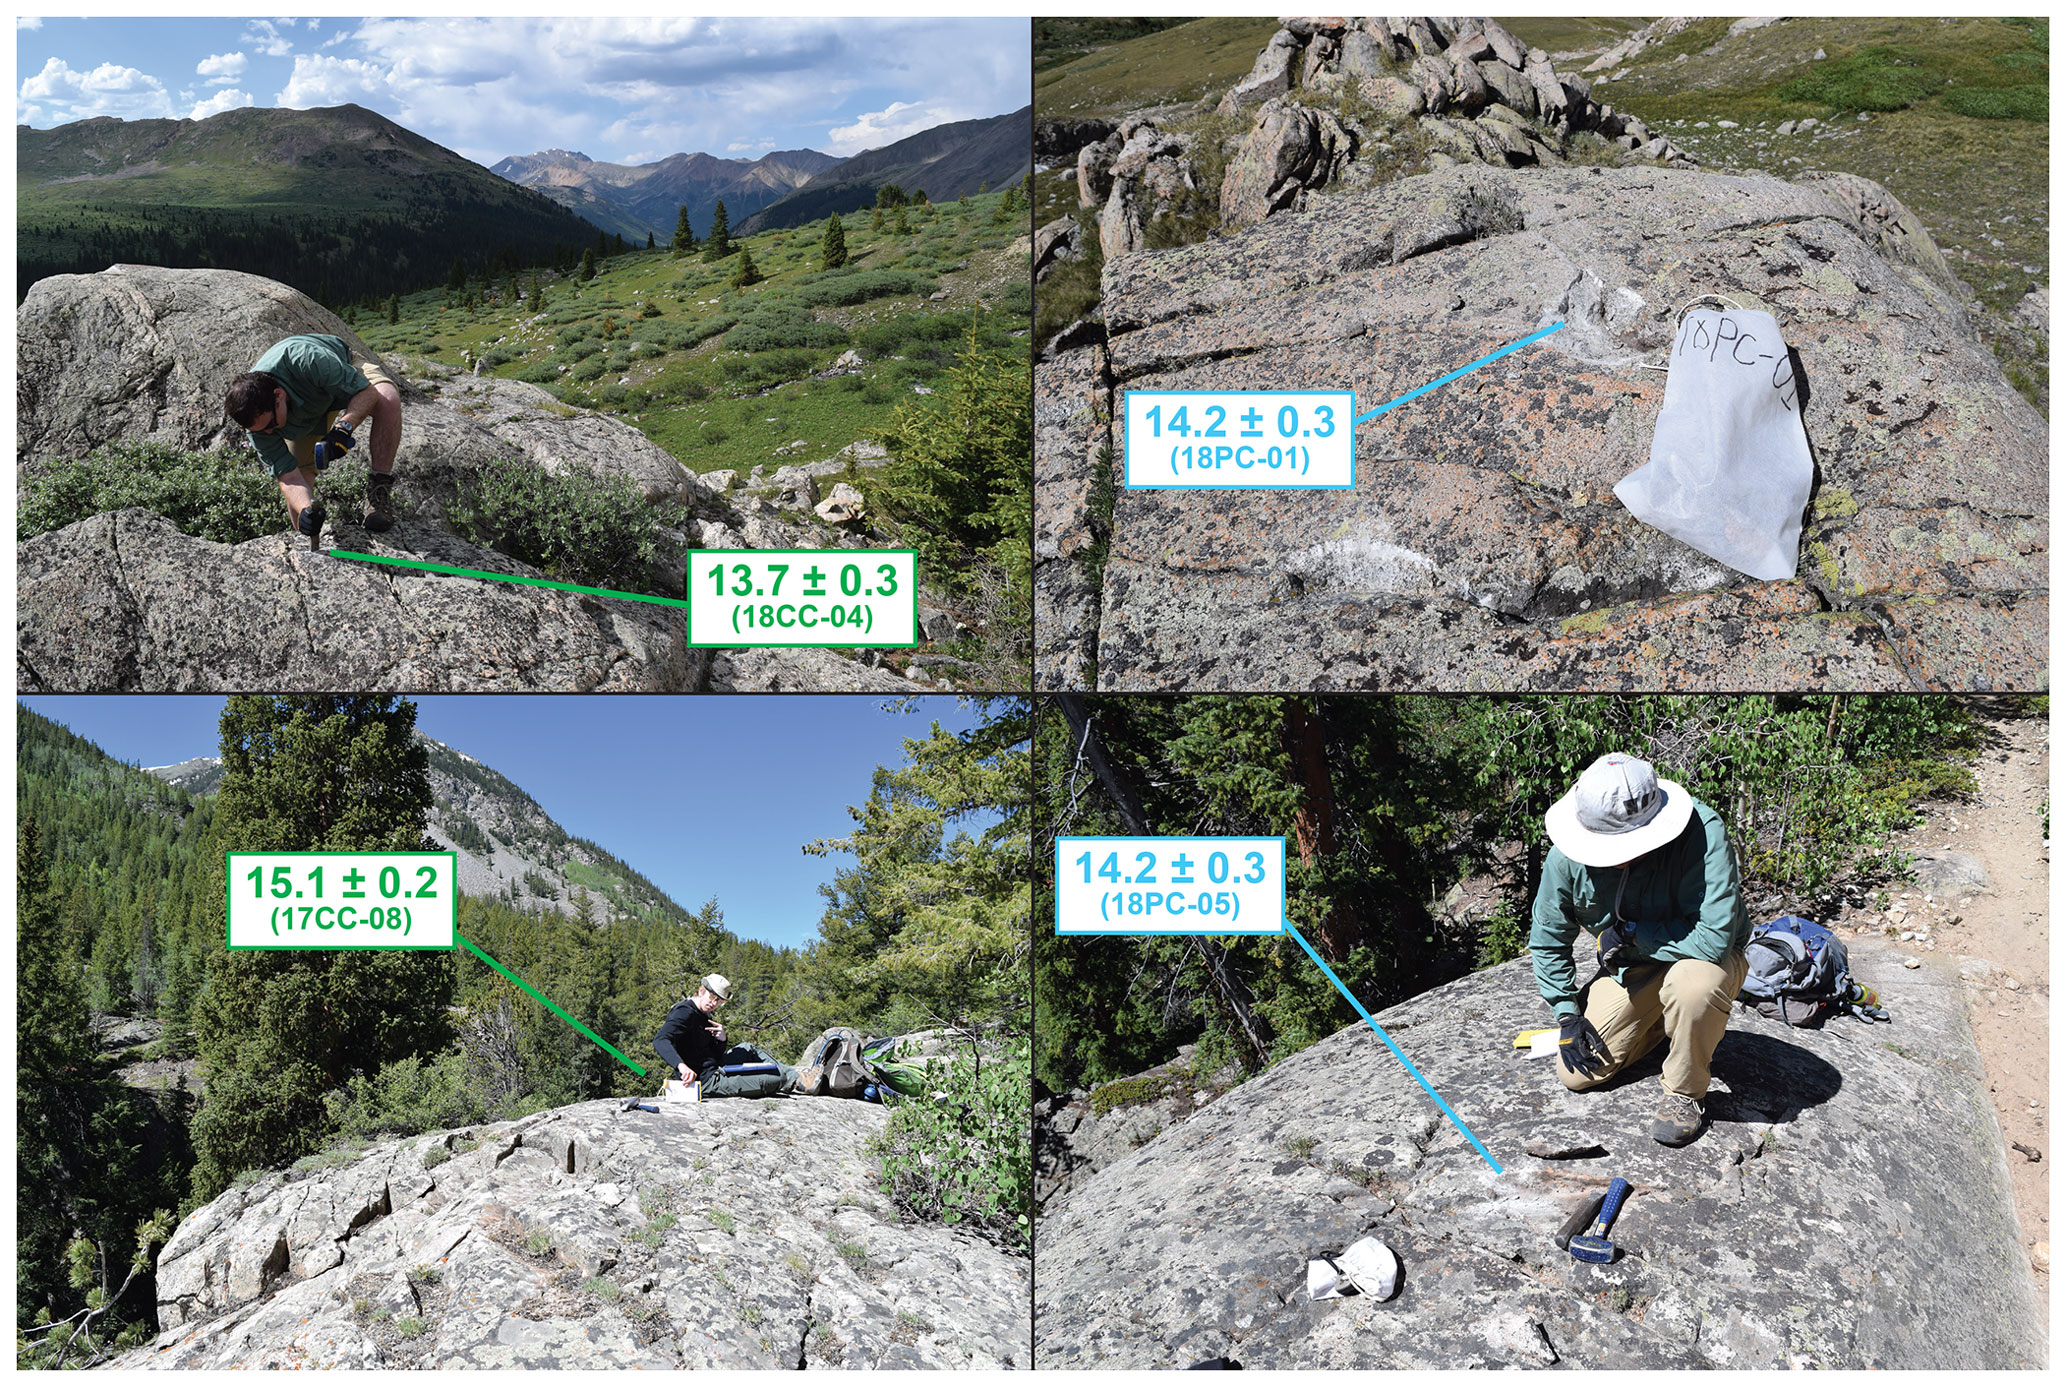
Figure 3Field photos of ice-sculpted bedrock surfaces from selected locations. Clockwise from top left: 18CC-04, 18PC-01, 18PC-05, 17CC-08. The color scheme for ages matches Figs. 2 and 4: Clear Creek valley samples are in green; Pine Creek valley samples are in blue.
Samples were processed at the University at Buffalo Cosmogenic Isotope Laboratory following the versions of quartz purification and beryllium extraction procedures refined at the University of Vermont (Corbett et al., 2016). After quartz purification, samples were dissolved in acid along with a 9Be carrier spike in two batches each with a process blank. Beryllium was then purified and extracted, oxidized, and packed into targets for measurement at the Center for Accelerated Mass Spectrometry at Lawrence Livermore National Laboratory. 10Be∕9Be ratios were measured and standardized to the reported 07KNSTD3110 ratio of (Nishiizumi et al., 2007). For samples collected in 2018, the process blank 10Be∕9Be ratio was , and for samples collected in 2017 the process blank 10Be∕9Be ratio was (see Table 1 for details on sample collection dates). Our 12 ages and 10 previously published ages were calculated using the Cronus Earth online calculator (developmental version 3; https://hess.ess.washington.edu/math/index_dev.html, last access: 12 April 2020; Balco et al., 2008). We calculate ages using the Promontory Point production rate (Lifton et al., 2015) and the LSDn scaling model (Lifton et al., 2014) – a combination used extensively throughout the western US (e.g., Licciardi and Pierce, 2018; Quirk et al., 2018; Brugger et al., 2019b; Schweinsberg et al., 2020). Below, we discuss in more detail how different production rate calibrations and scaling schemes impact our results. We do not attempt to make any corrections for snow cover or post-depositional bedrock surface erosion.
Table 1Sample data and 10Be ages.
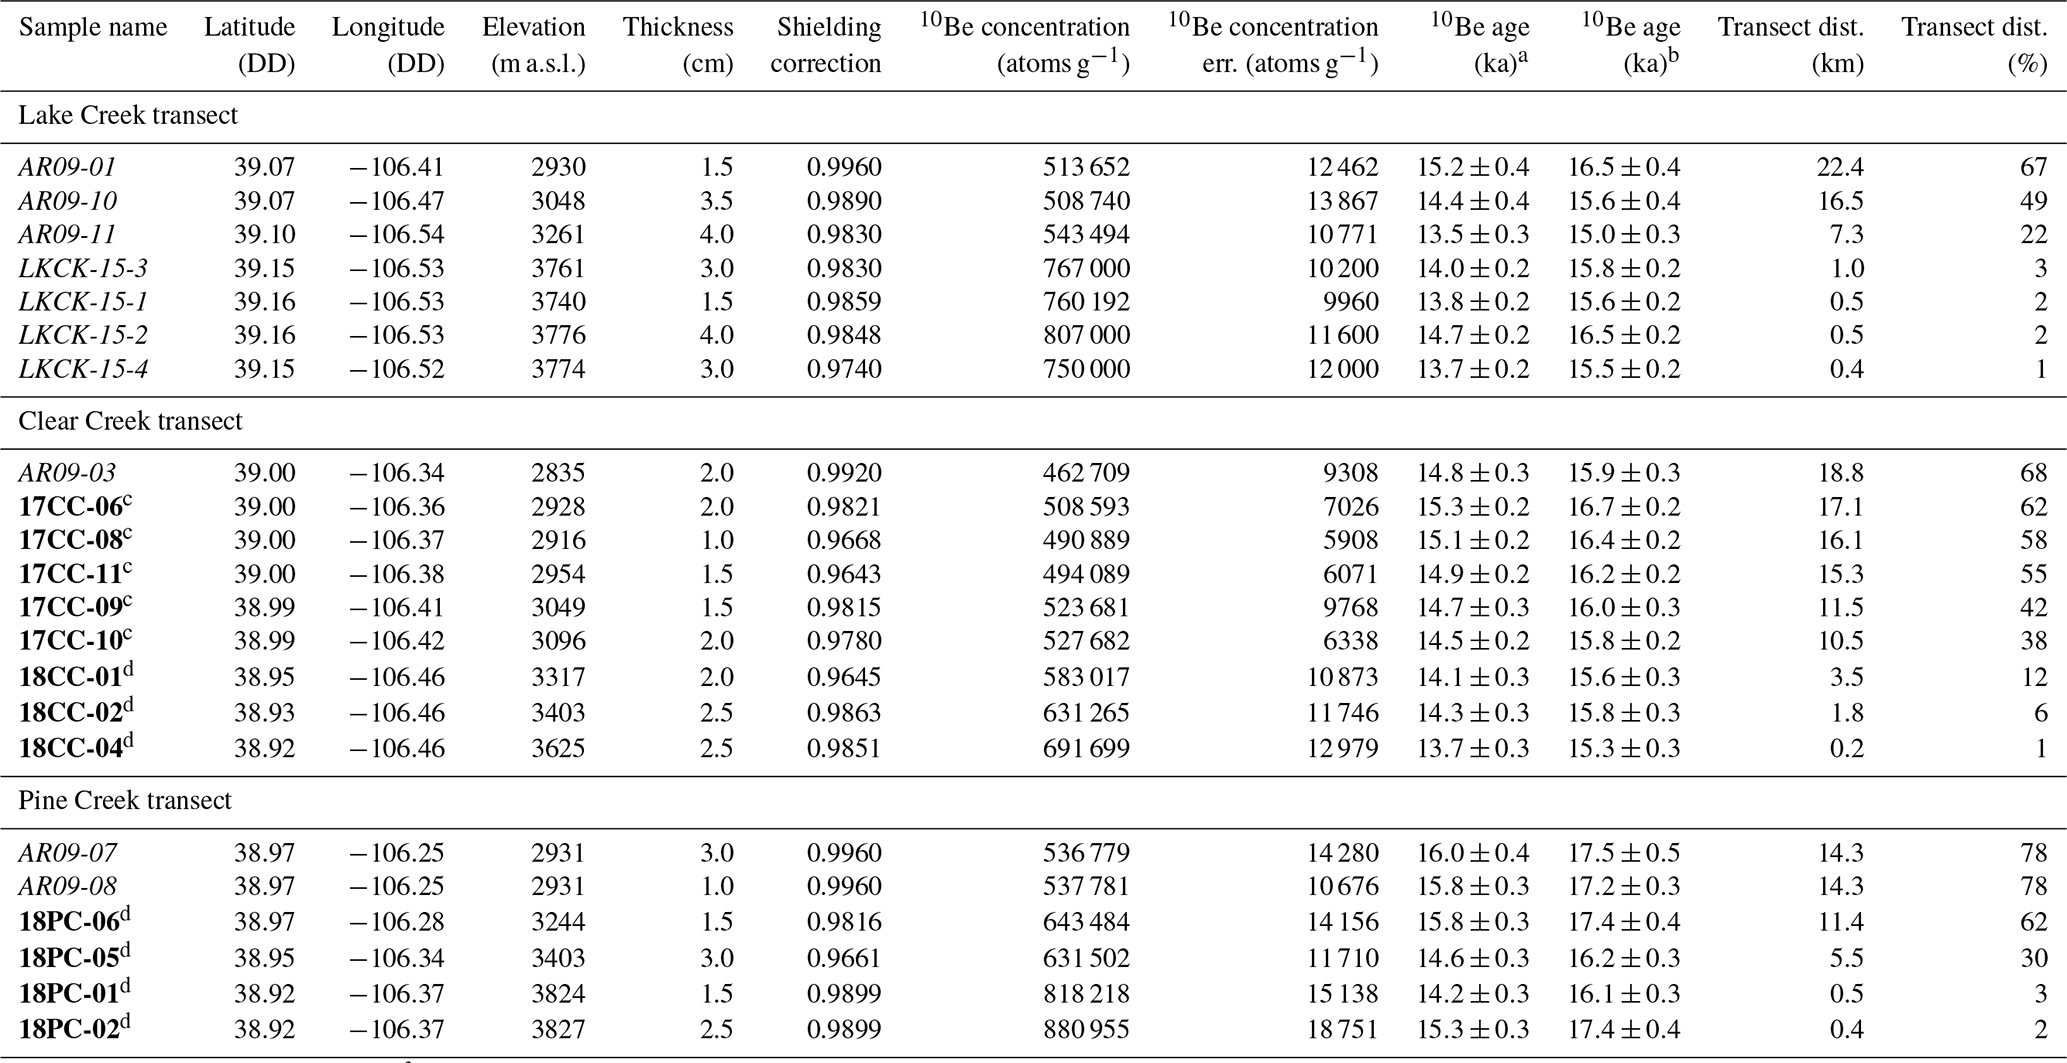
Notes: rock density for all samples is 2.65 g cm3; zero surface erosion rate applied to all samples. Sample names of previously published ages are italicized, and sample names for new ages are in bold. a Ages calculated using the Promontory Point production rate calibration (Lifton et al., 2015) and LSDn scaling (Lifton et al., 2014). b Ages calculated using the northeast North America production rate calibration (Balco et al., 2009) and Lm scaling (Lal, 1991; Stone, 2000). c Process blank for the following samples was (atoms g−1). d Process blank for the following samples was (atoms g−1).
To calculate retreat rates, we used the BACON program in R (Blaauw and Christen, 2011). This program generates age–depth models for stratigraphic records based on chronologic constraints at various depths. Here, we use the 10Be ages and their 1-sigma internal uncertainties measured in each valley as the age input and the geographic coordinates of each age as the depth inputs. The position along the valley floor is scaled such that the toe of the glacier at the LGM is the starting point (e.g., 100 % or maximum length), and the base of each valley's cirque wall is the end point (e.g., 0 % or minimum length). The model then interpolates between each point using Bayesian analysis and the geologic principle of superposition to build an age–length model with an unweighted statistical treatment of uncertainty. The interpolation between points is smoothed (i.e., nonlinear) based on retreat rates at previous positions. The retreat rates presented here are net retreat rates because it is possible there may have been short-lived readvances that did not lead to significant moraine deposition. BACON outputs a time series of age–length points and non-Gaussian 95 % confidence intervals. Calculated retreat rates are assumed to be linear, and we report the 95 % uncertainty range.
The 12 new sculpted-bedrock 10Be ages reported here range 15.8±0.3–13.7±0.3 ka (Fig. 2; Table 1). Combined with the previously published samples in our study area, all 22 sculpted-bedrock 10Be ages, which span from immediately inboard of the innermost moraine to the cirque floors, range between 16.0±0.4 and 13.5±0.3 ka (Fig. 2, Table 1). In Lake Creek valley, seven ages span 67 %–1 % of the distance of the valley floor, ranging between 15.2±0.4 and 13.5±0.3 ka. Nine 10Be ages spanning 68 %–1 % in Clear Creek valley range between 15.3±0.2 and 13.7±0.2 ka. In Pine Creek valley, six 10Be ages span 78 %–3 % and range between 16.0±0.4 and 14.2±0.3 ka.
Most ages in each valley are in stratigraphic order and fall within the 95 % confidence interval calculated in BACON, except for four ages (Fig. 4). Ages from Lake Creek valley suggest the glacier retreated from its recessional moraine position (82 %) at 15.6±0.7 ka and reached its cirque (∼1 %) by 13.7±0.2 ka. Clear Creek valley ages suggest the glacier retreated from its recessional moraine position (83 %) at 15.6±0.7 ka and reached its cirque (∼1 %) by 13.7±0.3 ka. Finally, Pine Creek valley ages suggest the glacier was at its LGM extent (100 %) until 16.0±0.9 ka and then retreated to its cirque (∼3 %) by 14.2±0.2 ka.
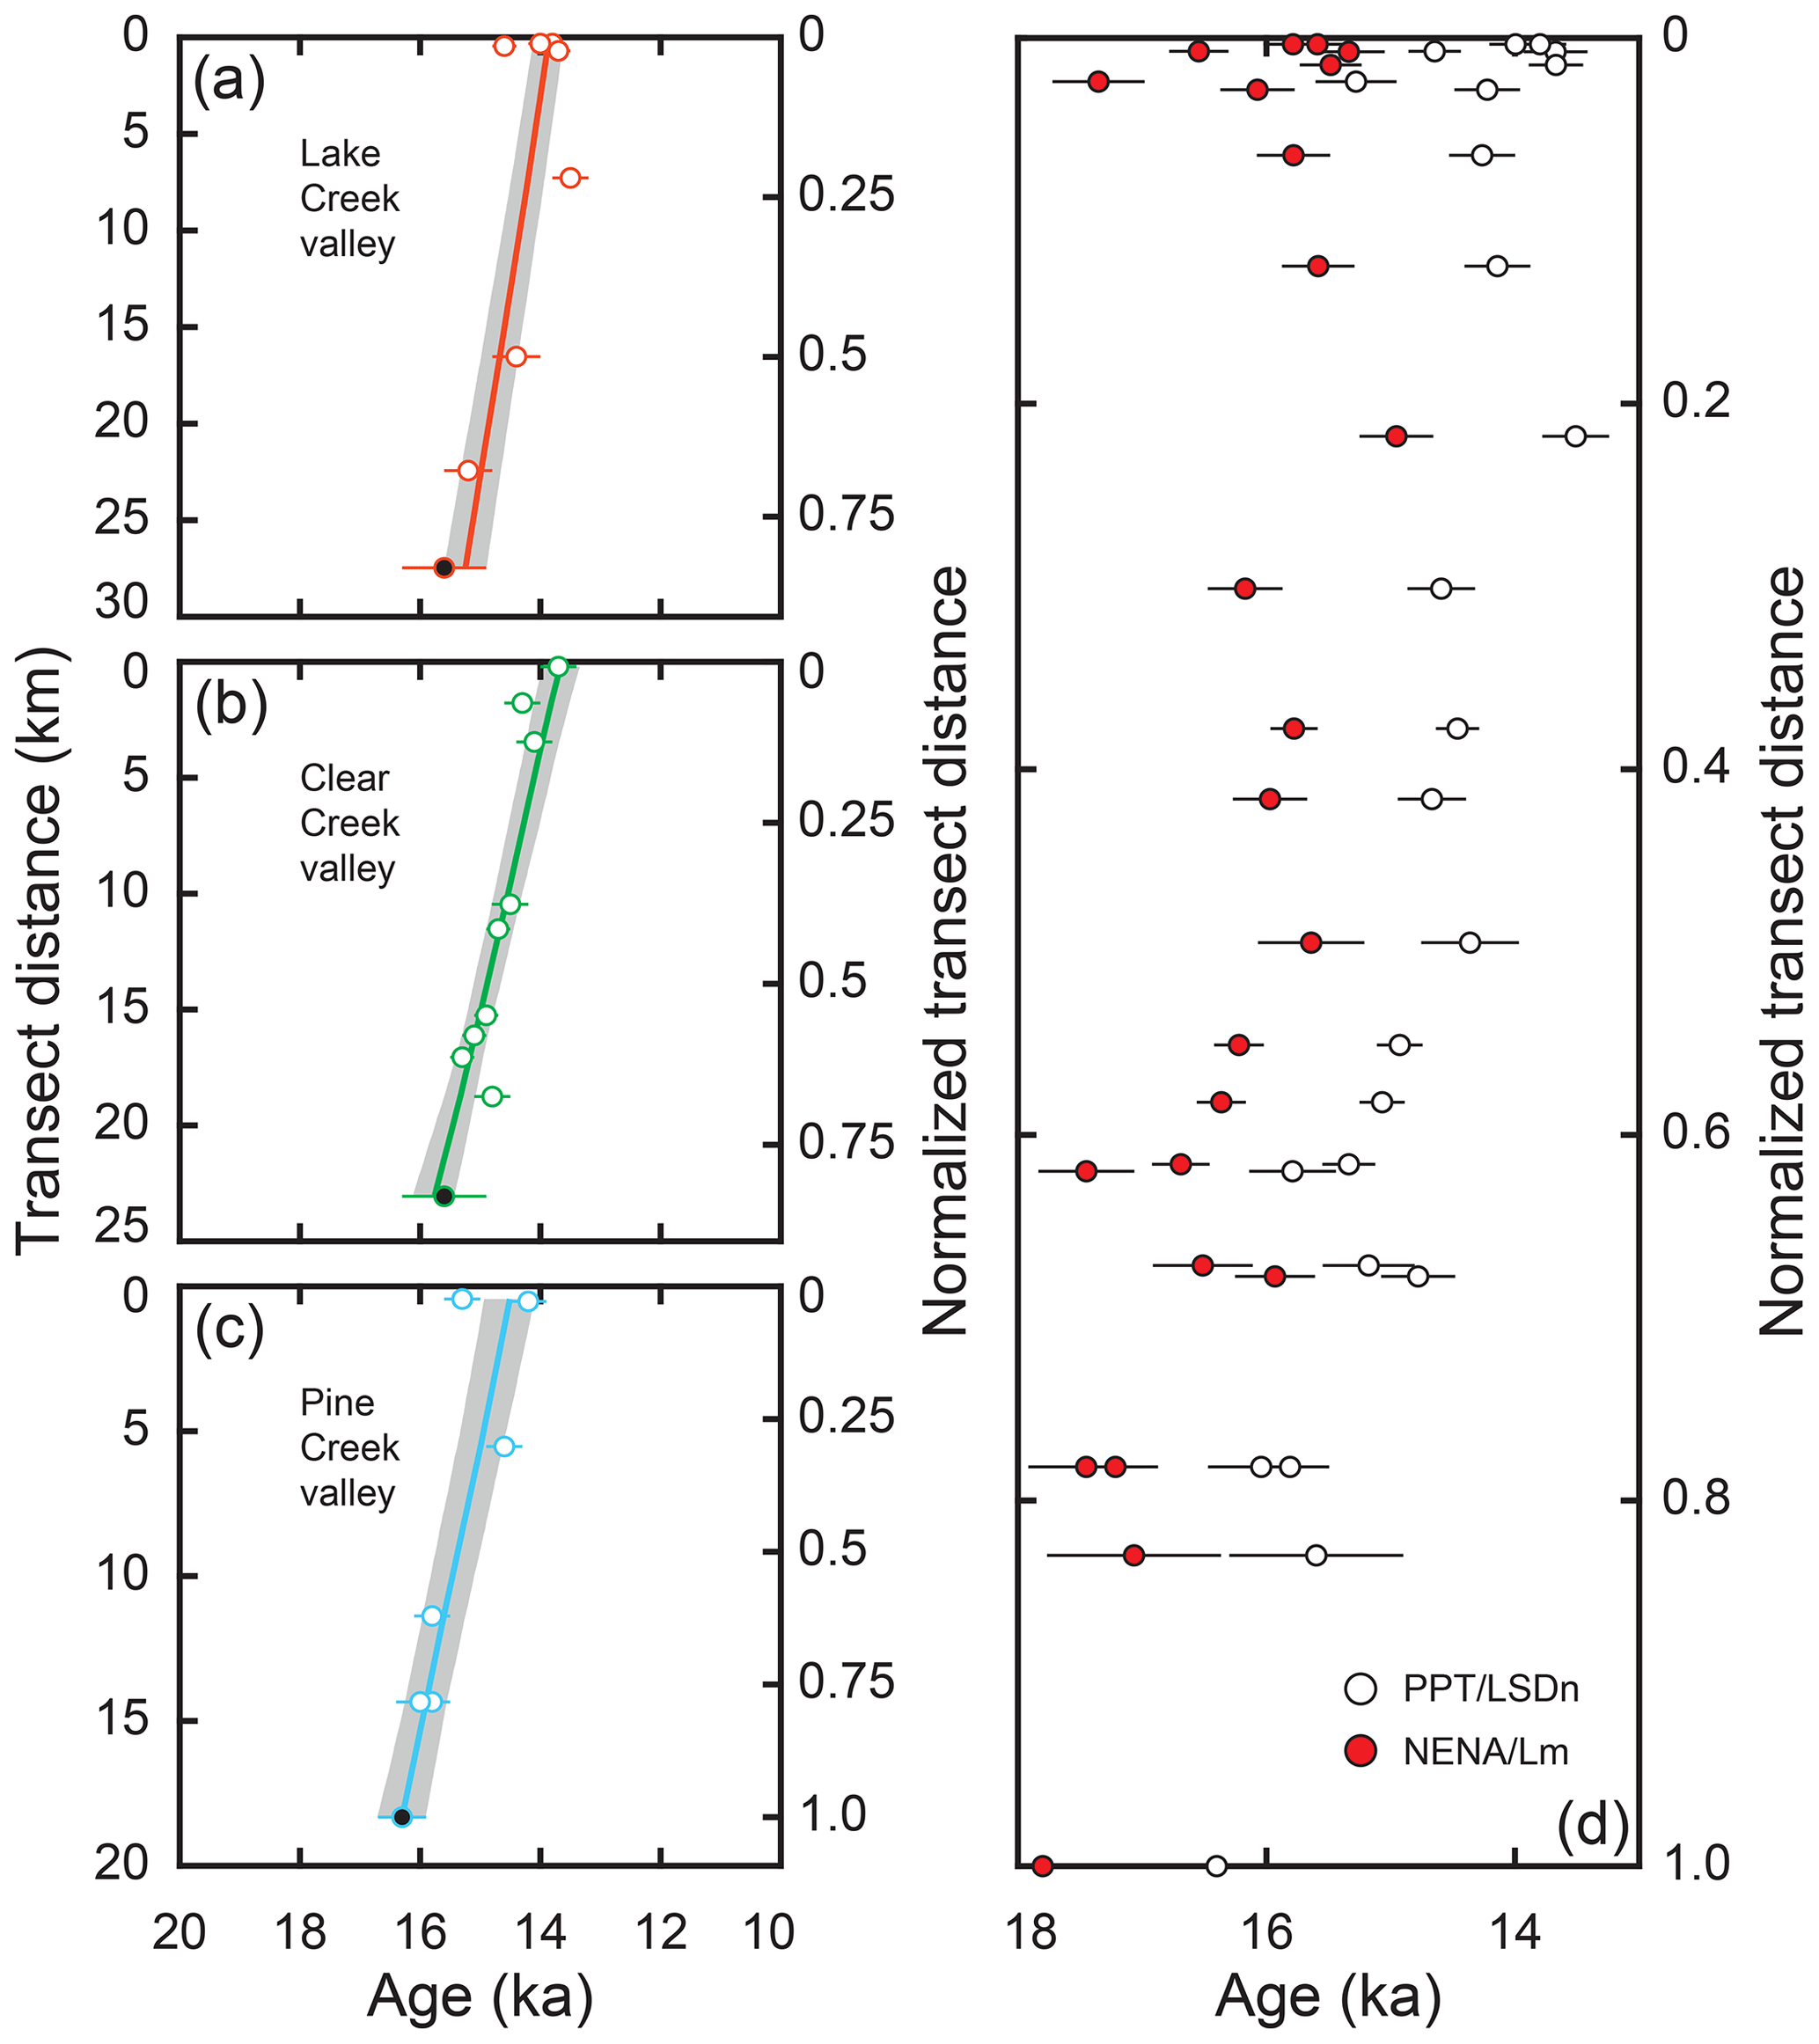
Figure 4Summary plots of 10Be ages and BACON statistical analysis results. (a) Lake Creek valley (orange), (b) Clear Creek valley (green), and (c) Pine Creek valley (blue). Ages in solid black fill at the bottom of each transect are from recessional moraine ages (Young et al., 2011; Schweinsberg et al., 2020). BACON results are mean (color lines) and 95 % confidence intervals (gray shading). The left y axes are total valley-floor distances from the LGM moraine to the base of each respective cirque headwall (note that scales are different because valley lengths are different). The right y axes are the same but normalized values; 1 indicates the LGM moraine position and 0 the base of the cirque headwall. (d) Distribution of all ages using the PPT (Lifton et al., 2015) and LSDn (Lifton et al., 2014) as well as the NENA (Balco et al., 2009) and Lm (Lal, 1991; Stone, 2000) production rate calibration and scaling scheme combinations. All other reasonable combinations mentioned in the text produce ages that fall somewhere between the ages calculated using the PPT–LSDn and NENA–Lm combinations.
Results from BACON analysis suggest that the net retreat rate for the glacier in Lake Creek valley between 15.6±0.7 ka (Schweinsberg et al., 2020) and 13.7±0.2 ka ranges 35.6–13.8 m a−1 at 95 % confidence (Fig. 4). The net retreat rate calculated from BACON for the glacier in Clear Creek valley between 15.6±0.7 and 13.7±0.3 ka ranges 15.5–8.2 m a−1 at 95 % confidence. Finally, the net retreat rate for the glacier in Pine Creek valley from the LGM position at 16.0±0.9 ka (Young et al., 2011) to 14.2±0.3 ranges 18.3–6.8 m a−1 at 95 % confidence. Removal of potential outliers reduces retreat rates by 1.7 %, 2.7 %, and 6 % for Lake Creek, Clear Creek, and Pine Creek valleys, respectively. The calculated average valley gradients for each valley – measured as the elevation change divided by the horizontal length of each valley bottom transect from the LGM moraine up to the base of each respective cirque – are 29 m km−1 for Lake Creek valley, 37 m km−1 for Clear Creek valley, and 65 m km−1 for Pine Creek valley.
5.1 Reliability of bedrock ages
While most bedrock ages along each valley transect are in stratigraphic order, we find four ages that do not comply with stratigraphic order and fall outside the 95 % confidence interval of the retreat rates calculated from BACON. For example, in Lake Creek valley, one age at 13.5±0.3 ka is younger than all up-valley ages, which average 13.8±0.2 ka (excluding one possible outlier outside the BACON 95 % confidence interval). In Clear Creek valley, the age from the farthest down-valley site of 14.8±0.3 ka may be a possible outlier because the next three ages up-valley are all older and in stratigraphic order, the oldest of which is 15.3±0.2 ka. Finally, one age from the Pine Creek cirque of 15.3±0.3 ka may be an outlier because it is older than the next age down-valley (14.6±0.3 ka) and a second sample from the cirque of 14.2±0.3 ka. Two suspected outliers are older than expected, which may have been caused by insufficient glacial erosion. The two remaining potential outliers are younger than expected, which could have resulted from excessive soil and snow cover, enhanced post-depositional bedrock surface erosion, or a combination of these factors.
Although we interpret our results using the Promontory Point production rate calibration site (Lifton et al., 2015) and the LSDn scaling scheme (Lifton et al. 2014), we calculate exposure ages with other commonly used calibration sites (e.g., northeastern North America NENA from Balco et al., 2009, and the “global” production rate from Borchers et al., 2016) and another commonly used scaling scheme (Lal/Stone Lm scaling; Lal, 1991; Stone, 2000). Samples used for the NENA production rate calibration range in elevation between ∼50 and 400 m a.s.l. and are located ∼3000 km northeast of the Sawatch Range. This combination produces the oldest ages, given the previously mentioned reasonable production rate calibrations and scaling schemes, that are between 9 % and 12 % older than when using PPT–LSDn (all other combinations fall somewhere between; Fig. 4; Table 1). We do not feel confident in calculating exposure ages using other production rate calibration sites since the sites in closest proximity likely shared the most similar exposure histories. Ultimately, we favor the Promontory Point production rate calibration site (Lifton et al., 2015) because the site is closest in both location (the site is ∼600 km from the Sawatch Range) and elevation (sample elevations are ∼1600 m a.s.l.) to our study area.
5.2 The last deglaciation of the Sawatch Range and the southern Rocky Mountains
The pattern of deglaciation in both Clear Creek valley and Pine Creek valley appears to follow the pattern previously observed in Lake Creek valley (Young et al., 2011; Leonard et al., 2017b; Schweinsberg et al., 2020). All three glaciers remained at – or readvanced to – (100 %) or near (82 %–83 %) their LGM extents between 16.0 and 15.6 ka, after which all three glaciers rapidly retreated to their cirques within the next ∼2 kyr at rates ranging between 35.6 and 6.8 m a−1. It is possible that the glacier in Pine Creek valley began retreating ∼500 years earlier than the other two glaciers and likewise completely deglaciated ∼500 years earlier. Pine Creek valley is shorter and steeper than the other two valleys. Thus, it is possible that variations in valley hypsometry between Pine Creek valley and the other two valleys may have caused the slight difference in their deglaciation histories (Young et al., 2011). We also observe that Pine Creek valley has the steepest average valley gradient and generally the slowest net retreat rate, which is predictably a direct result of valley hypsometry since glacier lengths in steeper valleys generally adjust less to equivalent changes in equilibrium line altitude (ELA). On the other hand, glaciers occupying the lower-gradient Lake Creek and Clear Creek valleys experienced generally higher reconstructed rates of retreat. Regardless, we find that while Pine Creek may have initiated ∼500 years sooner than the other two, all three valleys were in a period of ∼1–1.5 kyr synchronous retreat once the other two glaciers began retreating. We conclude that while there may have been some hypsometric influences on the timing of deglaciation across our study site, evidence suggests that these influences did not keep the glaciers from synchronously retreating during a majority of their deglaciation. We find that all three valley glaciers did not begin significantly retreating until ∼5–6 kyr after the culmination of the LGM in the Sawatch Range (since we assume that boulder ages on both LGM and recessional moraines represent the timing of moraine abandonment). However, once glacier retreat initiated, deglaciation was completed within ∼2 kyr.
From the existing records in the southern Rocky Mountains synthesized above, we find that the pattern of deglaciation observed in the Sawatch Range was consistent in a few but not all sites across the region. Collecting more records of alpine deglaciation in the southern Rocky Mountains may be necessary to further test which pattern, if any, is the dominant pattern of deglaciation in the region.
5.3 Drivers of southern Rocky Mountain deglaciation
Records of global climate change over the last deglaciation suggest a link between rising CO2 concentrations and global temperature (Denton et al., 2010; Shakun et al., 2012; Putnam et al., 2013; Fig. 5). However, there is noticeable spatial heterogeneity in both the timing and magnitude of warming through the last deglaciation that cannot be attributed to global CO2 forcing alone (e.g., Clark et al., 2012). We find that the initiation of significant deglaciation in some locations across the southern Rocky Mountains lagged rising CO2 concentrations by as much as ∼2–3 kyr (Fig. 5), which suggests these glaciers were more likely influenced by regional forcings rather than global CO2.
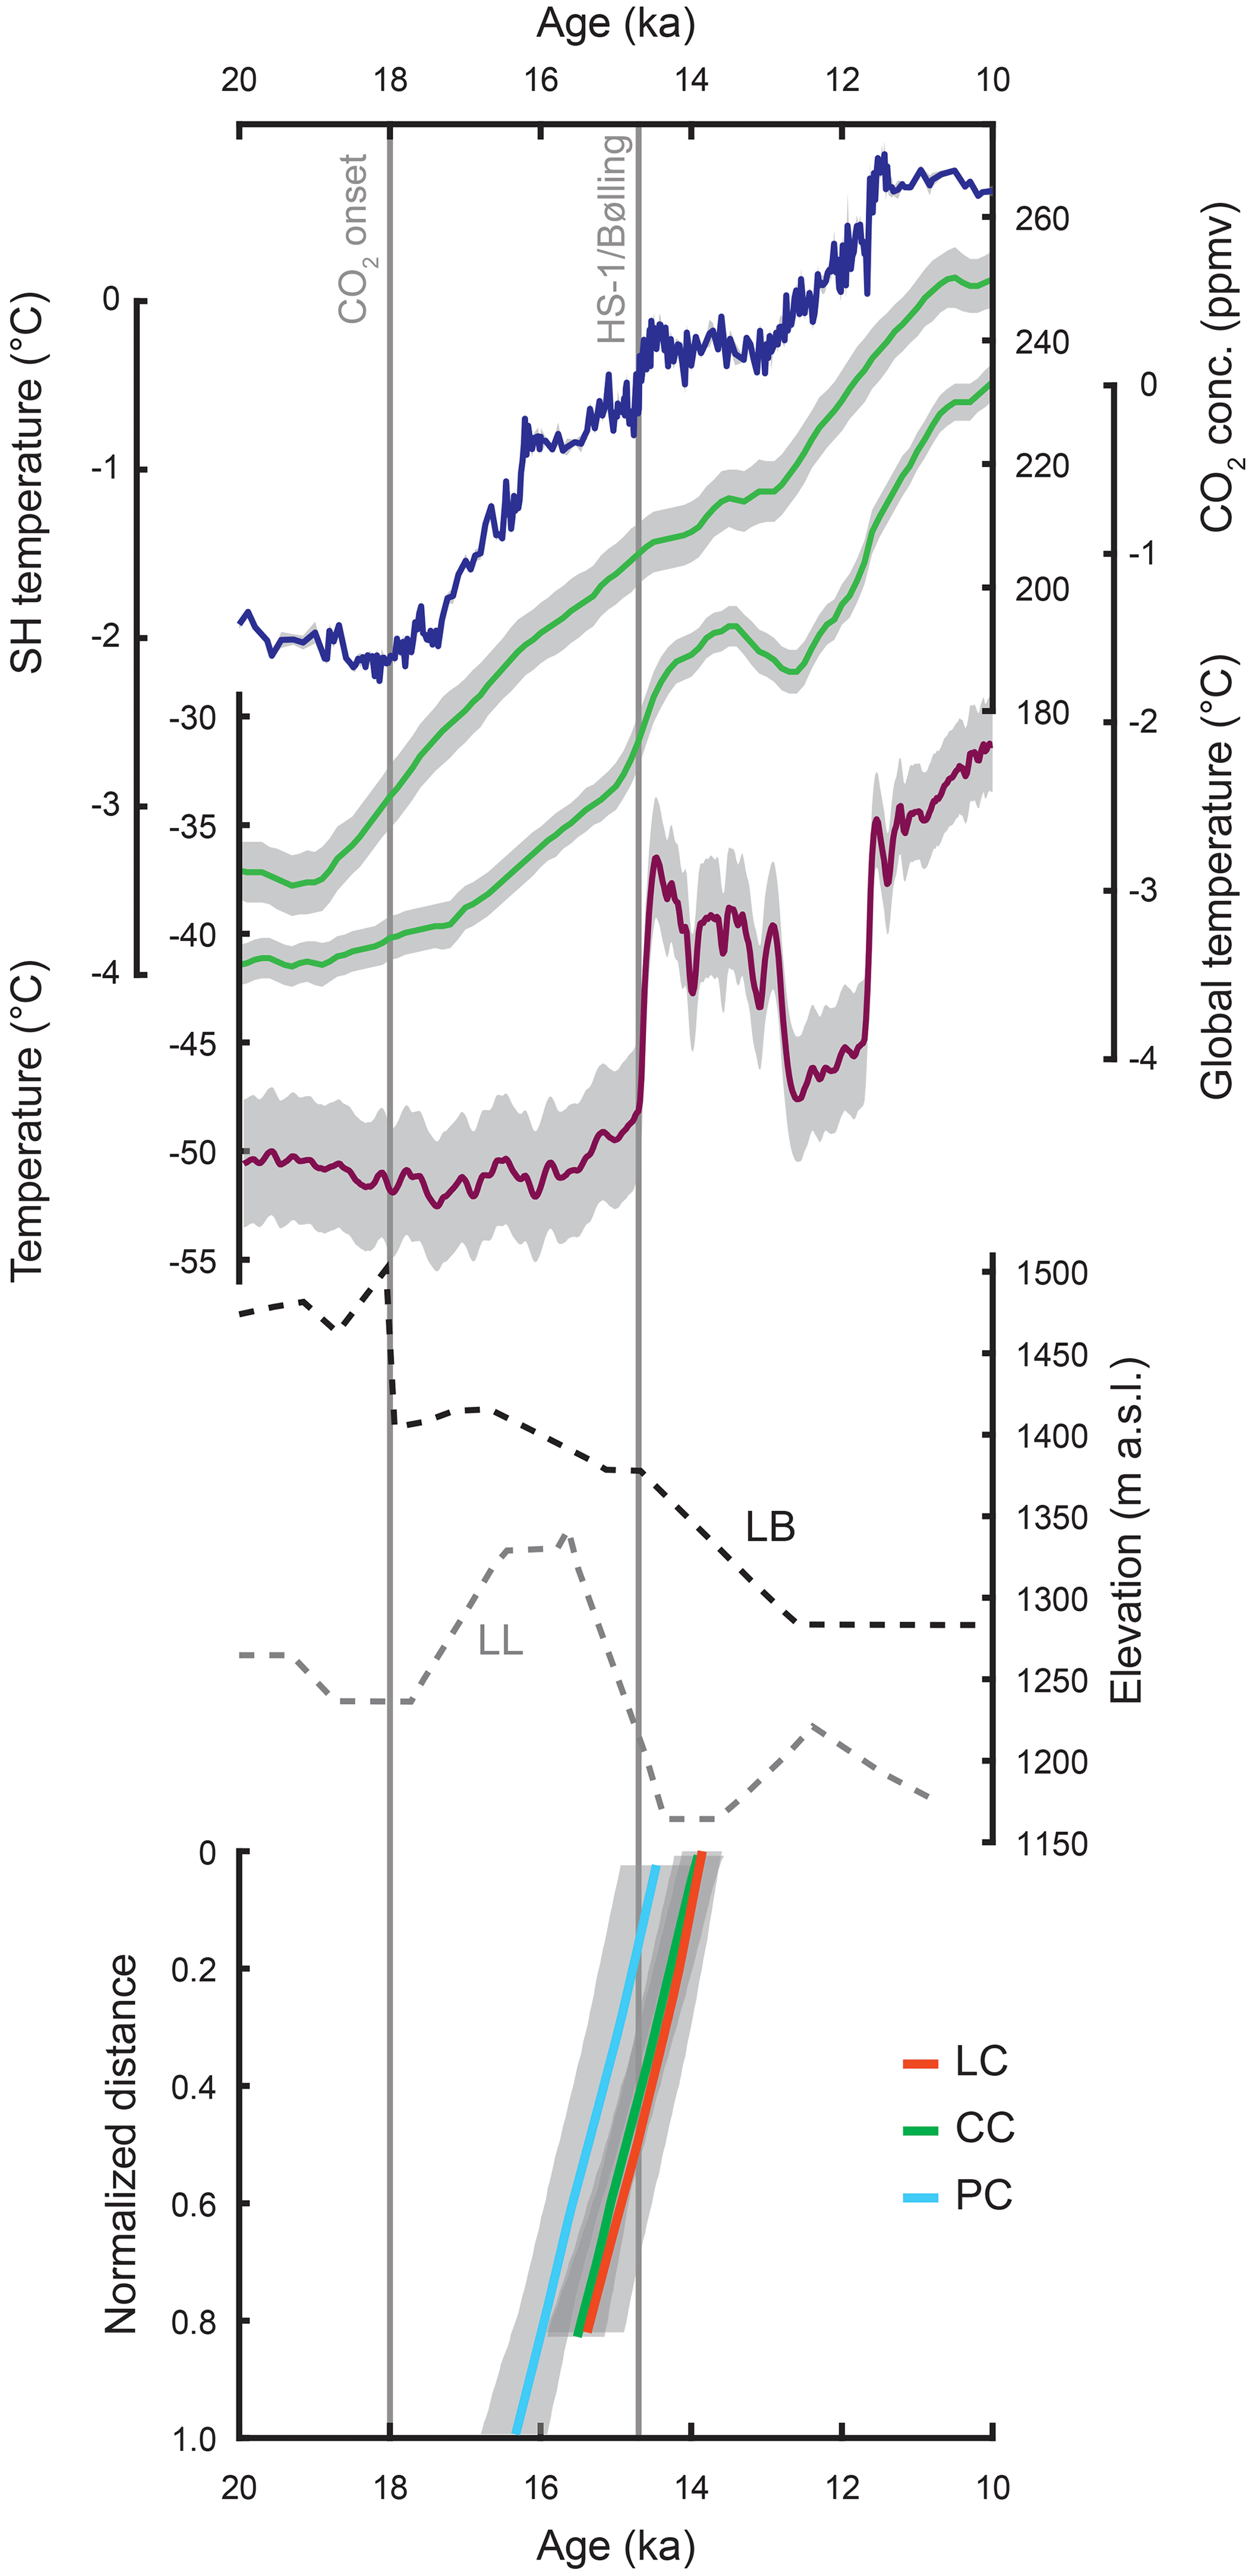
Figure 5Deglaciation of the Sawatch Range compared to other climate proxies. From top to bottom: atmospheric CO2 concentrations (Bereiter et al., 2015); global and Southern Hemisphere temperature stacks (Shakun et al., 2012); synthesized Greenland temperature from ice cores (Buizert et al., 2014); lake level reconstructions of Lake Bonneville (LB; black dashed line) and Lake Lahontan (LL; gray dashed line) from Reheis et al. (2014); normalized BACON plots from Lake Creek (LC; orange), Clear Creek (CC; green), and Pine Creek valleys (PC; blue). Vertical lines correspond to the onset of CO2 rise beginning ∼18 ka and the Heinrich Stadial 1–Bølling transition at 14.7 ka.
Ice core records – among other records – reveal a complex pattern of abrupt warming and cooling events that occurred in the North Atlantic region during the last deglaciation (Fig. 5; Buizert et al., 2014). Despite rising CO2 concentrations beginning ∼18 ka, North Atlantic records reveal that cold conditions persisted until 14.7 ka, known as Heinrich Stadial 1 (HS-1). Following these sustained cold conditions, an abrupt transition to warmer conditions is marked by the HS-1–Bølling boundary at 14.7 ka (Buizert et al., 2014). We find that deglaciation at some locations in the southern Rocky Mountains encompasses the HS-1–Bølling transition. Furthermore, the relatively rapid and short-lived nature of retreat for glaciers in the Sawatch Range – and some others across the southern Rocky Mountains – appears to be more consistent with the abrupt manner of warming observed in the North Atlantic. However, glaciers were already retreating prior to the abrupt HS-1–Bølling transition at ∼14.7 ka. Therefore, it is difficult to argue that North Atlantic warming alone forced glacier retreat in the southern Rocky Mountains.
In addition to the alpine glaciers that existed in the mountainous regions of the western US during the late Pleistocene, large pluvial lakes such as Lake Lahontan and Lake Bonneville existed across the Great Basin (Fig. 1; Gilbert, 1890; Russell, 1885; Orme, 2008). These lakes could have been sustained by increased precipitation delivery to the southwestern US (e.g., Munroe and Laabs, 2013; Oster et al., 2015; Lora and Ibarra, 2019) or were maintained simply by colder temperatures persisting throughout the region (e.g., Benson et al., 2013). Recent syntheses of past Great Basin lake levels reveal that Lahontan and Bonneville lakes resided at relative high stands between 15.5 and 14.5 ka (Benson et al., 2013; Reheis et al., 2014; Oviatt, 2015). After this time, each lake experienced notable declines in lake level (Fig. 5), which could have been the result of reduced precipitation due to rearranging storm tracks, warming temperature, or a combination of both (Benson et al., 2013; Oster et al., 2015; Lora and Ibarra, 2019).
Recent modeling efforts have highlighted how North American ice sheets likely influenced atmospheric circulation and regional climate throughout the Pleistocene (COHMAP members, 1988; Löfverström et al., 2014; Liakka and Lofverstrom, 2018; Lora and Ibarra, 2019). Specifically, there appears to have been a drastic shift in climatologies over the western US when the Cordilleran (CIS) and Laurentide (LIS) ice sheets separated (Lofverstrom et al., 2014; Lora et al., 2016; Tulenko et al., 2020). For example, during the last deglaciation, once the CIS and LIS separated, some model results suggest the western US became warmer and drier (Lora et al., 2016). The latest synthesis of the last deglaciation of the major North American ice sheets suggests that the separation occurred between 16 and 15 ka (Dalton et al., 2020). Thus, it is possible that the saddle collapse and separation of the CIS and LIS and resulting atmospheric reorganization may have led to both drastic pluvial lake level reductions and the rapid deglaciation of some glaciers in the southern Rocky Mountains.
Between North Atlantic forcing and North American ice sheet forcing, it is difficult to conclude what the primary driver of deglaciation in the Sawatch Range was; it may be a combination of both forcings. We find that the approximate timing and rate of deglaciation observed in the Sawatch Range point to abrupt warming and/or drying; this is supported by pluvial lake level records in the western US, which have also been tied to both North Atlantic forcing and North American ice sheet forcing (Munroe and Laabs, 2013; Benson et al., 2013; Lora and Ibarra, 2019). Regardless, the data synthesized here underscore the dominance of regional forcing mechanisms over global forcing mechanisms in some climate records in the western US.
We constrain the timing and rate of deglaciation in three alpine valleys in the Sawatch Range, southern Rocky Mountains. Beryllium-10 ages from ice-sculpted bedrock in each valley reveal that the significant retreat of glaciers from their LGM extents (100 %) or near (82 %–83 %) their LGM extents was initiated shortly after 16.0–15.6 ka, despite ∼2–3 kyr of increasing global temperature forced by rising atmospheric CO2. Glaciers in three adjacent valleys retreated rapidly to their cirques within ∼2 kyr, culminating at ∼ 14.2–13.7 ka, at rates ranging between 35.6 and 6.8 m a−1. We recognize that using the NENA production rate and Lm scaling produces ages 9 %–12 % older than the ages reported herein, which might change the interpretation of the dataset. However, we favor the PPT–LSDn combination because the PPT calibration site is closest in proximity and elevation to the Sawatch Range.
We hypothesize that one of two – or a combination of both – possible regional climatic mechanisms was responsible for driving the pattern of deglaciation for some glaciers in the southern Rocky Mountains. First, we find that for some alpine glaciers in the region, the relatively rapid, short-lived, and synchronous nature of retreat – including those in the Sawatch Range – across the southern Rocky Mountains is more consistent with the abrupt manner of warming observed in the North Atlantic than with steadily increasing global temperature forced by CO2 rise. However, evidence suggests that glaciers were already retreating prior to the HS-1–Bølling transition. Alternatively, lake level records reveal that both Bonneville and Lahontan lakes lowered nearly in step with some retreating alpine glaciers across the southern Rocky Mountains. Previous studies have linked Great Basin pluvial lake regression to warming and the migration of prevailing storm tracks due to atmospheric reorganization that may have been forced by the separation of North American ice sheets. Thus, warming and drying induced by abrupt atmospheric reorganization at the time of LIS and CIS separation may have driven both Great Basin lake level lowering and rapid alpine glacier retreat in some valleys in the southern Rocky Mountains. While we cannot conclude that either one of the aforementioned forcing mechanisms was solely responsible for deglaciation of the Sawatch Range, we suggest that one or both were stronger controls than increasing global temperature forced by CO2 rise.
All new cosmogenic 10Be exposure data presented in this paper are complete and available in Table 1. The data are also available on the ICE-D Alpine web page (http://alpine.ice-d.org/, last access: 9 August 2020) (Balco et al., 2020).
JPT was responsible for investigation (sample collection and processing), conceptualization, data curation, writing the original draft, and visualization. WC was responsible for investigation (sample collection and processing) as well as review and editing of the paper. ADS was responsible for investigation (sample collection and processing), conceptualization, and review and editing of the paper. JPB was responsible for investigation (sample collection and processing), conceptualization, data curation, supervision, and funding acquisition. EML was responsible for investigation (sample collection), conceptualization, data curation, and review and editing of the paper.
The authors declare that they have no conflict of interest.
Joseph P. Tulenko acknowledges funding from the University at Buffalo Geology Department Duane Champion Fund for fieldwork. Avriel D. Schweinsberg acknowledges funding from the Colorado Scientific Society and Mark Diamond Research Fund from the University at Buffalo Graduate Student Association for fieldwork. We also thank Alia J. Lesnek for assistance in the 2018 field campaign, as well as Charles M. Russell and Ryan K. Kroner for sample collection in the Lake Creek valley cirque in 2015.
This research has been supported by the University at Buffalo Graduate Student Association, the University at Buffalo Geology Department, and the Colorado Scientific Society.
This paper was edited by Yeong Bae Seong and reviewed by Benjamin Laabs and Richard Selwyn Jones.
Armour, J., Fawcett, P. J., and Geissman, J. W.: 15 ky paleoclimatic and glacial record from northern New Mexico, Geology, 30, 723–726, 2002.
Balco, G., Stone, J. O., Lifton, N. A., and Dunai, T. J.: A complete and easily accessible means of calculating surface exposure ages or erosion rates from 10Be and 26Al measurements, Quat. Geochronol., 3, 174–195, 2008.
Balco, G., Briner, J., Finkel, R. C., Rayburn, J. A., Ridge, J. C., and Schaefer, J. M.: Regional beryllium-10 production rate calibration for late-glacial northeastern North America, Quat. Geochronol., 4, 93–107, 2009.
Balco, G., Blard, P. H., Eaves, S., Heyman, J., Hidy, A., Jackson, M., Laabs, B., Lamp, J., Lesnek, A. J., Saha, S., Schimmelpfennig, I., Spector, P., and Tulenko, J. P.: ICE-D Alpine: informal cosmogenic-nuclide exposure-age database alpine, available at: http://alpine.ice-d.org/, last access: 9 August 2020.
Benson, L., Madole, R., Phillips, W., Landis, G., Thomas, T., and Kubik, P.: The probable importance of snow and sediment shielding on cosmogenic ages of north-central Colorado Pinedale and pre-Pinedale moraines, Quaternary Sci. Rev., 23, 193–206, 2004.
Benson, L. V., Smoot, J. P., Lund, S. P., Mensing, S. A., Foit Jr., F., and Rye, R. O.: Insights from a synthesis of old and new climate-proxy data from the Pyramid and Winnemucca lake basins for the period 48 to 11.5 cal ka, Quatern. Int., 310, 62–82, 2013.
Bereiter, B., Eggleston, S., Schmitt, J., Nehrbass-Ahles, C., Stocker, T. F., Fischer, H., Kipfstuhl, S., and Chappellaz, J.: Revision of the EPICA Dome C CO2 record from 800 to 600 kyr before present, Geophys. Res. Lett., 42, 542–549, https://doi.org/10.1002/2014GL061957, 2015.
Blaauw, M. and Christen, J. A.: Flexible paleoclimate age-depth models using an autoregressive gamma process, Bayesian Anal., 6, 457–474, 2011.
Borchers, B., Marrero, S., Balco, G., Caffee, M., Goehring, B., Lifton, N., Nishiizumi, K., Phillips, F., Schaefer, J., and Stone, J.: Geological calibration of spallation production rates in the CRONUS-Earth project, Quat. Geochronol., 31, 188–198, 2016.
Briner, J. P.: Moraine pebbles and boulders yield indistinguishable 10Be ages: A case study from Colorado, USA, Quat. Geochronol., 4, 299–305, https://doi.org/10.1016/j.quageo.2009.02.010, 2009.
Brugger, K. A., Ruleman, C. A., Caffee, M. W., and Mason, C. C.: Climate during the Last Glacial Maximum in the Northern Sawatch Range, Colorado, USA, Quaternary, 2, 36,https://doi.org/10.3390/quat2040036, 2019a.
Brugger, K. A., Laabs, B., Reimers, A., and Bensen, N.: Late Pleistocene glaciation in the Mosquito Range, Colorado, USA: chronology and climate, J. Quat. Sci., 34, 187–202, https://doi.org/10.1002/jqs.3090, 2019b.
Buizert, C., Gkinis, V., Severinghaus, J. P., He, F., Lecavalier, B. S., Kindler, P., Leuenberger, M., Carlson, A. E., Vinther, B., and Masson-Delmotte, V.: Greenland temperature response to climate forcing during the last deglaciation, Science, 345, 1177–1180, 2014.
Clark, P. U., Shakun, J. D., Baker, P. A., Bartlein, P. J., Brewer, S., Brook, E., Carlson, A. E., Cheng, H., Kaufman, D. S., Liu, Z., Marchitto, T. M., Mix, A. C., Morrill, C., Otto-Bliesner, B. L., Pahnke, K., Russell, J. M., Whitlock, C., Adkins, J. F., Blois, J. L., Clark, J., Colman, S. M., Curry, W. B., Flower, B. P., He, F., Johnson, T. C., Lynch-Stieglitz, J., Markgraf, V., McManus, J., Mitrovica, J. X., Moreno, P. I., and Williams, J. W.: Global climate evolution during the last deglaciation, P. Natl. Acad. Sci. USA, 109, E1134–E1142, https://doi.org/10.1073/pnas.1116619109, 2012.
COHMAP members: Climatic changes of the last 18,000 years: observations and model simulations, Science, 241, 1043–1052, 1988.
Corbett, L. B., Bierman, P. R., and Rood, D. H.: An approach for optimizing in situ cosmogenic 10Be sample preparation, Quat. Geochronol., 33, 24–34, 2016.
Dalton, A. S., Margold, M., Stokes, C. R., Tarasov, L., Dyke, A. S., Adams, R. S., Allard, S., Arends, H. E., Atkinson, N., Attig, J. W., Barnett, P. J., Barnett, R. L., Batterson, M., Bernatchez, P., Borns, H. W., Breckenridge, A., Briner, J. P., Brouard, E., Campbell, J. E., Carlson, A. E., Clague, J. J., Curry, B. B., Daigneault, R.-A., Dubé-Loubert, H., Easterbrook, D. J., Franzi, D. A., Friedrich, H. G., Funder, S., Gauthier, M. S., Gowan, A. S., Harris, K. L., Hétu, B., Hooyer, T. S., Jennings, C. E., Johnson, M. D., Kehew, A. E., Kelley, S. E., Kerr, D., King, E. L., Kjeldsen, K. K., Knaeble, A. R., Lajeunesse, P., Lakeman, T. R., Lamothe, M., Larson, P., Lavoie, M., Loope, H. M., Lowell, T. V., Lusardi, B. A., Manz, L., McMartin, I., Nixon, F. C., Occhietti, S., Parkhill, M. A., Piper, D. J. W., Pronk, A. G., Richard, P. J. H., Ridge, J. C., Ross, M., Roy, M., Seaman, A., Shaw, J., Stea, R. R., Teller, J. T., Thompson, W. B., Thorleifson, L. H., Utting, D. J., Veillette, J. J., Ward, B. C., Weddle, T. K., and Wright, H. E.: An updated radiocarbon-based ice margin chronology for the last deglaciation of the North American Ice Sheet Complex, Quaternary Sci. Rev., 234, 106223, https://doi.org/10.1016/j.quascirev.2020.106223, 2020.
Denton, G. H., Anderson, R. F., Toggweiler, J. R., Edwards, R. L., Schaefer, J. M., and Putnam, A. E.: The Last Glacial Termination, Science, 328, 1652, https://doi.org/10.1126/science.1184119, 2010.
Dühnforth, M., and Anderson, R. S.: Reconstructing the glacial history of green lakes valley, North Boulder Creek, Colorado Front Range, Arct. Antarct. Alp. Res., 43, 527–542, 2011.
Gilbert, G. K.: Lake Bonneville, US government printing office, Washington, 1890.
Guido, Z. S., Ward, D. J., and Anderson, R. S.: Pacing the post–Last Glacial Maximum demise of the Animas Valley glacier and the San Juan Mountain ice cap, Colorado, Geology, 35, 739–742, 2007.
Hofmann, F. M., Alexanderson, H., Schoeneich, P., Mertes, J. R., Léanni, L., and Team, A.: Post-Last Glacial Maximum glacier fluctuations in the southern Écrins massif (westernmost Alps): insights from 10Be cosmic ray exposure dating, Boreas, 48, 1019–1041, 2019.
Ivy-Ochs, S., Kerschner, H., Reuther, A., Maisch, M., Sailer, R., Schaefer, J., Kubik, P. W., and Synal, H.: The timing of glacier advances in the northern European Alps based on surface exposure dating with cosmogenic 10Be, 26Al, 36Cl, and 21Ne, Special Paper – Geological Society of America, 2006.
Johnson, J. S., Bentley, M. J., Smith, J. A., Finkel, R., Rood, D., Gohl, K., Balco, G., Larter, R. D., and Schaefer, J.: Rapid thinning of Pine Island Glacier in the early Holocene, Science, 343, 999–1001, 2014.
Jones, R. S., Mackintosh, A. N., Norton, K. P., Golledge, N. R., Fogwill, C. J., Kubik, P. W., Christl, M., and Greenwood, S. L.: Rapid Holocene thinning of an East Antarctic outlet glacier driven by marine ice sheet instability, Nat. Commun., 6, 8910, https://doi.org/10.1038/ncomms9910, 2015.
Koester, A. J., Shakun, J. D., Bierman, P. R., Davis, P. T., Corbett, L. B., Braun, D., and Zimmerman, S. R.: Rapid thinning of the Laurentide Ice Sheet in coastal Maine, USA, during late Heinrich Stadial 1, Quaternary Sci. Rev., 163, 180–192, 2017.
Laabs, B. J. C., Refsnider, K. A., Munroe, J. S., Mickelson, D. M., Applegate, P. J., Singer, B. S., and Caffee, M. W.: Latest Pleistocene glacial chronology of the Uinta Mountains: support for moisture-driven asynchrony of the last deglaciation, Quaternary Sci. Rev., 28, 1171–1187, https://doi.org/10.1016/j.quascirev.2008.12.012, 2009.
Laabs, B. J. C., Licciardi, J. M., Leonard, E. M., Munroe, J. S., and Marchetti, D. W.: Updated cosmogenic chronologies of Pleistocene mountain glaciation in the western United States and associated paleoclimate inferences, Quaternary Sci. Rev., 242, 106427, https://doi.org/10.1016/j.quascirev.2020.106427, 2020.
Lal, D.: Cosmic ray labeling of erosion surfaces: in situ nuclide production rates and erosion models, Earth Planet. Sc. Lett., 104, 424–439, 1991.
Leonard, E. M., Laabs, B. J. C., Plummer, M. A., Kroner, R. K., Brugger, K. A., Spiess, V. M., Refsnider, K. A., Xia, Y., and Caffee, M. W.: Late Pleistocene glaciation and deglaciation in the Crestone Peaks area, Colorado Sangre de Cristo Mountains, USA – chronology and paleoclimate, Quaternary Sci. Rev., 158, 127–144, https://doi.org/10.1016/j.quascirev.2016.11.024, 2017a.
Leonard, E. M., Laabs, B., Schweinsberg, A., Russell, C. M., Briner, J. P., and Young, N.: Deglaciation of the Colorado Rocky Mountains following the Last Glacial Maximum, Cuadern. Investig., 43, 497–526, 2017b.
Lesnek, A. J., Briner, J. P., Young, N. E., and Cuzzone, J. K.: Maximum Southwest Greenland Ice Sheet Recession in the Early Holocene, Geophys. Res. Lett., 47, e2019GL083164, https://doi.org/10.1029/2019gl083164, 2020.
Liakka, J. and Lofverstrom, M.: Arctic warming induced by the Laurentide Ice Sheet topography, Clim. Past, 14, 887–900, https://doi.org/10.5194/cp-14-887-2018, 2018.
Licciardi, J. M. and Pierce, K. L.: History and dynamics of the Greater Yellowstone Glacial System during the last two glaciations, Quaternary Sci. Rev., 200, 1–33, 2018.
Lifton, N., Sato, T., and Dunai, T. J.: Scaling in situ cosmogenic nuclide production rates using analytical approximations to atmospheric cosmic-ray fluxes, Earth Planet. Sc. Lett., 386, 149–160, 2014.
Lifton, N., Caffee, M., Finkel, R., Marrero, S., Nishiizumi, K., Phillips, F. M., Goehring, B., Gosse, J., Stone, J., and Schaefer, J.: In situ cosmogenic nuclide production rate calibration for the CRONUS-Earth project from Lake Bonneville, Utah, shoreline features, Quat. Geochronol., 26, 56–69, 2015.
Löfverström, M., Caballero, R., Nilsson, J., and Kleman, J.: Evolution of the large-scale atmospheric circulation in response to changing ice sheets over the last glacial cycle, Clim. Past, 10, 1453–1471, https://doi.org/10.5194/cp-10-1453-2014, 2014.
Lora, J. M. and Ibarra, D. E.: The North American hydrologic cycle through the last deglaciation, Quaternary Sci. Rev., 226, 105991, https://doi.org/10.1016/j.quascirev.2019.105991, 2019.
Lora, J. M., Mitchell, J. L., and Tripati, A. E.: Abrupt reorganization of North Pacific and western North American climate during the last deglaciation, Geophys. Res. Lett., 43, 11796–711804, 2016.
Marcott, S. A., Clark, P. U., Shakun, J. D., Brook, E. J., Davis, P. T., and Caffee, M. W.: 10Be age constraints on latest Pleistocene and Holocene cirque glaciation across the western United States, npj Climate and Atmospheric Science, 2, 1–7, 2019.
Munroe, J. S. and Laabs, B. J. C.: Temporal correspondence between pluvial lake highstands in the southwestern US and Heinrich Event 1, J. Quaternary Sci., 28, 49–58, https://doi.org/10.1002/jqs.2586, 2013.
Munroe, J. S. and Laabs, B. J. C.: Combining radiocarbon and cosmogenic ages to constrain the timing of the last glacial-interglacial transition in the Uinta Mountains, Utah, USA, Geology, 45, 171–174, https://doi.org/10.1130/g38156.1, 2017.
NGRIP members: High-resolution record of Northern Hemisphere climate extending into the last interglacial period, Nature, 431, 147–151, https://doi.org/10.1038/nature02805, 2004.
Nishiizumi, K., Imamura, M., Caffee, M. W., Southon, J. R., Finkel, R. C., and McAninch, J.: Absolute calibration of 10Be AMS standards, Nucl. Instrum. Meth. B, 258, 403–413, 2007.
Oerlemans, J.: Extracting a Climate Signal from 169 Glacier Records, Science, 308, 675–677, https://doi.org/10.1126/science.1107046, 2005.
Orme, A. R.: Pleistocene pluvial lakes of the American West: a short history of research, Geological Society, London, Special Publications, 301, 51–78, 2008.
Oster, J. L., Ibarra, D. E., Winnick, M. J., and Maher, K.: Steering of westerly storms over western North America at the Last Glacial Maximum, Nat. Geosci., 8, 201–205, https://doi.org/10.1038/ngeo2365, 2015.
Oviatt, C. G.: Chronology of Lake Bonneville, 30,000 to 10,000 yr B.P, Quaternary Sci. Rev., 110, 166–171, https://doi.org/10.1016/j.quascirev.2014.12.016, 2015.
Palacios, D., Stokes, C. R., Phillips, F. M., Clague, J. J., Alcalá-Reygosa, J., Andres, N., Angel, I., Blard, P.-H., Briner, J. P., and Hall, B. L.: The deglaciation of the Americas during the Last Glacial Termination, Earth-Sci. Rev., 203, 103–113, https://doi.org/10.1016/j.earscirev.2020.103113, 2020.
Pierce, K. L.: Pleistocene glaciations of the Rocky Mountains, Developments in Quaternary Sciences, 1, 63–76, 2003.
Porter, S. C., Pierce, K. L., and Hamilton, T. D.: Late Wisconsin Mountain Glaciation in the Western United States, in: Late-Quaternary environments of the United States, edited by: Wright, H. E. and Porter, S. C., University of Minnesota Press, Minnesota, 71–111, 1983.
Putnam, A. E., Schaefer, J. M., Denton, G. H., Barrell, D. J., Birkel, S. D., Andersen, B. G., Kaplan, M. R., Finkel, R. C., Schwartz, R., and Doughty, A. M.: The last glacial maximum at 44 ∘S documented by a 10Be moraine chronology at Lake Ohau, Southern Alps of New Zealand, Quaternary Sci. Rev., 62, 114–141, 2013.
Quirk, B. J., Moore, J. R., Laabs, B. J., Caffee, M. W., and Plummer, M. A.: Termination II, Last Glacial Maximum, and Lateglacial chronologies and paleoclimate from Big Cottonwood Canyon, Wasatch Mountains, Utah, Bulletin, 130, 1889–1902, 2018.
Rasmussen, S. O., Bigler, M., Blockley, S. P., Blunier, T., Buchardt, S. L., Clausen, H. B., Cvijanovic, I., Dahl-Jensen, D., Johnsen, S. J., and Fischer, H.: A stratigraphic framework for abrupt climatic changes during the Last Glacial period based on three synchronized Greenland ice-core records: refining and extending the INTIMATE event stratigraphy, Quaternary Sci. Rev., 106, 14–28, 2014.
Reheis, M. C., Adams, K. D., Oviatt, C. G., and Bacon, S. N.: Pluvial lakes in the Great Basin of the western United States – a view from the outcrop, Quaternary Sci. Rev., 97, 33–57, https://doi.org/10.1016/j.quascirev.2014.04.012, 2014.
Roe, G. H., Baker, M. B., and Herla, F.: Centennial glacier retreat as categorical evidence of regional climate change, Nat. Geosci., 10, 95–99, 2017.
Russell, I. C.: Geological history of Lake Lahontan: a Quaternary lake of northwestern Nevada, US Government Printing Office, 1885.
Schaefer, J. M., Denton, G. H., Barrell, D. J., Ivy-Ochs, S., Kubik, P. W., Andersen, B. G., Phillips, F. M., Lowell, T. V., and Schlüchter, C.: Near-synchronous interhemispheric termination of the last glacial maximum in mid-latitudes, Science, 312, 1510–1513, 2006.
Schweinsberg, A. D., Briner, J. P., Licciardi, J. M., Shroba, R. R., and Leonard, E. M.: Cosmogenic 10Be exposure dating of Bull Lake and Pinedale moraine sequences in the upper Arkansas River valley, Colorado Rocky Mountains, USA, Quaternary Res., 97, 125–139, https://doi.org/10.1017/qua.2020.21, 2020.
Shakun, J. D., Clark, P. U., He, F., Marcott, S. A., Mix, A. C., Liu, Z., Otto-Bliesner, B., Schmittner, A., and Bard, E.: Global warming preceded by increasing carbon dioxide concentrations during the last deglaciation, Nature, 484, 49–54, 2012.
Shakun, J. D., Clark, P. U., He, F., Lifton, N. A., Liu, Z., and Otto-Bliesner, B. L.: Regional and global forcing of glacier retreat during the last deglaciation, Nat. Commun., 6, 8059, https://doi.org/10.1038/ncomms9059, 2015.
Shroba, R. R., Kellogg, K. S., and Bandt, T. R.: Geologic map of the Granite 7.5'quadrangle, Lake and Chaffee Counties, Colorado: US Geological Survey Scientific Investigations Map 3294, 31, 1 sheet, scale 1:24 000, 2014.
Small, D., Smedley, R. K., Chiverrell, R. C., Scourse, J. D., Cofaigh, C. Ó., Duller, G. A. T., McCarron, S., Burke, M. J., Evans, D. J. A., Fabel, D., Gheorghiu, D. M., Thomas, G. S. P., Xu, S., and Clark, C. D.: Trough geometry was a greater influence than climate-ocean forcing in regulating retreat of the marine-based Irish-Sea Ice Stream, GSA Bulletin, 130, 1981–1999, https://doi.org/10.1130/b31852.1, 2018.
Stone, J. O.: Air pressure and cosmogenic isotope production, J. Geophys. Res.-Sol. Ea., 105, 23753–23759, 2000.
Tulenko, J. P., Lofverstrom, M., and Briner, J. P.: Ice sheet influence on atmospheric circulation explains the patterns of Pleistocene alpine glacier records in North America, Earth Planet. Sc. Lett., 534, 116115, https://doi.org/10.1016/j.epsl.2020.116115, 2020.
Ward, D. J., Anderson, R. S., Guido, Z. S., and Briner, J. P.: Numerical modeling of cosmogenic deglaciation records, Front Range and San Juan mountains, Colorado, J. Geophys. Res.-Earth, 114, F01026, https://doi.org/10.1029/2008JF001057, 2009.
Young, N. E., Briner, J. P., Leonard, E. M., Licciardi, J. M., and Lee, K.: Assessing climatic and nonclimatic forcing of Pinedale glaciation and deglaciation in the western United States, Geology, 39, 171–174, 2011.
Young, N. E., Briner, J. P., Schaefer, J., Zimmerman, S., and Finkel, R. C.: Early Younger Dryas glacier culmination in southern Alaska: Implications for North Atlantic climate change during the last deglaciation, Geology, 47, 550–554, 2019.