the Creative Commons Attribution 4.0 License.
the Creative Commons Attribution 4.0 License.
 | 23 Sep 2020
LA-ICPMS U–Pb geochronology of detrital zircon grains from the Coconino, Moenkopi, and Chinle formations in the Petrified Forest National Park (Arizona)
George Gehrels
Dominique Giesler
Paul Olsen
Dennis Kent
Adam Marsh
William Parker
Cornelia Rasmussen
Roland Mundil
Randall Irmis
John Geissman
Christopher Lepre
Uranium–lead (U–Pb) geochronology was conducted by laser ablation – inductively coupled plasma mass spectrometry (LA-ICPMS) on 7175 detrital zircon grains from 29 samples from the Coconino Sandstone, Moenkopi Formation, and Chinle Formation. These samples were recovered from ∼ 520 m of drill core that was acquired during the Colorado Plateau Coring Project (CPCP), located in Petrified Forest National Park (Arizona).
A sample from the lower Permian Coconino Sandstone yields a broad distribution of Proterozoic and Paleozoic ages that are consistent with derivation from the Appalachian and Ouachita orogens, with little input from local basement or Ancestral Rocky Mountain sources. Four samples from the Holbrook Member of the Moenkopi Formation yield a different set of Precambrian and Paleozoic age groups, indicating derivation from the Ouachita orogen, the East Mexico arc, and the Permo-Triassic arc built along the Cordilleran margin.
A total of 23 samples from the Chinle Formation contain variable proportions of Proterozoic and Paleozoic zircon grains but are dominated by Late Triassic grains. LA-ICPMS ages of these grains belong to five main groups that correspond to the Mesa Redondo Member, Blue Mesa Member and lower part of the Sonsela Member, upper part of the Sonsela Member, middle part of the Petrified Forest Member, and upper part of the Petrified Forest Member. The ages of pre-Triassic grains also correspond to these chronostratigraphic units and are interpreted to reflect varying contributions from the Appalachian orogen to the east, Ouachita orogen to the southeast, Precambrian basement exposed in the ancestral Mogollon Highlands to the south, East Mexico arc, and Permian–Triassic arc built along the southern Cordilleran margin. Triassic grains in each chronostratigraphic unit also have distinct U and thorium (Th) concentrations, which are interpreted to reflect temporal changes in the chemistry of arc magmatism.
Comparison of our LA-ICPMS ages with available chemical abrasion thermal ionization mass spectrometry (CA-TIMS) ages and new magnetostratigraphic data provides new insights into the depositional history of the Chinle Formation, as well as methods utilized to determine depositional ages of fluvial strata. For parts of the Chinle Formation that are dominated by fine-grained clastic strata (e.g., mudstone and siltstone), such as the Blue Mesa Member and Petrified Forest Member, all three chronometers agree (to within ∼ 1 Myr), and robust depositional chronologies have been determined. In contrast, for stratigraphic intervals dominated by coarse-grained clastic strata (e.g., sandstone), such as most of the Sonsela Member, the three chronologic records disagree due to recycling of older zircon grains and variable dilution of syn-depositional-age grains. This results in LA-ICPMS ages that significantly predate deposition and CA-TIMS ages that range between the other two chronometers. These complications challenge attempts to establish a well-defined chronostratigraphic age model for the Chinle Formation.
- Article
(12099 KB) - Full-text XML
-
Supplement
(19305 KB) - BibTeX
- EndNote


Triassic strata of the Colorado Plateau and environs provide rich and geographically extensive records of environmental and biotic change during a critical period of Earth's history, as well as the transition from passive- to convergent-margin tectonism along the North American Cordillera (e.g., Parker and Martz, 2011; Olsen et al., 2011). As demonstrated by Riggs et al. (1996, 2003, 2012, 2013, 2016), Dickinson and Gehrels (2008), Irmis et al. (2011), Ramezani et al. (2011, 2014), Atchley et al. (2013), Nordt et al. (2015), Kent et al. (2018, 2019), Olsen et al. (2018, 2019), Marsh et al. (2019), and Rasmussen et al. (2020), Chinle Formation strata have the potential to record the timing of these changes in great detail given their several-hundred-meter thickness, abundance of near-depositional-age zircon grains, and recoverable paleomagnetic reversal stratigraphy.
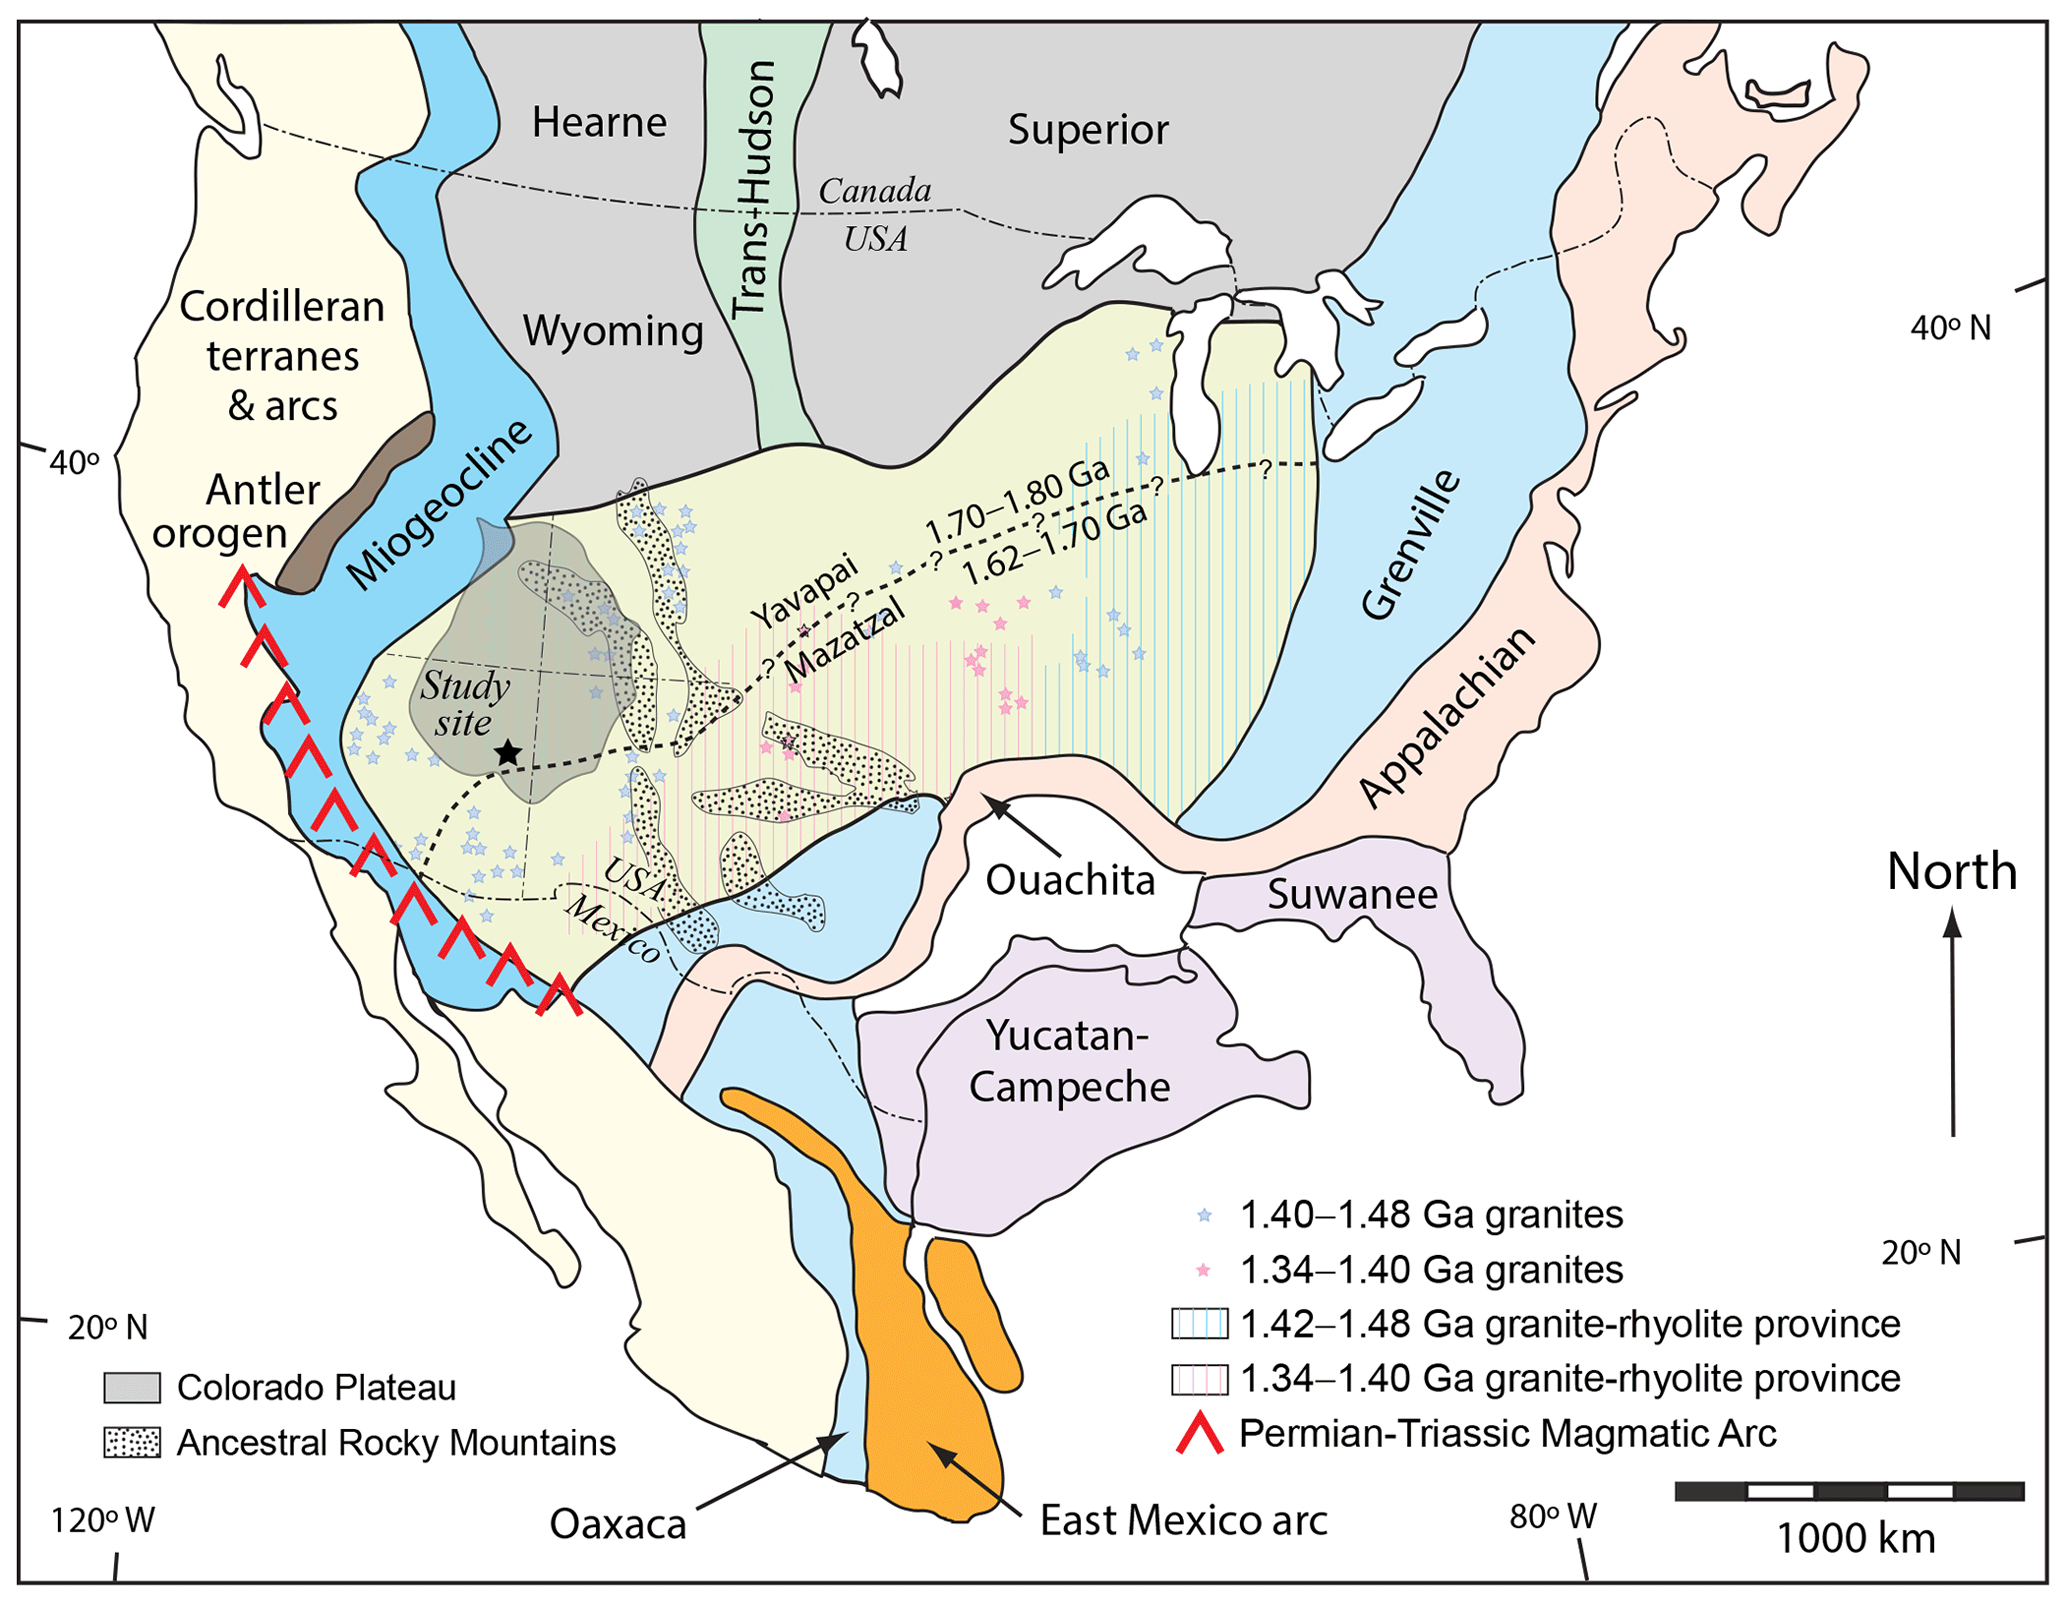
Figure 1Map showing the main basement provinces of southern North America and Mexico. Also shown are locations of the study area within the Colorado Plateau, outlines of Ancestral Rocky Mountain uplifts, and the Permian–Triassic magmatic arc along the continental margin of southwestern North America. Modified from Gehrels et al. (2011).
In an effort to further develop this record, ∼ 520 m of continuous core was collected from Triassic and underlying Permian strata at Petrified Forest National Park (PEFO), which is located on the southern Colorado Plateau of northern Arizona (Fig. 1; (35.085933∘ N, 109.795500∘ W; WGS84 datum). The objectives and primary findings of this project have been described by Olsen et al. (2018, 2019), Kent et al. (2018, 2019), and Rasmussen et al. (2020), and numerous related studies are currently in progress. This contribution to the project reports uranium–lead (U–Pb) geochronologic analyses of detrital zircon grains that were extracted from 29 samples from this core (CPCP-PFNP13-1A). Analyses were conducted by laser ablation – inductively coupled mass spectrometry (LA-ICPMS), with between 36 and 490 grains analyzed per sample (total of 7175 analyses). Grains were chosen for analysis by random selection in an effort to provide unbiased information about provenance. Fortunately, a significant number of near-depositional-age grains were recovered from many samples in the Chinle Formation, which provides opportunities to also determine robust maximum depositional ages. This report explores variations in both provenance and maximum depositional age of strata intersected in the CPCP-PFNP13-1A core and the implications for Permian–Triassic environmental and biotic transformations and the tectonic evolution of southwestern North America.

Figure 2Strata encountered in the Colorado Plateau Coring Project (adapted from Olsen et al., 2018). Sampled horizons are shown relative to core depth, stratigraphic depth, and stratigraphic nomenclature relevant for the Petrified Forest region. Detailed descriptions of samples are provided in Table S1; images of the sampled material are presented in Sect. S1.
The lowest stratigraphic horizon encountered consists of quartz arenite belonging to the Coconino Sandstone (Fig. 2). This unit belongs to regionally extensive erg deposits of early Permian (Leonardian) age (Blakey et al., 1988; Lawton et al., 2015; Dickinson, 2018).
Overlying strata of the Coconino Sandstone are tabular, thin- to thick-bedded, reddish mudstone, siltstone, and sandstone layers of the Early–Middle Triassic Moenkopi Formation. In the PEFO region, the Moenkopi Formation consists of thin-bedded reddish siltstone with interlayered sandstone and mudstone. Lower, finer-grained strata are assigned to the Wupatki Member and Moqui Member, and upper sandstone-rich horizons dominate the Holbrook Member. The base is a regional unconformity, the Tr-1 unconformity of Pipiringos and O'Sullivan (1978), along which strata of the lower Permian Toroweap Formation and Kaibab Formation have been removed. Strata of the Moenkopi Formation are interpreted to have accumulated on a northwest-sloping coastal plain, with thinner fluvial strata to the southeast and thicker marginal marine strata to the northwest (Dickinson, 2018). The Moenkopi Formation basin was bounded by residual uplifts of the Ancestral Rocky Mountains to the northeast and highlands of the Ouachita orogen to the southeast. Highlands developed within early phases of the Cordilleran magmatic arc may have existed to the southwest.
Strata of the Moenkopi Formation are overlain unconformably (Tr-3 unconformity of Pipiringos and O'Sullivan, 1978) by the Chinle Formation (Fig. 2). The transition is marked in most areas by the Shinarump Conglomerate, which consists of cobbles of chert, quartzite, limestone, and subordinate felsic volcanic rocks. Riggs et al. (2012) have determined U–Pb ages of 232–224 Ma on volcanic cobbles in the Shinarump Conglomerate. The Shinarump Conglomerate is interpreted to correlate with finer-grained strata of the Mesa Redondo Member (Irmis et al., 2011; Martz et al., 2012, 2017; Riggs et al., 2016). Strata of the Shinarump Conglomerate and Mesa Redondo Member are interpreted to have accumulated in paleovalleys that were carved into underlying strata. Strikingly variegated, strongly pedogenically modified, red, purple, and yellow strata in the core are assigned to the Mesa Redondo Member given the lack of conglomerate. Strata of the Mesa Redondo Member in outcrop have yielded U–Pb (zircon) ages of ∼ 227.6 Ma (Atchley et al., 2013) and ∼ 225.2 Ma (Ramezani et al., 2011).
Gradationally overlying the Mesa Redondo Member are strata of the Blue Mesa Member, which consist of purplish to gray and red bentonitic mudstone with sandstone beds that are generally 0.5 m in thickness (Woody, 2006). Blue Mesa Member mudstones are pervasively pedogenically modified in the core. These strata are interpreted to have accumulated primarily as overbank deposits within a mixed-load meandering river system (Martz and Parker, 2010). Previously reported U–Pb isotope dilution thermal ionization mass spectrometry (ID-TIMS) or chemical abrasion thermal ionization mass spectrometry (CA-TIMS) ages from outcrop of the Blue Mesa Member range from ∼ 223 to ∼ 218 Ma (Heckert et al., 2009; Ramezani et al., 2011; Irmis et al., 2011; Atchley et al., 2013; Rasmussen et al., 2020).
Strata of the Blue Mesa Member are overlain by sandstone-rich and conglomerate-bearing strata of the Sonsela Member. Lucas (1993) and Heckert and Lucas (2002) refer to the base of the Sonsela Member as a regionally significant unconformity, although this interpretation has been questioned by Woody (2006) and Martz and Parker (2010) given that conglomeratic sandstone of the Sonsela is interbedded with mudstone of the Blue Mesa Member. Martz and Parker (2010) suggest that the transition from the Blue Mesa Member to the Sonsela Member marks a change in depositional regime (from mainly overbank deposits to bedload-dominated channel deposits) but does not mark a significant hiatus in deposition.
The Sonsela Member consists predominantly of sandstone with lesser mudstone and local conglomerate. Sandstone beds are variable in thickness, have significant lateral extent, and exhibit cut-and-fill structure (Woody, 2006). Conglomerate (with abundant volcanic clasts) is common within the sandstone beds. Five units have been recognized: a lower sandstone interval (Camp Butte beds), a lower–middle unit with abundant mudstone (Lot's Wife beds), a middle sandstone and conglomerate unit (Jasper Forest/Rainbow Forest bed), a middle–upper unit with pedogenic carbonate and abundant mudstone (Jim Camp Wash beds), and an upper sandstone unit (Martha's Butte beds) (Martz and Parker, 2010). The five units are gradational, with the main variation being the abundance of mudstone in two of the middle units. Reddish siliceous horizons within the Sonsela Member are marked by a significant die-off of the conifers that characterize Petrified Forest National Park (Creber and Ash, 1990), a turnover of the vertebrate fauna (Parker and Martz, 2009, 2011), and perhaps a significant change in flora and paleoclimate (Reichgelt et al., 2013; Nordt et al., 2015; Baranyi et al., 2017). U–Pb (CA-TIMS/zircon) ages from the Sonsela Member range from ∼ 220 to ∼ 214 Ma (Ramezani et al., 2011; Marsh et al., 2019; Rasmussen et al., 2020) from below the outcropping siliceous horizon and from ∼ 214 to ∼ 213 Ma (Ramezani et al., 2011; Nordt et al., 2015; Kent et al., 2018; Rasmussen et al., 2020) from above.
Overlying the conglomeratic sandstones of the Sonsela Member is a purplish mudstone that marks the base of the Petrified Forest Member (Fig. 2). This member consists of red and purple mudstone with abundant paleosols and pedogenic carbonate nodules, with local conglomeratic sandstone beds that formed in bedload-dominated streams. Near the top of the unit is the Black Forest bed, which consists of limestone–pebble conglomerate and reworked andesitic tuff (Ash, 1992). Zircon grains from the Black Forest bed have yielded U–Pb (ID-TIMS or CA-TIMS) ages of ∼ 213 to ∼ 210 Ma (Riggs et al., 2003; Heckert et al., 2009; Ramezani et al., 2011; Kent et al., 2018; Rasmussen et al., 2020).
We analyzed detrital zircon grains from 29 samples collected from the Permian and Triassic strata described above. Samples include one from the Coconino Sandstone, five from the Moenkopi Formation (one that may be from the Wupatki Member and four from the Holbrook Member), and 23 from the Chinle Formation (one from the Mesa Redondo Member, three from the Blue Mesa Member, 12 from the Sonsela Member, and seven from the Petrified Forest Member). Approximate stratigraphic positions of the samples are shown in Fig. 2, lithic characteristics are described in Table S1 in the Supplement, and images of the sampled material (both core and thin sections) are presented in Sect. S1 in the Supplement. Each sample consisted of 20 cm (for sandstone) to 30 cm (for mudstone–siltstone) of one-fourth sections of the core.
Zircon mineral separation was performed at the Arizona LaserChron Center (http://laserchron.org/laserchron/, last access: 9 September 2020) using methods modified from those outlined by Gehrels (2000), Gehrels et al. (2008), and Gehrels and Pecha (2014) because of the small size of all samples and the abundance of clay minerals in many samples. The process included using a hand crusher to break the samples apart, a gold pan for initial density separation, and an ultrasonic disruptor (Hoke et al., 2014) to separate zircon crystals from clay mineral grains. Magnetic separation was performed with a Frantz isodynamic separator, followed by density separation using methylene iodide.
Zircon grains greater than 60 µm in size were enclosed in 1 in epoxy mounts along with fragments of zircon standards SL (primary) and FC-1 and R33 (secondary). Mounts were polished approximately 5–10 µm deep to expose the internal structure of the grains but retain as much material as possible for subsequent CA-TIMS analysis. Imaging was performed with a backscatter electron (BSE) detector system using a Hitachi S3400 scanning electron microscope (SEM) to ensure analysis of zircon and to avoid inclusions and fractures. Mounts were cleaned with 1 % HCl and 1 % HNO3 prior to isotopic analysis.
U–Pb isotopic analyses were conducted by LA-ICPMS using a Teledyne Photon Machines Analyte G2 laser connected to a Thermo Scientific Element 2 mass spectrometer. Analyses utilized a 20 µm diameter laser beam fired at 7 Hz for 15 s, resulting in 10–12 µm deep pits. Details of the analytical methods are reported in Table S2.
U–Pb ages are calculated with an in-house data-reduction routine (E2agecalc) following methods of Pullen et al. (2018). Analyses of zircon grains from our samples are reported in Table S3, with results filtered for discordance (using cutoffs of 80 % and 105 % concordance), precision (10 %), and common Pb (> 600 cps counts of 204). Following the recommendations of Horstwood et al. (2016), uncertainties for individual analyses include only internal (random or measurement) uncertainty contributions, whereas uncertainties of pooled ages contain both internal and external (systematic) contributions.
Detrital age distributions are displayed and analyzed with normalized probability density plots, which are based on the individual ages and measured uncertainties from each sample. Provenance interpretations are based on the main clusters of ages, with less emphasis on ages that do not belong to clusters given the possibility that they are unreliable due to Pb loss, inheritance, analysis of inclusions, high common Pb, or unusual Pb–U fractionation due to ablation along fractures (Gehrels, 2014).
Analysis of provenance is conducted by comparison with age distributions from five likely source regions for Permian–Triassic strata of the Colorado Plateau, which include the Appalachian orogen, the Ouachita orogen, local basement rocks of southwestern Laurentia, the East Mexico arc, and the Permian–Triassic magmatic arc developed along the Cordilleran margin of southwestern North America (Fig. 1; Dickinson, 2018). The age distributions for these regions include data from (1) upper Paleozoic strata of the Appalachian foreland basin (Thomas et al., 2017) and Illinois and Forest City basins (Kissock et al., 2018), (2) upper Paleozoic strata of the Delaware (Xie et al., 2018), Fort Worth (Absalem et al., 2018), and Marathon (Thomas et al., 2019) basins, (3) lower Paleozoic strata of the Grand Canyon (Gehrels et al., 2011) and Cordilleran passive-margin strata in southern California and northern Sonora (Gehrels and Pecha, 2014), (4) Permian and Triassic strata of the Barranca and El Antimonio formations of Sonora (Gonzalez-Leon et al., 2009; Gehrels and Pecha, 2014), Jura-Cretaceous strata of the Great Valley (DeGraaff-Surpless et al., 2002; Surpless et al., 2006; Wright and Wyld, 2007), Permian–Triassic igneous rocks in California (Chen and Moore, 1982; Miller at al., 1995; Tobisch et al., 2000; Barth and Wooden, 2006; Barth et al., 2011, 2013; Saleeby and Dunne, 2015), and (5) Mesozoic strata that accumulated adjacent to the East Mexico arc (Ortega-Flores et al., 2014). Age distributions for these five regions are presented in Fig. 3.
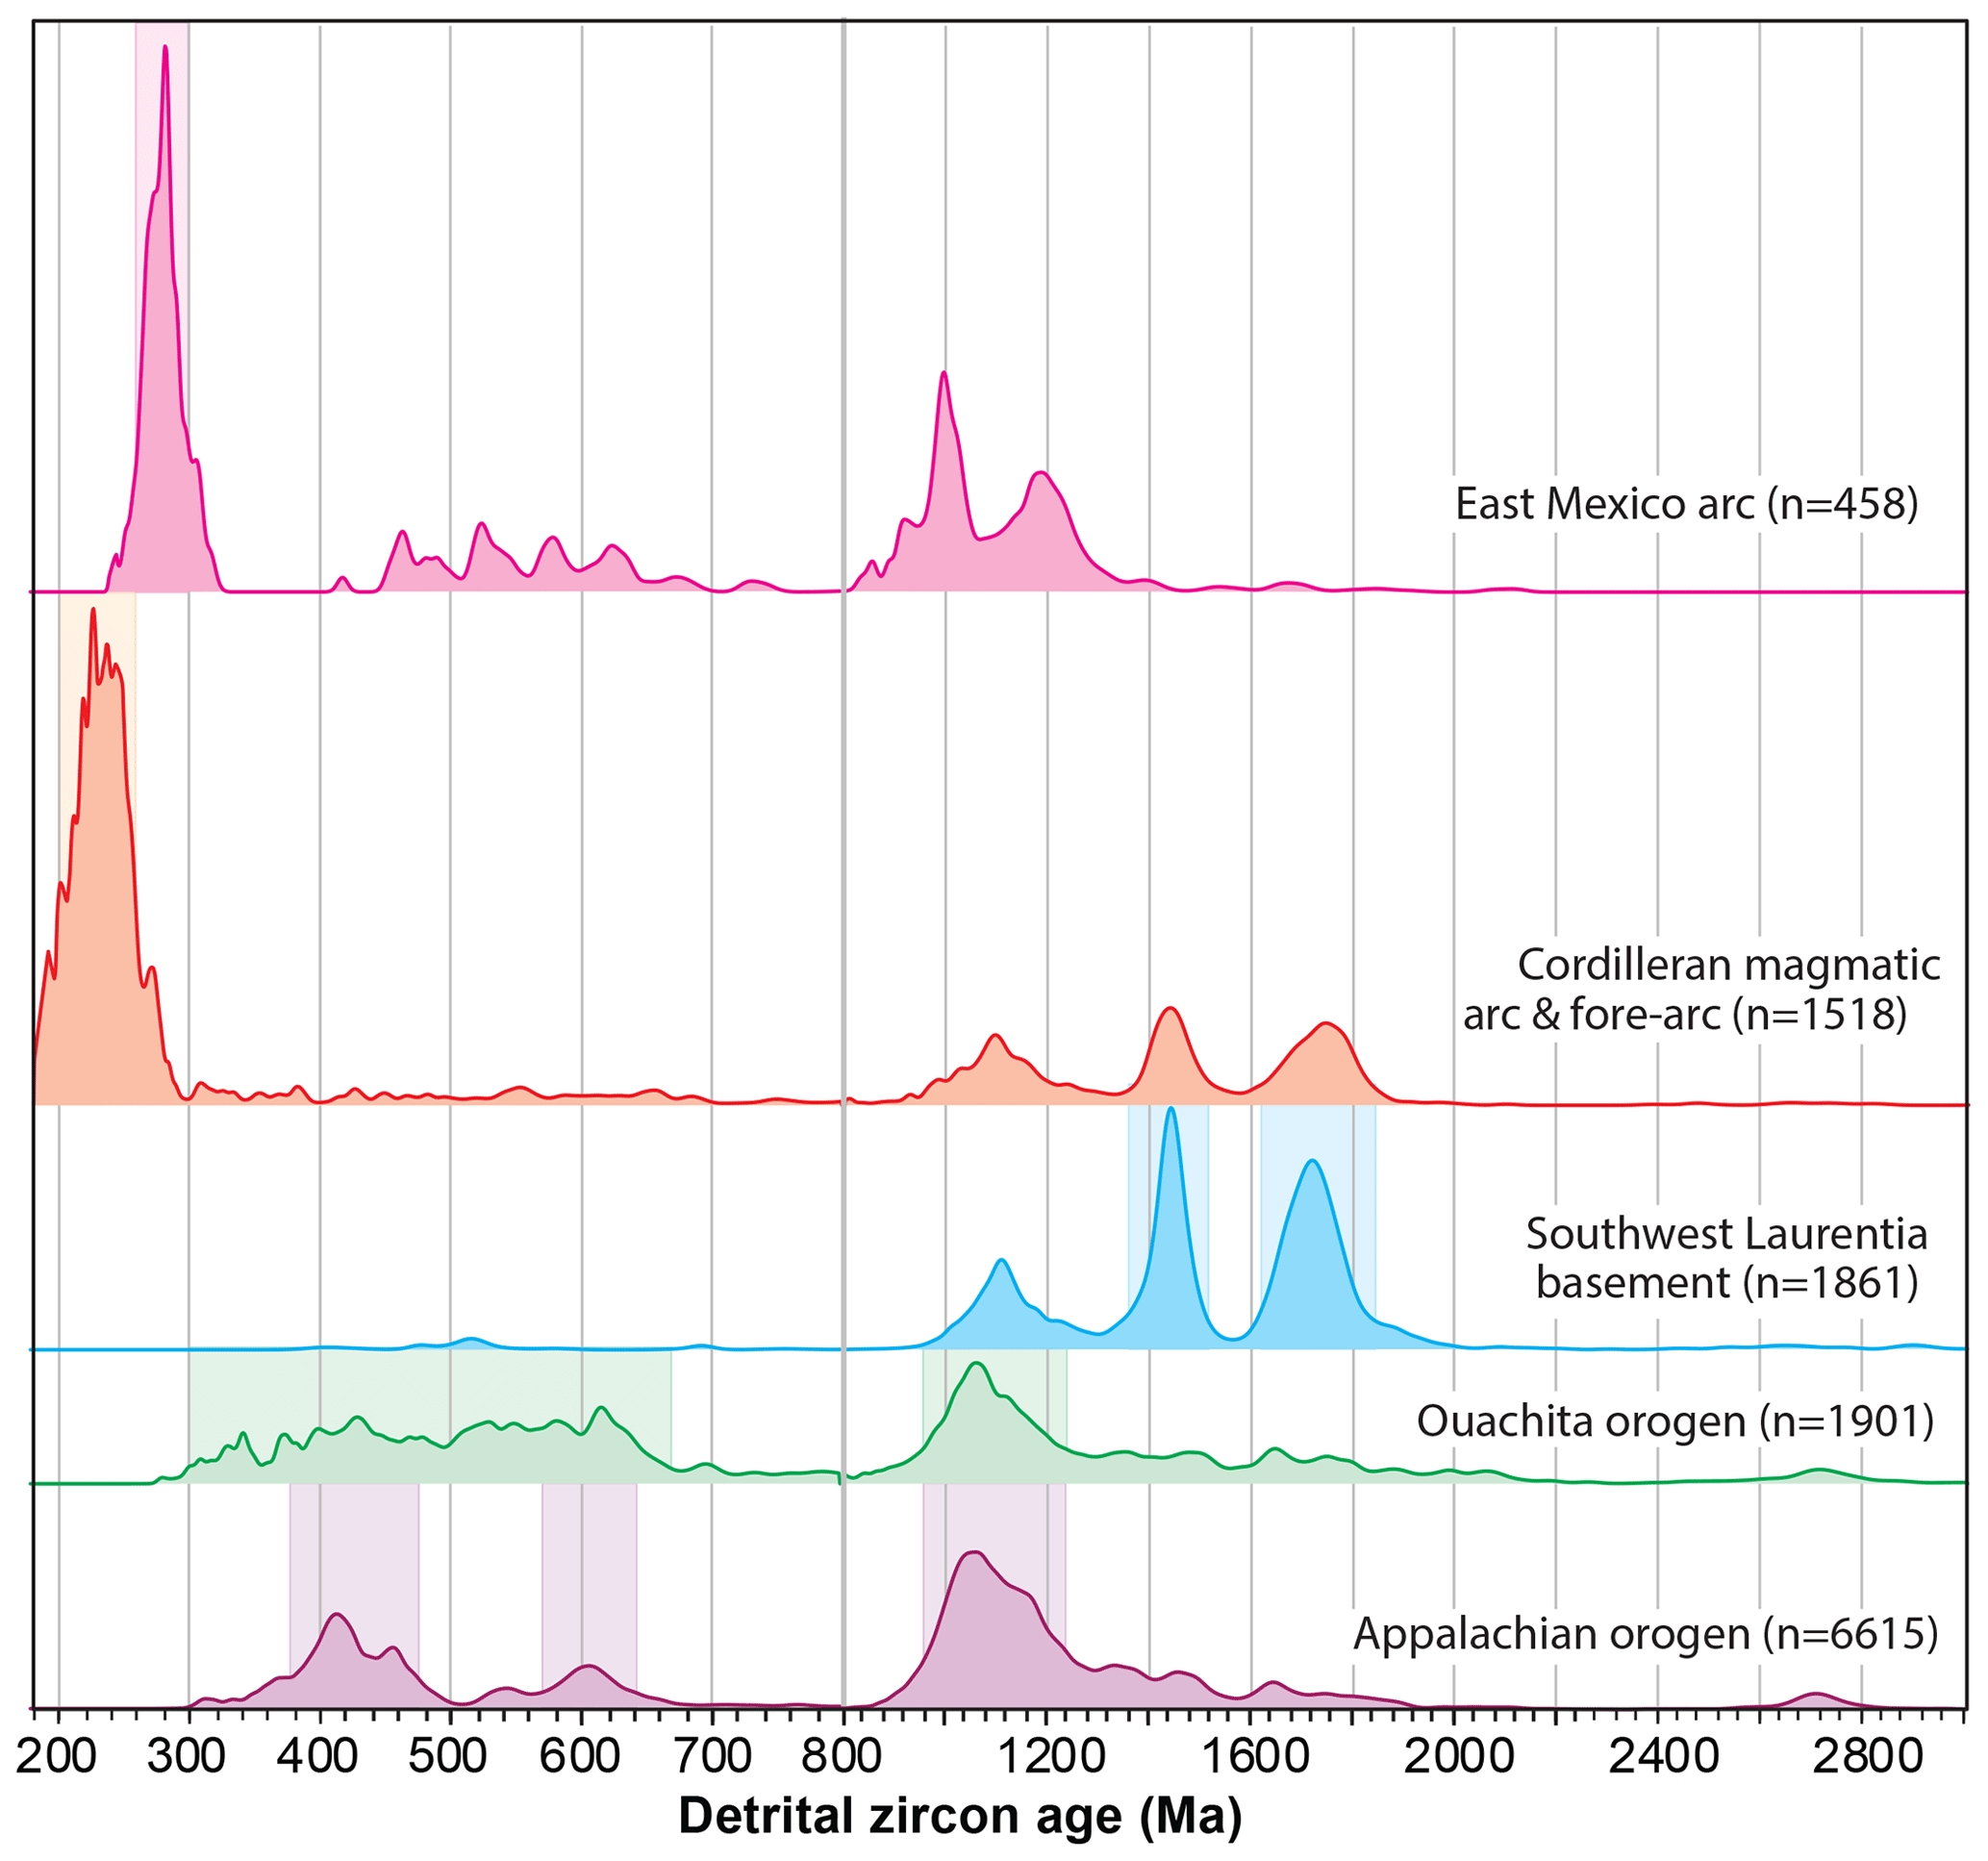
Figure 3Normalized probability density plots of U–Pb (zircon) ages from source terranes. Distinctive age groups include 1750–1620 and 1520–1360 Ma ages from southwest Laurentia basement provinces, 1240–960 Ma ages from Grenville-age provinces exposed in the Appalachian and Ouachita orogens, 640–570 and 480–370 Ma ages characteristic of the Appalachian orogen, 670–300 Ma ages from the Ouachita orogen, 300–260 Ma ages from the East Mexico arc, and 260–200 Ma ages belonging to the Cordilleran magmatic arc of southwestern North America. See text for sources of information.
Comparisons of age distributions are quantified using two different statistical measures that examine the degree to which age distributions contain similar proportions of similar age groups. Metrics used in this study include the Kolmogorov–Smirnov D (KS-D) values and Kuiper V values. The statistical basis as well as strengths and limitations of each of these metrics are summarized by Saylor and Sundell (2016) and Vermeesch (2018a). Results from these comparisons are presented in Tables S4 and S5. The interpretations offered below are based on KS-D values, although Kuiper V values yield similar results. For both metrics, smaller values indicate a higher degree of similarity of age distributions. Comparisons are also presented visually through the use of multidimensional scaling (MDS) diagrams (Vermeesch, 2013; Saylor et al., 2016; Wissink et al., 2018), which provide a two-dimensional representation of the differences between multiple age distributions. MDS analyses are based on KS-D values of the age distributions.
Maximum depositional ages (MDAs) are estimated from the youngest distinct cluster of ages in each sample (e.g., Dickinson and Gehrels, 2009; Gehrels, 2014). The age of this cluster is estimated using five different methods, each of which has strengths and limitations. Complications with these methods arise from (1) the need to make unconstrained decisions about which analyses to include or exclude from consideration, (2) the evidence that dates in some clusters have been compromised by Pb loss, resulting in dates that postdate deposition, (3) the evidence that some clusters also contain slightly older recycled grains that predate deposition, and (4) issues of statistical robustness for some methods (Vermeesch, 2018b). The following are short descriptions of the five methods:
-
The age of the youngest peak on a probability density plot (PDP) is advantageous because no decisions are made about which analyses are included and/or excluded, but it has the disadvantage that no uncertainty is reported for the peak age.
-
The weighted mean age and uncertainty of the youngest cluster are used to calculate the average age of a cluster by weighting each analysis according to the inverse square of its uncertainty. The reported uncertainty relates to the mean age (e.g., standard error of the mean), not the age distribution of constituent analyses (e.g., standard deviation). An advantage of this method is that it also yields a mean square of the weighted deviates (MSWD), which is an indication of the degree to which the ages belong to a single population (values of ∼ 1 or less indicate a single population). A disadvantage of this method is that the investigator must decide which ages are included in the calculation, which leads to the possibility of subjective bias. In this study, clusters include the main set of continuous ages, with boundaries selected at the youngest and oldest gaps in ages. This calculation is available from the weighted mean function in Isoplot (Ludwig, 2008).
-
The TuffZirc method determines the age and uncertainty of the youngest cluster using the age extractor function in Isoplot (Ludwig, 2008), which identifies the largest cluster of ages that overlap to an acceptable degree (probability of fit > 0.05), reports the median value as the most likely age, and uses the range of included ages to calculate an asymmetric uncertainty. The reported uncertainty refers to the median value (not the range of constituent analyses). Excluded ages are interpreted to predate the selected cluster (if older) or to be compromised by Pb loss (if younger). This method is advantageous in that no subjective decisions are made about including/excluding ages.
-
The maximum likelihood method reports the age and uncertainty using a maximum likelihood analysis to determine the Gaussian distribution that best fits the youngest cluster. The reported uncertainty refers to the most likely value (not the range of constituent analyses). This method is advantageous in that no subjective decisions are made about including/excluding ages. It is available from the Unmix function of Isoplot (Ludwig, 2008).
Finally, we also use the minimum age model of Galbraith and Laslett (1993) and Vermeesch (2020). This method assumes that a set of dates is a mixture of a discrete young component and a continuous older component. It uses the method of maximum likelihood to determine the age and uncertainty of the younger component. Calculations were conducted using IsoplotR (Vermeesch, 2018b), which returns the minimum age and also a central age that is similar to the weighted mean described above.
The results of these calculations are presented in Table S6. Shown separately are estimates from the first four methods noted above and the average of these four estimates, as well as the minimum age (and uncertainty), which we interpret as the maximum depositional age.
Table S6 also reports the age and uncertainty of the youngest analysis from each sample. This youngest age does not provide a reliable maximum depositional age given that the youngest age of a distribution will always be younger than the true age due to analytical uncertainty (Gehrels, 2014). For example, as described by Coutts et al. (2019), consider the analytical data from a population of zircon grains that have exactly the same true age. Because of analytical uncertainty, the measured ages of half of the analyses will be younger than the true age, and half will be older, and the youngest age will be significantly younger than the mean (true) age. Ironically, the more grains are analyzed, the greater the inaccuracy of this youngest age will be (Vermeesch, 2020)!
In addition to this statistical bias, the youngest single age will be even farther from the mean (true) age if it has been compromised by Pb loss (e.g., Andersen et al., 2019). We report these youngest ages because they provide important information about the possibility that analyses included in the youngest cluster have also experienced Pb loss. Table S6 accordingly reports this youngest age (and uncertainty), as well as information about its U concentration, the average U concentration of the youngest cluster of ages, and whether the youngest age belongs to the youngest cluster or is an outlier (based on TuffZirc analysis). U concentration is important because Pb loss is commonly correlated with the degree of radiation damage, which is a function of U concentration (and age).
A second test of the likelihood that analyses belonging to the youngest cluster have experienced Pb loss is provided by a plot of U concentration versus age for analyses belonging to the youngest cluster. Such plots are shown for every sample in Table S3, and whether a correlation exists is indicated in Table S6.
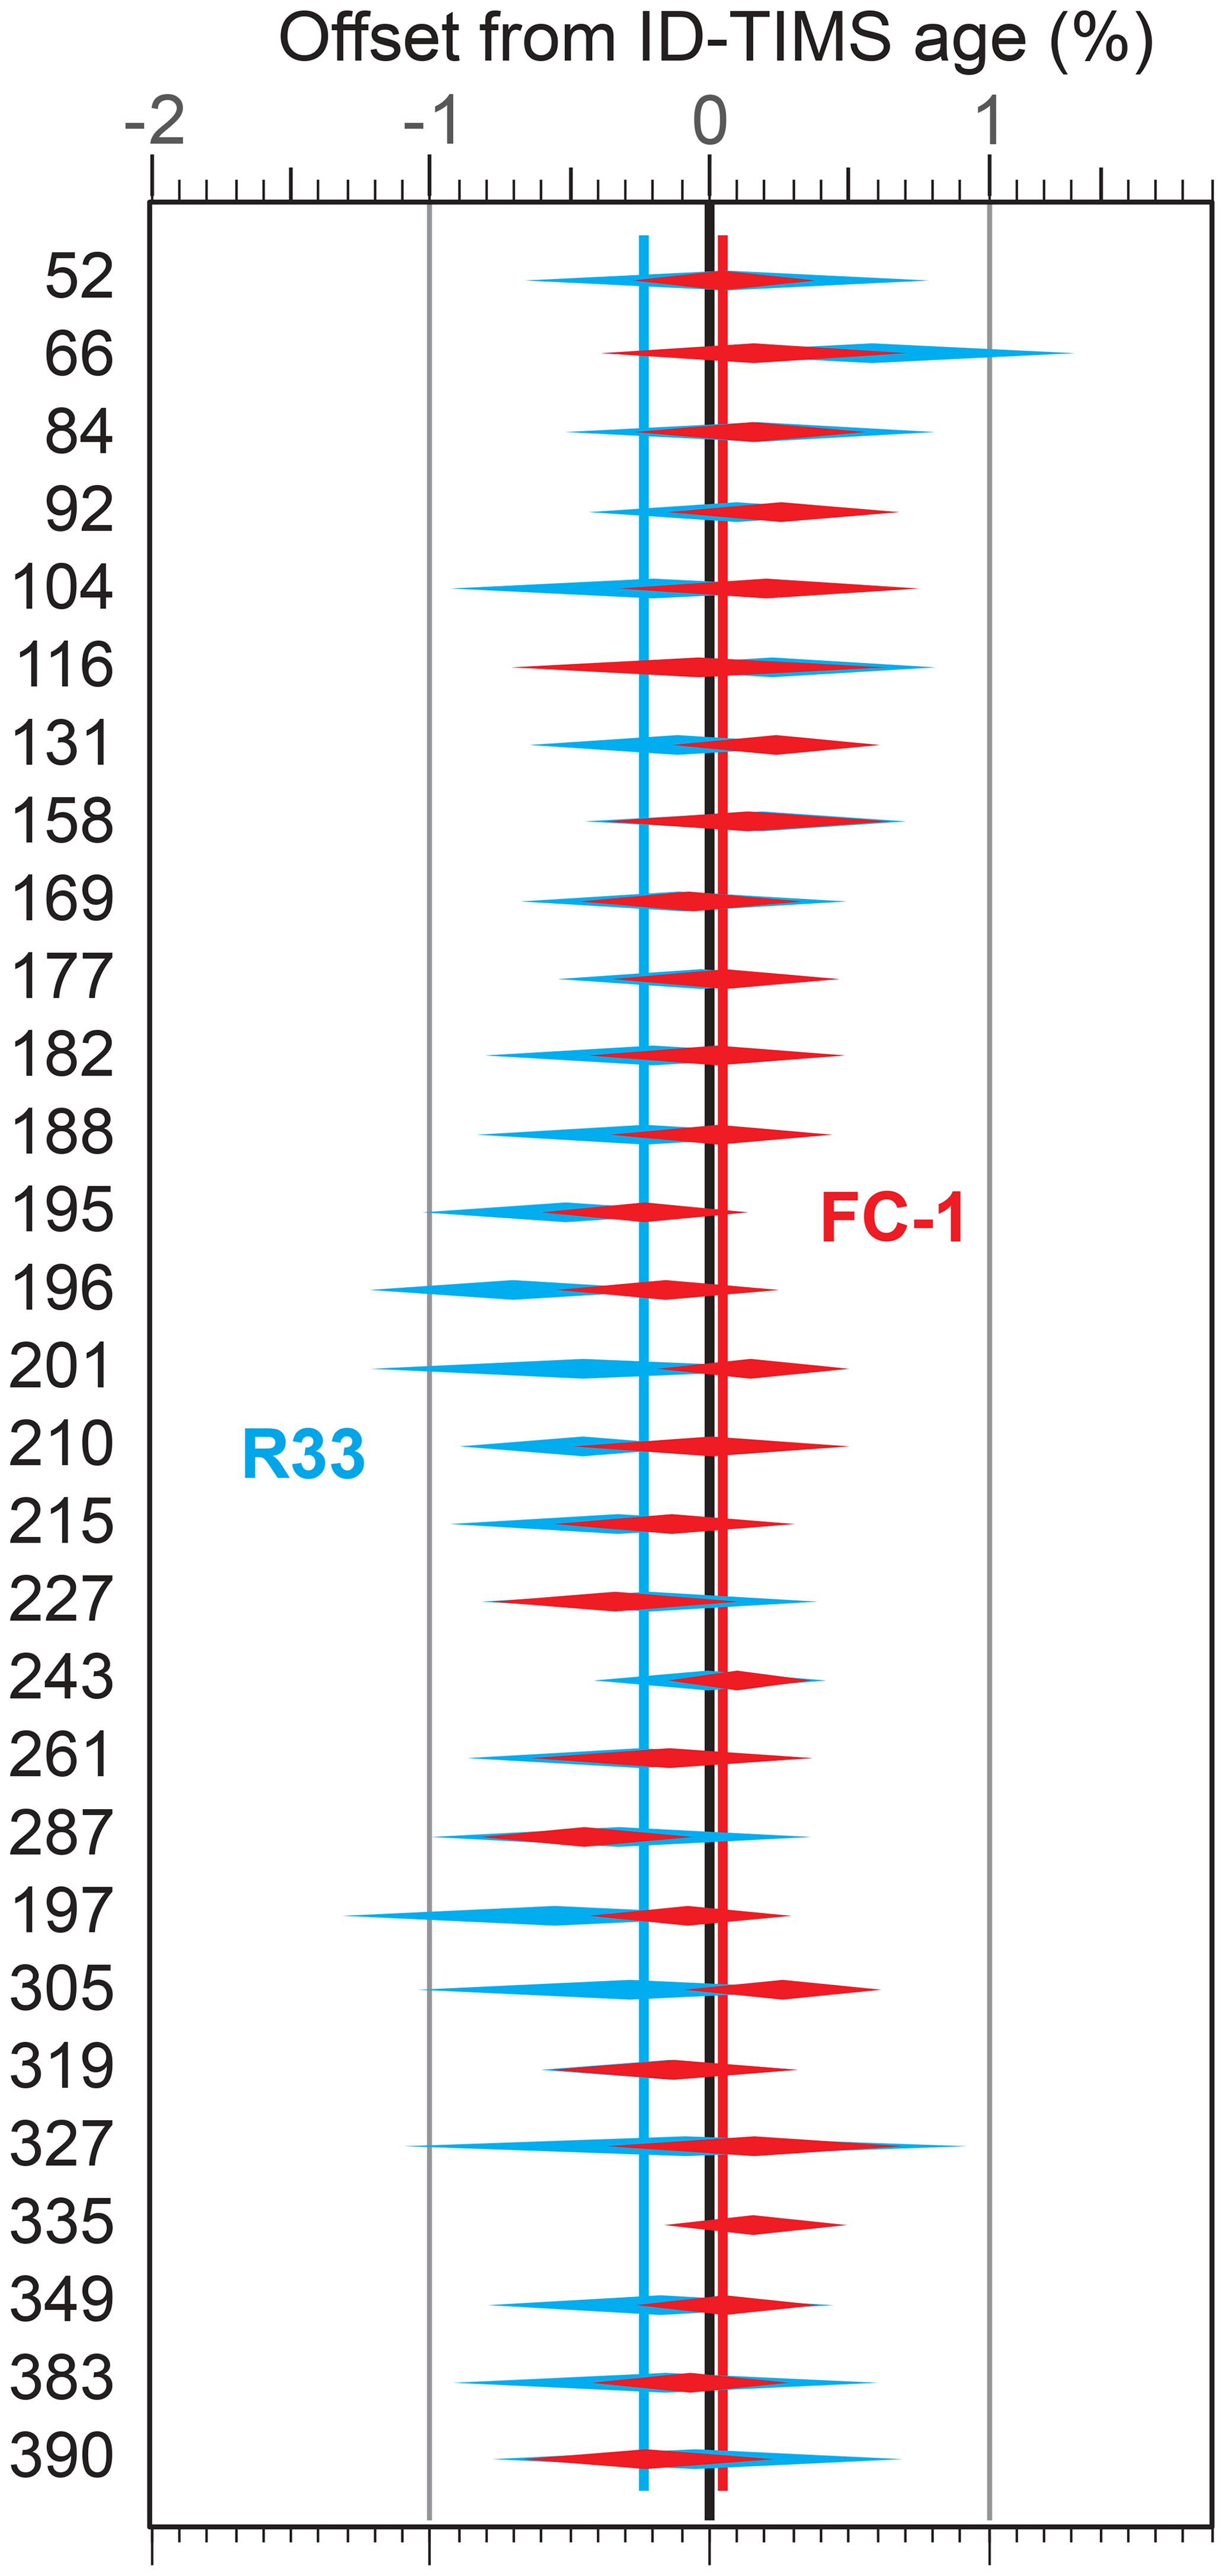
Figure 4Plot showing the accuracy of dates of secondary standards analyzed during the current study. Each pair of symbols represents the weighted mean age and 2σ uncertainty of R33 and FC-1 analyses conducted with each sample, expressed as % offset from reported ID-TIMS dates of 1099.9 Ma for FC-1 (Paces and Miller, 1993) and 419.26 Ma for R33 (Black et al., 2004). For FC-1, 1065 analyses are reported, with MSWD of 0.95 for all analyses. For R33, 295 analyses are reported, with MSWD of 0.92 for all analyses. Data are reported in Table S7.
The average precision of individual analyses reported herein is 2.3 % (2σ) for dates and 2.6 % for dates. For pooled ages, calculated as described above, the average precision is 0.52 % (2σ) including only internal uncertainties and 0.98 % (2σ) including both internal and external sources of uncertainty. The accuracy of our analyses can be estimated from the age of the secondary standards that were analyzed with each set of unknowns. As reported in Table S7 and shown in Fig. 4, sets of dates for FC-1 are offset between +0.25 % and −0.45 % from the reported date of 1099.9 Ma (Paces and Miller, 1993), with an average offset for all 1065 analyses of +0.03 %. For R33, offsets range from +0.85 % to −0.95 % from the assumed age of 419.3 Ma (Black et al., 2004), with an average offset for all 291 ages of −0.23 %. MSWD values for the sets of FC-1 and R33 ages are 0.95 and 0.92 (respectively) – this demonstrates that reported uncertainties for individual analyses are accurate, and that MSWD values for sets of unknown ages are reliable indicators of the existence of multiple age components.
Interpretation of our ages relative to the geologic timescale is based on the August 2018 version of the International Chronostratigraphic Chart (Cohen et al., 2013, updated 2018).
U–Pb geochronology by LA-ICPMS also provides U concentrations and U ∕ Th values for each analysis, which can be used as a geochemical fingerprint of detrital zircon grains (e.g., Gehrels et al., 2006, 2008; Riggs et al., 2012, 2016). This information is accordingly reported for each analysis in Table S3 and for each set of analyses in Table S6.
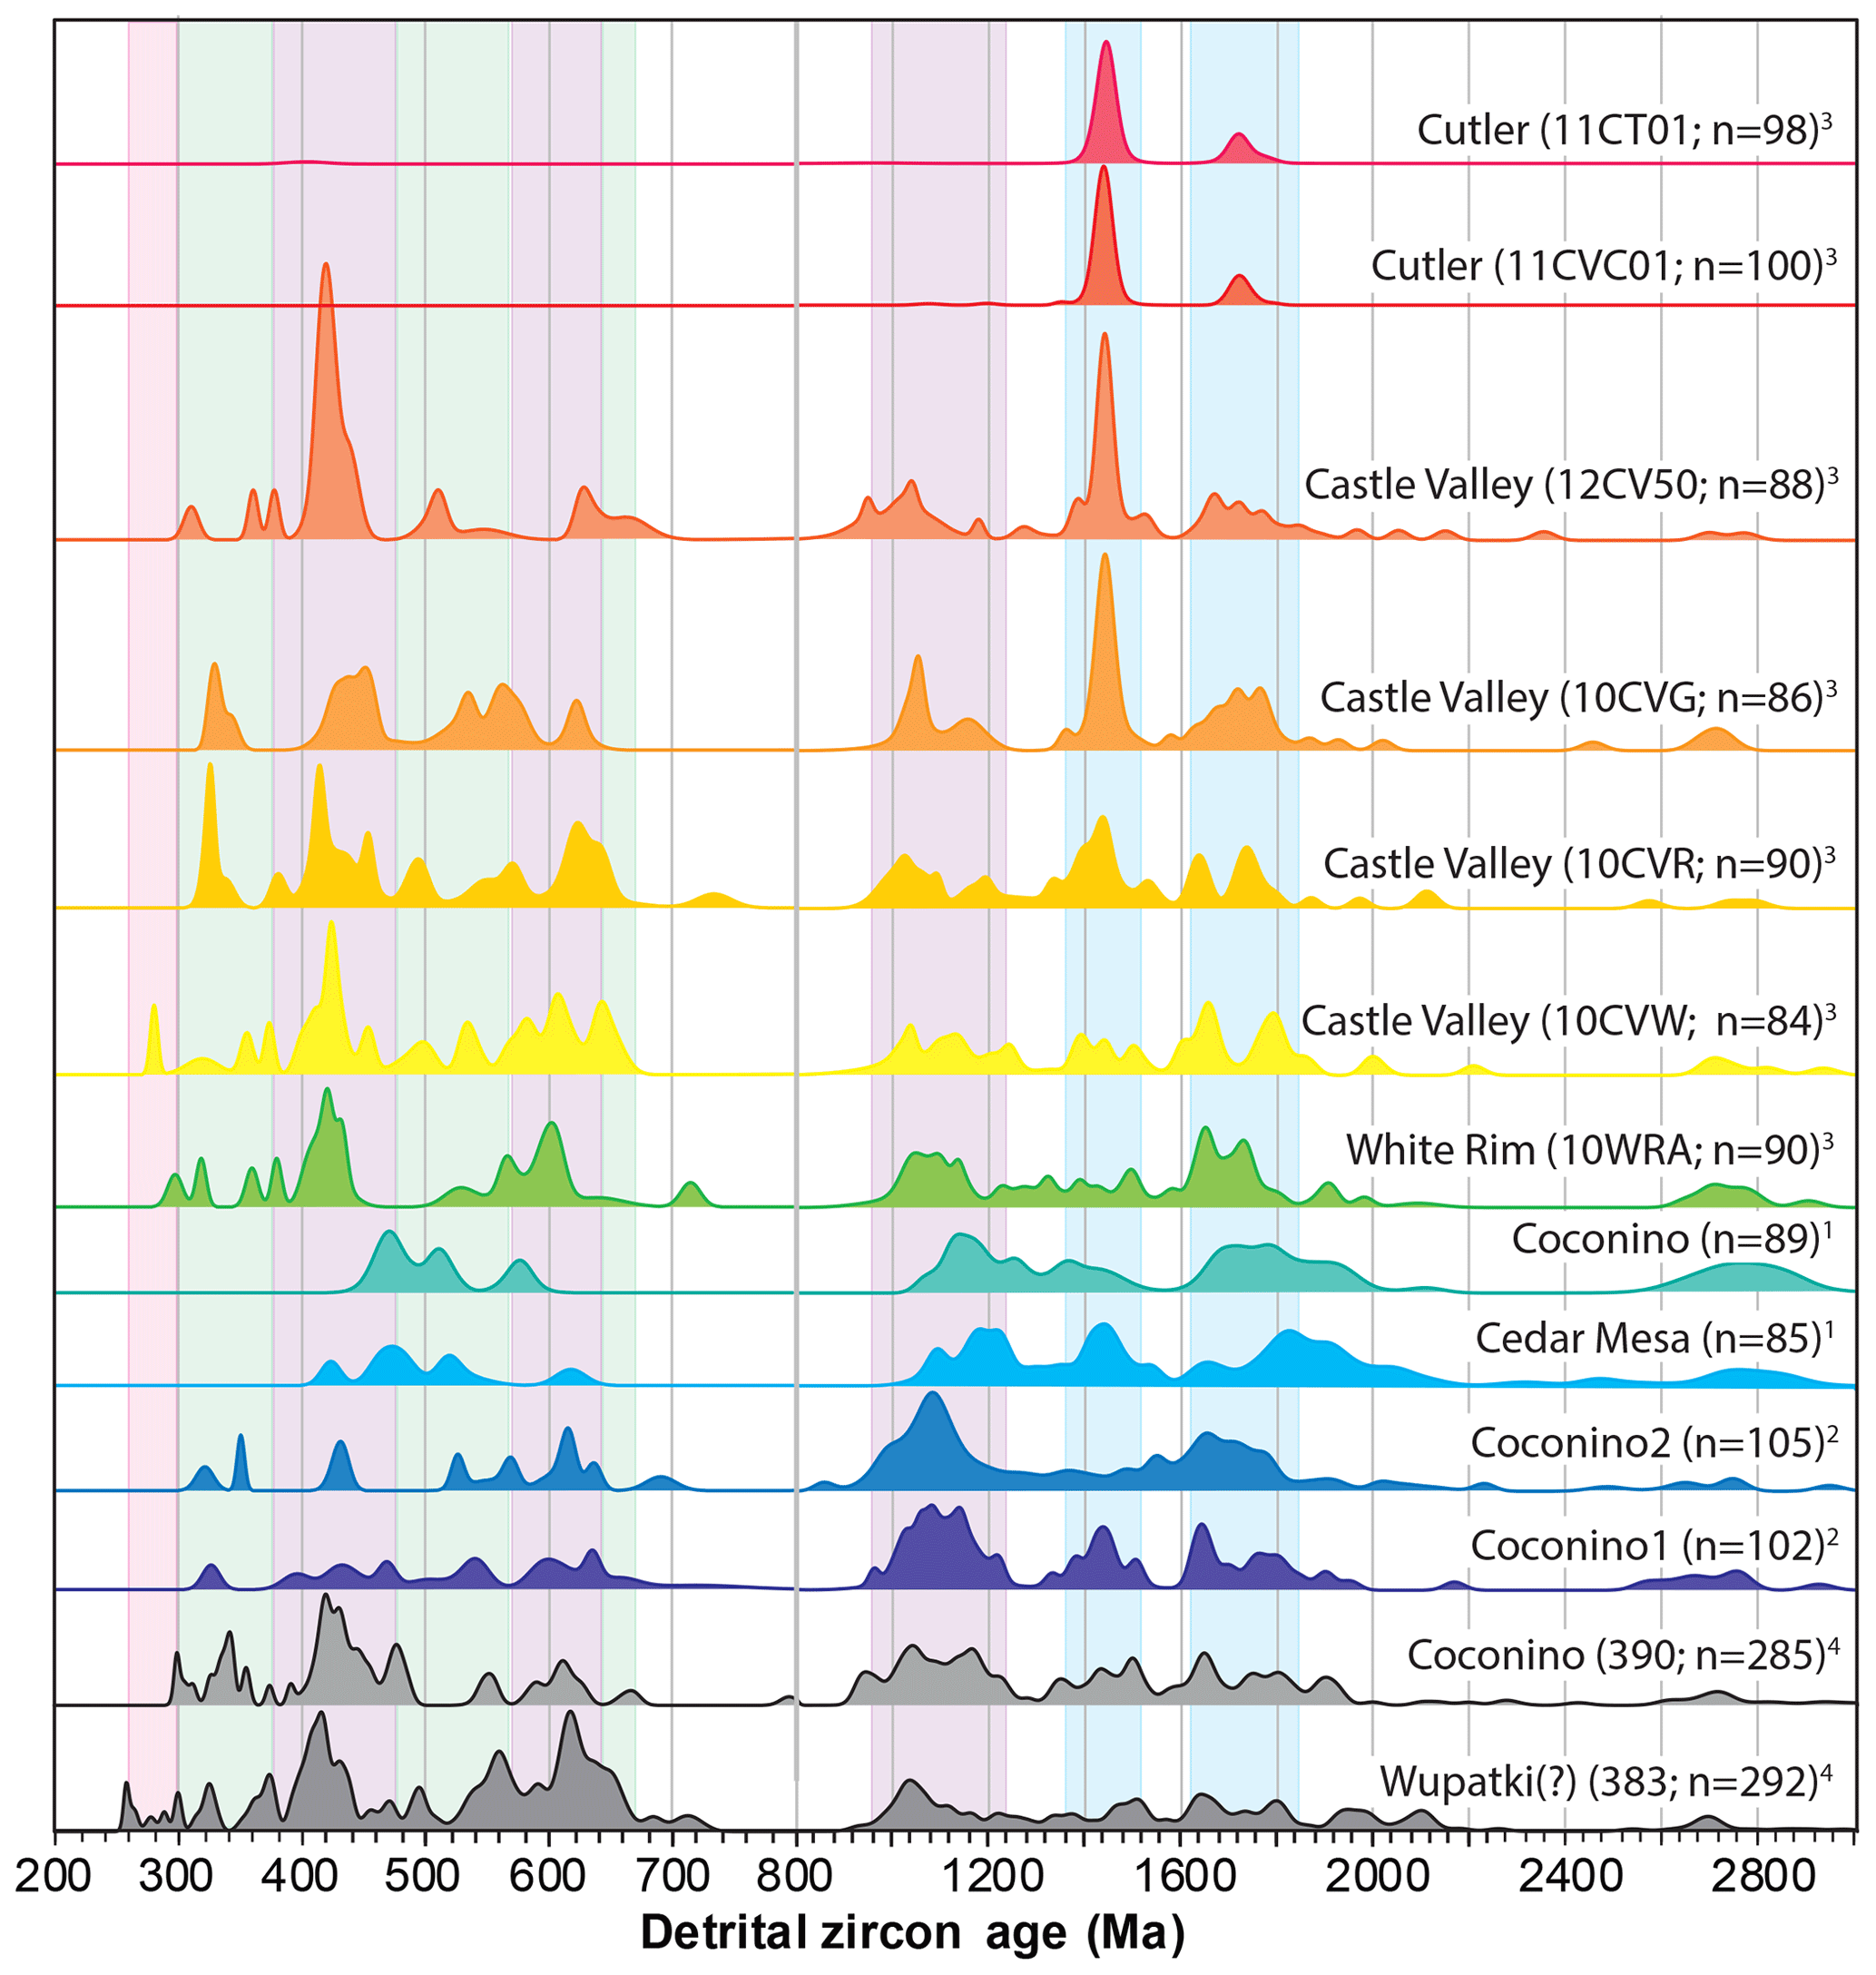
Figure 5Normalized probability density plots of detrital zircon ages from our sample of the Coconino Sandstone and from other lower Permian sandstones of the Colorado Plateau. Numbers of constituent analyses are shown for each sample. Data are from 1 Dickinson and Gehrels (2003), 2 Gehrels et al. (2011), 3 Lawton et al. (2015), and 4 this study. Shown for reference are age ranges from the Appalachian orogen (purple bands) and from local basement rocks (blue bands) (from Fig. 3), which are interpreted by previous researchers to have sourced most of the detritus in these units. Also shown is our sample 383-2, which is interpreted to belong to the Wupatki Member of the Moenkopi Formation but has an age signature characteristic of lower Permian strata of the Colorado Plateau.
Results of our U–Pb geochronologic analyses are described below, keyed to the age distributions for individual samples that are shown in Figs. 5, 6, and 7. Figure 8 presents age distributions for combined sets of samples. Age distributions from all of the samples are compared statistically in Table S4 using the five metrics described above, and MDS plots are shown in Fig. 9.
We note that Rasmussen et al. (2020) have reported a subset of the LA-ICPMS ages presented herein. The ages reported in their study are for the grains selected for CA-TIMS analysis, which in most cases are among the youngest grains in each of our samples (as documented in Sect. S2). This strategy was followed assuming that these grains represent the youngest age components in each sample, and accordingly provide the most useful maximum depositional ages. The individual dates reported in the two studies are identical, but, given the selection process noted above, the pooled ages reported by Rasmussen et al. (2020) are consistently younger than the pooled ages reported herein. A comparison of the results of the two studies is summarized in Sect. S2. The discussions below are based on the full set of ages from each sample.
Sample numbers are registered to the Colorado Plateau Coring Project (CPCP) core (CPCP-PFNP13-1A) by the number of the core run and segment (e.g., our sample number 383-2 is from CPCP-PFNP13-1A-383Y-2, which specifies that the material is from run 383, segment 2). The part of each segment that was collected for geochronologic analysis is specified in Table S1.
5.1 Coconino Sandstone
Our sample from quartz arenite of the lower Permian (Leonardian) Coconino Sandstone (sample 390-1) yielded 285 acceptable ages (Table S3; Fig. 5). Most grains belong to two broad age groups of ∼ 2.0–1.0 Ga and ∼ 640–295 Ma. Individual age peaks are at 2712, 1898, 1746, 1646, 1497, 1432, 1347, 1162, 1038, 667, 612, 590, 552, 476, 430, 419, 391, 374, 355, 341, and 300 Ma.
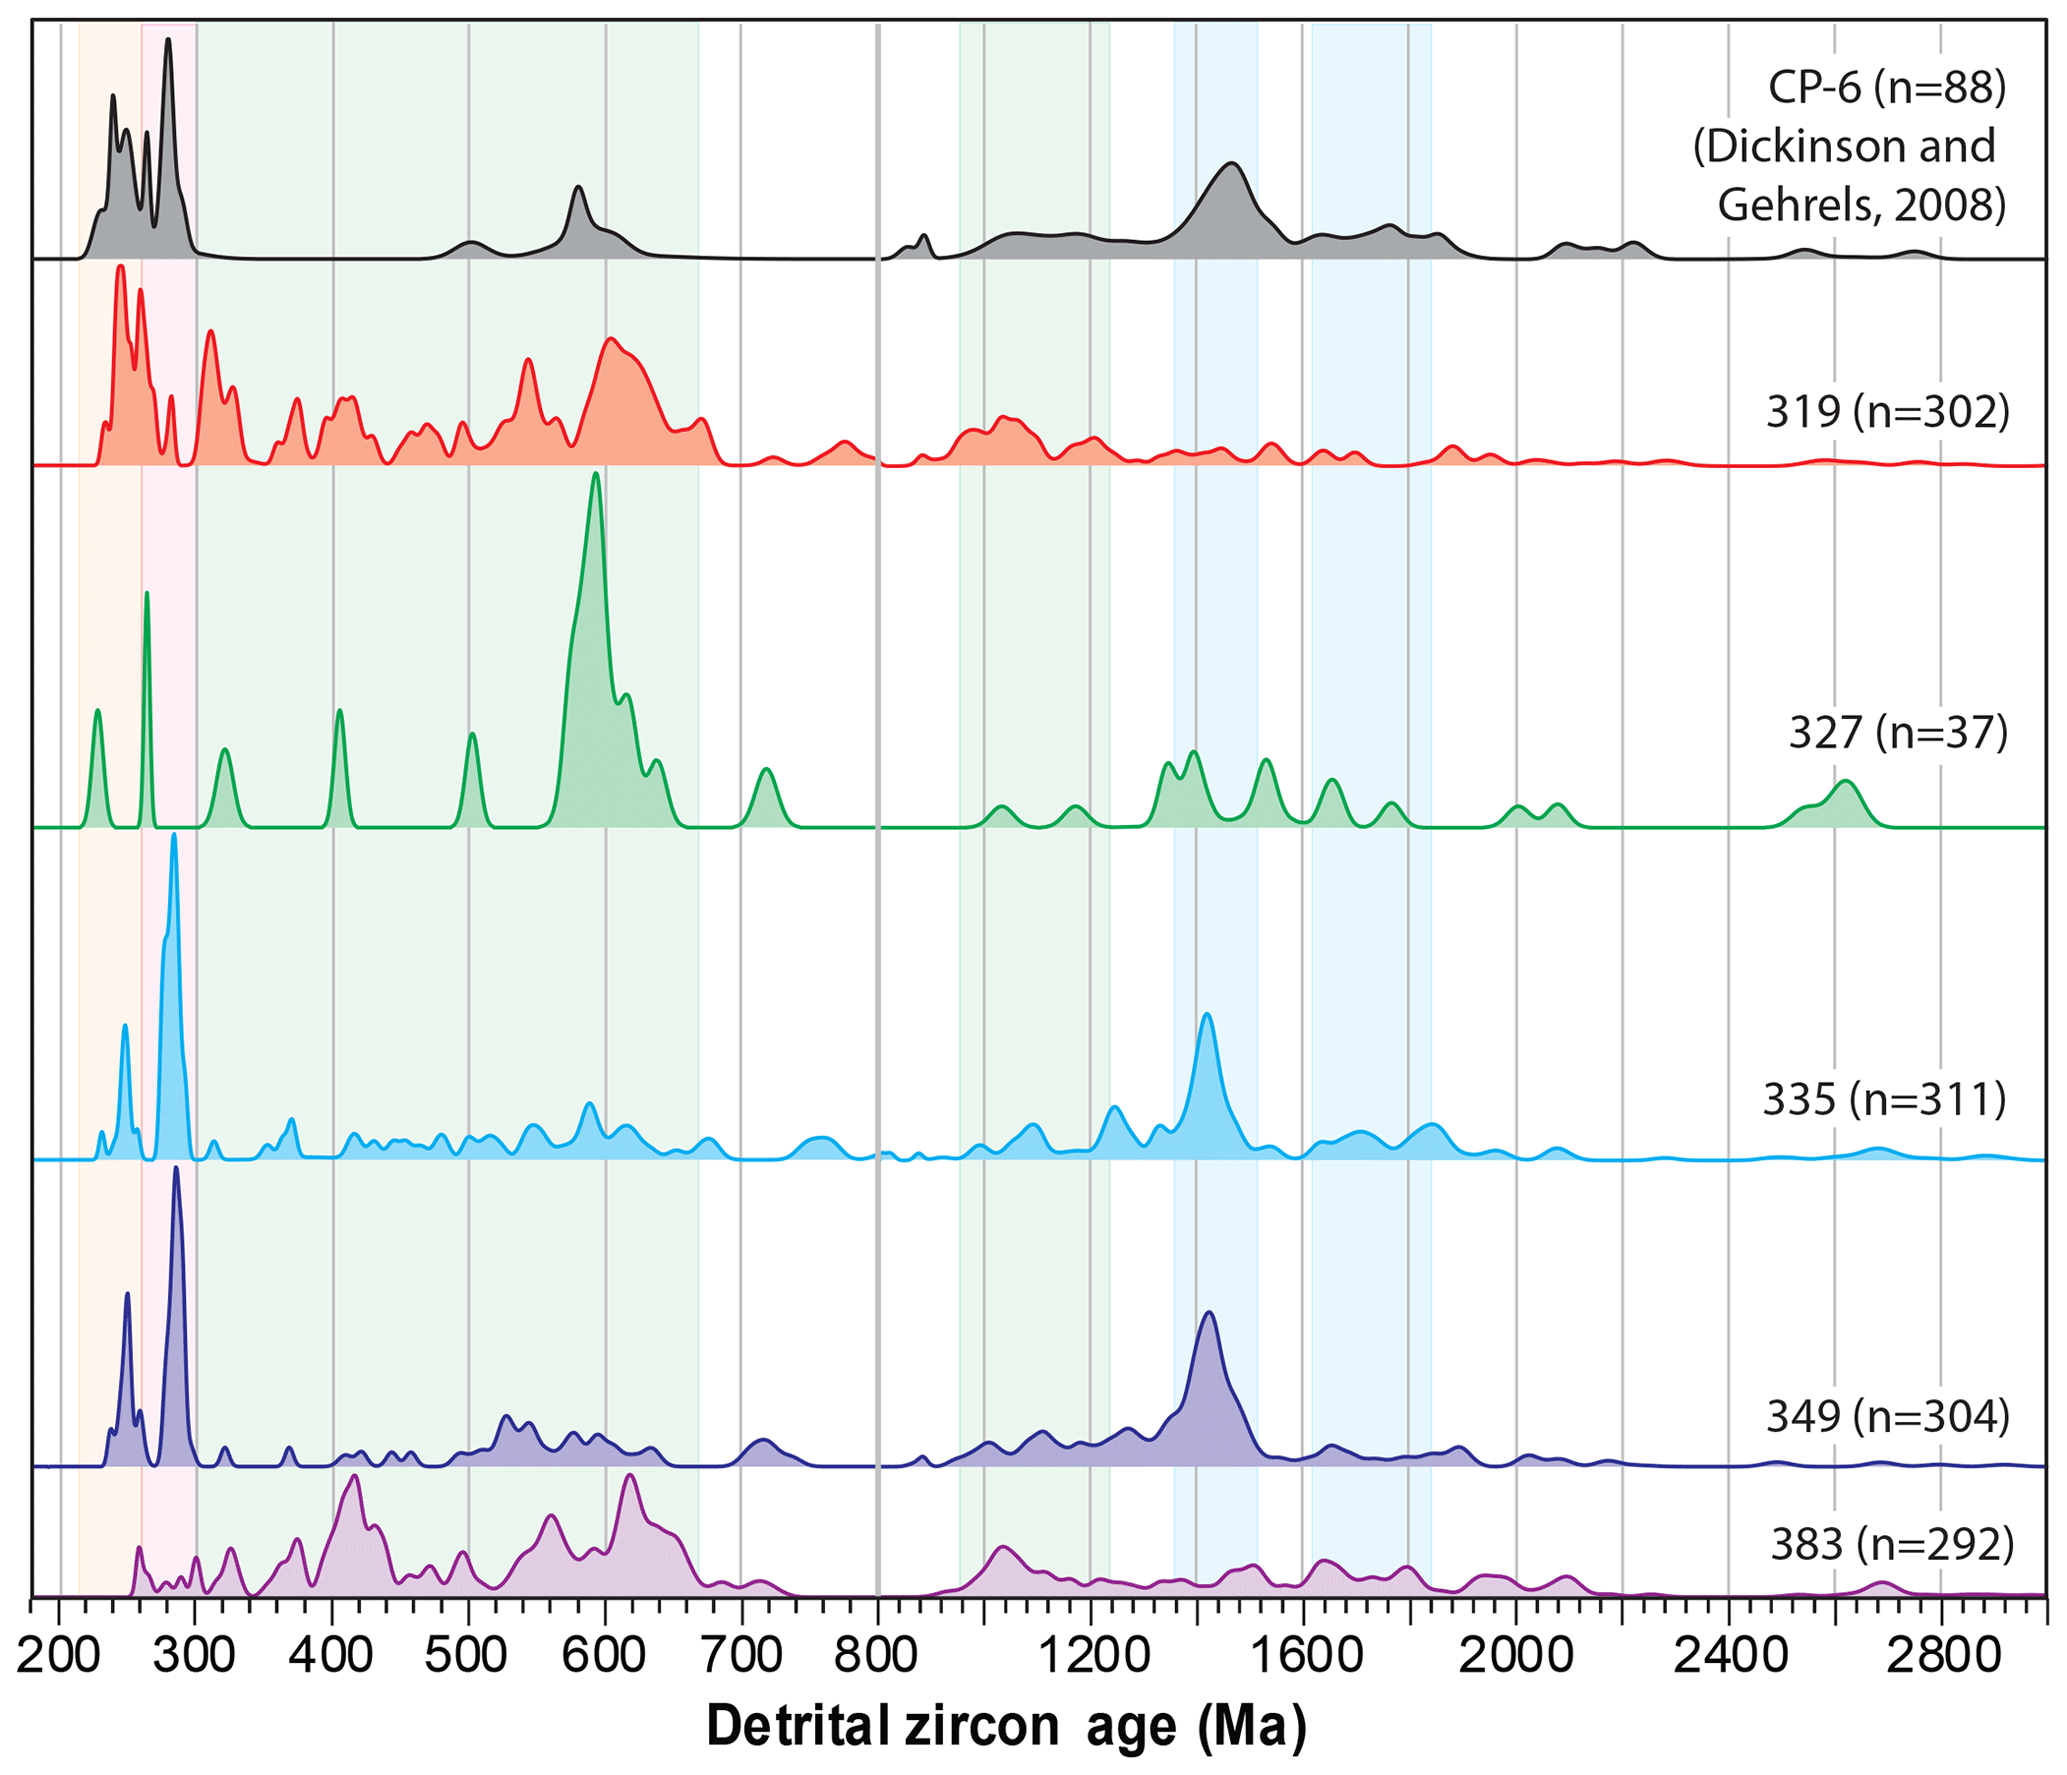
Figure 6Probability density plots of detrital zircon ages from four samples from the Moenkopi Formation (lower four curves) as well as a Moenkopi sample from Dickinson and Gehrels (2008). Numbers of constituent analyses are shown for each sample. Samples 349-3, 335-1, 327-2, and 319-2, plus the sample from Dickinson and Gehrels (2008), are all from the Holbrook Member. Sample 383-2 is interpreted to belong to the Wupatki Member but has an age distribution that resembles lower Permian strata. Source regions are interpreted to include local basement rocks (blue bands), the Ouachita orogen (green bands), the East Mexico arc (red band), and the Late Permian–Triassic arc built along the Cordilleran margin (orange band).
5.2 Moenkopi Formation
Five samples from the Early–Middle Triassic Moenkopi Formation have been analyzed (Fig. 2). The lowest sample (383-2) is assigned to the Wupatki Member based on the red–brown laminated mudstone to fine-grained sandstone lithology (Fig. 2; Table S1). The age distribution from this sample is very similar to that found in underlying upper Paleozoic strata, with two dominant age groups from ∼ 2.2 to 1.0 Ga and from ∼ 680 to 250 Ma (Fig. 5). Although the preferred interpretation for this sample is that it belongs to the lowest part of the Moenkopi Formation, an alternative is that the sample is late Paleozoic in age, and perhaps correlative with fine-grained clastic strata (e.g., the Toroweap Formation) that regionally overlie the Coconino Sandstone. In an effort to provide a comparison with underlying and overlying strata, the results from this sample are shown in Figs. 5 and 6. Additional studies of the sampled horizon are needed to resolve whether this sample belongs to the Moenkopi Formation or underlying upper Paleozoic strata.
The upper four samples (349-3, 335-1, 327-2, and 319-2) are all from sandstone, siltstone, and mudstone of the Holbrook Member. These samples yield generally similar age distributions (average KS-D values of 0.19; Table S4), with significant proportions of ∼ 1.42 Ga, 650–510 Ma, 290–270 Ma, and 250–235 Ma ages (Fig. 6). With ages from all four Moenkopi Formation samples combined, PDP peak ages are 1420, 594, 543, 285, and 250 Ma (Fig. 8).
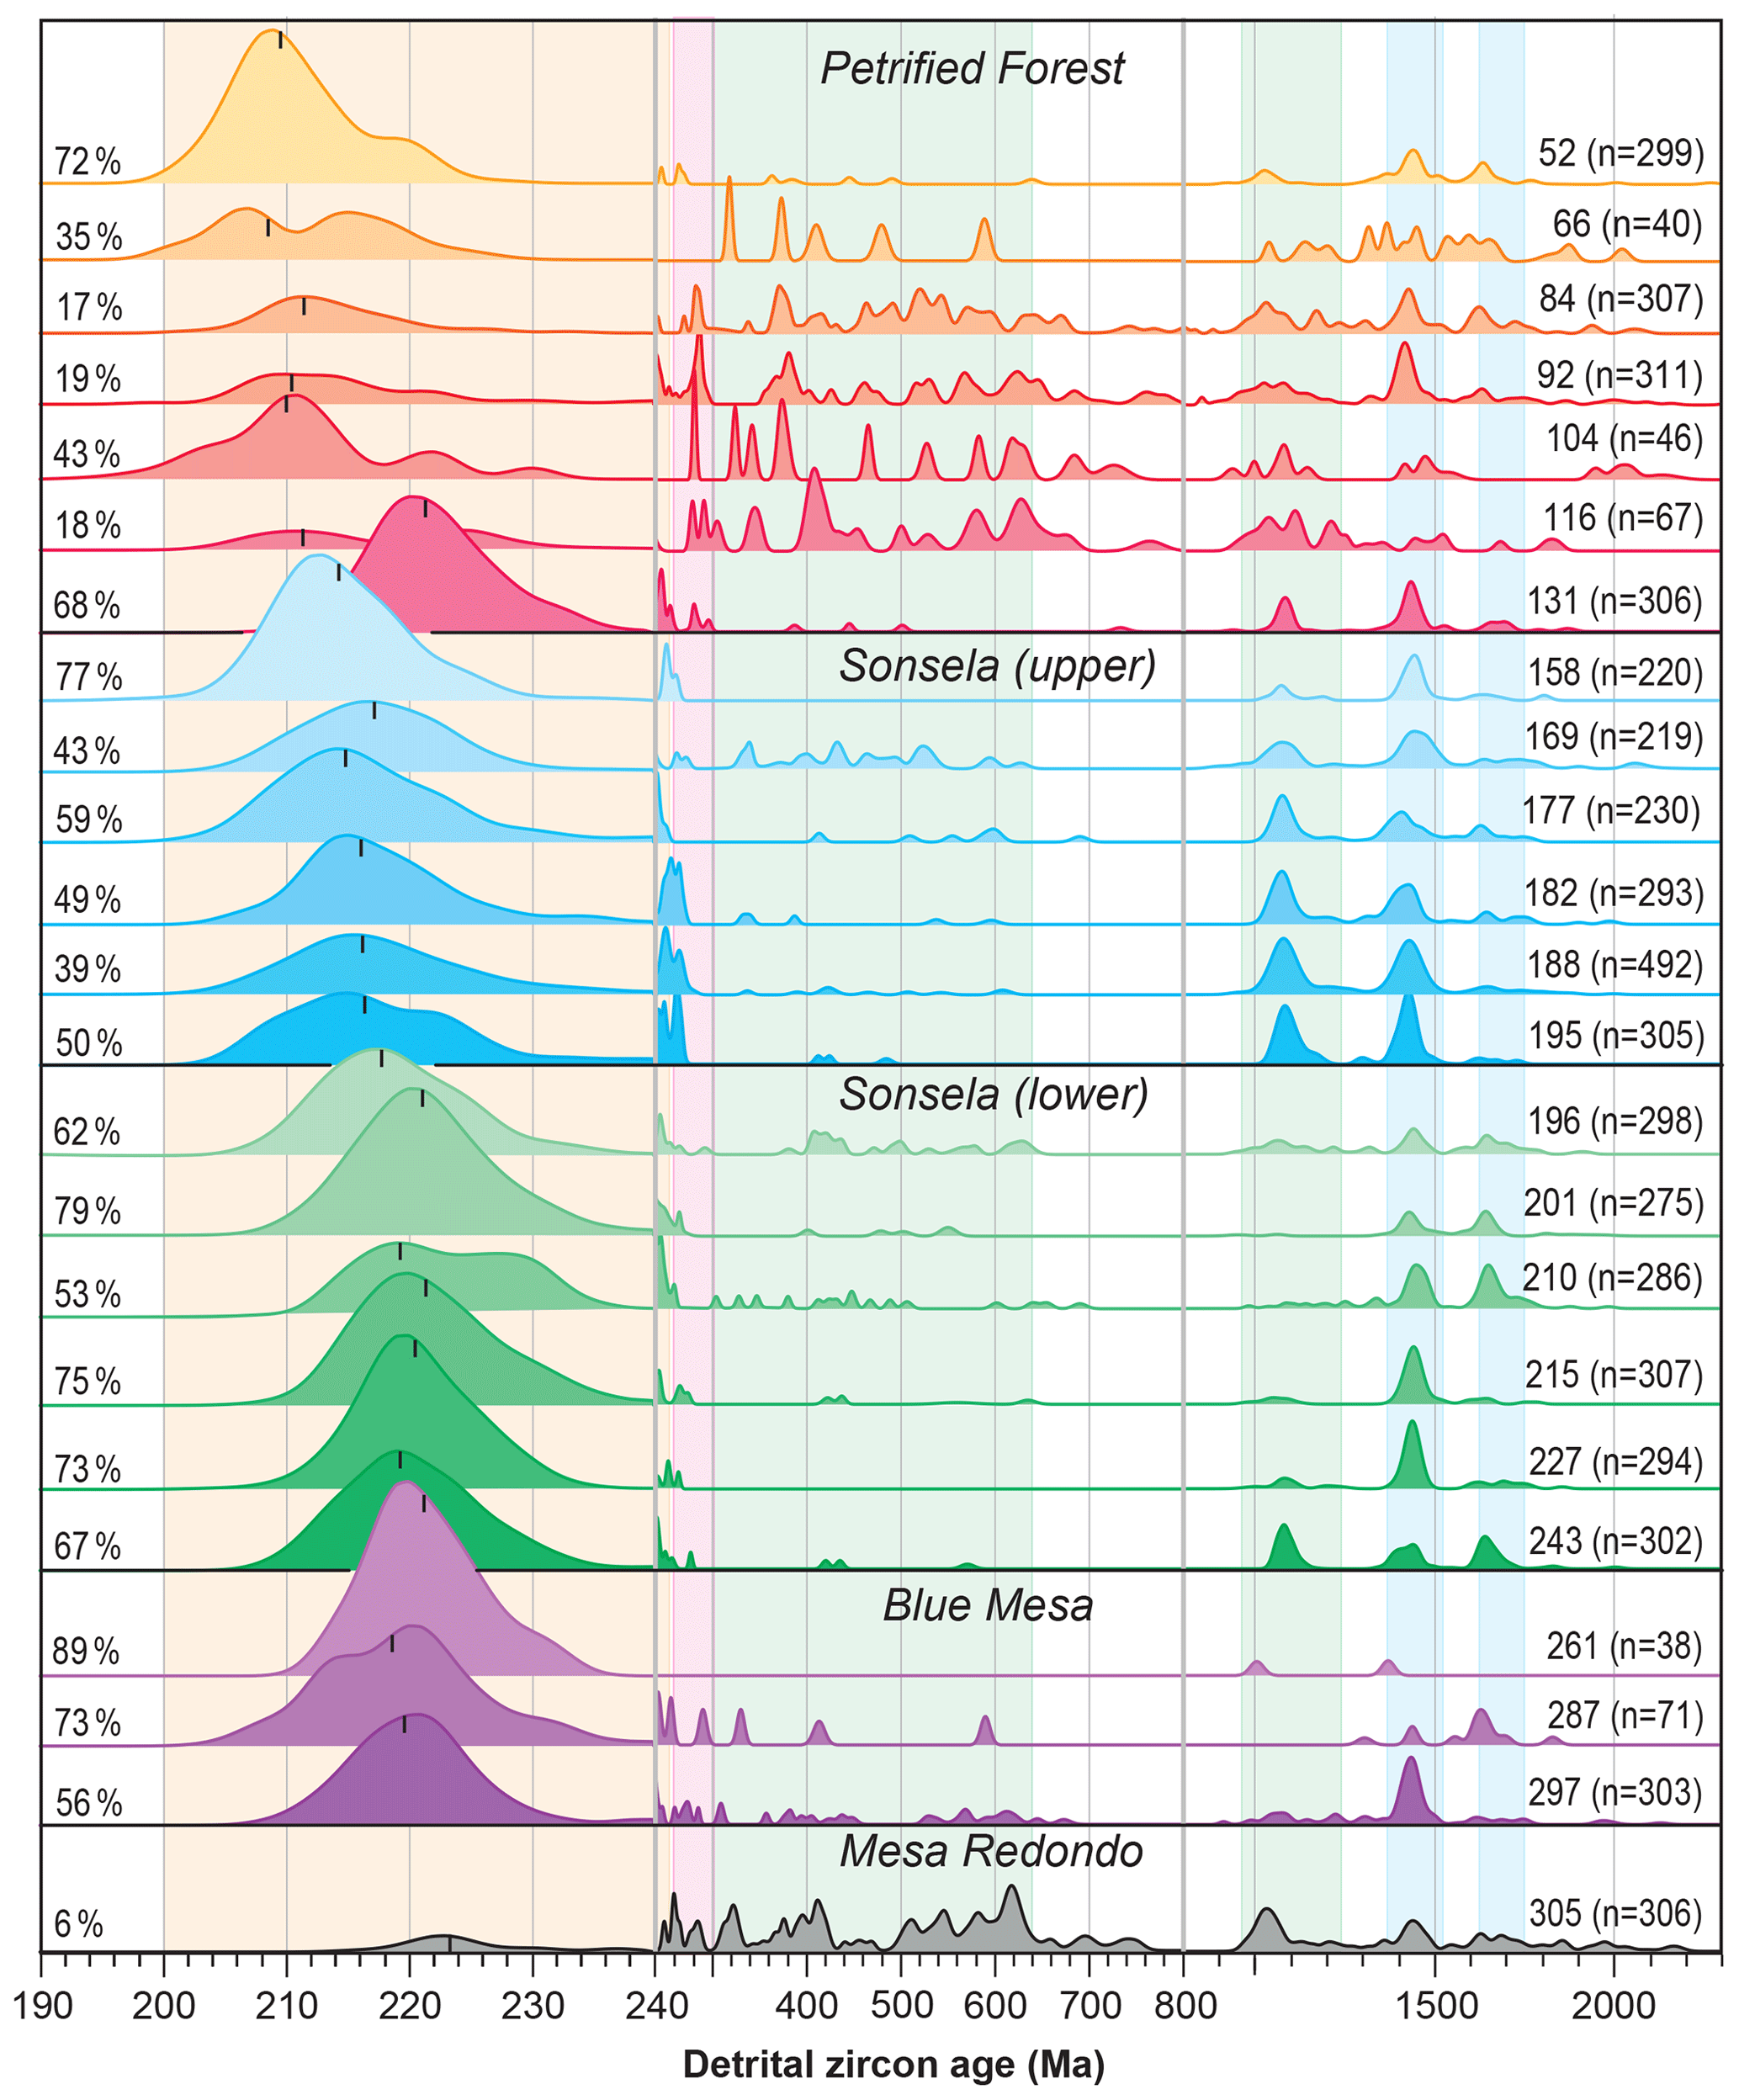
Figure 7Normalized probability density plots of detrital zircon ages from 23 samples from the Mesa Redondo, Blue Mesa, Sonsela, and Petrified Forest members of the Chinle Formation. Numbers of constituent analyses are shown for each sample. Age distributions older than 240 Ma are exaggerated by a factor of 10. Black tick marks indicate the interpreted maximum depositional ages for each sample (from Table S6). Source regions are interpreted to include local basement rocks (blue bands), the Ouachita orogen (green bands), the East Mexico arc (red band), and the Late Permian–Triassic arc built along the Cordilleran margin (orange band). The percent of all grains that are < 240 Ma in age is shown for each sample on the left.
5.3 Chinle Formation
A total of 23 samples from the Mesa Redondo Member, Blue Mesa Member, Sonsela Member, and Petrified Forest Member of the Chinle Formation have been analyzed (Fig. 2). Results from each member are described separately below.
5.4 Mesa Redondo Member
One sample of sandstone from the Mesa Redondo Member (305-2) yields dominant age groups of ∼ 2.0–1.6 Ga, 1.44 Ga, 1.1–1.0 Ga, 750–500 Ma, and 450–300 Ma, and 290–220 Ma (Fig. 7), with PDP peak ages of 1443, 1036, 618, 412, 323, 248, and 223 Ma. As reported in Table S4 and shown in Fig. 9b and c, the > 240 Ma ages in this sample resemble ages in the underlying Moenkopi Formation and Coconino Sandstone.
5.5 Blue Mesa Member
Three samples (297-2, 287-2, 261-1) of siltstone and mudstone from the Blue Mesa Member yield similar results, with nearly identical < 240 Ma ages and small but varying proportions of ∼ 1.64 Ga, 1.44 Ga, 1.1–1.0 Ga, 650–500 Ma, and 440–240 Ma ages (Figs. 7 and 8). Both < 240 Ma ages (Fig. 9a) and > 240 Ma ages (Fig. 9c) differ from those in underlying strata of the Mesa Redondo Member. Between 56 % and 89 % of the grains analyzed from these samples yield ages between 232 and 210 Ma, with PDP peak ages of 221–220 Ma (Fig. 7; Table S6). With all three samples combined, 62 % of the ages are < 240 Ma, and PDP peak ages are 1630, 1440, and 220 Ma (Fig. 8).
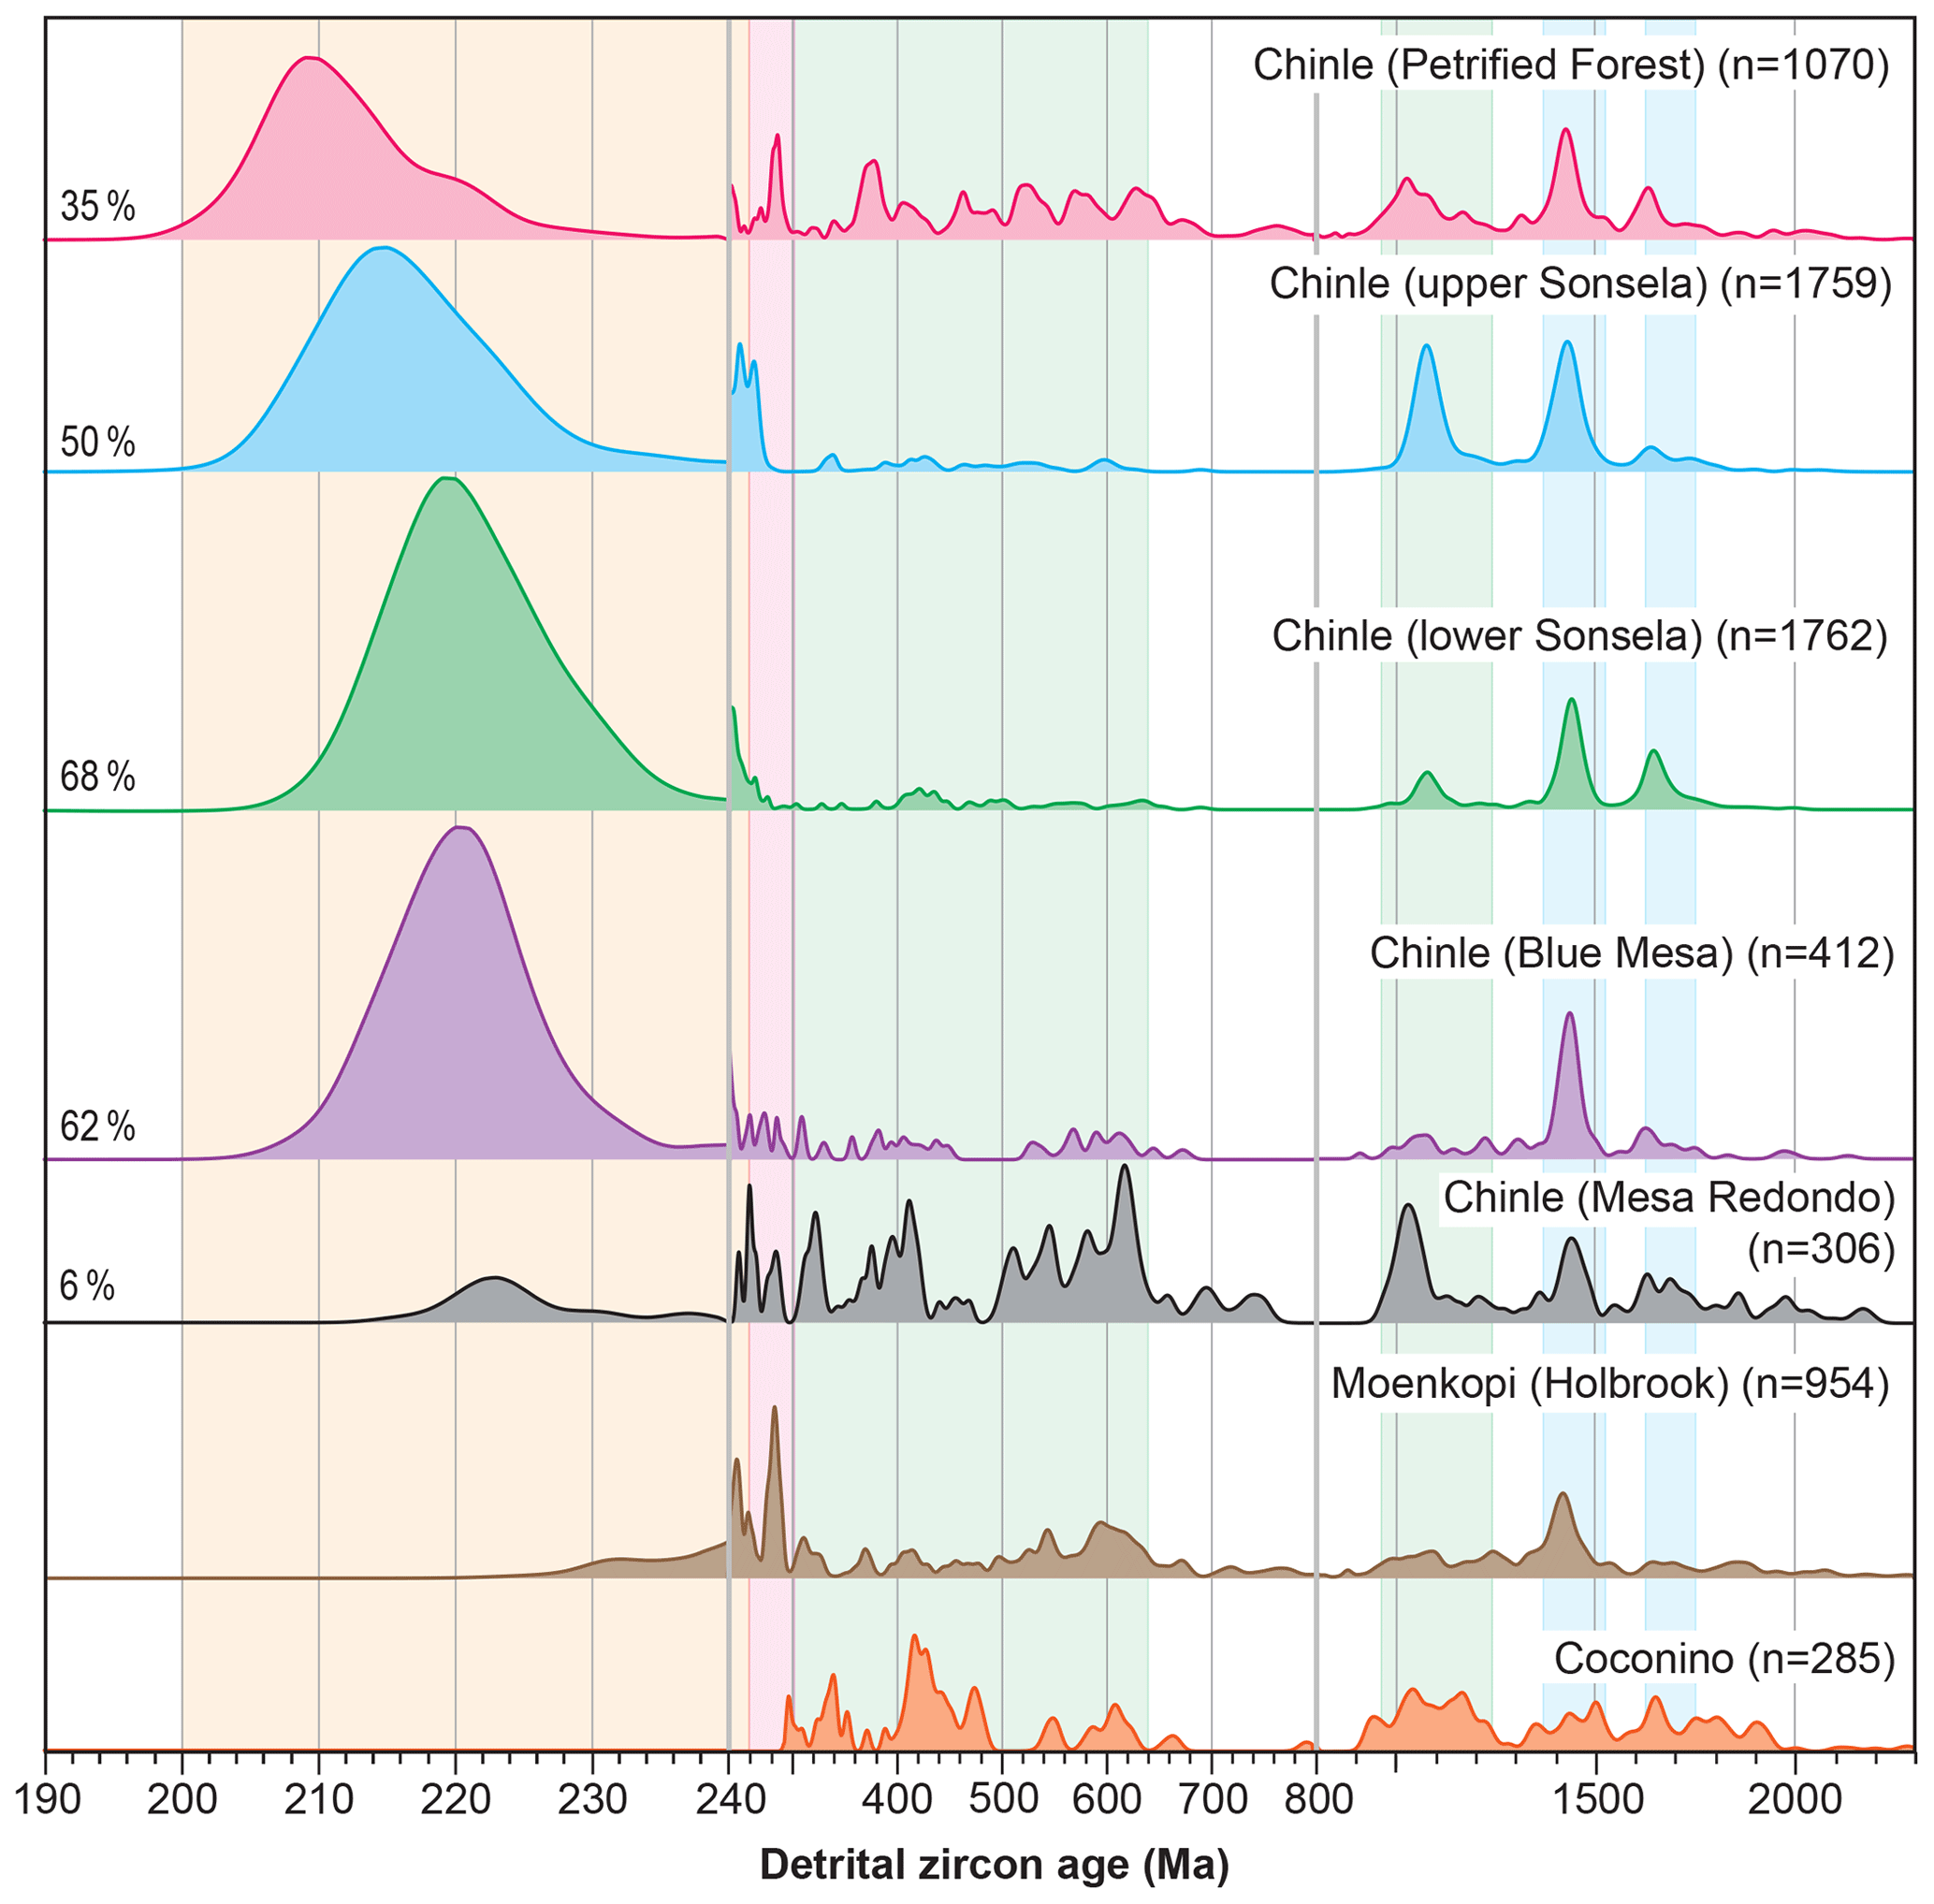
Figure 8Normalized probability density plots of detrital zircon ages from each set of samples analyzed in this study. Numbers of constituent analyses are shown for each sample. Age distributions older than 240 Ma for Chinle strata are exaggerated by a factor of 10 relative to < 240 Ma ages. Age distributions for Moenkopi and Coconino sandstones are exaggerated by a factor of 5 relative to Chinle ages. Source regions are interpreted to include local basement rocks (blue bands), the Ouachita orogen (green bands), the East Mexico arc (red band), and the Late Permian–Triassic arc built along the Cordilleran margin (orange band). Results from sample 383-2 are not included in this plot because of its uncertain stratigraphic position. Data from sample 131-2 are omitted because they differ from ages present in other samples from the Petrified Forest Member. The percent of all grains that are < 240 Ma in age is shown for each sample on the left.
5.6 Sonsela Member
Overall, 12 samples (243-3 to 158-2) from the Sonsela Member yield two different sets of age distributions (Figs. 7, 8, and 9; Table S3). The lower six samples (243-3 to 196-3), all consisting of sandstone and subordinate siltstone (Table S1), yield small numbers of Precambrian grains that are mostly ∼ 1.65 and 1.44 Ga, with few ∼ 1.1–1.0 Ga grains. These samples yield between 53 % and 79 % ages < 240 Ma, with most ages between 234 and 208 Ma, and PDP peak ages of 221–218 Ma (Fig. 7). With ages from all six samples combined, 68 % of the grains are <240 Ma, and PDP peak ages are 1650, 1445, 1084, and 219 Ma (Fig. 8). Comparison of age distributions (Figs. 7 and 8), KS-D values (Table S4), and MDS patterns (Fig. 9) suggests that the < 240 Ma ages in lower Sonsela Member strata are similar to < 240 Ma ages in underlying Blue Mesa strata, whereas > 240 Ma ages in the two sets of samples are less similar due to the variability of ages from the three Blue Mesa Member samples. Ages that are > 240 Ma in these strata have even less similarity to ages from the Mesa Redondo Member, Moenkopi Formation, and Coconino Sandstone (Fig. 9; Table S4).
The upper six samples from the Sonsela Member (195-2 to 158-2) consist mainly of sandstone and subordinate siltstone (Table S1). All six samples yield a subordinate but consistent proportion of Precambrian ages that are mostly ∼ 1.43 and 1.1–1.0 Ga, with few 1.65 Ga grains (Fig. 7). Grains with ages of < 240 Ma comprise between 39 % and 77 % of the grains analyzed. These ages are somewhat younger than in lower Sonsela Member samples, with PDP peak ages of 217–214 Ma. With all six samples combined, 50 % of the grains are < 240 Ma, and PDP peak ages are 1643, 1434, 1082, 256, and 215 Ma (Fig. 8).
Statistical analysis (MDS patterns in Fig. 9 and KS-D values in Table S4) shows that the < 240 Ma ages in upper and lower Sonsela Member strata are significantly different, whereas > 240 Ma ages are less distinct. Exceptions to this are > 240 Ma ages in sample 243-3 (lower Sonsela Member), which resemble equivalent ages in strata of the upper Sonsela Member (Fig. 9c), and < 240 Ma ages in sample 196-3, which share characteristics with strata of both the upper and lower Sonsela Member (Fig. 9a). Ages from strata of the upper Sonsela Member show even less overlap with ages from strata of the Blue Mesa Member and underlying units (Fig. 9 and Table S4).

Figure 9MDS plot (Vermeesch, 2013) comparing age distributions of samples analyzed herein with each other and with possible source areas. MDS (metric) analyses were conducted using the software of Saylor et al. (2018). Data from samples analyzed herein are in Table S3. Ages for source regions are from the sources cited in the text. Stars represent MDS values for sets of examples, with the exception that sample 131-2 is not included with other Petrified Forest samples.
5.7 Petrified Forest Member
Seven samples (131-2 to 52-2) from the Petrified Forest Member were collected mainly from claystone, mudstone, siltstone, and fine-grained sandstone, with only the lowest sample (131-2) consisting of coarse-grained sandstone. The upper six fine-grained samples yield between 17 % and 72 % < 240 Ma ages that are significantly younger than in underlying strata, with PDP peak ages between 212 and 209 Ma. Ages that are > 240 Ma in most of these samples differ from equivalent ages in strata of the Blue Mesa Member and Sonsela Member but overlap to varying degrees with ages in strata of the Mesa Redondo Member, Moenkopi Formation, and Coconino Sandstone (Fig. 9c; Table S4). With the six samples combined, 35 % of the grains are < 240 Ma, and PDP peak ages are 1636, 1430, 1032, 629, 379, 287, and 209 Ma (Fig. 8). The lowest sample (131-2), consisting of coarse-grained sandstone, differs from the other Petrified Forest Member samples, with an age peak of 221 Ma, and a greater proportion (68 %) of > 240 Ma ages (Fig. 7). The < 240 Ma ages are very similar to equivalent ages in strata of the lower Sonsela Member (Fig. 9a; KS-D of 0.12), whereas > 240 Ma ages are slightly more similar to ages in the upper Sonsela Member (KS-D of 0.17) than in the lower Sonsela Member (KS-D of 0.22) (Fig. 9c).
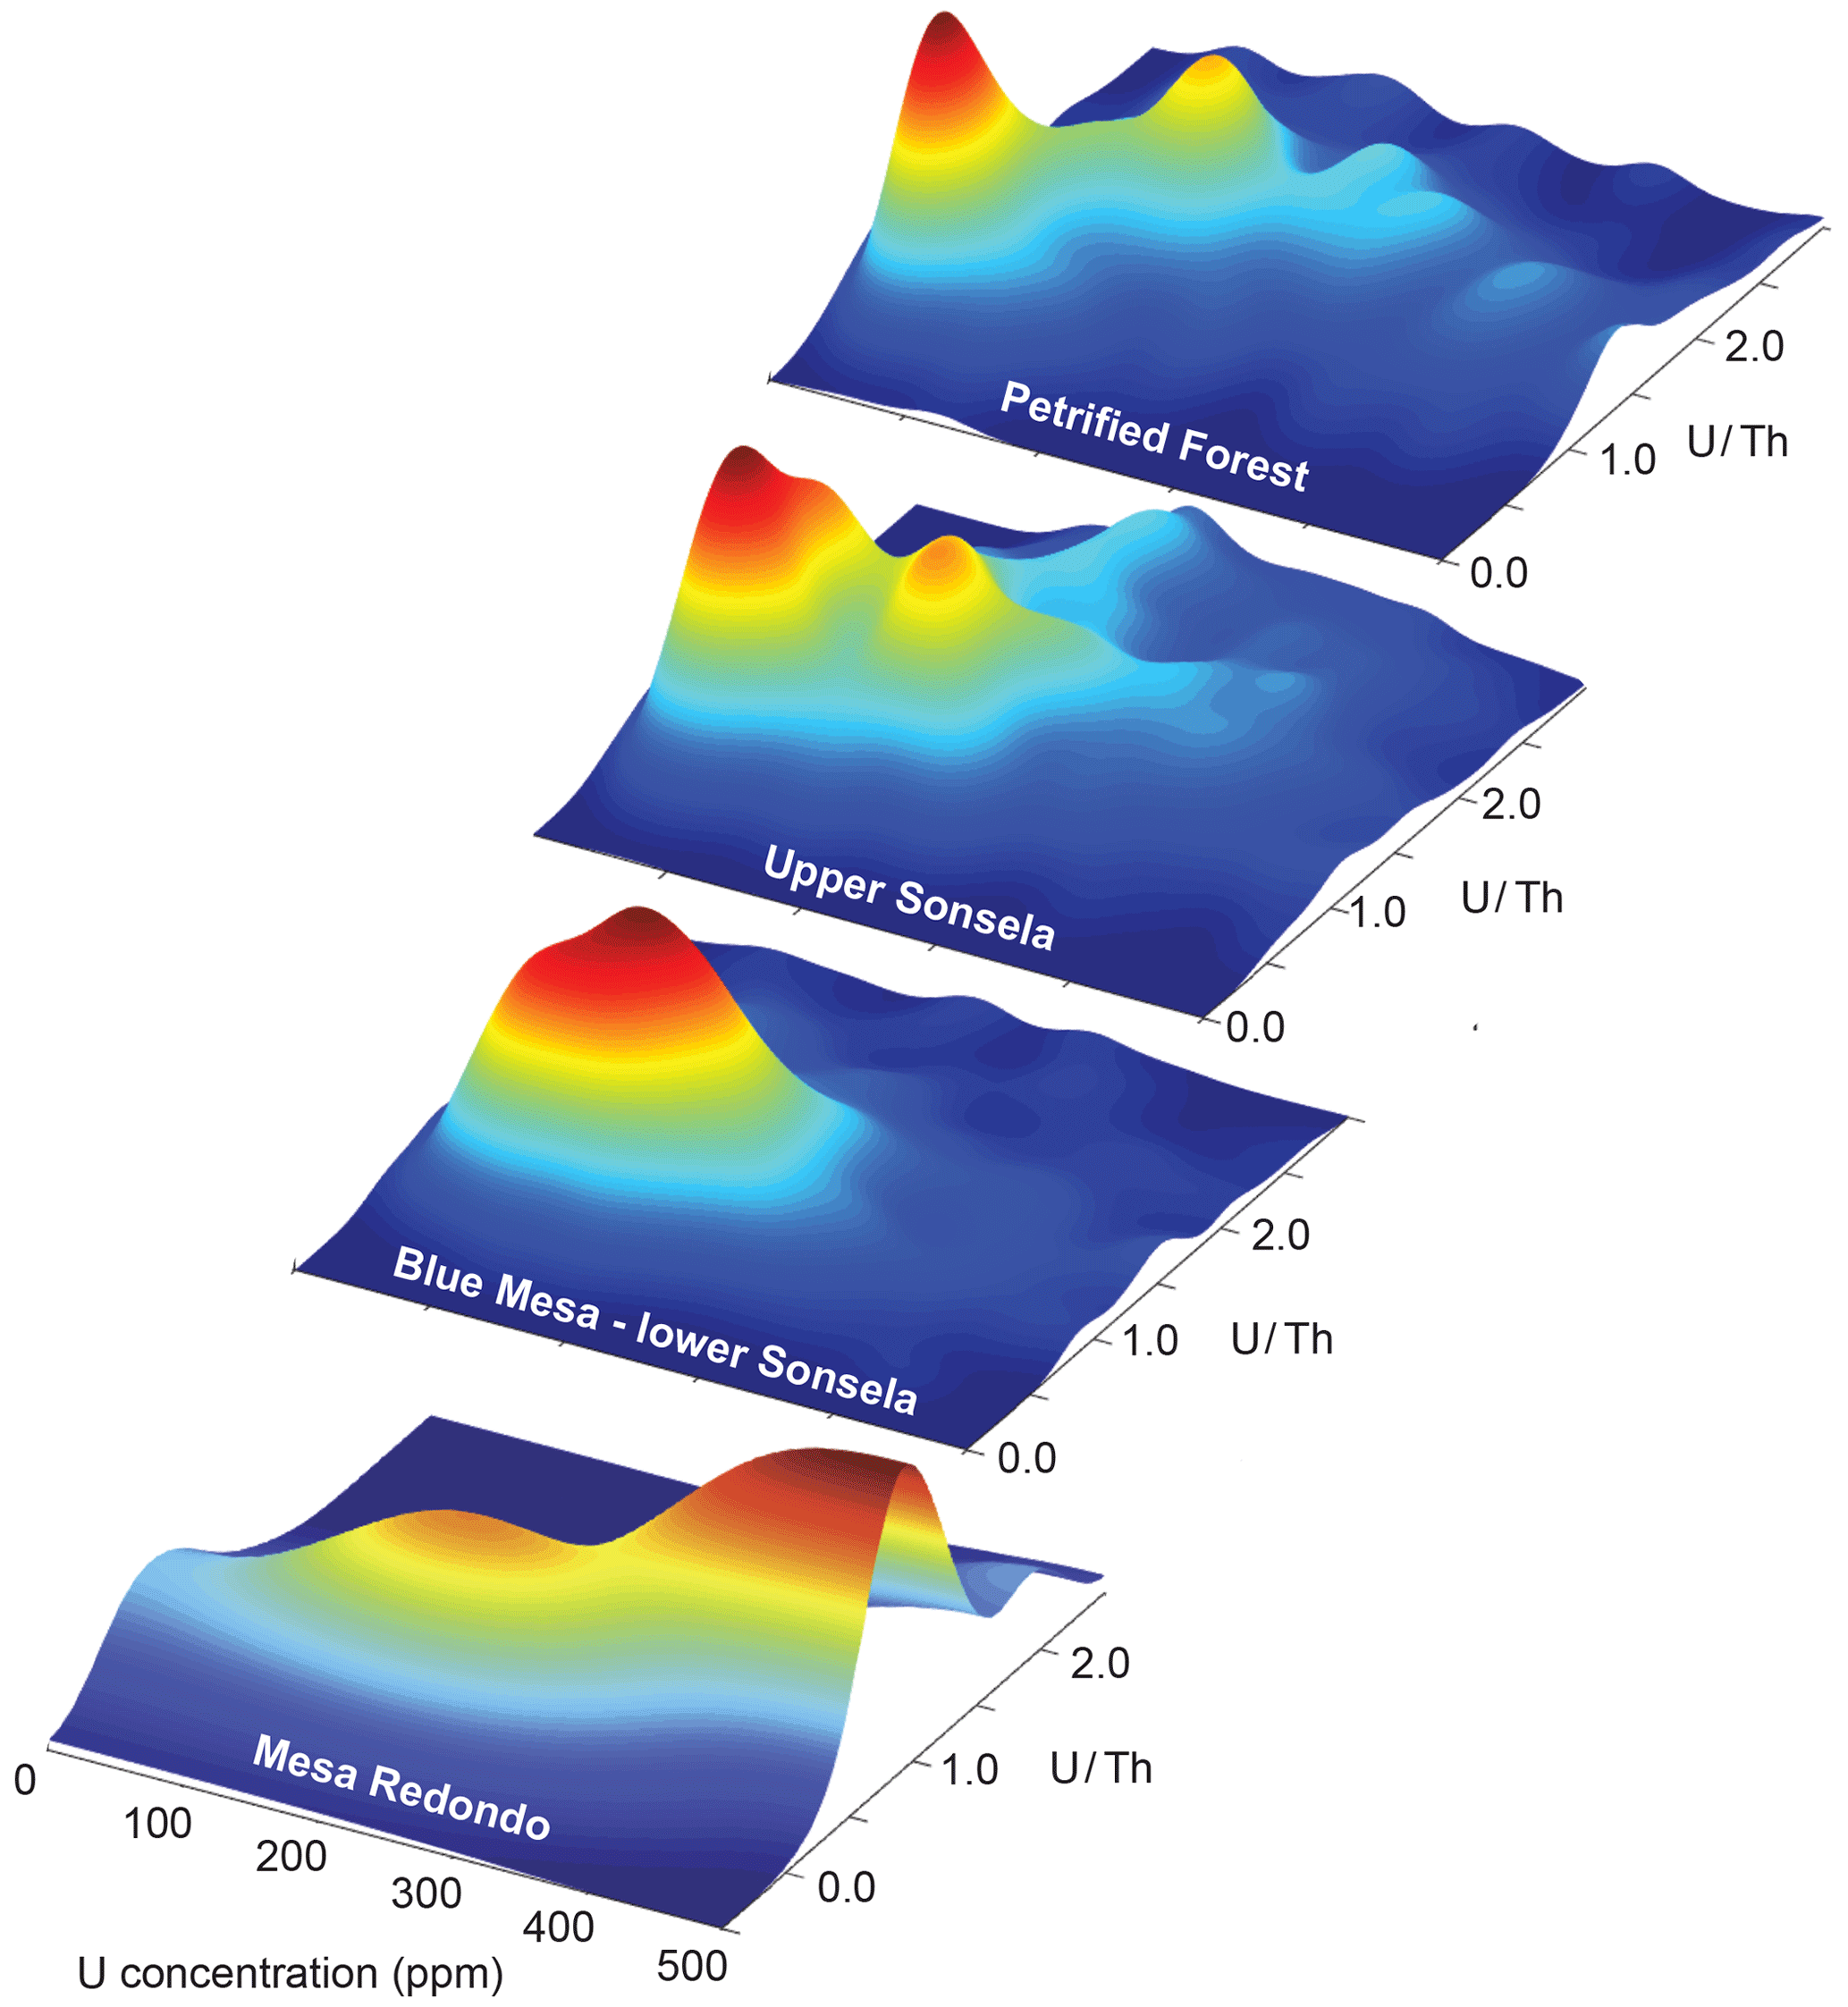
Figure 10Density distributions of U concentration versus U ∕ Th for Triassic grains in the four chronostratigraphic units recognized in this study. Plots were made with hafnium (Hf) density plotter software of Sundell et al. (2019).
5.8 Summary of Chinle results
The patterns of LA-ICPMS ages described above suggest that the studied part of the Chinle Formation comprises four different units, each of which has a distinct chronologic signature for both < 240 and > 240 Ma ages (Fig. 8). These chronostratigraphic units correspond to the Mesa Redondo Member, Blue Mesa Member and lower part of the Sonsela Member, upper part of the Sonsela Member, and Petrified Forest Member.
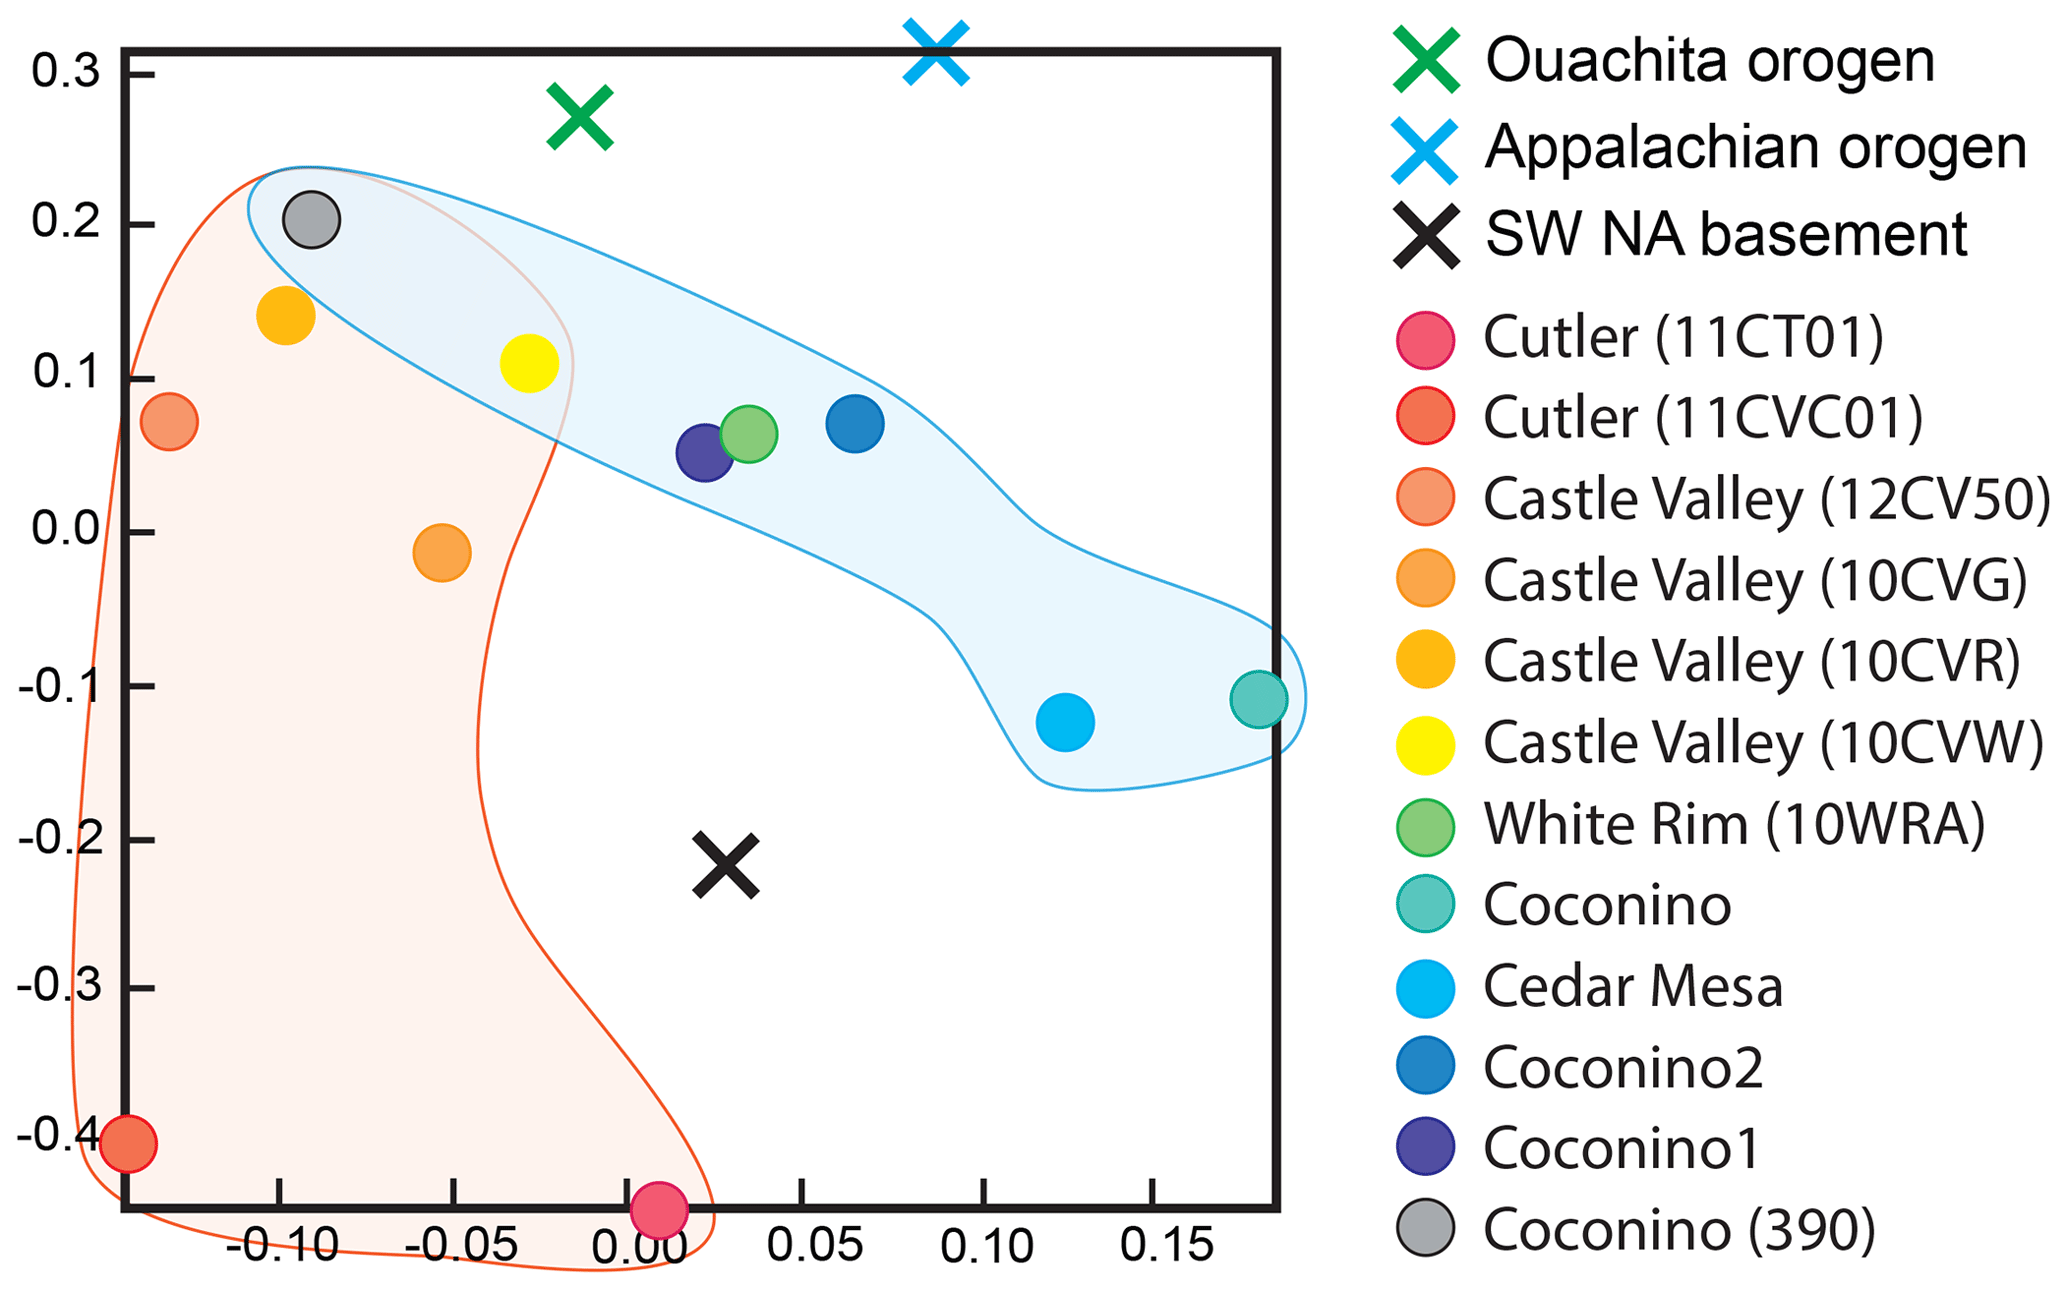
Figure 11MDS plot comparing age distributions of Permian strata of the Colorado Plateau with each other and with potential source regions including the Appalachian orogen, Ouachita orogen, and basement rocks of southwestern North America. Data sources are described in Figs. 3 and 4. The data support the interpretation of Lawton et al. (2015) that the Coconino, Cedar Mesa, and White Rim sandstones (cool shades) belong to a regional blanket of eolian strata that was derived largely from the Appalachian and/or Ouachita orogen, where strata of the Castle Valley and Cutler formations (warm shades) include greater proportions of detritus derived from local basement sources.
In an effort to evaluate whether the Triassic zircon grains from the four chronostratigraphic units also have distinct chemical signatures (following Riggs et al., 2012, 2016), Fig. 10 summarizes the U concentrations and U ∕ Th values for Triassic zircon grains analyzed from each unit. The patterns exhibited in these plots suggest that (1) zircon grains from the Mesa Redondo Member are significantly different from zircon grains in overlying strata, (2) grains in strata of the Blue Mesa Member and lower Sonsela Member differ from grains in overlying strata of the upper Sonsela Member and Petrified Forest Member, and (3) grains in strata of the upper Sonsela Member and Petrified Forest Member have distinctive and slightly different bimodal patterns. Plots showing U concentrations and U ∕ Th values for individual samples are included in Table S3.
Detrital zircon geochronology has previously been used to reconstruct the provenance of Permian and Triassic strata of the Colorado Plateau by Riggs et al. (1996, 2003, 2012, 2013, 2016), Dickinson and Gehrels (2003, 2008), Gehrels et al. (2011), Lawton et al. (2015), and Marsh et al. (2019). The results of most of these chronological studies, and a large number of stratigraphically based analyses, have recently been summarized by Dickinson (2018). The following sections compare our new results with this existing information.
The following comparisons are based in part on qualitative comparison of age distributions of the strata that we have analyzed and of age distributions from five potential source areas (summarized in Fig. 3). As described by Gehrels (2000), such comparisons focus on the degree to which two age distributions contain similar proportions of similar ages. Comparisons are also based on the results of statistical analyses (Table S4) that compare our results with the age distributions of possible source areas and on graphic displays of these comparisons using MDS plots (Fig. 9).
7.1 Coconino Sandstone
Lawton et al. (2015) and Dickinson (2018) suggest that lower Permian strata of the Colorado Plateau comprise a regional blanket of eolian strata that was shed predominantly from the Appalachian and/or Ouachita orogens, with increasing input in northern regions from local basement rocks exposed in the Uncompahgre or Ute uplift (Fig. 1). These interpretations are supported by the age distributions shown in Figs. 5 and 11, with southern strata (Coconino, Cedar Mesa, and White Rim sandstones) forming a distinct group dominated by Appalachian/Ouachita detritus, and northern strata (Castle Valley and Cutler strata) forming a separate group with increasing proportions of ∼ 1.44 Ga grains. The age distribution from our Coconino Sandstone sample (390-1) fits well with other strata from the southern Colorado Plateau in having abundant 1.2–1.0 and 670–300 Ma (Appalachian–Ouachita) grains and a low proportion of ∼ 1.44 Ga grains (Figs. 5 and 11).
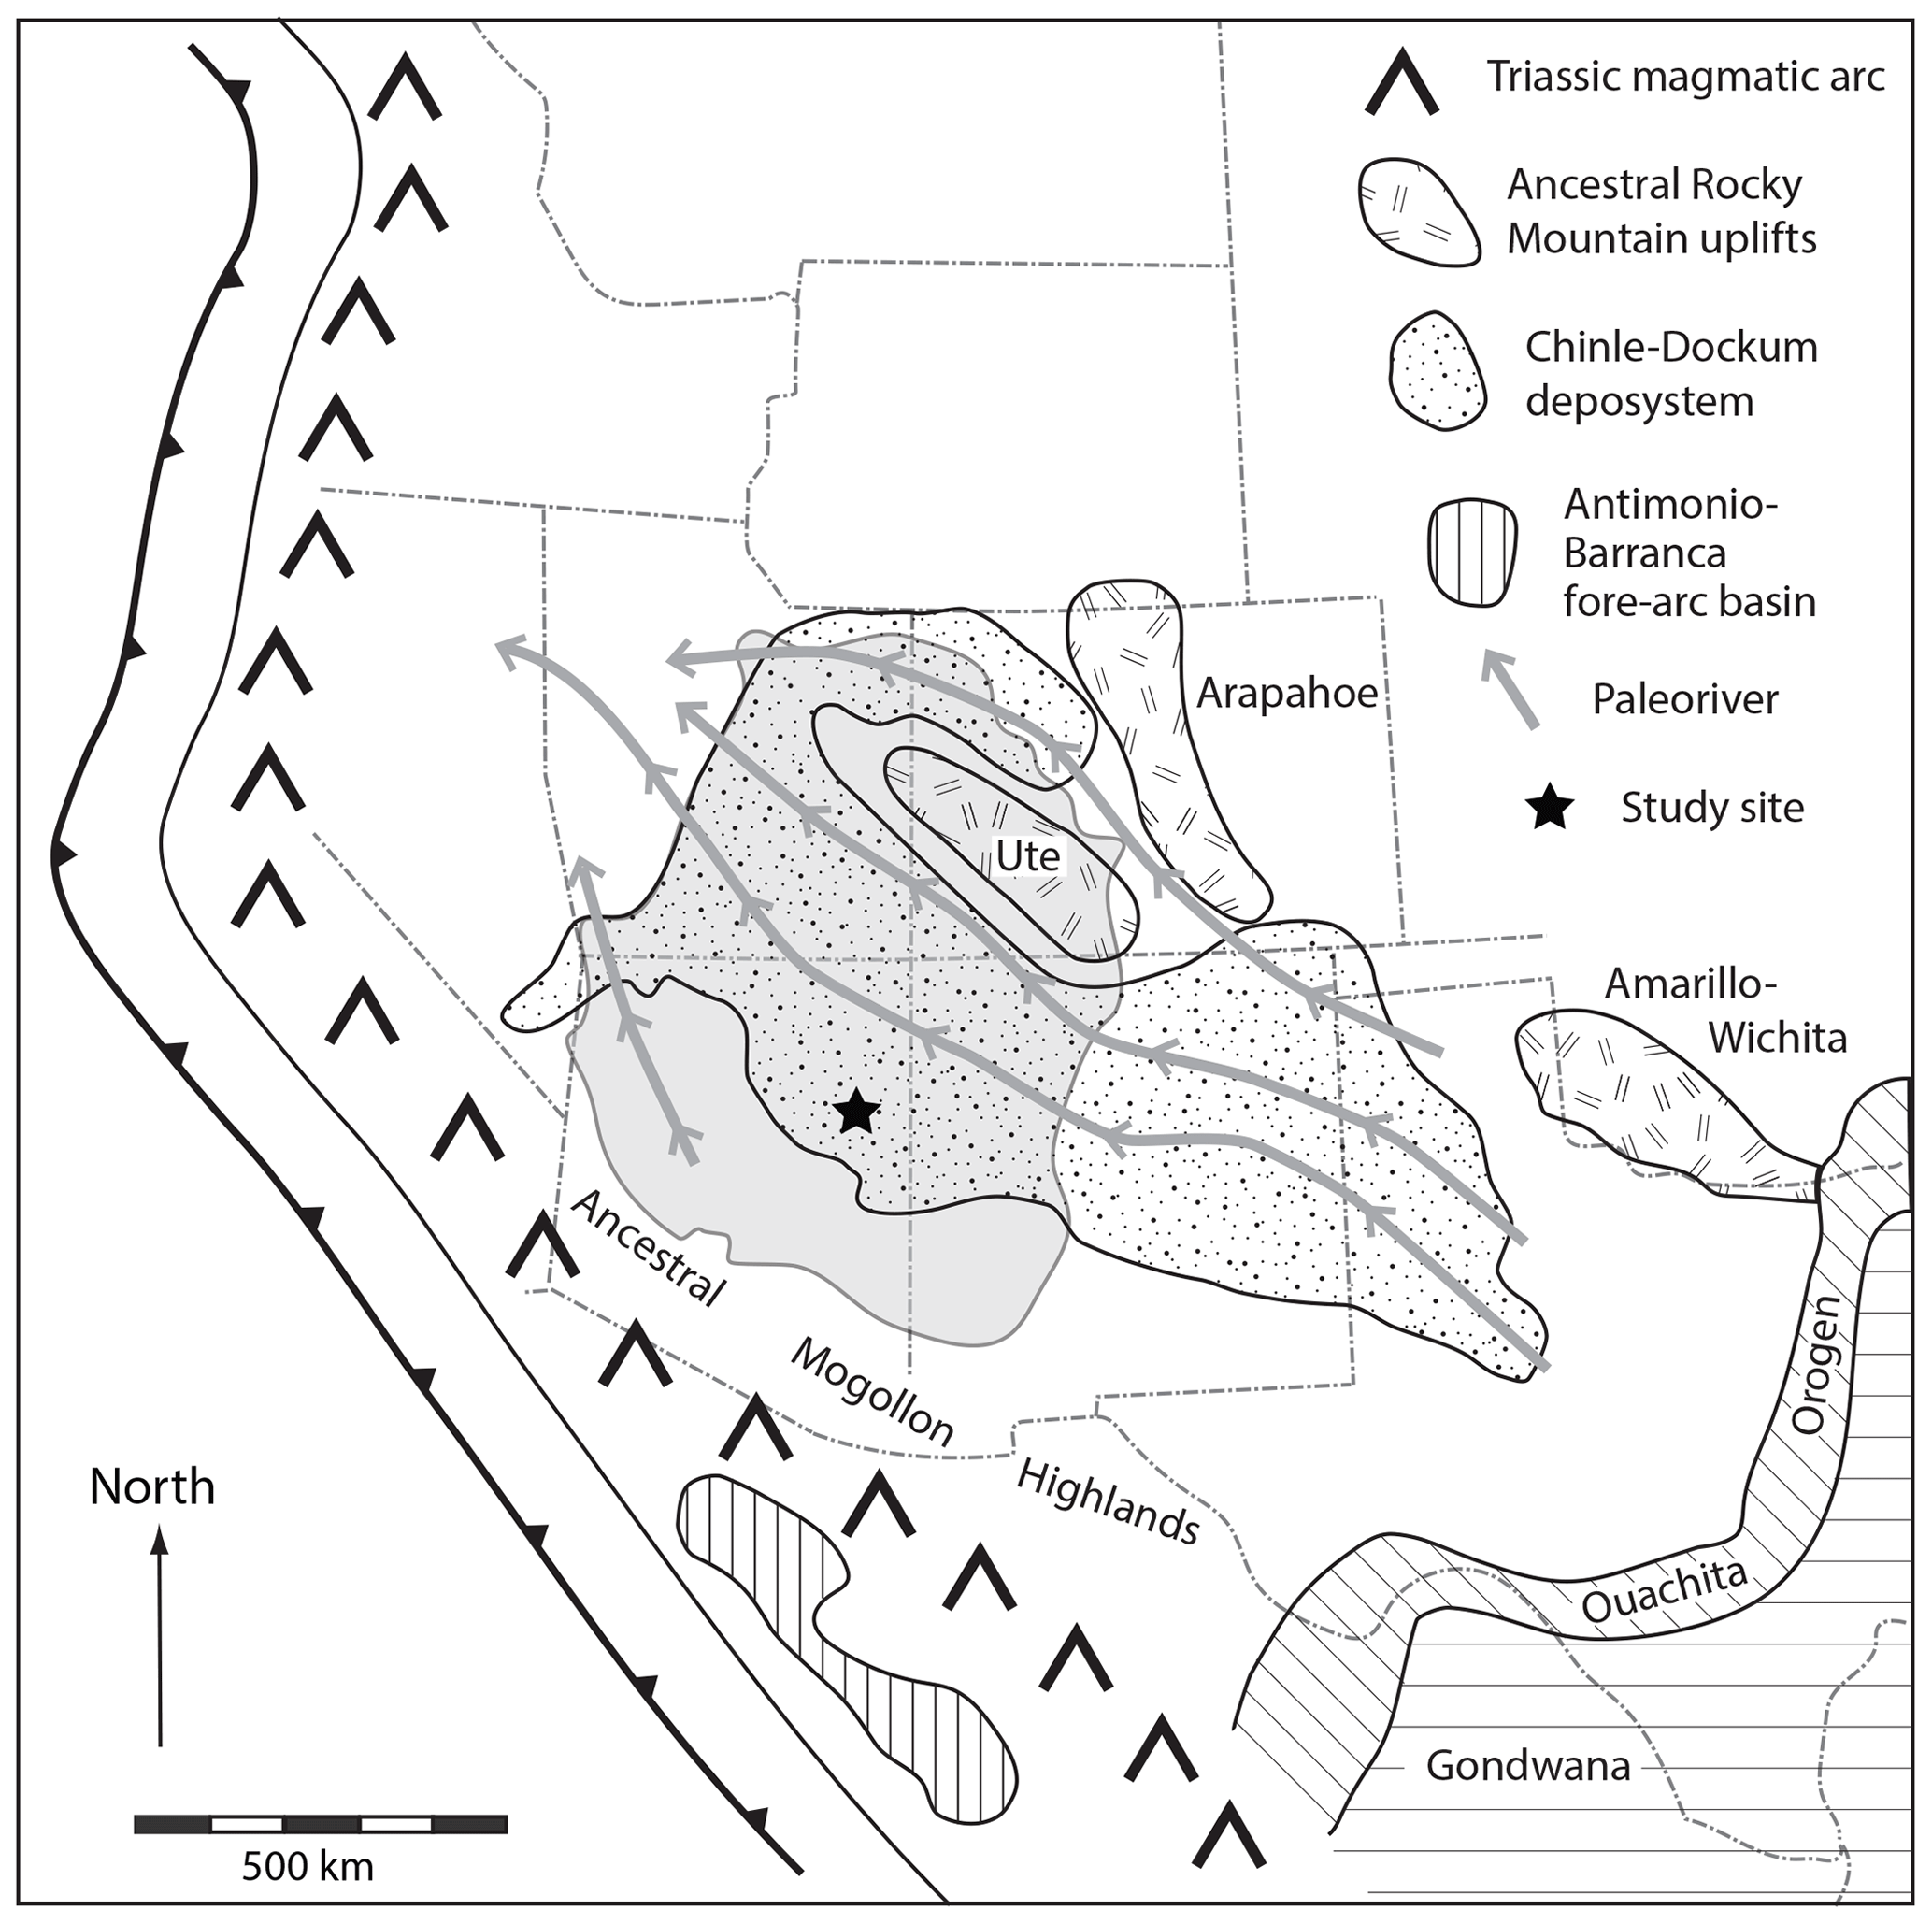
Figure 12Sketch map of relevant tectonic features in southwestern Laurentia during Late Triassic time (adapted from Fig. 42 of Dickinson, 2018).
7.2 Moenkopi Formation
As summarized in Fig. 6, the detrital zircon ages from our four Holbrook Member samples are generally similar to ages from a Holbrook Member sandstone reported by Dickinson and Gehrels (2008). Dominant > 300 Ma age groups and interpreted source terranes include ∼ 1.44 Ga and subordinate ∼ 2.0–1.6 Ga grains derived from the Laurentian Precambrian basement and ∼ 670–300 Ma grains derived from Ouachita and/or Gondwana sources. Based on comparison with detrital zircon ages from strata that accumulated in proximity to the East Mexico and southern Cordilleran arcs (Fig. 3), 300–260 Ma grains (PDP peak ages of 285, 284, 265, 260, and 279) are interpreted to have been shed from the East Mexico arc (peak age of 284 Ma), whereas 260–230 Ma grains (peak ages of 250, 248, 228, 245, and 239 Ma) were likely shed from Early–Middle Triassic parts of the Cordilleran magmatic arc in California and northwestern Mexico (peak ages of 243, 236, and 226 Ma) (Fig. 3). Statistical analyses (Table S4) suggest nearly equal contributions from the Ouachita orogen, local basement rocks, and the East Mexico arc.
More detailed analysis of the age distributions (Fig. 6) and MDS patterns (Fig. 9) suggest that the lower two samples (349-3 and 335-1) (plus sample CP8 of Dickinson and Gehrels, 2008) are dominated by ∼ 1.44 Ga and ∼ 285 Ma grains, whereas the upper two samples (327-2 and 319-2) are dominated by ∼ 620–590 and ∼ 250–230 Ma grains. The age distributions (Fig. 6) and comparison metrics (Fig. 9c; Table S4) suggest that the lower samples were shed mainly from local basement rocks (KS-D of 0.35), whereas the upper samples were shed largely from the Ouachita orogen (KS-D of 0.23).
7.3 Chinle Formation
Our results from detrital zircon grains recovered from strata of the Chinle Formation are consistent with the provenance and paleogeographic reconstructions offered by Riggs et al. (1996, 2003, 2012, 2013, 2016), Dickinson (2018), and Marsh et al. (2019). Given the observed age distributions (Fig. 7) and the location of our study site relative to Late Triassic paleogeographic and paleotectonic features of southwestern North America (Fig. 12), likely sources for pre-Triassic grains include rocks exposed in the Ouachita orogen to the southeast and the ancestral Mogollon Highlands to the south and southwest. Given the abundance of ash layers, bentonitic mudstone, and near-depositional-age zircon grains in strata of the Chinle Formation, and the existence of arc-related plutons and volcanic rocks of Triassic age in Sonora and southern California (Barth and Wooden, 2006; Barth et al., 2011, 2013; Saleeby and Dunne, 2015; Riggs et al., 2016), Stewart et al. (1986), Riggs et al. (2012, 2016), Dickinson (2018), Marsh et al. (2019), and many other researchers conclude that Triassic grains in Chinle strata were derived from the active arc built along the southern Cordilleran margin. The occurrence in fore-arc and back-arc strata of very similar distributions of ages (Fig. 3) is inconsistent with interpretations (e.g., Hildebrand, 2009, 2013) that the early Mesozoic arc was located far from southwestern North America.
Although our data are entirely consistent with the provenance interpretations outlined above, the density of our sampling and the large number of analyses from most samples provide opportunities to reconstruct temporal changes in Triassic provenance in greater detail, and with the benefit of statistical analyses to quantify conclusions. The following are interpretations based on strata belonging to each of the different members of the Chinle Formation.
7.4 Mesa Redondo Member
The provenance of strata belonging to the Mesa Redondo Member is similar to that of the underlying Moenkopi Formation, with our sample (305-2) containing abundant ∼ 640–300 Ma grains derived from Ouachita and/or Gondwana sources as well as ∼ 290–260 Ma grains derived from the East Mexico arc (Fig. 8). Statistical analysis confirms higher similarity of > 240 Ma grains with Ouachita sources (0.58) than with Appalachian (0.35) or local basement (0.15) sources (Table S4). This sample also yields a significant proportion of Triassic ages that approximate the depositional age for these strata (Fig. 7). These young grains, with a PDP age peak of 223 Ma, are interpreted to have been transported primarily by aeolian processes from the active magmatic arc to the west (Fig. 12). Statistical analysis demonstrates that the Triassic ages in these samples are significantly different from ages in overlying strata (Fig. 9a) and that the > 240 Ma ages are similar to those in some strata of the Petrified Forest Member (Fig. 9c).
7.5 Blue Mesa Member
Our three samples from strata of the Blue Mesa Member yield a large proportion of Triassic zircon grains (Figs. 7 and 8) that were derived from the active Cordilleran magmatic arc to the west (Fig. 12), and a small proportion of pre-240 Ma grains that were shed from local basement rocks and the Ouachita and/or Appalachian orogens (Fig. 8). Statistical analysis confirms that the Triassic ages in all these samples are quite similar (Fig. 9a), whereas the age distributions of > 240 Ma grains in the three samples are more variable (Fig. 9c; Table S4).
7.6 Lower Sonsela Member
The lower six samples from the Sonsela Member yield a large proportion of Triassic grains derived from the Cordilleran magmatic arc, and fewer ages derived from local basement rocks and Ouachita and/or Gondwana sources (Figs. 7 and 8). Distinctive among the older grains is a significant proportion of ∼ 1.44 Ga grains that most likely signal increased input from the ancestral Mogollon Highlands to the southwest (Marsh et al., 2019) (Fig. 12). MDS analysis demonstrates that the < 240 and > 240 Ma ages in these samples are quite similar, with the main difference being the larger number of ∼ 1.1 Ga grains in sample 243-3 (Figs. 7 and 9c).
7.7 Upper Sonsela Member
The upper six samples from the Sonsela Member reveal a continued low contribution from the Ouachita orogen and a significant increase in the proportion of ∼ 1.08 Ga and 260–240 Ma grains (Figs. 7 and 8). The ∼ 260–240 Ma grains were likely derived from Permian–Early Triassic igneous rocks along the southern Cordilleran margin (Saleeby and Dunne, 2015; Riggs et al., 2016), exposed in the ancestral Mogollon Highlands (Fig. 12). The prominent ∼ 1.44 and 1.08 Ga grains in these samples may also have been shed from highland sources to the south and southwest. Triassic grains in these samples record a slightly younger (230–204 Ma, peak age of 215 Ma) phase of magmatism along the Cordilleran margin. Significant changes in both < 240 and > 240 Ma ages occur between samples 196-3 and 195-2 (Fig. 7). MDS analysis demonstrates that patterns of both < 240 and > 240 Ma ages are consistent among the six upper Sonsela Member samples but are distinct from ages in all other parts of the Chinle Formation (Figs. 7 and 9).
7.8 Petrified Forest Member
Strata of the Petrified Forest Member record an important shift in provenance, with significantly greater detrital input from the East Mexico arc (∼ 287 Ma) and the Ouachita orogen (∼ 640–300 Ma), and a broader range of > 1.0 Ga basement sources (Figs. 7 and 8). Triassic grains in these strata are also significantly younger, with ages of 228–200 Ma (peak age of 209 Ma).
An exception to these patterns is recorded by ages from the coarse-grained sandstone of sample 131-2, which has Precambrian grains that are mainly ∼ 1.1–1.0 and 1.44 Ga (like upper or lower Sonsela Member; Fig. 9c), and Triassic grains that are ∼ 221 Ma (like strata of the lower Sonsela Member and Blue Mesa Member; Fig. 9a). This lower Petrified Forest Member sample is interpreted to have been reworked mainly from lateral equivalents of underlying strata of the Sonsela Member and Blue Mesa Member, with little or no input from the active arc to the west.
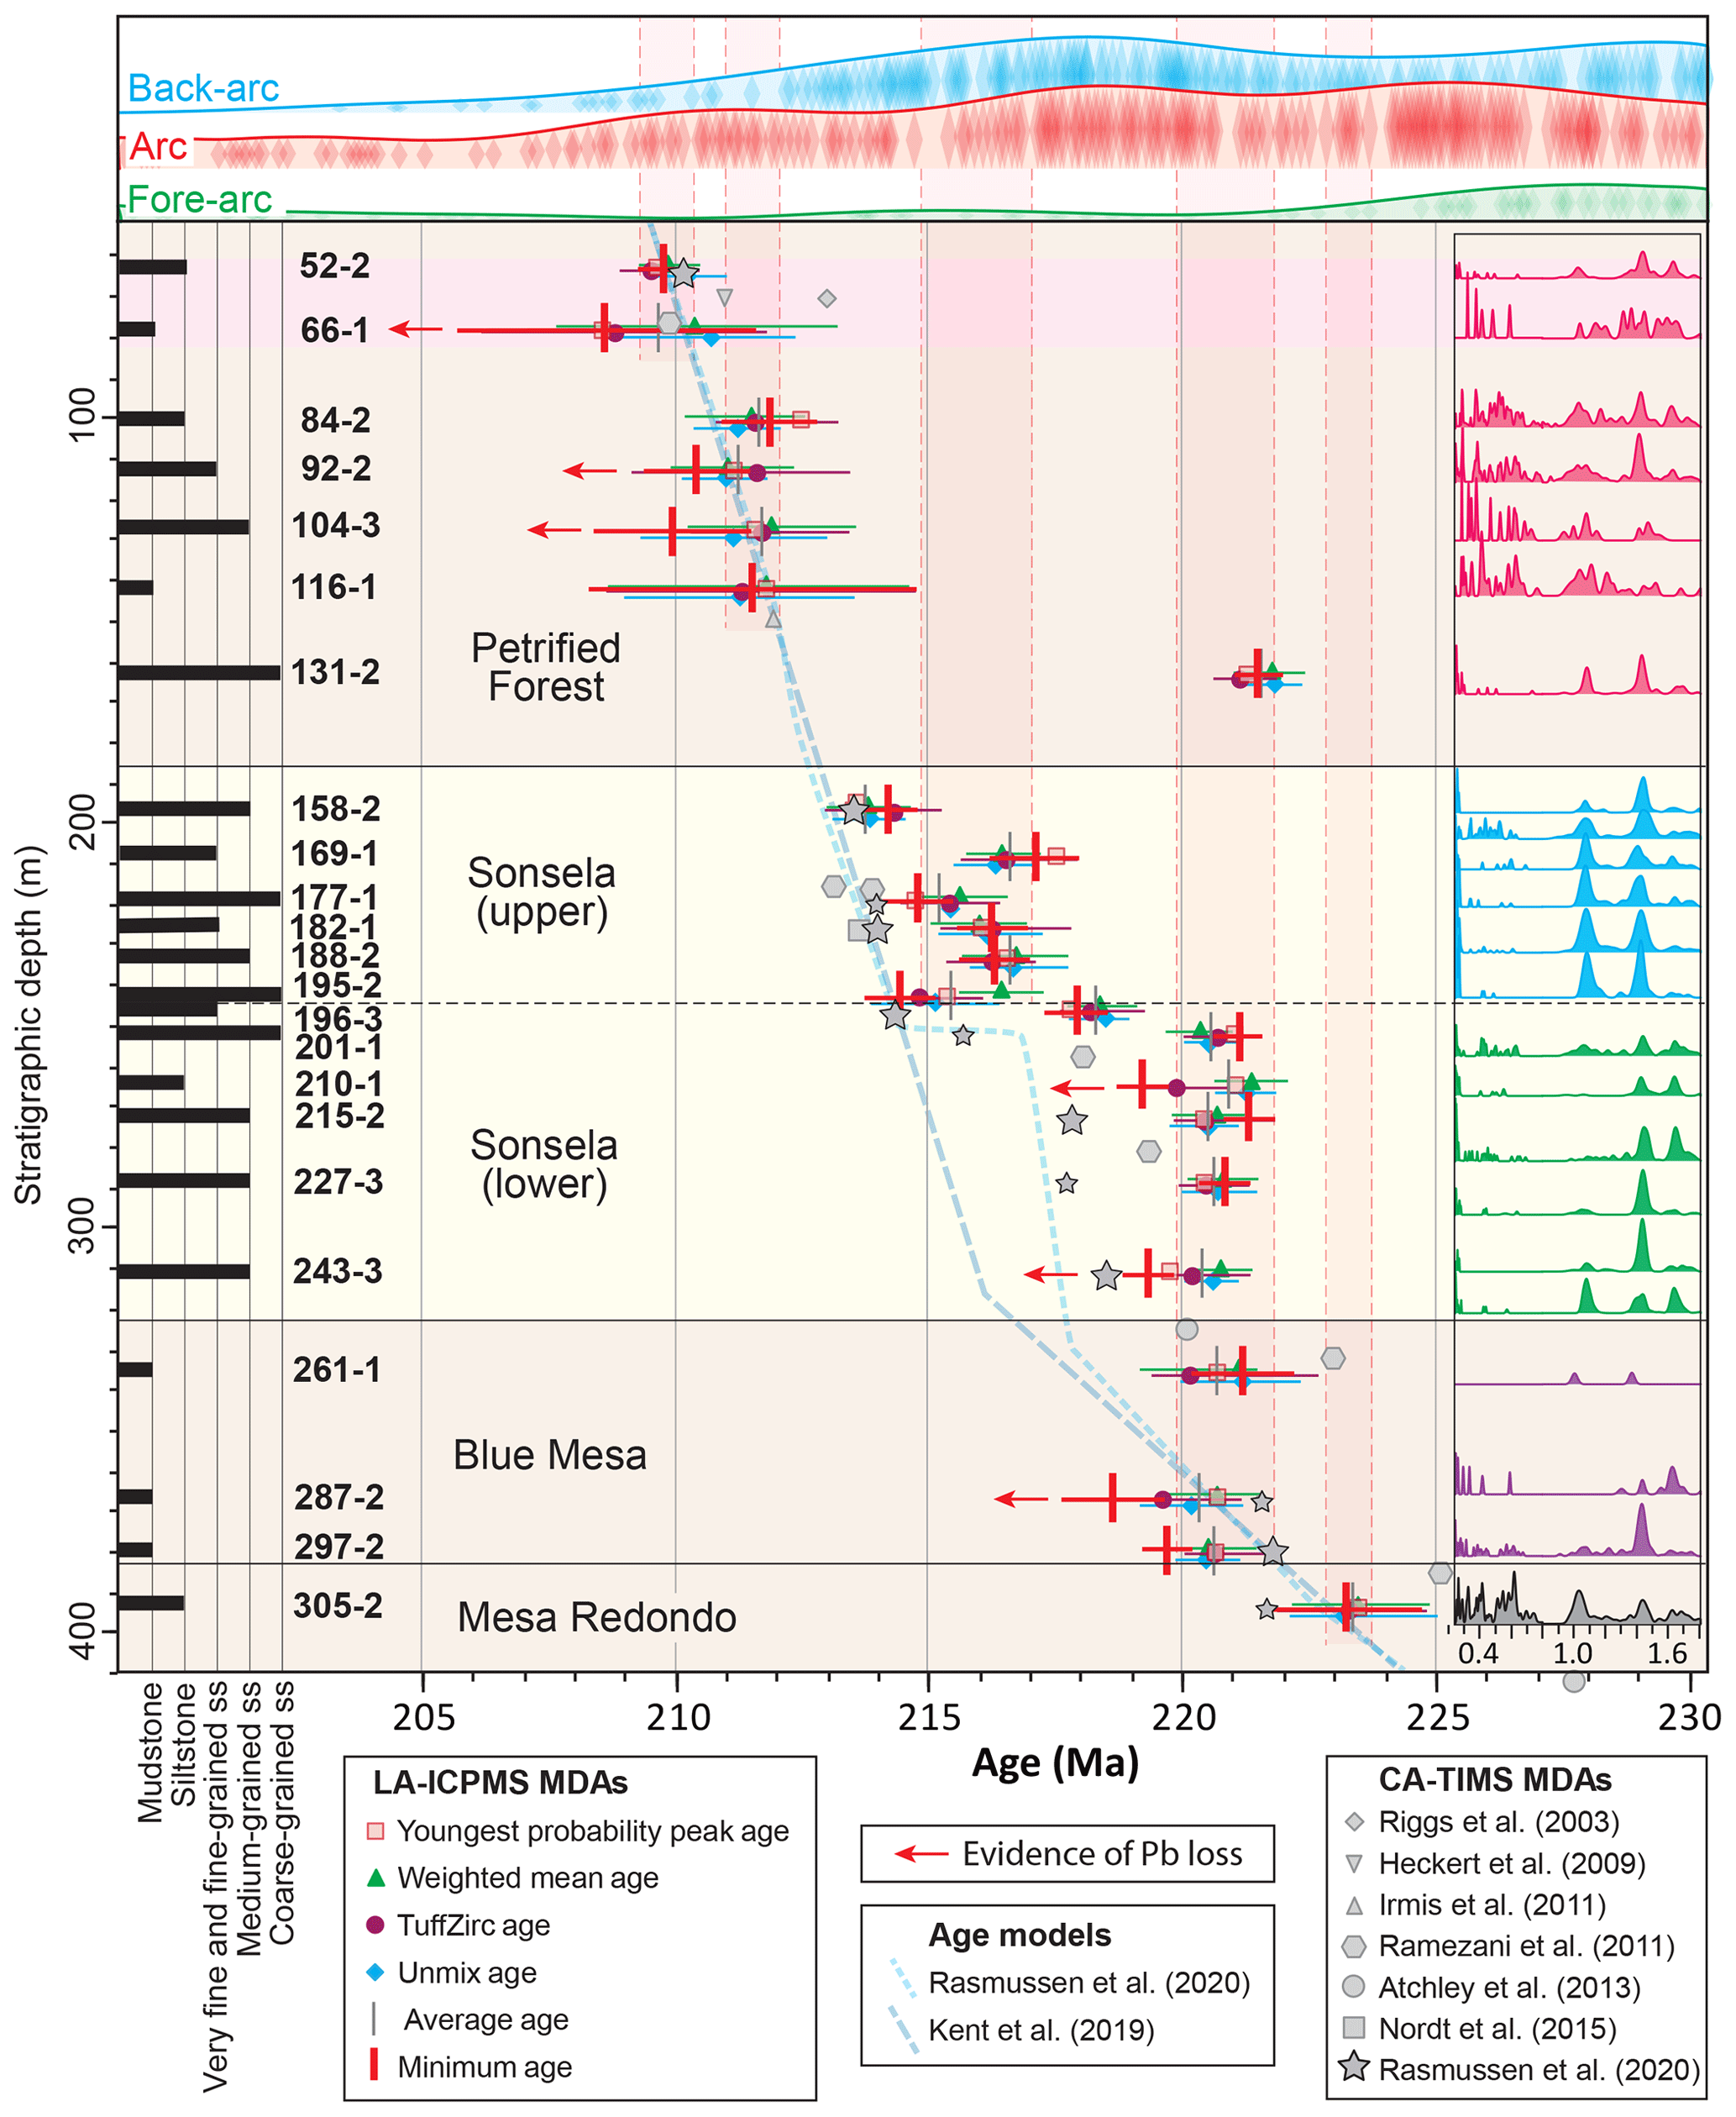
Figure 13Plot showing the available chronologic information for strata of the Chinle Formation from the study area. LA-ICPMS results are shown using red crosses for interpreted maximum depositional ages (using the minimum age approach of Vermeesch, 2020), and various symbols for the four age estimates (and the average) of the youngest cluster. Red arrows indicate that LA-ICPMS ages may be compromised by Pb loss (Table S6). CA-TIMS and ID-TIMS ages are shown in approximate stratigraphic position (as shown by Kent et al., 2019), with outcrop samples in gray symbols and core samples using black symbols. Smaller symbols represent ID-TIMS ages or CA-TIMS ages based on a single age or of uncertain reliability. Stratigraphic units are keyed to dominant rock type, with brown indicating mudstone and siltstone, yellow indicating sandstone, and pink indicating bentonite. The average grain size of each sample is shown with bars on the left (from Sect. S1 and Table S1). PDP curves to the right show 2.0 Ga to 240 Ma ages, as plotted in Fig. 7. Also shown are age models of Kent et al. (2019) and Rasmussen et al. (2020). Vertical red bands show interpreted ages of main clusters of LA-ICPMS ages. Curves across the top of the diagram show the distribution of ages from (1) fore-arc strata of the Barranca and El Antimonio groups in Sonora (Gonzalez-Leon et al., 2009; Gehrels and Pecha, 2014) and the Great Valley Group in California (DeGraaff-Surpless et al., 2002; Surpless et al., 2006; Wright and Wyld, 2007), (2) Permian–Triassic igneous rocks in California (Chen and Moore, 1982; Miller at al., 1995; Tobisch et al., 2000; Barth and Wooden, 2006; Barth et al., 2011, 2013; Saleeby and Dunne, 2015), and (3) strata of the Chinle Formation in other parts of the Colorado Plateau (Dickinson and Gehrels, 2008; Riggs et al., 2012; Marsh et al., 2019). Diamond-shaped symbols beneath curves represent individual ages.
The depositional age of Triassic strata on the Colorado Plateau is of considerable interest because of the rich faunal and paleoclimatic records preserved within the Moenkopi Formation and Chinle Formation, and as the zircon-based geochronological framework for the early Mesozoic when coupled with paleomagnetic polarity stratigraphy and astrochronology (Olsen et al., 2018, 2019; Kent et al., 2018, 2019; Rasmussen et al., 2020). There accordingly have been many prior attempts to determine the depositional age of these strata by dating igneous zircon grains in ash beds or volcanic cobbles and detrital zircon grains in clastic strata (e.g., Riggs et al., 1996, 2003, 2012, 2013, 2016; Heckert et al., 2009; Dickinson and Gehrels, 2009; Irmis et al., 2011; Ramezani et al., 2011, 2014; Atchley et al., 2013; Nordt et al., 2015). As part the Colorado Plateau Coring Project, Kent et al. (2018) and Rasmussen et al. (2020) report the results of CA-TIMS analyses on many of the same samples reported herein. All of the available CA-TIMS ages, and the preferred age models of Kent et al. (2019) and Rasmussen et al. (2020), are shown in Fig. 13.
MDAs have been determined using the minimum age model of Vermeesch (2020). The possibility that this maximum depositional age has been compromised by Pb loss is evaluated mainly by determining whether there is a correlation between U concentration and age. One criterion is whether the youngest single age has higher U concentration than the average of the youngest cluster – if yes, then the youngest analysis (and perhaps other analyses within the youngest cluster) may have experienced Pb loss. A second criterion is whether analyses within the youngest cluster display an inverse correlation between U concentration and age – if yes, then the higher U and younger analyses within the cluster may have experienced Pb loss. An additional criterion is whether the youngest date is excluded from the cluster determined by TuffZirc analysis. Samples in which all three methods suggest the presence of Pb loss are shown with red arrows in Fig. 13. Rasmussen et al. (2020) document Pb loss in zircon grains from several of our samples by showing that CA-TIMS ages are commonly older than LA-ICPMS ages from the same crystals.
8.1 Coconino Sandstone
Our analyses do not provide a useful MDA for strata of the Coconino Sandstone (sample 390-1) because few late Paleozoic ages were recovered from this sample.
8.2 Holbrook Formation of the Moenkopi Formation
Of our four samples from the Holbrook Member of the Moenkopi Formation, three yield MDAs that young upward from 248.05(±1.82) Ma to 246.63(±1.92) Ma to 236.78(±9.92) Ma (Table S6). These MDAs are consistent with the inferred Early–Middle Triassic age of the strata and the corresponding ∼ 251–237 Ma range for Early and Middle Triassic time on the geologic timescale (Cohen et al., 2013, updated 2018). All three samples show patterns of U concentration that suggest the possibility of Pb loss (Table S6).
8.3 Mesa Redondo Member of the Chinle Formation
Our one sample (305-2) from strata of the Mesa Redondo Member yields an MDA of 223.24±1.50 Ma (Table S6). Patterns of U concentration do not indicate the presence of Pb loss (Table S6). This MDA overlaps with CA-TIMS ages of ∼ 224.7–221.7 Ma from the same sample but is slightly older than the preferred single-grain age of ∼ 221.7 Ma (Rasmussen et al., 2020). However, the LA-ICPMS MDA of 223.24±1.50 is younger than CA-TIMS ages of ∼ 225.2 Ma (Ramezani et al., 2011) and ∼ 227.6 (Atchley et al., 2013) from outcrop samples of the Mesa Redondo Member.
8.4 Blue Mesa Member of the Chinle Formation
Our three samples (297-2, 287-2, 261-1) from strata of the Blue Mesa Member yield MDAs of 219.68±0.46, 218.62±0.98, and 221.23±1.02 Ma (Table S6). All samples yield MSWD values > 1.0 (average of 2.4), which indicates the presence of multiple age populations and/or Pb loss (Table S6). Patterns of U concentration suggest the possible presence of Pb loss in all three samples and likely Pb loss in sample 287-2. As shown in Fig. 13, these MDAs are slightly younger than CA-TIMS ages of ∼ 221.8 Ma (from sample 297-2; Rasmussen et al., 2020), and ∼ 220.5 Ma (from sample 287-2; Rasmussen et al., 2020). From upper strata, our age is similar to a CA-TIMS age from outcrop of ∼ 220.1 Ma (Atchley et al., 2013) but significantly younger than a CA-TIMS age of ∼ 223.0 Ma (Ramezani et al., 2011), also from outcrop.
8.5 Lower part of the Sonsela Member
Our six samples from the lower part of the Sonsela Member (243-3 to 196-3) yield MDAs of 219.27±0.44 Ma (sample 243-3), 220.81±0.44 Ma (sample 227-3), 221.30±0.48 Ma (sample 215-2), 219.21±0.66 Ma (sample 210-1), and 221.06±0.50 Ma (sample 201-1). The sixth and uppermost sample (196-3) yields younger ages with an MDA of 217.93±0.56 Ma. MSWD values for these samples are all high (average of 2.6), which demonstrates the presence of multiple age components. There is evidence for Pb loss in analyses from samples 243-3 and 210-1.
As shown in Fig. 13, these MDAs are 1–3 Myr older than most CA-TIMS ages from equivalent strata. From oldest to youngest, the CA-TIMS ages include ∼ 220.1 Ma (from outcrop; Atchley et al., 2013) from near the base, through ∼ 218.8 Ma (sample 243-3; Rasmussen et al., 2020), ∼ 217.7 Ma (sample 227-3; Rasmussen et al., 2020), ∼ 219.3 Ma (from outcrop; Ramezani et al., 2011), ∼ 217.8 Ma (sample 215-2; Rasmussen et al., 2020), ∼ 218.0 Ma (from outcrop; Ramezani et al., 2011), and ∼ 215.7 Ma and 214.4 Ma (samples 201-1 and 196-3; Rasmussen et al., 2020) at the top. The LA-ICPMS-based MDA ages are also older than a ∼ 216.6 Ma MDA determined on LA-ICPMS ages from an outcrop sample of sandstone in the middle part of the lower Sonsela Member, exposed ∼ 132 km north of the CPCP core site (Marsh et al., 2019).
8.6 Upper part of the Sonsela Member
The lower five samples from the upper Sonsela Member yield similar preferred MDAs of 214.36±0.68 Ma (sample 195-2), 216.32±0.72 Ma (sample 188-2), 216.19±0.62 Ma (sample 182-1), 214.81±0.70 Ma (sample 177-1), and 217.07±0.86 Ma (sample 169-1). An upper sample yields a younger MDA of 214.18±0.54 Ma (sample 158-2). All samples yield MSWD values greater than 1.0 (average of 2.6) (Table S6), demonstrating the presence of multiple age components. Most samples have patterns of U concentration that suggest the possibility of Pb loss. The lower five MDAs are 2–3 Myr older than CA-TIMS ages from equivalent strata, which include outcrop ages of ∼ 213.9 (Ramezani et al., 2011), ∼ 213.6 Ma (Nordt et al., 2015), and ∼ 213.1 Ma (Ramezani et al., 2011), and CPCP core ages of ∼ 214.0 Ma (samples 182-1 and 177-1; Rasmussen et al., 2020). A CA-TIMS age of ∼ 213.5 Ma for the upper sample (158-2; Rasmussen et al., 2020) is nearly identical to our age determination.
8.7 Petrified Forest Member
Our seven samples from the Petrified Forest Member yield three sets of MDAs. The lowest unit (sample 131-2) yields an MDA of 221.54±0.44 Ma, which is significantly older than MDAs in adjacent strata. Four samples near the middle of the unit yield similar MDAs of 211.53±3.26 Ma (sample 116-1), 209.90±1.56 Ma (sample 104-3), 210.42±1.08 Ma (sample 92-2), and 211.86±0.94 Ma (sample 84-2). The MDAs for two of these samples overlap with an ID-TIMS age of ∼ 211.9 Ma (Irmis et al., 2011) from equivalent strata in outcrop, the other two younger MDAs may be compromised by Pb loss (Fig. 13).
Two upper samples, from the Black Forest bed, yield preferred MDAs of 208.26±3.38 Ma (sample 66-1) and 209.75±0.42 Ma (sample 52-2). These MDAs are similar to CA-TIMS ages of ∼ 210.2 Ma from core (sample 52-2; Rasmussen et al., 2020) and ∼ 209.9 Ma from outcrop (Ramezani et al., 2011) but are significantly younger than outcrop-based ID-TIMS ages of ∼ 211.0 Ma (Heckert et al., 2009) and ∼ 213.0 Ma (Riggs et al., 2003). Most of our samples yield MSWD values greater than 1.0 (average of 1.5), suggesting the presence of multiple age components, and have patterns of U concentration that suggest the presence of Pb loss.
Our maximum depositional ages for strata of the Chinle Formation range from ∼ 223.2 to ∼ 208.3 Ma, which is similar to the ∼ 227.6 to ∼ 209.9 Ma range of CA-TIMS ages (Fig. 13). All available U–Pb data therefore suggest that the analyzed Chinle Formation strata are Late Triassic and probably Norian in age (Dickinson, 2018), given the assigned ages of ∼ 237 to ∼ 201.3 for Late Triassic time (Cohen et al., 2013, updated 2018) and ∼ 227 to ∼ 208.5 Ma (Cohen et al., 2013, updated 2018) or ∼ 205.7 Ma (Kent et al., 2017) for Norian time.
Figure 13 presents a comparison of our LA-ICPMS-based average ages and maximum depositional ages, all available ID- and CA-TIMS ages (from Riggs et al., 2003; Heckert et al., 2009; Ramezani et al., 2011; Irmis et al., 2011; Atchley et al., 2013; Nordt et al., 2015; Kent et al., 2018, and Rasmussen et al., 2020), and two age models that are based on magnetostratigraphic and CA-TIMS geochronologic information (Kent et al., 2019; Rasmussen et al., 2020). As shown on this figure, our LA-ICPMS ages reveal two first-order patterns. The first pattern is that the LA-ICPMS-based ages overlap with most CA-TIMS ages and both age models for most strata belonging to the Blue Mesa Member and Petrified Forest Member but are significantly older for strata of the Sonsela Member. The second pattern is that most LA-ICPMS-based ages belong to five main clusters (∼ 223, ∼ 222–220 Ma, ∼ 217–215, ∼ 212–211, and ∼ 210 Ma), whereas the other chronologic records show a relatively simple pattern of upward younging (Fig. 13). The following discussion explores these two patterns – details of the magnetostratigraphic information, CA-TIMS data, and age models are discussed by Kent et al. (2018, 2019) and Rasmussen et al. (2020).
As shown in Fig. 13, the LA-ICPMS-based average ages and MDAs presented herein overlap with the other chronometers for sequences which are dominated by fine-grained strata (e.g., Blue Mesa Member and Petrified Forest Member) but are several million years too old for sequences which are dominated by coarse-grained strata (Sonsela Member) (Fig. 13). This pattern appears to hold for member-scale stratigraphic units (e.g., strata from the Petrified Forest Member), although some individual samples clearly do not follow this pattern. For example, of the six samples from the Petrified Forest Member that yield LA-ICPMS ages which overlap with the other chronometers, four are mudstone–siltstone and two are sandstone. In the lower Sonsela Member, of the six samples with LA-ICPMS ages that predate the other chronometers, five are sandstone and one is siltstone. These exceptions suggest that the dominant lithic characteristics and depositional environment of a member (e.g., dominantly fine-grained floodplain deposits for the Petrified Forest Member versus dominantly coarse-grained channel deposits of the Sonsela Member, Woody, 2006), are more important than the grain size of an individual horizon in controlling the recognition of near-depositional-age zircon grains.
The observed pattern that predominantly fine-grained strata of the Mesa Redondo, Blue Mesa, and Petrified Forest members yield reliable LA-ICPMS ages, whereas predominantly coarse-grained sandstones of the Sonsela Member do not, is surprising for two reasons. First, in terms of provenance (as described above), strata of the Mesa Redondo, Blue Mesa, and Petrified Forest members are interpreted to have been shed mainly from the Ouachita orogen, which lacks Triassic igneous rocks, whereas strata of the Sonsela Member were shed from the Cordilleran magmatic arc to the southwest, which contains abundant Permian and Triassic igneous rocks (Fig. 3). Second, as shown in the margins of Figs. 7 and 8, Triassic zircon grains are significantly (∼ 2×) more abundant in strata of the Sonsela Member than in underlying and overlying strata. Based on these two observations, one might expect that strata of the Sonsela Member would yield reliable MDAs, whereas strata from the Mesa Redondo Member, Blue Mesa Member, and Petrified Forest Member would not.
We suggest that these counterintuitive relations result in large part from our analytical method of only analyzing zircon grains that are > 60 µm, combined with the maximum size of zircons that can be transported in fine-grained versus coarse-grained sediments. For coarse-grained sediment, > 60 µm zircon grains could include both transported (detrital) components that predate deposition, as well as zircons that are of air-fall origin and approximately of depositional age. An MDA calculated from a mix of these grains would accordingly predate deposition. In contrast, Triassic zircon grains from fine-grained strata would tend to be mostly of air-fall origin given that the older, transported grains are too small to analyze. An MDA calculated from zircons that are primarily of air-fall origin would accordingly approach the true depositional age.
The relations described above suggest that convergence versus divergence of the chronologic records results from connections between depositional setting, grain size, provenance, and analytical methods, which together conspire to control the proportions of air-fall origin (near-depositional age) versus slightly older detrital zircon grains recognized in our samples. We suggest that the three chronometric records agree (to within ∼ 2 Myr) for strata of the lower Blue Mesa Member and middle-upper Petrified Forest Member because of the availability of zircon grains of air-fall origin, which are near depositional age and both < 60 and > 60 µm in size, versus the scarcity of pre-depositional-age Triassic grains of sufficient size for analysis due to the lack of Triassic rocks in the source region (mainly the Ouachita orogen) and the small (< 60 µm) grain size of most sediment. In contrast, for the Sonsela Member, the LA-ICPMS average ages and MDAs are interpreted to predate the other chronologic records because the sediment was derived from the south, where abundant igneous rocks of Permian–Triassic age were exposed, and the grain size of the detrital (pre-depositional-age) zircons was sufficiently large that many would have been analyzed.
A test of this hypothesis is provided by MSWD values of the weighted means calculated for ages from samples belonging to the various stratigraphic units. As shown in Table S6, average MSWD values for samples from dominantly fine-grained strata of the Mesa Redondo–Blue Mesa and Petrified Forest units are 1.7 and 1.3 (respectively), whereas coarser-grained strata of the lower and upper Sonsela units yield higher MSWD values of 2.6 and 2.1 (respectively). These values are consistent with the interpretation that Triassic zircon grains in coarser-grained units have a greater range of ages than Triassic zircon grains in finer-grained units.
These interpreted connections may also provide an explanation for the patterns of offset of the CA-TIMS ages of Rasmussen et al. (2020) relative to the LA-ICPMS ages and magnetostratigraphic age models in the Sonsela Member (Fig. 13). For strata of the upper Sonsela Member, the CA-TIMS and magnetostratigraphic records converge because the methods of grain selection were apparently successful in identifying populations of syn-depositional-age zircon grains. For strata of the lower Sonsela Member, however, these methods were unsuccessful in identifying a sufficient number of depositional-age zircon grains to determine a reliable MDA, presumably because of their low abundance relative to older transported grains.
The second main pattern exhibited by the three chronometers is that most of the LA-ICPMS-based average ages and MDAs belong to five main clusters (∼ 223, ∼ 222–220, ∼ 217–215, ∼ 212–211, and ∼ 210 Ma), whereas the other chronologic records show a relatively simple pattern of upward younging (Fig. 13). For the ∼ 222–220 Ma cluster, a plausible interpretation, following from the connections described above, is that ∼ 222–220 Ma zircon grains of air-fall origin accumulated in fine-grained strata of the lower Blue Mesa Member and were then recycled from age-equivalent strata into predominantly coarser-grained channel sands of the upper Blue Mesa Member and lower Sonsela Member. Grains from these same sources appear to have also been recycled into sandstone sample 131-2 of the lower Petrified Forest Member (Fig. 13). The ∼ 212–211 Ma cluster may have formed in a similar fashion, with initial accumulation of near-depositional-age air-fall zircons in mudstones of sample 116-1, followed by recycling of these grains from age-equivalent strata into coarser-grained strata of samples 104-3, 92-2, and 84-2 (Fig. 13).
The source of zircon grains that belong to the ∼ 217–215 Ma cluster is less obvious given the lack of recognized fine-grained strata dominated by zircons of this age (Fig. 13). One possibility is that ∼ 217–215 Ma grains were eroded from fine-grained strata exposed elsewhere (perhaps near Sonsela Buttes, Marsh et al., 2019, or near the Cordilleran magmatic arc) that are dominated by grains of this age. A second possibility is that fine-grained strata dominated by ∼ 217–215 Ma ages were originally present in the lower Sonsela Member but were removed by erosion and recycled into strata of the upper Sonsela Member. Previous workers have suggested the existence of a hiatus or hiatuses (Ramezani et al., 2011) or an erosional event (Rasmussen et al., 2020) at approximately this stratigraphic level, as shown by the preferred age model of Rasmussen et al. (2020) in Fig. 13. The occurrence of very different < 240 Ma ages, > 240 Ma ages, and U ∕ Th values in samples 196-3 and 195-2 suggests that this shift in provenance, accumulation of a condensed section, or formation of an unconformity likely coincides with the proposed boundary between strata of the lower Sonsela Member and upper Sonsela Member. As discussed by Ramezani et al. (2011) and Rasmussen et al. (2020), the possibility of an unconformity or condensed section near this stratigraphic position has important implications for Chinle stratigraphy and fundamental Late Triassic biotic and climatic changes. It should be noted, however, that no stratigraphic evidence for such an unconformity was recognized in the CPCP core.
The interpreted connections between the three geochronologic records and Chinle stratigraphy provide an opportunity to reconstruct the depositional history of the Chinle Formation. Fundamental assumptions in reconstructing this history are as follows:
-
Chinle Formation strata encountered in the CPCP core record nearly continuous deposition as described in the age model of Kent et al. (2019), perhaps with a period of erosion or very slow deposition in the middle part of the Sonsela Member (Rasmussen et al., 2020).
-
LA-ICPMS ages recovered from strata of the Chinle Formation belong to five separate groups (red vertical bars of Fig. 13) due to the hypothesized connections between stratigraphy, grain size, and proportions of near-depositional-age (air-fall) versus older (recycled) zircon ages.
-
Late Triassic igneous activity in the Cordilleran magmatic arc provided a nearly continuous supply of zircon grains of air-fall origin to the Chinle deposystem. This assumption is supported by the relatively continuous distribution of U–Pb ages within the Cordilleran magmatic arc and back-arc (upper curves of Fig. 13).
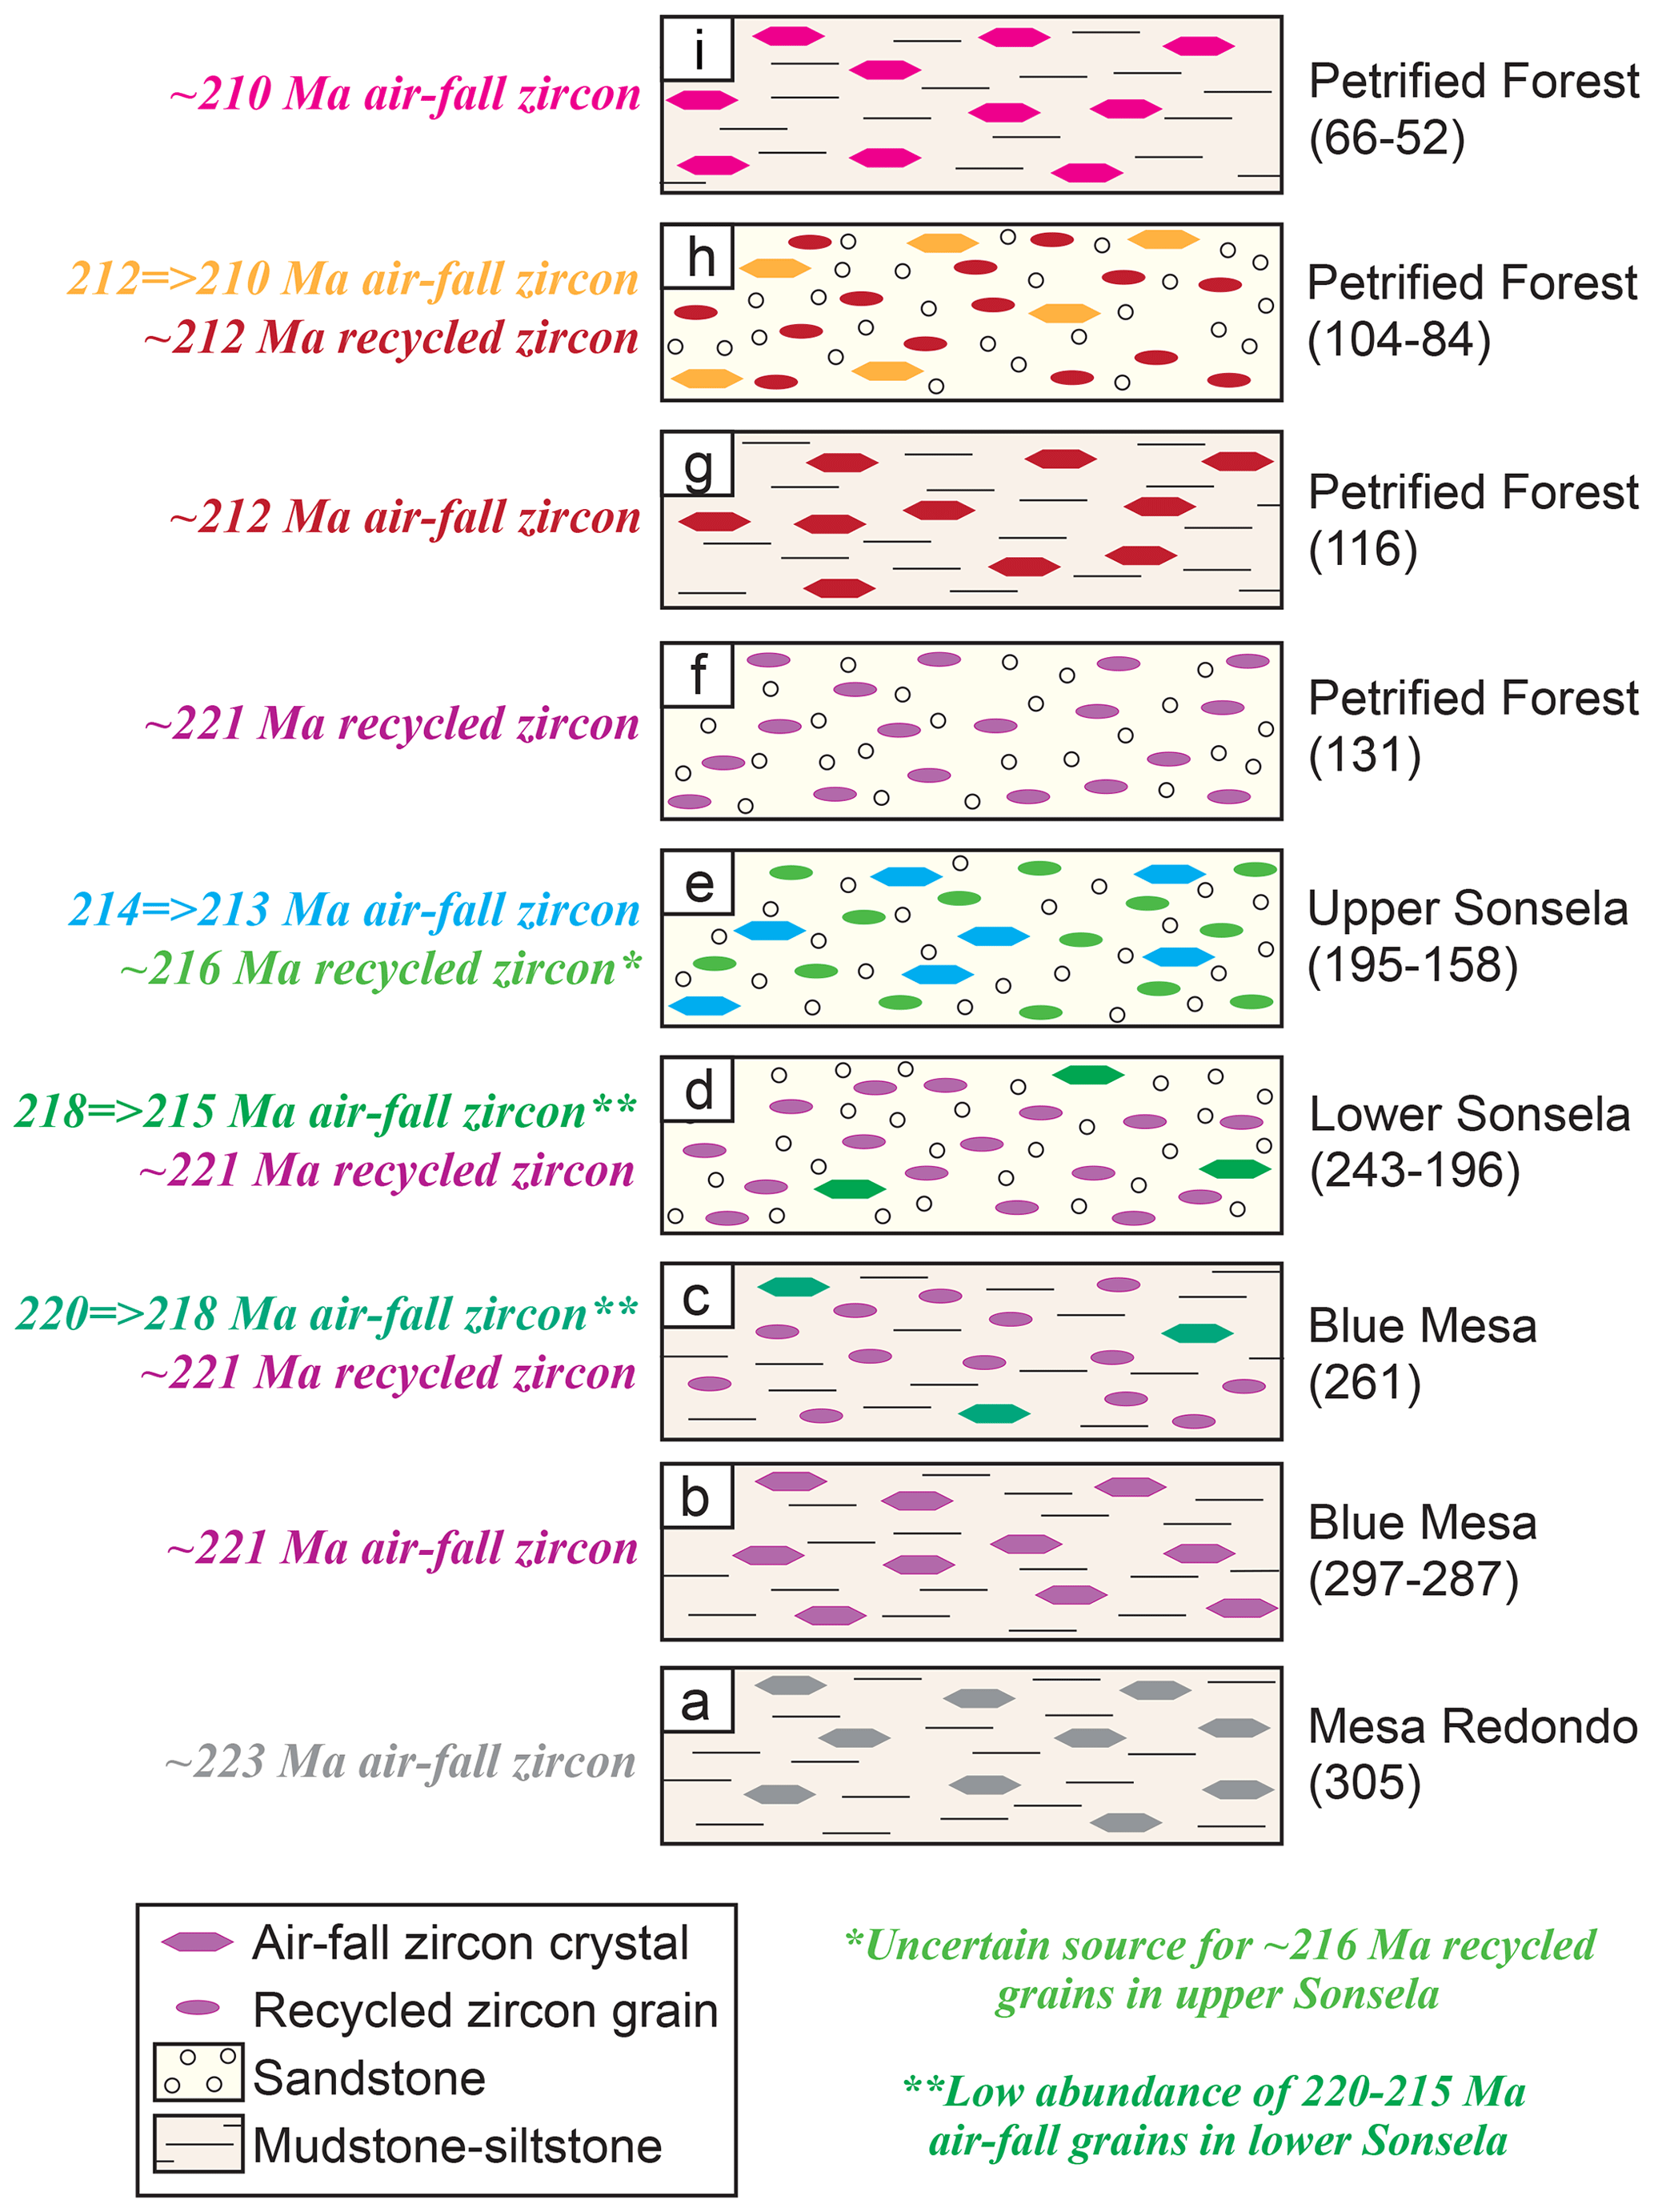
Figure 14Depositional model of strata of the Chinle Formation encountered in the CPCP core. Each time slice contains information about the dominant grain size of the host sedimentary rock, the abundance of syn-depositional-age zircon grains that are interpreted to be of air-fall origin, and the abundance of recycled zircon grains that predate deposition.
The interpreted stratigraphic evolution is summarized below and shown schematically in Fig. 14. Important phases in this evolution are as follows:
- a.
An LA-ICPMS MDA of ∼ 223.3 Ma from our one sample from the Mesa Redondo Member (305-2) agrees with the magnetostratigraphic information, the two age models, and the set of CA-TIMS ages from this sample, presumably because these fine-grained strata are dominated by zircon grains of air-fall origin. Older CA-TIMS ages of ∼ 225.2 Ma (Ramezani et al., 2011) and ∼ 227.6 Ma (Atchley et al., 2013) from outcrops of the Mesa Redondo Member may be compromised by an abundance of recycled zircon grains.
- b.
LA-ICPMS average ages of ∼ 221–220 Ma for most grains from fine-grained strata in the lower part of the Blue Mesa Member are also near depositional age, presumably because the > 60 µm zircon grains in these fine-grained strata are dominated by air-fall (or slightly reworked) components. Minimum ages for these samples are somewhat younger, presumably due to Pb loss.
- c.
LA-ICPMS ages from strata of the upper Blue Mesa Member significantly predate deposition, presumably because these strata are dominated by recycled zircons. The predominance of 221–220 Ma LA-ICPMS ages suggests that most zircon grains were recycled from lateral equivalents of underlying strata in the lower part of the Blue Mesa Member. CA-TIMS ages also predate deposition, presumably because of the difficulty of isolating near-depositional-age grains of air-fall origin.
- d.
This pattern continues up through most of the lower Sonsela Member, with LA-ICPMS ages remaining at 221–220 Ma (except where compromised by Pb loss) due to recycling of strata from lateral equivalents of the lower Blue Mesa Member. Most CA-TIMS ages predate the age of deposition because depositional-age (air-fall) grains were diluted by recycled components.
- e.
The age patterns from sandstones of the upper Sonsela Member are somewhat puzzling given that the dominant ∼ 217–215 Ma LA-ICPMS ages predate deposition, but fine-grained strata that could have sourced grains of these ages are not present in the lower Sonsela Member (Fig. 13). One possibility, as described above, is that the ∼ 217–215 Ma grains were eroded from fine-grained strata exposed elsewhere (perhaps near Sonsela Buttes (Marsh et al., 2019) or from the Cordilleran magmatic arc) that are dominated by grains of this age. A second possibility is that fine-grained strata dominated by ∼ 217–215 Ma ages were originally present in the underlying lower Sonsela Member but were removed by erosion and recycled into strata of the upper Sonsela Member. An erosional event of the appropriate age and stratigraphic position has been described by Ramezani et al. (2011) and by Rasmussen et al. (2020), as shown by their age model in Fig. 13. The occurrence of very different < 240 Ma ages, > 240 Ma ages, and U ∕ Th values in samples 196-3 and 195-2 suggests that this change in provenance, condensed section, or unconformity most likely coincides with the boundary between lower and upper Sonsela Member strata. As discussed by Rasmussen et al. (2020), the possibility of an unconformity or condensed section near this stratigraphic position has important implications for Chinle stratigraphy and fundamental Late Triassic biotic and climatic changes.
- f.
The dominance of pre-depositional-age grains in sample 131-2 provides strong evidence for recycling of detrital zircons from lateral equivalents of underlying strata of the Blue Mesa Member or lower Sonsela Member.
- g.
All chronometers agree for strata of sample 116-1, presumably because these fine-grained strata are dominated by air-fall (or slightly reworked) detrital zircons.
- h.
LA-ICPMS ages from sandstones of the middle Petrified Forest Member (samples 104-3, 92-2, and 84-2) slightly predate deposition (except where compromised by Pb loss) because they were recycled from lateral equivalents of immediately underlying fine-grained strata (e.g., sample 116-1).
- i.
Most LA-ICPMS ages agree with the other chronometers for strata of the Black Forest bed because this unit is dominated by air-fall (or slightly reworked) detrital zircon grains. The minimum age for sample 66-1 is somewhat younger, presumably due to Pb loss.
First-order conclusions that result from our U–Pb geochronologic analyses of detrital zircon grains from the Coconino Sandstone, Moenkopi Formation, and Chinle Formation are as follows:
-
The provenance of strata belonging to the Coconino Sandstone and Moenkopi Formation can be reconstructed by comparison of our LA-ICPMS ages (Figs. 5 and 6) with age distributions that characterize potential source regions (Fig. 3). As shown in Figs. 5 and 11, data from our sample of the Coconino Sandstone and equivalent sandstones of the southern Colorado Plateau suggest that these strata belong to an eolian blanket that was derived largely from the Ouachita and/or Appalachian orogens, whereas strata from the northern Colorado Plateau consist mainly of sediment derived from local basement uplifts (Fig. 1; Dickinson and Gehrels, 2003; Gehrels et al., 2011; Lawton et al., 2015). Early–Middle Triassic strata of the Moenkopi Formation record a very different dispersal system, with most detritus derived from the Ouachita orogen, the East Mexico arc, and early phases of the Cordilleran magmatic arc (Figs. 6 and 9).
-
LA-ICPMS ages from strata of the Chinle Formation belong to five groups that generally correspond to the main stratigraphic units (Figs. 7, 8, and 13). Maximum depositional ages calculated from < 240 Ma ages and provenance interpretations derived from > 240 Ma ages are as follows:
-
Strata of the Mesa Redondo Member yield a preferred MDA of ∼ 223.3 Ma, and were derived mainly from the Ouachita orogen.
-
Strata of the Blue Mesa Member yield MDAs of ∼ 221.2 to ∼ 218.6 Ma, and were derived from local basement and Ouachita sources.
-
Strata in the lower part of the Sonsela Member yield similar MDAs of ∼ 221.3 to ∼ 219.2 Ma (plus an uppermost sample with an MDA of ∼ 217.9 Ma). Detritus was derived mainly from local basement (especially ∼ 1.44 Ga) sources, perhaps located in the ancestral Mogollon Highlands to the south.
-
Strata in the upper part of the Sonsela Member yield younger MDAs of ∼ 217.1 to ∼ 214.4 Ma, plus an uppermost sample with an MDA of ∼ 214.2 Ma. Grains with > 240 Ma ages were derived mainly from Precambrian basement (mainly ∼ 1.44 Ga) and Grenville-age rocks to south, as well as the East Mexico arc.
-
Strata of the Petrified Forest Member yield LA-ICPMS ages that belong to three separate groups. The lowest sample yields an MDA of ∼ 221.5, which is significantly older than ages from adjacent strata. The middle four samples yield MDAs of ∼ 211.9 to ∼ 209.9 Ma, whereas the upper two samples yield MDAs of ∼ 209.8 and ∼ 208.3 Ma. All six upper samples contain abundant > 240 Ma grains that were shed from a broad range of Ouachita, local basement, and East Mexico arc sources.
-
-
Patterns of U and Th concentration in Triassic zircon grains from the Chinle Formation belong to four distinct groups that generally coincide with the chronostratigraphic units described above. Changes in U and Th concentrations are interpreted to record variations in the chemistry of arc magmatism through time, as has been documented previously by Barth and Wooden (2006), Barth et al. (2011, 2013), and Riggs et al. (2010, 2012, 2016).
-
Comparison of the Chinle Formation MDAs with magnetostratigraphic information (Kent et al., 2018, 2019) and CA-TIMS geochronologic information (Rasmussen et al., 2020) from the CPCP core, plus CA-TIMS ages reported from outcrop samples, indicates that LA-ICPMS MDAs approximate depositional ages for most strata of the Mesa Redondo Member, Blue Mesa Member, and Petrified Forest Member (except where compromised by Pb loss) but significantly predate deposition for strata of the Sonsela Member (Fig. 13). The correlation of age patterns with stratigraphy is interpreted to reflect the proportions of air-fall (or slightly reworked) versus recycled (older) zircon grains: fine-grained strata are dominated by near-depositional ages because most zircon grains are of air-fall (or slightly reworked) origin, whereas coarse-grained strata are dominated by pre-depositional ages because recycled zircon grains dilute the abundance of air-fall crystals.
-
This hypothesized connection between stratigraphy and the three geochronologic records supports the following depositional history for Chinle Formation strata encountered in the CPCP core (Figs. 13 and 14):
-
LA-ICPMS ages and magnetostratigraphic information (Kent et al., 2019) indicate that the sampled part of the Mesa Redondo Formation was deposited at ∼ 223.3 Ma. CA-TIMS ages of ∼ 225.2 Ma (Ramezani et al., 2011) and ∼ 227.6 Ma (Atchley et al., 2013) from outcrop samples suggest that strata of the Mesa Redondo Member in other areas are dominated by older recycled components.
-
Magnetostratigraphic information (Kent et al., 2019) suggests that strata of the Blue Mesa Member and lower Sonsela Member accumulated between ∼ 222 and ∼ 214 Ma, whereas LA-ICPMS MDAs are consistently 222–220 Ma for the same strata (except for the uppermost sample of ∼ 218 Ma). This suggests that most zircons in strata of the upper Blue Mesa Member and lower Sonsela Member were recycled from lateral equivalents of strata of the lower Blue Mesa Member. The observation that most CA-TIMS ages from these strata also predate deposition is interpreted to result from the dilution of air-fall zircon crystals by older recycled zircon grains.
-
Strata of the upper Sonsela Member accumulated between ∼ 215 and ∼ 213 Ma, as constrained by magnetostratigraphic information and CA-TIMS ages. LA-ICPMS MDAs from these strata are ∼ 217–215 Ma, which indicates that they are dominated by zircons recycled from older units. The lack of samples in the lower Sonsela Member that are dominated by ∼ 217–215 Ma grains suggests that zircon grains of this age in upper Sonsela Member strata may have been transported from sections of the Chinle Formation exposed outside of the PEFO area. It is also possible that such strata were exposed in the PEFO area but were removed during an erosional event inferred by Rasmussen et al. (2020) from the pattern of CA-TIMS ages in the upper Sonsela Member (Fig. 3). Significant changes in < 240 Ma ages, > 240 Ma ages, and U–Th values suggest that this unconformity, if present, occurs between samples 196-3 and 195-2.
-
All available evidence suggests that mudstone and subordinate sandstone of the middle Petrified Forest Member accumulated at ∼ 212–211 Ma, and the Black Forest bed in the upper part of the unit accumulated at ∼ 210 Ma. In contrast, LA-ICPMS ages recovered from sample 131-2, from the lower part of the Petrified Forest Member, are dominantly ∼ 221 Ma, suggestive of recycling from lateral equivalents of strata of the Blue Mesa Member and lower Sonsela Member.
-
-
Comparisons of our LA-ICPMS ages, the available CA-TIMS data, and magnetostratigraphic information provide insights into methods for determining the depositional age of fluvial strata. Our results show that the most reliable information comes from sequences dominated by fine-grained clastic strata (mudstone and siltstone) given that these strata have a low abundance of pre-depositional-age zircon grains of the appropriate size (> 60 µm diameter) for routine analysis by LA-ICPMS. Mudstone–siltstone samples may accordingly yield a high proportion of > 60 µm zircon grains that are of air-fall origin (or only slightly reworked) and thereby record the age of deposition. In contrast, sedimentary sequences dominated by sandstone could well yield abundant > 60 µm zircon grains that predate deposition, thereby diluting syn-depositional-age zircon grains. Future attempts to determine depositional ages from fluvial strata should accordingly focus on sequences dominated by fine-grained strata, rather than sandstones, in spite of the challenges of extracting and analyzing the smaller zircon crystals.
All data are available from the included supplementary tables.
The supplement related to this article is available online at: https://doi.org/10.5194/gchron-2-257-2020-supplement.
NG and GG generated the LA-ICPMS data reported in this paper. All coauthors were involved in acquiring the samples that were analyzed and/or interpreting the data. GG prepared the manuscript with input from all co-authors.
The authors declare that they have no conflict of interest.
Geochronologic analyses were conducted with support from NSF EAR-0959107 and EAR-1649254 (to George Gehrels). Laboratory analyses were performed primarily by Dominique Giesler. Collaborative aspects of the project were supported by NSF EAR 0958976 (Paul Olsen and John Geissman), 0958723 (Roland Mundil), 0958915 (Randall Irmis), and 0958859 (Dennis Kent). Funding for coring and much logistical support was provided by ICDP (International Scientific Continental Drilling Program grant 05-2010: John Geissman, Paul Olsen, Jingeng Sha, Roberto Molina-Garza, Wolfram Kürschner, and Gerhard Bachmann). Additional funding was supplied by grants from the Lamont Climate Center (Paul Olsen). Field support was provided by LacCore personnel (Anders Noren, Kristina Brady, and Ryan O'Grady), drilling manager Doug Schnurrenberger, and core-handling volunteers (Justin Clifton, Bob Graves, Ed Lamb, Max Schnurrenberger, and Riley Black). Superintendent Brad Traver of the National Park Service arranged for permission to core in the PEFO and provided logistical support during site selection and drilling. This is Petrified Forest Paleontological Contribution 67. The conclusions presented here are those of the authors and do not represent the views of the United States Government.
This research has been supported by the National Science Foundation, Directorate for Geosciences (grant no. EAR-0959107 and EAR-1649254).
This paper was edited by Pieter Vermeesch and reviewed by Glenn Sharman and Jahandar Ramezani.
Ash, S. R.: The Black Forest Bed, a distinctive unit in the Upper Triassic Chinle Formation, north-eastern Arizona, J. Arizona-Nevada Acad. Sci., 24–25, 59–73, 1992.
Atchley, S. C., Nordt, L. C., Dworkin, S. I., Ramezani, J., Parker, W. G., Ash, S. R., and Bowring, S. A.: A linkage among Pangean tectonism, cyclic alluviation, climate change, and biologic turnover in the Late Triassic: The Record from the Chinle Formation, Southwestern United States, J. Sediment. Res., 83, 1147–1161, 2013.
Baranyi, V., Reichgelt, T., Olsen, P. E., Parker, W. G., and Kürschner, W. M.: Norian vegetation history and related environmental changes: new data from the Chinle Formation, Petrified Forest National Park (Arizona, SW USA), Geol. Soc. Am. B., 130, 775–795,https://doi.org/10.1130/B31673.1, 2017.
Barth, A. P. and Wooden, J. L.: Timing of magmatism following initial convergence at a passive margin, southwestern US Cordillera, and ages of lower crustal magma sources, J. Geol., 114, 231–245, 2006.
Barth, A. P. Walker, J. D., Wooden, J. L., Riggs, N. R., and Schweickert, R. A.: Birth of the Sierra Nevada magmatic arc: Early Mesozoic plutonism and volcanism in the east-central Sierra Nevada of California, Geosphere, 7, 877–897, 2011.
Barth, A. P., Wooden, J. L., Jacobson, C. E., and Economos, R. C.: Detrital zircon as a proxy for tracking the magmatic arc system: The California arc example, Geology, 41, 223–226, 2013.
Black, L., Kamo, S., Allen, C., Davis, D., Aleinikoff, J., Valley, J., Mundil, R., Campbell, I., Korsch, R., Williams, I., and Foudoulis, C.: Improved 206Pb/238U microprobe geochronology by the monitoring of a trace-element-related matrix effect; SHRIMP, ID–TIMS, ELA–ICP–MS and oxygen isotope documentation for a series of zircon standards, Chem. Geol., 205, 115–140, 2004.
Blakey, R. C., Peterson, F., and Kocurek, G.: Synthesis of late Paleozoic and Mesozoic eolian deposits of the western interior of the United States, Sedimentary Geology, 56, 3–125, 1988.
Chen, J. H. and Moore, J. G.: Uranium-lead isotopic ages from the Sierra Nevada batholith, J. Geophys. Res., 87, 4761–4784, 1982.
Cohen, K. M., Finney, S. C., Gibbard, P. L., and Fan, J.-X.: The ICS International Chronostratigraphic Chart, Episodes 36, 199–204, 2013 (updated 2018).
Creber, G. T. and Ash, S. R.: Evidence of widespread fungal attack on Upper Triassic trees in the southwestern U.S.A., Rev. Palaeobot. Palynol., 63, 189–195, 1990.
DeGraaff-Surpless, K., Graham, S. A., Wooden, J. L., and McWilliams, M. O.: Detrital zircon provenance analysis of the Great Valley Group, California: Evolution of an arc-forearc system, Geol. Soc. Am. B., 114, 1564–1580, 2002.
Dickinson, W. R.: Tectonosedimentary Relations of Pennsylvanian to Jurassic strata on the Colorado Plateau, Geol. Soc. Am. Sp. P., 533, 184 pp., 2018.
Dickinson, W. R. and Gehrels, G. E.: U-Pb ages of detrital zircon grains from Permian and Jurassic eolian sandstones of the Colorado Plateau, USA, Paleogeographic implications, Sediment. Geol., 163, 29–66, 2003.
Dickinson, W. R. and Gehrels, G. E.: U-Pb ages of detrital zircon grains in relation to paleogeography: Triassic paleodrainage networks and sediment dispersal across southwest Laurentia, J. Sediment. Res., 78, 745–764, 2008.
Dickinson, W. R. and Gehrels, G. E.: Use of U–Pb ages of detrital zircon grains to infer maximum depositional ages of strata: a test against a Colorado Plateau Mesozoic database, Earth Planet. Sc. Lett., 288, 115–125, 2009.
Galbraith, R. and Laslett, G.: Statistical models for mixed fission track ages, Nuclear tracks and radiation measurements, 21, 459–470, 1993.
Gehrels, G. E.: Introduction to detrital zircon studies of Paleozoic and Triassic strata in western Nevada and northern California, in: Paleozoic and Triassic paleogeography and tectonics of western Nevada and northern California, edited by: Soreghan, M. J. and Gehrels, G. E., Geological Society of America Special Paper 347, 1–18, 2000.
Gehrels, G. E.: Detrital zircon U-Pb geochronology applied to tectonics, Ann. Rev. Earth Planet. Sc., 42, 127–149, 2014.
Gehrels, G. and Pecha, M.: Detrital zircon U-Pb geochronology and Hf isotope geochemistry of Paleozoic and Triassic passive margin strata of western North America, Geosphere, 10, 49–65, 2014.
Gehrels, G. E., Valencia, V., and Pullen, A.: Detrital zircon geochronology by Laser-Ablation Multicollector ICPMS at the Arizona LaserChron Center, in: Geochronology, Emerging Opportunities, edited by: Loszewski, T. and Huff, W., Paleontology Society Short Course: Paleontology Society Papers, 11, 10 pp., 2006.
Gehrels, G. E., Valencia, V., and Ruiz, J.: Enhanced precision, accuracy, efficiency, and spatial resolution of U-Pb ages by laser ablation–multicollector–inductively coupled plasma–mass spectrometry, Geochem. Geophy. Geosy., 9, Q03017, https://doi.org/10.1029/2007GC001805, 2008.
Gehrels, G., Blakey, R., Karlstrom, K., Timmons, M., Dickinson, W., and Pecha, M.: Detrital zircon U-Pb geochronology of Paleozoic strata in the Grand Canyon: Lithosphere, 3, 183–200, 2011.
González-León, C. M., Valencia, V. A., Lawton, T. F., Amato, J. M., Gehrels, G. E., Leggett, W. J., Montijo-Contreras, O., and Fernández, M. A.: The lower Mesozoic record of detrital zircon U-Pb geochronology of Sonora, México, and its paleogeographic implications, Revista Mexicana de Ciencias Geológicas, 26, 301–314, 2009.
Heckert, A. B. and Lucas, S. G.: Revised Upper Triassic stratigraphy of the Petrified Forest National Park, Arizona, USA, New Mexico Museum of Natural History Science Bulletin, 21, 1–36, 2002.
Heckert, A. B., Lucas, S. G., Dickinson, W. R., and Mortensen, J. K.: New ID-TIMS U-Pb ages for Chinle Group strata (Upper Triassic) in New Mexico and Arizona, correlation to the Newark Supergroup, and implications for the “long Norian”: Geological Society of America Abstracts with Programs, 41, p. 123, 2009.
Hildebrand, R. S.: Did westward subduction cause Cretaceous-Tertiary orogeny in the North American Cordillera?, Geological Society of America Special paper 457, 71 pp., 2009.
Hildebrand, R. S.: Mesozoic assembly of the North American cordillera: Geological Society of America Special paper 495, 169 pp., 2013.
Hoke, G., Schmitz, M., and Bowring, S.: An ultrasonic method for isolating nonclay components from clay-rich material, Geochem. Geophy. Geosy., 15, 492–498, 2014.
Horstwood, M., Kosler, J., Gehrels, G., Jackson, S., McLean, N., Paton, C., Pearson, N., Sircombe, K., Sylvester, P., Vermeesch, P., Bowring, J., Condon, D., and Schoene, B.: Community-Derived Standards for LA-ICP-MS U-Th-Pb Geochronology – Uncertainty Propagation, Age Interpretation and Data Reporting, Geostand. Geoanal. Res., 40, 311–332, 2016.
Irmis, R. B., Mundil, R., Martz, J. W., and Parker, W. G.: High-resolution U-Pb ages from the Upper Triassic Chinle Formation (New Mexico, USA) support a diachronous rise of dinosaurs, Earth Planet. Sc. Lett., 309, 258–267, 2011.
Kent, D. V., Olsen, P. E., and Muttoni, G.: Astrochronostratigraphic polarity time scale (APTS) for the Late Triassic and Early Jurassic from continental sediments and correlation with standard marine stages, Earth-Sci. Rev., 166, 153–180, 2017.
Kent, D. V., Olsen, P. E., Rasmussen, C., Lepre, C. J., Mundil, R., Irmis, R. B., Gehrels, G. E., Giesler, D., Geissman, J. W., and Parker, W. G.: Empirical evidence for stability of the 405 kyr Jupiter-Venus eccentricity cycle over hundreds of millions of years, P. Natl. Acad. Sci. USA, 115, 6153–6158, 2018.
Kent, D. V., Olsen, P. E., Lepre, C. Mundil, R., Rasmussen, C., Irmis, R. B., Gehrels, G. E., Giesler, D., Geissman, J. W., and Parker, W. G.: Magnetochronology of the entire Chinle Formation (Norian age) in scientific drill core PFNP-1A from the Petrified Forest National Park (Arizona, USA) and implications For Global Correlations In The Late Triassic, Geochem. Geophy. Geosy., 20, 4654–4664, https://doi.org/10.1029/2019GC008474, 2019.
Kissock, J. K., Finzel, E. S., Malone, D. H., and Craddock, J. P.: Lower–Middle Pennsylvanian strata in the North American midcontinent record the interplay between erosional unroofing of the Appalachians and eustatic sea-level rise, Geosphere, 14, 141–161, 2018.
Lawton, T. F., Buller, C. D., and Parr, T. R.: Provenance of a Permian erg on the western margin of Pangea: Depositional system of the Kungurian (late Leonardian) Castle Valley and White Rim sandstones and subjacent Cutler Group, Paradox Basin, Utah, USA, Geosphere, 11, 1–32, 2015.
Lucas, S. G.: The Chinle Group: revised stratigraphy and biochronology of Upper Triassic nonmarine strata in the western United States, in: Aspects of Mesozoic Geology and Paleontology of the Colorado Plateau, edited by: Morales, M., Museum of Northern Arizona Bulletin 59, Flagstaff, Museum of Northern Arizona Press, 27–50, 1993.
Ludwig, K. R.: Isoplot 3.6, Berkeley Geochronology Center Special Publication 4, 77 pp., 2008.
Marsh, A. D., Parker, W. G., Stockli, D. F., and Martz, J. W.: Regional correlation of the Sonsela Member (Upper Triassic Chinle Formation) and detrital U-Pb zircon data from the Sonsela Sandstone bed near the Sonsela Buttes, northeastern Arizona, USA, support the presence of a distributive fluvial system, Geosphere, 15, 1128–1139, https://doi.org/10.1130/GES02004.1, 2019.
Martz, J. W. and Parker, W. G.: Revised lithostratigraphy of the Sonsela Member (Chinle Formation, Upper Triassic) in the southwestern part of Petrified Forest National Park, Arizona, PLoS ONE, 5, e9329, https://doi.org/10.1371/journal.pone.0009329, 2010.
Martz, J. W., Parker, W. G., Skinner, L., Raucci, J. J., Umhoefer, P., and Blakey, R.C.: Geologic map of Petrified Forest National Park, Arizona: Arizona Geological Survey Contributed Map CM-12-A, 1 map sheet, scale 1 : 50 000, 18 pp., available at: http://repository.azgs.az.gov/uri_gin/azgs/dlio/1487 (last access: 9 September 2020), 2012.
Martz, J. W., Kirkland, J. I., Milner, A. R. C., Parker, W. G., and Santucci, V. L.: Upper Triassic lithostratigraphy, depositional sytems, and vertebrate paleontology across southern Utah, Geology of the Intermountain West, 4, 99–180, available at: https://www.utahgeology.org/wp-content/uploads/2018/05/GIW2017-v04-pp099-180-Martz.pdf (last access: 9 September 2020), 2017.
Miller, J. S., Glazner, A. F., Walker, J. D., and Martin, M. W.: Geochronologic and isotopic evidence for Triassic–Jurassic emplacement of the eugeoclinal allochthon in the Mojave Desert region, California, Geol. Soc. Am. B., 107, 1441–1457, 1995.
Nordt, L., Atchley, S., and Dworkin, S.: Collapse of the Late Triassic megamonsoon in western equatorial Pangea, present-day American southwest, Geol. Soc. Am. B., 127, 1798–1815, 2015.
Olsen, P. E., Kent, D. V., and Whiteside, H.: Implications of the Newark Supergroup-based astrochronology and geomagnetic polarity time scale (Newark-APTS) for the tempo and mode of the early diversification of the Dinosauria, Earth Env. Sci. T. R. So., 101, 201–229, 2011.
Olsen, P. E., Geissman, J. W., Kent, D. V., Gehrels, G. E., Mundil, R., Irmis, R. B., Lepre, C., Rasmussen, C., Giesler, D., Parker, W. G., Zakharova, N., Kürschner, W. M., Miller, C., Baranyi, V., Schaller, M. F., Whiteside, J. H., Schnurrenberger, D., Noren, A., Brady Shannon, K., O'Grady, R., Colbert, M. W., Maisano, J., Edey, D., Kinney, S. T., Molina-Garza, R., Bachman, G. H., Sha, J., and the CPCD team: Colorado Plateau Coring Project, Phase I (CPCP-I): a continuously cored, globally exportable chronology of Triassic continental environmental change from western North America, Sci. Dril., 24, 15–40, https://doi.org/10.5194/sd-24-15-2018, 2018.
Olsen, P. E., Laskar, J., Kent, D. V., Kinney, S. T., Reynolds, D. J., Sha, J. and Whiteside, J. H.: Mapping Solar System chaos with the Geological Orrery, P. Natl. Acad. Sci., 116, 10664–10673, 2019.
Ortega-Flores, B., Solari, L., Lawton, T. F., and Ortega-Obregón, C.: Detrital-zircon record of major Middle Triassic–Early Cretaceous provenance shift, central Mexico: demise of Gondwanan continental fluvial systems and onset of backarc volcanism and sedimentation, Int. Geol. Rev., 56, 237–261, 2014.
Paces, J. B. and Miller, J. D.: Precise U-Pb ages of Duluth Complex and related mafic intrusions, northeastern Minnesota: Geochronological insights to physical, petrogenetic, paleomagnetic, and tectonomagmatic processes associated with the 1.1 Ga midcontinent rift system, J. Geophys. Res., 98, 13997–14013, https://doi.org/10.1029/93JB01159, 1993.
Parker, W. and Martz, J.: Constraining the stratigraphic position of the Late Triassic (Norian) Adamanian-Revueltian faunal transition in the Chinle Formation of Petrified Forest National Park, Arizona, J. Vertebr. Paleontol., 29, 162A, 2009.
Parker, W. G. and Martz, J. W.: The Late Triassic (Norian) Adamanian–Revueltian tetrapod faunal transition in the Chinle Formation of Petrified Forest National Park, Arizona, Earth Env. Sci. T. R. So., 101, 231–260, 2011.
Pipiringos, G. N. and O'Sullivan, R. B.: Principal unconformities in Triassic and Jurassic rocks, Western Interior United States – a preliminary survey, Geological Survey Professional Paper 1035-A, 29 pp., 1978.
Pullen, A., Ibanez-Mejia, M., Gehrels, G., Giesler, D., and Pecha, M.: Optimization of a Laser Ablation-Single Collector-Inductively Coupled Plasma-Mass Spectrometer (Thermo Element 2) for Accurate, Precise, and Efficient Zircon U-Th-Pb Geochronology, Geochem. Geophy. Geosy., 19, 3689–3705, https://doi.org/10.1029/2018GC007889, 2018.
Ramezani, J., Hoke, G. D., Fastovsky, D. E., Bowring, S. A., Therrien, F., Dworkin, S. I., Atchley, S. C., and Nordt, L. C.: High precision U-Pb zircon geochronology of the Late Triassic Chinle Formation, Petrified Forest National Park (Arizona, USA): Temporal constraints on the early evolution of dinosaurs, Geol. Soc. Am. B., 123, 2142–2159, 2011.
Ramezani, J., Fastovsky, D. E., and Bowring, S. A.: Revised chronostratigraphy of the lower Chinle Formation strata in Arizona Arizona and New Mexico (USA): high-precision U-Pb geochronological constraints on the Late Triassic evolution of dinosaurs, Am. J. Sci., 314, 981–1008, 2014.
Rasmussen, C., Mundil, R., Irmis, R. B., Geisler, D., Gehrels, G. E., Olsen, P. E., Kent, D. V., Lepre, C., Geissmann, J. W., and Parker, W. G.: A high-resolution age model for the Upper Triassic Chinle Formation (Petrified Forest National Park, Arizona, USA) constrained by U-Pb geochronology and magnetostratigraphy: implications for Late Triassic paleoecological and paleoenvironmental change, Geol. Soc. Am. B., https://doi.org/10.1130/B35485.1, 2020.
Reichgelt, T., Parker, W. G., Martz, J. W., Conran, J. G., Cittert, J. H. A. K., and Kürschner, W. M.: The palynology of the Sonsela Member (Late Triassic, Norian) at Petrified Forest National Park, Arizona, USA, Rev. Palaeobot. Palyno., 189, 18–28, doi.org/10.1016/j.revpalbo.2012.11.001, 2013.
Riggs, N. R., Lehman, T. M., Gehrels, G. E., and Dickinson, W. R.: Detrital zircon link between headwaters and terminus of the Upper Triassic Chinle–Dockum paleoriver system, Science, 273, 97–100, 1996.
Riggs, N. R., Ash, S. R., Barth, A. P., Gehrels, G. E., and Wooden, J. L.: Isotopic age of the Black Forest Bed, Petrified Forest Member, Chinle Formation, Arizona: an example of dating a continental sandstone, Geol. Soc. Am. B., 115, 1315–1323, 2003.
Riggs, N. R., Barth, A. P., González-León, C., Jacobson, C. E., Howell, E., Wooden, J. E., and Walker, J. D.: Provenance of Upper Triassic strata in southwestern North America as suggested by isotopic analysis and chemistry of zircon crystals, in: Mineralogical and Geochemical Approaches to Provenance, edited by: Rasbury, E. T., Hemming, S., and Riggs, N., Geological Society of America Special Paper 487, 13–36, https://doi.org/10.1130/2012.2487(02), 2012.
Riggs, N. R., Reynolds, S. J., Lindner, P. J., Howell, E. R., Barth, A. P., Parker, W. G., and Walker, J. D.: The Early Mesozoic Cordilleran arc and Late Triassic paleotopography: The detrital record in Upper Triassic sedimentary successions on and off the Colorado Plateau, Geosphere, 9, 602–613, 2013.
Riggs, N. R., Oberling, Z. A., Howell, E. R., Parker, W. G., Barth, A. P., Cecil, M. R., and Martz, J. W.: Sources of volcanic detritus in the basal Chinle Formation, southwestern Laurentia, and implications for the Early Mesozoic magmatic arc, Geosphere, 12, 439–463, 2016.
Saleeby, J., and Dunne, G.: Temporal and tectonic relations of early Mesozoic arc magmatism, southern Sierra Nevada, California, in: Late Jurassic Margin of Laurasia – A Record of Faulting Accommodating Plate Rotation, edited: Anderson, T. H., Didenko, A. N., Johnson, C. L., Khanchuk, A. I., and MacDonald Jr., J. H., Geol. Soc. Am. Sp. P., 513, 223–268, 2015.
Saylor, J. E. and Sundell, K. E.: Quantifying comparison of large detrital geochronology data sets, Geosphere, 12, 203–220, 2016.
Saylor, J. E., Jordan, J. C., Sundell, K. E., Wang, X., Wang, S., and Deng, T.: Topographic growth of the Jishi Shan and its impact on basin and hydrology evolution, NE Tibetan Plateau, Basin Res., 30, 544–563, 2018.
Stewart, J. H., Anderson, T. H., Haxel, G. B., Silver, L. T., and Wright, J. E.: Late Triassic paleogeography of the southern Cordillera: The problem of a source for the voluminous volcanic detritus in the Chinle Formation of the Colorado Plateau region, Geology, 14, 567–570, 1986.
Sundell, K. E., Saylor, J. E., and Pecha, M.: Provenance and recycling of detrital zircons from Cenozoic Altiplano strata and the crustal evolution of western South America from combined U-Pb and Lu-Hf isotopic analysis, J. S. Am. Earth Sci., 363–397, https://doi.org/10.1016/B978-0-12-816009-1.00014-9, 2019.
Surpless, K. D., Graham, S. A., Covault, J. A., and Wooden, J. L.: Does the Great Valley Group contain Jurassic strata? Reevaluation of the age and early evolution of a classic forearc basin, Geology, 34, 21–24, 2006.
Thomas, W. A., Gehrels, G. E., Greb, S. F., Nadon, G. C., Satkoski, A. M., and Romero, M. C.: Detrital zircon grains and sediment dispersal in the Appalachian foreland, Geosphere, 13, 2206–2230, 2017.
Thomas, W. A., Gehrels, G. E., Lawton, T., Satterfield, J., Romero, M., and Sundell, K.: Detrital zircon grains and sediment dispersal from the Coahuila terrane of northern Mexico into the Marathon foreland of the southern Midcontinent, Geosphere, 15, 1102–1127, 2019.
Tobisch, O. T., Fiske, R. S., Saleeby, J. B., Holt, E., and Sorensen, S. S.: Steep tilting of metavolcanic rocks by multiple mechanisms, central Sierra Nevada, California, Geol. Soc. Am. B., 112, 1043–1058, 2000.
Vermeesch, P.: Multi-sample comparison of detrital age distributions, Chem. Geol., 341, 140–146, 2013.
Vermeesch, P.: Dissimilarity measures in detrital geochronology, Earth-Sci. Rev., 178, 310–321, https://doi.org/10.1016/j.earscirev.2017.11.027, 2018a.
Vermeesch, P.: Statistics for fission tracks, in: Fission track thermochronology and its application to geology, edited by: Malusa, M. and Fitzgerald, P., Springer, 2018b.
Vermeesch, P.: Maximum depositional age estimation revisited: Geoscience Frontiers, in press, 2020.
Wissink, G. K., Wilkinson, B. H., and Hoke, G. D.: Pairwise sample comparisons and multidimensional scaling of detrital zircon ages with examples from the North American platform, basin, and passive margin settings, Lithosphere, 10, 478–491, https://doi.org/10.1130/L700.1, 2018.
Woody, D. T.: Revised stratigraphy of the lower Chinle Formation (Upper Triassic) of Petrified Forest National Park, Arizona, Museum of Northern Arizona Bulletin, 62, 17–45, 2006.
Wright, J. E. and Wyld, S. J.: Alternative tectonic model for Late Jurassic through Early Cretaceous evolution of the Great Valley Group, California, in: Convergent Margin Terranes and Associated Regions: A Tribute to W. G. Ernst, edited by: Cloos, M., Carlson, W. D., Gilbert, M. C., Liou, J. G., and Sorensen, S. S., Geological Society of America Special Paper 419, 1–15, 2007.
Xie, X., Anthony, J. M., and Busbey, A. B.: Provenance of Permian Delaware Mountain Group, central and southern Delaware basin, and implications of sediment dispersal pathway near the southwestern terminus of Pangea, Int. Geol. Rev., 61, 361–380, https://doi.org/10.1080/00206814.2018.1425925, 2018.
- Abstract
- Introduction
- Strata encountered in the Petrified Forest National Park drill core
- Sampled horizons
- Analytical and interpretive methods
- U–Pb geochronologic results
- U and Th geochemistry of Chinle zircon grains
- Provenance interpretations
- Maximum depositional ages
- Comparison of LA-ICPMS, CA-TIMS, and magnetostratigraphic constraints on depositional age of Chinle Formation strata
- Implications for the stratigraphy of the Chinle Formation
- Conclusions
- Data availability
- Author contributions
- Competing interests
- Acknowledgements
- Financial support
- Review statement
- References
- Supplement