the Creative Commons Attribution 4.0 License.
the Creative Commons Attribution 4.0 License.
 | 22 Oct 2020
Resolving multiple geological events using in situ Rb–Sr geochronology: implications for metallogenesis at Tropicana, Western Australia
Hugo K. H. Olierook
Kai Rankenburg
Stanislav Ulrich
Christopher L. Kirkland
Noreen J. Evans
Stephen Brown
Brent I. A. McInnes
Alexander Prent
Jack Gillespie
Bradley McDonald
Miles Darragh
Dating multiple geological events in single samples using thermochronology and geochronology is relatively common, but it is only with the recent advent of triple quadrupole laser ablation inductively coupled plasma mass spectrometry (LA-ICP-MS) that in situ rubidium–strontium (Rb–Sr) dating has become a more commonly applied and powerful tool to date K-rich or Rb-bearing minerals. Here, we date two generations of mineral assemblages in individual thin sections using the in situ Rb–Sr method. Two distinct mineral assemblages, both probably associated with Au mineralization, are identified in samples from the Tropicana gold mine in the Albany–Fraser Orogen, Western Australia. For Rb–Sr purposes, the key dateable minerals are two generations of biotite as well as additional phengite associated with the younger assemblage. Our results reveal that the first, coarse-grained generation of biotite grains records a minimum age of 2535±18 Ma, coeval with previous 40Ar∕39Ar biotite, rhenium–osmium (Re–Os) pyrite and uranium–lead (U–Pb) rutile results. The second, fine-grained and recrystallized generation of biotite grains record an age of 1207±12 Ma across all samples. Phengite and muscovite yielded broadly similar results at ca. 1.2 Ga, but data are overdispersed for a single coeval population of phengite and show elevated age uncertainties for muscovite. We propose that the ca. 2530 Ma age recorded by various geochronometers represents cooling and exhumation and that the age of ca. 1210 Ma is related to major shearing associated with the regional deformation as part of Stage II of the Albany–Fraser Orogeny. This is the first time that an age of ca. 1210 Ma has been identified in the Tropicana Zone, which may have ramifications for constraining the timing of mineralization in the region. The in situ Rb–Sr technique is currently the only tool capable of resolving both geological events in these rocks.
- Article
(18440 KB) - Full-text XML
-
Supplement
(120693 KB) - BibTeX
- EndNote


The ability to date multiple events in individual samples has important consequences for developing a comprehensive understanding of the geological history of complex terranes. The uranium–lead (U–Pb) method has long been employed to date crystallization, metamorphism and hydrothermal events, often by targeting cores and rims in individual grains. Many U-bearing minerals have recorded multiple ages due to their ability to participate in metamorphic reaction, hydrothermal episodes or become (partially) reset by events above mineral closure temperatures, including zircon (Liu et al., 2012), monazite (Rasmussen et al., 2007), titanite (Olierook et al., 2019b; Kirkland et al., 2020), rutile (Zack and Kooijman, 2017; Olierook et al., 2019a) and apatite (Kirkland et al., 2018). However, not all geological events are associated with (partial) reset or new growth of U-bearing minerals. In these scenarios, it is important to examine alternative minerals that may provide a more complete record of the geological history.
The rubidium–strontium (Rb–Sr) isotopic system is particularly valuable for geochronology, as Rb is sufficiently abundant in common K-bearing minerals like biotite, muscovite and K-feldspar that are abundant in a wide variety of rocks and are readily mobilized during fluid–rock interactions (Riley and Compston, 1962; Attendorn and Bowen, 1997). 87Sr decays to 87Rb with a recently revised decay constant of ( a (equivalent to a half-life of ∼49.6 Ga; Villa et al., 2015). However, the most significant disadvantage of traditional Rb–Sr geochronology is the inability to perform in situ dating via secondary ion mass spectrometry (SIMS) or laser ablation inductively coupled plasma mass spectrometry (LA-ICP-MS; Nebel, 2013). Although several studies have dated mineral separates on a small scale (Glodny et al., 2002; Glodny et al., 2003), some even texturally constrained by micromilling (Chen et al., 1996; Charlier et al., 2006; Müller et al., 2000), the Rb–Sr technique could not compete with the <100 µm diameter resolution of the U–Pb method.
The major obstacle with in situ Rb–Sr geochronology is the isobaric interference of different isotopes, most notably that of 87Rb and 87Sr (Zack and Hogmalm, 2016). Pioneering work from Moens et al. (2001) and Vanhaecke et al. (2003) showed that it was possible to achieve chemical separation of interfering 87Rb from 87Sr inside a conventional ICP-MS by directing the ion beam through a dynamic reaction cell with CH3F gas to produce SrF+ () but leave Rb unaffected (). However, this technique was relatively imprecise ( %; Vanhaecke et al., 2003), particularly when compared with in situ U–Pb methods ( %), and still required dissolution of the sample.
With the recent advent of “triple quadrupole” LA-ICP-MS, it is now possible to perform in situ Rb–Sr dating at a precision that rivals in situ U–Pb geochronology (Zack and Hogmalm, 2016; Hogmalm et al., 2017). A reaction cell located between two quadrupoles is filled with a selected gas (e.g., N2O, SF6, O2) that reacts with Sr+ ions but leaves Rb+ unaffected. Thus, the first quadrupole is used to filter ions of a specific mass (e.g., 87Rb and 87Sr) that enter the reaction cell and the second quadrupole separates the 87Rb from the reacted (mass-shifted) Sr (e.g., 87Sr16O; now m∕v 103, see Supplement Fig. S1 for a graphic illustration of this process).
Following the work of Zack and Hogmalm (2016) and Hogmalm et al. (2017) for assessing the most suitable reaction cell gases, several publications have attempted to solve geological problems using the in situ Rb–Sr technique (Şengün et al., 2019; Tillberg et al., 2017, 2020). All of these studies, except the one from Tillberg et al. (2020), identified only a single age population within individual samples, which could have been resolved (at higher precision) with solution Rb–Sr or 40Ar∕39Ar. Tillberg et al. (2020) observed multiple age populations in their samples, but these were from mineral separates and the textural context was not preserved. To date, no published study has taken full advantage of the spatial resolving power of the in situ Rb–Sr technique whilst retaining textural context.
Here, we analyzed (in thin sections) the in situ Rb–Sr ages of two mineral assemblages developed in distinctly different deformation microstructures in the Tropicana Zone of the Albany–Fraser Orogen, southwestern Australia. For Rb–Sr purposes, we date (i) biotite from both assemblages, (ii) apatite from both generations, (iii) phengite from assemblage 2 and (iv) muscovite from assemblage 2. Ultimately, this work demonstrates the use of coupled in situ Rb–Sr geochronology and microstructural analysis for identifying and resolving multiple geological events in individual samples.
2.1 Geological history of the Albany–Fraser Orogen
The Albany–Fraser Orogen is a Proterozoic orogenic belt that girdles ∼1200 km of the south and southeastern margins of the Archean Yilgarn Craton in Western Australia. This belt had a protracted Proterozoic history that included a series of extensional and compressional events at ca. 2720–2530, 1810–1650 and 1330–1140 Ma (Spaggiari et al., 2015). The Albany–Fraser Orogen comprises several lithotectonic domains, including the Northern Foreland, the Tropicana Zone, the Biranup Zone, the Nornalup Zone and the Fraser Zone (Fig. 1), and principally represents the reworked margin of the Archean Yilgarn Craton (Kirkland et al., 2011). Each zone comprises minor to dominant components of Archean heritage variably reworked by Paleoproterozoic and Mesoproterozoic tectonomagmatic events.
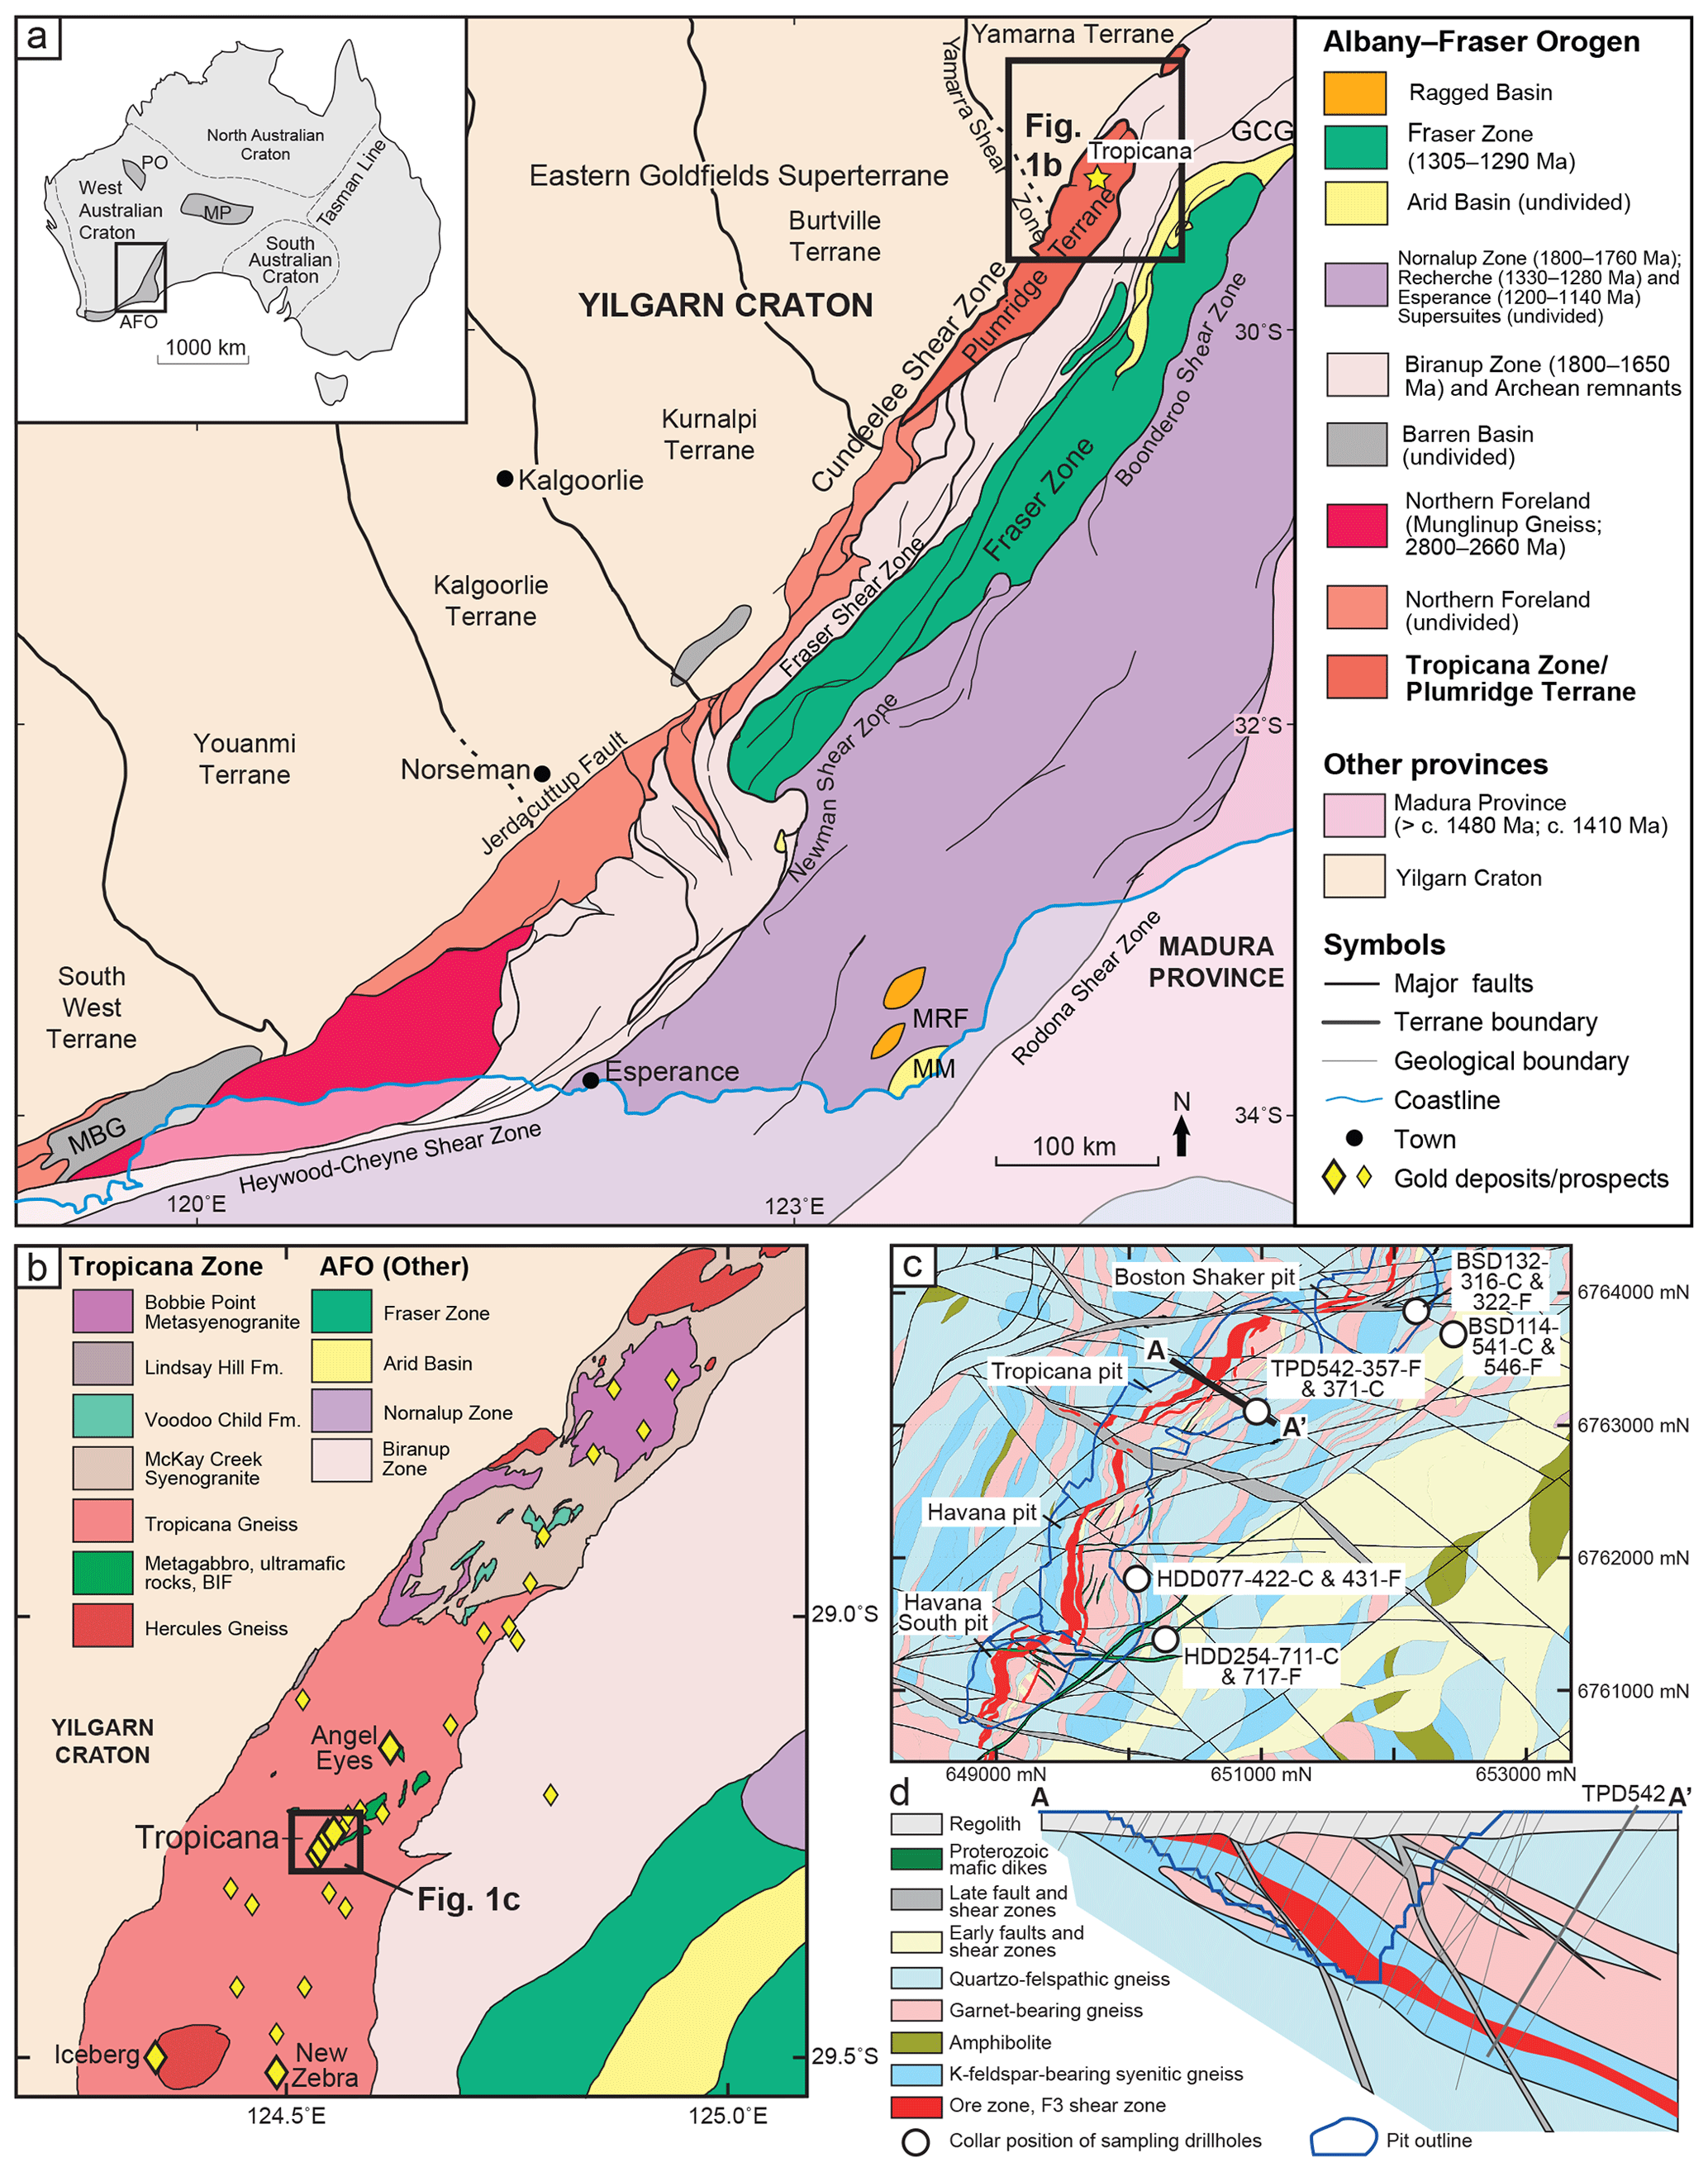
Figure 1(a) Simplified, pre-Mesozoic interpreted bedrock geology of the Albany–Fraser Orogen, modified from Spaggiari et al. (2015), Doyle et al. (2015) and Scibiorski et al. (2016). The abbreviations used in the figure are as follows: GCG – Gwynne Creek Gneiss, MBG – Mount Barren Group, MM – Malcolm Metamorphics and MRF – Mount Ragged Formation. (b) Interpreted basement map of the Tropicana Zone/Plumridge Terrane, modified from Kirkland et al. (2015). Gold deposits and prospects are shown from the Geological Survey of Western Australia MINEDEX database, with the studied locations labeled. (c) Interpreted basement map of the Tropicana gold mine from internal AngloGold Ashanti maps, showing the locations of the drill holes analyzed in this study. Note that the Tropicana and Havana pits have now joined. (d) Interpreted cross section across the ore-bearing and F3 shear zone of the Tropicana gold mine from AngloGold Ashanti, showing the locations of the drill holes (pale gray lines). All maps use GDA 1994 geodetic datum with (c) using the MGA zone 51 projection.
The earliest event in the belt at ca. 2720–2530 Ma was restricted to the Tropicana Zone (see Sect. 2.2) and was followed by magmatism from 1.81 to 1.65 Ga in the Tropicana, Biranup and Nornalup zones (Smithies et al., 2015). This earlier Paleoproterozoic magmatism is divided into three pulses: the Salmon Gums Event (1.81–1.80 Ga), the Ngadju Event (1.77–1.75 Ga) and the Biranup Orogeny (1.70–1.65 Ga; Kirkland et al., 2011; Spaggiari et al., 2015; Smithies et al., 2015). The tectonic setting in which this significant Paleoproterozoic magmatism occurred is not well constrained; however, it is generally interpreted to represent an extensional event (Spaggiari et al., 2015; Hartnady et al., 2019; Smits et al., 2014), with short-lived pulses of compression (i.e., Zanthus Event within the Biranup Orogeny; Kirkland et al., 2011; Smithies et al., 2015).
The majority of the magmatism in the Albany–Fraser Orogen occurred during arc accretion and subsequent reworking at 1330 and 1200 Ma, respectively (Spaggiari et al., 2015). The Albany–Fraser Orogen shares a heritage with Wilkes Land in East Antarctica, and these two orogenic belts were contiguous during the late Mesoproterozoic as a result of Rodinia assembly (Morrissey et al., 2017; Clark et al., 2000). Stage I of the Albany–Fraser Orogeny (1330–1260 Ma) was a widespread high-temperature, moderate- to high-pressure event accompanied by felsic and mafic magmatism (Clark et al., 2014). Stage I is generally interpreted as the collision between the Western Australian and Mawson cratons (Clark et al., 2000; Bodorkos and Clark, 2004). Stage II of the Albany–Fraser Orogeny is considered to reflect intracratonic orogenesis (Spaggiari et al., 2009, 2014, 2015). This stage is associated with craton-verging thrusting, high-temperature and moderate-pressure metamorphism, and mainly felsic magmatism at ca. 1225–1140 Ma (Dawson et al., 2003; Nelson et al., 1995). Mafic intrusions associated with Stage II are not known in the eastern Albany–Fraser Orogen but have recently been documented at 1134±9 (U–Pb zircon) and 1131±16 Ma (U–Pb baddeleyite) in the Bunger Hills, Wilkes Land (Stark et al., 2018).
2.2 Geological and mineralization history of the Tropicana Zone
The Tropicana Zone is located along the northeastern margin of the Yilgarn Craton (Fig. 1). Seismic sections across the Tropicana Zone reveal a northwest directed, imbricate thrust stack formed in a foreland setting by thrusting of the Tropicana Zone up along a major thrust surface known as the Plumridge Detachment (Occhipinti et al., 2014, 2018). This thrust transported the Tropicana Zone onto the Burtville and Yamarna terranes of the Yilgarn Craton (Occhipinti et al., 2018).
The Tropicana Zone includes the Tropicana gold mine and several prospects to the northeast and southwest (Fig. 1; Occhipinti et al., 2018; Spaggiari et al., 2014). A moderately foliated metagranite (Hercules Gneiss) sampled close to the Tropicana gold mine yielded a U–Pb age of 2722±15 Ma on oscillatory-zoned zircon cores interpreted to represent the magmatic crystallization age of the granite (Kirkland et al., 2015). A younger age of 2640±10 Ma on zircon rims from the same sample was interpreted as the age of a high-grade metamorphic overprint in the zone. In the Tropicana gold mine itself, a similar minimum age of crystallization (2638±4 Ma) was acquired from the syenitic lithofacies of the Tropicana Gneiss (Doyle et al., 2015). The Hercules Gneiss has broadly dioritic compositions and a very narrow range of low SiO2 (58.1–63.6 wt %) and is classified as a sanukitoid (Kirkland et al., 2015). Sanukitoid magmas, usually produced from metasomatized mantle in an arc setting (Martin et al., 2005), are known for gold fertility and are interpreted as a likely source of gold in the Tropicana Zone, although the gold may have been remobilized on several occasions (Kirkland et al., 2015). Sanukitoid intrusions commenced at 2692±16 Ma near the start of prolonged mid-amphibolite to lower-granulite facies metamorphism in the Tropicana Zone that persisted until ca. 2530 Ma (Kirkland et al., 2015; Doyle et al., 2015). Kirkland et al. (2015) interpreted the characteristic high-grade metamorphic textures and grain shapes of zircon as evidence of a prolonged period of granulite facies metamorphism (Atlantis Event) that formed many of the gneisses in the Tropicana Zone. Structural and isotopic data imply that the Tropicana Zone was held at a deep-crustal level during much of the Neoarchean (Tyler et al., 2015; Occhipinti et al., 2018).
Exhumation and retrogression to greenschist facies metamorphic conditions associated with folding and development of thrust shear zones occurred at ca. 2530 Ma (Blenkinsop and Doyle, 2014; Doyle et al., 2015). Thrusting onto the Yilgarn Craton is thought to have led to the ingress of fluids and Au mineralization at ca. 2530 Ma (Occhipinti et al., 2018; Doyle et al., 2015). The age of ca. 2530 Ma from the Tropicana gold mine is constrained from a biotite 40Ar∕39Ar age of 2531±14 Ma, recalculated using the decay constant of Renne et al. (2011) and an imprecise pyrite rhenium–osmium (Re–Os) age of ca. 2505±50 Ma. Additionally, a tungsten-rich rutile population exsolved from a coarse-grained biotite yielded dates between 2539±22 and 2479±10 Ma, overdispersed for a single population (Doyle et al., 2015). There is evidence from the work of Doyle et al. (2015) for subsequent resetting of geochronometers. Although Doyle et al. (2015) advocates for a 2521±5 Ma age for rutile formation, it is more likely that this represents partial resetting. Similarly, pyrite Pb–Pb results show scatter between ca. 2500 and 1800 Ma, disturbed 40Ar∕39Ar spectra show a range of individual steps between ca. 2.0 and 1.8 Ga, and U–Pb zircon and monazite ages show partial loss of Pb towards Mesoproterozoic ages but with poorly constrained lower intercepts (ca. 1.3–1.1 Ga). Whether these dates represent distinct events at ca. 2.4, 1.8 and/or 1.3–1.1 Ga, or are a continuum of dates towards younger ages remains unknown.
The sampling strategy for the Tropicana gold mine followed that of Blenkinsop and Doyle (2014), focusing on the Au-mineralized D3 shear zone. There is a natural strain gradient from undeformed syenitic gneiss host rock to transient low-strain and up to high-strain zones. A total of 10 samples were selected from diamond drill cores (photos in Supplement Fig. S2) from three main pits in the Tropicana gold mine (Table 1, Figs. 1, 2). All samples are perthitic K-feldspar-dominated rocks with minor biotite and quartz, deformed at low strains to a brittle–ductile microstructure at greenschist facies conditions. Additional phases include albitized plagioclase, biotite, phengite, quartz, calcite/dolomite, pyrite, zircon and monazite (Supplement Fig. S2).
Table 1List of samples dated in this study. Rb–Sr phases indicate the minerals that were dated in each sample, with 1 and 2 corresponding to assemblage 1 and 2, respectively. Eastings, northings and reduced level (RL) are in GDA 1994, MGA zone 51 projection for the drill hole collar.
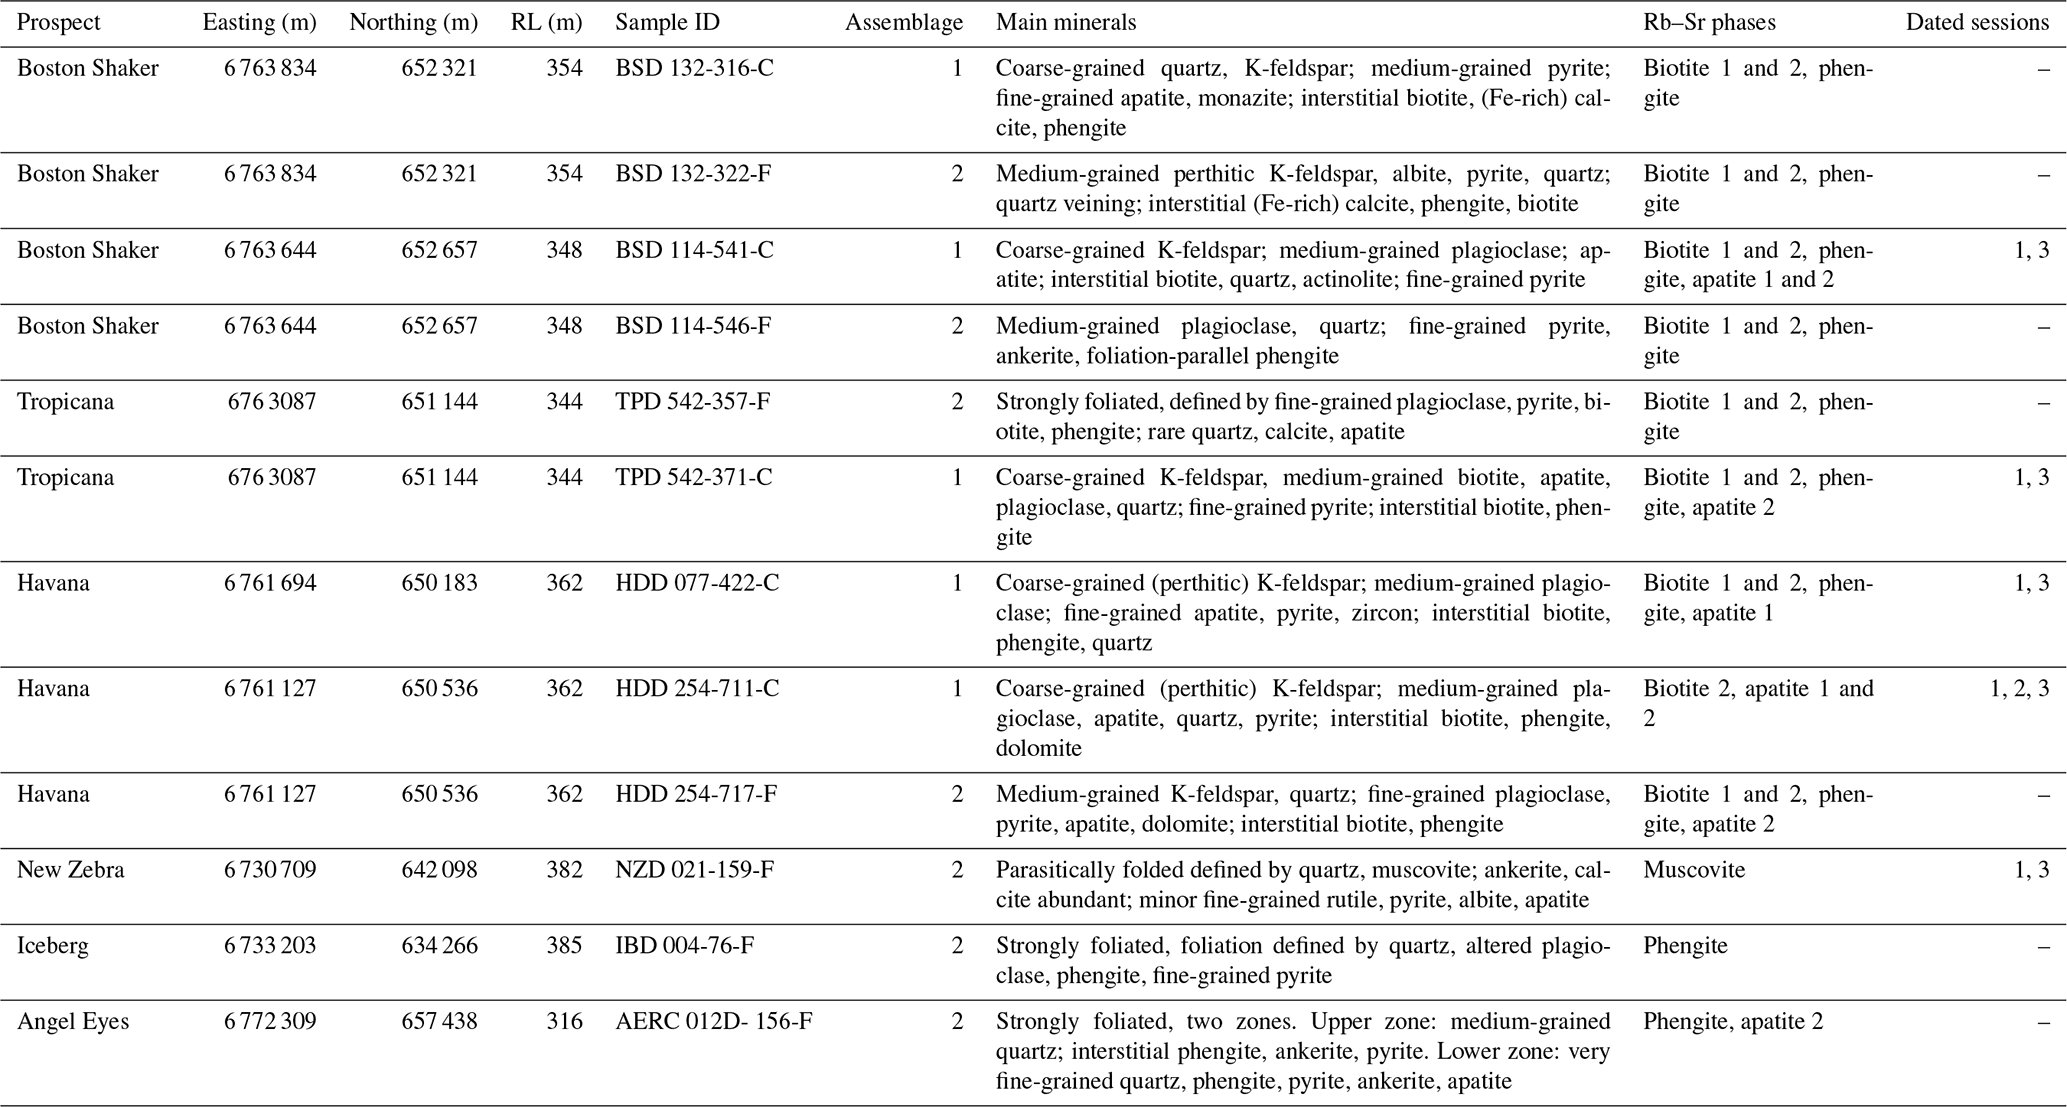
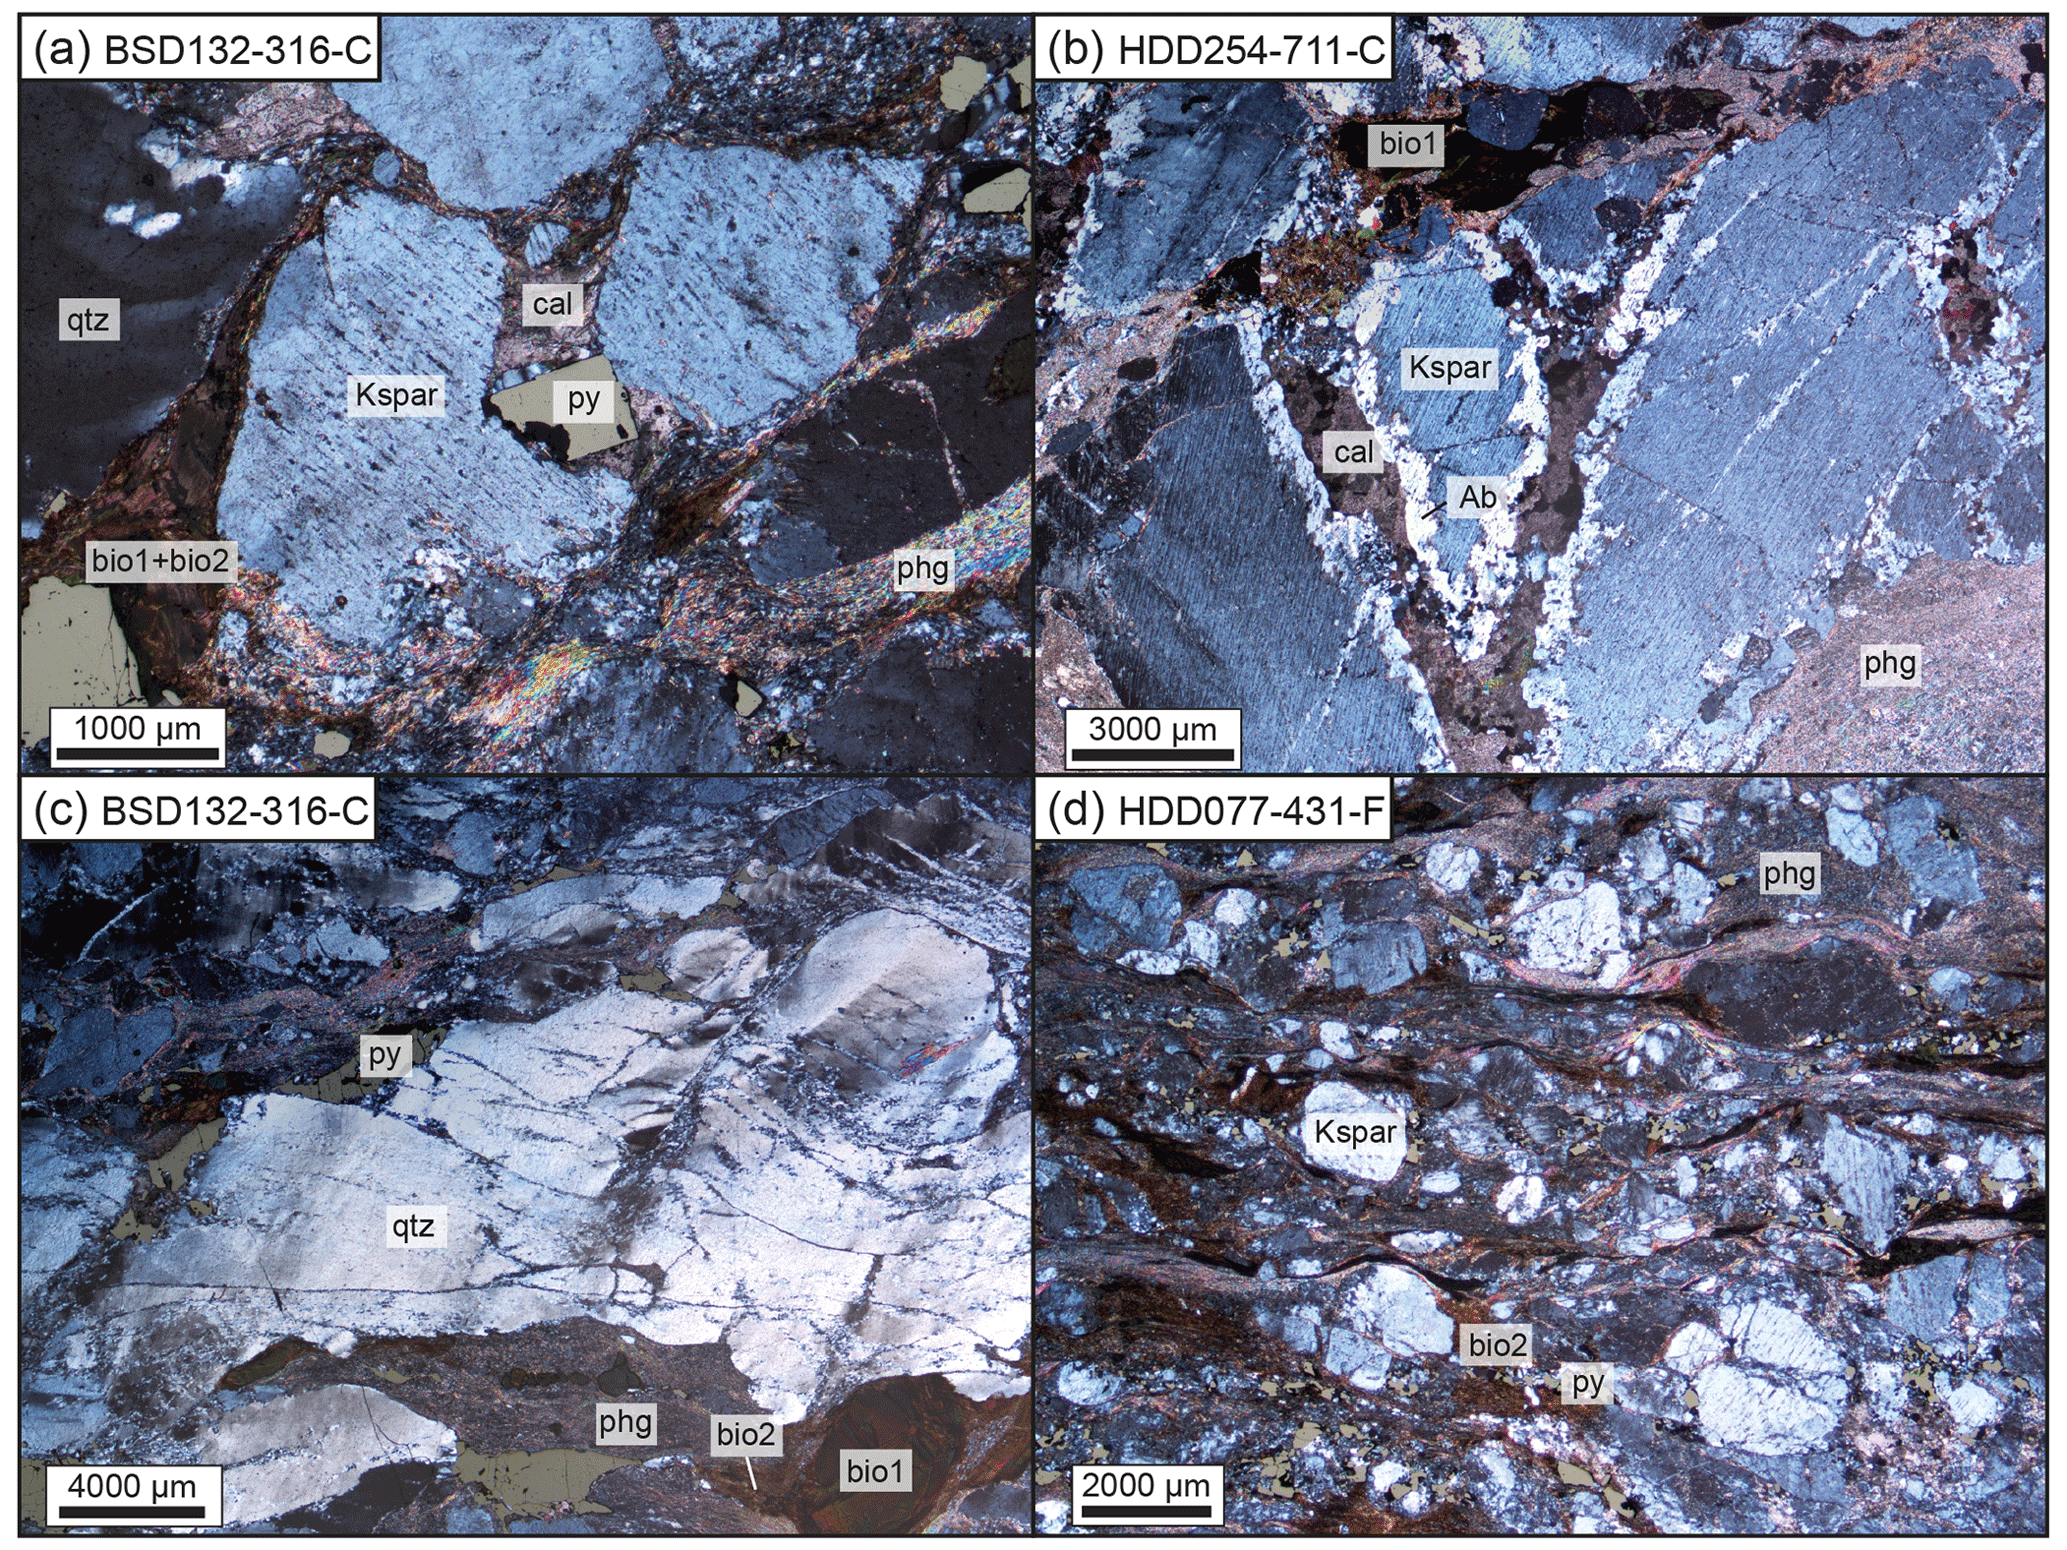
Figure 2Dual transmitted and reflected light, cross-polarized photomicrographs showing the characteristic low-strain (a–c) and high-strain (d) microstructures and mineral relationships of studied samples. (a) Sample BSD132-316-C shows fractured perthitic feldspar (Kspar) from assemblage 1 in the center with calcite (cal), phengite (phg), pyrite (py) and quartz (qtz) from assemblage 2 filling the fracture. Quartz and biotite 1 (bio1) show the formation of sub-grains (biotite 2; bio2). (b) In sample HDD254-711-C, a carbonate (calcite) from assemblage 2 fills shear fractures that crosscut perthitic feldspar from assemblage 1. Reaction rims along fractures show the breakdown of perthite to albite (Ab). (c) Sample BSD132-316-C shows brittle–ductile deformation of large quartz and biotite 1 (bottom right) grains and precipitation of pyrite in strain shadows. (d) Sample HDD077-431-F shows porphyroclasts of perthitic feldspar within a mylonitic matrix consisting of biotite 2, quartz, carbonate, pyrite and sericite.
Three samples were selected from satellite prospects proximal to the Tropicana gold mine and within the Tropicana Zone: one from the New Zebra, Iceberg and Angel Eyes prospects, respectively (Table 1, Figs. 1, 2). The sample from the New Zebra prospect displays parasitic folding defined by muscovite and quartz (Table 1, Supplement Fig. S2). The Iceberg and Angel Eyes samples are both strongly foliated, with foliation defined by quartz, phengite with or without altered plagioclase (Table 1, Supplement Fig. S2).
A subset of 4 of the 10 samples from the Tropicana gold mine were selected for in situ Rb–Sr geochronology (Table 1, Figs. 1, 2). From the satellite prospects, the sample from the New Zebra prospect was selected.
4.1 Thin section preparation and imaging
Standard polished thin sections prepared at Minerex Services, Esperance, Western Australia, were imaged in plane- and cross-polarized, transmitted light on an ZEISS Axio Imager 2 optical microscope at the School of Earth and Planetary Sciences, Curtin University.
Thin sections were subsequently carbon coated and analyzed using a TESCAN integrated mineral analyzer (TIMA) at the John de Laeter Centre (JdLC) at Curtin University to aid in mineral identification. TIMA (a field emission gun-scanning electron microscope) is equipped with four electron dispersive X-ray spectrometers (EDSs), which are capable of recording 420 000 X-ray counts per second. Thin sections were analyzed in “dot-mapping” mode with a rectangular mesh at a step size of 3 µm for backscattered electron (BSE) imaging. One thousand EDS counts are collected every ninth step (i.e., 27 µm) or when the BSE contrast changes (i.e., a change in mineral phase). For a given mineral grain, EDS counts are integrated across the entire grain. TIMA analyses used an accelerating voltage of 25 kV, a beam intensity of 19, a probe current of 6.74–7.01 nA, a spot size of 67–90 nm and a nominal working distance of 15 mm. The EDS spectra are standardized using a measurement of a pure Mn standard. After imaging and EDS collection, BSE signals and EDS peaks are referenced to a mineral library for automatic mineral classification. Representative BSE spectra for each mineral phase in each of the dated samples are available in Supplement Table S2.
After in situ Rb–Sr analysis, selected regions were imaged via backscattered electron (BSE) using a TESCAN Vega3 and Mira3 FEG-SEM, both at the JdLC, using working distances of 11–15 mm, a beam intensity of 12–14 and an accelerating voltage of 20 kV. Selected spot analyses were made on these BSE images using EDS to evaluate the chemistry of mineral phases.
Full thin section photomicrographs and TIMA images of each sample are given in Supplement Fig. S2.
4.2 In situ Rb–Sr geochronology
In situ Rb–Sr data were collected on sample thin sections in the GeoHistory Facility, JdLC, Curtin University, across three sessions. For all sessions, a RESOlution LR 193 nm ArF excimer laser with a Laurin Technic S155 sample cell was used. Laser settings comprised a beam diameter of 87 µm (session 1) or 64 µm (sessions 2–3), an on-sample energy of 2.5 J cm−2, a repetition rate of 5 Hz, 60 s of analysis time and 30 s of on-peak background acquisition with the laser off. All analyses were preceded by two cleaning pulses. Laser fluence was calibrated each day using a handheld energy meter, and subsequent analyses were performed in constant fluence mode. The Laurin Technic S155 sample cell was flushed with ultrahigh-purity He (320 mL min−1) with added N2 (1.2 mL min−1), both of which were passed through an inline Hg trap. High-purity Ar was used as the ICP-MS carrier gas (flow rate ∼1 L min−1).
Rb–Sr data were collected on an Agilent 8900 triple quadrupole mass spectrometer in MS/MS mode (see Supplement Table S1 for all relevant tuning and acquisition parameters) using N2O reaction gas following the pioneering work of Cheng et al. (2008) and Hogmalm et al. (2017). Each analytical session consisted of first tuning gas flows and ICP-MS ion lenses in single-quad mode for sensitivity and a flat mass response curve, followed by adjustment for robust plasma conditions, including , and on NIST610 glass (Kent et al., 2004). The mass spectrometer was then set to MS/MS mode, and N2O was added (∼0.25 mL min−1; not calibrated) to the reaction cell. The reaction cell was flushed with N2O for several hours before sample analysis to ensure signal stability. NIST610 was used to tune N2O to maximize intensity at mass 104 (88Sr16O), while maintaining <7 cps at mass 101 (85Rb16O). Finally, pulse-analog (P∕A) conversion factors for 88Sr16O (as 104Pd) and 87,85Rb were determined in single-quad mode on NIST610 reference glass and pressed powder tablets of phlogopite Mica-Mg, respectively (Govindaraju, 1979; Kröner et al., 1996; Morteani et al., 2013; Hogmalm et al., 2017), by varying the laser spot sizes and/or the laser repetition rate to yield ∼2 Mcps per analyte.
We designed the analytical protocol to stay below the P/A conversion thresholds for Rb and Sr by reducing the ablation spot size, the laser repetition rate, and/or the laser energy. Maximizing count rates for 87,86Sr implied that 88Sr was not available for mass bias correction. Thus, we followed the approach of Hogmalm et al. (2017) to calibrate 87Sr∕86Sr directly against NIST610 (; Woodhead and Hergt, 2001) to calculate 87Rb∕86Sr from certified values at 2.390±0.005 (Woodhead and Hergt, 2001). In order to check for matrix sensitivity of measured Sr isotopic compositions using this approach, we interspersed a megacrystic plagioclase (MIR a) and a modern shark tooth (apatite) with the samples as external standards. The measured results for plagioclase (; 2SE; n=15) and shark tooth apatite (87Sr∕86Sr ; 2SE; n=15) are in excellent agreement with the published Sr isotopic compositions of 0.70310±0.00007 (plagioclase MIR a; Rankenburg et al., 2004) and modern marine seawater 87Sr∕86Sr of 0.709174±0.000003 (McArthur et al., 2006), respectively, and attest to the validity of our analytical protocol. Our measured 87Sr∕86Sr for mica-Mg calibrated against NIST610 over the course of this study was 1.8692±0.0022 (2SE, n=28), and we used this value along with a crystallization age of 519.4±6.5 Ma (2σ) and initial 87Sr∕86Sr of 0.72607±0.00070 (Hogmalm et al., 2017) to calculate a mean 87Rb∕86Sr for mica-Mg of 156.9±2.3, with all errors propagated in quadrature.
Whereas all Rb–Sr isotopic analyses were initially normalized and drift corrected with factors determined from NIST610, an additional matrix correction to 87Rb∕86Sr was only applied to biotite analyses, with uncertainties on Mica-Mg and the unknown analyses propagated in quadrature. These corrections were also applied to phengite and muscovite, although with the caveat that Mica-Mg may not be a concentration-matched standard for these minerals. Because calculated ages from sample biotite mainly depend on accurate determination of the Rb–Sr fractionation factor, a secondary mica standard of known age is highly desirable. To this end, analyses of unknowns were additionally bracketed with in-house biotite reference material CK001B (422±6 Ma; Kirkland et al., 2007; Daly et al., 1991). Sample CK001B was collected by Daly et al. (1991) but not dated precisely. Sample CK009 was collected <50 km from CK001B, had similar biotite chemistry to CK001 and experienced equivalent Caledonian metamorphism (Kirkland et al., 2007). Biotite in sample CK009 is classified as magnesian siderophyllite according to a mgli–feal diagram (see Fig. 6 in Kirkland et al., 2007). The age of sample CK009 was determined from amphibole, whole-rock and biotite Rb–Sr solution analyses, yielding an age of 422±6 Ma (n=5, mean square of weighted deviates, MSWD, =0.57, p=0.68), recalculated using the decay constant of Villa et al. (2015) and an initial 87Sr∕86Sr ratio of 0.7108±0.0001 (Kirkland et al., 2007). Repeated analytical results from sessions 1–3 on adjacent spots show no systematic variation in Rb–Sr age (see Supplement Fig. S3). During analytical sessions 1, 2 and 3, sample CK001B yielded biotite ages of 413±4 Ma (n=38, MSWD =1.2, p=0.18), 414±5 Ma (n=38, MSWD =0.99, p=0.49) and 429±8 Ma (n=46, MSWD =0.28, p=1.00), respectively (Supplement Fig. S3). All three sessions yielded a combined age of 416±3 Ma (n=122, MSWD =0.99, p=0.52) with an initial 87Sr∕86Sr of 0.714±0.009 (Supplement Fig. S3). All of the ages and initial ratios overlap with the published values (Kirkland et al., 2007) within 2σ uncertainty.
A small round-robin analytical run consisting of ∼20 standards preceded analytical runs to monitor long-term stability and overall data integrity. Data were reduced in Iolite (Paton et al., 2011) and in-house Excel macros. Analyses that crosscut multiple minerals or mineral generations at depth were excluded. Rb–Sr isochrons and ages were computed using Isoplot 4.15 (Ludwig, 2012), with the decay constant after Villa et al. (2015). All uncertainties presented in the text are presented at 95 % confidence. Full isotopic data for the samples and reference materials are given in Supplement Table S3.
5.1 Microstructure and mineral paragenesis from the Tropicana gold mine
In the 10 samples from the Tropicana gold mine, two mineral assemblages are identified and linked to two distinct microstructures (Figs. 2, 3). Mineral assemblage 1 comprises perthitic K-feldspar, plagioclase, quartz, euhedral biotite 1 (first generation), apatite 1 (first generation), zircon, monazite and Au-bearing pyrite 1 (first generation). Both Au-bearing pyrite and apatite 1 occur as inclusions in K-feldspar (Fig. 3a, e). Very fine (<1 µm) exsolution lamellae of rutile and/or titanite within coarse-grained biotite 1 were observed in samples from the Tropicana and Havana pits (Fig. 4c, d, e, f, g, h), but these were absent from biotite 1 in the Boston Shaker pit (Fig. 4a, b). The presence of fine-grained Ti-bearing minerals is also supported by semiquantitative EDS chemistry, which shows significantly higher Ti in the Tropicana and Havana pits compared with the Boston Shaker pit (Fig. 5a). In other chemical aspects, biotite 1 in the Boston Shaker pit is slightly more Mg-rich than biotite from the other two pits, straddling the phlogopite–biotite boundary (Fig. 5b). The coarse-grained microstructure and associated mineral assemblage 1 is rarely preserved in the ore zone due to the low-temperature and high-strain shearing (Fig. 2a, b, c). However, main rock-forming minerals are preserved either in low-strain domains or as porphyroclasts within mylonites (Fig. 2a, b, c).
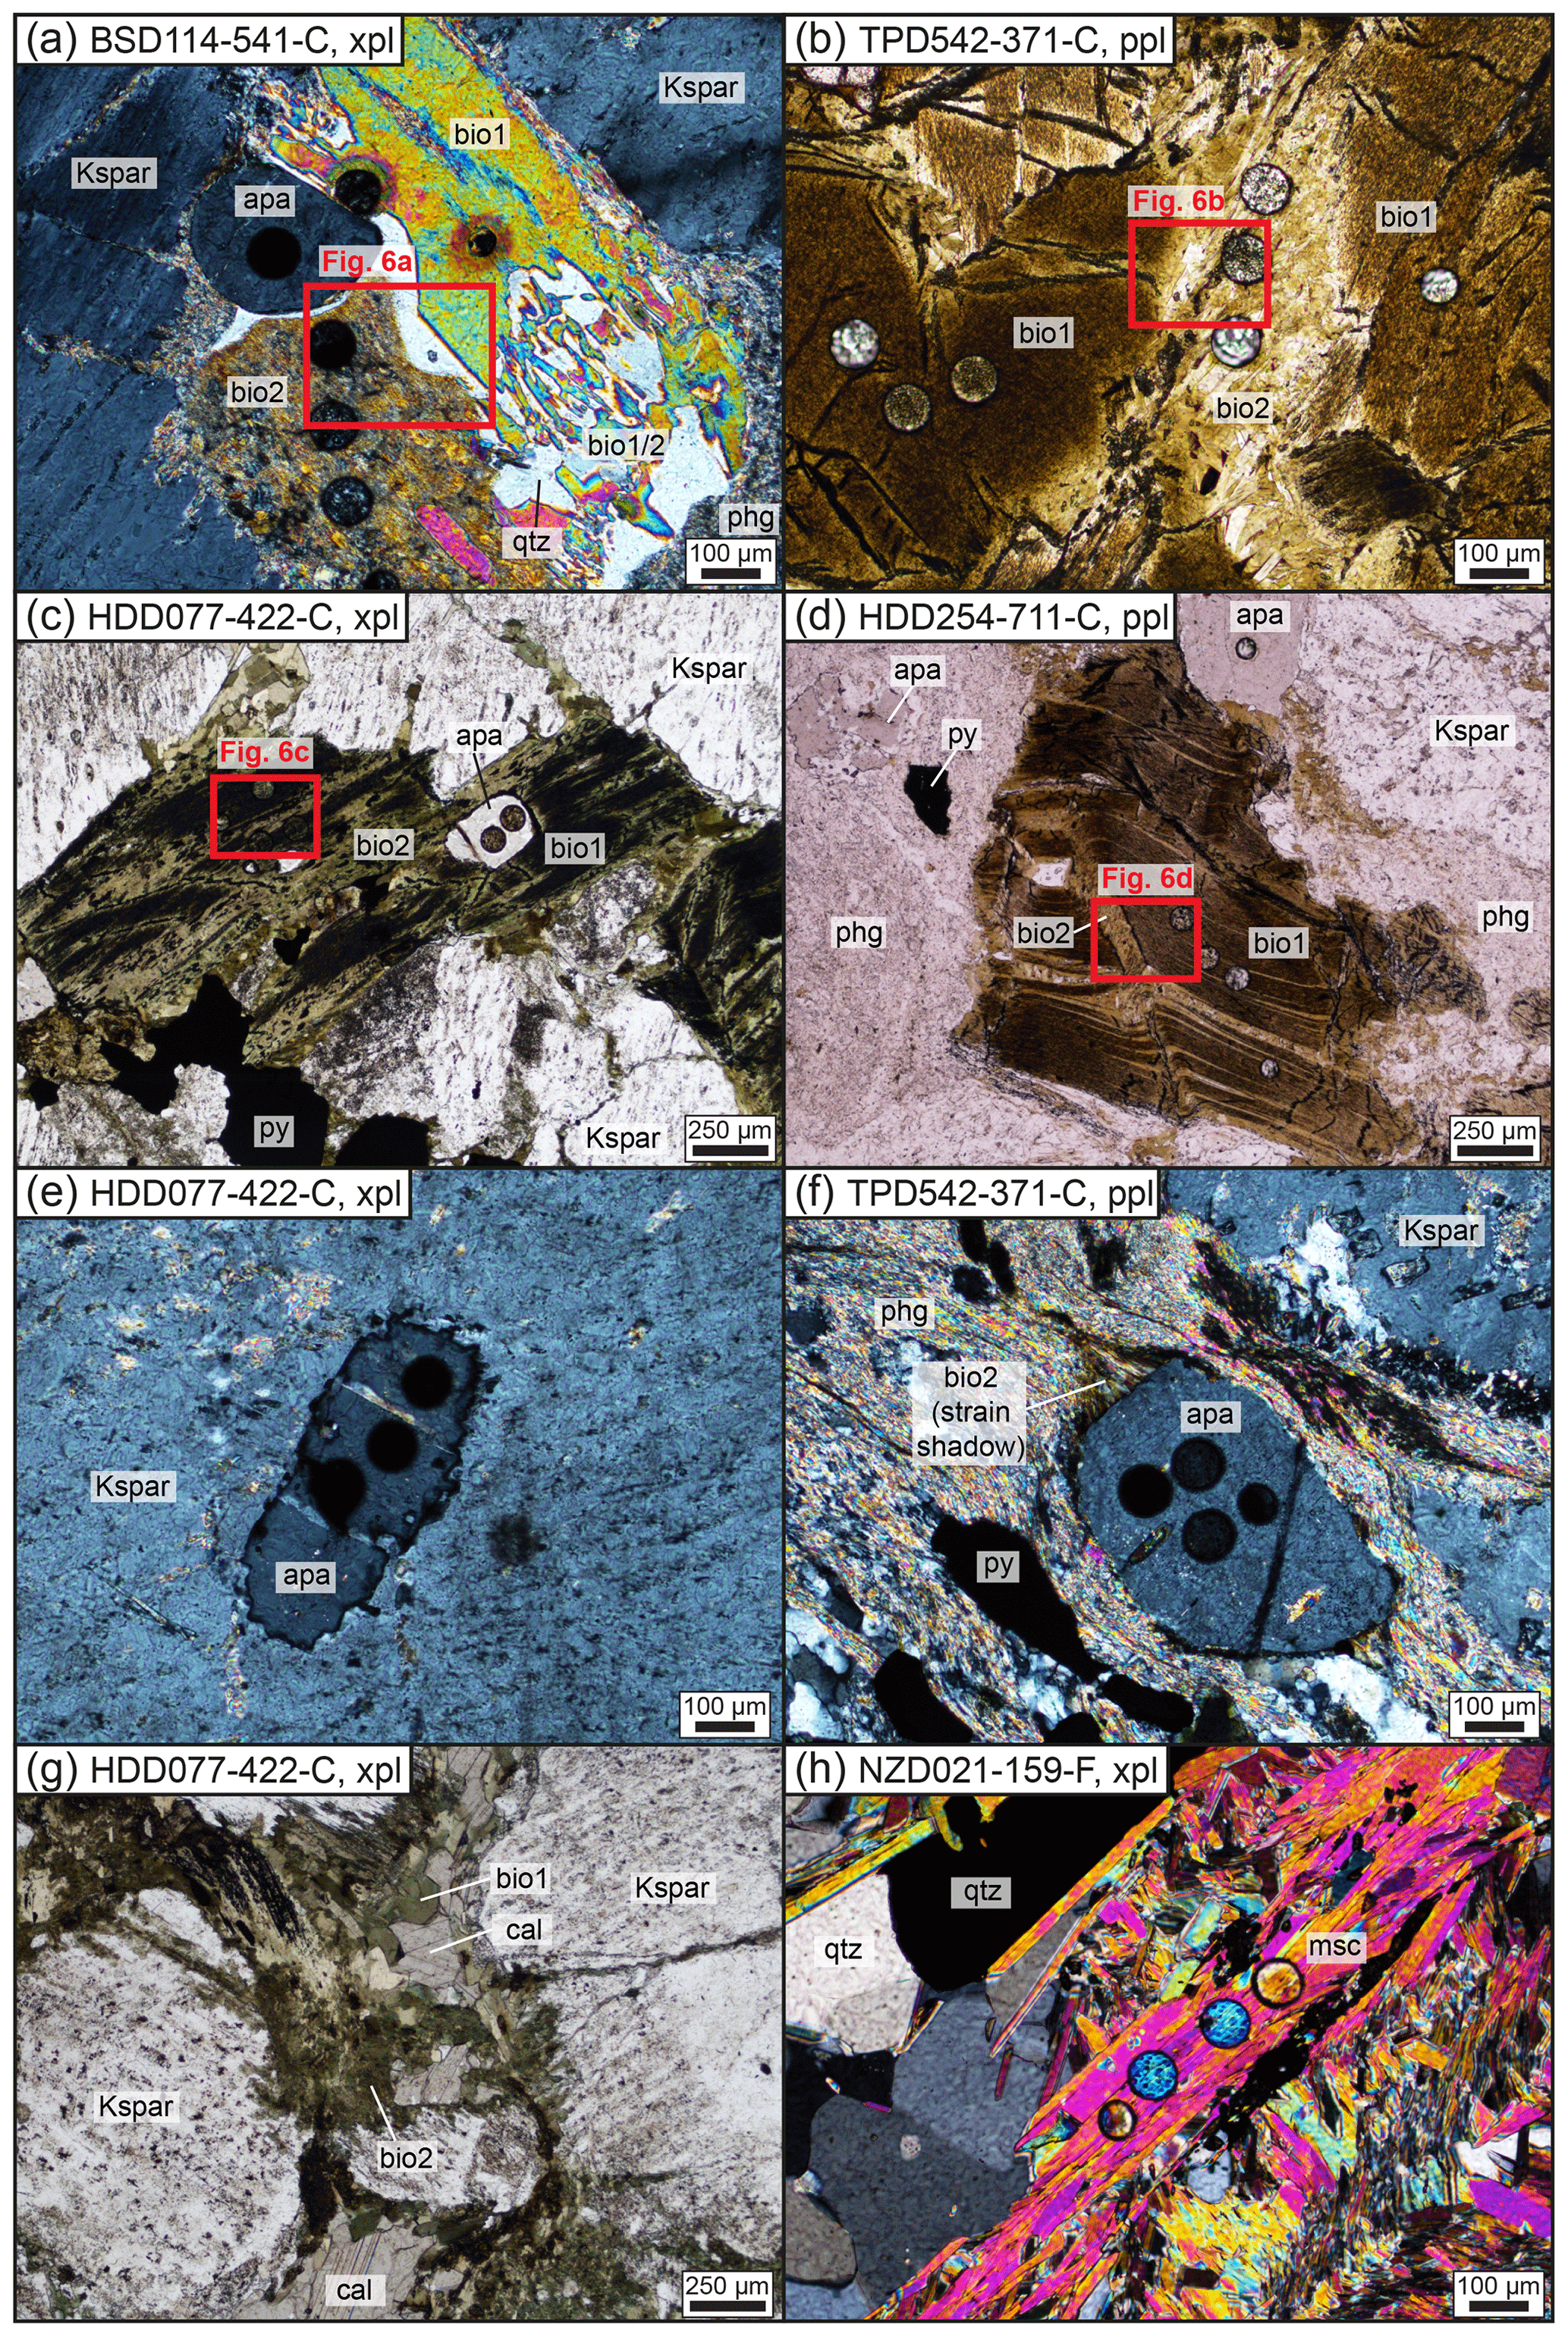
Figure 3Thin section photomicrographs in transmitted light showing detailed mineral relationships. (a) Biotite in various stages of recrystallization, from euhedral biotite 1 to partly recrystallized biotite 1 and 2 to fully recrystallized biotite 2, from BSD114-541-C. Note the association of unstrained quartz with recrystallization. (b) Recrystallized biotite 2 corridor between biotite 1 in TPD542-371-C. (c) Biotite 1 variably recrystallized to biotite 2, and associated with pyrite and apatite, all interstitial to K-feldspar phenocrysts from HDD077-422-C. (d) Biotite 2 recrystallized subparallel to the axial plane of folded biotite 1, situated in association with phengite and interstitial to K-feldspar phenocrysts, from HDD254-711-C. (e) Apatite (possibly magmatic and/or associated with assemblage 1) fully enclosed in K-feldspar phenocryst from HDD077-422-C. (f) Apatite (2) porphyroclast with rare strain shadow of biotite 2 and phengite, implying locally biotite 2> apatite > phengite, from TPD542-371-C. Also note the close association of pyrite. (g) Carbonate ingress with recrystallization of biotite 1 to biotite 2, interstitial to K-feldspar from HDD077-422-C. (h) Euhedral muscovite in association with quartz, from NZD021-159-F. The abbreviations used in the figure are as follows: apa – apatite; bio1 – euhedral, first generation biotite; bio1/2 – partly recrystallized biotite 1; bio2 – recrystallized biotite 1; cal – calcite; Kspar – K-feldspar; msc – muscovite; phg – phengite; py – pyrite; qtz – quartz; ppl – plane-polarized; xpl – cross-polarized. Circular holes are laser ablation pits of 87 or 64 µm diameters.
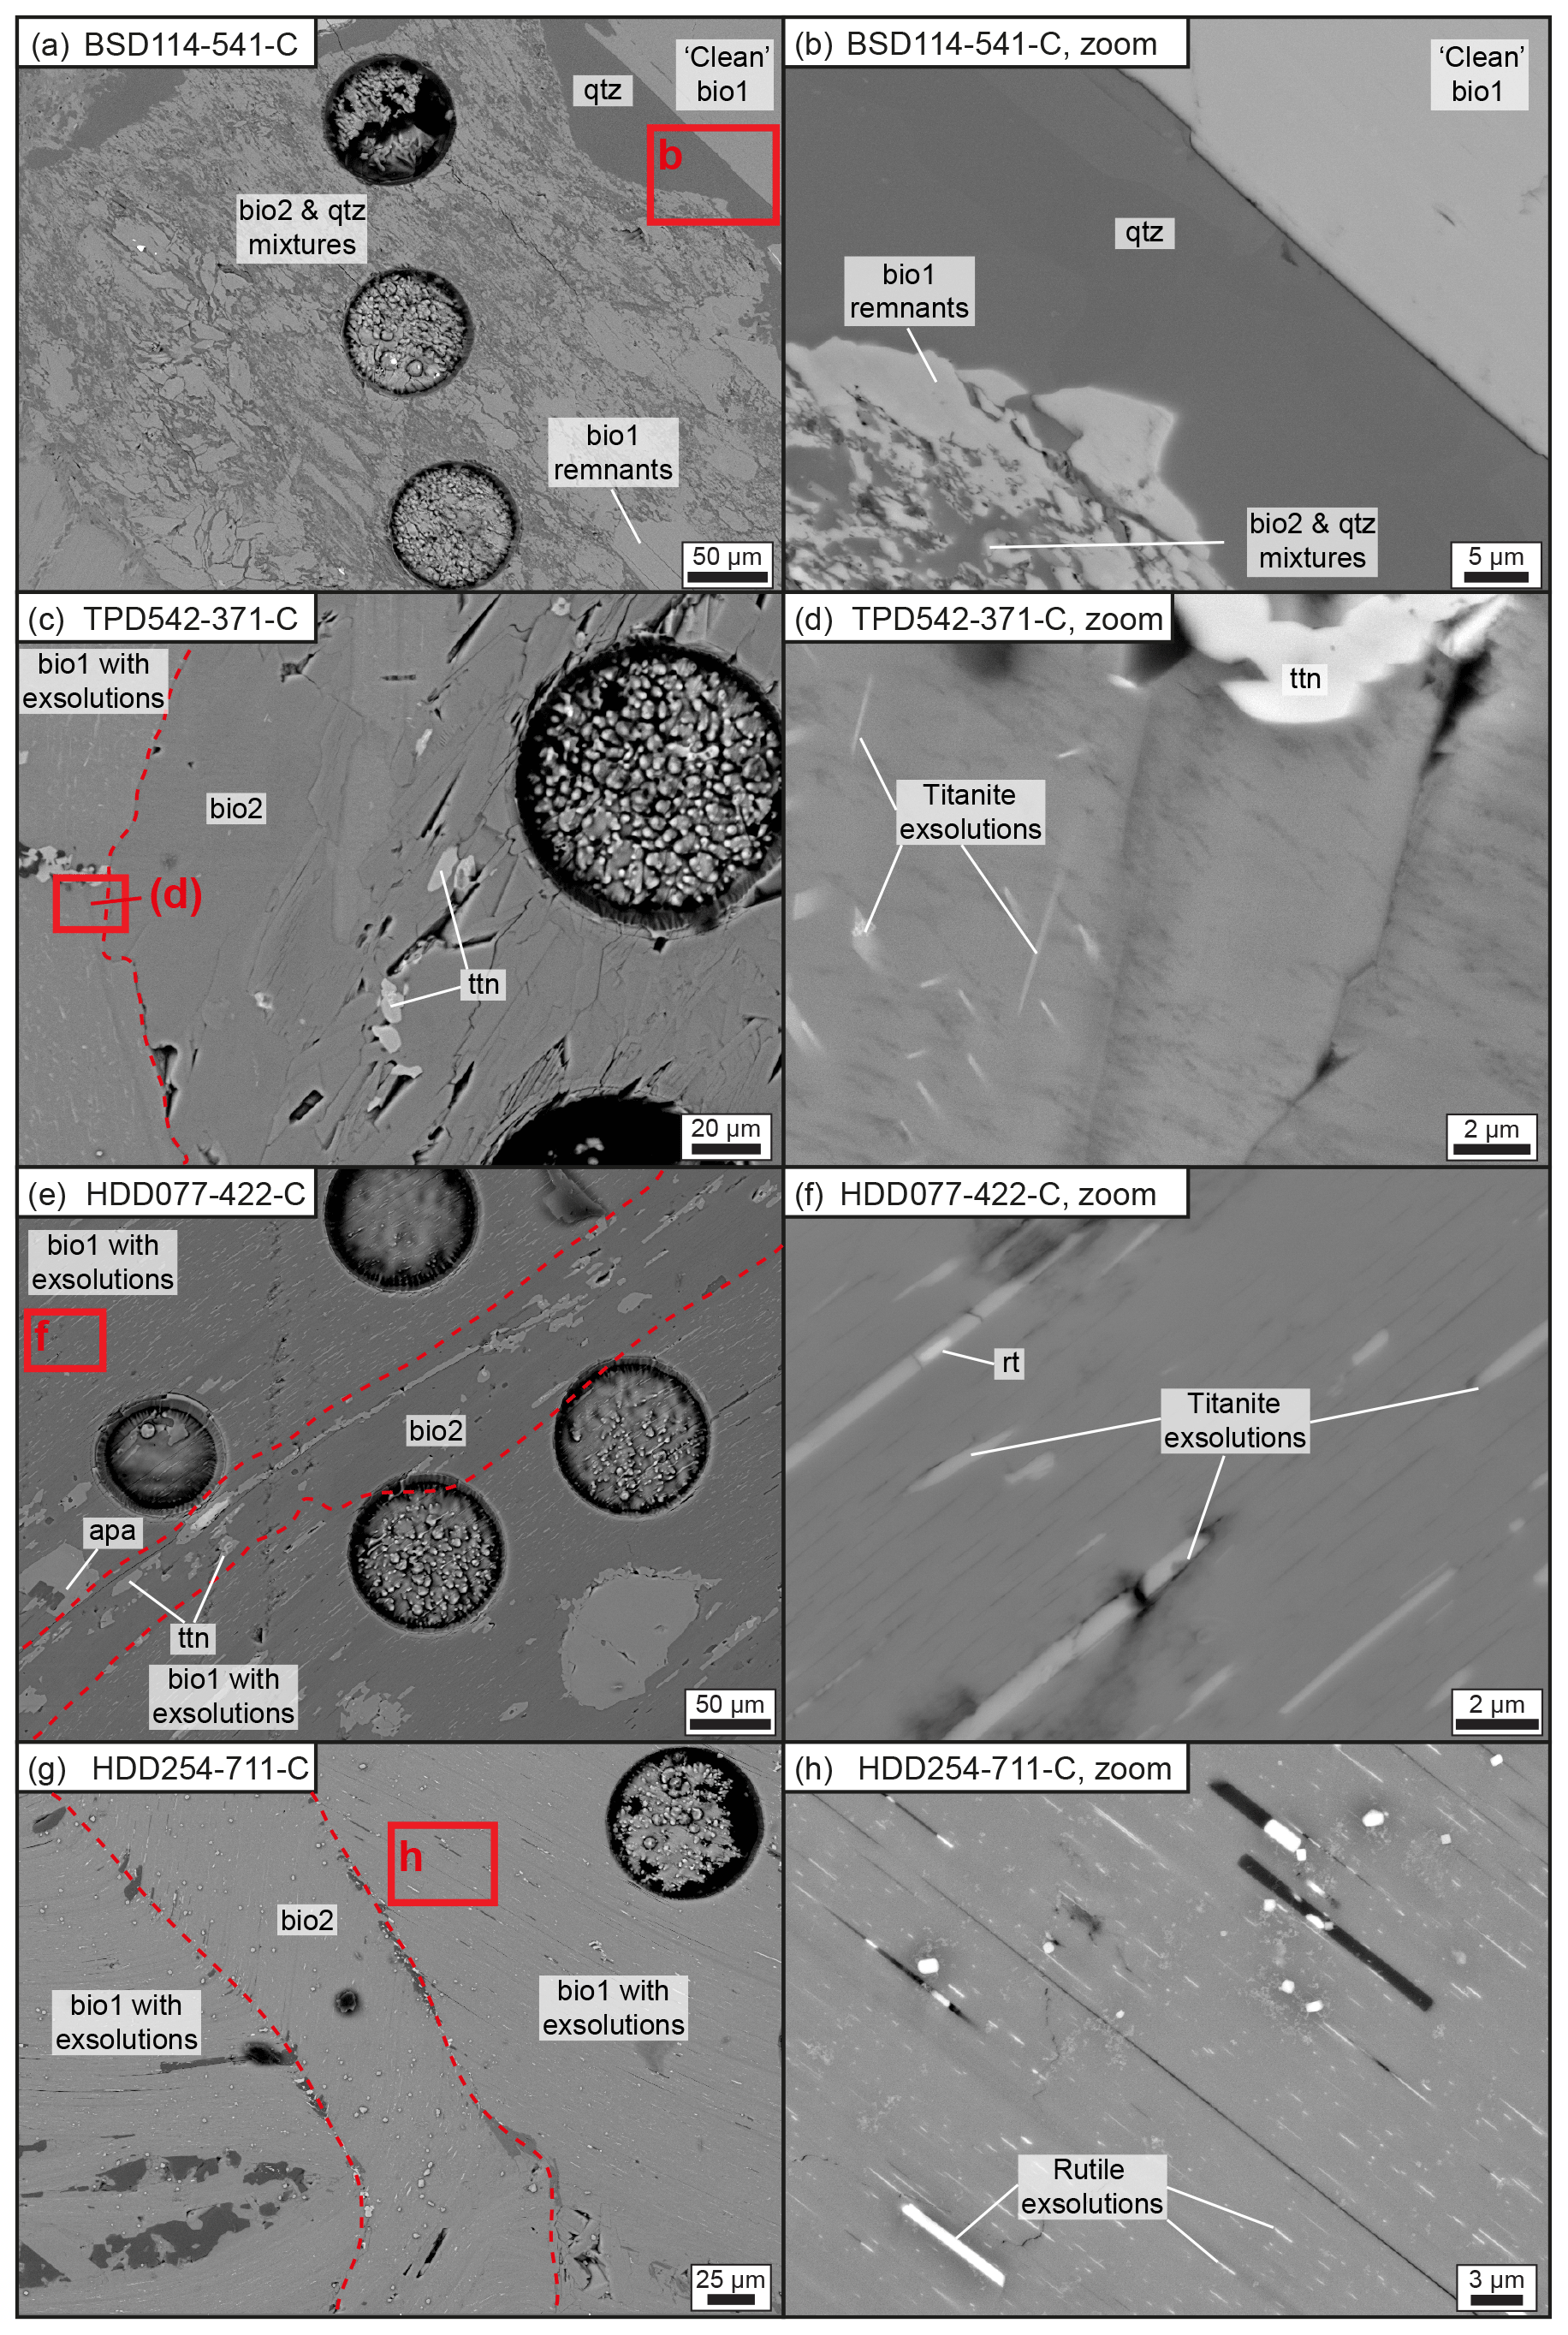
Figure 4Backscattered electron images of zoomed-in regions from Fig. 3 showing first and second generations of biotite (bio1 and bio2, respectively). Circular holes are laser ablation analyses. (a, b) In BSD114-541-C from the Boston Shaker pit, biotite 1 is free of microscale inclusions, whereas biotite 2 shows mixtures of biotite and quartz (qtz). (c, d) In TPD542-371-C from the Tropicana pit, biotite 1 shows thin exsolution lamellae of titanite (ttn). Biotite 2 contains larger (2–5 µm) inclusions of titanite. (e, f) In HDD077-422-C from the Havana pit, biotite 1 has titanite ± rutile (rt) exsolution lamellae and biotite 2 contains larger grains of titanite (up to 50 µm). (g, h) In HDD254-711-C from the Havana pit, both biotite 1 and 2 show thin rutile exsolution lamellae, with biotite 2 occasionally showing slightly larger (up to 2 µm) rutile grains.
The fine-grained microstructure and associated mineral assemblage 2 is related to localized brittle to brittle–ductile strain, overprinting assemblage 1 (Blenkinsop and Doyle, 2014). The brittle strain affects perthite to form a so-called crackle breccia (D3 of Blenkinsop and Doyle, 2014). The brittle–ductile strain reworked quartz and biotite to form transitional microstructures between jigsaw puzzle breccia and core-and-mantle microstructure (Fig. 2c), while plagioclase broke down to a sericite mesh (Fig. 2a, b, c). Dynamic recrystallization was accompanied by the ingress of hydrothermal fluids that precipitated carbonates, pyrite and microcrystalline phengite (Fig. 2a, b, c) and breaks down perthite to albite along fractures (Fig. 2b). This microcrystalline phengite is chemically different to the euhedral muscovite found in the satellite deposits (Fig. 5c). The low-strain microstructure represents the main target for our in situ dating of an early biotite 1 and dynamically recrystallized biotite 2 (Fig. 3a, b, c, d). Biotite 2 tends to have less Ti (Fig. 5a) and more Mg and Al than biotite 1 (Fig. 5b). In the high-strain zone, sericite forms interconnected matrix to porphyroclasts of perthite, quartz and biotite (Fig. 2d; D4 after Blenkinsop and Doyle, 2014). A potential second generation of apatite (apatite 2) is also found interstitially along with assemblage 2 minerals (Fig. 3f).
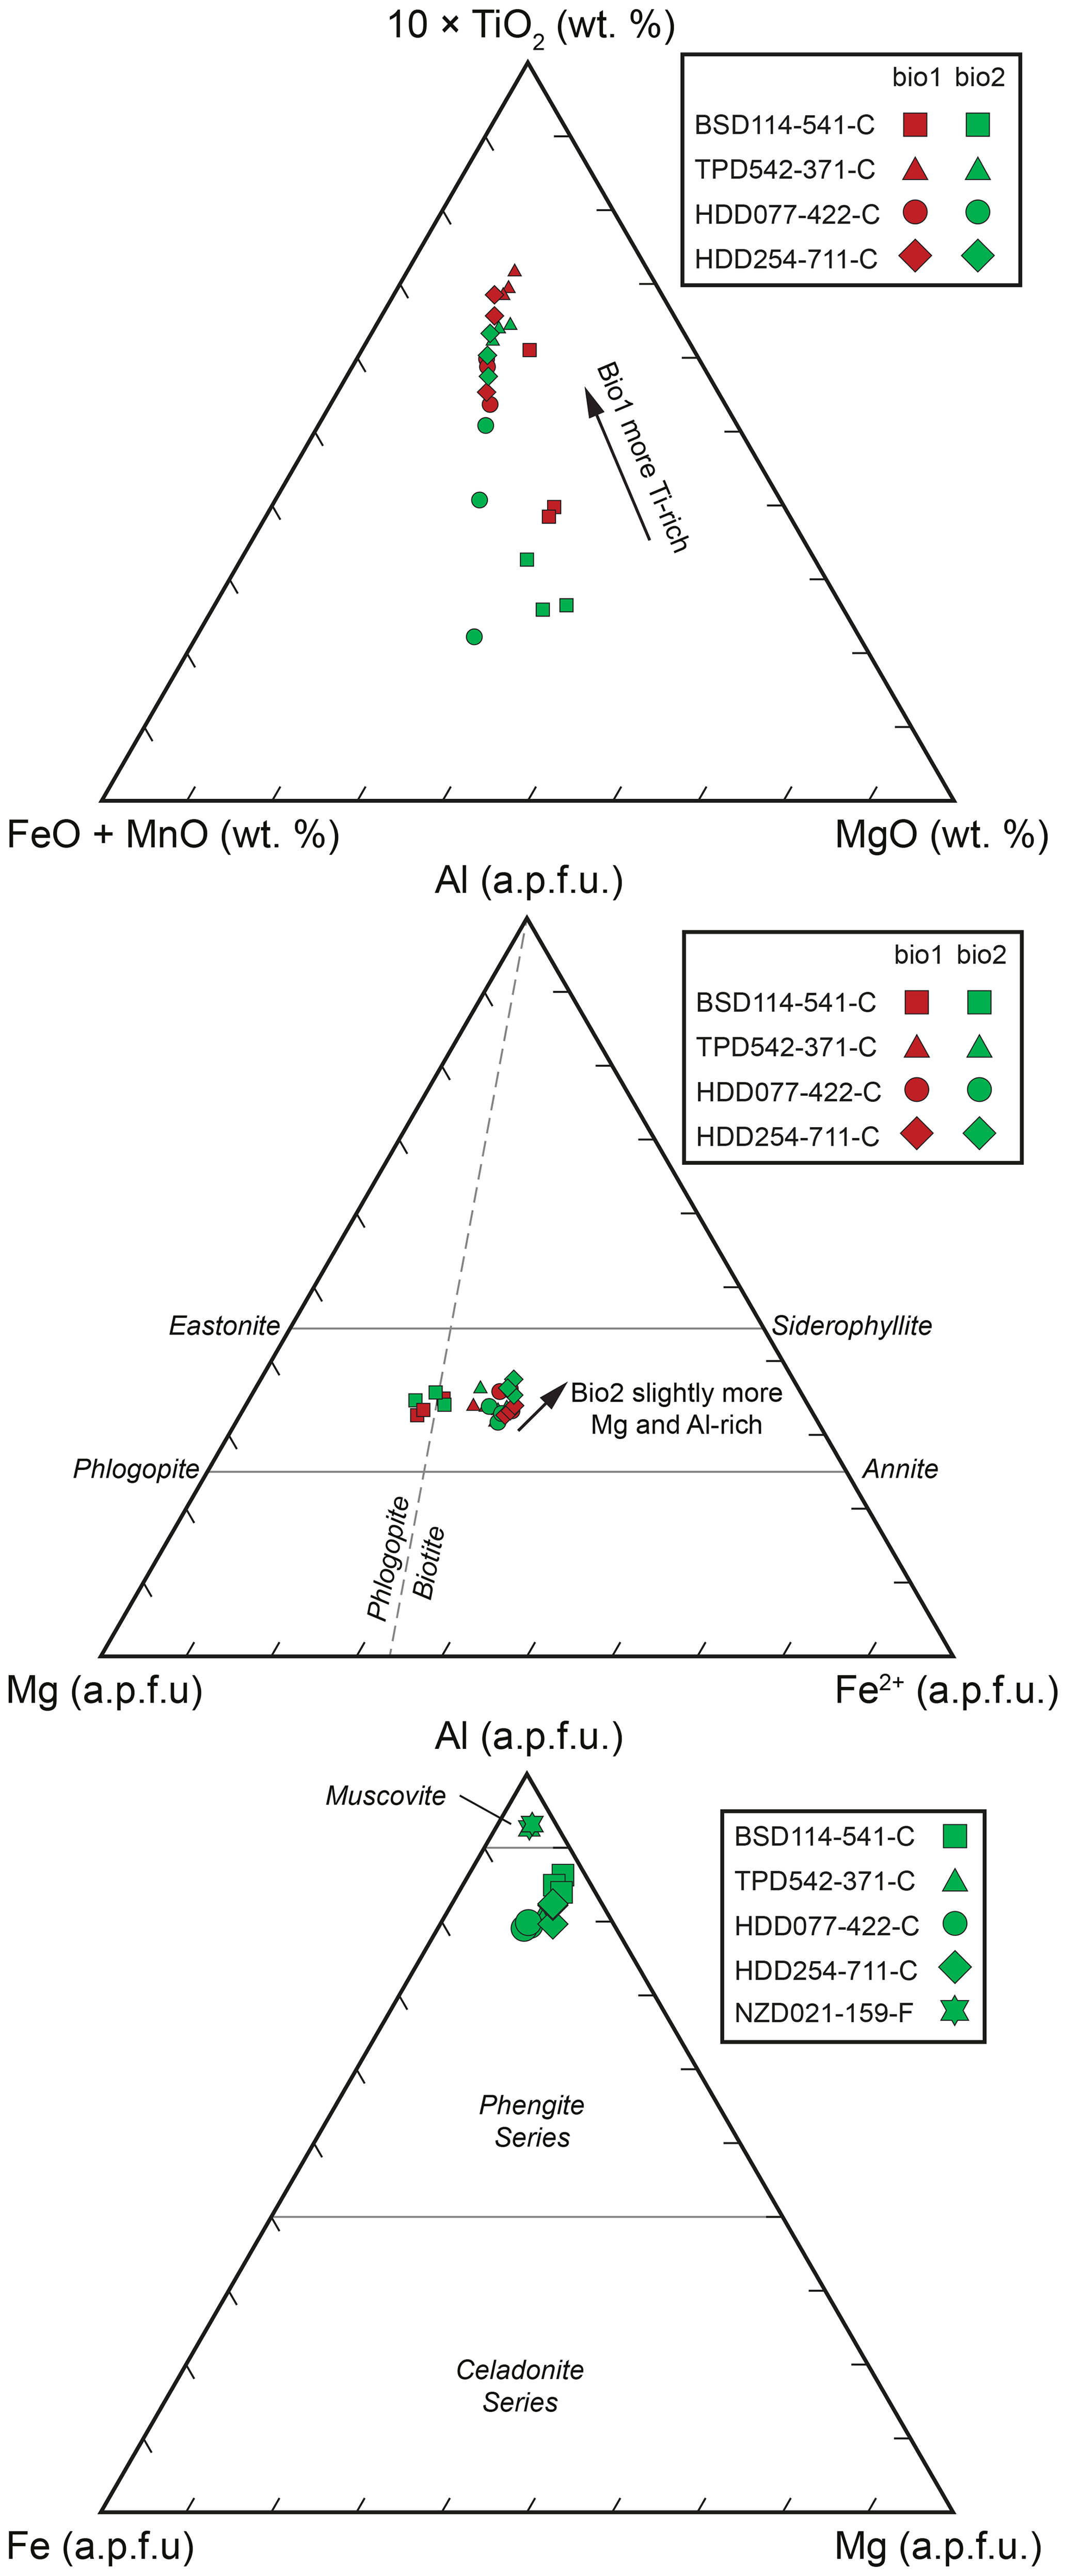
Figure 5Mica chemistry and classifications for (a) trioctahedral mica (phlogopite–biotite series), showing elevated Ti concentrations in biotite 1, (b) trioctahedral micas (phlogopite–biotite series), and (c) dioctahedral micas (white mica series). Three representative analyses were taken for each phase. Note that data were obtained using standardized electron dispersive X-ray spectrometer (EDS) data associated with TIMA analyses, so these data should be treated as semiquantitative only. EDS data may be found in Supplement Table S2. Note that a mgli–feal diagram after Tischendorf et al. (1997) for biotite was not used due to the extraneous presence of exsolved Ti minerals.
5.2 In situ Rb–Sr geochronological data
5.2.1 Biotite
Biotite was analyzed from all dated samples from the Tropicana gold mine (Table 1). According to the mineral paragenesis, biotite was subdivided into two texturally distinct subpopulations: (i) large, subhedral to euhedral grains associated with assemblage 1 and (ii) recrystallized, fine-grained crystals associated with assemblage 2 (Fig. 3).
The older component – texturally part of assemblage 1 – does not define a single population and has relatively low 87Rb∕86Sr (8–620, mean =171) compared with assemblage 2 biotite (Fig. 6). Assuming initial 87Sr∕86Sr ratios of 0.7045–0.7058 (as defined by apatite, see below), the variable Rb–Sr ratios yield broadly linear trends with dates between ca. 2400 and 1500 Ma for the four samples (Fig. 6). However, significant variation is observed in all samples. The analyses with the oldest dates (on average) are from samples with the limited presence of recrystallized biotite 2 and where biotite 1 did not show any exsolution lamellae (Fig. 4a, b). Conversely, samples with younger dates have a more significant proportion of biotite 2 and biotite 1 shows exsolution lamellae of rutile and/or titanite (Fig. 4c, d, e, f, g, h). Sample HDD077-422-C, with the youngest apparent biotite 1 dates (Fig. 6c), also has the highest proportion of exsolved Ti-bearing minerals in biotite 1 (Fig. 4e, f).

Figure 6Biotite Rb–Sr isochrons for individual samples, with red data corresponding to assemblage 1 and green data corresponding to assemblage 2 biotite. Gray data are considered to be part of assemblage 1 but with loss of radiogenic Sr. In samples where only disturbed biotite 1 exists, only a minimum age can be estimated based on a broad isochron through the oldest analyses. All error ellipses are plotted at 2σ. The 2530 Ma model age is based off Fig. 4a, assuming an initial 87Sr∕86Sr of 0.7045. Note that ages are calculated both solely with biotite 2 and with biotite 2 and apatite combined for assemblage 2 (see Sects. 3 and 6).
Spot profiles across two large biotite 1 grains were performed to ascertain if there was systematic age variation from core to rim (Fig. 7). The transects show that there is no significant variation in model ages observed across the large grains, with the exception of some younger dates towards the very edges or where fractures were intersected with minor recrystallized biotite 2 (Fig. 7h, i).
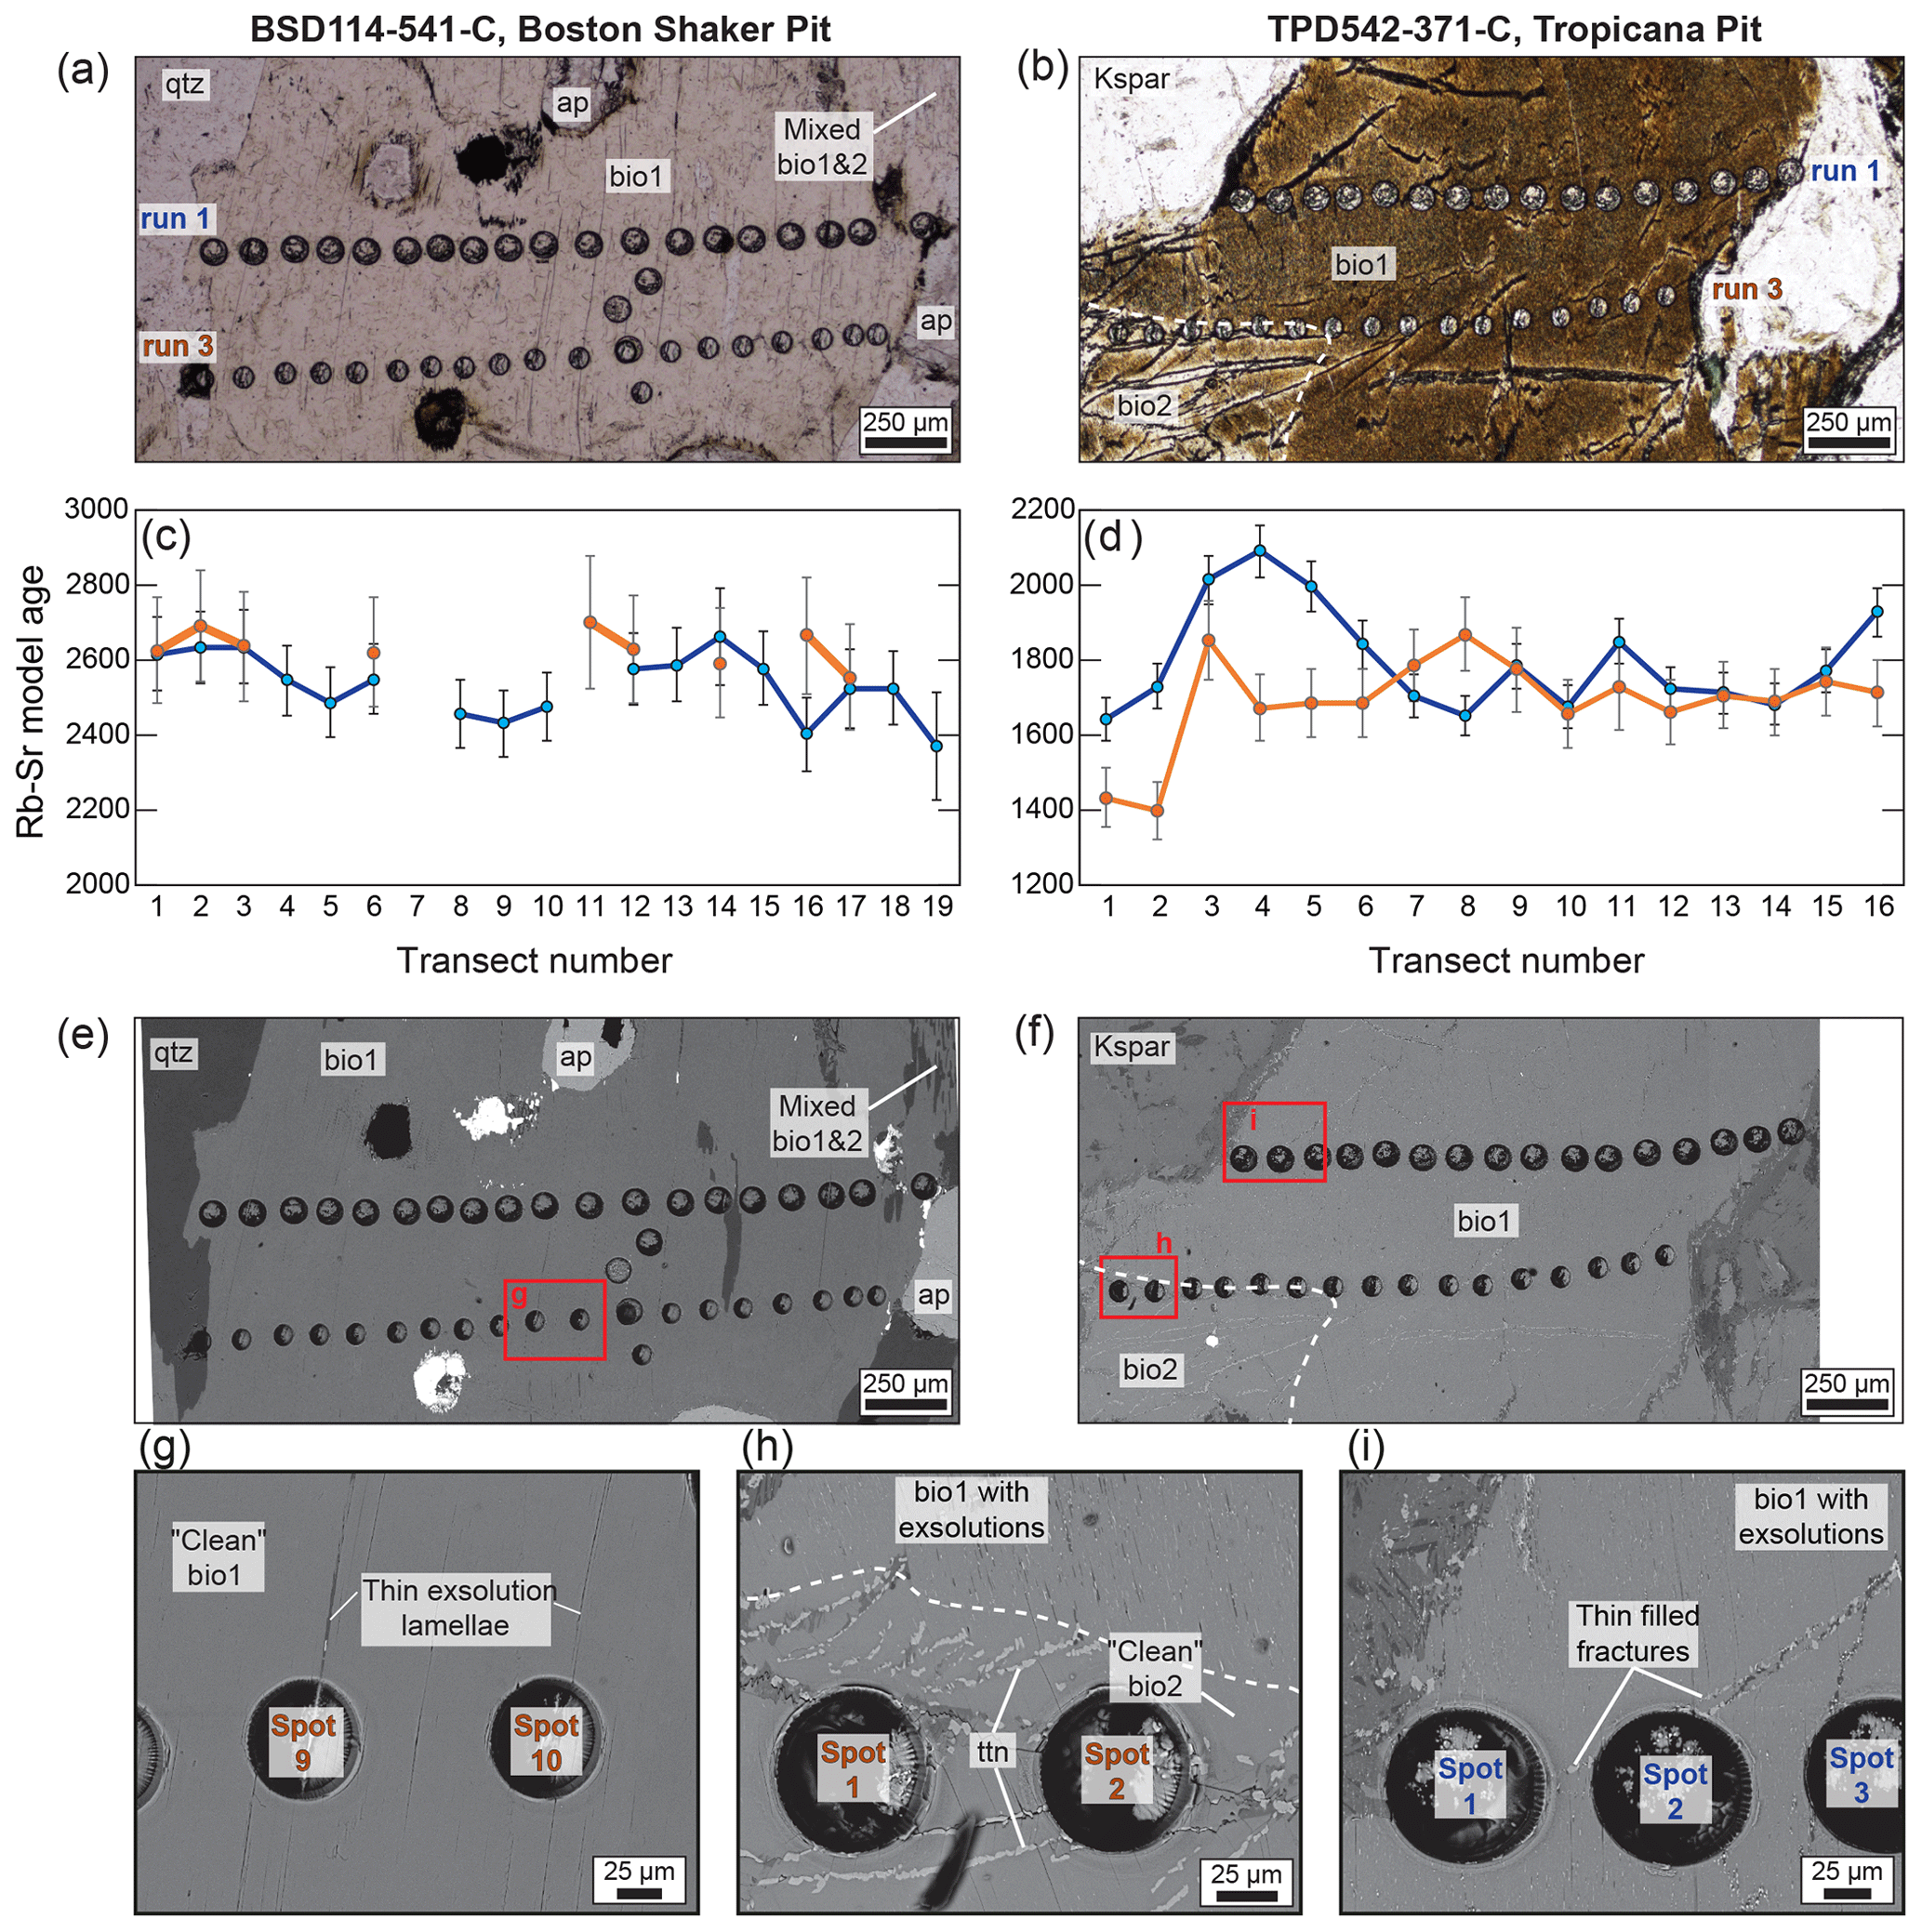
Figure 7Transects across two large, euhedral biotite grains. (a, b) Transmitted, plane-polarized photomicrographs of part of the euhedral grains, showing 87 µm (run 1) and 64 µm (run 3) laser ablation pits along the grains. (c, d) Rb–Sr model ages for each spot in the transect across two runs. Model ages were computed using 87Sr∕86Sr of apatite 1 in the corresponding sample (see Fig. 9). (e, f) Backscattered electron images of the same regions as (a) and (b). (g) Zoomed-in region showing inclusion-free biotite 1 in BSD114-541-C, similar to Fig. 4a and b. (h–i) Zoomed-in regions showing exsolution lamellae and fractures (commonly titanite-filled), with these fracture zones contributing to yielding younger Rb–Sr model ages. Spot numbers and colors refer back to panels (c) and (d). The abbreviations used in the figure are as follows: ap – apatite; bio1 – euhedral, first generation biotite; bio2 – recrystallized biotite 1; Kspar – K-feldspar; qtz – quartz
Analyses from the second phase of biotite (biotite 2) yielded statistically valid isochrons in every sample and showed a wider range of 87Rb∕86Sr ratios (up to 950, mean =210, Fig. 6). Ages computed from Rb–Sr isochrons are 1165±140, 1227±100, 1211±19 and 1208±36 Ma for the four respective samples from the Tropicana gold mine (p>0.05 in all cases, Fig. 6). For three of the samples where a putative second generation of apatite may be coeval with biotite 2 (see Sect. 5.1), it is possible to compute an isochron with both apatite and biotite 2. Combined apatite and biotite 2 yields isochrons of 1222±37, 1241±33 and 1205±15 Ma (p>0.05 in all cases, Fig. 6) but with ages that overlap in uncertainty if apatite is not used in the calculation. There is no systematic variation in ages between samples or between Tropicana gold mine pits.
5.2.2 Phengite
Microcrystalline phengite was analyzed from three of the four samples from the Tropicana gold mine. Phengite, associated with assemblage 2 in the Tropicana gold mine, yielded single, linear Rb–Sr trends with low to moderate 87Rb∕86Sr values (0.2–32, mean =13; Fig. 8). Sample TPD542-371-C yielded a statistically reliable but imprecise age of 1212±98 Ma (n=6, MSWD =1.3, p=0.28, Fig. 8b). The two other samples, both from the Havana pit, yielded broadly linear trends with respective age estimates of ca. 1220 and 1280 Ma but with overdispersion for a single population (MSWD =3.5–3.7, p<0.05; Fig. 8c, d). Notwithstanding the data scatter, on a given sample, the phengite age estimates are similar to those obtained via biotite Rb–Sr (cf. Fig. 6).
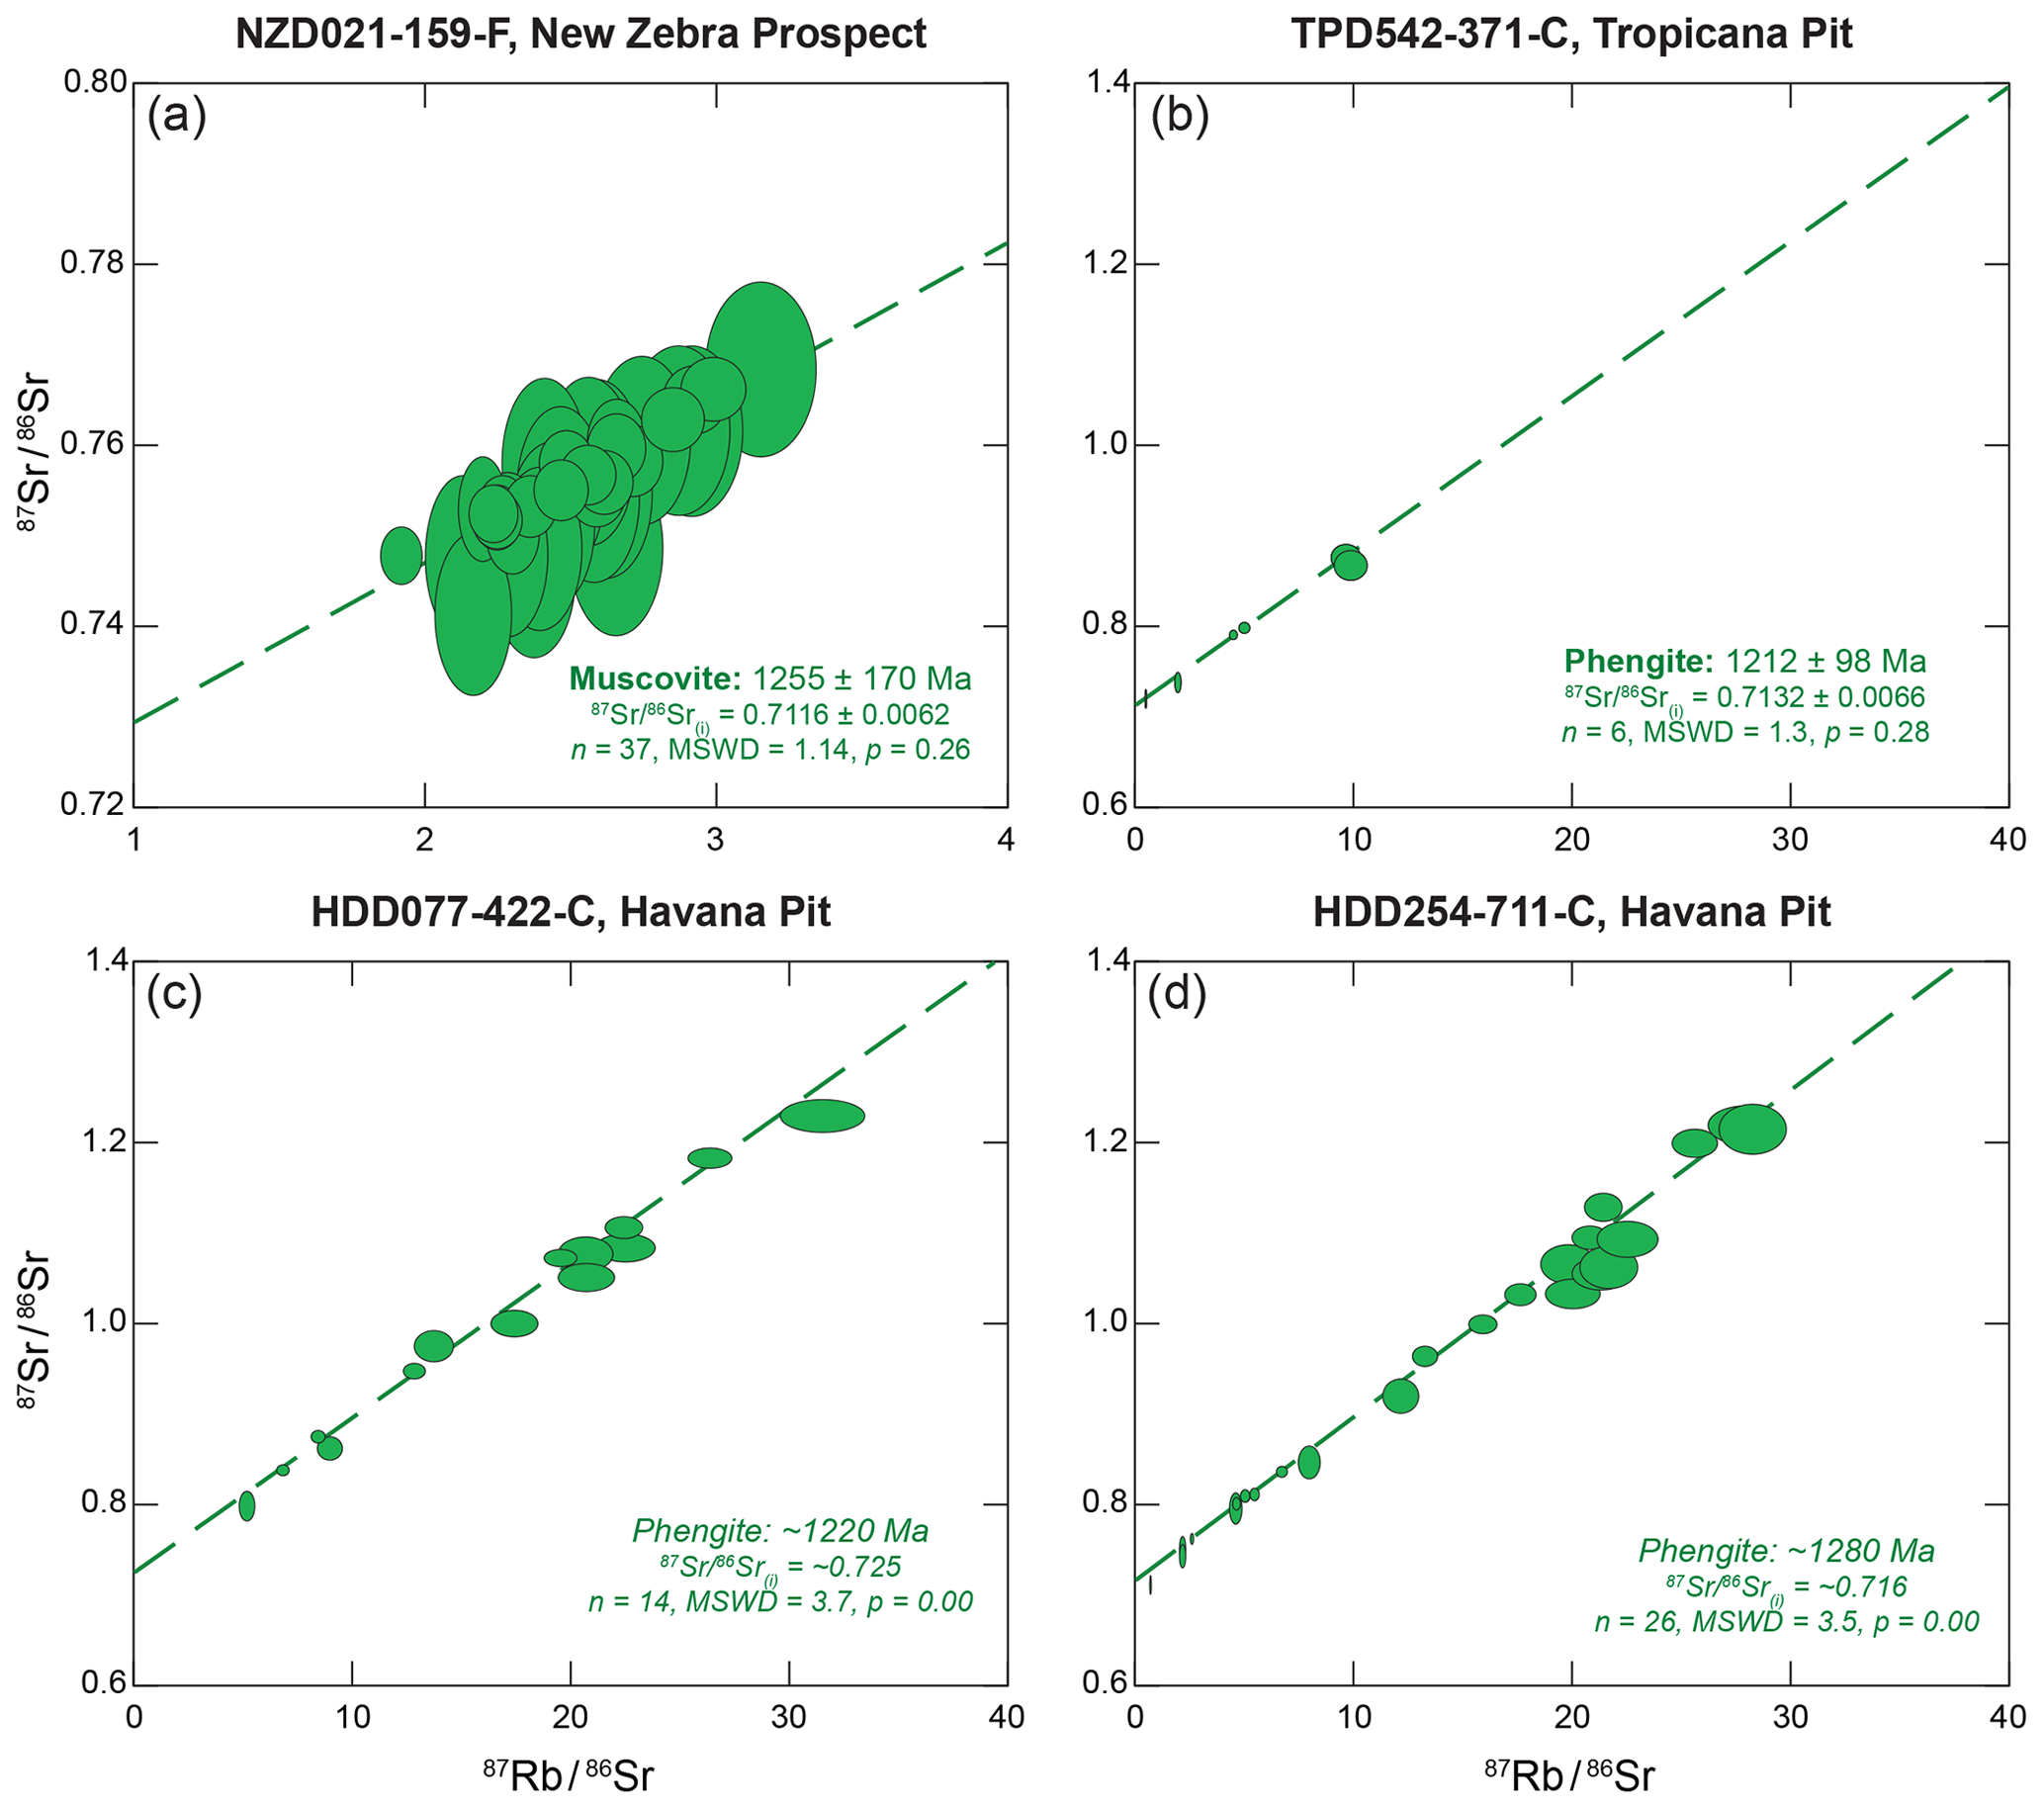
Figure 8Phengite and muscovite Rb–Sr isochrons for individual samples, with green data corresponding to assemblage 2 phengite or muscovite. All error ellipses are plotted at 2σ. Ages in italics are estimates only due to overdispersion for a single population.
5.2.3 Muscovite
Euhedral muscovite was present as euhedral crystals in the New Zebra satellite deposit. Muscovite showed only minor spread in 87Rb∕86Sr (2.0–3.4, Fig. 8a). Consequently, it yielded a statistically valid but imprecise isochron of 1255±170 Ma (n=37, MSWD =1.14, p=0.26) with an initial 87Sr∕86Sr intercept of 0.7116±0.0062 (Fig. 8a).
5.2.4 Apatite
As apatite has negligible Rb, there is no modification of initial 87Sr∕86Sr from any radiogenic decay of 87Rb. Thus, the measured 87Sr∕86Sr is equivalent to the initial 87Sr∕86Sr ratio at the time of (re)crystallization. Apatite 1 was analyzed in three samples, yielding 87Sr∕86Sr(i) ratios between 0.7045±0.0012 and 0.7058±0.0039 (p>0.05 in all samples; Fig. 9a, c, d). Apatite 2 was analyzed in three samples, yielding 87Sr∕86Sr(i) ratios between 0.7053±0.0012 and 0.7092±0.0033 (p>0.05 in all samples; Table 1, Fig. 9a, b, d). In the two samples where both assemblages of apatite were analyzed, BSD114-514-C yielded initial 87Sr∕86Sr that overlapped within 2σ error but HDD254-711-C yielded more radiogenic values for apatite 2 than for apatite 1 (Fig. 9a, d).
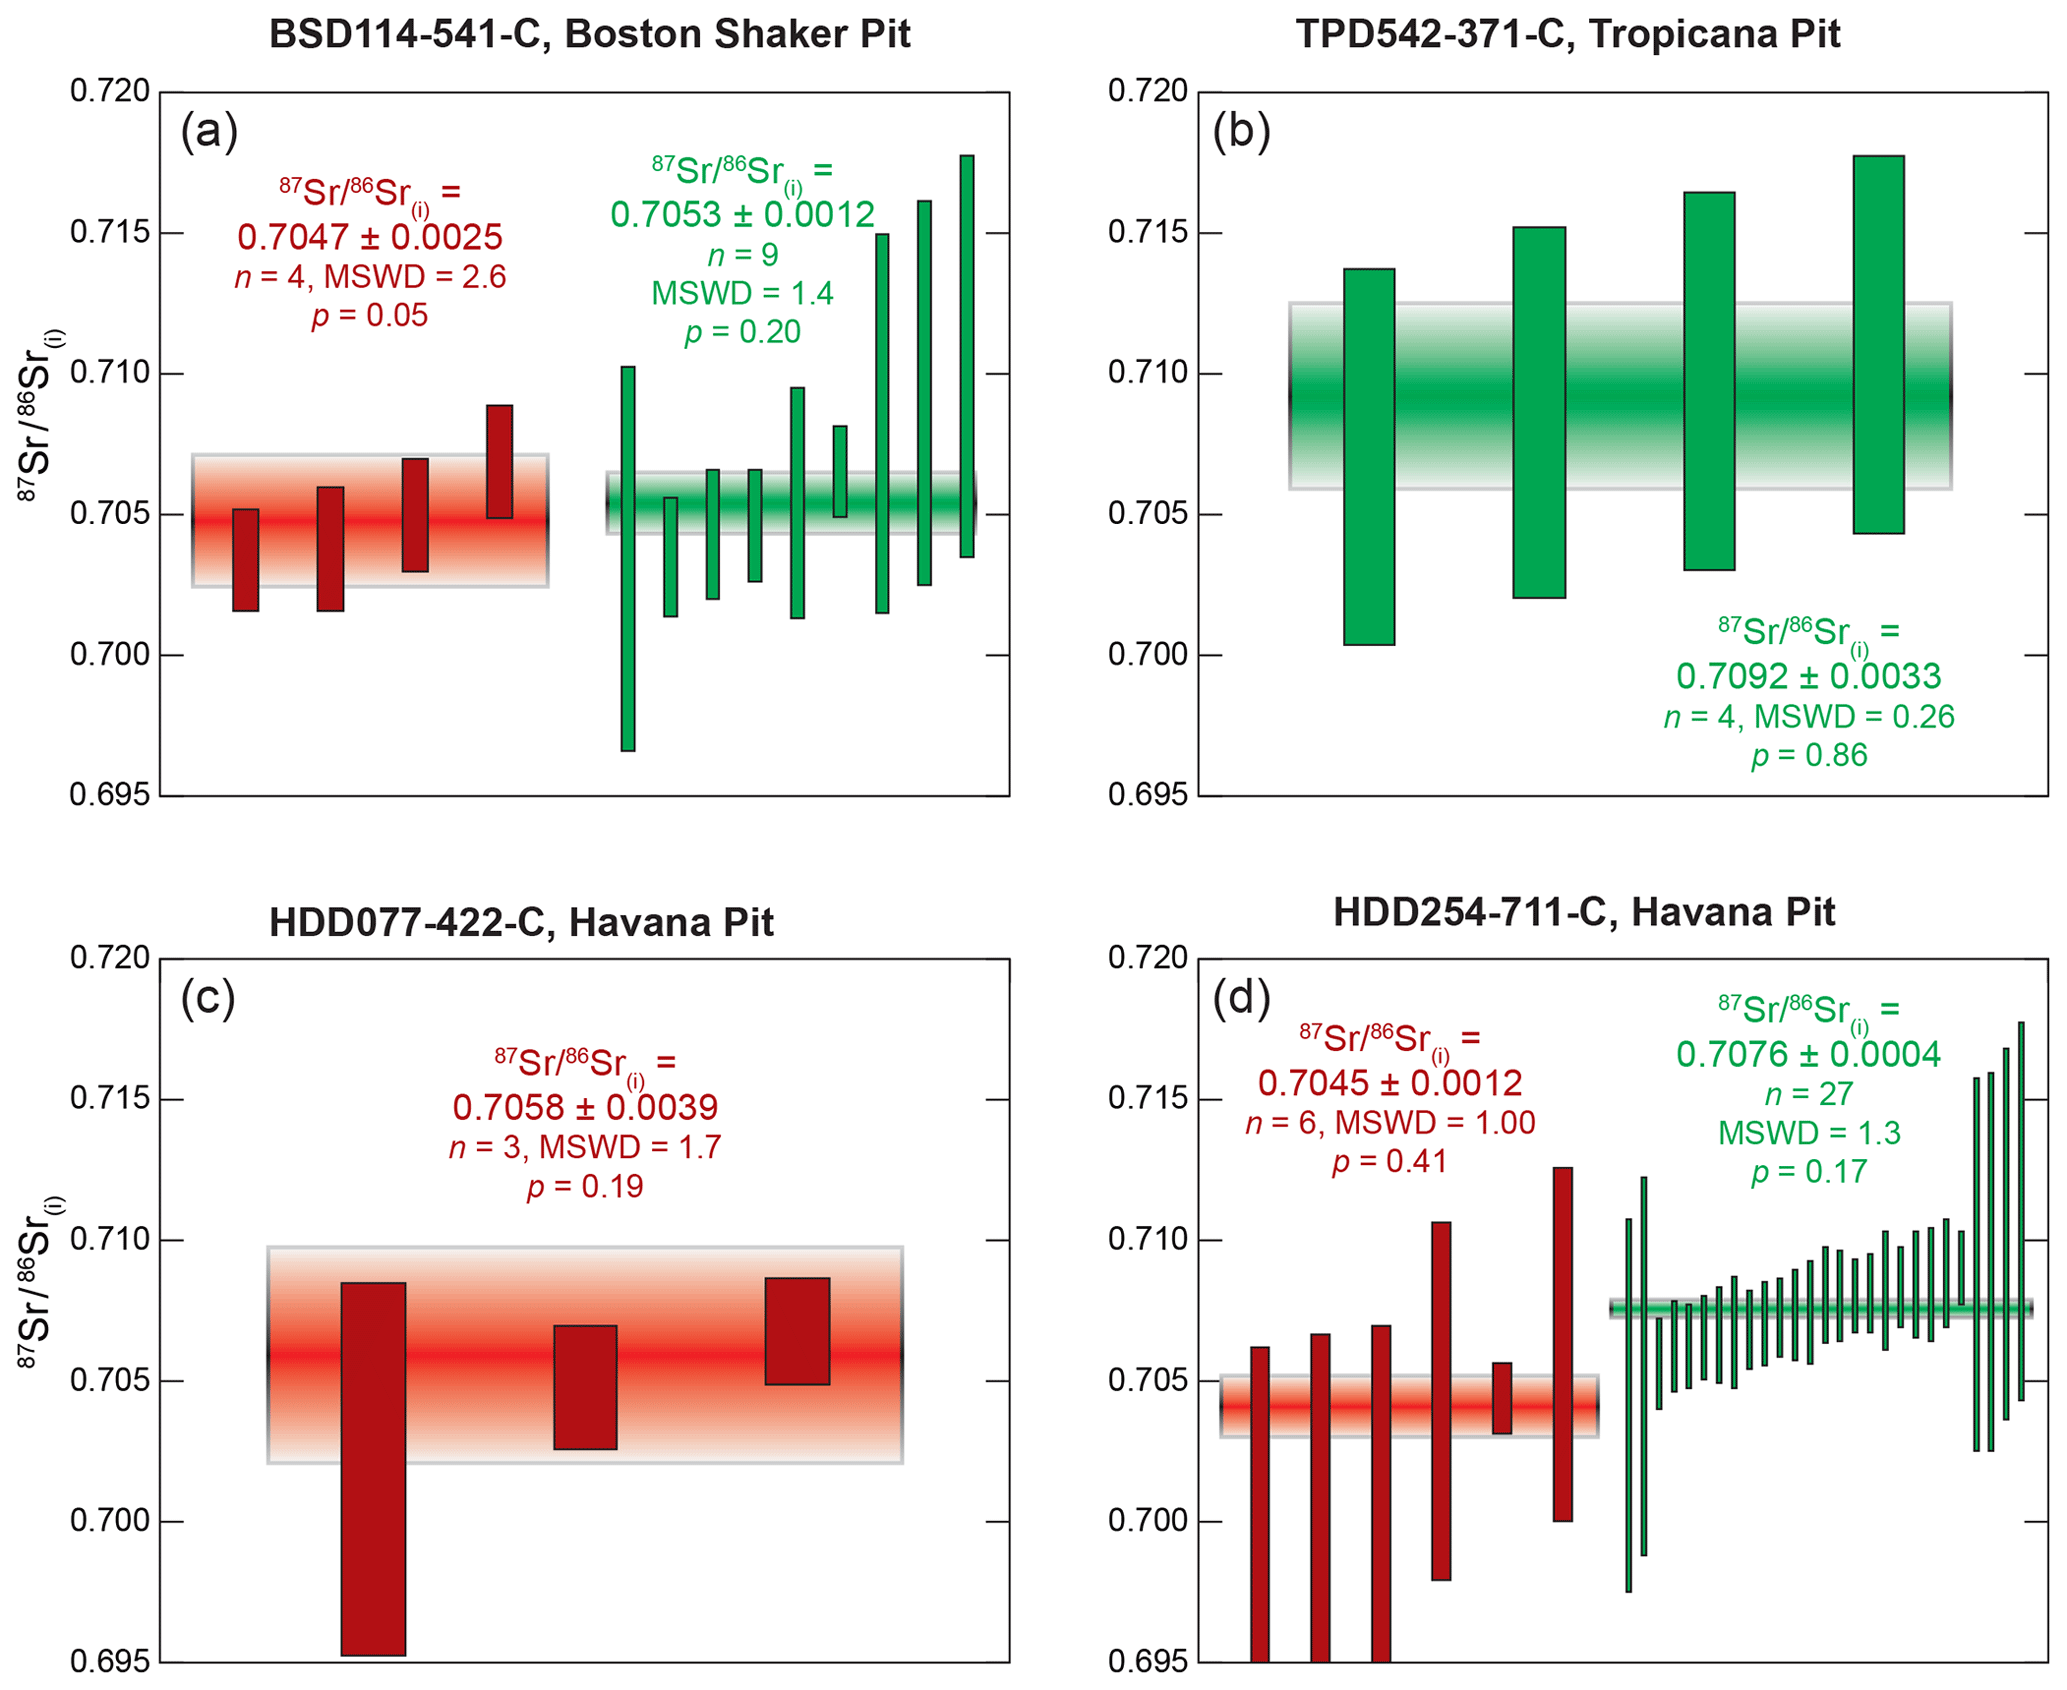
Figure 9Apatite weighted mean 87Sr∕86Sr. Due to the lack of Rb in apatite, measured 87Sr∕86Sr values can be considered as initial ratios.
6.1 Ages recorded by the Rb–Sr geochronometers in the Tropicana Zone
Two distinct temporal patterns are identified in the Rb–Sr results (Figs. 6, 7, 8, 9). In the following, we examine the two isotopic patterns to evaluate their significance and assess the formation mechanisms.
6.1.1 Assemblage 1: ca. 2530 Ma
The first generation of biotite grains consistently shows a scatter of data and a variation in mean isochron ages, with a strong textural control on these age estimates. Samples with dominantly euhedral, exsolution-free biotite grains and minimal recrystallized biotite 2 (e.g., BSD114–541-C) yielded a mean age estimate of ca. 2500 Ma (Fig. 6a). Conversely, where the majority of biotite 1 has been recrystallized to biotite 2 (e.g., HDD077-422-C) and where exsolution lamellae were abundant (Fig. 4c, d, e, f, g, h), the age estimates from biotite 1 are as young as ca. 1500 Ma (Fig. 6c). If this exsolution occurred during the formation of biotite 2 with the incomplete transformation of biotite 1 to 2, it would also explain why biotite 2 appears more bleached (i.e., depleted in Fe–Ti oxides) than biotite 1 (Fig. 3a, b, c, d). Thus, any laser spots in biotite 1 in samples from the Tropicana and Havana pits would have hit physical mixtures of biotite 1 and 2, thereby providing a meaningless age. The relative consistency of dates for a single sample (albeit still overdispersed) is attributed to the consistency of exsolution lamellae. For example, the “age” of biotite 1–2 mixtures in HDD077-422-C (ca. 1.5 Ga; Fig. 6c) is younger than HDD254-711-C (ca. 1.7 Ga; Fig. 6d) because the former has, on average, a higher proportion of lamellae (Fig. 4f, h). These exsolution lamellae could also have facilitated variable loss of Rb and Sr (especially radiogenic 87Sr) during (partial) resetting of the Rb–Sr isotopic system (Matheney et al., 1990; Kalt et al., 1994; Evans et al., 1995; Eberlei et al., 2015).
Considering that the excess scatter in the first assemblage biotite grains is due to partial resetting linked to dynamic recrystallization (and thereby mixing biotite 1 and 2 components), it follows that the oldest biotite grains can yield a minimum age for the first event. In the samples where the crystals are freshest, coarsest, and least overprinted by shearing and assemblage 2, the oldest biotite grains provide a minimum age of 2535±18 Ma for assemblage 1 (Fig. 6a). This is consistent within error with biotite 40Ar∕39Ar (2531±14 Ma) and pyrite Re–Os ages (2505±50 Ma) and broadly compatible with the oldest W-rich rutile U–Pb dates of ca. 2539–2479 Ma obtained from similar samples in the Tropicana gold mine (Doyle et al., 2015).
6.1.2 Assemblage 2: ca. 1210 Ma
Ages of the recrystallized biotite grains from assemblage 2 are within uncertainty of one another for all samples from the Tropicana gold mine. Considering the relative proximity of all samples within the Tropicana gold mine, it is unlikely that the duration of a hydrothermal event associated with dynamic recrystallization of biotite would have exceeded the uncertainty of the Rb–Sr geochronometer. Therefore, we calculate a single weighted mean age of 1207±12 Ma (n=62, MSWD =0.91, p=0.68) for all available analysis of this fabric (Fig. 10), and we consider this age to record a synchronous event across the Tropicana gold mine. Assuming biotite 2 grains were coeval with apatite 2, a better initial 87Sr∕86Sr intercept can be defined, relative to one generated from a free-regressed biotite 2 isochron. Hence, we have also computed a weighted mean age with apatite 2 and biotite 2 of 1212±9 Ma (n=102, MSWD =1.3, p=0.05), overlapping within uncertainty with the biotite-only regressed age (Fig. 10).
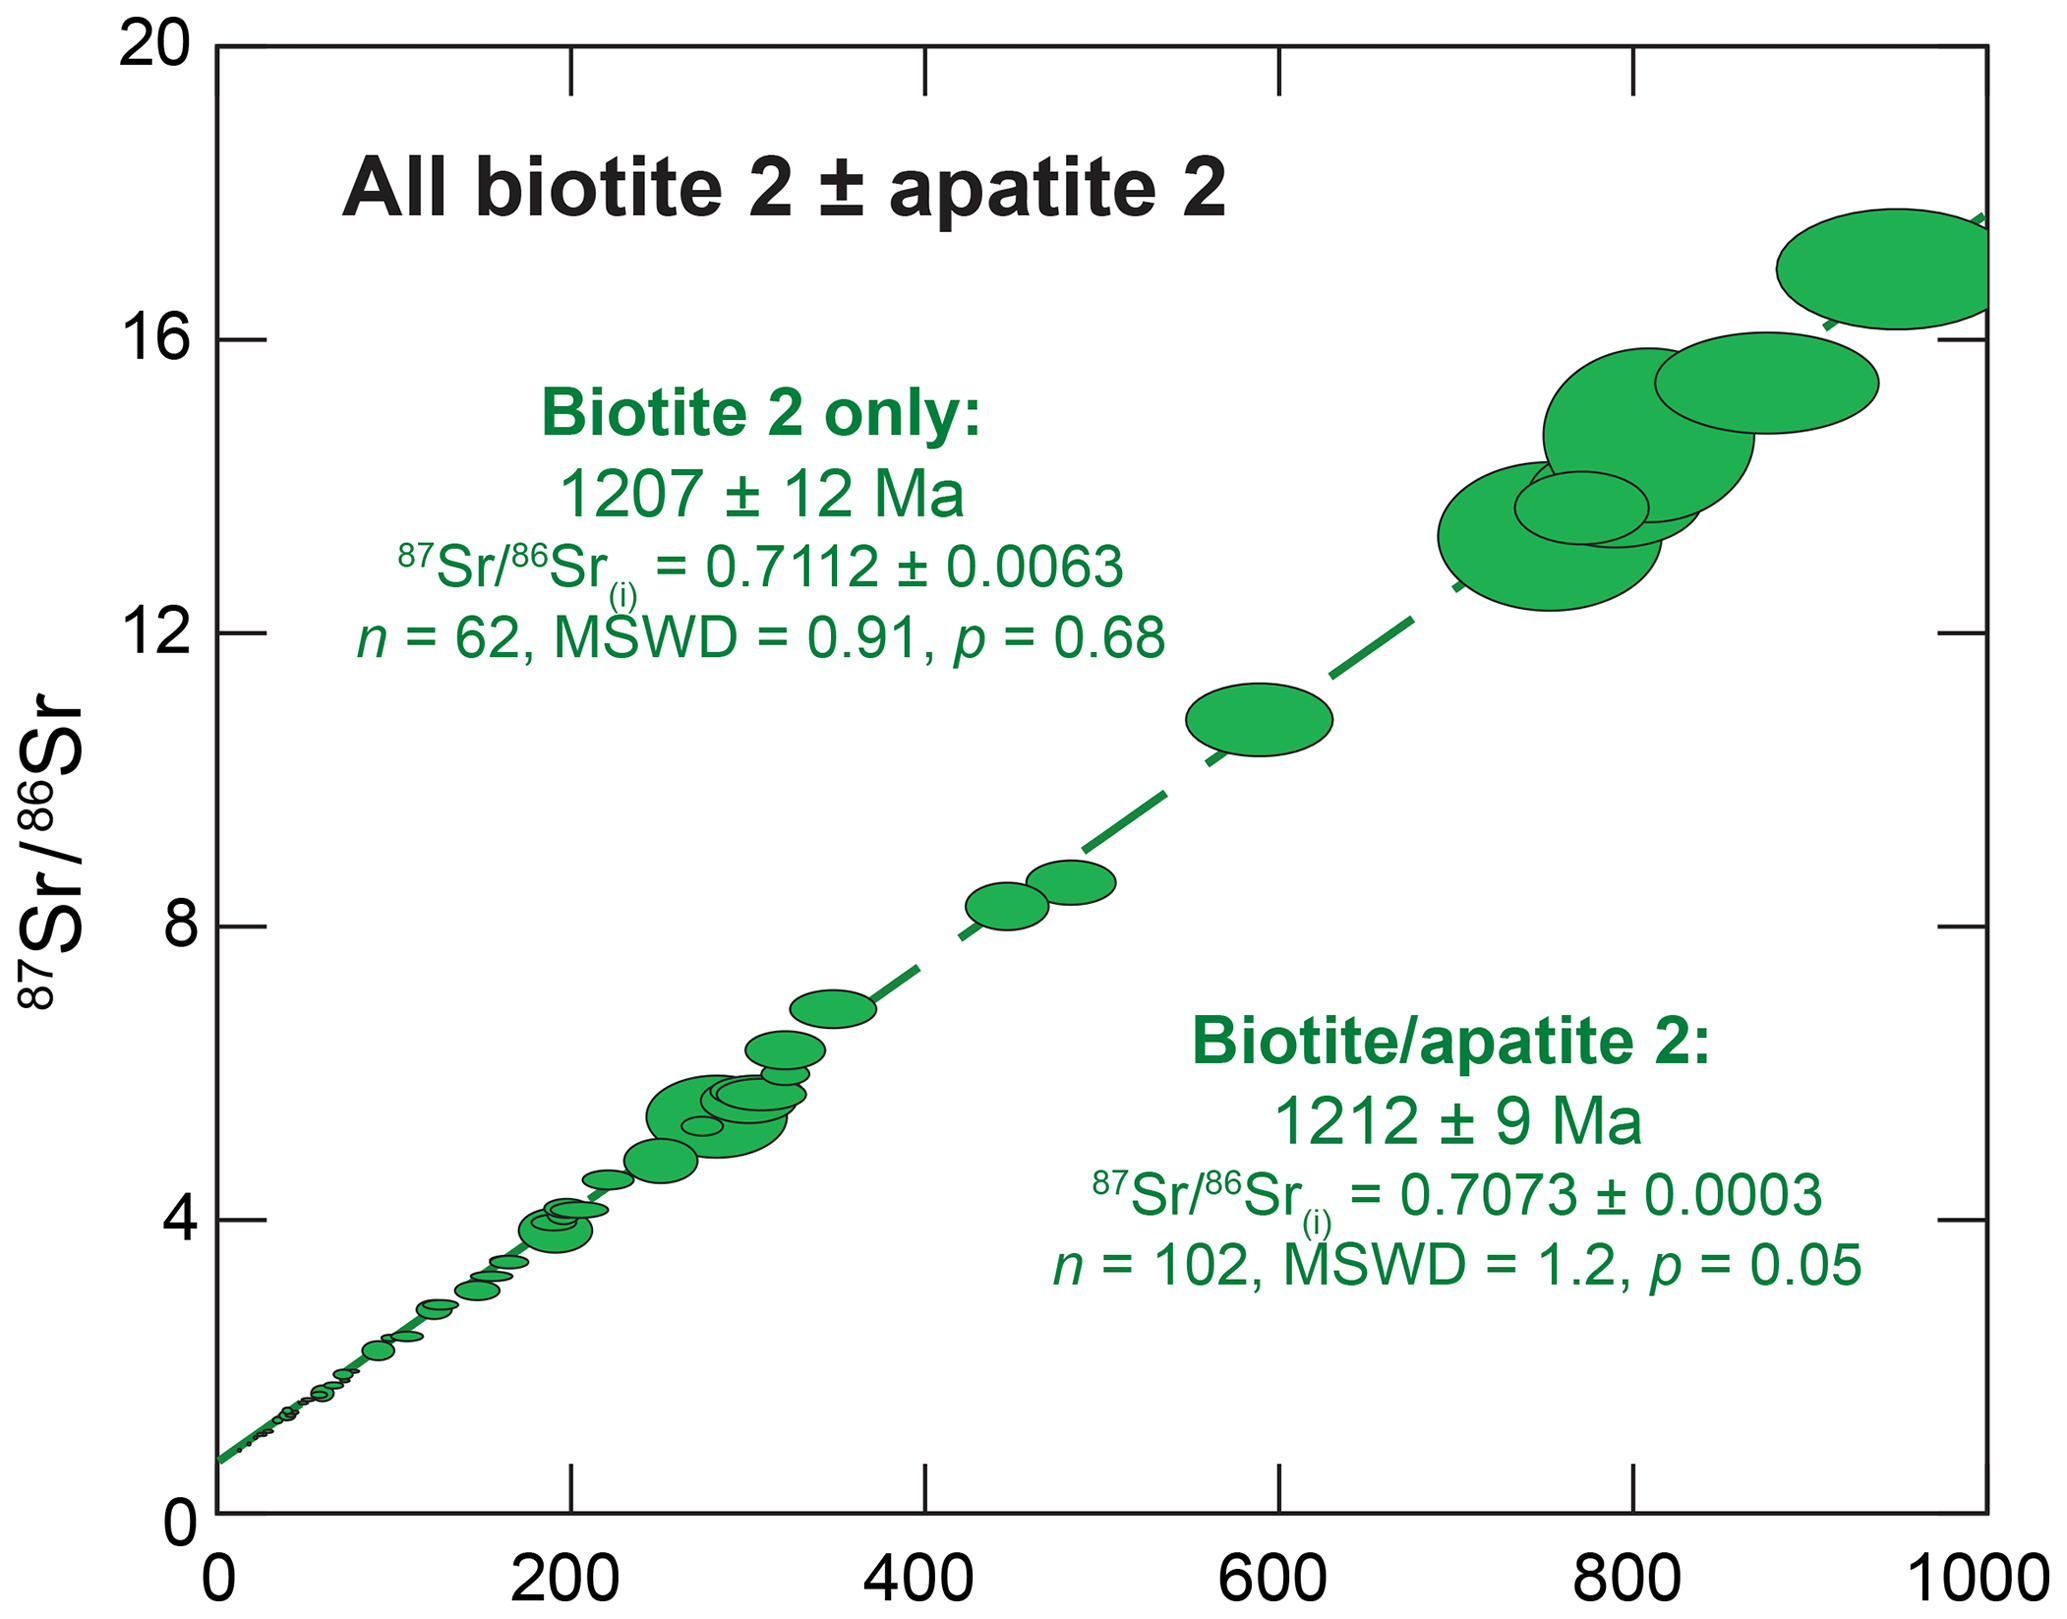
Figure 10Combined isochron of biotite 2 analyses from all four samples in the Tropicana gold mine, computed with and without apatite 2.
The phengite data consistently yield similar ages within 2σ of the biotite 2 ages, albeit with excess scatter, implying that biotite 2 and phengite are coeval (Figs. 6, 8). This is consistent with the mineral paragenetic sequence (Fig. 2). The overdispersion in the phengite data could be a consequence of heterogeneous minerals or differences in the matrix between the phengite and the phlogopite primary standard Mica-Mg (see Sect. 4.2). Alternatively, the overdispersion may be a real geological phenomenon, implying that phengite formed over a protracted period.
The only sample that contained euhedral muscovite, from the New Zebra prospect, yielded an age of 1255±170 Ma that, although imprecise, also overlaps with the second phase of biotite (biotite 2) and the phengite ages (Figs. 6, 8). Thus, all samples point towards a single event at ca. 1210 Ma.
The ca. 1210 Ma event could either represent a distinct, fluid-flow episode that recrystallized biotite, formed phengite and produced muscovite, or it may record an exhumation event that cooled the Rb–Sr geochronometers to below their closure temperatures. The implication with the latter is that the fluid-flow event occurred prior to exhumation.
6.2 Implications for metamorphic, hydrothermal and mineralization events in the Albany–Fraser Orogen
Two ages of ca. 2530 and 1210 Ma have been previously linked to events in the Albany–Fraser Orogen, although the latter had not been previously identified in the Tropicana Zone. The discovery of the Mesoproterozoic age at Tropicana needs to be explored in terms of implications for structural and hydrothermal evolution as well as metallogenesis.
The ca. 2530 Ma age is only known from the Tropicana Zone of the Albany–Fraser Orogen (Doyle et al., 2015; Kirkland et al., 2015). Previous workers have interpreted the ca. 2530 Ma age as a distinct hydrothermal event at greenschist facies conditions during D3 shearing, which was also associated with Au mineralization (Blenkinsop and Doyle, 2014; Doyle et al., 2015; Occhipinti et al., 2018). This ca. 2530 Ma event is postulated to have followed a protracted period of granulite-facies metamorphism from ca. 2640 to 2530 Ma as part of the Atlantis Event (Kirkland et al., 2015; Doyle et al., 2015).
Here, we propose an alternative plausible scenario, namely that the ca. 2530 Ma age represents the timing of cooling below the closure temperatures of the various geochronometers, including U–Pb rutile ≈ 2539–2479 Ma, Re–Os pyrite Ma, Rb–Sr biotite Ma and 40Ar∕39Ar biotite Ma (Doyle et al., 2015 and this study). The closure temperatures for these minerals are low to moderate, in decreasing order: (i) Pb diffusion in rutile = 550–650 ∘C (Ewing et al., 2015; Kooijman et al., 2010), (ii) 187Os in pyrite closure ∼500 ∘C (Brenan et al., 2000), (iii) 87Sr diffusion in biotite =300–400 ∘C (Del Moro et al., 1982) and (iv) 40Ar diffusion in biotite =280–350 ∘C (Harrison et al., 1985). Given that all of the geochronometers are broadly within an error of ca. 2530 Ma (this study and Doyle et al., 2015), exhumation at ca. 2530 Ma would have been relatively faster than the preceding ∼120 Myr of the Atlantis Event. Such prolonged slow cooling followed by a relatively faster period of cooling is also observed in the core of the Yilgarn Craton (Goscombe et al., 2019). The rate of cooling and exhumation in Tropicana Zone is difficult to ascertain as the uncertainty on the various geochronometers is insufficiently precise to develop a cooling curve. If the ca. 2530 Ma age recorded in the Tropicana Zone represents a cooling age rather than a distinct tectonic event, an important implication is that D3 shearing occurred post-2530 Ma.
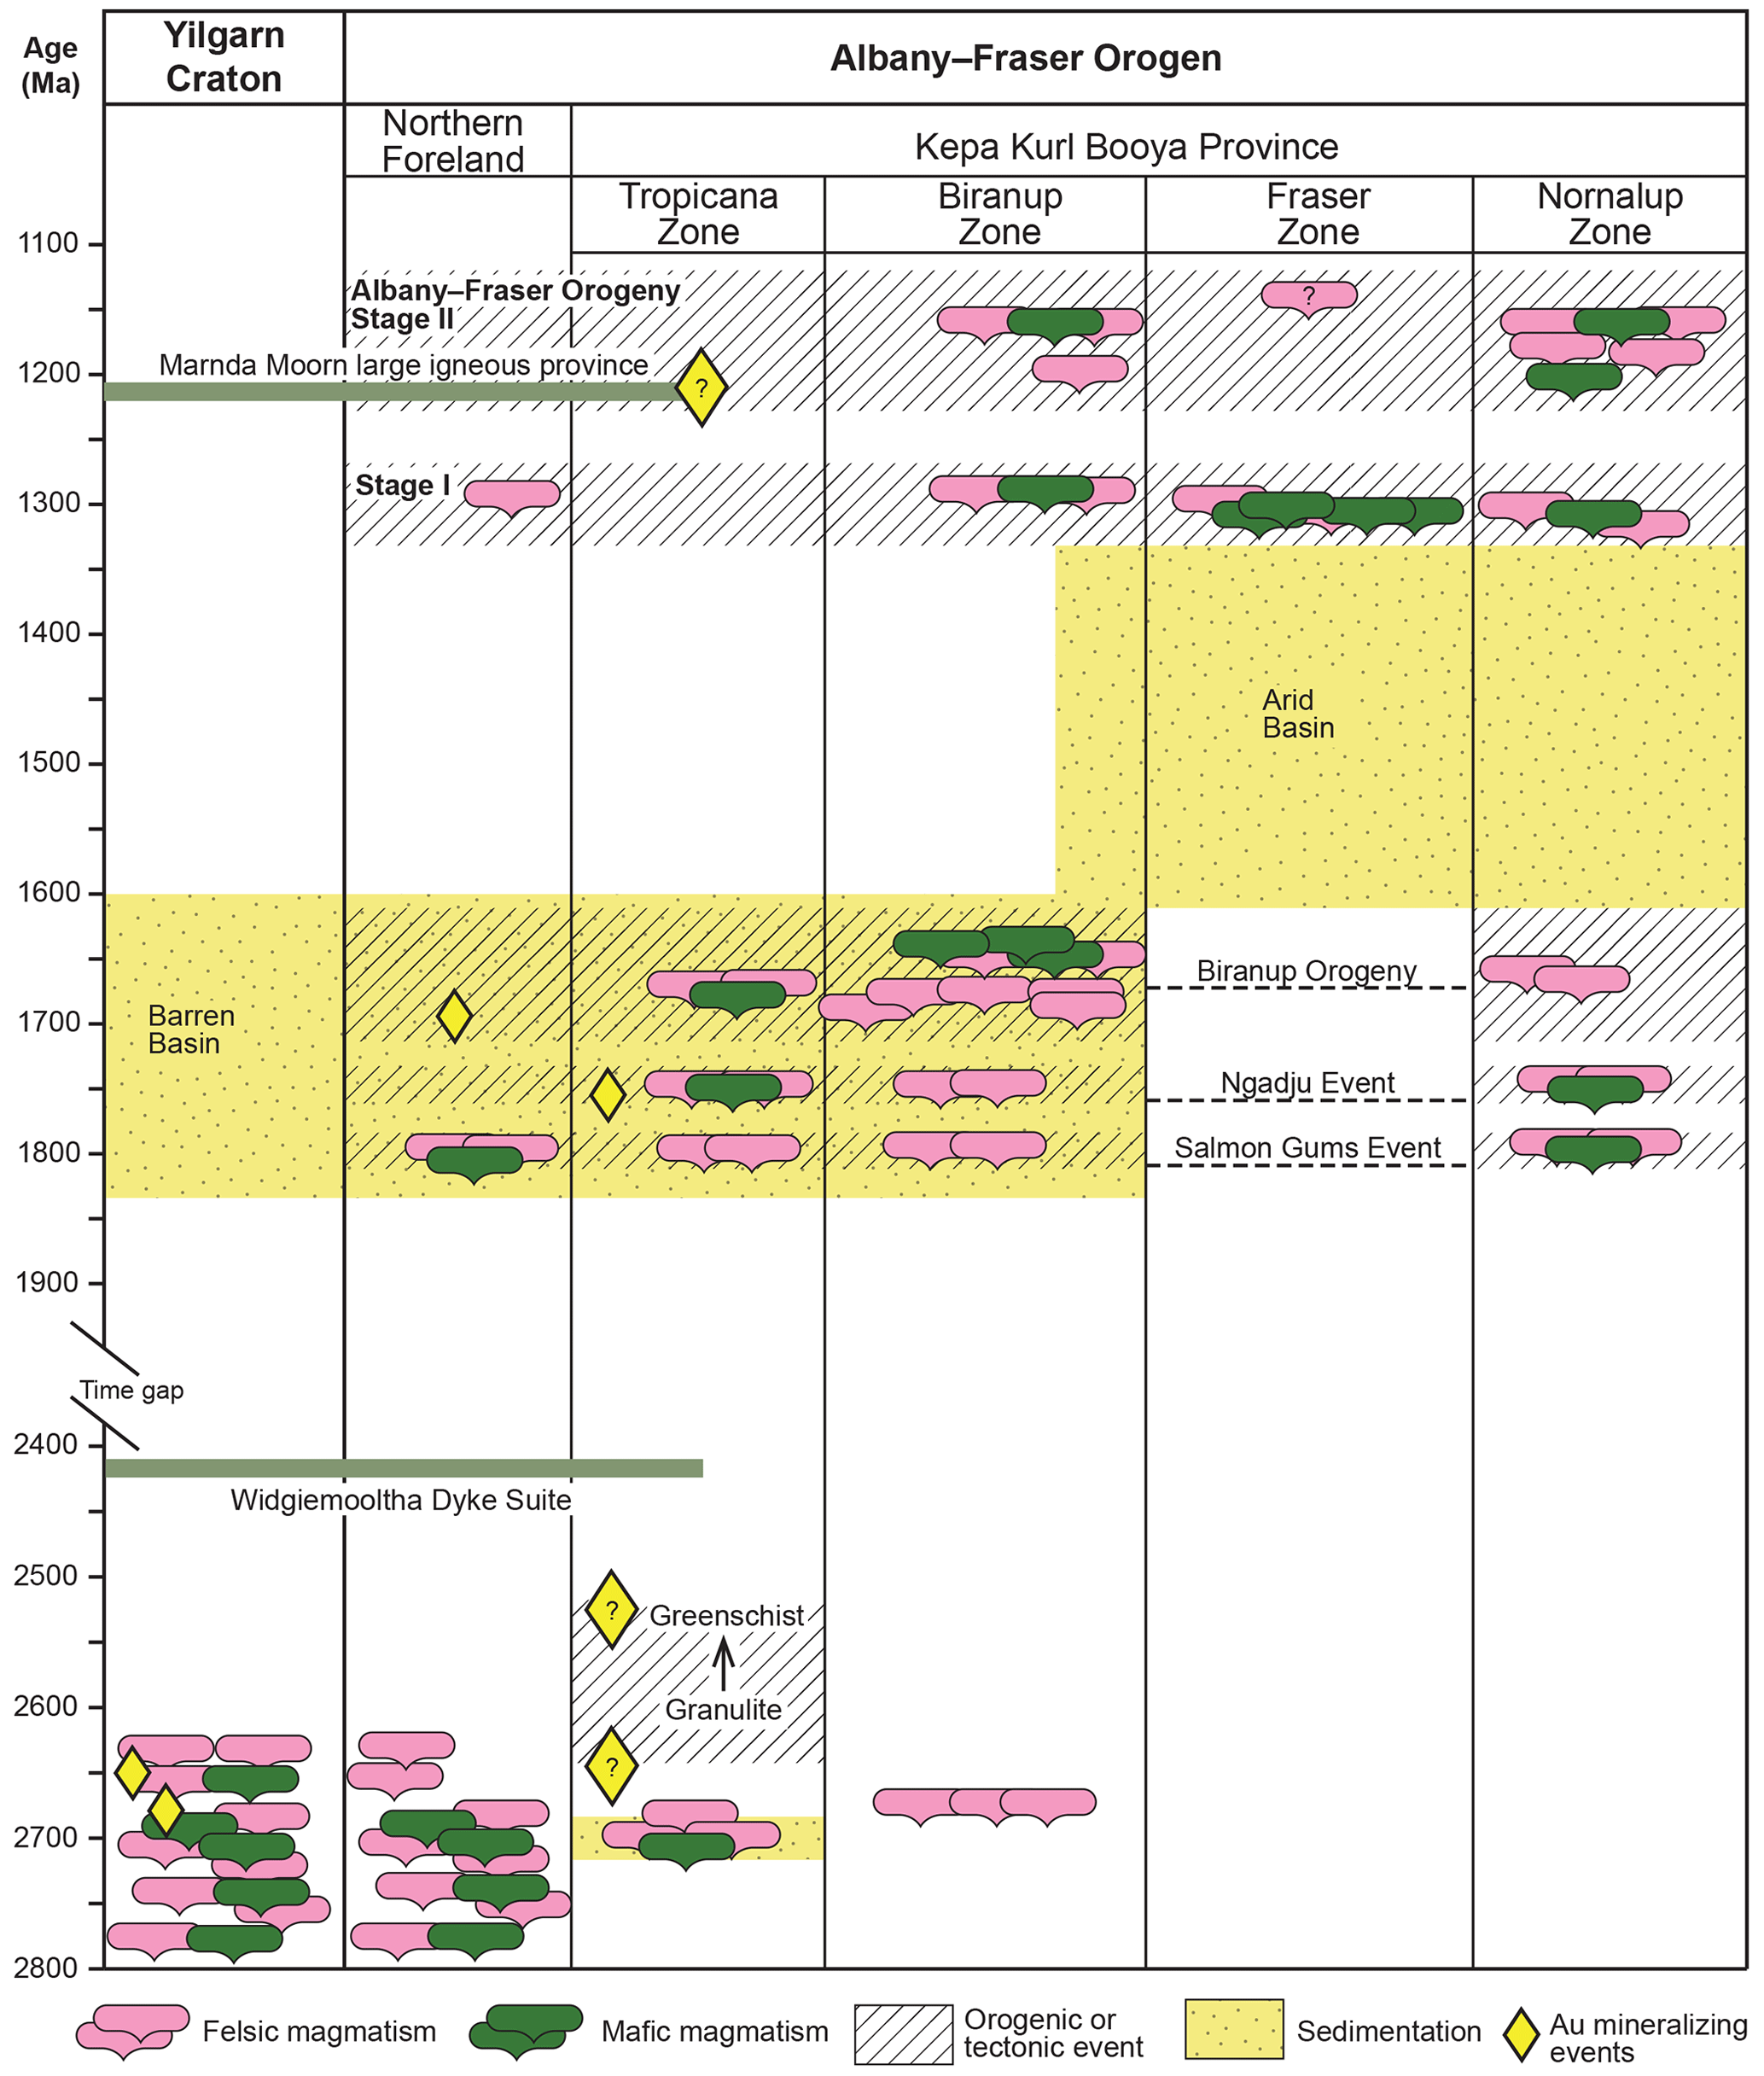
Figure 11Synthetic time–space plot showing geological history of the Tropicana Zone, modified from Spaggiari et al. (2015) and Kirkland et al. (2015). The timing of mineralization in the Tropicana Zone is uncertain (see Sect. 6).
We propose that D3 shearing instead occurred at ca. 1210 Ma. There are several lines of evidence to support this interpretation:
-
Mineral assemblage 2 associated with the brittle–ductile microstructure is stable from low- to high-strain zones across the Tropicana gold mine. Blenkinsop and Doyle (2014) attributed the crackle breccia with dominantly biotite–pyrite assemblage to the D3 event and a muscovite–chlorite-bearing assemblage only recorded in the high-strain zones to the D4 event. However, they have attributed the same kinematics of northeast–southwest shortening to both D3 and D4 events. We see a possibility that a variable amount of muscovite/phengite might be a function of the variable plagioclase content of the host syenitic gneiss. Breakdown of plagioclase to micas localizes strain within anastomosing and simple shear-dominated D4 ductile shears, while K-feldspar-dominated domains show a more brittle response within an apparent low-strain and pure shear-dominated domain (Fig. 2). A presence of carbonate and euhedral pyrite in both microstructures support the coincident development of the D3 and D4 microstructures (Fig. 2, Supplement Fig. S2). If only a single shearing event is implicated (i.e., D3–D4), this would have to occur during the formation of mineral assemblage 2 (i.e., 1210 Ma). Although, the question of a possible reactivation is not the primary goal of this paper, it is likely that some reactivation of D3–D4 fabric might have occurred during a localized D5 event (Blenkinsop and Doyle, 2014).
-
Rb–Sr profiles across coarse-grained biotite 1 show limited resetting at grain edges, linked to dynamic recrystallization (Fig. 7), and are also consistent with a single shearing event (i.e., 1210 Ma).
-
If D3 shearing occurred at ca. 2530 Ma and it was reset at ca. 1210 Ma, one would expect a range of Proterozoic ages from biotite 2, which is clearly not the case (Fig. 10). One could argue that previous geochronological studies in the Tropicana gold mine have pointed towards a potential mineralizing event at ca. 2000–1800 Ma on the basis of disturbed 40Ar∕39Ar spectra and Pb–Pb dates (Doyle et al., 2015). Additionally, quartz vein-related Au mineralization is implicated at ca. 2100 Ma for the Hercules and Atlantic gold prospects in the Tropicana Zone based on Re–Os pyrite model ages (Kirkland et al., 2015). However, it is equally likely that the Pb–Pb and Re–Os pyrite dates (Doyle et al., 2015) represent mixed assemblage 1 and 2 populations and do not represent distinct events. Disturbed 40Ar∕39Ar spectra are also notoriously unreliable (Baksi, 2007).
-
Finally, there is no unequivocal geological evidence for a distinct shearing event at ca. 2530 Ma (Doyle et al., 2015).
Our support for D3 shearing at ca. 1210 Ma does not necessarily mean that assemblage 2 was linked to the primary Au mineralization in the Tropicana deposit (Fig. 11). Mesoproterozoic orogens are typically poor in orogenic Au deposits across the world (e.g., Goldfarb et al., 2001), and the Albany–Fraser Orogen is no exception. Since the discovery of Tropicana in 2005 (Doyle et al., 2007; Kendall et al., 2007), it remains the only deposit with economic Au mineralization in the Albany–Fraser Orogen. Although Tropicana is unlike typical Archean lode gold deposits in the Yilgarn Craton (e.g., gold not directly associated with quartz and carbonate veining; Kent et al., 1996; Cassidy et al., 1998), the Tropicana Zone experienced long-lived granulite facies metamorphism from ca. 2640 to 2530 Ma (Atlantis Event; Doyle et al., 2015; Kirkland et al., 2015). Such long-lived metamorphism might have efficiently reworked all textural indicators of primary mineralization. Indeed, a detailed microscale study of the gold compartment in the Tropicana gold mine has demonstrated gold and telluride inclusions within granulite facies coarse-grained material from assemblage 1 (Hardwick, 2020). Following these observations, it seems that D3 shearing and alteration minerals of assemblage 2 masks the controls on primary gold mineralization.
There are certainly Proterozoic occurrences of subeconomic Au mineralization in the rest of the Tropicana Zone and possibly the wider Albany–Fraser Orogen (Figs. 1b, 11). Gold prospects such as New Zebra, Iceberg or Angel Eyes lack obvious Archean events (Fig. 8a) but still show elevated Au. Therefore, it is probable that subordinate, secondary Au mineralization in the Tropicana Zone is associated with the D3–D4 shearing event and mineral assemblage 2 formation at ca. 1210 Ma (Fig. 11), but it is uncertain whether the Au is remobilized from an Archean source or was only introduced into the Mesoproterozoic crust at ca. 1210 Ma.
The ca. 1210 Ma event in the Albany–Fraser Orogen is known from both the early stages of the Albany–Fraser Orogeny Stage II (Clark et al., 2000; Kirkland et al., 2011; Spaggiari et al., 2014) and the widespread intrusions of the Marnda Moorn dyke swarm (Wang et al., 2014; Wingate and Pidgeon, 2005; Dawson et al., 2003). We favor the association of the D3 shearing with Stage II of the Albany–Fraser Orogeny given the macro- and microstructural characteristics of the Tropicana gold mine.
In situ Rb–Sr geochronology from two assemblages of biotite in the Tropicana gold mine yielded ages of 2535±18 and 1212±9 Ma. The former overlaps with 40Ar∕39Ar biotite, Re–Os pyrite and U–Pb rutile ages obtained in a previous study, whilst the latter is the first record of a Mesoproterozoic age in the Tropicana Zone. We propose that the ca 2530 Ma represents cooling of the Yilgarn Craton after granulite facies metamorphism and that the ca. 1210 Ma represent a distinct shearing event (D3–D4 of Blenkinsop and Doyle, 2014), potentially associated with Au mineralization. Considering the likely association of the ca. 1210 Ma event with major shearing, we consider the most likely cause of this Mesoproterozoic event to be Stage II of the Albany–Fraser Orogeny. At present, the in situ Rb–Sr method is the only technique that could have revealed these two age populations without foregoing textural context.
All data related to this contribution may be found as part of the Supplement.
The supplement related to this article is available online at: https://doi.org/10.5194/gchron-2-283-2020-supplement.
HKHO, SU, BIAM and MD conceptualized the project. KR and BM designed the methodology and investigated the experiments. CLK, NJE and AP carried out formal analysis. SU, SB and MD provided resources, data curation and funding to the project. BIAM and MD provided project administration. HKHO prepared the original draft of the paper, and all co-authors contributed to the reviewing and editing process.
The authors declare that they have no conflict of interest.
AngloGold Ashanti Australia is thanked for funding this project. The TESCAN Mira3 TIMA with four MAXIM PulseTor SDD X-ray detectors was acquired through the Australian Research Council LIEF scheme (grant no. LE140100150). This study was enabled by AuScope and the Australian Government via the National Collaborative Research Infrastructure Strategy (NCRIS). The 8900 triple quadrupole was obtained via funding from the Curtin University Research Office. Special thanks go to Jeni Savage and Brendan Hardwick from AngloGold Ashanti for constructive discussions about the Tropicana deposit.
This research has been supported by AngloGold Ashanti, the Australian Research Council LIEF scheme (grant no. LE140100150), the Curtin University of Technology and the National Collaborative Research Infrastructure Strategy.
This paper was edited by Daniela Rubatto and reviewed by Thomas Blenkinsop and Thomas Zack.
Attendorn, H. G. and Bowen, R. N. C.: Rubidium-strontium dating, in: Radioactive and Stable Isotope Geology, Springer, 159–191, 1997.
Baksi, A. K.: A quantitative tool for detecting alteration in undisturbed rocks and minerals – I: Water, chemical weathering, and atmospheric argon, Geol. Soc. Am. Spec. Pap., 430, 285–303, https://doi.org/10.1130/2007.2430(15), 2007.
Blenkinsop, T. G. and Doyle, M. G.: Structural controls on gold mineralization on the margin of the Yilgarn craton, Albany–Fraser orogen: The Tropicana deposit, Western Australia, J. Struct. Geol., 67, 189–204, https://doi.org/10.1016/j.jsg.2014.01.013, 2014.
Bodorkos, S. and Clark, D. J.: Evolution of a crustal-scale transpressive shear zone in the Albany–Fraser Orogen, SW Australia: 2. Tectonic history of the Coramup Gneiss and a kinematic framework for Mesoproterozoic collision of the West Australian and Mawson cratons, J. Metamorph. Geol., 22, 713–731, 2004.
Brenan, J. M., Cherniak, D. J., and Rose, L. A.: Diffusion of osmium in pyrrhotite and pyrite: implications for closure of the Re–Os isotopic system, Earth Planet. Sc. Lett., 180, 399–413, https://doi.org/10.1016/S0012-821X(00)00165-5, 2000.
Cassidy, K. F., Groves, D. I., and McNaughton, N. J.: Late-Archean granitoid-hosted lode-gold deposits, Yilgarn Craton, Western Australia: deposit characteristics, crustal architecture and implications for ore genesis, Ore Geol. Rev., 13, 65–102, 1998.
Charlier, B. L. A., Ginibre, C., Morgan, D., Nowell, G. M., Pearson, D. G., Davidson, J. P., and Ottley, C. J.: Methods for the microsampling and high-precision analysis of strontium and rubidium isotopes at single crystal scale for petrological and geochronological applications, Chem. Geol., 232, 114–133, 2006.
Chen, C.-H., DePaolo, D. J., and Lan, C.-Y.: Rb Sr microchrons in the Manaslu granite: implications for Himalayan thermochronology, Earth Planet. Sc. Lett., 143, 125–135, 1996.
Cheng, P., Koyanagi, G. K., and Bohme, D. K.: On the chemical resolution of the 87Rb+ (s0)/87Sr+ (s1) isobaric interference: A kinetic search for an optimum reagent, Anal. Chim. Acta, 627, 148–153, 2008.
Clark, C., Kirkland, C. L., Spaggiari, C. V., Oorschot, C., Wingate, M. T. D., and Taylor, R. J.: Proterozoic granulite formation driven by mafic magmatism: An example from the Fraser Range Metamorphics, Western Australia, Precambrian Res., 240, 1–21, https://doi.org/10.1016/j.precamres.2013.07.024, 2014.
Clark, D. J., Hensen, B. J., and Kinny, P. D.: Geochronological constraints for a two-stage history of the Albany–Fraser Orogen, Western Australia, Precambrian Res., 102, 155–183, https://doi.org/10.1016/S0301-9268(00)00063-2, 2000.
Daly, J. S., Aitcheson, S. J., Cliff, R. A., Gayer, R. A., and Rice, A. H. N.: Geochronological evidence from discordant plutons for a late Proterozoic orogen in the Caledonides of Finnmark, northern Norway, J. Geol. Soc., 148, 29–40, 1991.
Dawson, G. C., Krapež, B., Fletcher, I. R., McNaughton, N. J., and Rasmussen, B.: 1.2 Ga thermal metamorphism in the Albany–Fraser Orogen of Western Australia: consequence of collision or regional heating by dyke swarms?, J. Geol. Soc., 160, 29–37, https://doi.org/10.1144/0166-764901-119, 2003.
Del Moro, A., Puxeddu, M., di Brozolo, F. R., and Villa, I. M.: Rb-Sr and K-Ar ages on minerals at temperatures of 300–400∘C from deep wells in the Larderello geothermal field (Italy), Contrib. Mineral. Petr., 81, 340–349, https://doi.org/10.1007/BF00371688, 1982.
Doyle, M. G., Kendall, B. M., and Gibbs, D.: Discovery and characteristics of the Tropicana gold district, Geoscience Australia Record 2007/14, 186–190, 2007.
Doyle, M. G., Fletcher, I. R., Foster, J., Large, R. R., Mathur, R., McNaughton, N. J., Meffre, S., Muhling, J. R., Phillips, D., and Rasmussen, B.: Geochronological constraints on the Tropicana gold deposit and Albany-Fraser orogen, Western Australia, Economic Geology, 110, 355–386, 2015.
Eberlei, T., Habler, G., Wegner, W., Schuster, R., Körner, W., Thöni, M., and Abart, R.: Rb∕Sr isotopic and compositional retentivity of muscovite during deformation, Lithos, 227, 161–178, https://doi.org/10.1016/j.lithos.2015.04.007, 2015.
Evans, J. A., Millar, I. L., and Noble, S. R.: Hydration during uplift is recorded by reset Rb–Sr whole-rock ages, J. Geol. Soc., 152, 209–212, 1995.
Ewing, T. A., Rubatto, D., Beltrando, M., and Hermann, J.: Constraints on the thermal evolution of the Adriatic margin during Jurassic continental break-up: U–Pb dating of rutile from the Ivrea–Verbano Zone, Italy, Contrib. Mineral. Petr., 169, 44, https://doi.org/10.1007/s00410-015-1135-6, 2015.
Glodny, J., Bingen, B., Austrheim, H., Molina, J. F., and Rusin, A.: Precise eclogitization ages deduced from Rb∕Sr mineral systematics: the Maksyutov complex, Southern Urals, Russia, Geochim. Cosmochim. Ac., 66, 1221–1235, 2002.
Glodny, J., Austrheim, H., Molina, J. F., Rusin, A. I., and Seward, D.: Rb∕Sr record of fluid-rock interaction in eclogites: The Marun-Keu complex, Polar Urals, Russia, Geochim. Cosmochim. Ac., 67, 4353–4371, 2003.
Goldfarb, R. J., Groves, D. I., and Gardoll, S.: Orogenic gold and geologic time: a global synthesis, Ore Geol. Rev., 18, 1–75, https://doi.org/10.1016/S0169-1368(01)00016-6, 2001.
Goscombe, B., Foster, D. A., Blewett, R., Czarnota, K., Wade, B., Groenewald, B., and Gray, D.: Neoarchaean metamorphic evolution of the Yilgarn Craton: A record of subduction, accretion, extension and lithospheric delamination, Precambrian Res., 335, 105441, https://doi.org/10.1016/j.precamres.2019.105441, 2019.
Govindaraju, K.: Report (1968–1978) on two mica reference samples: biotite Mica-Fe and phlogopite Mica-Mg, Geostandard. Newslett., 3, 3–24, 1979.
Hardwick, B.: Mineralised textures at the Tropicana Gold Mine, Western Australia: Implications for genetic model and deportment of gold, MSc, University of Tasmania, Hobart, Tasmania, 2020.
Harrison, T. M., Duncan, I., and McDougall, I.: Diffusion of 40Ar in biotite: Temperature, pressure and compositional effects, Geochim. Cosmochim. Ac., 49, 2461–2468, https://doi.org/10.1016/0016-7037(85)90246-7, 1985.
Hartnady, M. I. H., Kirkand, C. L., Smithies, R. H., Poujol, M., and Clark, C.: Periodic Paleoproterozoic calc-alkaline magmatism at the south eastern margin of the Yilgarn Craton; implications for Nuna configuration, Precambrian Res., 332, 105400, https://doi.org/10.1016/j.precamres.2019.105400, 2019.
Hogmalm, K. J., Zack, T., Karlsson, A. K. O., Sjöqvist, A. S. L., and Garbe-Schönberg, D.: In situ Rb–Sr and K–Ca dating by LA-ICP-MS/MS: an evaluation of N2O and SF6 as reaction gases, J. Anal. Atom. Spectrom., 32, 305–313, 2017.
Kalt, A., Grauert, B., and Baumann, A.: Rb-Sr and U-Pb isotope studies on migmatites from the Schwarzwald (Germany): constraints on isotopic resetting during Variscan high-temperature metamorphism, J. Metamorph. Geol., 12, 667–680, 1994.
Kendall, B. M., Doyle, M. G., and Gibbs, D.: Tropicana: The discovery of a new gold province in Western Australia, 2007 NewGenGold Conference, 19 November 2007, Perth, Australia, 85–95, 2007.
Kent, A. J. R., Cassidy, K. F., and Mark Fanning, C.: Archean gold mineralization synchronous with the final stages of cratonization, Yilgarn Craton, Western Australia, Geology, 24, 879–882, 1996.
Kent, A. J. R., Jacobsen, B., Peate, D. W., Waight, T. E., and Baker, J. A.: Isotope Dilution MC-ICP-MS Rare Earth Element Analysis of Geochemical Reference Materials NIST SRM 610, NIST SRM 612, NIST SRM 614, BHVO-2G, BHVO-2, BCR-2G, JB-2, WS-E, W-2, AGV-1 and AGV-2, Geostand. Geoanal. Res., 28, 417–429, https://doi.org/10.1111/j.1751-908X.2004.tb00760.x, 2004.
Kirkland, C. L., Daly, J. S., Eide, E. A., and Whitehouse, M. J.: Tectonic evolution of the Arctic Norwegian Caledonides from a texturally- and structurally-constrained multi-isotopic (Ar-Ar, Rb-Sr, Sm-Nd, U-Pb) study, Am. J. Sci., 307, 459–526, https://doi.org/10.2475/02.2007.06, 2007.
Kirkland, C. L., Spaggiari, C. V., Pawley, M. J., Wingate, M. T. D., Smithies, R. H., Howard, H. M., Tyler, I. M., Belousova, E. A., and Poujol, M.: On the edge: U–Pb, Lu–Hf, and Sm–Nd data suggests reworking of the Yilgarn craton margin during formation of the Albany-Fraser Orogen, Precambrian Res., 187, 223–247, https://doi.org/10.1016/j.precamres.2011.03.002, 2011.
Kirkland, C. L., Spaggiari, C. V., Smithies, R. H., Wingate, M. T. D., Belousova, E. A., Gréau, Y., Sweetapple, M. T., Watkins, R., Tessalina, S., and Creaser, R.: The affinity of Archean crust on the Yilgarn–Albany-Fraser Orogen boundary: implications for gold mineralisation in the Tropicana Zone, Precambrian Res., 266, 260-281, 2015.
Kirkland, C. L., Yakymchuk, C., Szilas, K., Evans, N., Hollis, J., McDonald, B., and Gardiner, N. J.: Apatite: a U-Pb thermochronometer or geochronometer?, Lithos, 318–319, 143–157, https://doi.org/10.1016/j.lithos.2018.08.007, 2018.
Kirkland, C. L., Yakymchuk, C., Gardiner, N. J., Szilas, K., Hollis, J., Olierook, H., and Steenfelt, A.: Titanite petrochronology linked to phase equilibrium modelling constrains tectono-thermal events in the Akia Terrane, West Greenland, Chem. Geol., 536, 119467, https://doi.org/10.1016/j.chemgeo.2020.119467, 2020.
Kooijman, E., Mezger, K., and Berndt, J.: Constraints on the U–Pb systematics of metamorphic rutile from in situ LA-ICP-MS analysis, Earth Planet. Sc. Lett., 293, 321–330, https://doi.org/10.1016/j.epsl.2010.02.047, 2010.
Kröner, A., Braun, I., and Jaeckel, P.: Zircon geochronology of anatectic melts and residues from a highgrade pelitic assemblage at Ihosy, southern Madagascar: evidence for Pan-African granulite metamorphism, Geol. Mag., 133, 311–323, 1996.
Liu, L., Wang, C., Cao, Y.-T., Chen, D.-L., Kang, L., Yang, W.-Q., and Zhu, X.-H.: Geochronology of multi-stage metamorphic events: Constraints on episodic zircon growth from the UHP eclogite in the South Altyn, NW China, Lithos, 136, 10–26, 2012.
Ludwig, K.: User's manual for Isoplot version 3.75–4.15: a geochronological toolkit for Microsoft, Excel Berkley Geochronological Center Special Publication, 2012.
Martin, H., Smithies, R. H., Rapp, R., Moyen, J. F., and Champion, D.: An overview of adakite, tonalite–trondhjemite–granodiorite (TTG), and sanukitoid: relationships and some implications for crustal evolution, Lithos, 79, 1–24, https://doi.org/10.1016/j.lithos.2004.04.048, 2005.
Matheney, R. K., Brookins, D. G., Wallin, E. T., Shafiqullah, M., and Damon, P. E.: Incompletely reset Rb-Sr systems from a Cambrian red-rock granophyre terrane, Florida Mountains, New Mexico, U.S.A, Chem. Geol., 86, 29–47, https://doi.org/10.1016/0168-9622(90)90004-V, 1990.
McArthur, J. M., Rio, D., Massari, F., Castradori, D., Bailey, T. R., Thirlwall, M., and Houghton, S.: A revised Pliocene record for marine-87Sr/86Sr used to date an interglacial event recorded in the Cockburn Island Formation, Antarctic Peninsula, Palaeogeogr. Palaeoclim., 242, 126–136, https://doi.org/10.1016/j.palaeo.2006.06.004, 2006.
Moens, L. J., Vanhaecke, F. F., Bandura, D. R., Baranov, V. I., and Tanner, S. D.: Elimination of isobaric interferences in ICP-MS, using ion–molecule reaction chemistry: Rb∕Sr age determination of magmatic rocks, a case study, J. Anal. Atom. Spectrom., 16, 991–994, 2001.
Morrissey, L. J., Payne, J. L., Hand, M., Clark, C., Taylor, R., Kirkland, C. L., and Kylander-Clark, A.: Linking the Windmill Islands, east Antarctica and the Albany–Fraser Orogen: Insights from U–Pb zircon geochronology and Hf isotopes, Precambrian Res., 293, 131–149, https://doi.org/10.1016/j.precamres.2017.03.005, 2017.
Morteani, G., Kostitsyn, Y. A., Gilg, H. A., Preinfalk, C., and Razakamanana, T.: Geochemistry of phlogopite, diopside, calcite, anhydrite and apatite pegmatites and syenites of southern Madagascar: evidence for crustal silicocarbonatitic (CSC) melt formation in a Panafrican collisional tectonic setting, Int. J. Earth Sci., 102, 627–645, https://doi.org/10.1007/s00531-012-0832-x, 2013.
Müller, W., Mancktelow, N. S., and Meier, M.: Rb–Sr microchrons of synkinematic mica in mylonites: an example from the DAV fault of the Eastern Alps, Earth Planet. Sc. Lett., 180, 385–397, 2000.
Nebel, O.: Rb–Sr Dating, in: Encyclopedia of Scientific Dating Methods, edited by: Rink, W. J. and Thompson, J., Springer Netherlands, Dordrecht, 1–19, 2013.
Nelson, D. R., Myers, J. S., and Nutman, A. P.: Chronology and evolution of the Middle Proterozoic Albany-Fraser Orogen, Western Australia, Aust. J. Earth Sci., 42, 481–495, https://doi.org/10.1080/08120099508728218, 1995.
Occhipinti, S., Doyle, M., Spaggiari, C., Korsch, R., Cant, G., Martin, K., Kirkland, C., Savage, J., Less, T., and Bergin, L.: Preliminary interpretation of the deep seismic reflection line 12GA-T1: northeastern Albany-Fraser Orogen, Albany-Fraser Orogen seismic and magnetotelluric (MT) workshop 2014: extended abstracts, Preliminary Edn., 44–59, 2014.
Occhipinti, S. A., Tyler, I. M., Spaggiari, C. V., Korsch, R. J., Kirkland, C. L., Smithies, R. H., Martin, K., and Wingate, M. T. D.: Tropicana translated: a foreland thrust system imbricate fan setting for c. 2520 Ma orogenic gold mineralization at the northern margin of the Albany–Fraser Orogen, Western Australia, Geological Society, London, Special Publications, 453, 225–245, 2018.
Olierook, H. K. H., Agangi, A., Plavsa, D., Reddy, S. M., Clark, C., Yao, W.-H., Occhipinti, S. A., and Kylander-Clark, A. R. C.: Neoproterozoic hydrothermal activity in the West Australian Craton related to Rodinia assembly or breakup?, Gondwana Res., 68, 1–12, https://doi.org/10.1016/j.gr.2018.10.019, 2019a.
Olierook, H. K. H., Taylor, R. J. M., Erickson, T. M., Clark, C., Reddy, S. M., Kirkland, C. L., Jahn, I., and Barham, M.: Unravelling complex geologic histories using U–Pb and trace element systematics of titanite, Chem. Geol., 504, 105–122, https://doi.org/10.1016/j.chemgeo.2018.11.004, 2019b.
Paton, C., Hellstrom, J., Paul, B., Woodhead, J., and Hergt, J.: Iolite: Freeware for the visualisation and processing of mass spectrometric data, J. Anal. Atom. Spectrom., 26, 2508–2518, 2011.
Rankenburg, K., Lassiter, J. C., and Brey, G.: Origin of megacrysts in volcanic rocks of the Cameroon volcanic chain–constraints on magma genesis and crustal contamination, Contrib. Mineral. Petr., 147, 129–144, 2004.
Rasmussen, B., Fletcher, I. R., and Muhling, J. R.: In situ U–Pb dating and element mapping of three generations of monazite: unravelling cryptic tectonothermal events in low-grade terranes, Geochim. Cosmochim. Ac., 71, 670–690, 2007.
Renne, P. R., Balco, G., Ludwig, K. R., Mundil, R., and Min, K.: Response to the comment by W. H. Schwarz et al. on “Joint determination of 40K decay constants and 40Ar∗/40K for the Fish Canyon sanidine standard, and improved accuracy for 40Ar∕39Ar geochronology” by PR Renne et al. (2010), Geochim. Cosmochim. Ac., 75, 5097–5100, 2011.
Riley, G. H. and Compston, W.: Theoretical and technical aspects of Rb-Sr geochronology, Geochim. Cosmochim. Ac., 26, 1255–1281, https://doi.org/10.1016/0016-7037(62)90055-8, 1962.
Scibiorski, E., Tohver, E., Jourdan, F., Kirkland, C. L., and Spaggiari, C.: Cooling and exhumation along the curved Albany-Fraser orogen, Western Australia, Lithosphere, 8, 551–563, https://doi.org/10.1130/l561.1, 2016.
Şengün, F., Bertrandsson Erlandsson, V., Hogmalm, J., and Zack, T.: In situ Rb-Sr dating of K-bearing minerals from the orogenic Akçaabat gold deposit in the Menderes Massif, Western Anatolia, Turkey, J. Asian Earth Sci., 185, 104048, https://doi.org/10.1016/j.jseaes.2019.104048, 2019.
Smithies, R., Spaggiari, C., and Kirkland, C.: Building the crust of the Albany-Fraser Orogen; constraints from granite geochemistry, Geological Survey of Western Australia, Perth, WA, 2015.
Smits, R. G., Collins, W. J., Hand, M., Dutch, R., and Payne, J.: A Proterozoic Wilson cycle identified by Hf isotopes in central Australia: Implications for the assembly of Proterozoic Australia and Rodinia, Geology, 42, 231–234, https://doi.org/10.1130/g35112.1, 2014.
Spaggiari, C. V., Bodorkos, S., Barquero-Molina, M., Tyler, I. M., and Wingate, M. T. D.: Interpreted bedrock geology of the south Yilgarn and central Albany-Fraser orogen, Western Australia, Geological Survey of Western Australia, Record, 10, 84 pp., 2009.
Spaggiari, C. V., Kirkland, C. L., Smithies, R. H., and Wingate, M. T. D.: Tectonic links between Proterozoic sedimentary cycles, basin formation and magmatism in the Albany–Fraser Orogen: Geological Survey of Western Australia, Report, 2014.
Spaggiari, C. V., Kirkland, C. L., Smithies, R. H., Wingate, M. T. D., and Belousova, E. A.: Transformation of an Archean craton margin during Proterozoic basin formation and magmatism: The Albany–Fraser Orogen, Western Australia, Precambrian Res., 266, 440–466, https://doi.org/10.1016/j.precamres.2015.05.036, 2015.
Stark, J. C., Wang, X.-C., Li, Z.-X., Rasmussen, B., Sheppard, S., Zi, J.-W., Clark, C., Hand, M., and Li, W.-X.: In situ U-Pb geochronology and geochemistry of a 1.13 Ga mafic dyke suite at Bunger Hills, East Antarctica: The end of the Albany-Fraser Orogeny, Precambrian Res., 310, 76–92, https://doi.org/10.1016/j.precamres.2018.02.023, 2018.
Wingate, M. T. D. and Pidgeon, R.: The Marnda Moorn LIP: A Late Mesoproterozoic Large Igneous Province in the Yilgarn Craton, Western Australia July 2005 LIP of the Month, Large Igneous Provinces Commission, International Association of Volcanology and Chemistry of the Earth's Interior, available at: http://www.largeigneousprovinces.org/05jul (last access: 1 January 2020), 2005.
Tillberg, M., Drake, H., Zack, T., Hogmalm, J., and Åström, M.: In Situ Rb-Sr Dating of Fine-grained Vein Mineralizations Using LA-ICP-MS, Proced. Earth Plan. Sc., 17, 464–467, https://doi.org/10.1016/j.proeps.2016.12.117, 2017.
Tillberg, M., Drake, H., Zack, T., Kooijman, E., Whitehouse, M. J., and Åström, M. E.: In situ Rb-Sr dating of slickenfibres in deep crystalline basement faults, Sci. Rep., 10, 562, https://doi.org/10.1038/s41598-019-57262-5, 2020.
Tischendorf, G., Gottesmann, B., Förster, H.-J., and Trumbull, R. B.: On Li-bearing micas: estimating Li from electron microprobe analyses and an improved diagram for graphical representation, Mineral. Mag., 61, 809–834, 1997.
Tyler, I. M., Spaggiari, C. V., Occhipinti, S. A., Kirkland, C. L., and Smithies, R. H.: Tropicana translated – late Archean to early Paleoproterozoic gold mineralization in the Albany–Fraser Orogen, GSWA 2015 extended abstracts: promoting the prospectivity of Western Australia, Geological Survey of Western Australia, 36–40, 2015.
Vanhaecke, F., De Wannemacker, G., Balcaen, L., and Moens, L.: The use of dynamic reaction cell ICP mass spectrometry to facilitate Rb-Sr age determination, Geological Society, London, Special Publications, 220, 173–181, 2003.
Villa, I. M., De Bièvre, P., Holden, N. E., and Renne, P. R.: IUPAC-IUGS recommendation on the half life of 87Rb, Geochim. Cosmochim. Ac., 164, 382–385, https://doi.org/10.1016/j.gca.2015.05.025, 2015.
Wang, X.-C., Li, Z.-X., Li, J., Pisarevsky, S. A., and Wingate, M. T. D.: Genesis of the 1.21 Ga Marnda Moorn large igneous province by plume–lithosphere interaction, Precambrian Res., 241, 85–103, https://doi.org/10.1016/j.precamres.2013.11.008, 2014.
Woodhead, J. D. and Hergt, J. M.: Strontium, neodymium and lead isotope analyses of NIST glass certified reference materials: SRM 610, 612, 614, Geostandard. Newslett., 25, 261–266, 2001.
Zack, T. and Hogmalm, K. J.: Laser ablation Rb∕Sr dating by online chemical separation of Rb and Sr in an oxygen-filled reaction cell, Chem. Geol., 437, 120–133, https://doi.org/10.1016/j.chemgeo.2016.05.027, 2016.
Zack, T. and Kooijman, E.: Petrology and Geochronology of Rutile, Rev. Mineral. Geochem., 83, 443–467, https://doi.org/10.2138/rmg.2017.83.14, 2017.