the Creative Commons Attribution 4.0 License.
the Creative Commons Attribution 4.0 License.
 | 04 Nov 2020
Luminescence properties and dating of glacial to periglacial sediments from northern Switzerland
Daniela Mueller
Frank Preusser
Marius W. Buechi
Lukas Gegg
Gaudenz Deplazes
Luminescence dating has become a pillar of the understanding of Pleistocene glacial advances in the northern foreland of the Swiss Alps. However, both quartz and feldspar from the region are equally challenging as dosimeters with anomalous fading and partial bleaching being some of the obstacles to overcome for the establishment of decisive chronologies. In this study, luminescence properties of coarse- and fine-grained quartz, feldspar, and polymineral fractions of eight samples from a palaeovalley, Rinikerfeld in northern Switzerland, are systematically assessed. Standard performance tests are conducted on all four fractions. Deconvolution of luminescence signals of the quartz fractions is implemented and shows the dominance of stable fast components. Reader-specific low preheat temperatures are investigated on the infrared stimulated luminescence (IRSL) signal of feldspar. Thermal stability of this signal is found for low preheats, and thermal quenching could be excluded for higher preheats. However, anomalous fading is observed in the feldspar and polymineral IRSL signals and two correction approaches are applied. For one approach, fading corrected coarse-grained feldspar ages are consistent with those derived from quartz. In general, coarse-grained quartz and feldspar, as well as the fine-grained polymineral fraction of one sample, are in chrono-stratigraphic agreement and present negligible evidence for partial bleaching. However, ages derived from fine-grained quartz are found to underestimate those of the coarse-grained quartz fractions. Hence, the impact of alpha efficiency and water content on the dose rate and thus the ages are assessed. A finite explanation for the observed discrepancies remains lacking, but this systematic investigation of different luminescence signals allows for the establishment of a chronology for the palaeovalley fill dating back to at least Marine Isotope Stage 6 (MIS 6).
- Article
(9328 KB) - Full-text XML
- BibTeX
- EndNote


Pleistocene glaciations in the northern foreland of the Swiss Alps have been studied since the early 19th century (summarised in Preusser et al., 2011). Whereas it appears that a minimum of eight glacial advances have shaped the lowlands, consensus on the exact number and timing is still lacking. During the last 3 decades, numerical dating has become a crucial component in the reconstruction of the environmental past of northern Switzerland (e.g. Preusser, 1999a; Graf et al., 2007; Kock et al., 2009; Dehnert et al., 2012). In particular, luminescence dating has become a pillar of chrono-stratigraphy and understanding of glacial advances (Preusser et al., 2011). However, luminescence dating of glacial and proglacial deposits can be complex (e.g. Duller, 1994, 2006; Spencer and Owen, 2004). For one, in such environments sediment sources and sinks are often within a short distance of each other and transport may occur in turbid waters, both of which reduces the chance for grains to experience sufficient sunlight exposure to reset or bleach any pre-existing luminescence signals. This effect will consequently lead to age overestimation and requires consideration in such deposits. The measurement of single grains or small aliquots has been advised to allow for monitoring of luminescence signal, commonly presented as equivalent dose (De) distributions and the isolation of a proportion of the De distributions that is considered well bleached (e.g. Olley et al., 2004; Duller, 2006; Trauerstein et al., 2017). The optically stimulated luminescence (OSL) signal of quartz is more readily bleachable than that of feldspar (Godfrey-Smith et al., 1988; Murray et al., 2012), and hence it is favoured as a dosimeter (e.g. Lowick et al., 2015). But, to assess partial bleaching of samples from northern Switzerland, Trauerstein et al. (2017) have recommended the comparison of luminescence signals obtained from both dosimeters. However, quartz and feldspar from the region have found to be equally challenging for dating.
For quartz from the wider region, unstable components were reported for some (e.g. Klasen et al., 2016) but not all samples (e.g. Gaar et al., 2013). Moreover, laboratory dose response curves for quartz were often best fitted with a double-saturating exponential function that accounts for high dose responses beyond single exponential behaviour (Lowick et al., 2010; Dehnert et al., 2012). This phenomenon is also known for samples from other regions where luminescence ages are either in agreement (e.g. Murray et al., 2008; Pawley et al., 2010) or disagreement (e.g. Lai, 2010; Timar et al., 2010; Timar-Gabor et al., 2011) with independent age control. However, the physical reason for this behaviour has yet to be identified (Wintle, 2008). In northern Switzerland, quartz luminescence ages of up to (but not beyond) ca. 250 ka have been found to be reliable (Anselmetti et al., 2010; Dehnert et al., 2012; Lowick et al., 2015; Buechi et al., 2017). Hence, this approach is not suitable to establish an independent chronology for the recently modified Mid-Pleistocene glaciation history (Graf, 2009; Preusser et al., 2011).
While feldspar requires more time to reset the signal prior to deposition, it is known to saturate at higher doses and therefore often allows one to date much older deposits than quartz (cf. Duller, 1997). Yet, the infrared stimulated luminescence signal of feldspar measured at 50 ∘C (IRSL) often suffers from anomalous fading, contributing to age underestimation (Wintle, 1973; Spooner, 1994). Different approaches to determine and account for the loss of signal over time have been proposed (Huntley and Lamothe, 2001; Auclaire et al., 2003; Lamothe et al., 2003; Huntley, 2006; Kars et al., 2008). These approaches rely on observing signal loss over hours to days within laboratory experiments and from this data the signal loss that has occurred over geological timescales is deduced. In such storage tests, fading has been observed for most samples from northern Switzerland with g-values between 1 % and 3 % per decade (Dehnert et al., 2012; Lowick et al., 2012, 2015; Gaar and Preusser, 2012) and 2.7±0.3 % per decade (normalised to 2 d; Buechi et al., 2017). However, (1) uncorrected IRSL De values were beyond the linear part of the dose response curve and therefore unsuited for most fading correction approaches, (2) corrected IRSL De values were close to saturation and consequently rejected for age determination, or (3) uncorrected feldspar ages were in better agreement with quartz ages and therefore favoured (Dehnert et al., 2012; Lowick et al., 2012, 2015; Gaar and Preusser, 2012; Buechi et al., 2017). Only Gaar et al. (2013) found correcting for fading appropriate and necessary for samples < 100 ka. For dating of older samples, Lowick et al. (2012) tested alternative measurement protocols that target signals that are more stable than the IRSL signal, the post-infrared infrared stimulated luminescence signals (pIRIR). The pIRIR signals are measured at higher temperatures after an initial readout of IRSL signals at 50 ∘C (Thomsen et al., 2008; Buylaert et al., 2011; Thiel et al., 2011). While fading is expected to decrease or become negligible for the more stable pIRIR signals, these take longer to bleach by sunlight during transport. For the selected pIRIR225 and pIRIR290 signals, fading was still observed and age overestimations led to the conclusion that these approaches are not beneficial for the investigated water-lain sediments from northern Switzerland (Lowick et al., 2012).
Here, luminescence properties of samples from the Rinikerfeld in the northern foreland of the Swiss Alps are assessed. Scientific drilling was conducted at a stratigraphic key site within the former glacier forefield as part of a larger campaign. The campaign aims to acquire further insights into the long-term glacial and fluvial landscape evolution of northern Switzerland. Modelling of future erosion scenarios will be based on the gained knowledge and thereby assist in the assessment of the safest and most suitable location for a prospective Swiss nuclear waste depository. For this, the establishment of a chrono-stratigraphy is essential, and hence dating is a crucial component. Therefore, feldspar, polymineral, and fine- and coarse-grained quartz are investigated to exploit the dating potential of the samples from this site. Performance tests, signal intensity and composition of quartz, and signal and fading properties of feldspar are discussed, and two approaches to correct for fading are applied. Eventually ages are derived and discussed with regard to problems found for other studies of the region. For ease of reading, methods, results and discussion are jointly presented in aspect specific subsections.
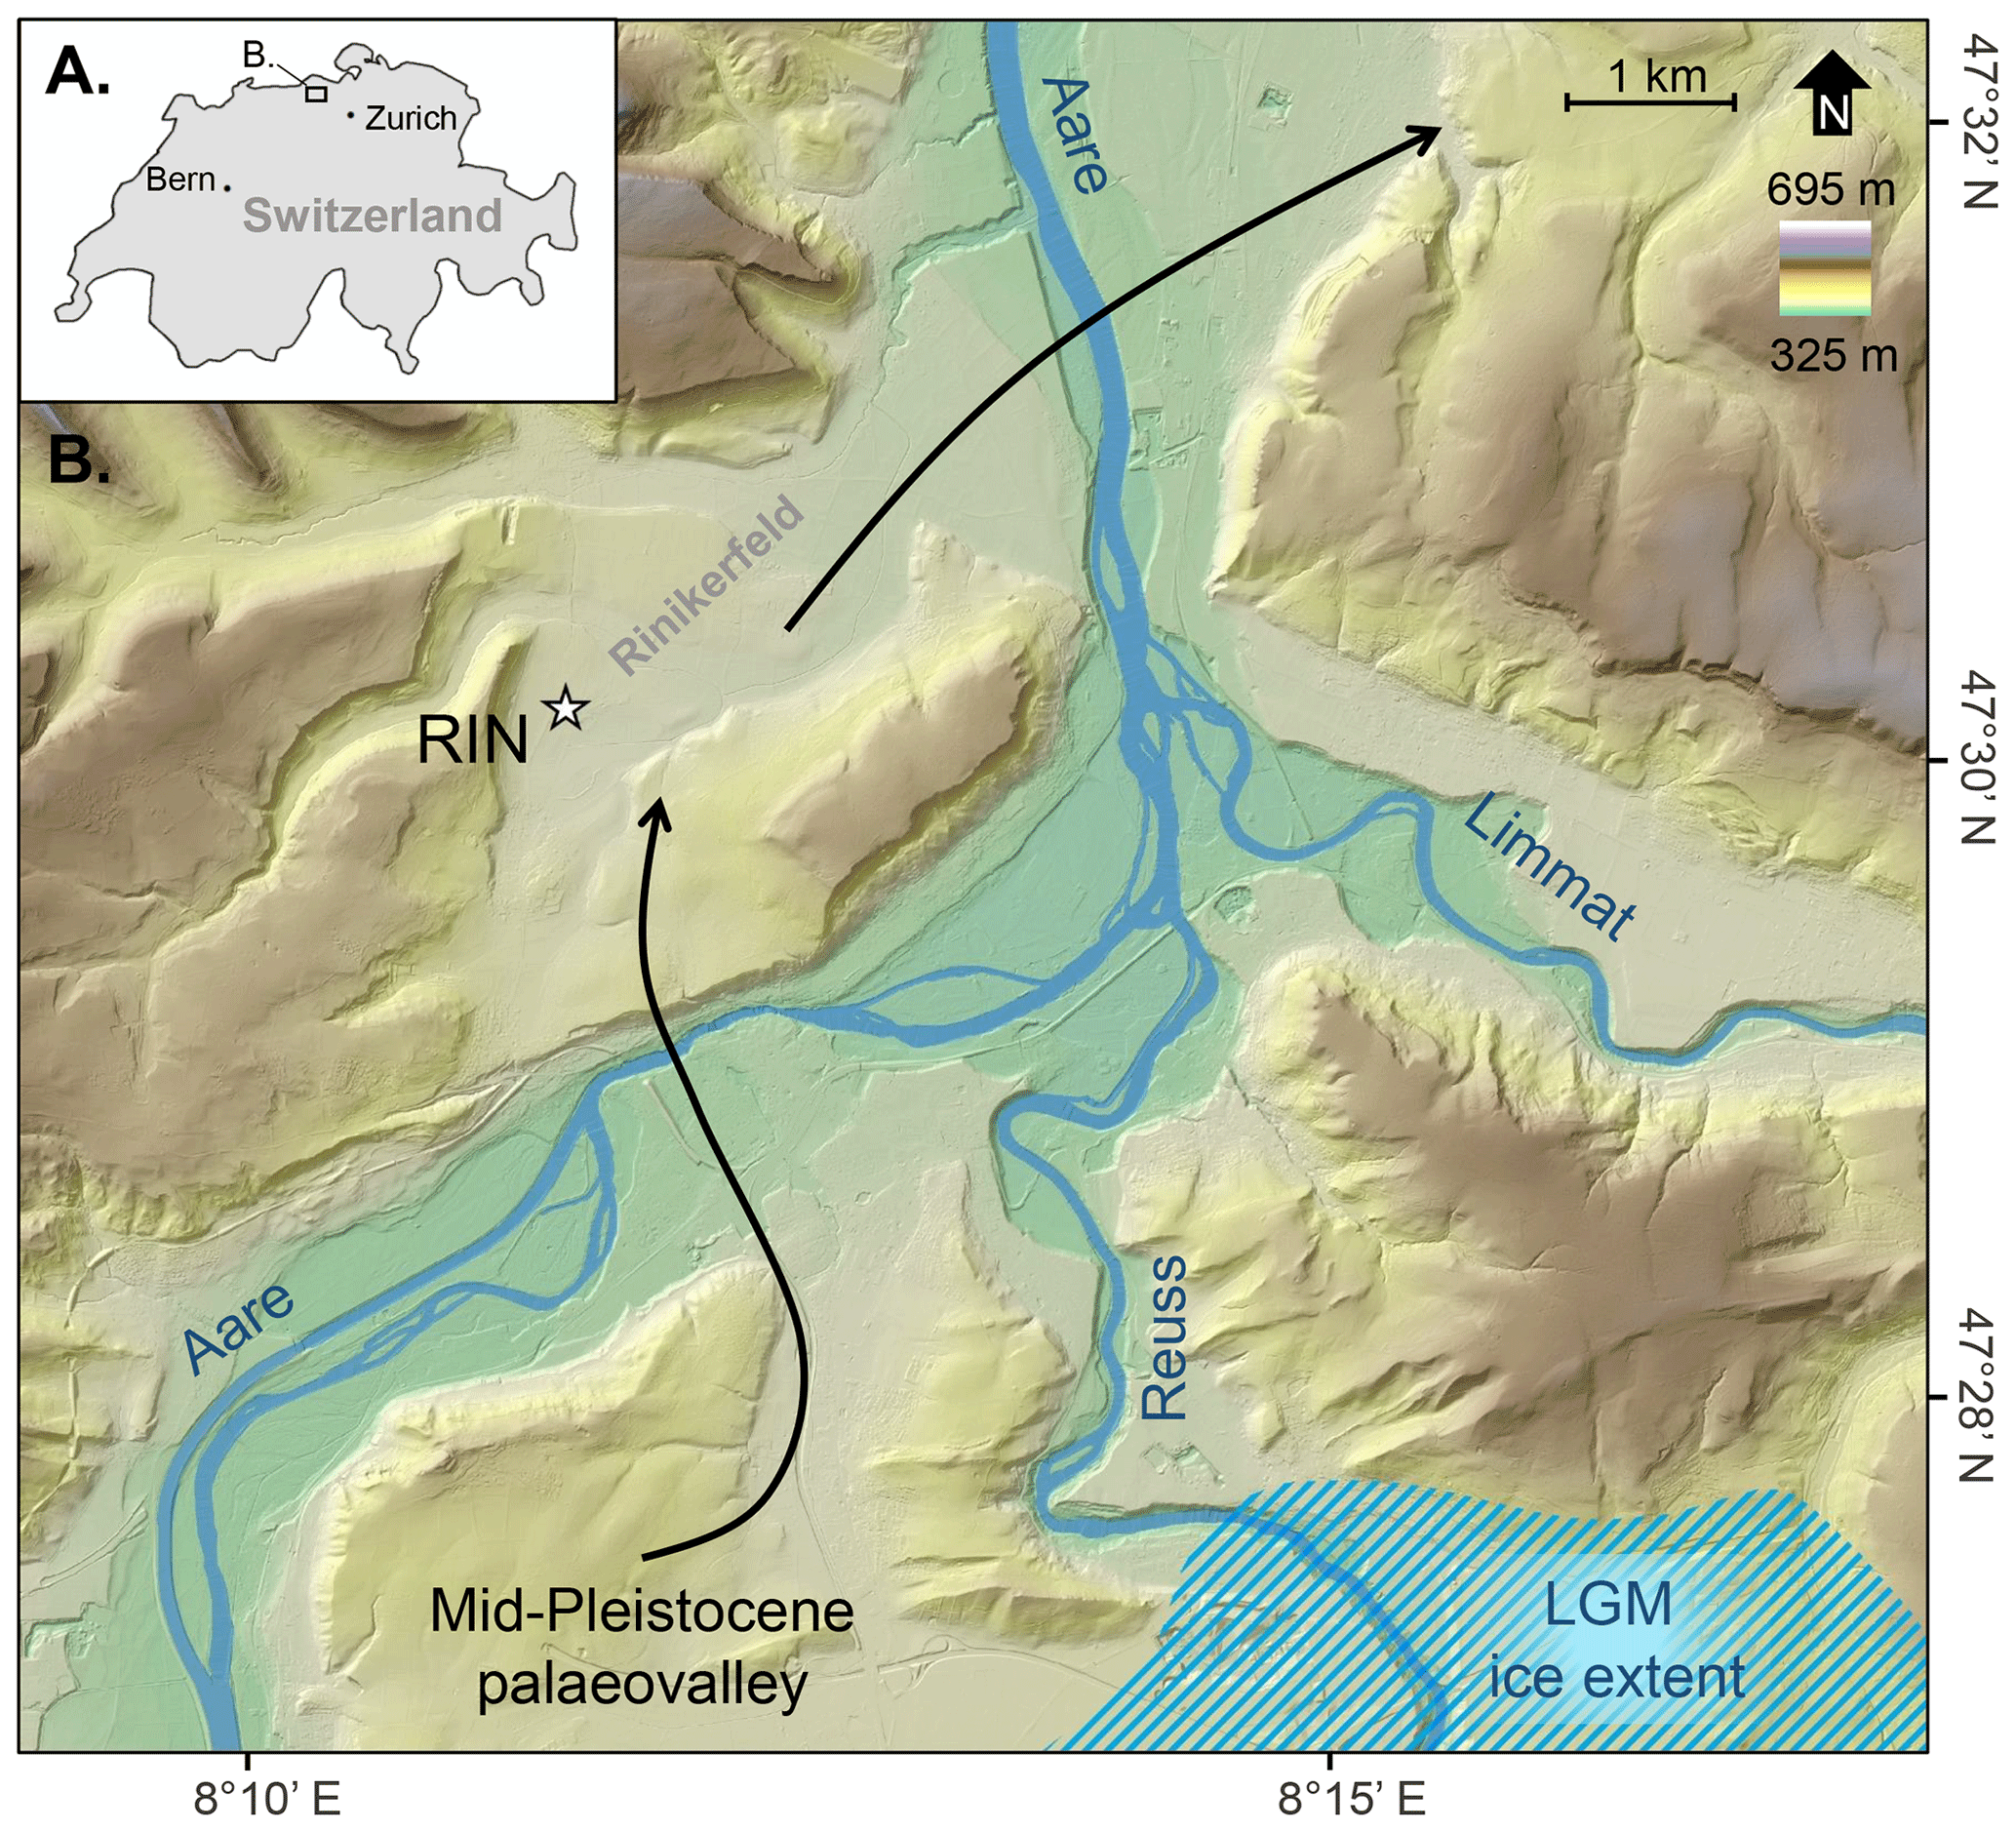
Figure 1(a) Location of the study area within Switzerland. (b) Overview of the study area and drill site.
The study site (Fig. 1) is located within the Rinikerfeld, at the eastern tail of the Jura Mountains, about 30 km NW of Zurich. Rinikerfeld is part of an extensive palaeovalley structure and situated in an elevated position, ca. 50 m above the nearby present-day Lower Aare Valley. At the site, the palaeovalley is carved into Mesozoic bedrock and presumed to be of Mid-Pleistocene age (Bitterli-Dreher et al., 2007; Graf, 2009). It was spared from glacial overprint during the Last Glacial Maximum (Bini et al., 2009); however, the outermost ice margins of preceding glaciations were found to the north of the study area (cf. Preusser et al., 2011), suggesting a glacial to periglacial sedimentary nature of the palaeovalley fill.
About 40 m of Quaternary sediments are overlying the bedrock (carbonaceous marl) and were recovered in a composite core (Fig. 2) within a scientific drilling campaign (Gegg et al., 2018). At its base, the composite core consists of about 4 m of glacial diamicton overlain by ca. 2 m of glacial or glacier-proximal sandy gravel that contains frequent angular, faceted and (in the lowest part) striated clasts. This unit transitions into ca. 24 m of lacustrine clay and silt. The interbedded gravelly sand and silt at the bottom of the lacustrine unit suggest an initial dominance of deposition by traction currents, possibly in a glaciolacustrine or deltaic setting. Relatively homogeneous laminated sediments in the rest of the lacustrine unit indicate suspension settling and low-energy currents. Towards the top, the lacustrine unit progressively coarsens and is capped by ca. 4.6 m of interbedded gravelly and sandy diamictons that are rich in locally derived angular clasts. This heterogeneous unit is likely to represent a mix of fluvial and colluvial deposits possibly deposited in a periglacial setting (Raab et al., 2007).
For luminescence dating, samples were obtained from ca. 10 cm diameter cores recovered in plastic liners (Table 1). A total of eight samples were taken: three samples from the gravelly to sandy diamicton unit (RIN1, 2, 3), one sample of lacustrine sands (RIN4), and one sample of gravelly sand and silt (RIN13). The two latter samples bracket the fine-grained lacustrine unit, whereof another three samples were taken (RIN5, 6, 8). Sample material was collected in ca. 10 cm segments, whereby the outer rind and the surface, exposed to daylight during core cutting and splitting, were allocated for dose rate determination, and the inner core was used for De determination.
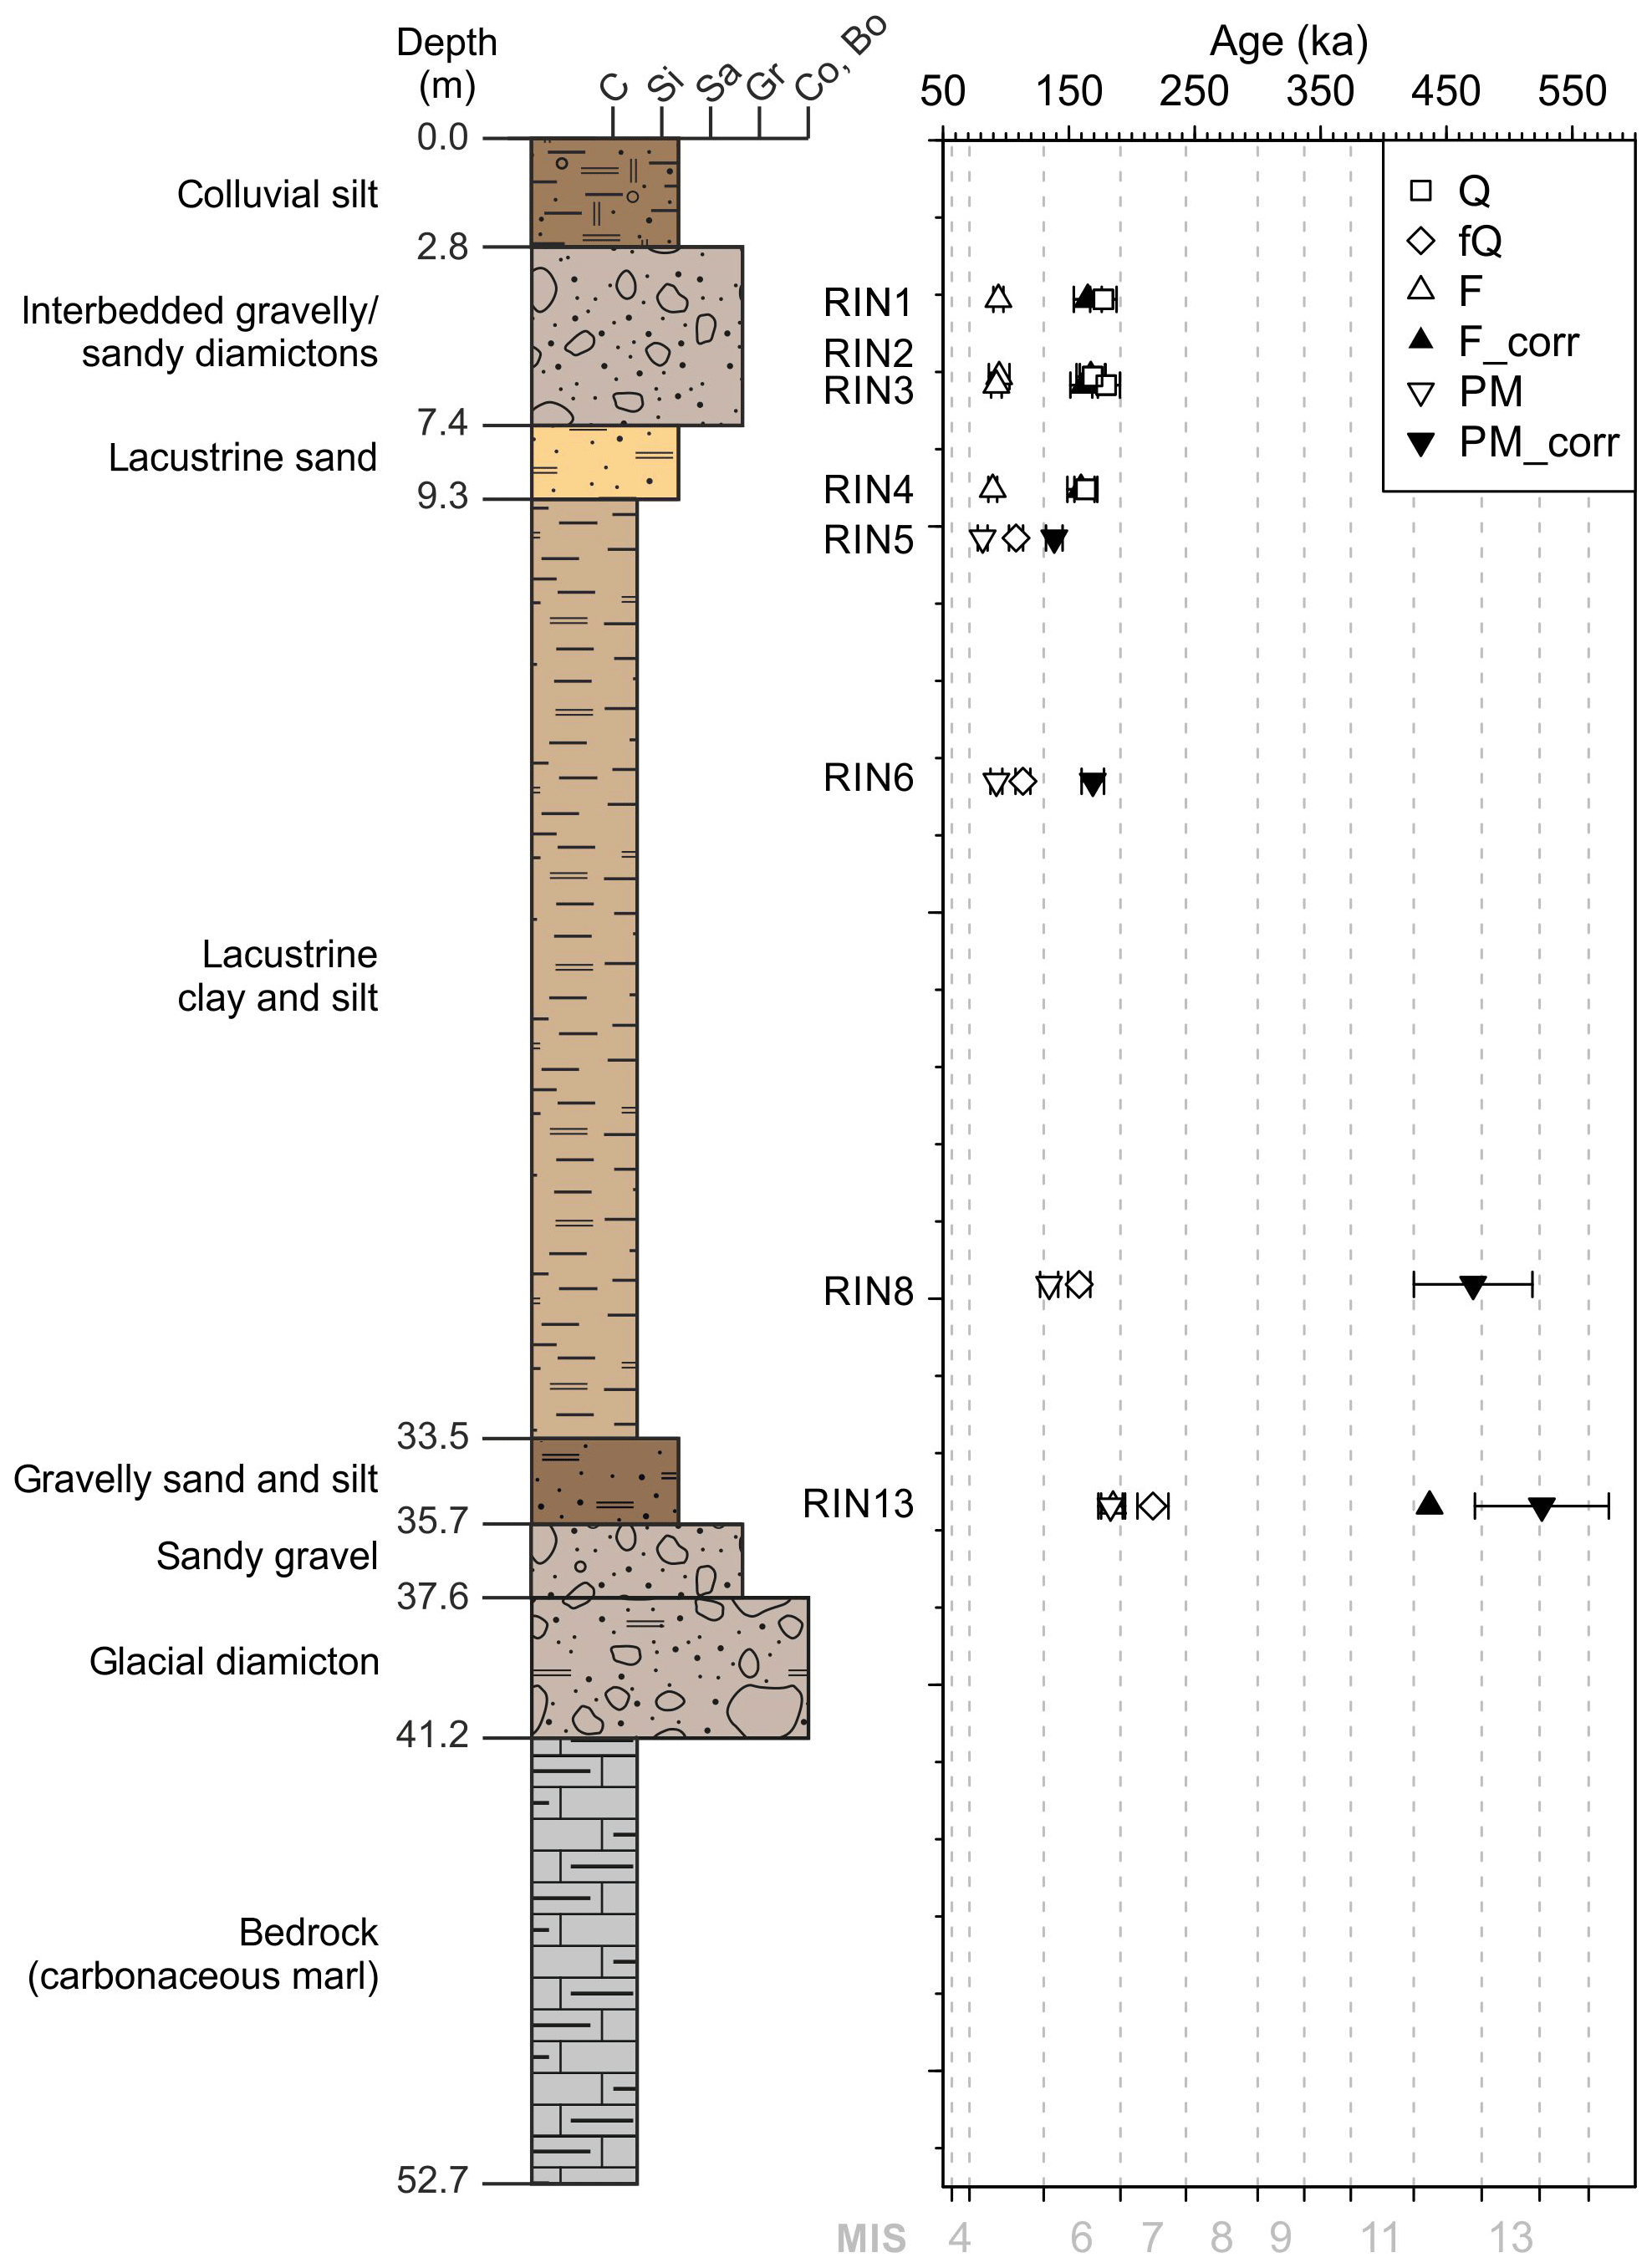
Figure 2Core log and age–depth model of the investigated site. Ages for all minerals and fractions are presented with 1σ uncertainty. Fading corrected ages are calculated following Kars et al. (2008). Grain size fractions are subdivided into clay (C), silt (Si), sand (Sa), gravel (Gr), and a combined fraction of cobbles and boulders (Co, Bo).
Table 1De values and derived ages for all samples; 1σ uncertainties are given. Presented values are obtained using the central age model (CAM, Galbraith et al., 1999). The number of accepted and measured aliquots is provided by n. The measured mineral, i.e. coarse-grained quartz (Q), fine-grained quartz (fQ), feldspar (F), and polymineral (PM), is given by M. Ages to be considered for chrono-stratigraphic interpretation are presented in bold.
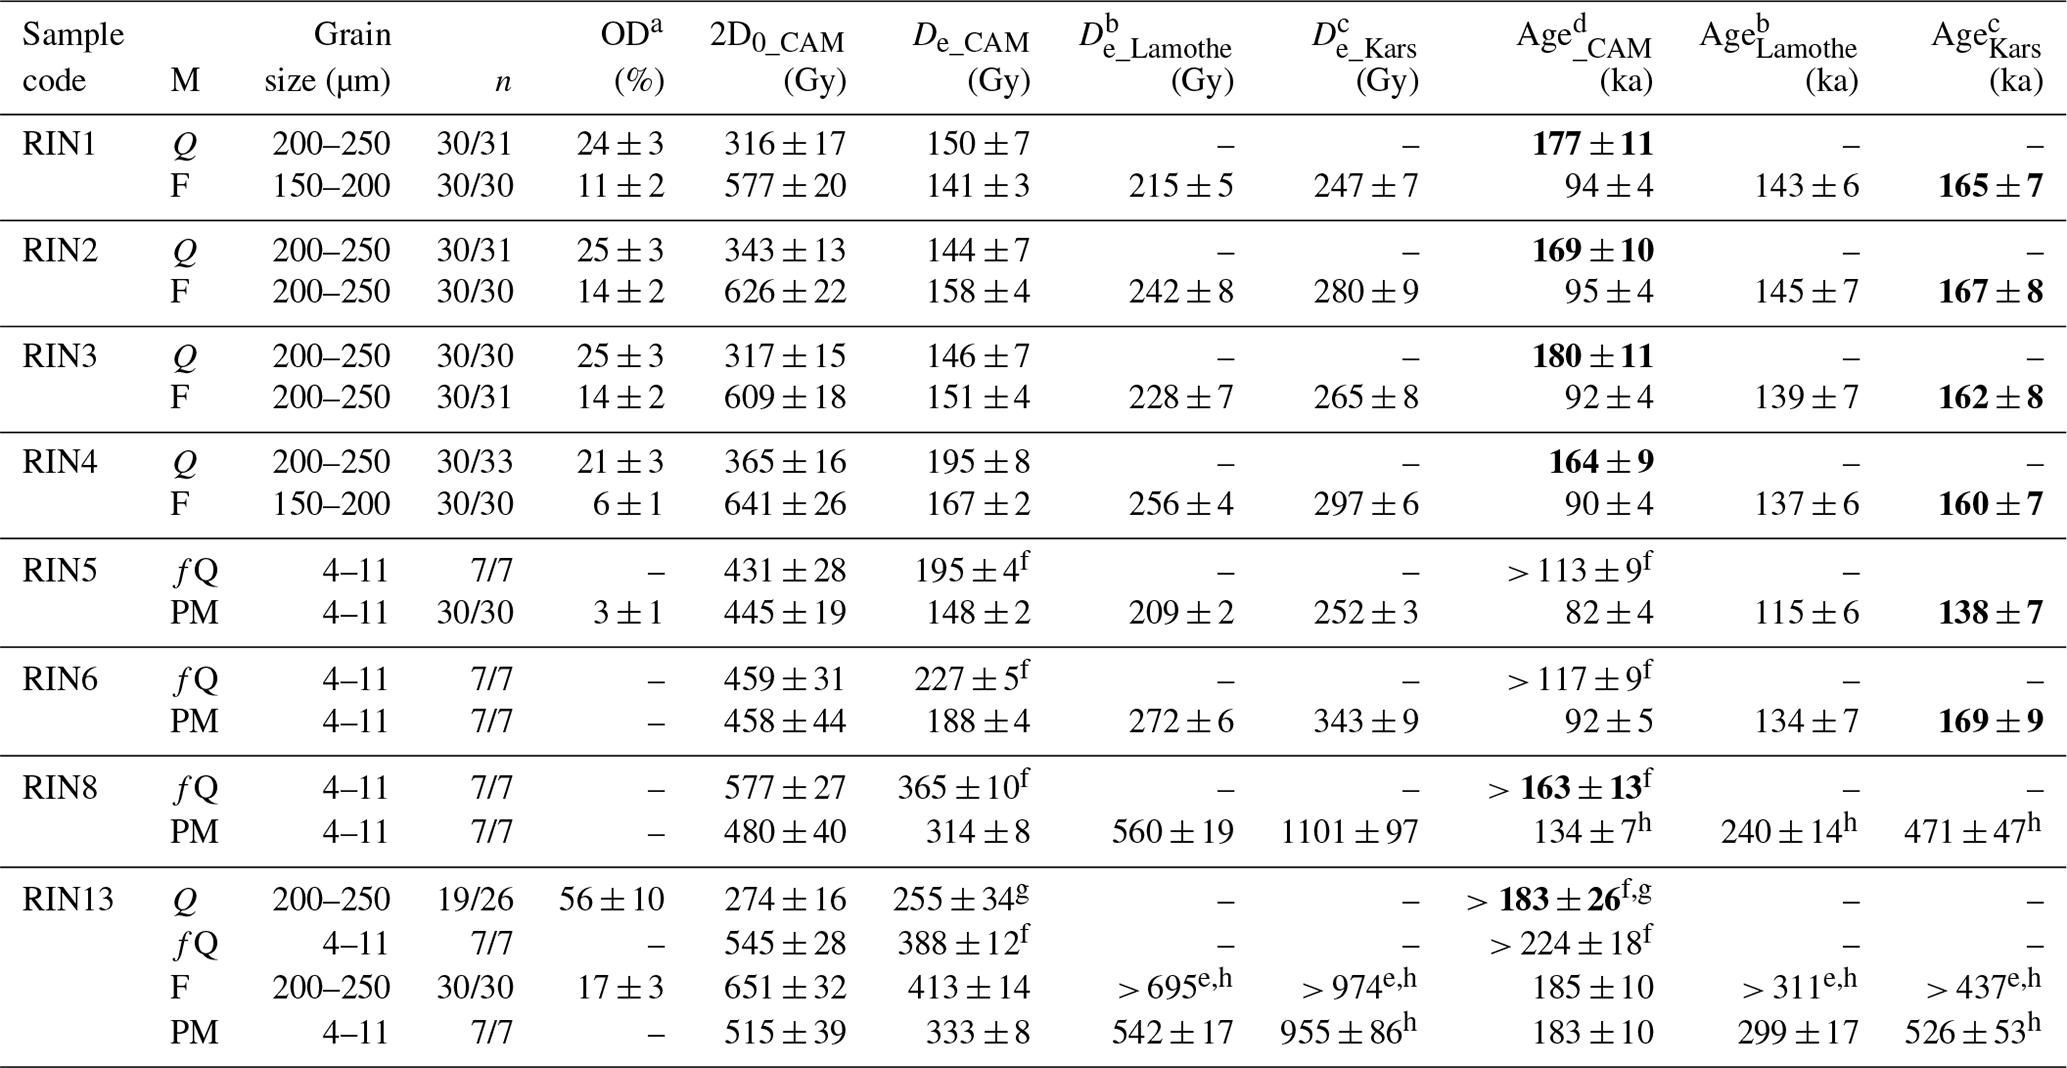
a Overdispersion was calculated using the CAM (Galbraith et al., 1999). b A g-value (normalised to 2 d) of 3.1±0.6 was used for F of RIN1 to RIN4 and RIN13, and a g-value of 2.4±0.6 was used for PM of RIN5 to RIN13. c A ρ′-value of was used for F of RIN1 to RIN4 and RIN13, and a ρ′-value of was used for PM of RIN5 to RIN13. d Ages were calculated using the weighted mean of the uncorrected De values derived with the CAM (Galbraith et al., 1999). e Out of 30 measured aliquots, 12 (Lamothe-corrected) and 19 (Kars-corrected) aliquots are in saturation following fading correction, and therefore the values shown are derived using a CAM on a truncated distribution. f Regarded to be minimum estimates due to chrono-stratigraphic reasons. g Derived CAM is based on a truncated distribution, and results should be considered as minima. h Based on De values beyond 2×D0.
To determine De values, samples were wet-sieved and treated with HCl and H2O2 to remove carbonates and organic matter, respectively. Of five samples (RIN1 to RIN4 and RIN13), coarse-grained (150–200 and 200–250 µm) potassium-rich feldspar (F) and quartz (Q) were separated using sodium polytungstate at densities of 2.58 and 2.7 g cm−3. The outer rind of the quartz grains was etched in 40 % hydrofluoric acid (HF) for 1 h, followed by a 32 % HCl treatment for another hour to eliminate any fluoride precipitates. For the remaining three samples (RIN5, 6, 8) and RIN13, the fine-grained fraction (4–11 µm) was separated using settling under Stokes' Law. One half of the sample remained pristine as polymineral fraction (PM), while the other half was treated with hexafluorosilicic acid for 7 d in order to obtain purified quartz (fQ). The fine-grained fractions were suspended in acetone and settled onto cups of 9.8 mm in diameter (> 106 grains). For the coarse-grained fractions, sample material was mounted onto cups using silicon oil stamps with diameters of 1 mm for feldspar and 4 mm for quartz (ca. 13 and 200 grains, respectively).
De values were obtained with a Freiberg Instruments Lexsyg Research reader using LEDs with peak emission at 458 nm (blue-light stimulated luminescence, BSL) for quartz and at 850 nm (IRSL) for feldspar and polymineral. BSL and IRSL signals were detected by an ET9235QB photomultiplier tube filtered through a 2.5 mm Hoya U-340 glass combined with a 5 mm Delta-BP 365/50 EX-interference filter or a 3 mm BG 39 Schott glass and a 3.5 mm HC 414/46-1 AHF Brightline interference filter (referred to as “410 nm filter combination”), respectively. Additionally, a cardboard barrier was mounted into the filter wheel for IRSL measurements (for details, see Sect. 4.2). Laboratory irradiation was given by a 90Sr ∕ 90Y beta source mounted into the reader. The beta source was calibrated using Risø calibration quartz batches 108 (4–11 µm) and 118 (180–250 µm) to ca. 0.10 and 0.11 Gy s−1, respectively. Measurements with the electron-multiplying charge-coupled device (EMCCD) were conducted using an Andor iXon Ultra 897 camera mounted to the Lexsyg Research.
Notable is the preheat behaviour of the used Lexsyg Research reader (Lexsyg ID 090020): at a heating rate of 5 ∘C s−1, the so-called 110 ∘C thermoluminescence (TL) peak emerges at much lower temperatures than expected. For example, for Risø calibration quartz (batch 118) TL counts peak at 87±3 ∘C during preheat. This is in agreement with observations made by Schmidt et al. (2018b), who compared the preheat behaviour of various OSL readers and discovered the appearance of the 110 ∘C TL peak within a range of 60 ∘C. This has to be considered when assessing appropriate measurement protocols (see Sect. 4).
Table 2Dosimetric data and total dose rates as used for age determination (all values are given with 1 σ uncertainties).
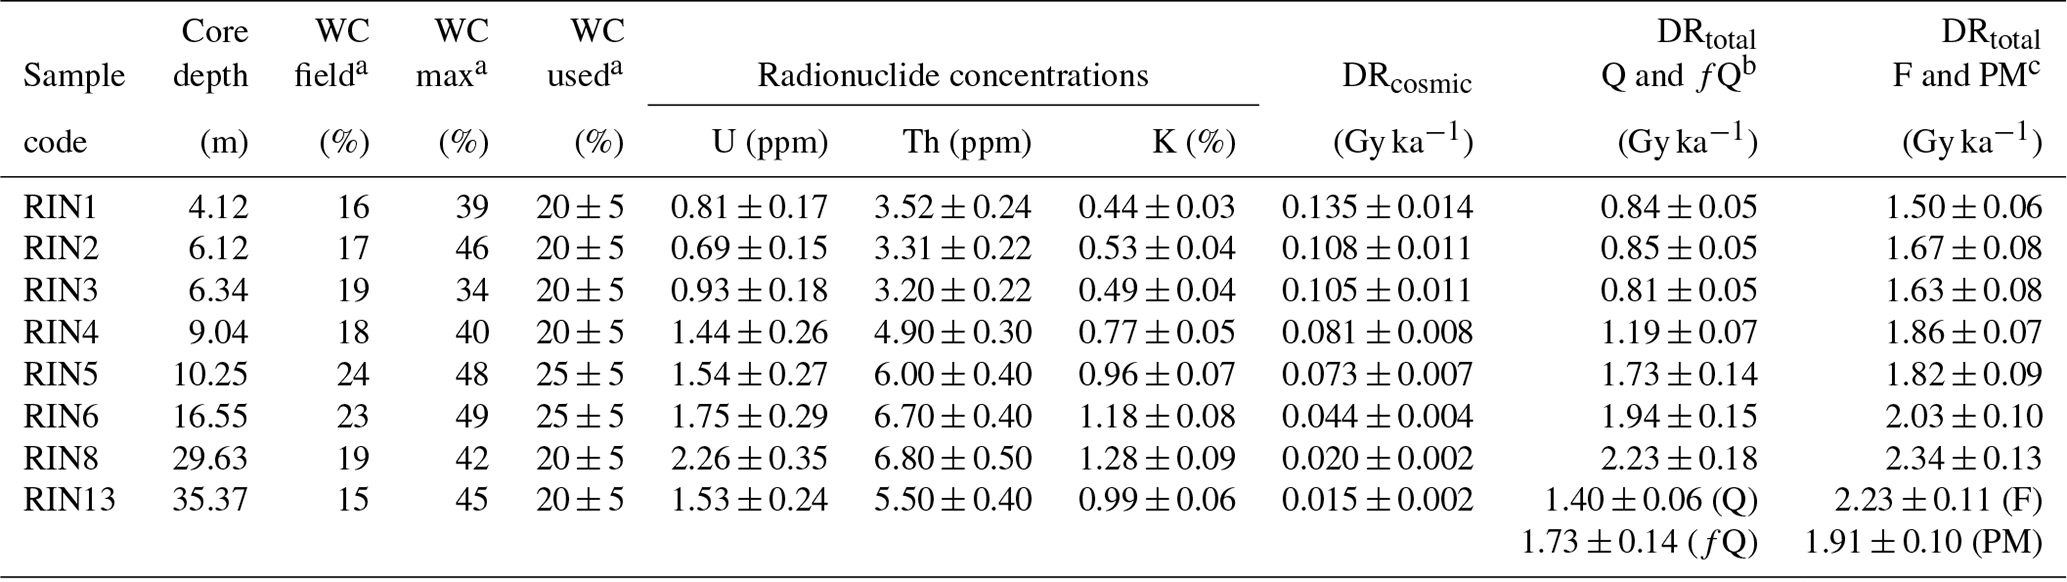
a Water content (WC) as measured from the samples (field), and maximum absorption capacity as measured in laboratory tests (max) and as used for De determination. b Alpha efficiency of 0.04 ± 0.02 was assumed for fQ. c Alpha efficiency of 0.05 ± 0.01 and internal potassium content of 12.5 % ± 0.5 % were assumed.
For dose rate determination (Table 2), sample material was dried and radionuclide content was determined via high-resolution gamma-ray spectrometry at VKTA (Dresden, Germany). In absence of evidence for radioactive disequilibrium (cf. Degering and Degering, 2020), only contents used for dose rate determination are presented in Table 2. A mean alpha efficiency factor of 0.04±0.02 (a-value) was assumed for all fQ following Buechi et al. (2017). An a-value of 0.05±0.01 was applied for the F and PM fractions (Preusser, 1999a, b; Preusser et al., 2001). For the two latter fractions an internal potassium content of 12.5 %±0.5 % was used (Huntley and Baril, 1997). The cosmic contribution was determined for present-day depths following Prescott and Hutton (1994). Water content relative to the dry weight of the sample and capacity of water absorption (DIN 18132:2012-04, 2016) were determined in the laboratory. Representative long-term water content estimates of 20 to 25 %±5 % were used for total dose rate (DRtotal) determination. Age calculations were conducted with ADELE 2017 software (https://www.add-ideas.com/, last access: 1 February 2020; Degering and Degering, 2020).
Performance tests were conducted on both the coarse- and fine-grained fractions of two representative samples (RIN2Q, RIN2F, RIN5fQ, RIN5PM). Preheat plateau tests were carried out on the natural dose while for thermal transfer and dose recovery tests, sample material was exposed to a daylight lamp for 16 h (Q, fQ) to 30 h (F, PM). All performance tests and measurements were conducted using preheating prior to the natural, regenerative and test doses for which the aliquots were heated with 5 ∘C s−1 to the tested temperature and held for 10 s (Q, fQ) or 60 s (F, PM).
Both BSL and IRSL measurements were conducted following the single-aliquot regenerative-dose (SAR) protocol (Murray and Wintle, 2000) with test doses of ca. 46 and ca. 23 Gy administered, respectively. The initial signal was derived from the first 0.4 s of the BSL and the first 15 s of the IRSL signals. A late background subtraction using the last 40 s (BSL) or 50 s (IRSL) was applied. De values were calculated using the numOSL package for R (Peng et al., 2018).
For Q and fQ, an IR depletion ratio step (> 20 %) was implemented at the end of each sequence to check the adequacy of the sensitivity correction and for feldspar contamination. A maximum of four aliquots per sample failed this rejection criterion. None of the measured Q, fQ, F and PM aliquots presented dim (< 3 × background level) or imprecise (> 20 %) test dose signals and were hence accepted. For RIN3 F, one aliquot was rejected as it failed the recycling ratio test (> 20 %), and for RIN13 Q, three aliquots were rejected as their De values were in saturation.
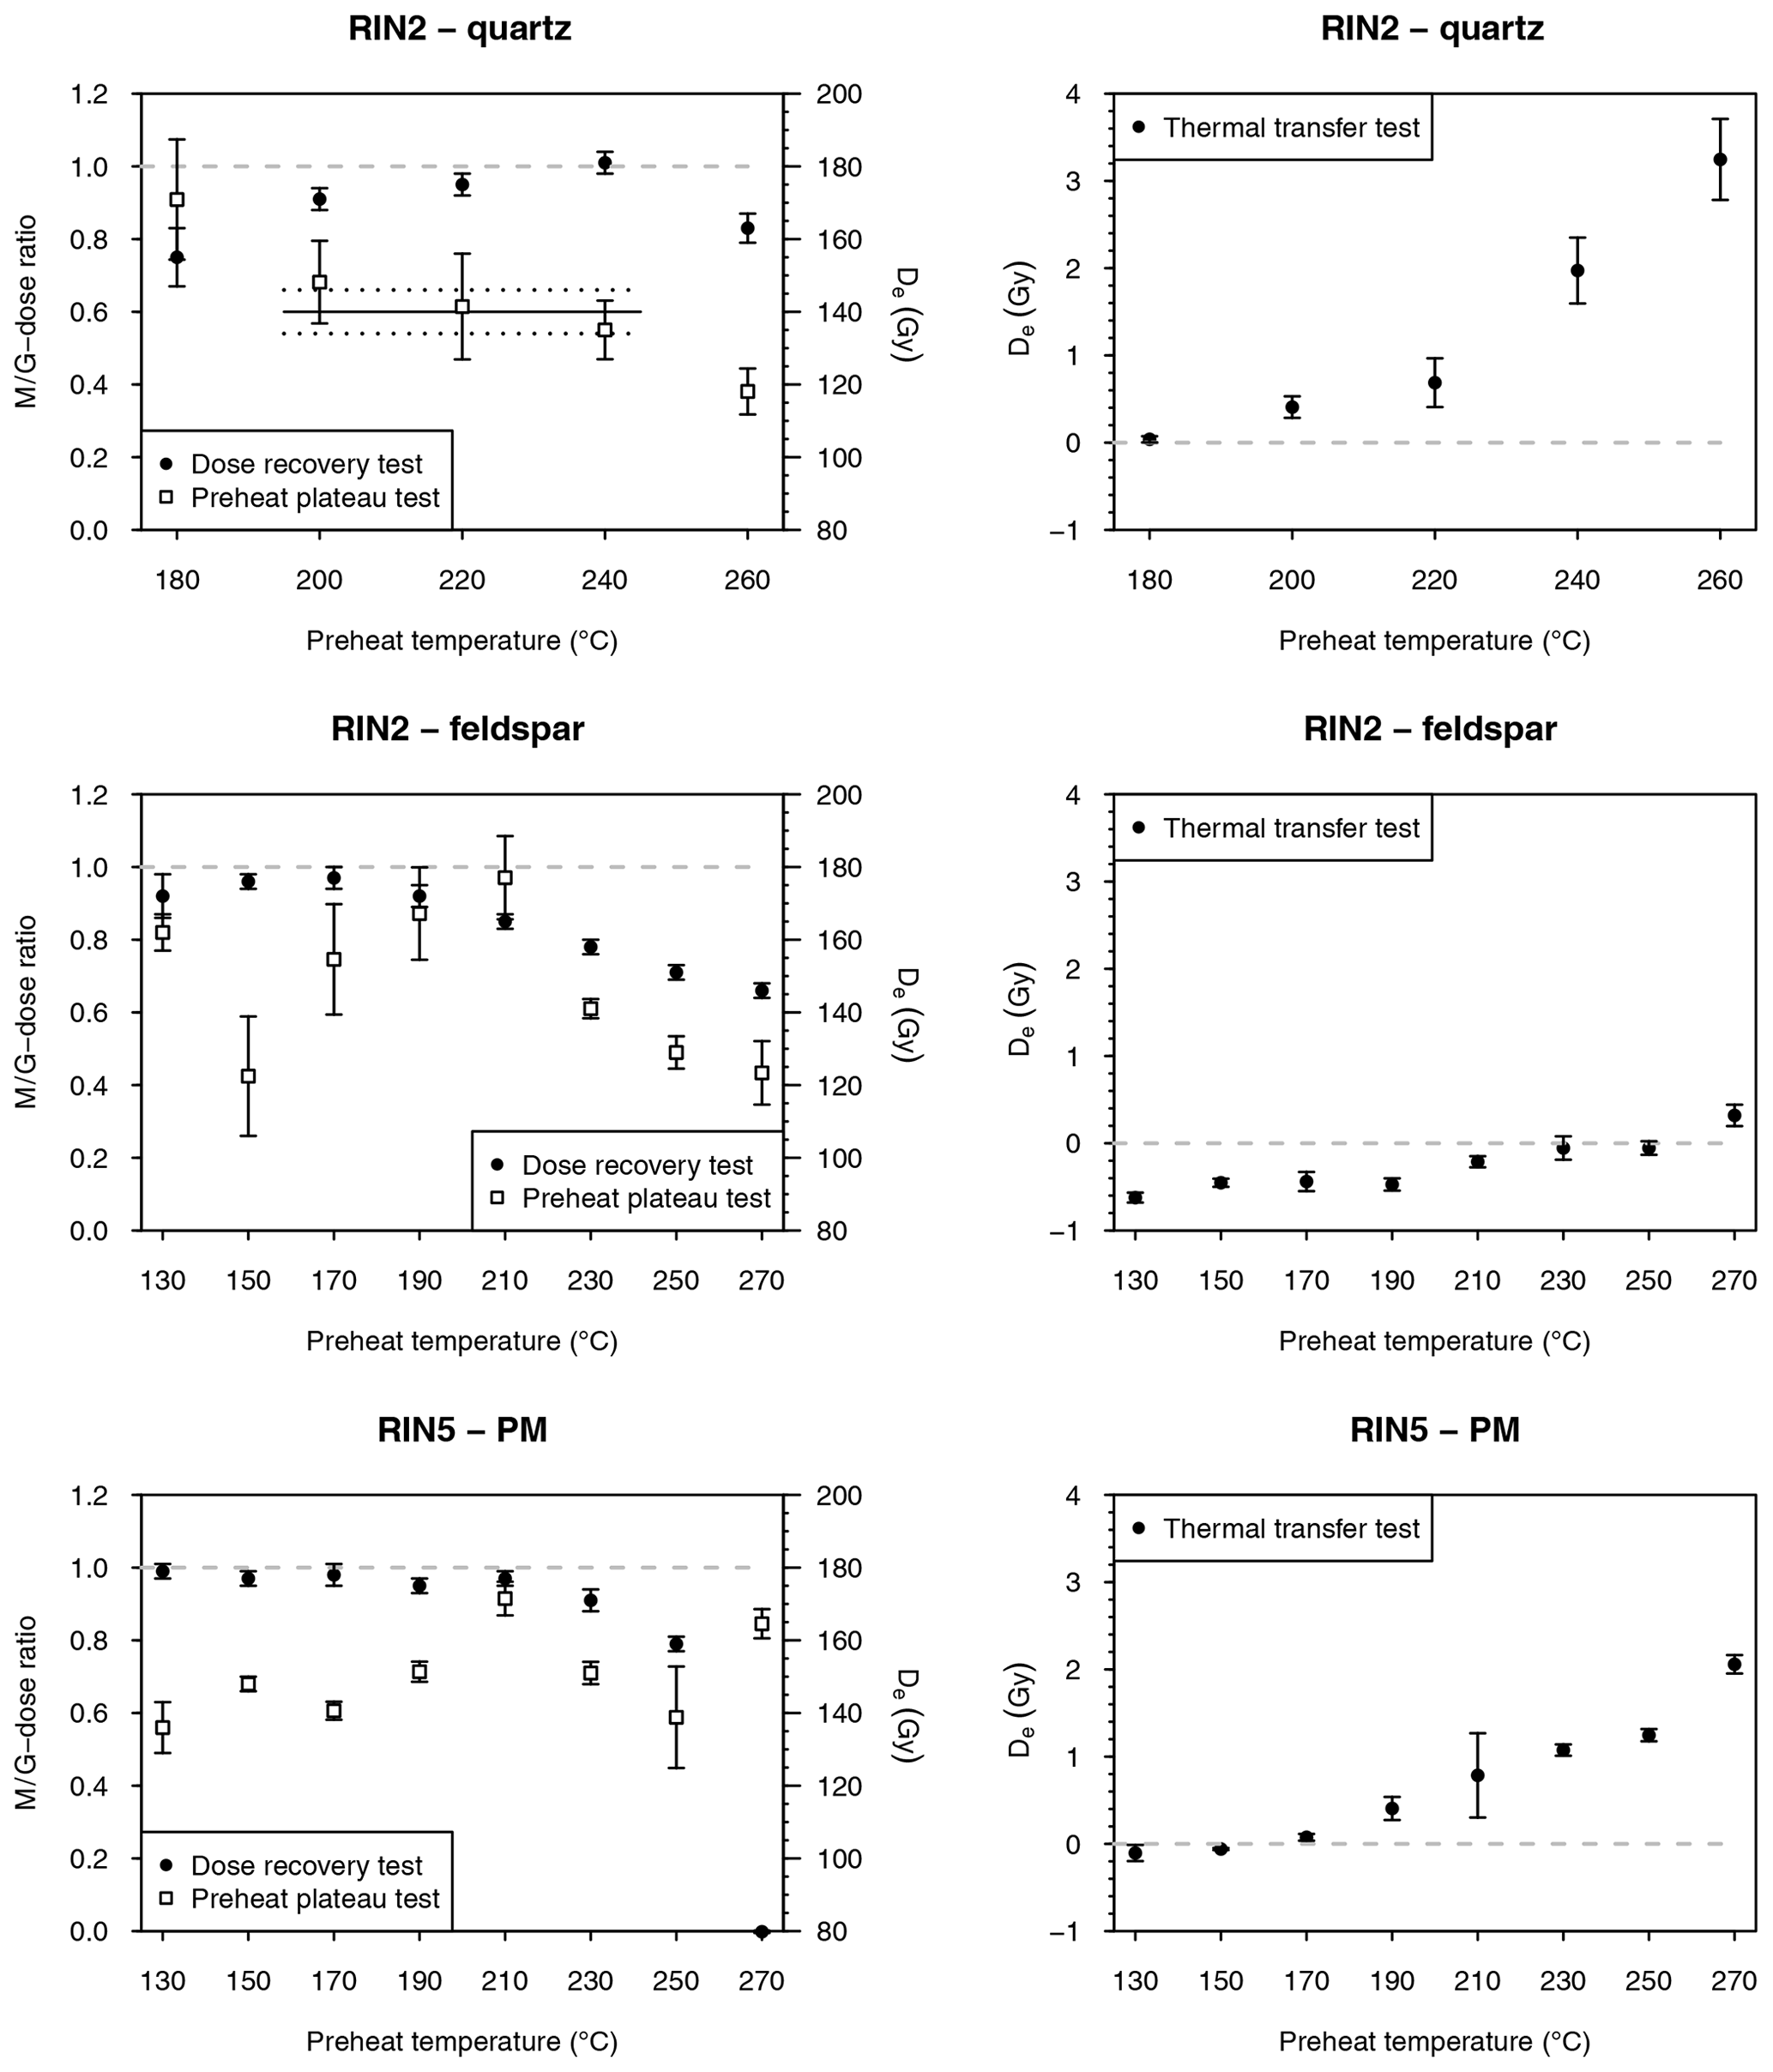
Figure 3Preheat plateau, dose recovery and thermal transfer test results for Q and F of RIN2 and fQ and PM of RIN5. Presented are CAM De values with 1σ uncertainties for 3 (F, PM) or 5 (Q, fQ) aliquots per preheat temperature. Dose recovery results are presented as measured-to-given dose ratios (M ∕ G ratio).
4.1 Quartz OSL
For preheat plateau tests on the natural signal of Q (RIN2), statistically consistent (1σ) De values were obtained on the larger grain size fraction for preheats between 200 and 240 ∘C (Fig. 3). De values of fQ (RIN5) for this preheat temperature range are consistent at 2σ (Fig. 3). A given dose of ca. 130 Gy was fully recovered from both tested samples (RIN2 Q and RIN5 fQ; Fig. 3) at 240 ∘C with measured-to-given dose ratios (M ∕ G ratios) of 1.01±0.03 and 1.05±0.04, respectively. Maximal thermal transfer was detected with < 4 Gy, which is equal to less than 3.5 % of the natural De and is therefore considered negligible. Hence, a preheat temperature of 240 ∘C was chosen for both grain size fractions of quartz (Q, fQ) for all investigated samples.
4.2 Feldspar and polymineral IRSL
For F, poor recovery was obtained for preheats above 190 ∘C. Considering the poor performance at high temperatures and the early emergence of the 110 ∘C TL peak on the used Lexsyg Research reader (see Sect. 3), lower temperatures were tested and a full recovery of the given dose (ca. 130 Gy) was possible for F and PM with a preheat of 170 ∘C. No plateau is present, but increasing trends of De values from the natural signal were observed between 150 and 210 ∘C for F and between 170 and 210 ∘C for PM. Natural De values decrease rapidly for preheats above 210 ∘C, while thermal transfer behaves inversely. However, thermal transfer is within < 2 Gy (ca. 1.5 % of the natural De) and is therefore negligible. To investigate whether thermal quenching induces an underestimation of De values at high preheat temperatures, preheat measurements were conducted on aliquots of RIN2 F, following Wallinga et al. (2000). Therefore, the natural signal was bleached with IR LEDs, a fixed dose of ca. 90 Gy was administered and each aliquot was preheated to 50 ∘C for 10 s, followed by IRSL at 50 ∘C for 0.1 s. This was repeated for preheat temperatures between 50 and 300 ∘C in 25 ∘C steps. After the highest preheat, the aliquots are expected to be sensitised and can be used for normalisation; therefore, the entire measurement sequence was repeated using the same fixed dose of ca. 90 Gy (Fig. 4). An increase in normalised IRSL sensitivity would be expected if the electron trapping probability changes with temperature (Wallinga et al., 2000). However, a decrease was observed for temperatures above 200 ∘C, suggesting that it is not a change in trapping probability causing the lower natural De values and dose recovery ratios. Conversely, the high preheat temperature may cause a removal of signal commonly used for De determination. Therefore, a preheat temperature of below 200 ∘C is most advisable. The best performance of the SAR protocol was obtained at a preheat of 170 ∘C (Fig. 3), which suggests a much lower preheat than is conventionally used. Buylaert et al. (2011) advise against the use of preheats below 200 ∘C due to thermally unstable signals induced during laboratory irradiation. However, their study was conducted on a Risø reader with different reader-specific preheat conditions. It is stressed that temperature parameters of Risø and Lexsyg readers are not readily comparable. Nevertheless, to investigate a potential contribution from artificially filled unstable traps, short shine pulse annealing tests were conducted on aliquots of RIN2 F with naturally irradiated and laboratory-irradiated material following Wallinga et al. (2000). Each aliquot was preheated for 10 s and then stimulated with IR LEDs at 50 ∘C for 0.1 s. Preheats were conducted consecutively in 10 ∘C steps from 130 to 400 ∘C. The signal was normalised with a test dose measurement of the same aliquot and renormalised to the first measurement (Fig. 5). Signal distribution of both the natural and laboratory-induced irradiation are indistinguishable, and it is unlikely that a thermally unstable component from artificially filled traps contributes to the IRSL signal even at low preheat temperatures. Thermal stability of IRSL signals from the samples investigated here is given and thermal quenching was not detected; therefore, preheats of 170 ∘C are considered appropriate. In the absence of preheat plateaus in the natural signals, the dose recovery test results are indicative (RIN2 F 0.97±0.03; RIN5 PM 0.98±0.03), and hence preheats of 170 ∘C were used all for measurements.
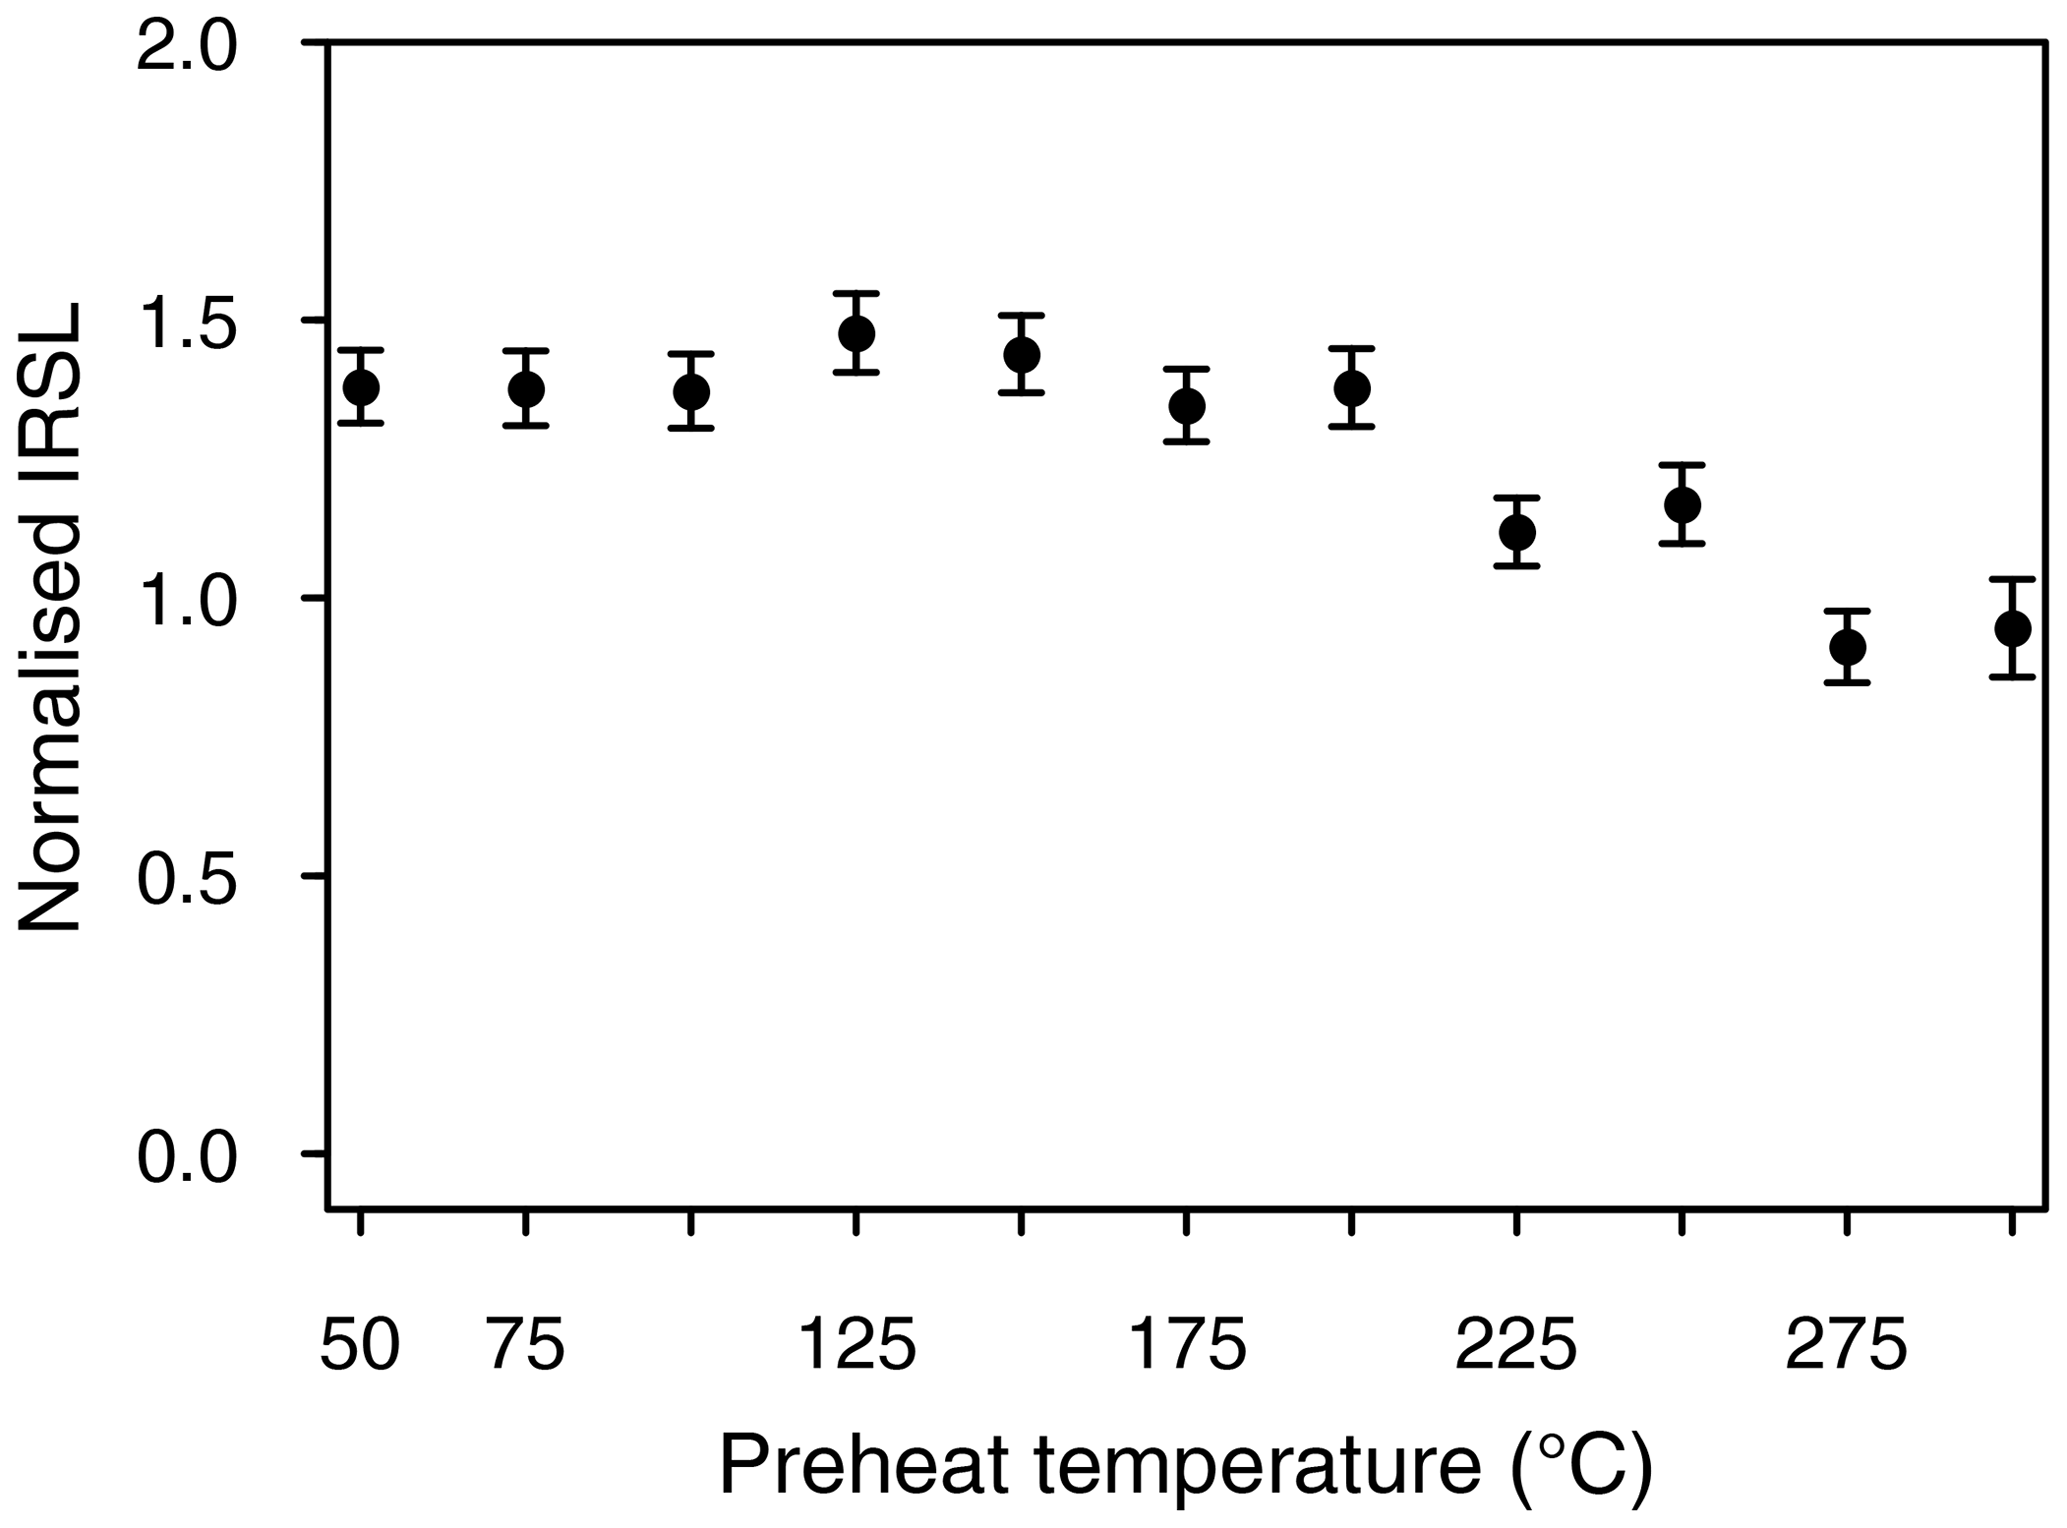
Figure 4To determine thermal quenching, repeated short shine measurements of Lx∕Tx for a given dose of 90 Gy after preheats at different temperatures were conducted on one aliquot of RIN2 F.

Figure 5Short shine pulse annealing experiment on natural and laboratory-induced doses of two aliquots from RIN2 F. The IRSL signal is normalised to a test dose and renormalised to the first measurement.
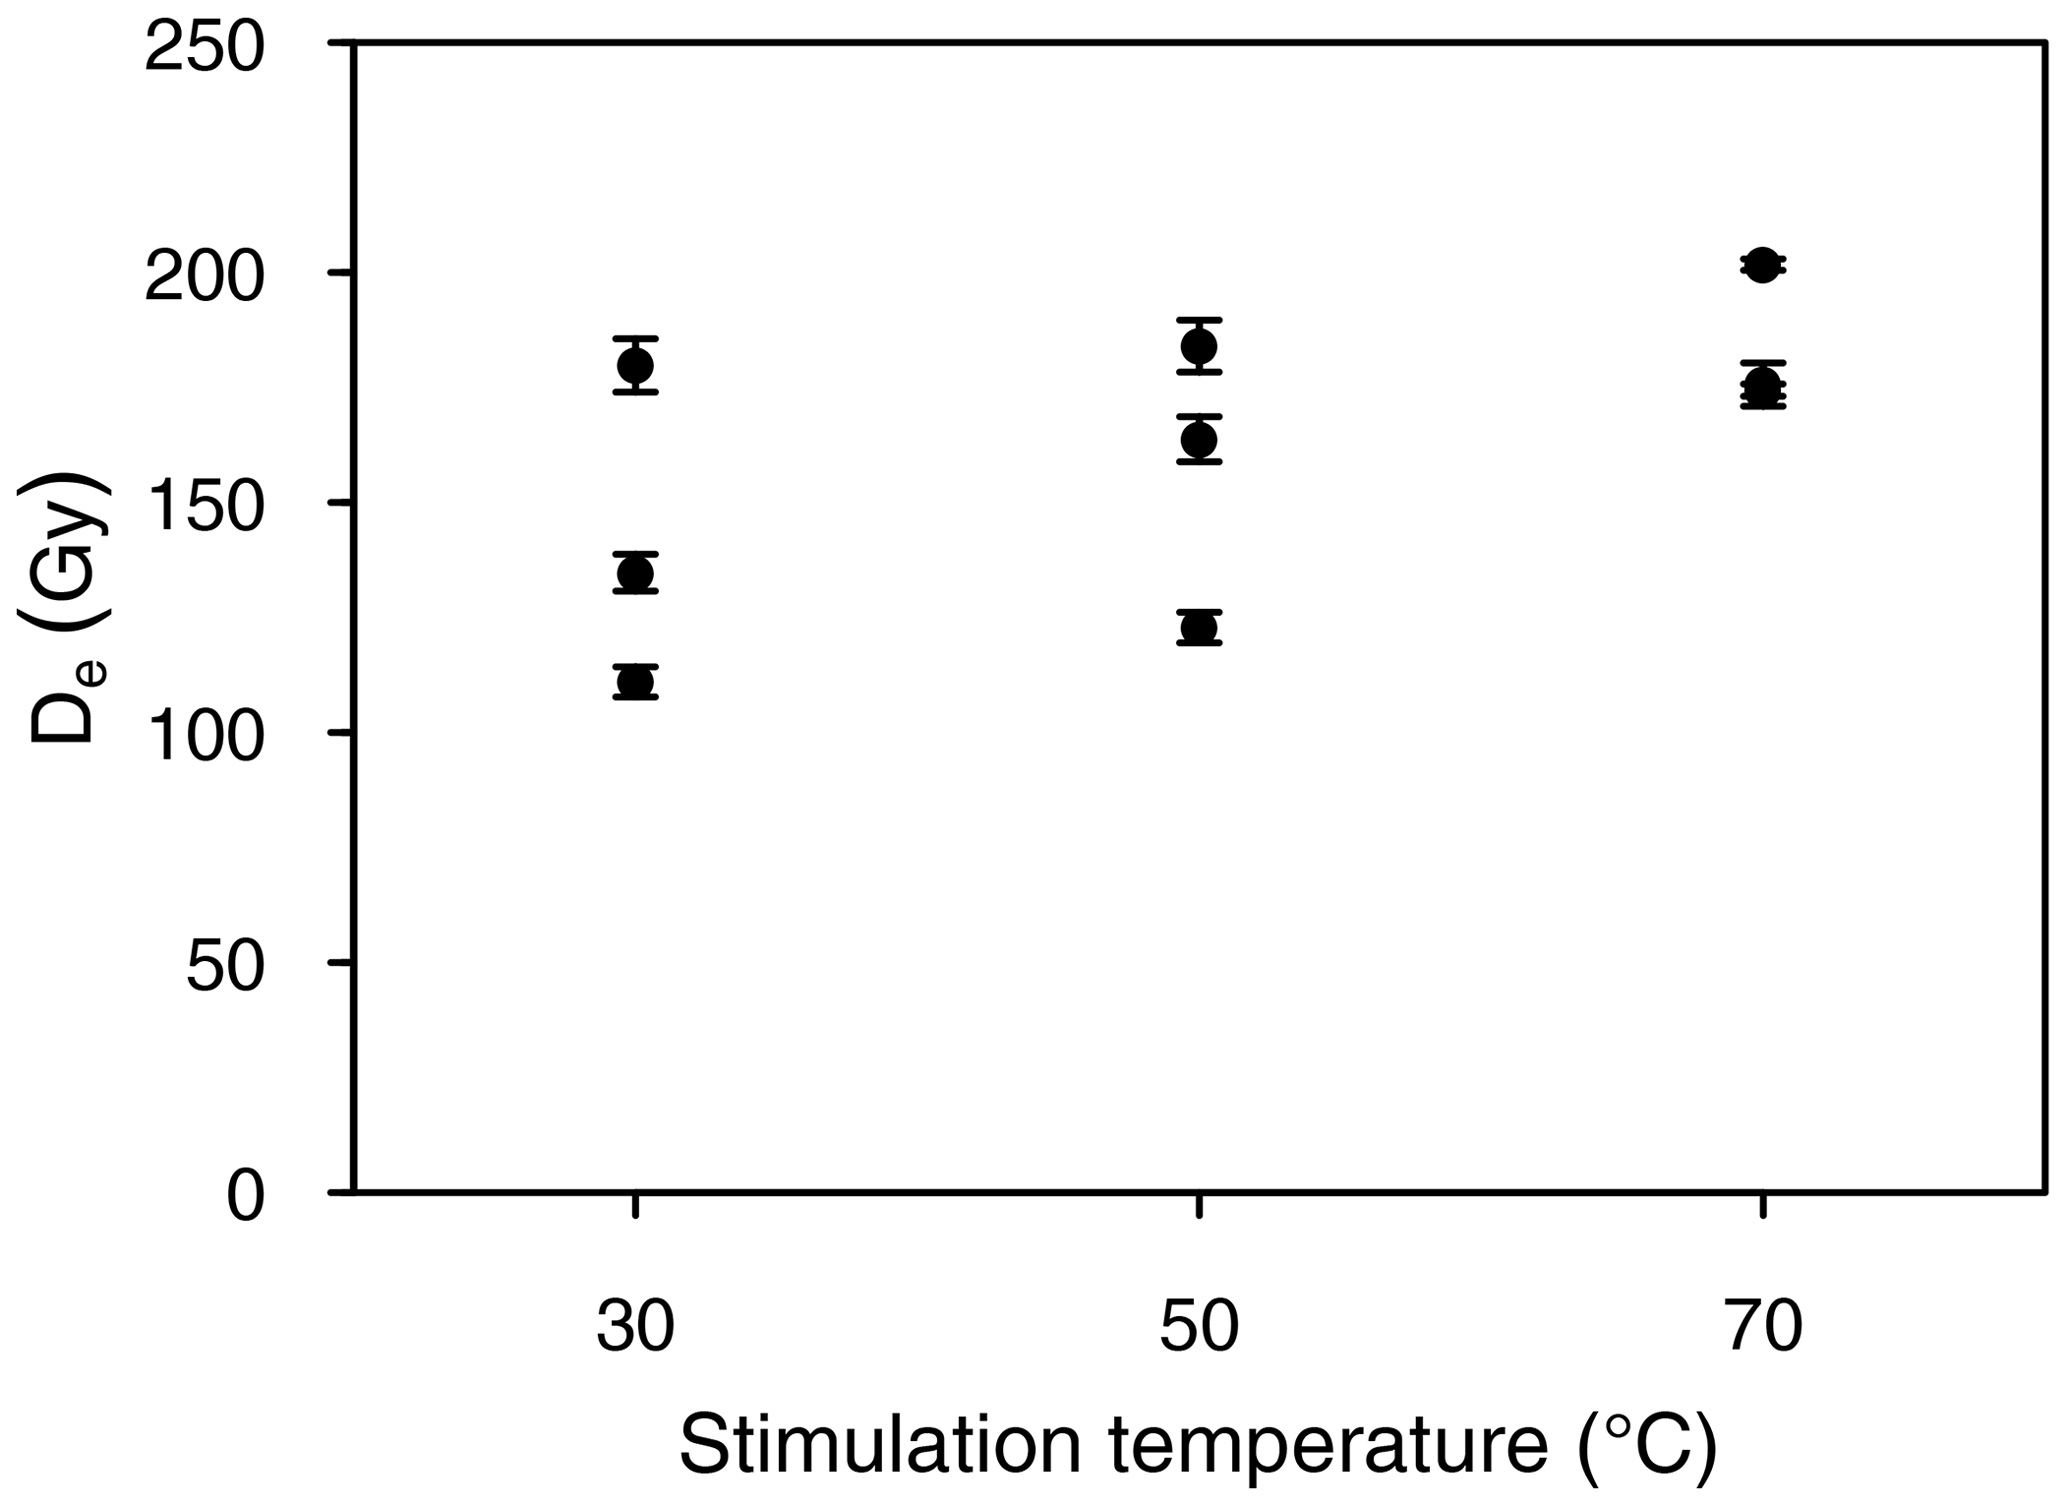
Figure 6De determination of the natural signal using different stimulation temperatures for each three aliquots of RIN2 F.
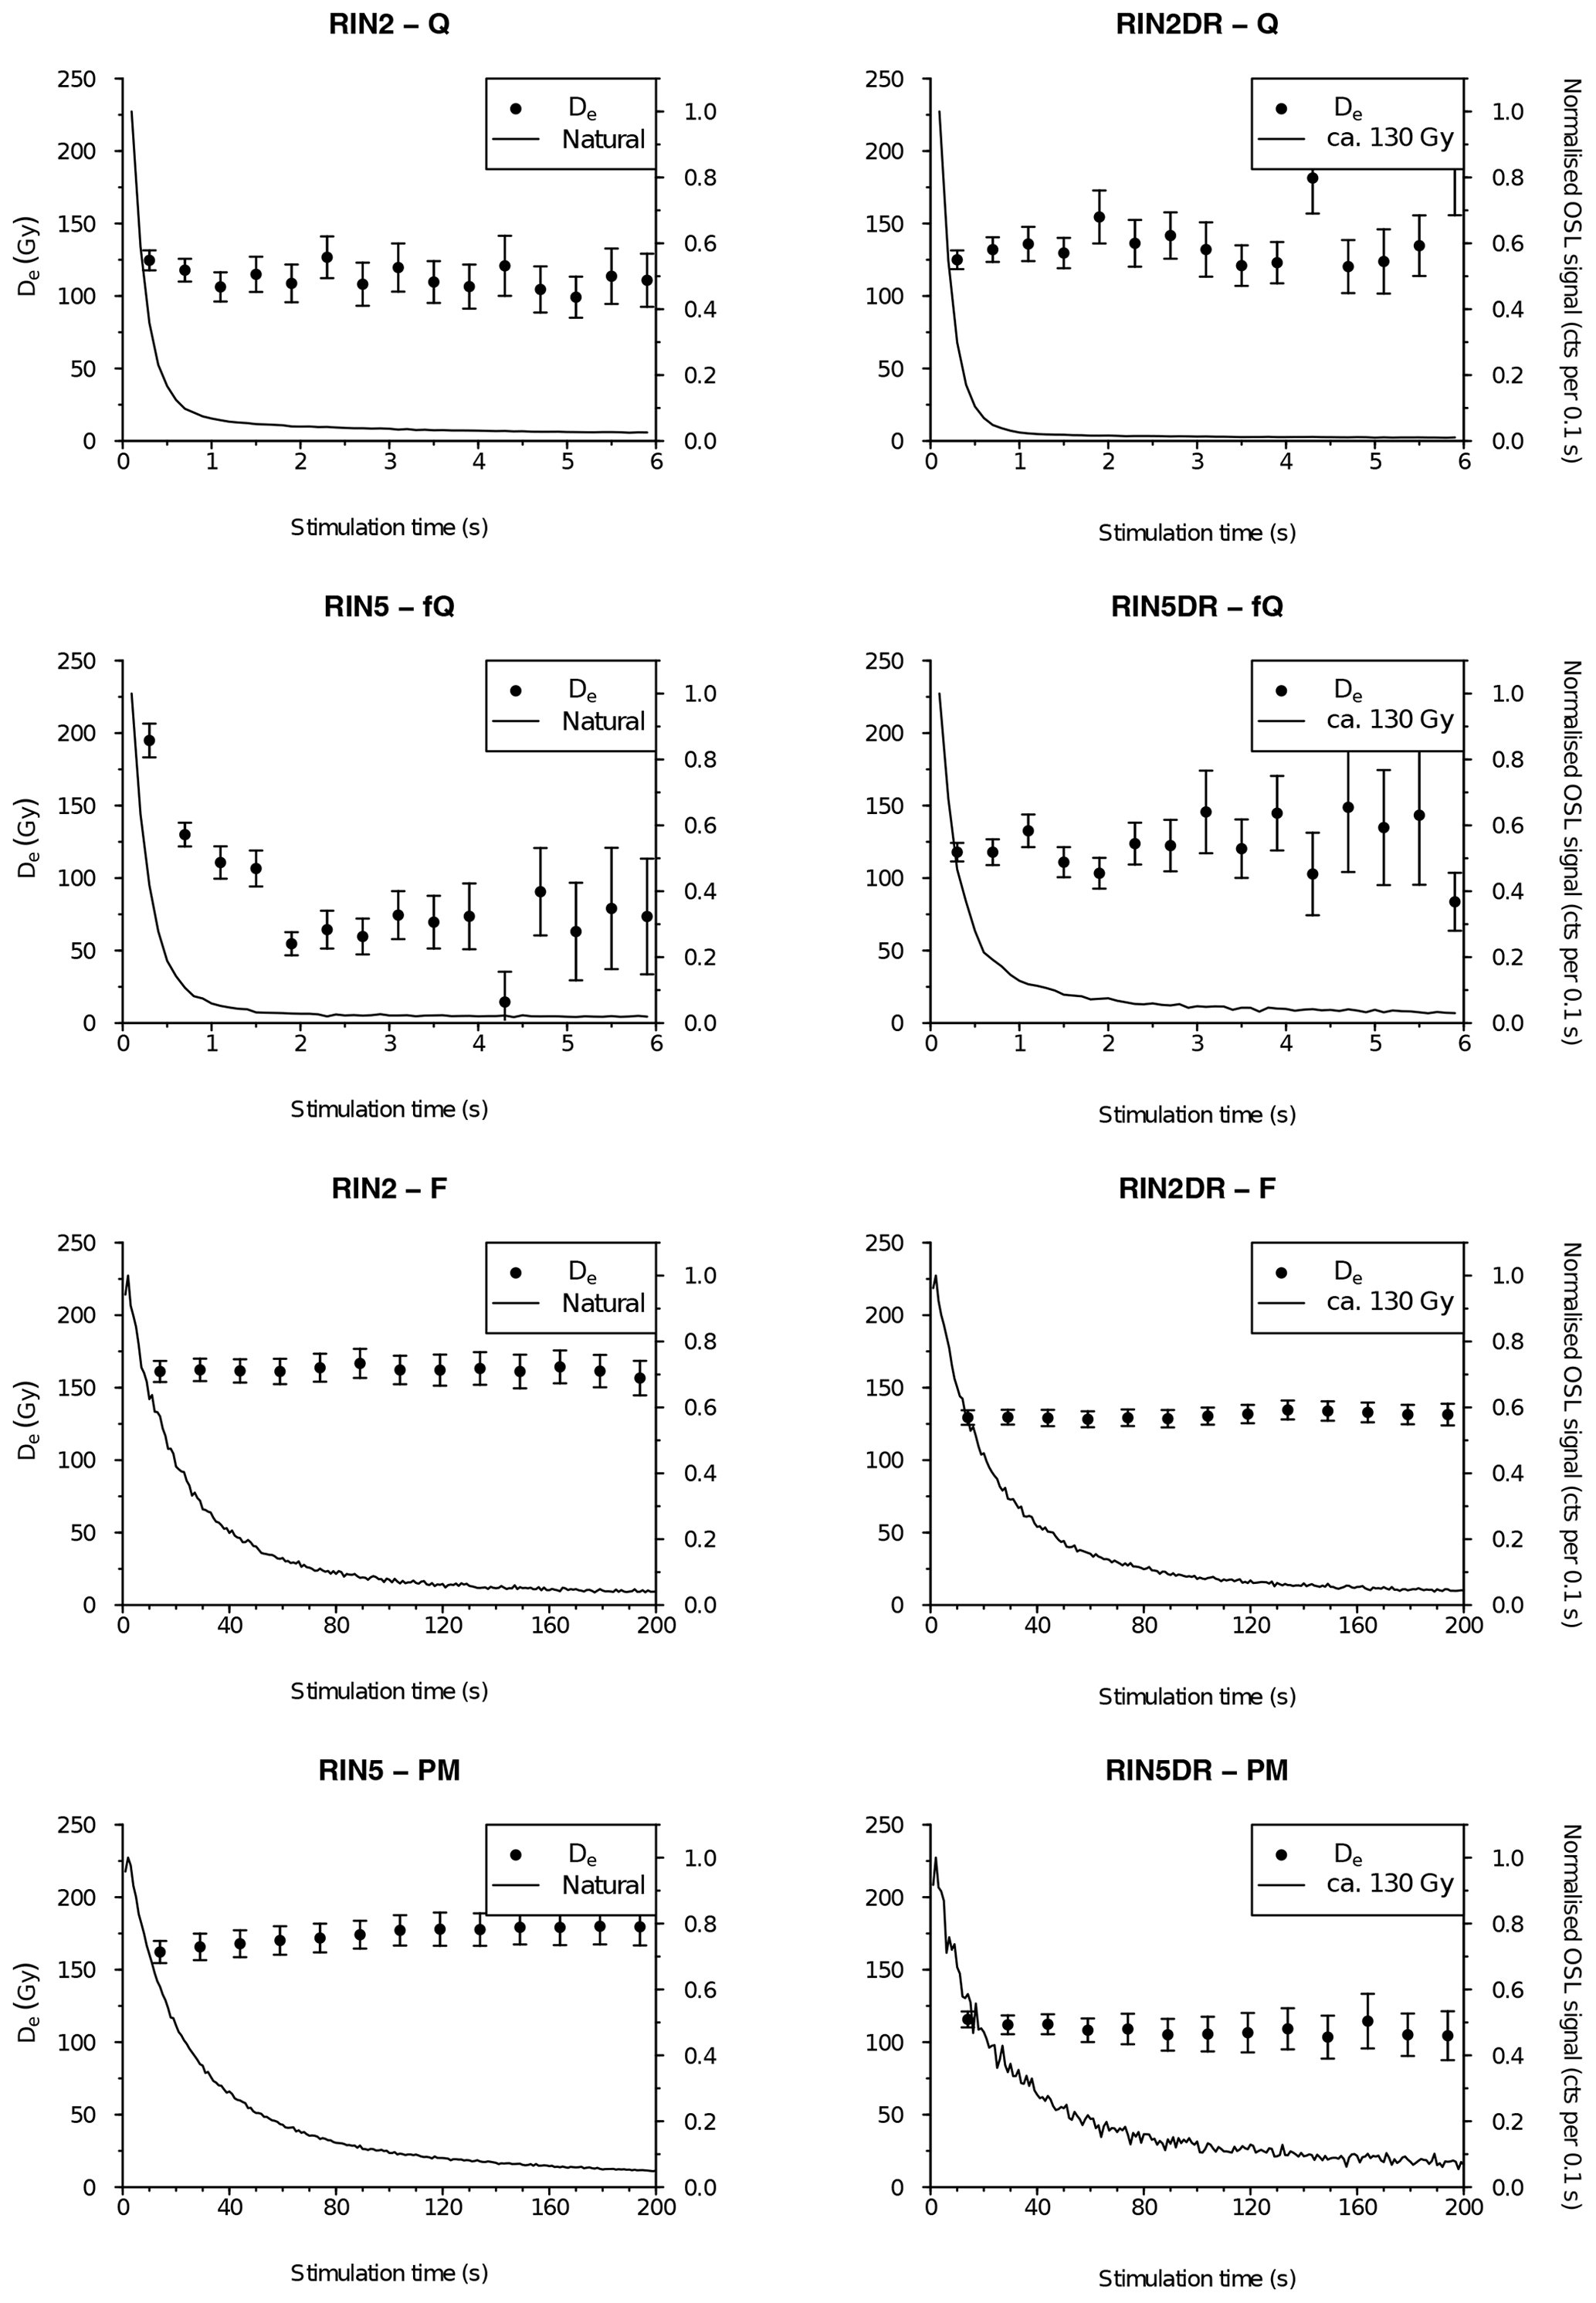
Figure 7De(t) plots of the natural dose determination and dose recovery (DR) tests for Q and F of RIN2 and fQ and PM of RIN5. De(t) plots were calculated for 0.4 s intervals (Q, fQ) and 1.5 s (F, PM). The normalised luminescence signals of the natural or first given (DR) dose are presented.
However, the differences in temperature parameters make it necessary to test whether the configuration of the Lexsyg Research reader affects the temperature during stimulation as it does for preheating. Therefore, De values of the natural signal were obtained at stimulation temperatures of 30, 50 and 70 ∘C for one representative sample (RIN2 F) (Fig. 6). While the scatter in the natural De values decreases with stimulation temperature, mean De values of all stimulation temperatures are statistically consistent with each other, implying that differences between the reader systems may not be as pronounced in the low temperature range as they are at temperatures above 150 ∘C.
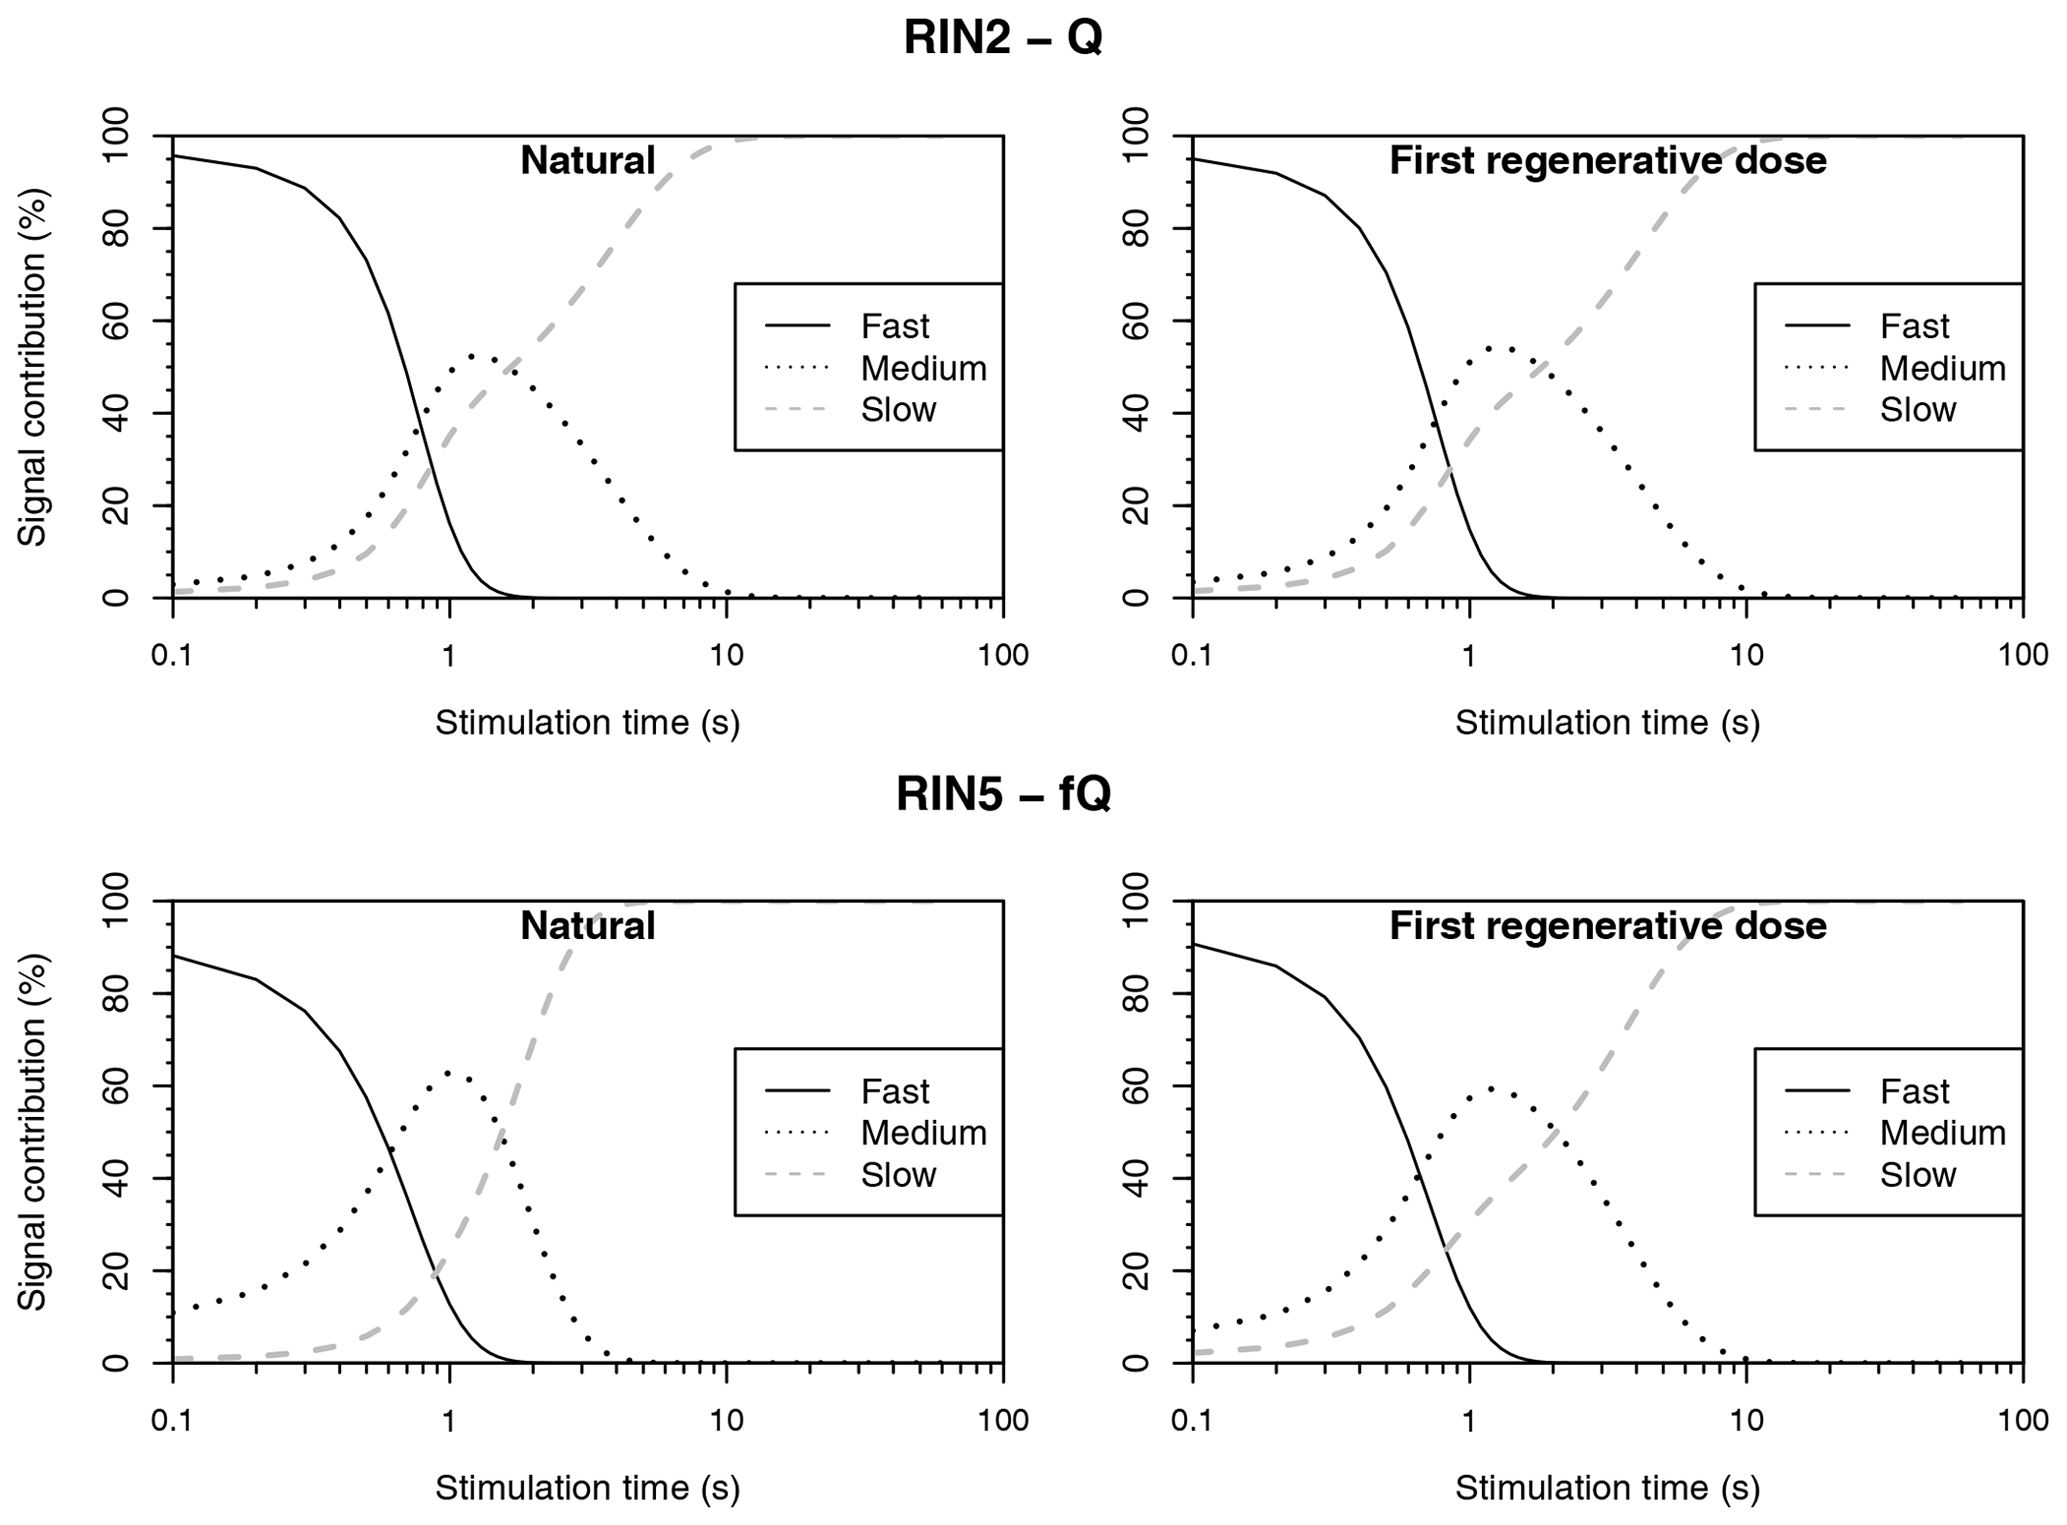
Figure 8Component deconvolution of the natural and regenerative OSL response of RIN2 Q and RIN5 fQ.
5.1 Quartz OSL
Quartz grains from the investigated site are relatively dim and rarely present luminescent properties. Tests with an EMCCD camera showed that < 1 % of the coarse-grained grains emitted a natural luminescence signal when stimulated with blue light. This is common for quartz from Switzerland (Trauerstein et al., 2017) and to allow for bright enough signals during measurement, an aliquot size of 4 mm in diameter was chosen. While ca. 200 grains are measured at once using this approach, only a few grains are expected to significantly contribute to the emitted luminescence signal, and these are thereby considered small aliquots.
The signals emitted by Q and fQ are dominated by the fast component and reduce to background after about 2 to 4 s of stimulation (Fig. 7). To further investigate the BSL signals, signal decomposition was conducted (Fig. 8) using the numOSL package in R (Peng et al., 2018) that applies the “Levenberg–Marquardt algorithm” suggested by Bluszcz and Adamiec (2006). The initial signals consist of 95 % of the fast component for Q and 90 % of the fast component for fQ, while the relative contribution of the medium components to the natural and regenerative doses are almost identical. The latter is considered an indicator for a stable medium component (Steffen et al., 2009). Further, when assessing De(t) plots with 0.4 s intervals of Q from RIN2 (Fig. 7), generally consistent De values are obtained for the measurement of the natural dose and the dose recovery experiment, which indicates uniformity of signal contribution. For RIN5 fQ, De values decrease with the shift of integration intervals between 0 and 2 s stimulation time. However, this phenomenon is only present in the natural signal but not in those of dose recovery tests. Li and Li (2006a) observed a similar decrease of De values within the first 3.6 s for their DGF-1 sample (Chinese coarse-grained aeolian deposit) and found an explanation in a thermally unstable medium component. They proposed the use of De(t) plots to derive De values separately from the fast and medium component by fitting their Eq. (3). For RIN5 fQ, negligible differences were found for De values derived using either component by assuming photo-ionising cross sections, as proposed by Jain et al. (2003) and Li and Li (2006b). However, Steffen et al. (2009) found that the equation is highly dependent on the photo-ionising cross section of the individual components, the determination of which introduces an array of uncertainties and was therefore deemed unpractical.
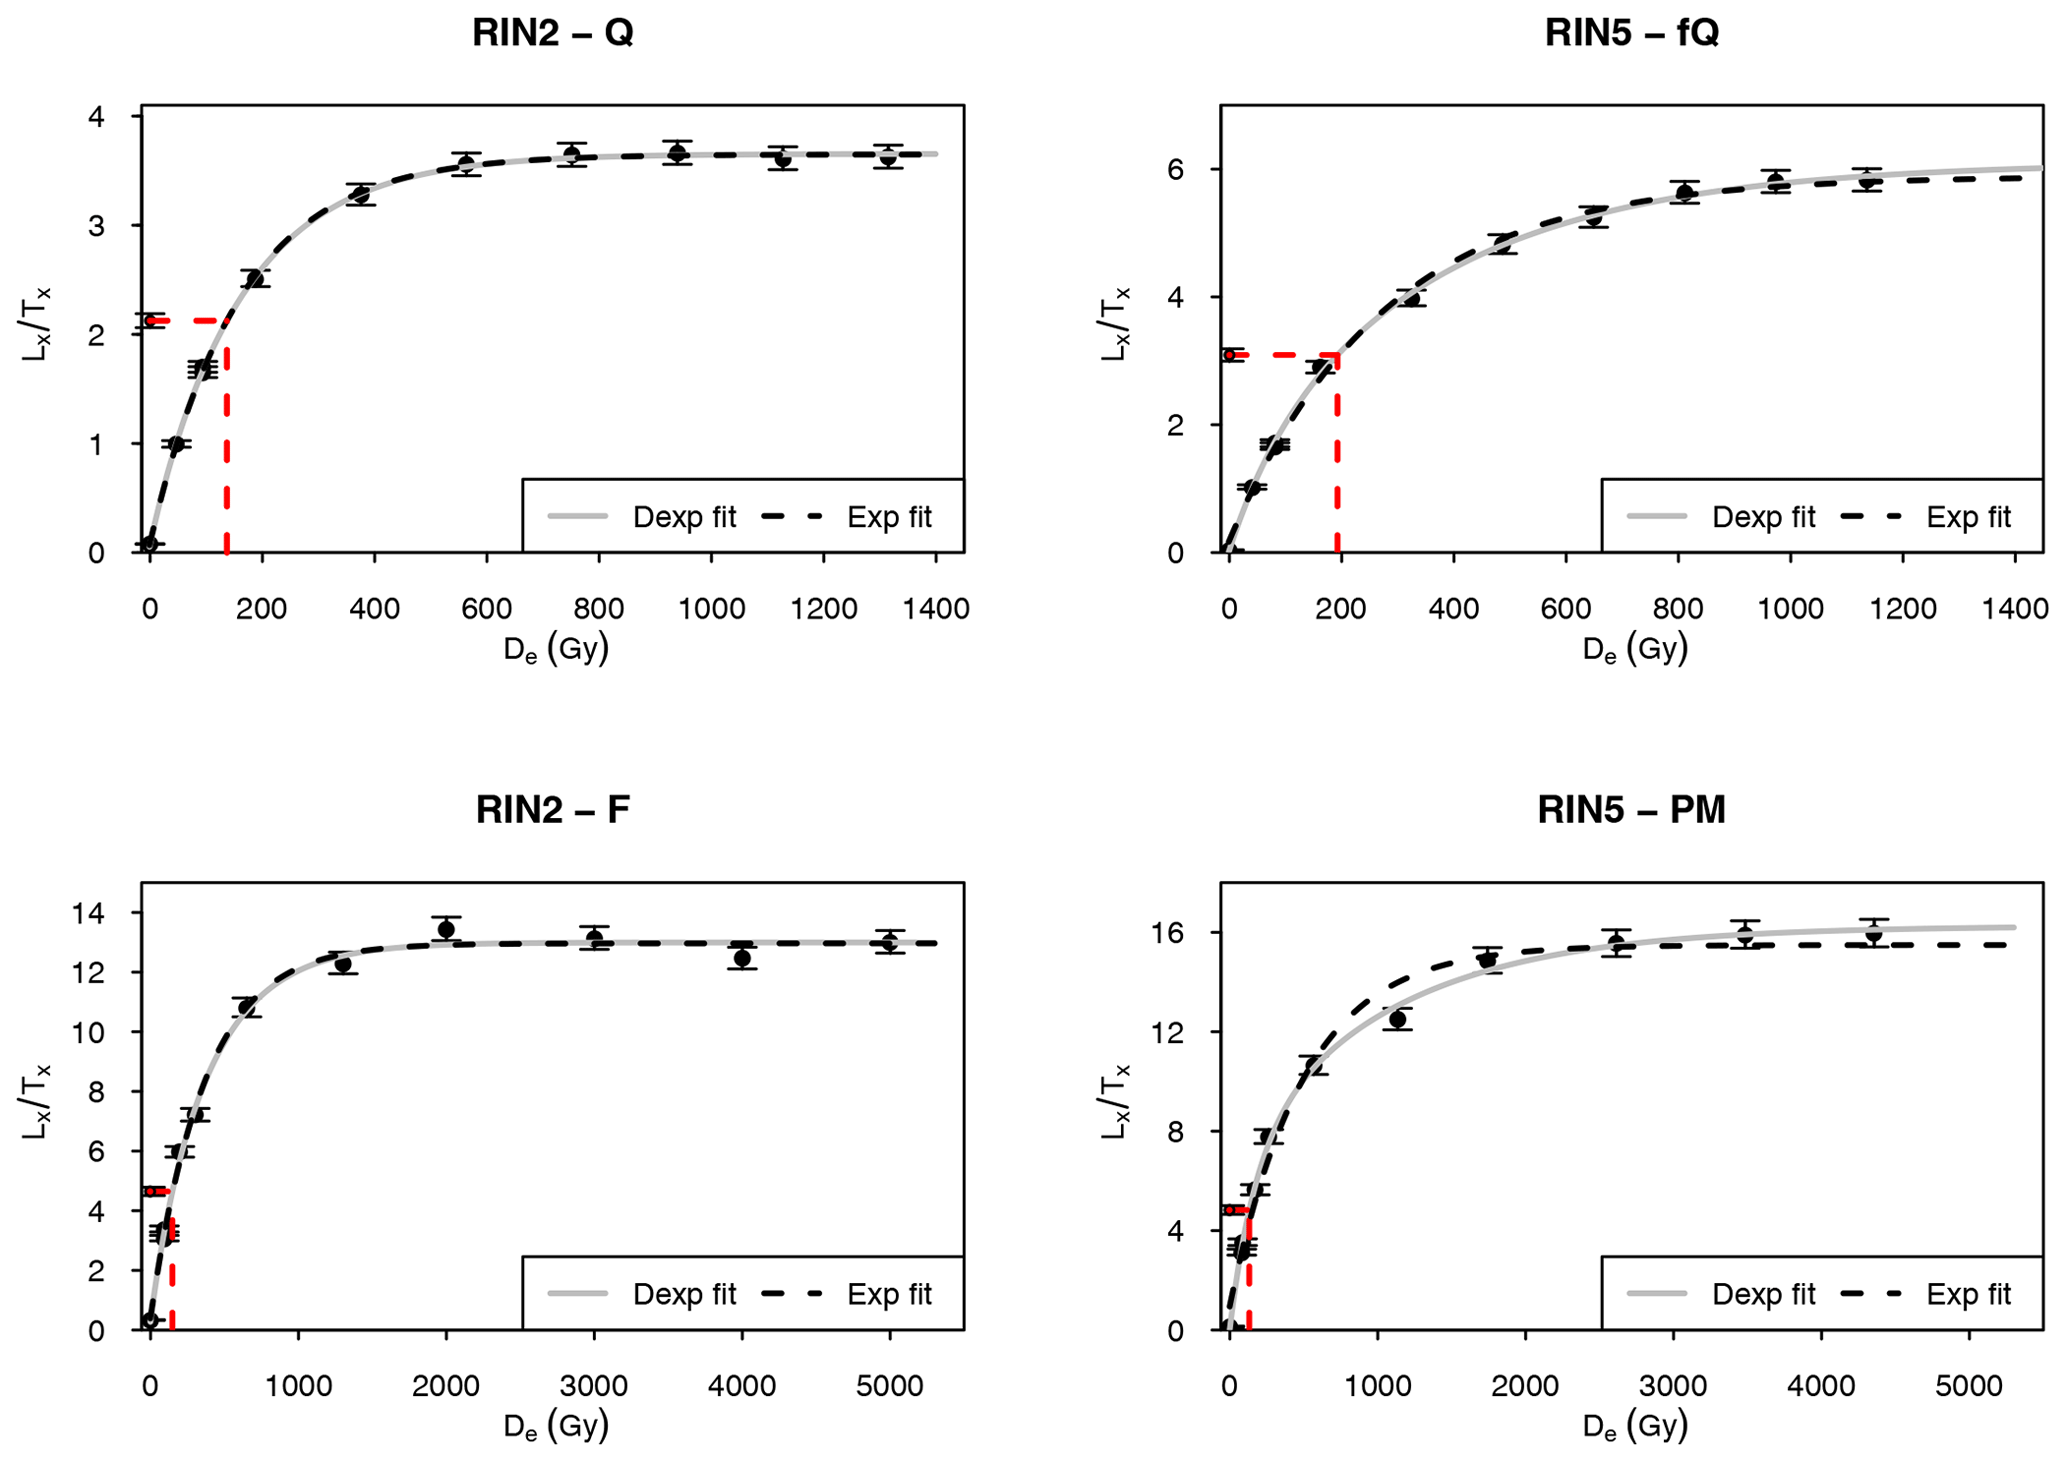
De values derived using early background subtraction (0.4 to 1.0 s; cf. Cunningham and Wallinga, 2010) are statistically consistent with those obtained using late background subtraction (2σ). This indicates an unproblematic slow component. For De determination of Q and fQ, the first 0.4 s of the BSL signal was found appropriate as the initial signal, and a late background subtraction using the last 40 s was applied. Examples of extended dose response curves are shown for one aliquot Q from RIN2 and one aliquot fQ from RIN5 in Fig. 9. Laboratory saturation levels exceed 600 Gy (Q) and 800 Gy (fQ), and 2×D0 values are below 400 Gy (Q) and 580 Gy (fQ; Table 1). Dose response curves of both Q and fQ are well fitted with a double-saturating exponential and a single-saturating exponential function. The latter implies that a single type of trap is responsible for the signal (Aitken, 1998).
5.2 Feldspar and polymineral IRSL
In contrast to Q, the natural signal of 1 mm F aliquots (ca. 13 grains) is very bright and causes saturation of the photomultiplier tube, particularly at high doses. Noteworthy is that only few grains inherit an effective, natural luminescence signal with even less being particularly bright as shown by tests with an EMCCD camera (Fig. 10). A Schott NG-11 neutral density filter was tested together with the 410 nm-filter combination but failed in protecting the photomultiplier tube from saturation. A cardboard disc with a hole in its centre was mounted into the filter wheel, reducing the photon passage to 4 mm in diameter, which allowed for the retrieval of a detectable signal. A dose recovery test (given dose of ca. 130 Gy) was conducted with and without using the cardboard disc (Fig. 11). Results of both setups are statistically consistent with each other and suggest that the use of the cardboard is unlikely to impact the reliability of the De determination. Hence, the cardboard was used in all IRSL measurements within this study.
De(t) plots with 1.5 s intervals show consistent results over the first 200 s of the IRSL signal as presented for both the natural signal and the artificial signal induced during dose recovery tests of RIN2 F and RIN5 PM (Fig. 7). For age determination, De values were derived using the first 1.5 s of the signal and a late background subtraction of the last 50 s. Examples of extended dose response curves are shown for one aliquot from RIN2 F and one aliquot from RIN5 PM in Fig. 9. Laboratory saturation levels exceed 1500 Gy (F) and 1800 Gy (PM), and 2×D0 values are about 600 Gy (F) and above 425 Gy (PM; Table 1). For both F and PM, dose response curves are well fitted with a double-saturating exponential and a single-saturating exponential function.

Figure 10Coloured EMCCD image obtained from the natural IRSL signal of 100 F grains of RIN2. The grains were placed on a Risø single grain disc with a 10×10 grid of holes (300 µm in diameter). (a) Holes containing F grains emitting luminescence are presented with dashed green circles, while those without emission are shown in white. (b) The 3D surface plot emphasises that some grains inherit very bright signals, while others are rather dim.
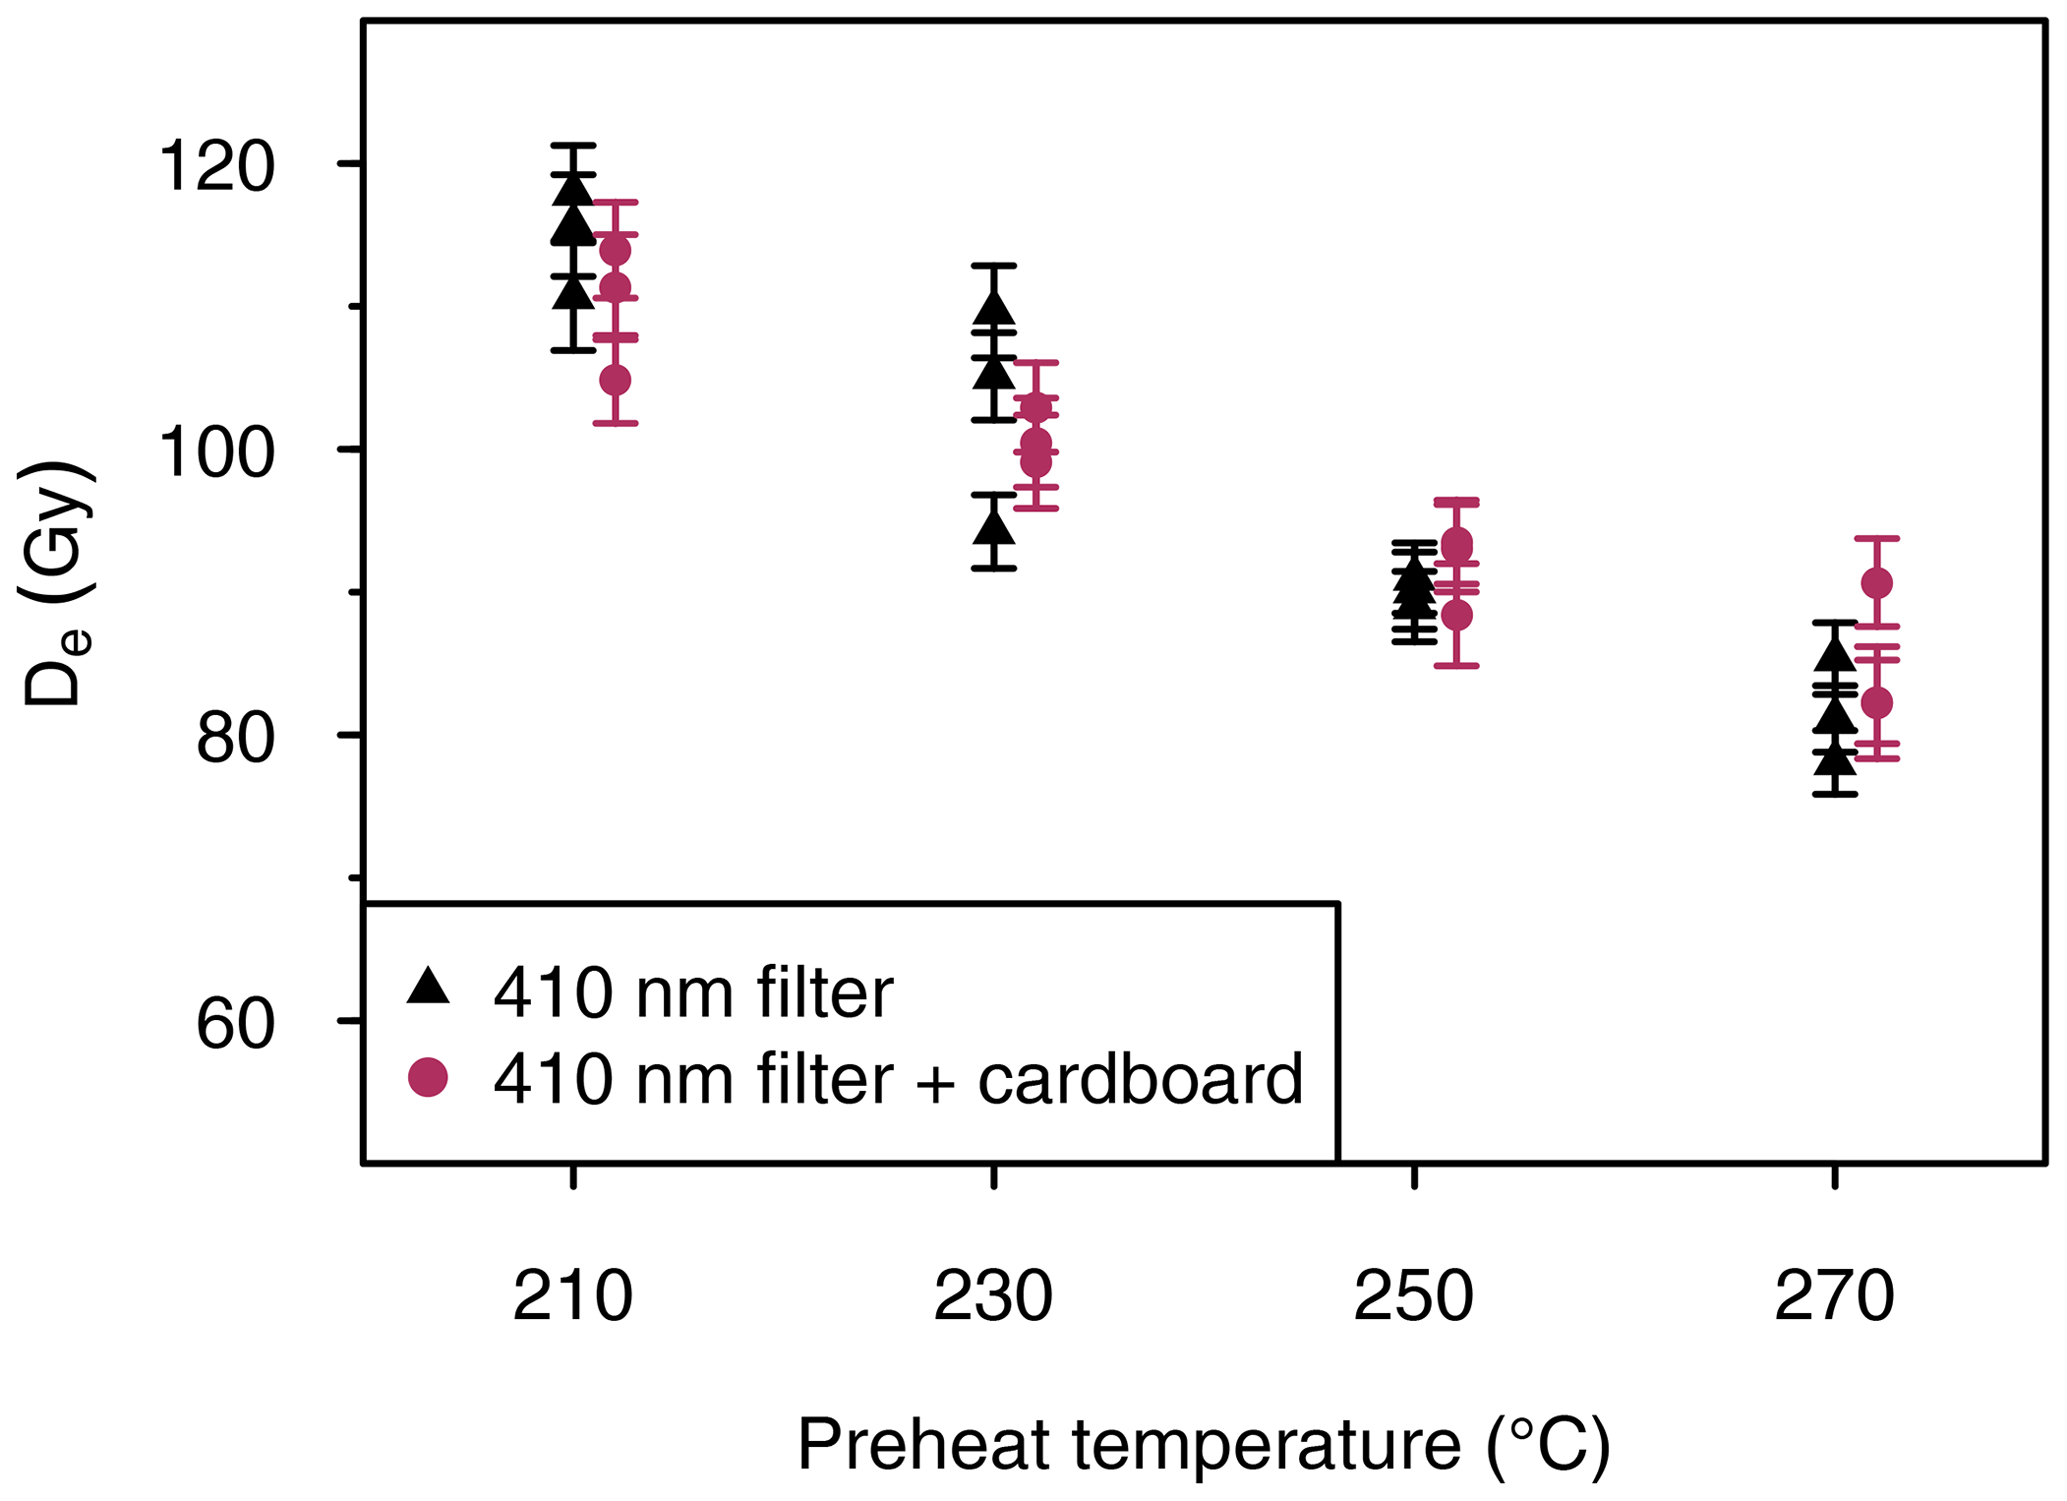
Figure 11Dose recovery test (RIN2 F, 130 Gy given dose) at different preheat temperatures with and without a mounted cardboard barrier to reduce photon passage.
As the IRSL signal commonly is subject to a loss of signal over time, fading tests were conducted following Auclair et al. (2003) for a given dose of ca. 130 Gy. Three cycles with storage times of ca. 0 s, 1 h, 2.5 h, 5 h and 10 h were implemented per aliquot while the aliquot constantly remained on the sample arm. This reduces the possibility of sample material being lost during mechanical transfer of the aliquot between sample arm and storage carousel (Preusser et al., 2014). For all fading tests, aliquots previously used for De determination were utilised. Two fading correction procedures were conducted, following Lamothe et al. (2003) and Kars et al. (2008), respectively, using the R luminescence package (Kreutzer and Mercier, 2019; King and Burow, 2019). The first approach is based on the extrapolation of luminescence signal loss to a decadal percentage (g-value) that is used to correct the natural dose and the dose response points while the latter approach utilises the sample-specific density of recombination centres (ρ′-value) to correct the dose response curves. To apply both approaches, ρ′- and g-values were derived, whereby the latter was normalised to 2 d.
Fading properties (ρ′-value of ; g-value of 3.1 % ± 0.6 % per decade) were obtained for RIN2 as a representative sample for the F fractions, and fading correction was applied to the F measurements, providing corrected De values and ages (Table 1). Following Kars et al. (2008), the corrected F De values, except for RIN13 F, are about 16 % higher than those corrected using Lamothe et al. (2003). Kars-corrected De values are between 247±7 Gy (RIN1) and 297±6 Gy (RIN4) and well below 2×D0 (RIN1 measured 577±20 Gy and simulated 560±7 Gy; RIN2 measured 626±22 Gy and simulated 602±9 Gy; RIN3 measured 609±18 Gy and simulated 590±9 Gy; RIN4 measured 641±26 Gy and simulated 612±24 Gy). For RIN13 F, a significant number of aliquots 12 (Lamothe correction) and 19 (Kars correction) out of 30 measured aliquots are in saturation. Minimum CAM De values of > 695 and > 974 Gy are obtained, respectively, which are beyond the 2×D0 limit (measured 651±32 Gy; Kars-simulated 666±4 Gy). However, for all other samples the Kars-corrected F ages (for age determination, see Sect. 7) are in good agreement with those of the Q fraction (statistically consistent at 1σ, Table 1). It cannot be excluded that this effect is due to an overestimation of both Kars-corrected F and Q ages. Due to the lack of evidence for the prior, the Kars et al. (2008) fading correction approach is considered most appropriate for samples of this study.
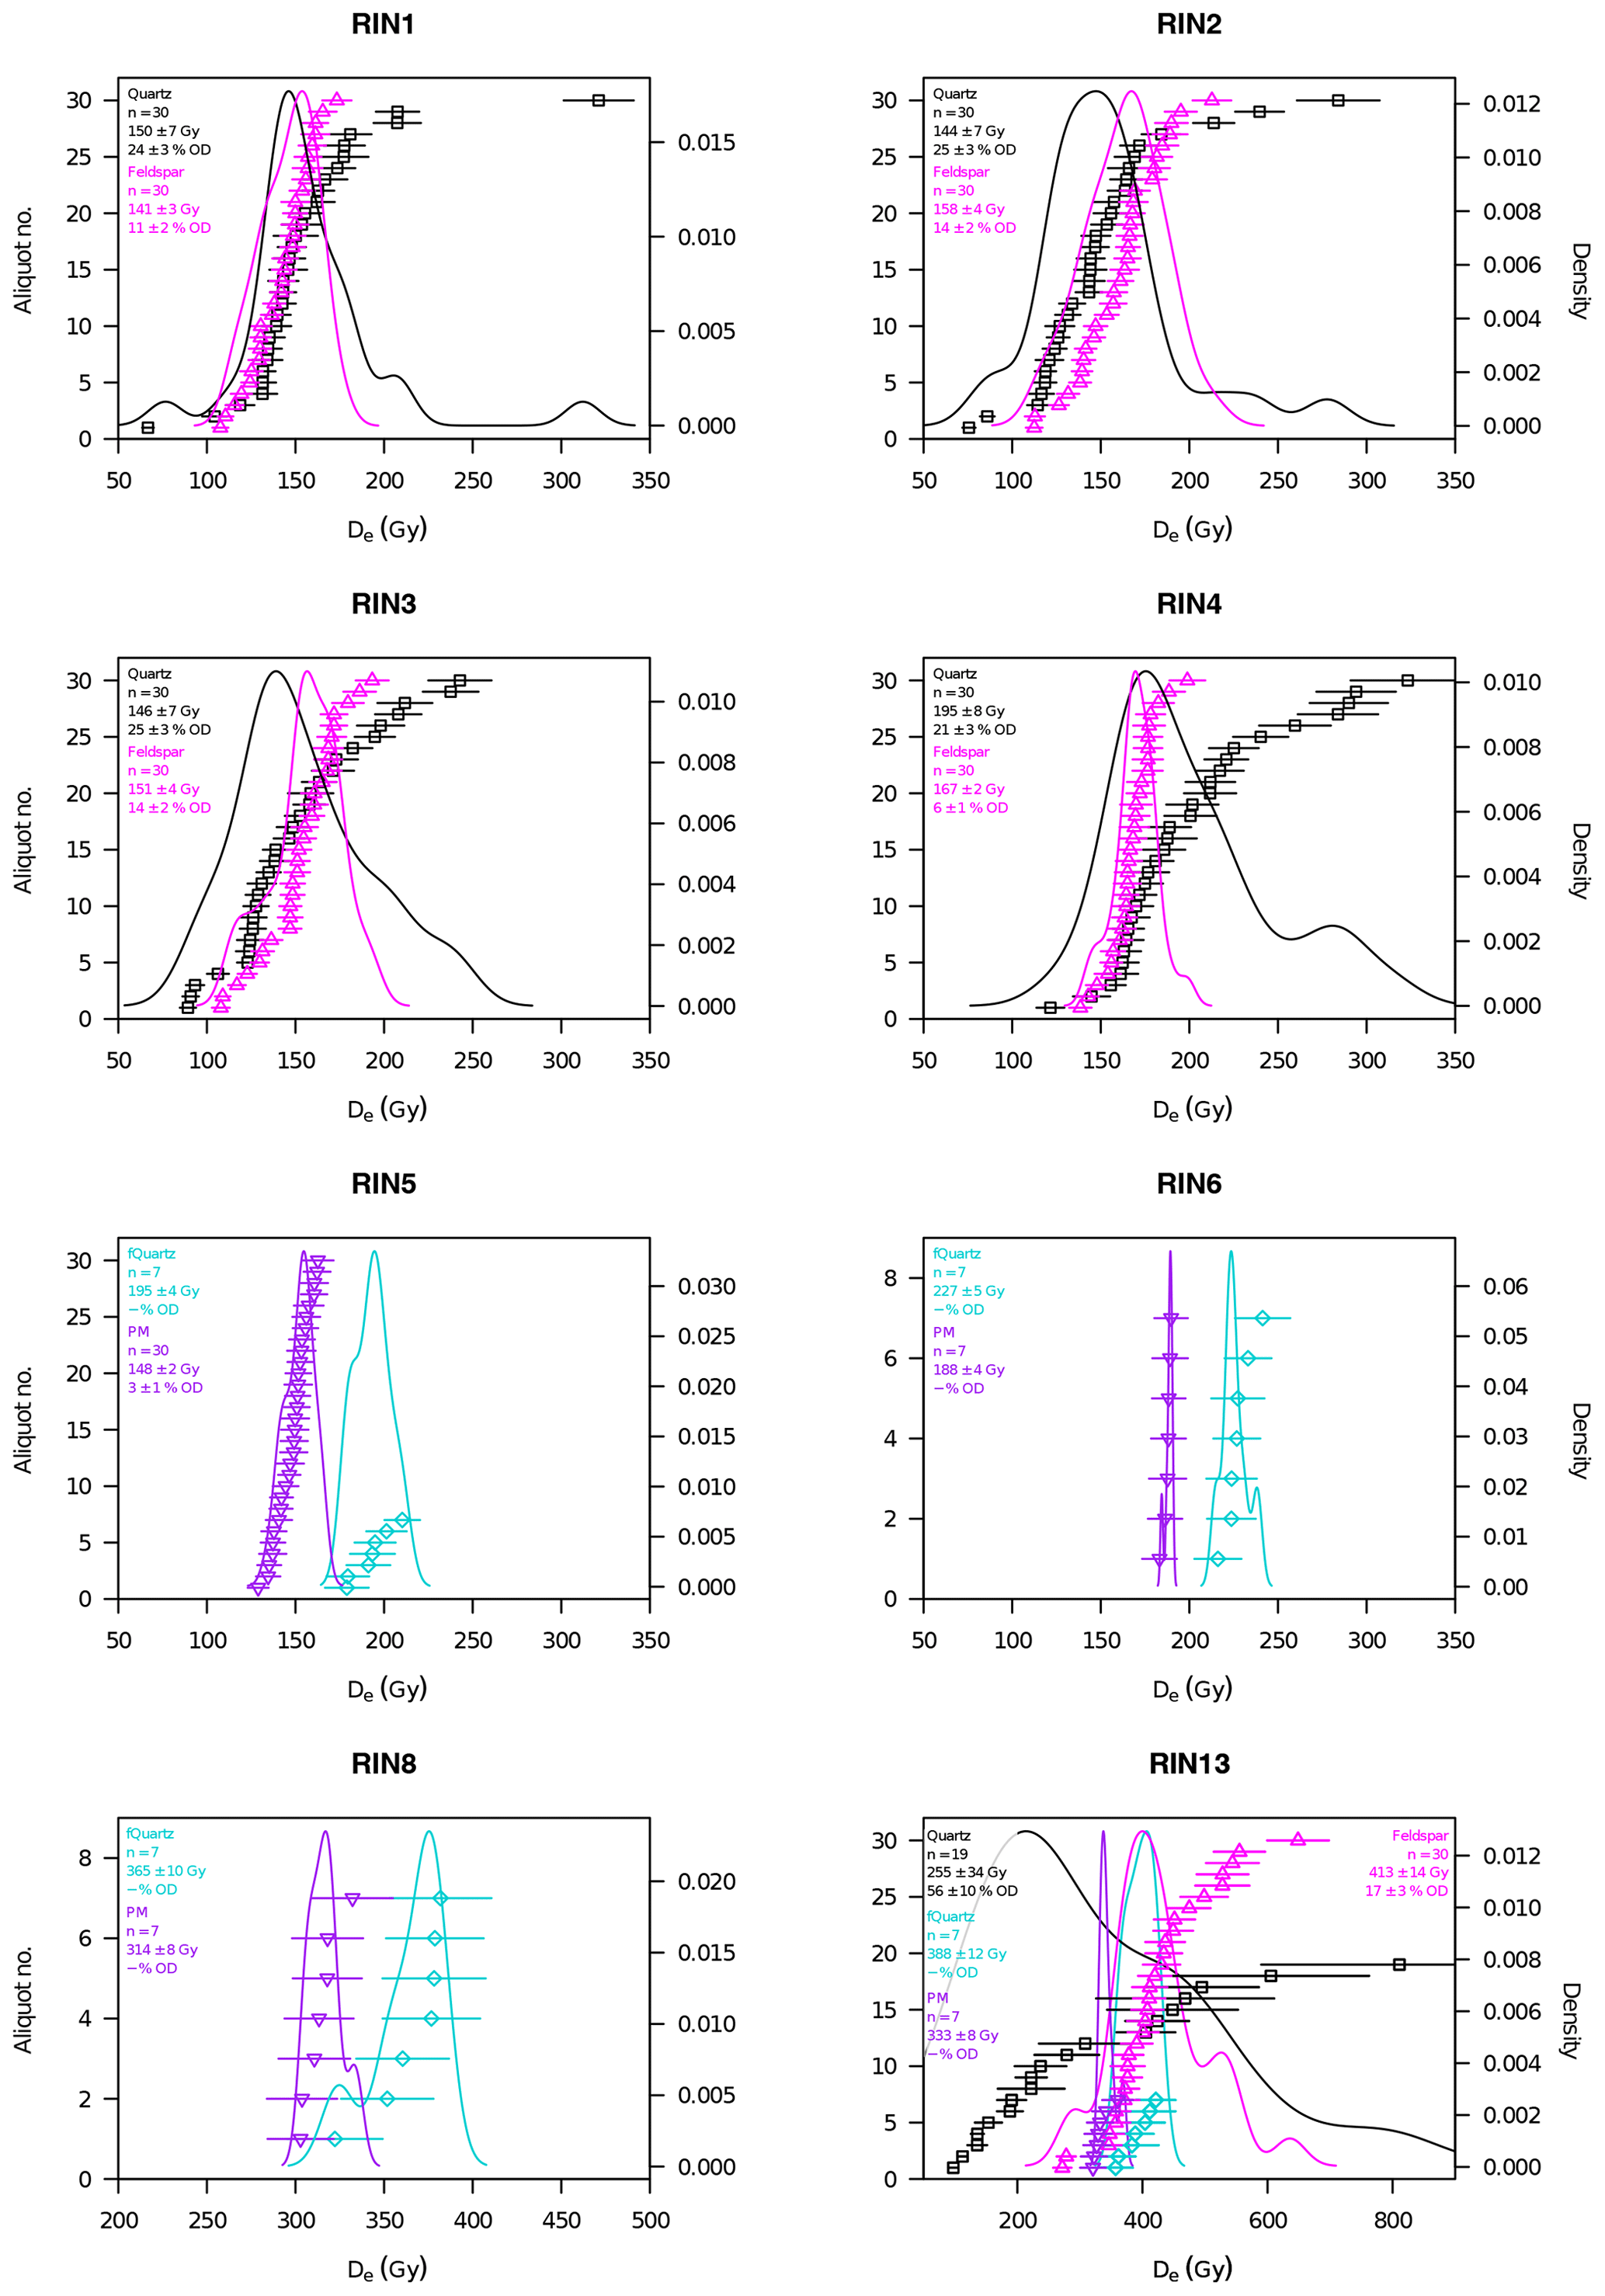
Figure 12De distributions of all measured samples and minerals. CAM De values are given with 1σ uncertainty. F and PM De values are uncorrected.
For PM, fading properties (ρ′-value of ; g-value of 2.4±0.6 % per decade) were obtained from one representative polymineral sample (RIN5). Following Lamothe et al. (2003), the corrected ages are 20 % to 100 % lower than those corrected using Kars et al. (2008). As the latter have shown good agreement for F and Q ages, ages calculated using Kars-corrected PM De values are presented in the following. Corrected PM ages of RIN5 and RIN6 are, with 138±7 ka and 169±9 ka, 22 % and 44 % higher than the associated fQ ages. While RIN5 is younger than to be expected from the Q and fading corrected F ages of the overlaying samples (RIN1 to RIN4), the derived fading corrected age is still consistent at 2σ with the latter. The corrected PM age of RIN6 is statistically consistent (at 1σ) with the ages of the overlaying samples. For RIN8 PM and RIN13 PM, corrected ages of 471±47 and 526±53 ka were calculated, respectively. Fading corrected De values are, with 1101±97 Gy (RIN8) and 955±86 Gy (RIN13), far beyond the 2×D0 values (RIN8 measured 80±40 Gy and simulated 536±4 Gy; RIN13 measured 515±39 Gy and simulated 534±3 Gy).
Both g-values obtained in this study are similar to those previously found for northern Switzerland (see Sect. 1). However, while most studies have abstained from applying fading corrections, the here-presented Kars fading-corrected F and Q ages are in good agreement, thereby justifying the application of this fading correction.
7.1 Quartz OSL
The De distributions of the four top Q samples show the tendency towards being positively skewed and have overdispersion (OD) values between 21 % ± 3 % and 25 % ± 3 % (Fig. 12). Arnold et al. (2007) recommend the application of a three-parameter minimum age model (MAM3) (Galbraith et al., 1999) for De distributions of partially bleached samples that are significantly positively skewed and/or show OD values of > 40 %. Following this, skewness of RIN1, RIN2 and RIN4 require the use of an MAM3. However, the decision tree of Arnold et al. (2007) is based on fluvial samples with diverse bleaching histories that are comparably young (< 20 ka). For older samples, it is suggested that distributions may vary, as time-dependent factors are expected to contribute to the data spread (Galbraith and Roberts, 2012). For example, the impact of beta microdosimetry (Mayya et al., 2006) will increase with the age of the sample. Therefore, the application of an MAM3 was refrained from and derived CAM De values of between 144±7 and 195±8 Gy were used for the age determination of the top four samples (Table 1). Q ages for these samples range between 164±9 ka (RIN4) and 180±11 ka (RIN3) and are statistically consistent with each other (1σ).
The De distributions of RIN13 Q is also positively skewed but presents a much higher OD value, 56±10 %, in comparison to the four top Q samples. Of the measured aliquots, 12 % are in saturation, allowing only for the assessment of a truncated distribution. In this case, the application of the MAM3 is also recommended (Arnold et al., 2007). Besides an expected impact of beta microdosimetry, fitting uncertainties are likely accountable for the skewness and spread of the distribution. For RIN13 Q, the natural doses are projected on the high proportion of the dose response curves, emphasising any fitting uncertainty. Therefore, an MAM3 De value is unlikely to represent the distribution most appropriately and the CAM De value is considered to represent a more conclusive lower limit of the distribution. The CAM De value of 255±34 Gy is consistent with the 2×D0 limit of 274±16 Gy, and it is arguable whether an obtained age at this range is still reliable. However, the minimum CAM age of 183±26 ka is consistent with ages of the top four samples, and from this and the stratigraphy it can be deduced that RIN13 is of similar age or older than RIN1 to RIN4.
The four fQ samples (RIN5, RIN6, RIN8, RIN13), representing depths of 10 to 36 m, show normally distributed De values (Figs. 2, 12, Table 1). This is to be expected for fine-grained samples, as the number of grains on each aliquot will have an averaging effect that will mask any skewness of the De distributions. CAM De values of 195±4 to 388±12 Gy were derived, which are all well below 2×D0 (Table 1). For the lowest samples (RIN13), the obtained age of 224±18 ka is close to the upper limit of reliable quartz ages in the region (Lowick et al., 2015). Obtained fQ ages for the two topmost lacustrine samples are 113±9 ka (RIN5) and 117±9 ka (RIN6). These ages are between 20 % and almost 50 % lower than ages derived for the Q fractions of RIN1 to RIN4. This, from a chrono-stratigraphy perspective, is unreasonable and can be ascribed to either issues with the De value or the dose rate determination and will be discussed in detail in Sect. 8.
7.2 Feldspar and polymineral IRSL
None of the F and PM De distributions show a trend towards being skewed and OD values are between 0 % and 17 % (Fig. 12). This is to be expected for the fine-grain PM aliquots that each represent an averaged De value derived from over a million grains. For F, each aliquot consists of only about 13 grains, whereof few give a luminescence signal (see Sect. 5.2), and the De distributions are not affected by skewness. Therefore, as no evidence for partial bleaching is observed, the CAM was applied for all F and PM samples (Table 1). For the upper four samples, Kars-corrected CAM De values of between 247±7 Gy (RIN1 F) and 297±6 Gy (RIN4 F) were derived, which equates to ages of 160±7 ka (RIN4) to 167±8 ka (RIN2). These ages are statistically consistent at 1σ with those of the Q fraction (Table 1). For RIN5 PM and RIN6 PM Kars-corrected CAM De values of 252±3 and 343±9 Gy or ages of 138±7 and 169±9 ka were obtained, respectively. RIN5 PM presents an age inversion ( ka) in comparison with the overlying samples RIN1 to RIN4. A similar trend is found for both RIN5 and RIN6 fQ ages. This, from a chrono-stratigraphy perspective, is unreasonable and can be ascribed to either issues with the De value or the dose rate determination and will be discussed in detail in Sect. 8. However, the PM age of RIN6 is statistically consistent at 1σ with overlying F ages.
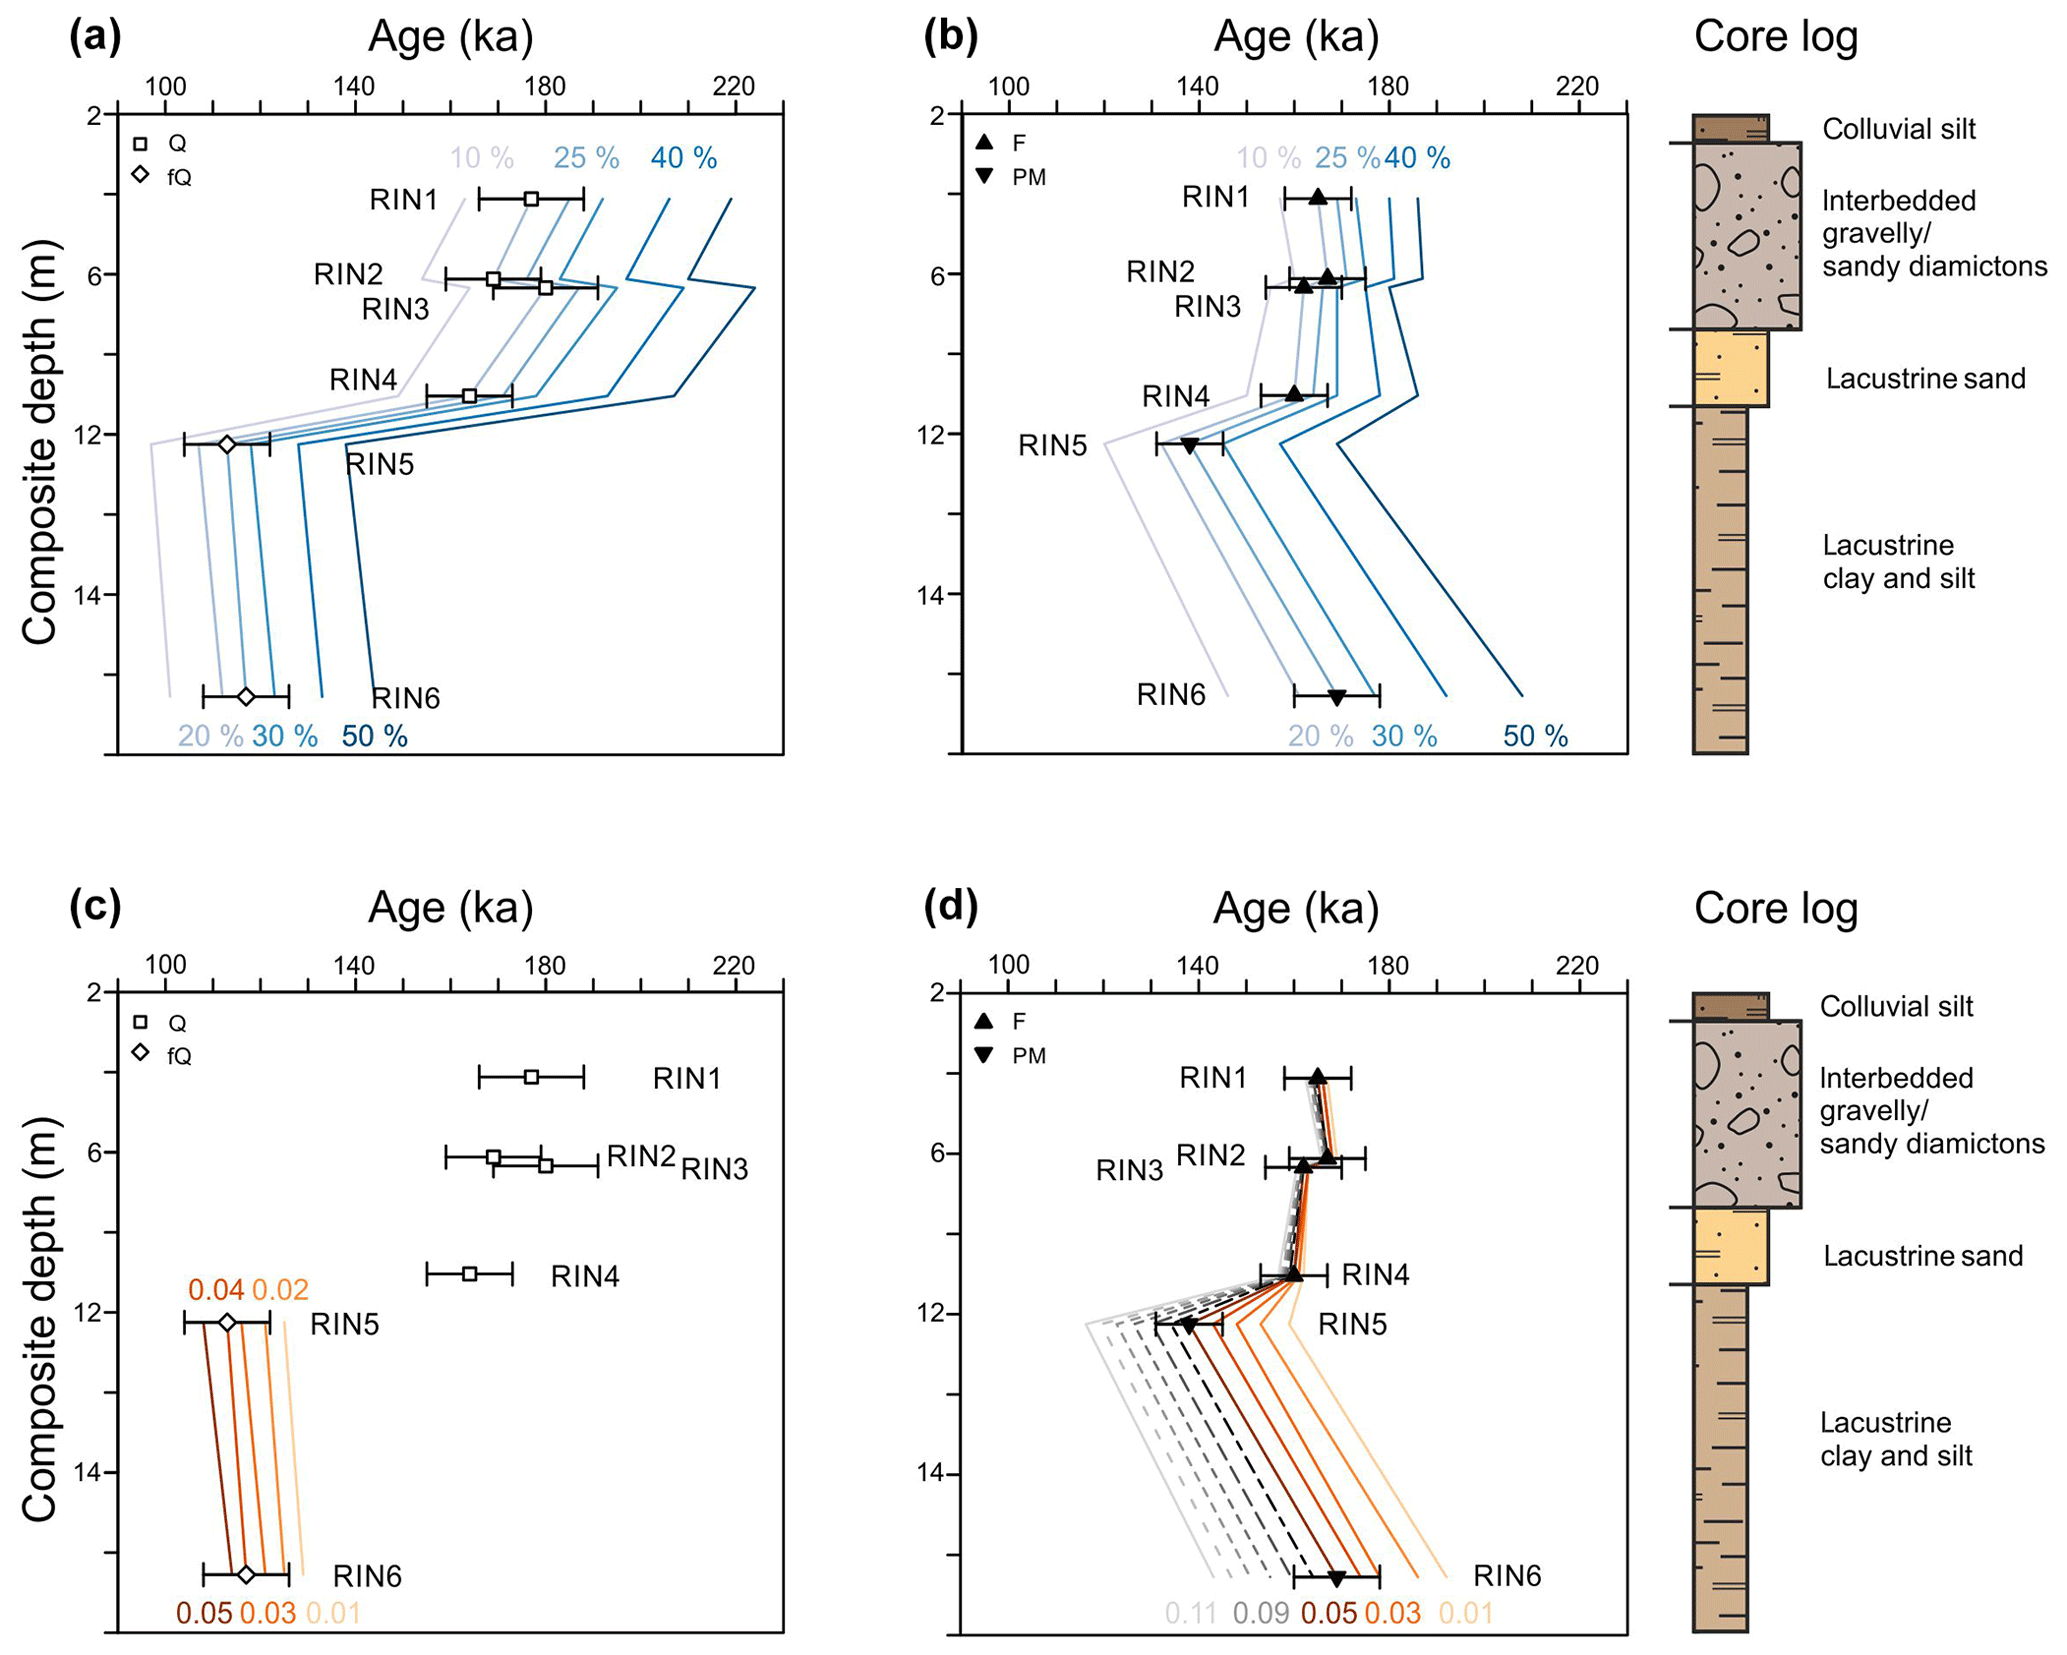
Figure 13Ages of (a) Q and fQ and (b) F and PM (fading corrected following Kars et al., 2008) are shown for water contents between 10 % and 50 % and plotted against depth (line signature). (c) Ages of fQ are shown for alpha efficiency values between 0.01 and 0.05 and plotted against depth (line signature). No alpha component was considered for age determination of HF-etched Q, but accepted ages are presented for completeness. (d) F and PM (fading corrected following Kars et al., 2008) ages for alpha efficiency values between 0.01 and 0.11. Accepted ages are presented with 1σ uncertainties as point signatures. The upper part of the core log is given on the right for comparison (see Fig. 2 for the full log).
For RIN13 PM, the age is in agreement with the minimum age of > 437 ka obtained for the F fraction of the same sample. There are three possible explanations for the high De values of RIN8 and RIN13: (1) the sediment was deposited about half a million years ago, (2) the applied fading correction overestimates for doses derived from the higher dose range of the response curve or (3) these De values are the result of an averaged signal with a greater contribution of partially bleached, high residual signals. The latter is an effect that is to be expected for glacier-proximal deposits that are likely to have had limited light exposure during short transport times. From the sedimentological context, samples RIN8 and RIN13 are likely from such an environment. However, no drastic increase in De values was observed for the fQ fraction, but it has to be considered that the OSL signal of quartz bleaches faster than feldspar. Nevertheless, corrected De values are higher than the 2×D0 values. This measure has been introduced as a dating limit for quartz (Wintle and Murray, 2006) but was found to be an appropriate measure for adequately dating feldspars as well (Zhang and Li, 2020). Therefore, De values of RIN8 PM, RIN13 PM and RIN13 F are unsuitable for the determination of finite ages.
For the top four samples, Q and fading-corrected F ages range between 160±7 ka (RIN4 F) and 180±11 ka (RIN3 Q) and are thereby statistically consistent with each other at 1σ. For the two samples (RIN5, RIN6) below, a discrepancy between fQ and PM ages (22 % to 44 %) is observed. In addition, fQ ages of these two samples are up to almost 50 % lower than those of the overlying samples RIN1 to RIN4. This leads to an age offset of ca. 50 ka between Q and fQ that is not accountable from a chrono-stratigraphic perspective. The observed age offset equals 20 % to 50 % difference and is likely to be emphasised through the actual age calculation, which in turn relies on derived De and DRtotal values. The latter are all based on the assumptions that (1) the long-term average estimates of the water content are accurate and (2) used alpha efficiency values are appropriate in this context.
8.1 Water content and age determination
A water content of 20 % ± 5 % was assumed for all but two samples, which is within 5 % uncertainty of the measured field water content (Table 2). RIN5 and RIN6 have a slightly higher field water content (23 % to 24 %) due to their argillaceous character, and hence an average long-term water content of 25 % ± 5 % was found to be more appropriate for these samples. For similar sedimentary facies, values between 20 % and 30 % have been used (Anselmetti et al., 2010; Dehnert et al., 2012; Lowick et al., 2015; Buechi et al., 2017). However, the assessment of an appropriate long-term water content is complex but important to avoid age over- or underestimations. It is well known that moisture has an attenuation effect of beta and gamma radiation (Zimmermann, 1971), which may lead to drastic changes in DRtotal and thereby age determination (Nathan and Mauz, 2008). Between 34 % and 49 % of water, in relation to the samples dry weights, was absorbed over a 24 h period by unconsolidated sample material in this study. The highest amounts of water were absorbed by RIN5 and RIN6, which also presented the highest field water contents. For the purpose of comparison, the water content maximum can be set to 50 % to represent the highest observed absorption capacity for unconsolidated sample material (Table 2). The DRtotal values are calculated for water contents between 10 % and 50 % in 10 % steps. In addition, a step with 25 % water content, as is assumed to be appropriate for age determination of RIN5 and RIN6, is included in the comparison. Recalculated ages (Fig. 13a and b) show that the difference in ages for the different water contents is up to 40 % for Q, 15 % to 25 % for F, and 40 % for PM and fQ. A water content of 10 % for Q and F (RIN1 to RIN4) results in statistically consistent ages at 2σ with fQ and PM (RIN5, RIN6) at 50 %. However, a 10 % moisture for the coarse-grained samples is unlikely, as under current conditions ground water penetrates these layers and oxidation features are present. Also, 50 % of moisture for fQ and PM are at the limit of maximum water absorption capacity for unconsolidated material of these samples. It is unlikely that for the consolidated deposits, as found in nature, the maximum absorption capacity will be equally high and that these samples were saturated to a maximum for over ca. 150 ka. Therefore, neither 50 % nor 10 % water content is considered representative as a long-term average. Consequently, assumptions about the water content may well have an effect on the age discrepancy between RIN5 and RIN6 and the coarse-grained samples from above (RIN1 to RIN4), but they are not the sole cause for this offset.
8.2 Alpha efficiency values and age determination
A further cause for the observed discrepancy may be found in the chosen alpha efficiency values (a-values), which account for the efficiency of alpha particles for producing luminescence and are grain size dependent (cf. Mauz et al., 2006). For the coarse Q fraction, the need to consider alpha radiation is circumvented by HF etching the outer rind of the grains and thereby removing the sphere penetrated by alpha particles. However, fQ grains cannot be etched due to the possibility of total dissolution, and therefore an appropriate a-value has to be chosen. In this study, an a-value of 0.04±0.02 was used for fQ, following Buechi et al. (2017). In the literature, a-values between 0.02±0.01 and 0.05±0.01 have been presented for fine-grained quartz from several continents (e.g. Rees-Jones, 1995; Mauz et al., 2006; Lai et al., 2008), and a-values of 0.03±0.02 to 0.05±0.01 were used in studies of northern Switzerland (e.g. Gaar and Preusser, 2012; Lowick et al., 2015; Buechi et al., 2017). For the polymineral fractions, a-values of up to 0.10±0.01 and 0.11±0.01 (e.g. Rees-Jones, 1995; Lang et al., 2003, Schmidt et al., 2018a) are presented in the literature. However, for two study sites in northern Switzerland, a-values with a mean of 0.05±0.01 have been determined (Preusser, 1999a, b; Preusser et al., 2001). Considering that these two studies represent the nearest approximation of geographical position and provenance, their a-value was used here.
The impact of a-value estimates is investigated by recalculating ages for different a-values (0.01 to 0.05 for fQ and 0.01 to 0.11 for PM, Fig. 13c and d). For fQ and PM, a reduction of the a-value leads to a 11 % to 16 % age increase, while for corrected F the a-value has an insignificant impact onto the finite ages (ca. 2 ka). Recalculated ages are consistent with each other at 2σ over the a-value spectrum between 0.01 and 0.05. Between corrected F and PM samples, lower a-values (e.g. 0.01) will decrease the age differences. However, the chosen a-value of 0.05 is at the lower limit of values proposed in the literature. A sample-specific determination of a-values is needed to justify the use of a lower a-value. However, in the absence of sample-specific a-values and limited gain of age precision, the initially chosen a-value will be retained.
Also, with the lowest possible a-value of 0.01 for fQ, an offset to the Q ages of the top four samples and RIN5 and RIN6 is still apparent with ca. 20 ka. A further increase of the used a-values will amplify the age offset. Consequently, neither the chosen a-value nor water content is the sole cause for the observed age offset.
8.3 Implications
Neither the chosen water contents nor the a-values are the sole cause for the age offset between RIN5 and RIN6 fQ and RIN1 to RIN4 Q. Given the internal consistency of Q ages for RIN1 to RIN4 and the chrono-stratigraphic context, fQ ages of this study should be regarded as minimum age estimates. Unlike for other studies in the area (e.g. Gaar and Preusser, 2012), corrected F ages are in agreement with Q ages while uncorrected ages are suspect to significant age underestimation. However, obtained Q ages remain under the reliable quartz luminescence age limit of ca. 250 ka (Anselmetti et al., 2010; Dehnert et al., 2012; Lowick et al., 2015; Buechi et al., 2017).
With only minimum age estimates of the two lowest samples (RIN8 fQ > 163 ka, RIN13 Q > 183 ka, RIN13 fQ > 224 ka) it remains unclear whether the transition from glacial- to proglacial-influenced environments to a lacustrine environment was of a rapid nature or occurred much earlier than the deposition of the entire lacustrine sequence. For the lacustrine sequence, ages of 169 ka (RIN6 PM) and 138 ka (RIN5 PM) were obtained. The sandy top of the lacustrine unit is ca. 160 ka (RIN4 F, Q), which is statistically consistent with ages from the sandy diamicton (RIN1 to RIN3; 160 to 180 ka F and Q). This indicates a deposition of at least 16.6 m during Marine Isotope Stage 6 (MIS 6) with a rapid transition from lacustrine to colluvial-dominated periglacial environments.
Luminescence properties of coarse- and fine-grained quartz, feldspar and polymineral fractions of eight samples from a palaeovalley in northern Switzerland were assessed. Quartz components have been found to be stable, and the occurrence of a second exponential function in the dose response curves is missing. Noteworthy is the presence of positively skewed De distributions for coarse-grained quartz, but the lack of a comparable pattern for the slower-bleaching feldspar suggests that partial bleaching is unlikely to influence these distributions. However, an age discrepancy between fine- and coarse-grained quartz is present. Different scenarios for dose rate components (a-value, water content) are assessed but do not explain the age discrepancy. From the two applied fading corrections, the Kars-fading-corrected feldspar ages are in good agreement with each other, with the quartz ages and one fading-corrected polymineral age from the unit below. Noteworthy is the presence of positively skewed De distributions for coarse-grained quartz, while the slower-bleaching feldspar lacks a comparable pattern, suggesting that partial bleaching is unlikely to influence these distributions. Not all minerals, fractions or samples are suitable for dating using the here-presented luminescence techniques; nonetheless, this systematic investigation of different luminescence signals allows for a decisive chronology to be established. For the study site, Rinikerfeld, a deposition of at least 16.6 m during MIS 6 with a rapid transition from lacustrine to colluvial-dominated periglacial environments is reconstructed. For the two lowest samples, only minimum age estimates can be derived from the chrono-stratigraphic context, indicating that those glacial to proglacial diamictons are of similar age or older than the top units.
Data is available upon request.
Manuscript conceptualisation and experiment design was conducted by DM with support by FP. DM obtained and analysed the presented data and prepared the manuscript with contributions from all co-authors. Sample context and material was provided by MB and LG. LG contributed Fig. 1 and parts of Fig. 2 and Fig. 13, while GD was instrumental for funding acquisition.
The authors declare that they have no conflict of interest.
The authors like to thank Lisa Ahlers for her support in the Freiburg OSL laboratory. Sebastian Kreutzer, an anonymous reviewer, and the editor, Julie Durcan, are thanked for their constructive comments on earlier versions of the manuscript.
This research has been supported by the National Cooperative for the Disposal of Radioactive Waste (NAGRA), Switzerland (“ZFT Nr. ZVK 2017 07 14 03” and “ZFT Nr. ZVK 2019 08 09”).
This paper was edited by Julie Durcan and reviewed by Sebastian Kreutzer and one anonymous referee.
Aitken, M. J.: An Introduction to Optical Dating – The Dating of Quaternary Sediments by the Use of Photon-stimulated Luminescence, Oxford University Press, 267 pp., https://doi.org/10.5860/choice.36-6294, 1998.
Anselmetti, F. S., Drescher-Schneider, R., Furrer, H., Graf, H. R., Lowick, S. E., Preusser, F., and Riedi, M. A: A ∼ 180,000 years sedimentation history of a perialpine overdeepened glacial trough (Wehntal, N-Switzerland), Swiss J. Geosci., 103, 345–361, https://doi.org/10.1007/s00015-010-0041-1, 2010.
Arnold, L. J., Bailey, R. M., and Tucker, G. E.: Statistical treatment of fluvial dose distributions from southern Colorado arroyo deposits, https://doi.org/10.1016/j.quageo.2006.05.003, Quat. Geochronol., 2, 162–167, 2007.
Auclair, M., Lamothe, M., and Huot, S: Measurement of anomalous fading for feldspar IRSL using SAR. Radiat. Meas., 37, 487–492, https://doi.org/10.1016/s1350-4487(03)00018-0, 2003.
Bini, A., Buoncristiani, J. F., Coutterand, S., Ellwanger, D., Felber, M., Florineth, D., Graf, H. R., Keller, O., Kelly, M., Schlüchter, C., and Schoeneich, P.: Die Schweiz während des letzteiszeitlichen Maximums (LGM) (Map 1 : 500 000), Swisstopo, Wabern, 2009.
Bitterli-Dreher, P., Graf, H. R., Naef, H., Diebold, P., Matousek, F., Burger, H., ND Pauli-Gabi, T.: Geologischer Atlas der Schweiz 1 : 25 000, Blatt 1070 Baden, Erläuterungen, Bundesamt für Landestopografie swisstopo, 152 pp., 2007.
Bluszcz, A. and Adamiec, G.: Application of differential evolution to fitting OSL decay curves, Radiat, Meas., 41, 886–891, https://doi.org/10.1016/j.radmeas.2006.05.016, 2006.
Buechi, M. W., Lowick, S. E., and Anselmetti, F. S.: Luminescence dating of glaciolacustrine silt in overdeepened basin fills beyond the last interglacial, Quat. Geochronol., 37, 55–67, https://doi.org/10.1016/j.quageo.2016.09.009, 2017.
Buylaert, J. P., Thiel, C., Murray, A. S., Vandenberghe, D. A., Yi, S., and Lu, H.: IRSL and post-IR residual dose recorded in modern dust samples from the Chinese Loess Plateau, Geochronometria, 38, 432–440, https://doi.org/10.2478/s13386-011-0047-0, 2011.
Cunningham, A. C. and Wallinga, J.: Selection of integration time intervals for quartz OSL decay curves, Quat. Geochronol., 5, 657–666, https://doi.org/10.1016/j.quageo.2010.08.004, 2010.
Degering, D. and Degering, A: Change is the only constant – time-dependent dose rates in luminescence dating, Quat. Geochronol., 58, 1–14, https://doi.org/10.1016/j.quageo.2020.101074, 2020.
Dehnert, A., Lowick, S. E., Preusser, F., Anselmetti, F. S., Drescher-Schneider, R., Graf, H. R., Heller, F., Horstmeyer, H., Kemna, H. A., Nowactzyk, N. R., Züger, A., and Furrer, H.: Evolution of an overdeepened trough in the northern Alpine Foreland at Niederweningen, Switzerland, Quat. Sci. Rev., 34, 127–145, https://doi.org/10.1016/j.quascirev.2011.12.015, 2012.
DIN 18132:2012-04: Baugrund, Versuche und Versuchsgeräte – Bestimmung des Wasseraufnahmevermögens, https://doi.org/10.31030/1870018, 2016.
Duller, G. A.: A new method for the analysis of infrared stimulated luminescence data from potassium feldspar, Radiat. Meas., 23, 281–285, https://doi.org/10.1016/1350-4487(94)90053-1, 1994.
Duller, G. A.: Behavioural studies of stimulated luminescence from feldspars, Radiat. Meas., 27, 663–694, https://doi.org/10.1016/s1350-4487(97)00216-3, 1997.
Duller, G. A.: Single grain optical dating of glacigenic deposits, Quat. Geochronol, 1, 296–304, https://doi.org/10.1016/j.quageo.2006.05.018, 2006.
Gaar, D. and Preusser, F.: Luminescence dating of mommoth remains from northern Switzerland, Quat. Geochronol., 10, 257–263, https://doi.org/10.1016/j.quageo.2012.02.007, 2012.
Gaar, D., Lowick, S. E., and Preusser, F.: Performance of different luminescence approaches for the dating of known-age glaciofluvial deposits from northern Switzerland, Geochronometria, 41, 65–80, https://doi.org/10.2478/s13386-013-0139-0, 2013.
Galbraith, R. F. and Roberts, R. G.: Statistical aspects of equivalent dose and error calculation and display in OSL dating: An overview and some recommendations, Quat. Geochronol., 11, 1–27, https://doi.org/10.1016/j.quageo.2012.04.020, 2012.
Galbraith, R. F., Roberts, R. G., Laslett, G. M., Yoshida, H., and Olley, J. M.: Optical dating of single and multiple grains of quartz from Jinmium rock shelter, Northern Australia: Part I, experimental design and statistical models, Archaeometry, 41, 339–364, https://doi.org/10.1111/j.1475-4754.1999.tb00987.x, 1999.
Gegg, L., Kuster, A. M., Schmid, D., and Buechi, M. W.: Quaternary Boreholes QBO Riniken-1 & -2 (QRIN1 & QRIN2), Data Report, Nagra Arbeitsbericht NAB 18–40, 8 pp., available at: https://www.nagra.ch/de/cat/publikationen/arbeitsberichte-nabs/nabs-2018/downloadcenter.htm (last access: 4 February 2019), 2018.
Godfrey-Smith, D. I., Huntley, D. J., and Chen, W. H.: Optical dating studies of quartz and feldspar sediment extracts, Quat. Sci. Rev., 7, 373–380, https://doi.org/10.1016/0277-3791(88)90032-7, 1988.
Graf, A. A., Strasky, S., Ivy-Ochs, S., Akçar, N, Kubik, P. W., Burkhard, M., and Schlüchter, C.: First results of cosmogenic dated pre-Last Glaciation erratics from the Montoz area, Jura Mountains, Switzerland, Quatern. Int., 164–165, 43–52, https://doi.org/10.1016/j.quaint.2006.12.022, 2007.
Graf, H. R.: Stratigraphie von Mittel- und Spätpleistozän in der Nordschweiz, Textband, Federal Office of Topography swisstopo, 198 pp., 2009.
Huntley, D .J.: An explanation of the power-law decay of luminescence, J. Phys.-Condens. Mat., 18, 1359–1365, https://doi.org/10.1088/0953-8984/18/4/020, 2006.
Huntley, D. J. and Baril, M. R.: The K content of the K-feldspars being measured in optical dating or in thermoluminescence dating, Anc. TL, 15, 11–13, 1997.
Huntley, D. J. and Lamothe, M.: Ubiquity of anomalous fading in K-feldspars and measurement and correction for it in optical dating, Can. J. Earth Sci., 38, 1093–1106, https://doi.org/10.1139/e01-013, 2001.
Jain, M., Murray, A. S., and Bøtter-Jensen, L.: Characterisation of blue-light stimulated luminescence components in different quartz samples: implications for dose measurement, Radiat. Meas., 37, 441–449, https://doi.org/10.1016/s1350-4487(03)00052-0, 2003.
Kars, R. H., Wallinga, J., and Cohen, K. M.: A new approach towards anomalous fading correction for feldspar IRSL dating – tests on samples in field saturation, Radiat. Meas., 43, 786–790, https://doi.org/10.1016/j.radmeas.2008.01.021, 2008.
King, G. E. and Burow, C.: Calc_Huntley2006(): Apply the Huntley (2006) model, Function version 0.4.1, in: Luminescence: Comprehensive Luminescence Dating Data Analysis, edited by: Kreutzer, S., Burow, C., Dietz, M., Fuchs, M. C., Schmidt, C., Fischer, M., and Friedrich, J., R package version 0.9.0.109, available at: https://CRAN.R-project.org/package=Luminescence (last access: 7 November 2019), 2019.
Klasen, N., Fiebig, M., and Preusser, F.: Applying luminescence methodology to key sites of Alpine glaciations in Southern Germany, Quatern. Int., 420, 240–258, https://doi.org/10.1016/j.quaint.2015.11.023, 2016.
Kock, S., Kramers, J. D., Preusser, F., and Wetzel, A.: Dating of Late Pleistocene terrace deposits of the River Rhine using Uranium series and luminescence methods: Potential and limitations, Quat. Geochronol., 4, 363–373, https://doi.org/10.1016/j.quageo.2009.04.002, 2009.
Kreutzer, S. and Mercier, N.: Calc_Lamothe2003(): Apply fading correction after Lamothe et al., 2003. Function version 0.1.0, in: Luminescence: Comprehensive Luminescence Dating Data Analysis, edited by: Kreutzer, S., Burow, C., Dietz, M., Fuchs, M. C., Schmidt, C., Fischer, M., and Friedrich, J., R package version 0.9.0.109, available at: https://CRAN.R-project.org/package=Luminescence, last access: 12 November 2019.
Lai, Z. P.: Chronology and the upper dating limit for loess samples from Luochuan section in the Chinese Loess Plateau using quartz OSL SAR protocol, J. Asian Earth Sci., 37, 176–185, https://doi.org/10.1016/j.jseaes.2009.08.003, 2010.
Lai, Z. P., Zöller, L., Fuchs, M., and Brückner, H.: Alpha efficiency determination for OSL of quartz extracted from Chinese loess, Radiat. Meas., 43, 767–770, https://doi.org/10.1016/j.radmeas.2008.01.022, 2008.
Lamothe, M., Auclair, M., Hamzaoui, C., and Huot, S.: Towards a prediction of long-term anomalous fading of feldspar IRSL, Radiat. Meas., 37, 493–498, https://doi.org/10.1016/s1350-4487(03)00016-7, 2003.
Lang, A., Hatté, C., Rousseau, D. D., Antoine, P., Fontugne, M., and Zöller, L., Hambach, U.: High-resolution chronologies for loess: comparing AMS 14C and optical dating results, Quat. Scie. Rev., 22, 953–959, https://doi.org/10.1016/s0277-3791(03)00035-0, 2003.
Li, B. and Li, S.-H.: Comparison of De estimates using the fast component and the medium component of quartz OSL, Radiat. Meas. 41, 125–136, https://doi.org/10.1016/j.radmeas.2005.06.037, 2006a.
Li, S.-H. and Li, B.: Dose measurement using fast component of LM-OSL signals from quartz, Radiat. Meas., 41, 534–541, https://doi.org/10.1016/j.radmeas.2005.04.029, 2006b.
Lowick, S. E., Preusser, F., Pini, R., and Ravazzi, C.: Underestimation of fine grain quartz OSL dating towards the Eemian: Comparison with palynostratigraphy from Azzano Decimo, northern Italy, Quat. Geochronol., 5, 583–590, https://doi.org/10.1016/j.quageo.2009.12.003, 2010.
Lowick, S. E., Trauerstein, M., and Preusser, F.: Testing the application of post IR-IRSL dating to fine grain waterlain sediments, Quat. Geochronol., 8, 33–40, https://doi.org/10.1016/j.quageo.2011.12.003, 2012.
Lowick, S. E., Buechi, M. W., Gaar, D., Graf, H. R., and Preusser, F.: Luminescence dating of Middle Pleistocene proglacial deposits from northern Switzerland: methodological aspects and stratigraphical conclusions, Boreas, 44, 459–482, https://doi.org/10.1111/bor.12114, 2015.
Mauz, B., Packmann, S., and Lang, A.: The alpha effectiveness in silt-sized quartz: New data obtained by single and multiple aliquot protocols, Anc. TL, 24, 47–52, 2006.
Mayya, Y. S., Morthekai, P., Murari, M. K., and Singhvi, A. K.: Towards quantifying beta microdosimetric effects in single-grain quartz dose distribution, Radiat. Meas., 41, 1032–1039, 2006.
Murray, A. S. and Wintle, A. G.: Luminescence dating of quartz using an improved single-aliquot regenerative-dose protocol, Radiat. Meas., 32, 57–73, https://doi.org/10.1016/s1350-4487(99)00253-x, 2000.
Murray, A. S., Buylaert, J. P., Henriksen, M., Svendsen, J. I., and Mangerud, J.: Testing the reliability of quartz OSL ages beyond the Eemian, Radiat. Meas., 43, 776–780, https://doi.org/10.1016/j.radmeas.2008.01.014, 2008.
Murray, A. S., Thomsen, K. J., Masuda, N., Buylaert, J. P., and Jain, M.: Identifying well-bleached quartz using the different bleaching rates of quartz and feldspar luminescence signals, Radiat. Meas., 47, 688–695, https://doi.org/10.1016/j.radmeas.2012.05.006, 2012.
Nathan, R. P. and Mauz, B.: On the dose-rate estimate of carbonate-rich sediments for trapped charge dating, Radiat. Meas., 43, 14–25, https://doi.org/10.1016/j.radmeas.2007.12.012, 2008.
Olley, J. M., Pietsch, T., and Roberts, R. G.: Optical dating of Holocene sediments from a variety of geomorphic settings using single grains of quartz, Geomorphology, 60, 337–358, https://doi.org/10.1016/j.geomorph.2003.09.020, 2004.
Pawley, S. M., Toms, P., Armitage, S. J., and Rose, J.: Quartz luminescence dating of Anglian Stage (MIS 12) fluvial sediments: Comparison of SAR age estimates to the terrace chronology of the Middle Thames valley, UK, Quat. Geochronol., 5, 569–582, https://doi.org/10.1016/j.quageo.2009.09.013, 2010.
Peng, J., Li, B., More, J., Garbow, B., Hillstrom, K., Burkhardt, J., Gilbert, P., and Varadhan, R.: numOSL: Numeric Routines for Optically Stimulated Luminescence Dating, R package version 2.6, https://CRAN.R-project.org/package=numOSL (last access: 12 November 2019), 2018.
Prescott, J. R. and Hutton, J. T.: Cosmic ray contribution to dose rates for luminescence and ESR dating: large depths and long-term time variations, Radiat. Meas., 23, 497–500, https://doi.org/10.1016/1350-4487(94)90086-8, 1994.
Preusser, F.: Luminescence dating of fluvial sediments and overbank deposits from Gossau, Switzerland: fine grain dating, Quat. Geochronol., 18, 217–222, https://doi.org/10.1016/s0277-3791(98)00054-7, 1999a.
Preusser, F.: Lumineszenzdatierung fluviatiler Sedimente: Fallbeispiele aus der Schweiz und Norddeutschland, Kölner Forum für Geologie und Paläontologie, 3/1999, edited by: Herbig, H. G., Geologisches Institut der Universität zu Köln, 62 pp., 1999b.
Preusser, F., Müller, B. U., and Schüchter, C.: Luminescence dating of sediments from Luthern Valley, Central Switzerland, and implications for the chronology of the last glacial cycle, Quaternary Res., 55, 215–222, https://doi.org/10.1006/qres.2000.2208, 2001.
Preusser, F., Graf, H. R., Keller, O., Krayss, E., and Schlüchter, C.: Quaternary glaciation history of northern Switzerland, Quat. Sci. J., 60, 282–305, https://doi.org/10.3285/eg.60.2-3.06, 2011.
Preusser, F., Muru, M., and Rosentau, A.: Comparing different post-IR IRSL approaches for the dating of Holocene coastal foredunes from Ruhnu Island, Estonia, Geochronometria, 41, 342–351, https://doi.org/10.2478/s13386-013-0169-7, 2014.
Raab, T., Leopold, M., and Völkel, J.: Character, age, and ecological significance of Pleistocene periglacial slope deposits in Germany, Phys. Geogr., 28, 451–473, https://doi.org/10.2747/0272-3646.28.6.451, 2007.
Rees-Jones, J.: Optical dating of young sediments using fine-grain quartz, Anc. TL, 13, 9–14, 1995.
Schmidt, C., Bösken, J., and Kolb, T.: Is there a common alpha- efficiency in polymineral samples measured by various infrared stimulated luminescence protocols?, Geochronometria, 45, 160–172, https://doi.org/10.1515/geochr-2015-0095, 2018a.
Schmidt, C., Friedrich, J., Adamiec, G., Chruścińska, A., Fasoli, M., Kreutzer, S., Martini, M., Panzeri, L., Polymeris, G. S., Przegiętka, K., Valla, P. G., King, G. E., and Sanderson, D. C.: How reproducible are kinetic parameter constraints of quartz luminescence? An interlaboratory comparison for the 110 ∘C TL peak, Radiat. Meas., 110, 14–24, https://doi.org/10.1016/j.radmeas.2018.01.002, 2018b.
Spencer, J. Q. and Owen, L. A.: Optically stimulated luminescence dating of Late Quaternary glaciogenic sediments in the upper Hunza valley: validating the timing of glaciation and assessing dating methods, Quat. Scie. Rev., 23, 175–191, https://doi.org/10.1016/s0277-3791(03)00220-8, 2004.
Spooner, N. A.: On the optical dating signal of quartz, Radiat. Meas., 23, 593–600, https://doi.org/10.1016/1350-4487(94)90105-8, 1994.
Steffen, D., Preusser, F., and Schlunegger, F.: OSL quartz age underestimation due to unstable signal components, Quat. Geochronol., 4, 353–362, https://doi.org/10.1016/j.quageo.2009.05.015, 2009.
Swisstopo: swissALTI3D, Bundesamt für Landestopographie, swisstopo, available at: https://shop.swisstopo.admin.ch/en/products/height_models/alti3D (last access: 31 August 2018), 2013.
Thomsen, K. J., Murray, A. S., Jain, M., and Bøtter-Jensen, L.: Laboratory fading rates of various luminescence signals from feldspar-rich sediment extracts, Radiat. Meas., 43, 1474–1486, https://doi.org/10.1016/j.radmeas.2008.06.002, 2008.
Thiel, C., Buyleart, J-P., Murray, A. S., Terhost, B., Hofer, I., Tsukamoto, S., and Frechen, M.: Luminescence dating of the Stratzing loess profile (Austria) – Testing the potential of an elevated temperature post-IR IRSL protocol, Quatern. Int., 234, 23–31, https://https://doi.org/10.1016/j.quaint.2010.05.018, 2011.
Timar, A., Vandenberghe, D. A., Panaiotu, E. C., Panaiotu, C. G., Necula, C., Cosma, C., and van den Haute, P.: Optical dating of Romanian loess using fine-grained quartz, Quat. Geochronol., 5, 143–148, https://doi.org/10.1016/j.quageo.2009.03.003, 2010.
Timar-Gabor, A., Vandenberghe, D. A., Vasiliniuc, S., Panaoitu, E. E., Dimofte, D., and Cosma, C.: Optical dating of Romanian loess: A comparison between silt-sized and sand-sized quartz, Quatern. Int., 240, 62–70, https://doi.org/10.1016/j.quaint.2010.10.007, 2011.
Trauerstein, M., Lowick, S. E., Preusser, F., and Veit, H.: Testing the suitability of dim sedimentary quartz from northern Switzerland for OSL burial dose estimation, Geochronomoetria, 44, 66–76, https://doi.org/10.1515/geochr-2015-0058, 2017.
Wallinga, J., Murray, A. S., and Duller, G. A.: Underestimation of equivalent dose in single-aliquot optical dating of feldspar caused by preheating, Radiat. Meas., 32, 691–695, https://doi.org/10.1016/s1350-4487(00)00127-x, 2000.
Wintle, A. G.: Anomalous Fading of Thermoluminescence in Mineral Samples, Nature, 245, 143–144, https://doi.org/10.1038/245143a0, 1973.
Wintle, A. G.: Luminescence dating: where it has been and where it is going, Boreas, 37, 471–482, https://doi.org/10.1111/j.1502-3885.2008.00059.x, 2008.
Wintle, A. G. and Murray, A. S.: A review of quartz optically stimulated luminescence characteristics and their relevance in single-aliquot regeneration dating protocols, Radiat. Meas. 41, 369–391, https://doi.org/10.1016/j.radmeas.2005.11.001, 2006.
Zhang, J. and Li., S.-H.: Review of the Post-IR IRSL Dating Protocols of K-Feldspar, Methods and Protocols, 3, 7, 1–20, https://doi.org/10.3390/mps3010007, 2020.
Zimmermann, D. W.: Thermoluminescent dating using fine grains from pottery, Archaeometry, 13, 29–52, https://doi.org/10.1111/j.1475-4754.1971.tb00028.x, 1971.
- Abstract
- Introduction
- Site setting and samples
- Sample preparation, equipment and dose rate determination
- Performance tests
- Signal properties
- Fading attributes and correction
- De distributions and ages
- Age comparison
- Conclusions
- Data availability
- Author contributions
- Competing interests
- Acknowledgements
- Financial support
- Review statement
- References