the Creative Commons Attribution 4.0 License.
the Creative Commons Attribution 4.0 License.
 | 23 Nov 2020
Expanding the limits of laser-ablation U–Pb calcite geochronology
Andrew R. C. Kylander-Clark
U–Pb geochronology of calcite by laser-ablation inductively coupled plasma mass spectrometry (LA-ICPMS) is an emerging field with potential to solve a vast array of geologic problems. Because of low levels of U and Pb, measurement by more sensitive instruments, such as those with multiple collectors (MCs), is advantageous. However, whereas measurement of traditional geochronometers (e.g., zircon) by MC-ICPMS has been limited by detection of the daughter isotope, U–Pb dating of calcite can be limited by detection of the parent isotope if measured on a Faraday detector. The Nu P3D MC-ICPMS employs a new detector array to measure all isotopes of interest on Daly detectors. A new method, described herein, utilizes the low detection limit and high dynamic range of the Nu P3D for calcite U–Pb geochronology and compares it with traditional methods. Data from natural samples indicate that measurement of 238U by Daly is advantageous at count rates < 30 000; this includes samples low in U or those necessitating smaller spots. Age precision for samples run in this mode are limited by 207Pb counts and the maximum U ∕ Pbc. To explore these limits – i.e., the minimum U, Pb, and U ∕ Pb ratios that can be measured by LA-ICPMS – a model is created and discussed; these models are meant to serve as a guide to evaluate potential candidate materials for geochronology. As an example, for samples necessitating a < 1 Ma uncertainty, a minimum of ∼ 10 ppb U is needed at a spot size of 100 µm and rep rate of 10 Hz; absolute uncertainty scales roughly with U concentration.
- Article
(6118 KB) - Full-text XML
-
Supplement
(217 KB) - BibTeX
- EndNote


Calcite U–Pb geochronology by laser-ablation inductively coupled plasma mass spectrometry (LA-ICPMS) is a relatively new technique with untapped potential for solving numerous geochronologic problems from the timing of faulting (e.g., Roberts and Walker, 2016; Nuriel et al., 2017; Goodfellow et al., 2017) and the age of ore deposits (Burisch et al., 2017) to paleoclimate, sedimentation, and diagenesis (e.g., Mangenot et al., 2018; Rasbury et al., 1997; Hoff et al., 1995; Winter and Johnson, 1995; Wang et al., 1998; Rasbury et al., 1998). Early studies focused on carbonates more likely to contain high concentrations of U, such as speleothems (e.g., Richards et al., 1998), because the method employed – thermal ionization mass spectrometry (TIMS) – required weeks to produce reliable ratios; samples with a low likelihood of success, that is, those with potentially low U contents, were ignored. With the advent of LA-ICPMS, however, sample throughput and analytical costs have been greatly reduced, such that hundreds of geoanalytical facilities can, at the very least, screen a large number of samples and choose those suitable for geochronology in a relatively short period of time and for little cost; sample preparation is minimal, several samples can be analyzed in a day, and dozens of labs worldwide have the capability to perform such analyses. LA-ICPMS also has the advantage of sampling smaller volumes of material; it can thus take advantage of the heterogenous nature of calcite with respect to U and Pb, using larger datasets to better constrain both the initial 207Pb ∕ 206Pb compositions and the common Pb-corrected concordia ages. These isochron ages are calculated with ease on a Tera–Wasserburg diagram similar to other common-Pb-bearing mineral chronometers like titanite and apatite (e.g., Chew et al., 2014; Spencer et al., 2013), but calcite also lends itself to a 208Pb-based correction, given that it usually contains low levels of Th (Parrish et al., 2018).
For typical LA-ICPMS analyses, a 193 nm excimer laser is employed in conjunction with either a single-collector (SC-ICPMS; either a quadrupole or sector-field instrument), or multi-collector (MC-ICPMS) sector-field instrument. Traditionally, an MC-ICPMS uses a series of Faraday detectors on the high-mass side of the detector array to measure 238U and 232Th and either Faraday cups or secondary electron multipliers (SEMs) on the low-mass side of the array to concurrently measure Pb isotopes; SC-ICPMS instruments measure isotope count rates sequentially with a single SEM. The SC and MC instruments have distinct advantages. Because there is only one SEM on SC-ICPMS instruments, there is no need to cross-calibrate multiple detectors, yielding simpler data reduction and the possibility for making 204- or 208-based common-Pb corrections (e.g., Parrish et al., 2018). An MC-ICPMS, on the other hand, is 2–3 times more sensitive than the top SC-ICPMS instruments. This allows precise measurements of samples with low levels of Pb (i.e., young and/or low common Pb). Furthermore, its equivalent sensitivity is even higher because it measures all masses at the same time. For example, an SC-ICPMS running only masses 238, 207, and 206 (232, 208, and 204 are also typically measured) at equal dwell times measures one-third of the counts over a given cycle that the count rate might suggest because only one mass can be measured at a time; given that it is also 2–3 times less sensitive than an MC-ICPMS, a laser spot must be ∼ 6–9 times bigger to achieve the same precision on an SC-ICPMS. However, expected count rates for each isotope are different, and an SC-ICPMS can be configured to count longer on lower-concentration elements, thus reducing the precision offset between the two instruments. A further advantage of an MC-ICPMS is that transient signals from changes in U and Pb concentration during ablation affect uncertainties in the measured 207Pb ∕ 206Pb and 206Pb ∕ 238U less because all measurements are made concurrently; similarly, it also eliminates transient signals due to ICP flicker. Finally, the smaller dynamic range of the SEM can limit samples to a specific range of U concentrations; samples or reference materials with high U contents can cause the detector to trip to a different measurement mode (or trip off), yielding spurious results. Low U concentrations in calcite can also be a problem for an MC-ICPMS measuring 238U with a Faraday cup because limits of detection are on the order of 104 cps (counts per second). Conversely, an SC-ICPMS can precisely measure count rates of ∼ 102 cps by employing an SEM for all masses. However, because an SC-ICPMS is 2–3 times less sensitive, the range of low-U samples that can only be measured by SC-ICPMS is rather limited.
Fortunately, a recently introduced MC-ICPMS – the P3D – by Nu Instruments (Wrexham, UK) can overcome both of these limitations. The instrument features a Daly detector array that allows for ion counting on 238U and the Pb isotopes and thus expands the range of calcite samples – those with lower U concentrations – that can be precisely measured by LA-ICPMS. Similar to a standard SEM, the Daly detector allows for increased sensitivity over a Faraday cup, but it does so with a greater dynamic range (approx. 10-fold over that of an SEM) and with a more linear response. Thus equipped, the instrument can effectively analyze samples with a larger range of U concentrations: from 102 to 107 cps. This contribution describes the analytical setup for LA-ICPMS using the new Nu P3D, comparing the two modes with each other and with that of an SC-ICPMS and thereby demonstrating the increased capability of this new instrumentation to measure calcite U–Pb dates. Further, by presenting data from three different instrument setups and by comparing these results to those expected from theoretical models, the aim of this contribution is also to serve as a guide for those interested in U–Pb calcite geochronology.
Table 1Instrumental parameters of laser-ablation split-stream ICPMS.
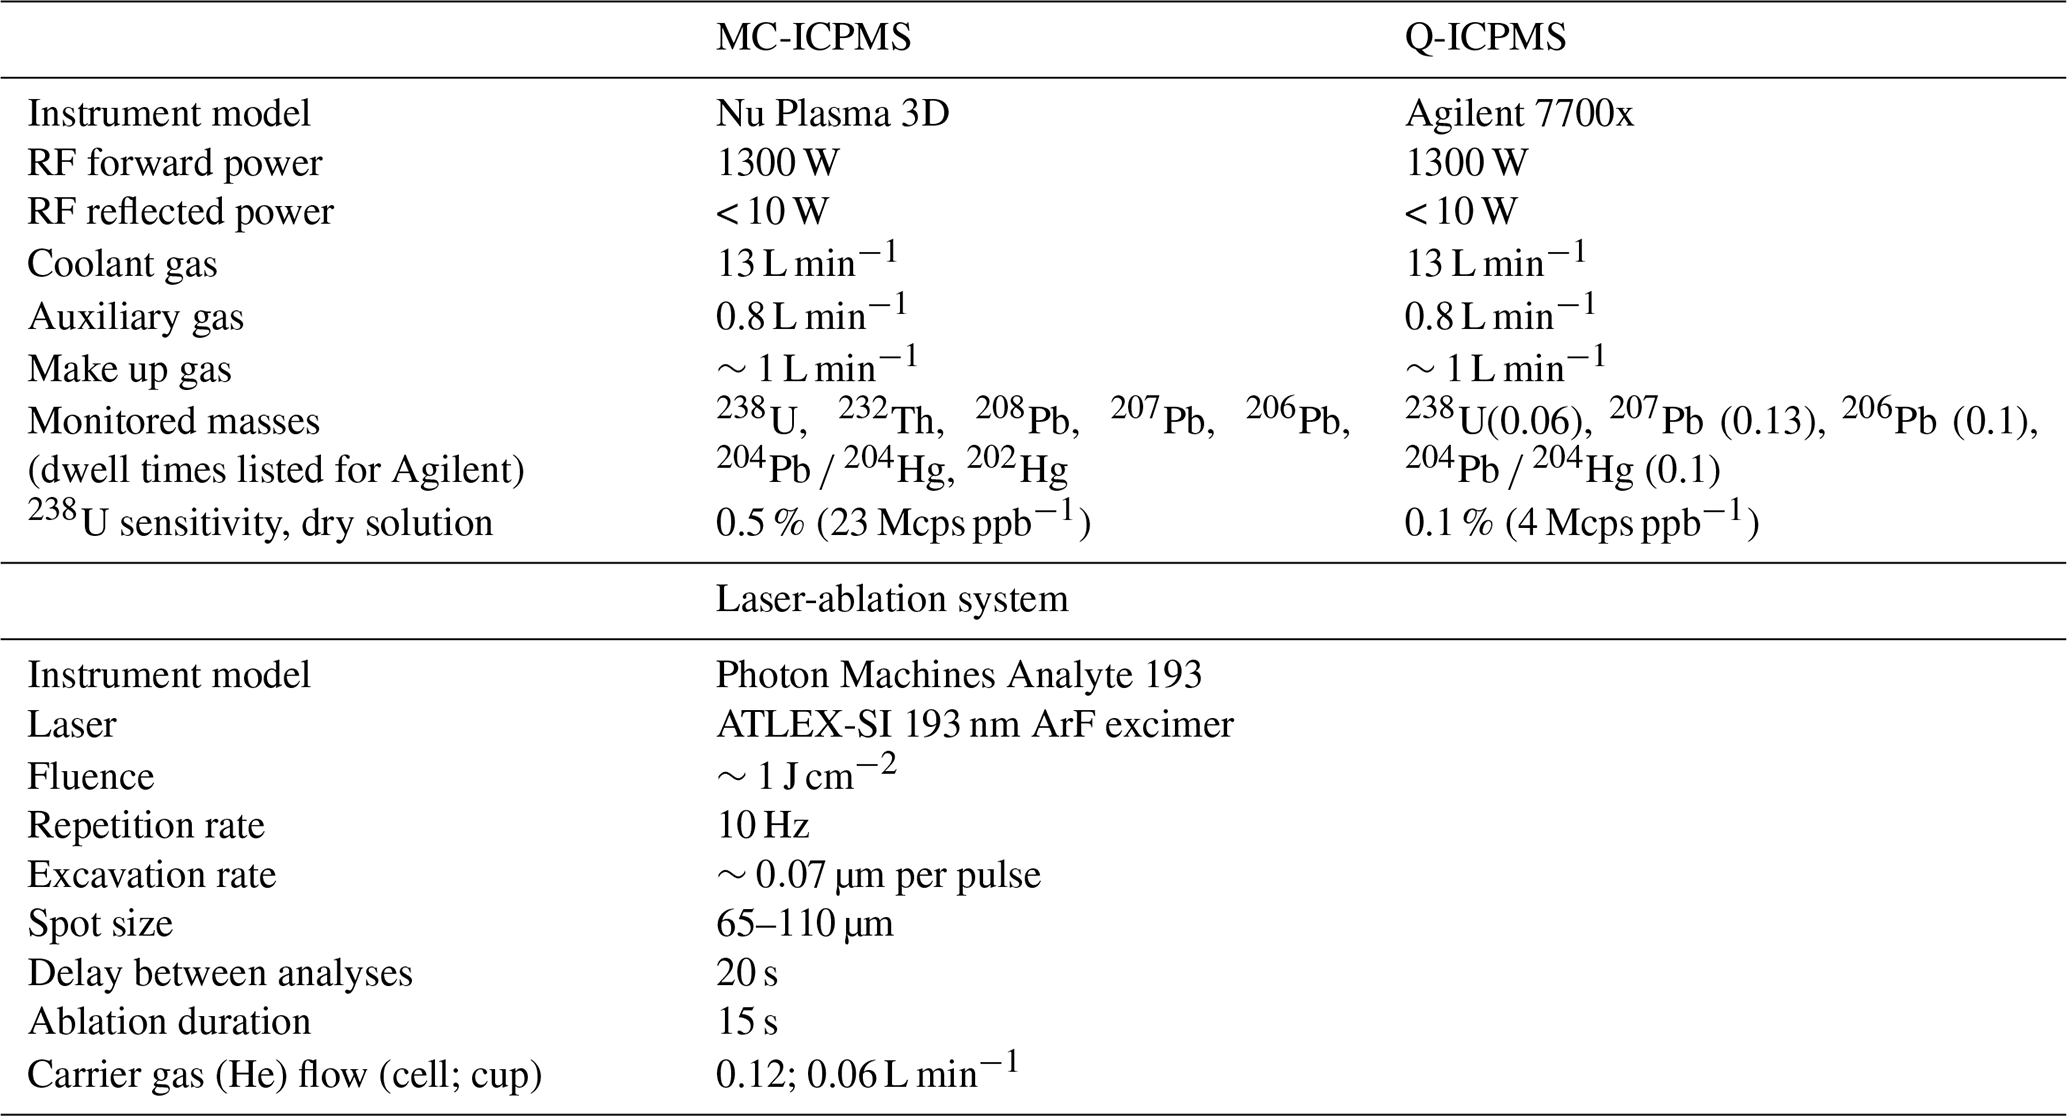
The analytical setup is described in Table 1. The instrumentation used in the study consists of a Photon Machines Excite 193 nm excimer laser equipped with a HelEx cell, coupled to a Nu Instruments P3D for standard LA-ICPMS analyses. The Nu Plasma 3D (P3D) contains an array with six Daly detectors: five on the low-mass side of the array and one on the high-mass side. A 14-Faraday array lies between the Daly detectors and allows for measurement of 238U on either a Faraday or Daly detector, depending on the U concentration in the sample. Daly detectors are used to measure masses 202, 204, 206, 207, and 208, and 232Th is measured on a Faraday cup. Faraday backgrounds yield 1 SD of 0.04 mV, which implies a limit of detection (LOD) of ∼ 0.1 mV or ∼ 8000 cps; Daly backgrounds yield 1SD of 10–20 cps for isotopes of Hg and Pb and 1 cps for 238U, corresponding to LODs of 30–60 and 3 cps, respectively.
In order to compare the difference between SC and MC analytical sensitivities and uncertainties, the laser was used in conjunction with the P3D for two experiments and an Agilent 7700 quadrupole (Q-)ICPMS for one experiment. These three experiments were run with different spot sizes: Experiment F – a 65 µm spot on the P3D using a Faraday for masses 238 and 232 and Daly detectors for masses 208–204 and 202 (110 total analyses); Experiment D – the same configuration, but with 238 measured on a Daly detector; and Experiment Q – a 110 µm spot with the Q-ICPMS and cycle times of 0.06, 0.13, 0.1, and 0.1 s on masses 238, 207, 206, and 204, respectively. During each separate analytical run, each spot was located near the corresponding spot from the other runs, to minimize uncertainty caused by grain homogeneity. For all experiments, the laser was run at 10 Hz for 15 s and a fluence of approximately 1 J cm−2, yielding a spot depth of 10–15 µm. Analyses were preceded by two pre-ablation pulses and 20 s of baseline measurement.
Three calcite samples – veins associated with faulting – from the Champlain Valley of western Vermont (courtesy of W. Amidon of Middlebury College) were the main samples measured. These samples – C258, C304, and C273 – are ca. 440, 110, and 80 Ma, respectively, and range in U concentration between a few parts per billion and a few parts per million, with an average of 120 ppb and a mode of ∼ 20 ppb. Three further samples (C254, C283A, and C283B), were run in experiments F and D and provide more data for uncertainty comparisons between the two instrumental configurations (see Fig. 1), but the data are described in less detail; they are ca. 440 Ma with variable Cretaceous (?) (re)crystallization. Calcite and NIST614 reference materials (RMs) were interspersed every 10 analyses, and a two-stage reduction scheme was employed. Iolite v.3.0 (Paton et al., 2011) was used first used to correct the 207Pb ∕ 206Pb for mass bias, detector efficiency, instrumental drift etc., and to correct the 238U ∕ 206Pb ratio for instrumental drift, using NIST614 as the primary reference material. During this first data reduction, 2 s were removed from both the beginning and end of both the RMs and the unknowns, yielding a total count time of 11 s. The 238U ∕ 206Pb ratio was then corrected using a linear correction in Excel such that the primary calcite RM, WC-1, yielded 254 Ma (Roberts et al., 2017) on a Tera–Wasserburg (TW) diagram, anchored to a 207Pb ∕ 206Pb value of 0.85. Similar to that of the 207Pb ∕ 206Pb ratio, this correction encompasses offset due to both mass bias and detector efficiency differences (i.e., there is no prior gain calibration for the Daly detector array). Using this method, we retrieved ages of 3.01±0.15 (MSWD = 1.3; n= 30) and 65.9±1.1 (MSWD = 1.2; n = 40) for secondary RMs ASH15 (2.96 Ma; Nuriel et al., 2020) and Duff Brown Tank (64 Ma; Hill et al., 2016), respectively. Because the purpose of this study is to gain a better understanding of the analytical equipment uncertainties associated with the standards (e.g., upper intercept of WC-1, 207Pb ∕ 206Pb value of NIST614) were not propagated into the uncertainties of unknown analyses. Analyses with large uncertainties (arbitrarily chosen as 50 % for both 238U ∕ 206Pb and 207Pb ∕ 206Pb) were discarded; removing these data has little influence on the final age. The data from the unknowns are all a bit scattered for geological reasons and were culled to yield single populations for ease of comparison. (Though beyond the scope of this paper, the Paleozoic samples are interpreted to have suffered partial Pb loss or new crystal growth in the Cretaceous–Tertiary, and the older Cretaceous sample likely (re)crystallized over an extended period.)
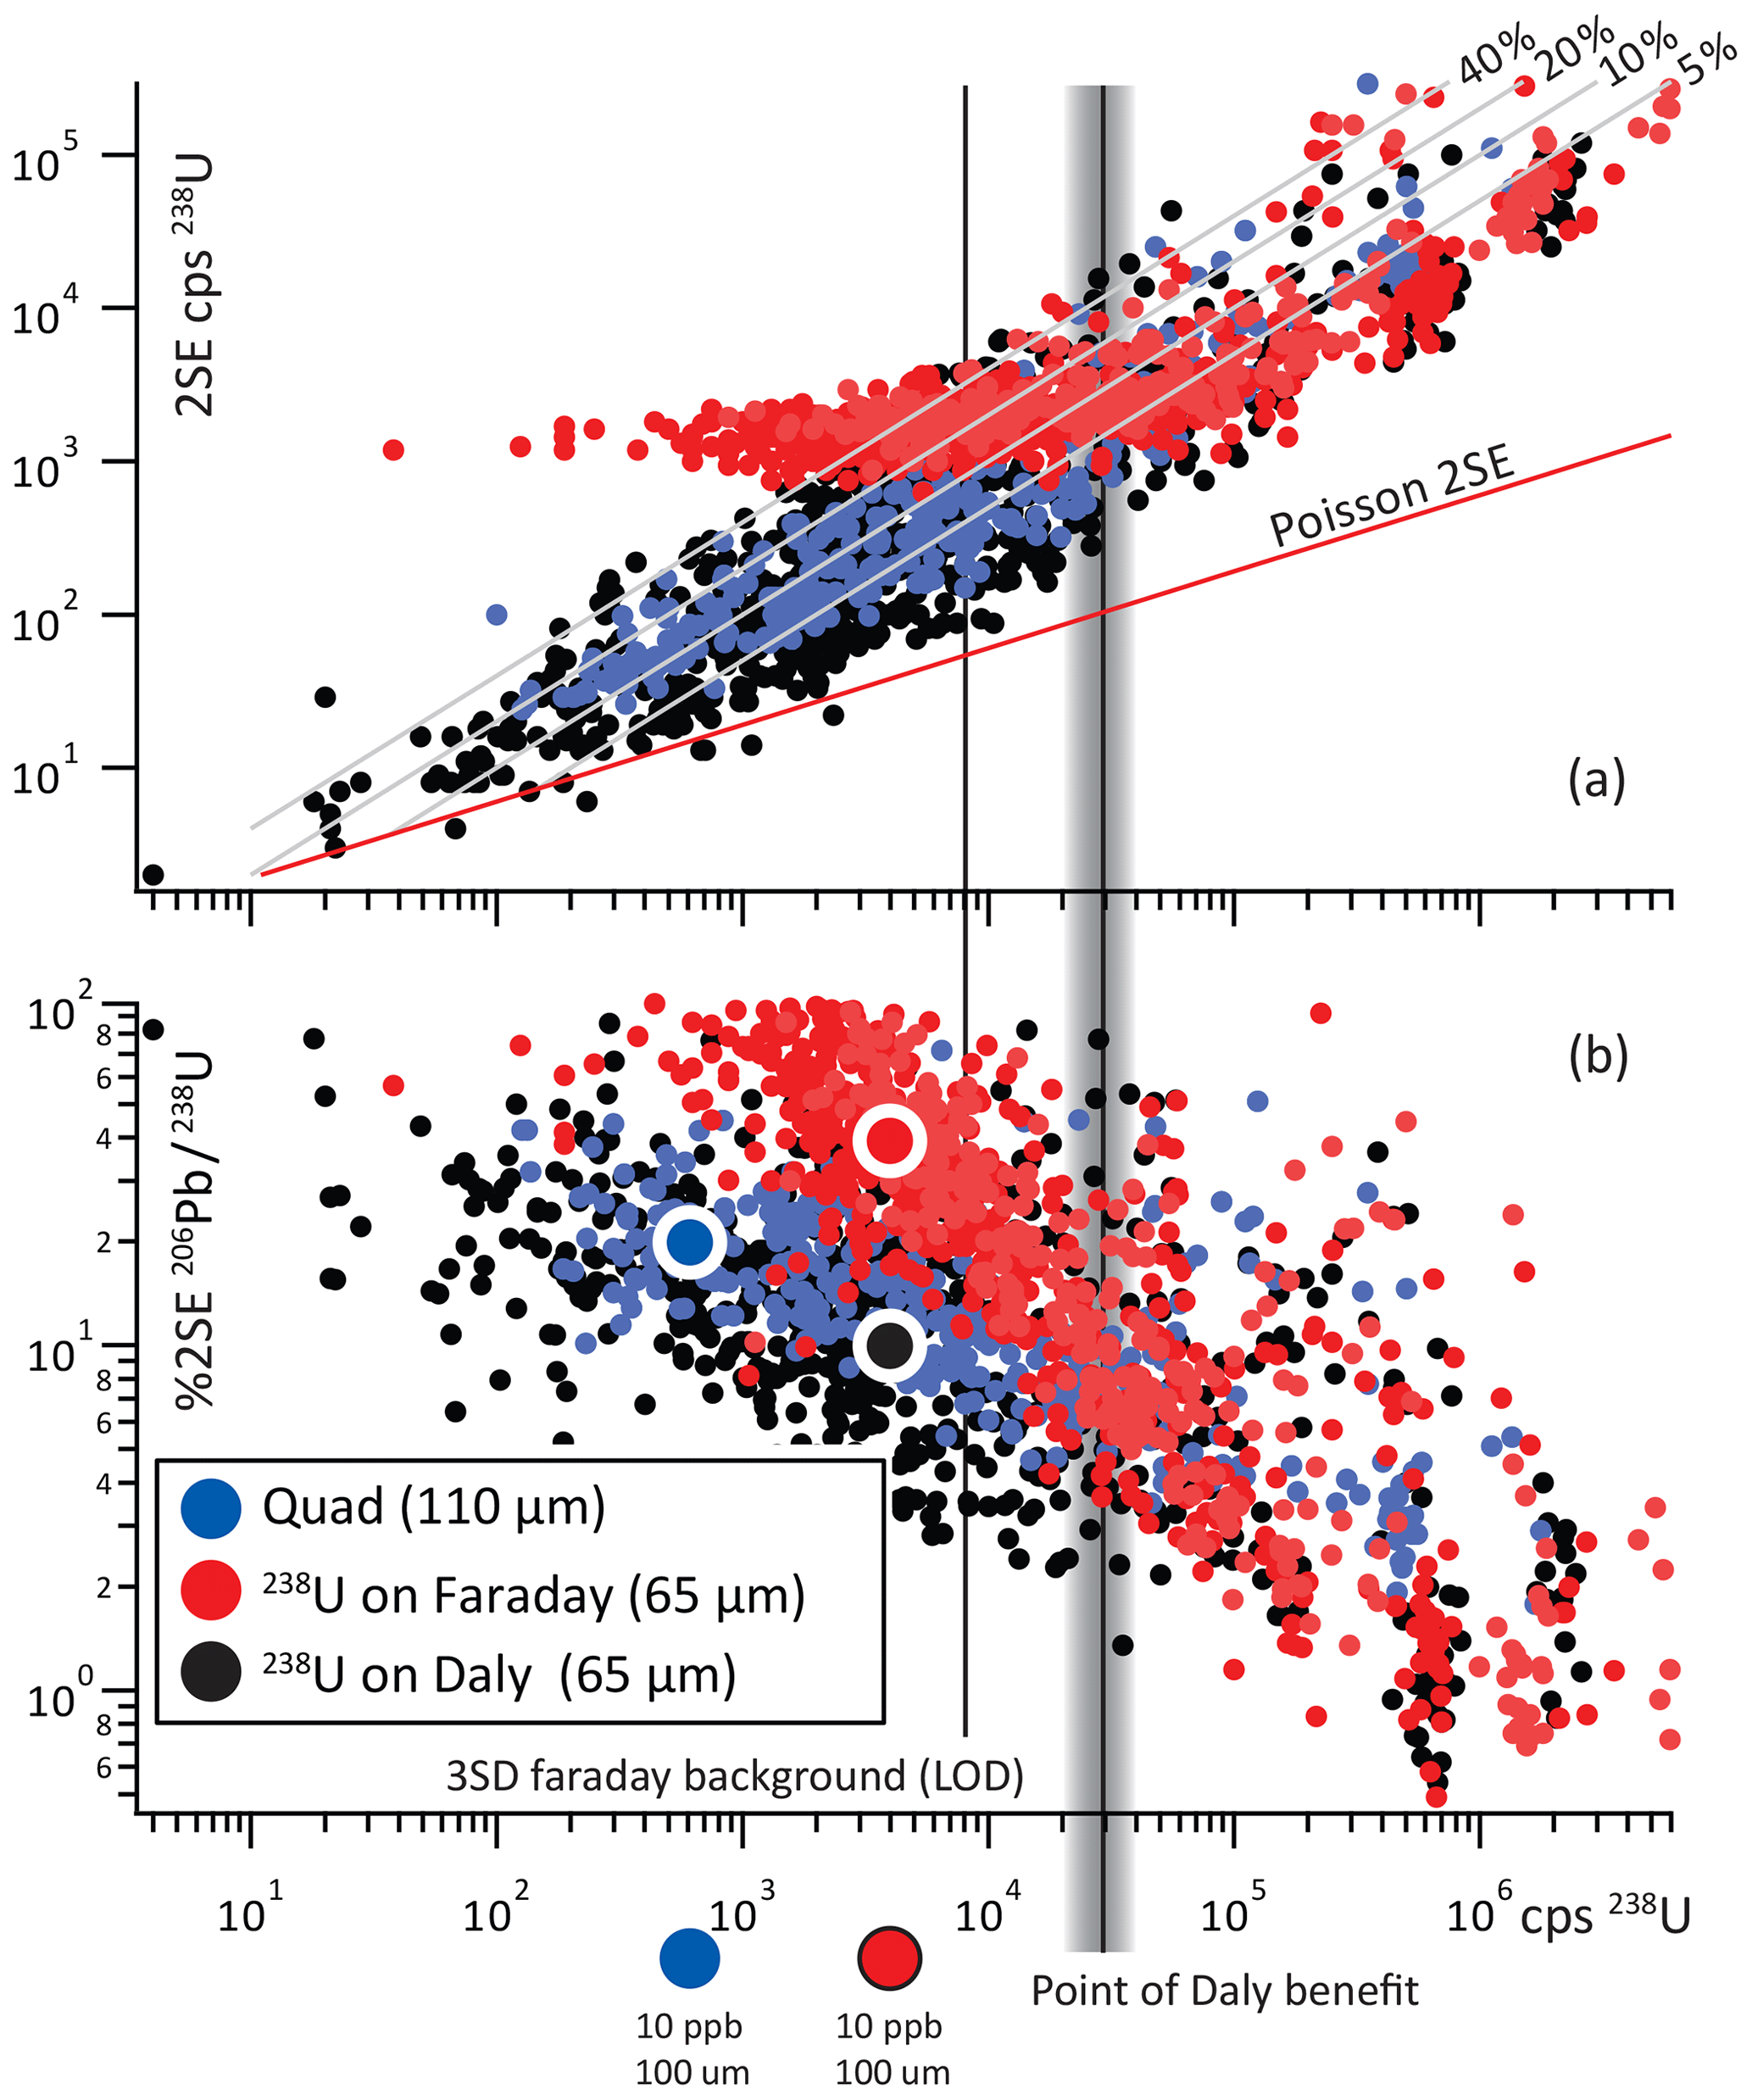
Figure 1Relation between counts per second 238U and uncertainty of 238U (a), and 206Pb ∕ 238U (b). Grey lines in A are %2 SE uncertainties of 238U. The three experiments show the same trend in uncertainty vs. counts per second at count rates above ∼ 30 kcps 238, but below that, the uncertainty of measurements in Experiment F (238 on the Faraday) increases significantly compared to Experiments D and Q. Although Experiments D and Q (red and blue symbols) show similar trends, the sensitivity gain using the P3D leads to significant improvements in spot uncertainty; large symbols represent expected uncertainties for a 100 µm spot at 10 ppb U, and the vertical offset between them represents the gain or loss in precision for such an analyses depending on the instrumentation used.
Table 2Results from three experiments; n/a means not applicable.
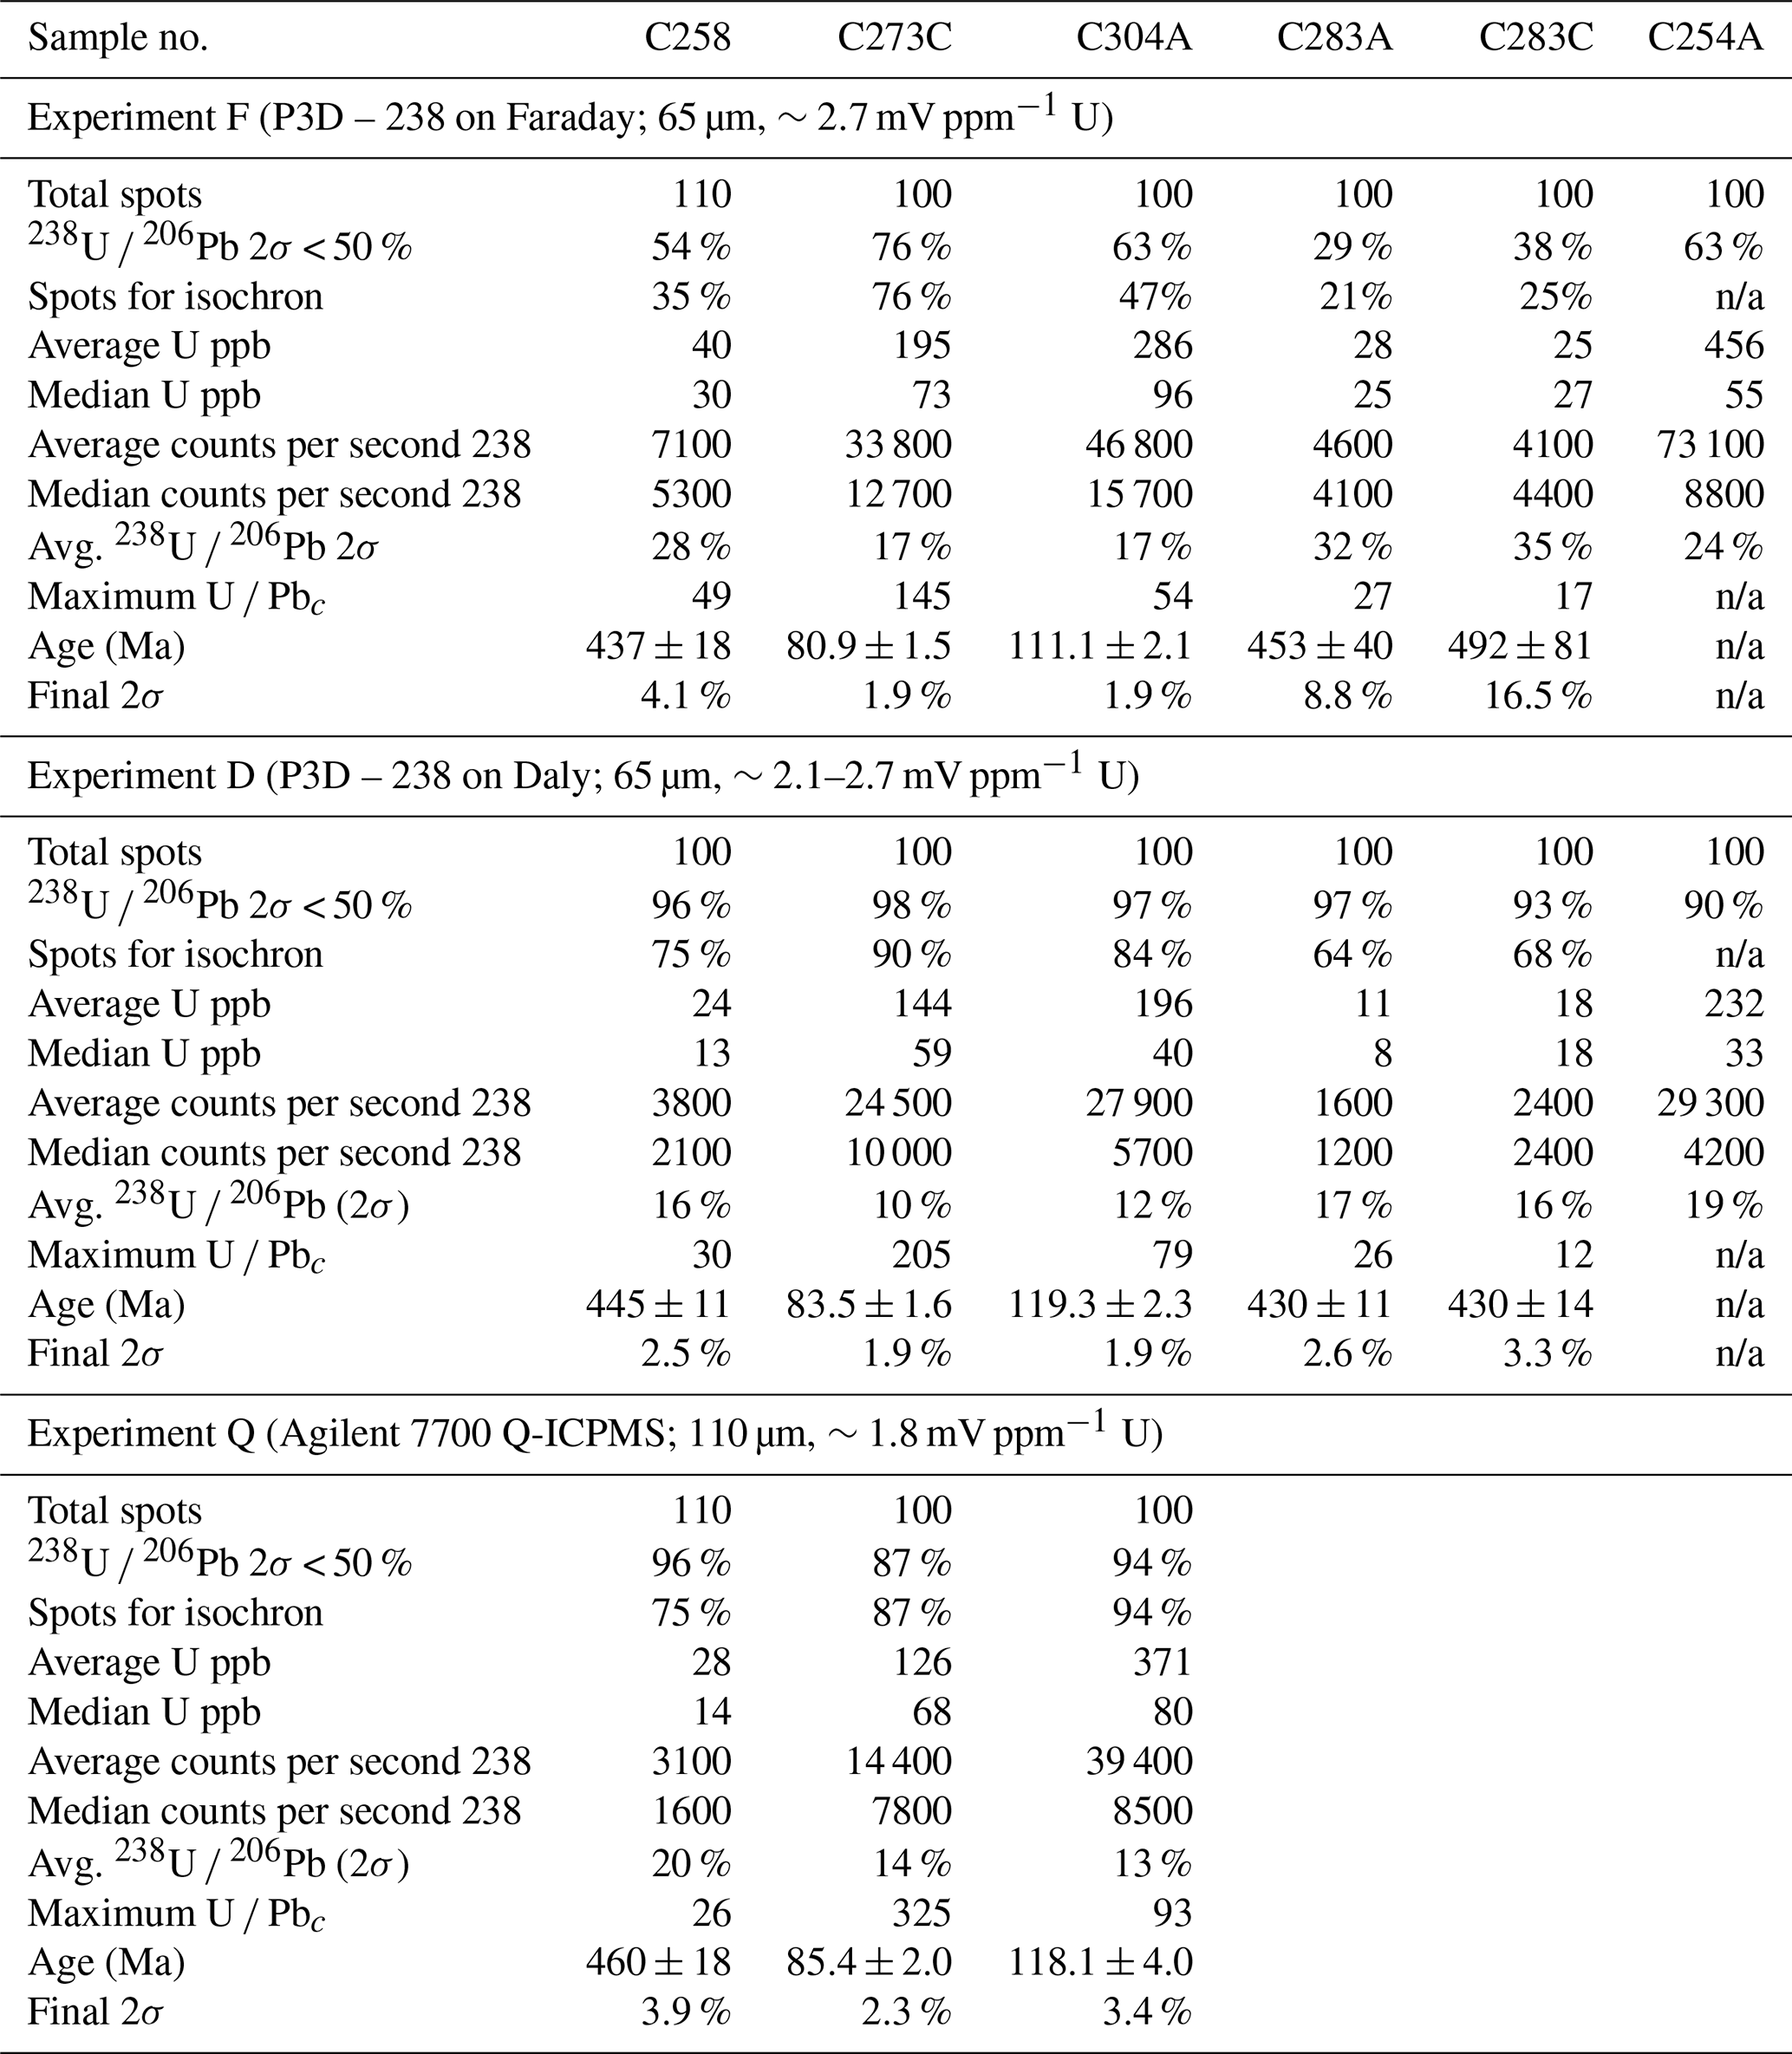
Table 2 and Fig. 2 shows the results for the six samples analyzed in the three experiments. Experiment F (P3D – 65 µm spot; U on a Faraday) yielded ∼ 170 kcps (1000 cps) ppm−1 (2.7 mV ppm−1) of mass 238 on NIST614 and was relatively stable throughout the run. The sensitivity of Experiment D (P3D – 65 µm spot; U on a Daly) was similar to that of Experiment F but dropped approximately 25 % during the analytical session to ∼ 125 kcps ppm−1 (2 mV ppm−1) of mass 238 on NIST614. Experiment Q (Agilent Q-ICPMS – 110 µm spot) yielded ∼ 110 kcps ppm−1 of mass 238 on NIST614 – equivalent to ∼ 1.8 mV/ppm from a spot ∼ 3 times larger than the 65 µm spot in experiments F and D – and was stable throughout the run.
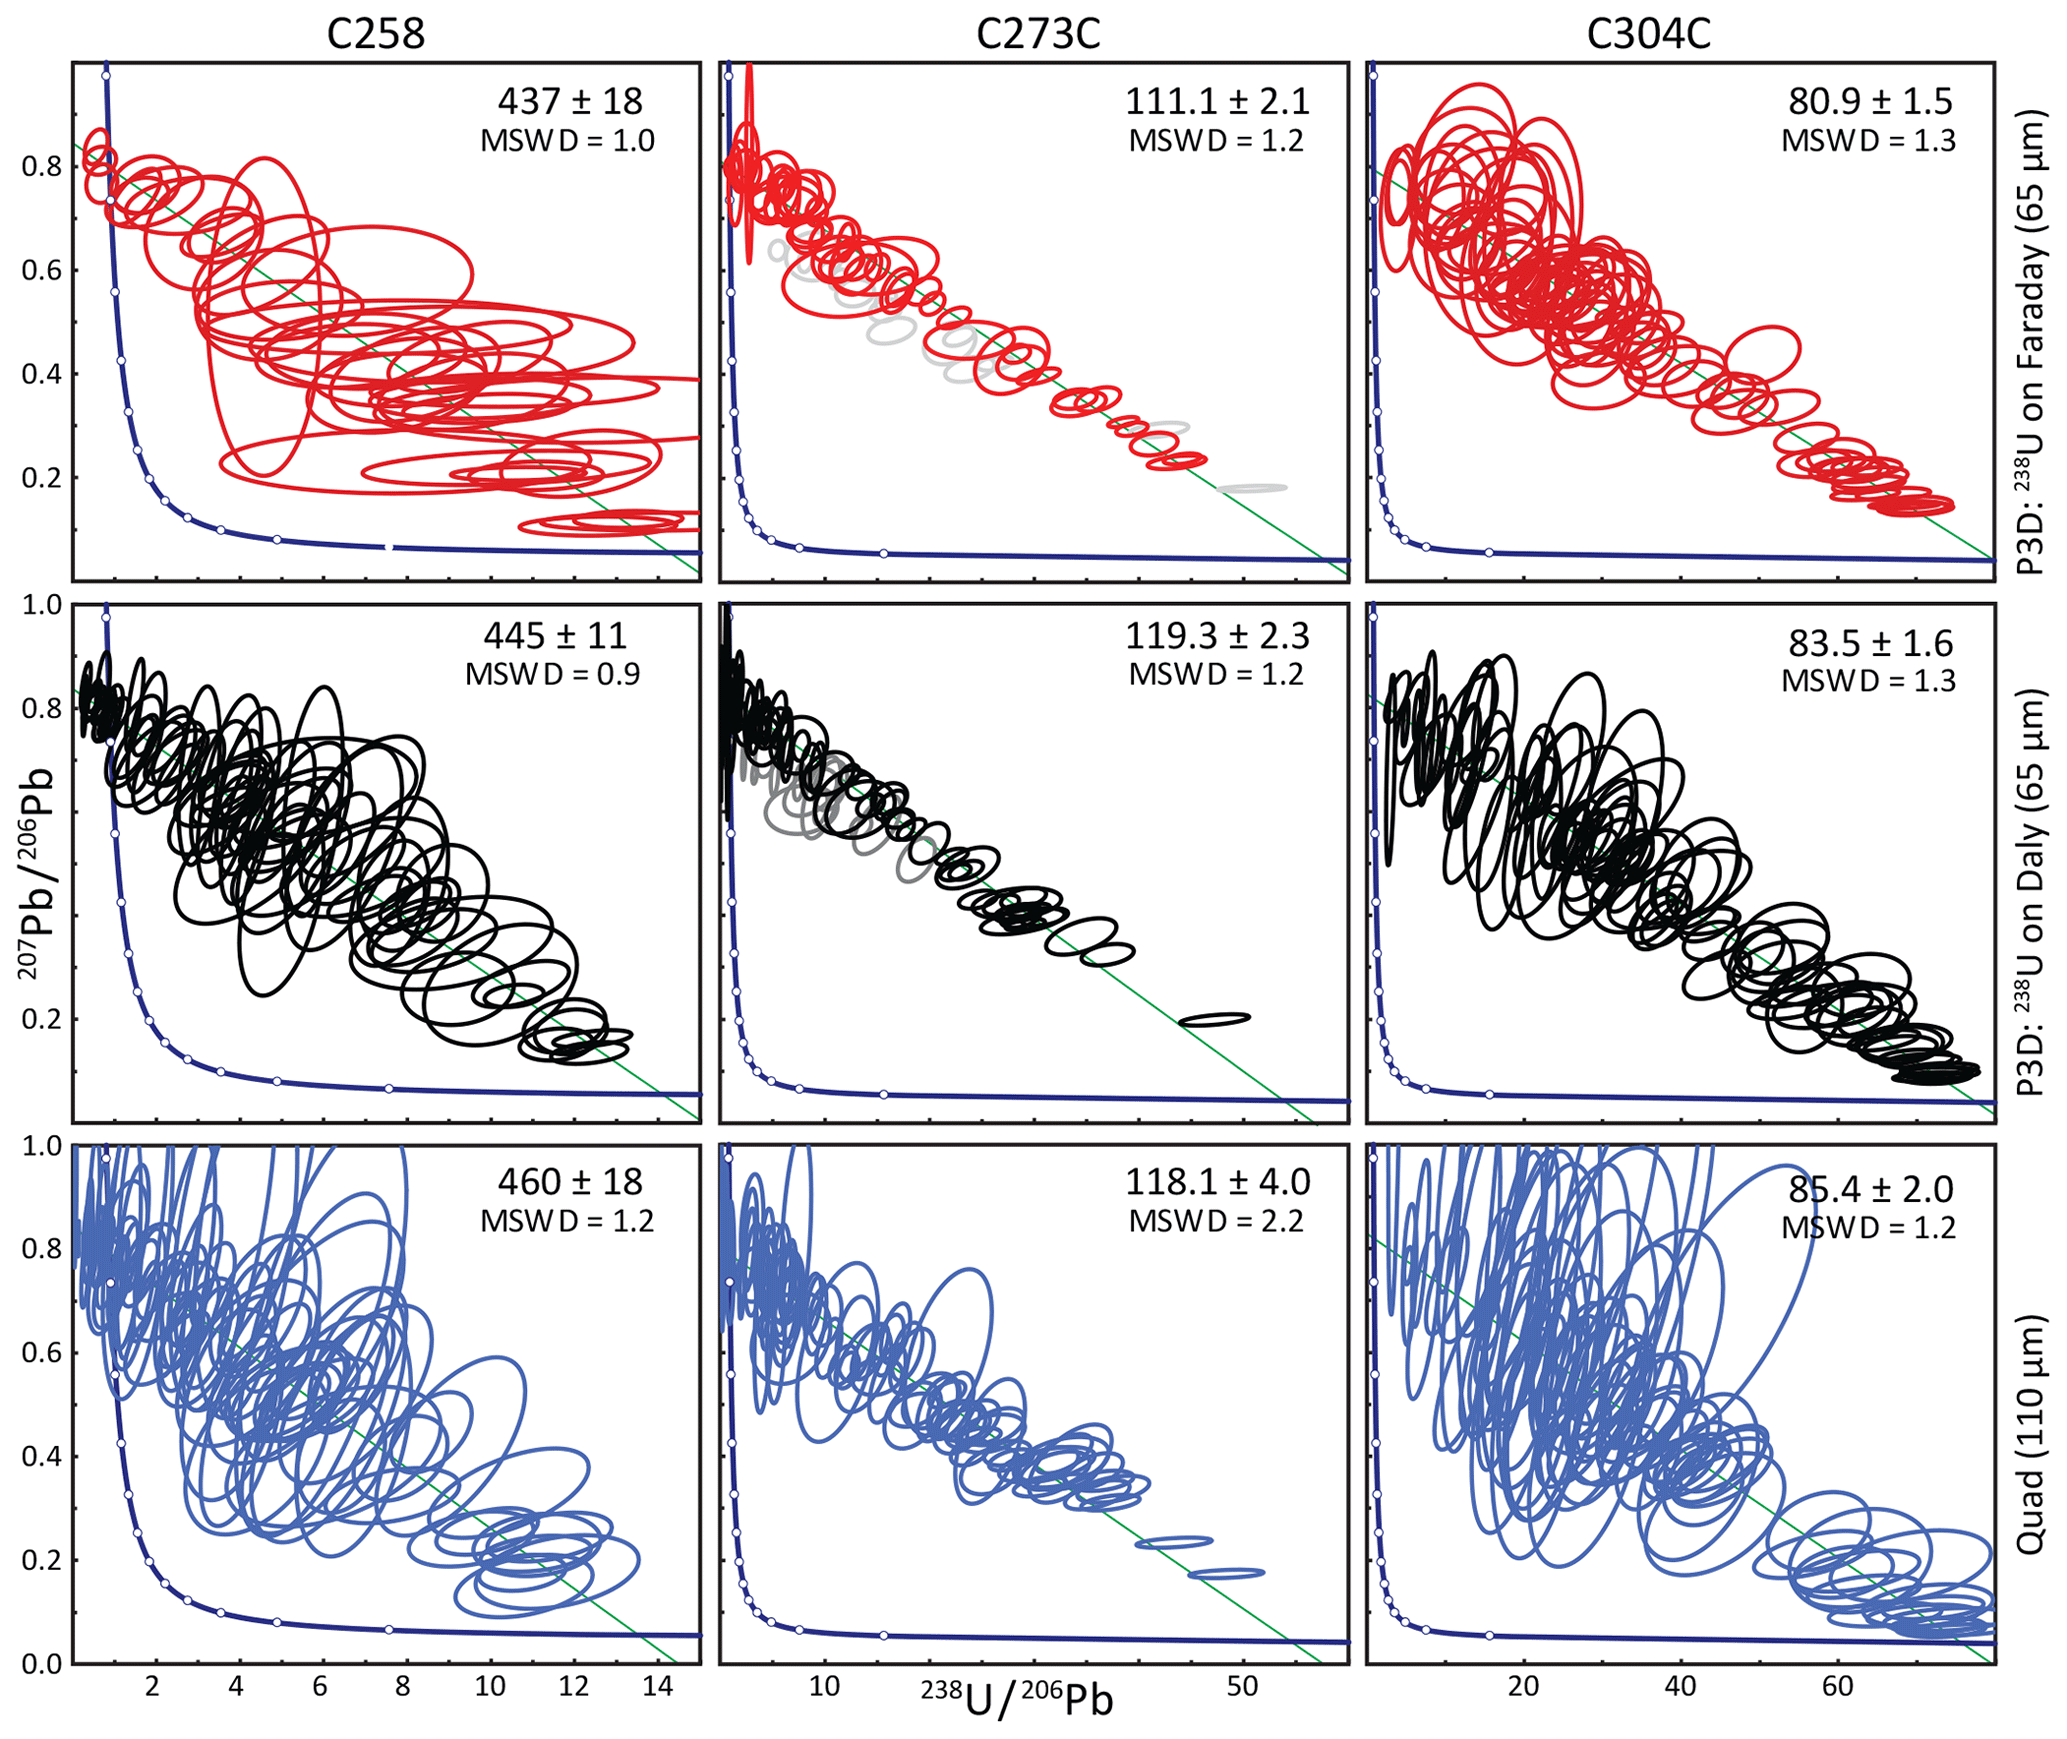
Figure 2Tera–Wasserburg concordia diagrams of the three unknown samples in each of the three experiments. See text for discussion.
For every sample, Experiment F yielded fewer analyses with uncertainties of < 50 % for 206Pb ∕ 238U as well as the fewest spots available to make an isochron; this is depicted graphically in Fig. 1b as a steeper negative slope for Experiment F vs. Experiments D and Q. These results are consistent with a higher average and median U parts per billion (Table 2); low U concentrations that were measured in Experiments D and Q went undetected or yielded large uncertainties in Experiment F. Though samples with median 238U count rates of > 10 000 cps (C273C and C304A) returned fewer viable analyses and worse average 238U ∕ 206Pb uncertainties in Experiment F, the uncertainty of the final age was similar for the higher-U samples on both configurations on the P3D; both yielded lower uncertainties than the Q-ICPMS, despite the 3-fold volume increase in analyzed material on the Q-ICPMS (Fig. 2).
When average count rates of 238U were below ∼ 8000 cps (near the detection limit of the Faraday detector on the P3D), however, the number of viable analyses and final age precision was significantly higher in Experiment D (Table 2 and Fig. 2). As an example, sample C258 yielded few viable data points (35 % of the 110 analyses) in Experiment F, fewer than half the number of good analyses in Experiments D and Q. In addition, the resulting uncertainty in the final age calculation (∼ 4 %) is significantly larger than that of Experiment D, and similar to the resulting uncertainty in Experiment Q (although the Q-ICPMS yielded > 2 times the number of viable spots). Samples C283A and C283C – which also contain low levels of U – yielded ∼ 50 % fewer viable data, necessitated double the average count rates of 238U, and final uncertainties that were significantly greater in Experiment F than those of Experiment D.
A summary of the precision vs. U count rate is shown in Fig. 1, which shows the precision of 238U ∕ 206Pb and 238U on a single spot vs. the count rate of 238U. While there is considerable overlap in the precision vs. 238U counts per second of both 238U and 238U ∕ 206Pb at count rates above approx. 30 000 cps, data collected in Experiment F yielded no better than a few kcps 2σ uncertainty on 238U (Fig. 1a); 238U ∕ 206Pb uncertainties consequently show a similar deviation from the high-count-rate trend (Fig. 1b). Finally, though the Q-ICPMS shows similar gains in precision for low-U analyses, the lower sensitivity of the Q-ICPMS results in a smaller window of U concentrations for which analyses have lower uncertainties than those run on the P3D (vertical offset in symbols in Fig. 1b).
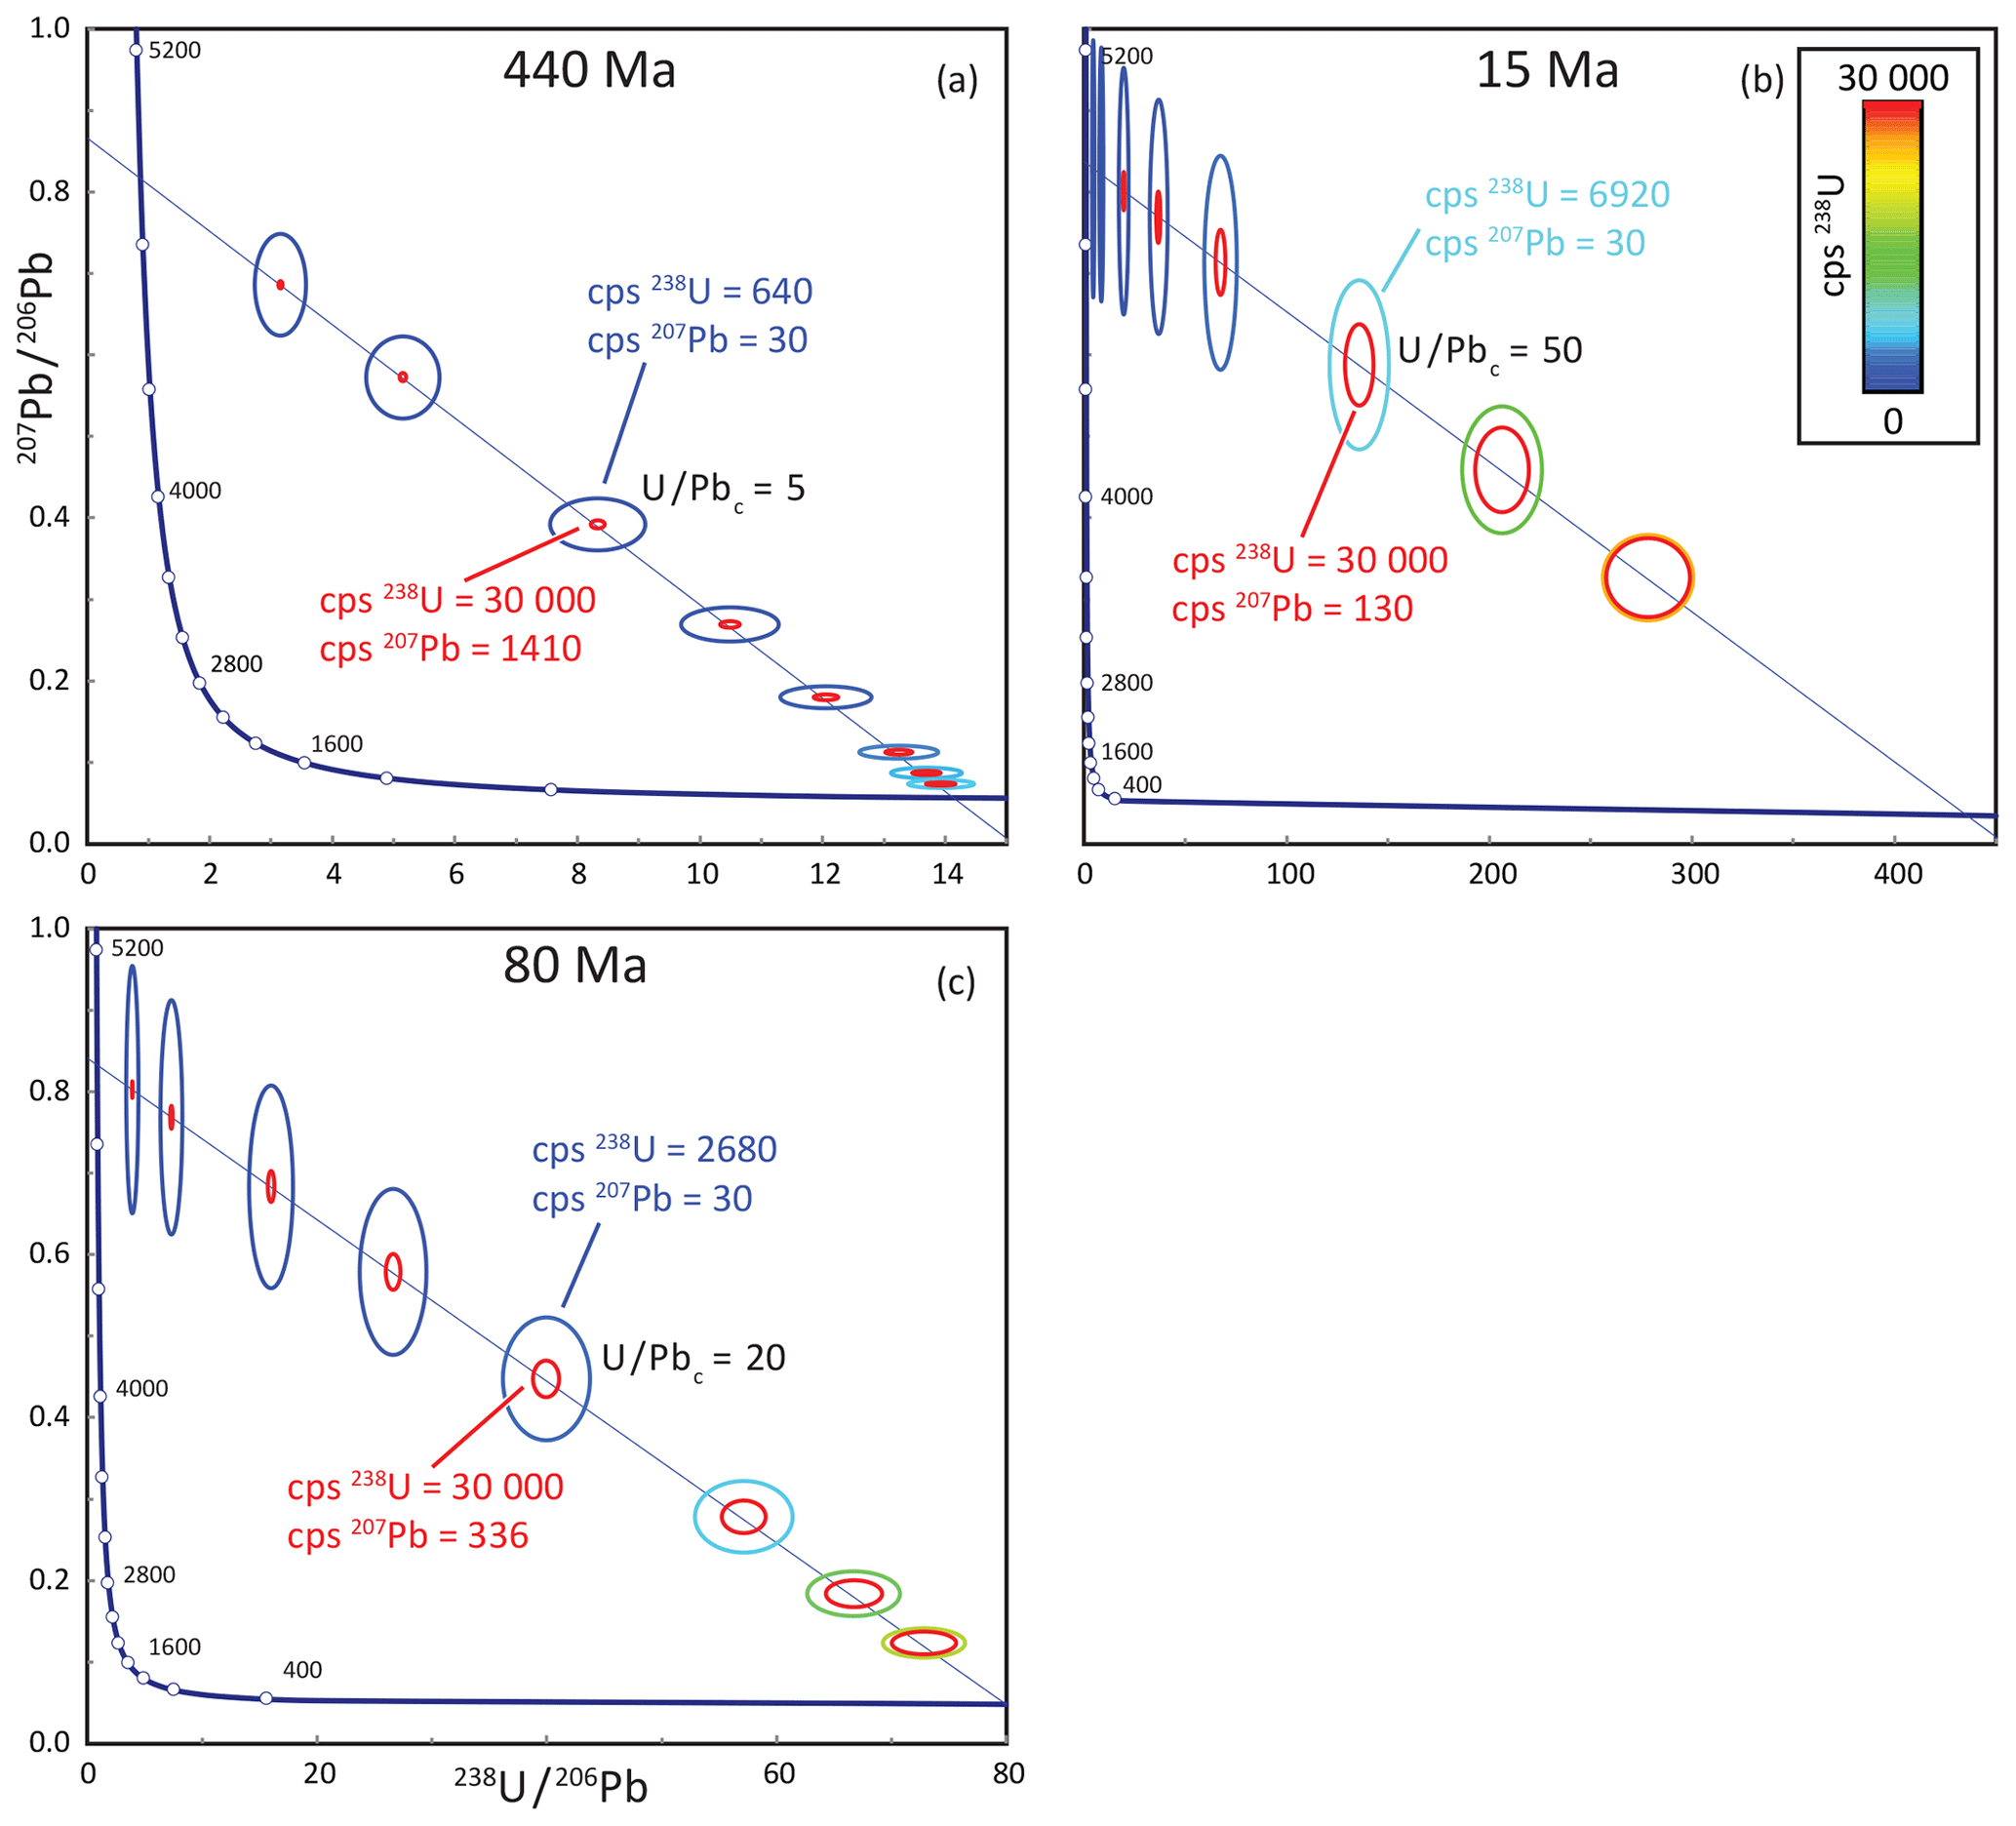
Figure 3Uncertainty ellipses for each Tera–Wasserburg plot depict two end-member type of analyses in which the large ellipses represent the limit of detection of the all-Daly configuration, or any SC-ICPMS (limited by 207Pb counts), and the smaller ellipses represent the uncertainty at 30 000 cps 238U, the point at which measurement of 238U on the Daly is not advantageous. The ellipses are colored according to the 238U count rate and depict the counting uncertainty for a 10 s analysis at the given count rate and different U ∕ Pbc ratios of 1, 2, 5, 10, 20, 50, 100, and 200. Example analyses are illustrated in each of the panels at different U ∕ Pbc ratios of 5 (440 Ma; a), 20 (80 Ma; c), and 50 (15 Ma; b).
While there is a clear advantage of using the new Daly-only detector setup on the P3D for LA-based calcite geochronology for some samples, the extent to which this advantage obtains for all samples is still somewhat ambiguous. The samples that benefit most from the new instrumentation are not only low in U but also older. For most measurements of long-lived-isotope geochronology, the analytical limit is determined by the detection limit of the daughter, not the parent, isotope. However, because older samples have more daughter product, they are – for samples with low U ∕ Pbc ratios – more likely to be limited by the count rate of the parent isotope. For samples run on an SC-ICPMS, this distinction is unimportant because the detection limit of 238U is in all cases lower than that for Pb. However, because the MC-ICPMS has a large sensitivity and precision advantage over the SC-ICPMS, it is important to distinguish the limits of measurement between the Faraday–Daly and all-Daly configuration.

Figure 4Left-hand plots show the difference in distribution of 238U ∕ 206Pb ratios in reference materials and unknowns; ratios are normalized to the 238U ∕ 206Pb ratio of the age of the sample. Reference materials Duff Brown and WC-1 have the smallest variation in 238U ∕ 206Pb ratios, which correlates well with the distribution of their U and Pb contents (left-hand plots). Reference material ASH15 and unknown sample C283C still have a wider lognormal distribution, reflective of their larger distribution of U and Pb contents relative to Duff Brown and WC-1. Unknown sample C273C has a more uniform distribution of 238U ∕ 206Pb ratios, reflecting its largest distribution of U contents.
4.1 Theoretical uncertainty of Tera–Wasserburg data
To explore the limits of precision for each analytical configuration, a synthetic dataset was created (using an MS Excel spreadsheet; available on request) to represent different U ∕ Pbc and 238U cps for samples of different ages. Figure 3 shows samples with ages of 440, 80, and 15 Ma with error ellipses at U ∕ Pbc ratios of 1, 2, 5, 10, 20, 100, and 200. The size of the ellipse is the maximum possible uncertainty (from counting statistics only) for a 10 s analysis, given the limit of detection of the instrument. For the all-Daly configuration, the limit of detection is determined by 207Pb counts, the least abundant isotope of interest. For this example, 30 cps is assumed (the best achieved LODs herein; Hansman et al., 2018), but it is important to recognize that the LOD of Pb is based on the background, which varies from lab to lab and is also a function of the instrumental sensitivity. For the Faraday–Daly arrangement, the LOD is limited by 238U counts for samples with lower U ∕ Pbc and by 207Pb for samples with high U ∕ Pbc – and increasingly so as the sample age decreases. In this case, a minimum of 30 000 cps of 238U is considered – as opposed to the actual ca. 8000 cps LOD – for the Faraday because that is the count rate below which a distinct benefit in precision is gained by using the all-Daly arrangement (see Fig. 1 and discussion above). As depicted in Figure 3, older samples yield the greatest range of U ∕ Pbc ratios that could yield an advantage of measurement by 238U on an ion counter, whereas the advantage of the Daly detector disappears at U ∕ Pbc ratios greater than ca. 500 and 250 for samples that are 80 and 15 Ma, respectively. As an example of the benefit of 238U measurement by Daly, an 80 Ma sample with a maximum U ∕ Pbc ratio of 10 yields 1400 cps of 238U at the LOD of 30 cps 207Pb. Given a limit of detection of 8000 cps for the Faraday detector, the signal size would need to be 6 times higher before it could be measured by such means. Furthermore, as discussed above, and shown in Fig. 1, the benefit of the Daly extends to ca. 30 000 cps or ∼ 20 times the signal that can be measured by the Faraday–Daly configuration. The benefit extends to 200 times for a U ∕ Pbc ratio of 1, but a question arises as to the ability to measure ages at such low U ∕ Pbc values.
4.2 Choosing samples and instruments
One intention of this paper is to serve as a guide to determine whether any given calcite (or any other Pbc-bearing) sample is appropriate for U–Pb geochronology and deciding which type of analytical equipment to use. As such, the model above is expanded below to explore the U ∕ Pbc ratios and count rates needed to produce a reliable age from a given number of analyses. These models are then compared with the natural results to determine best practices when selecting samples and instruments for analysis.
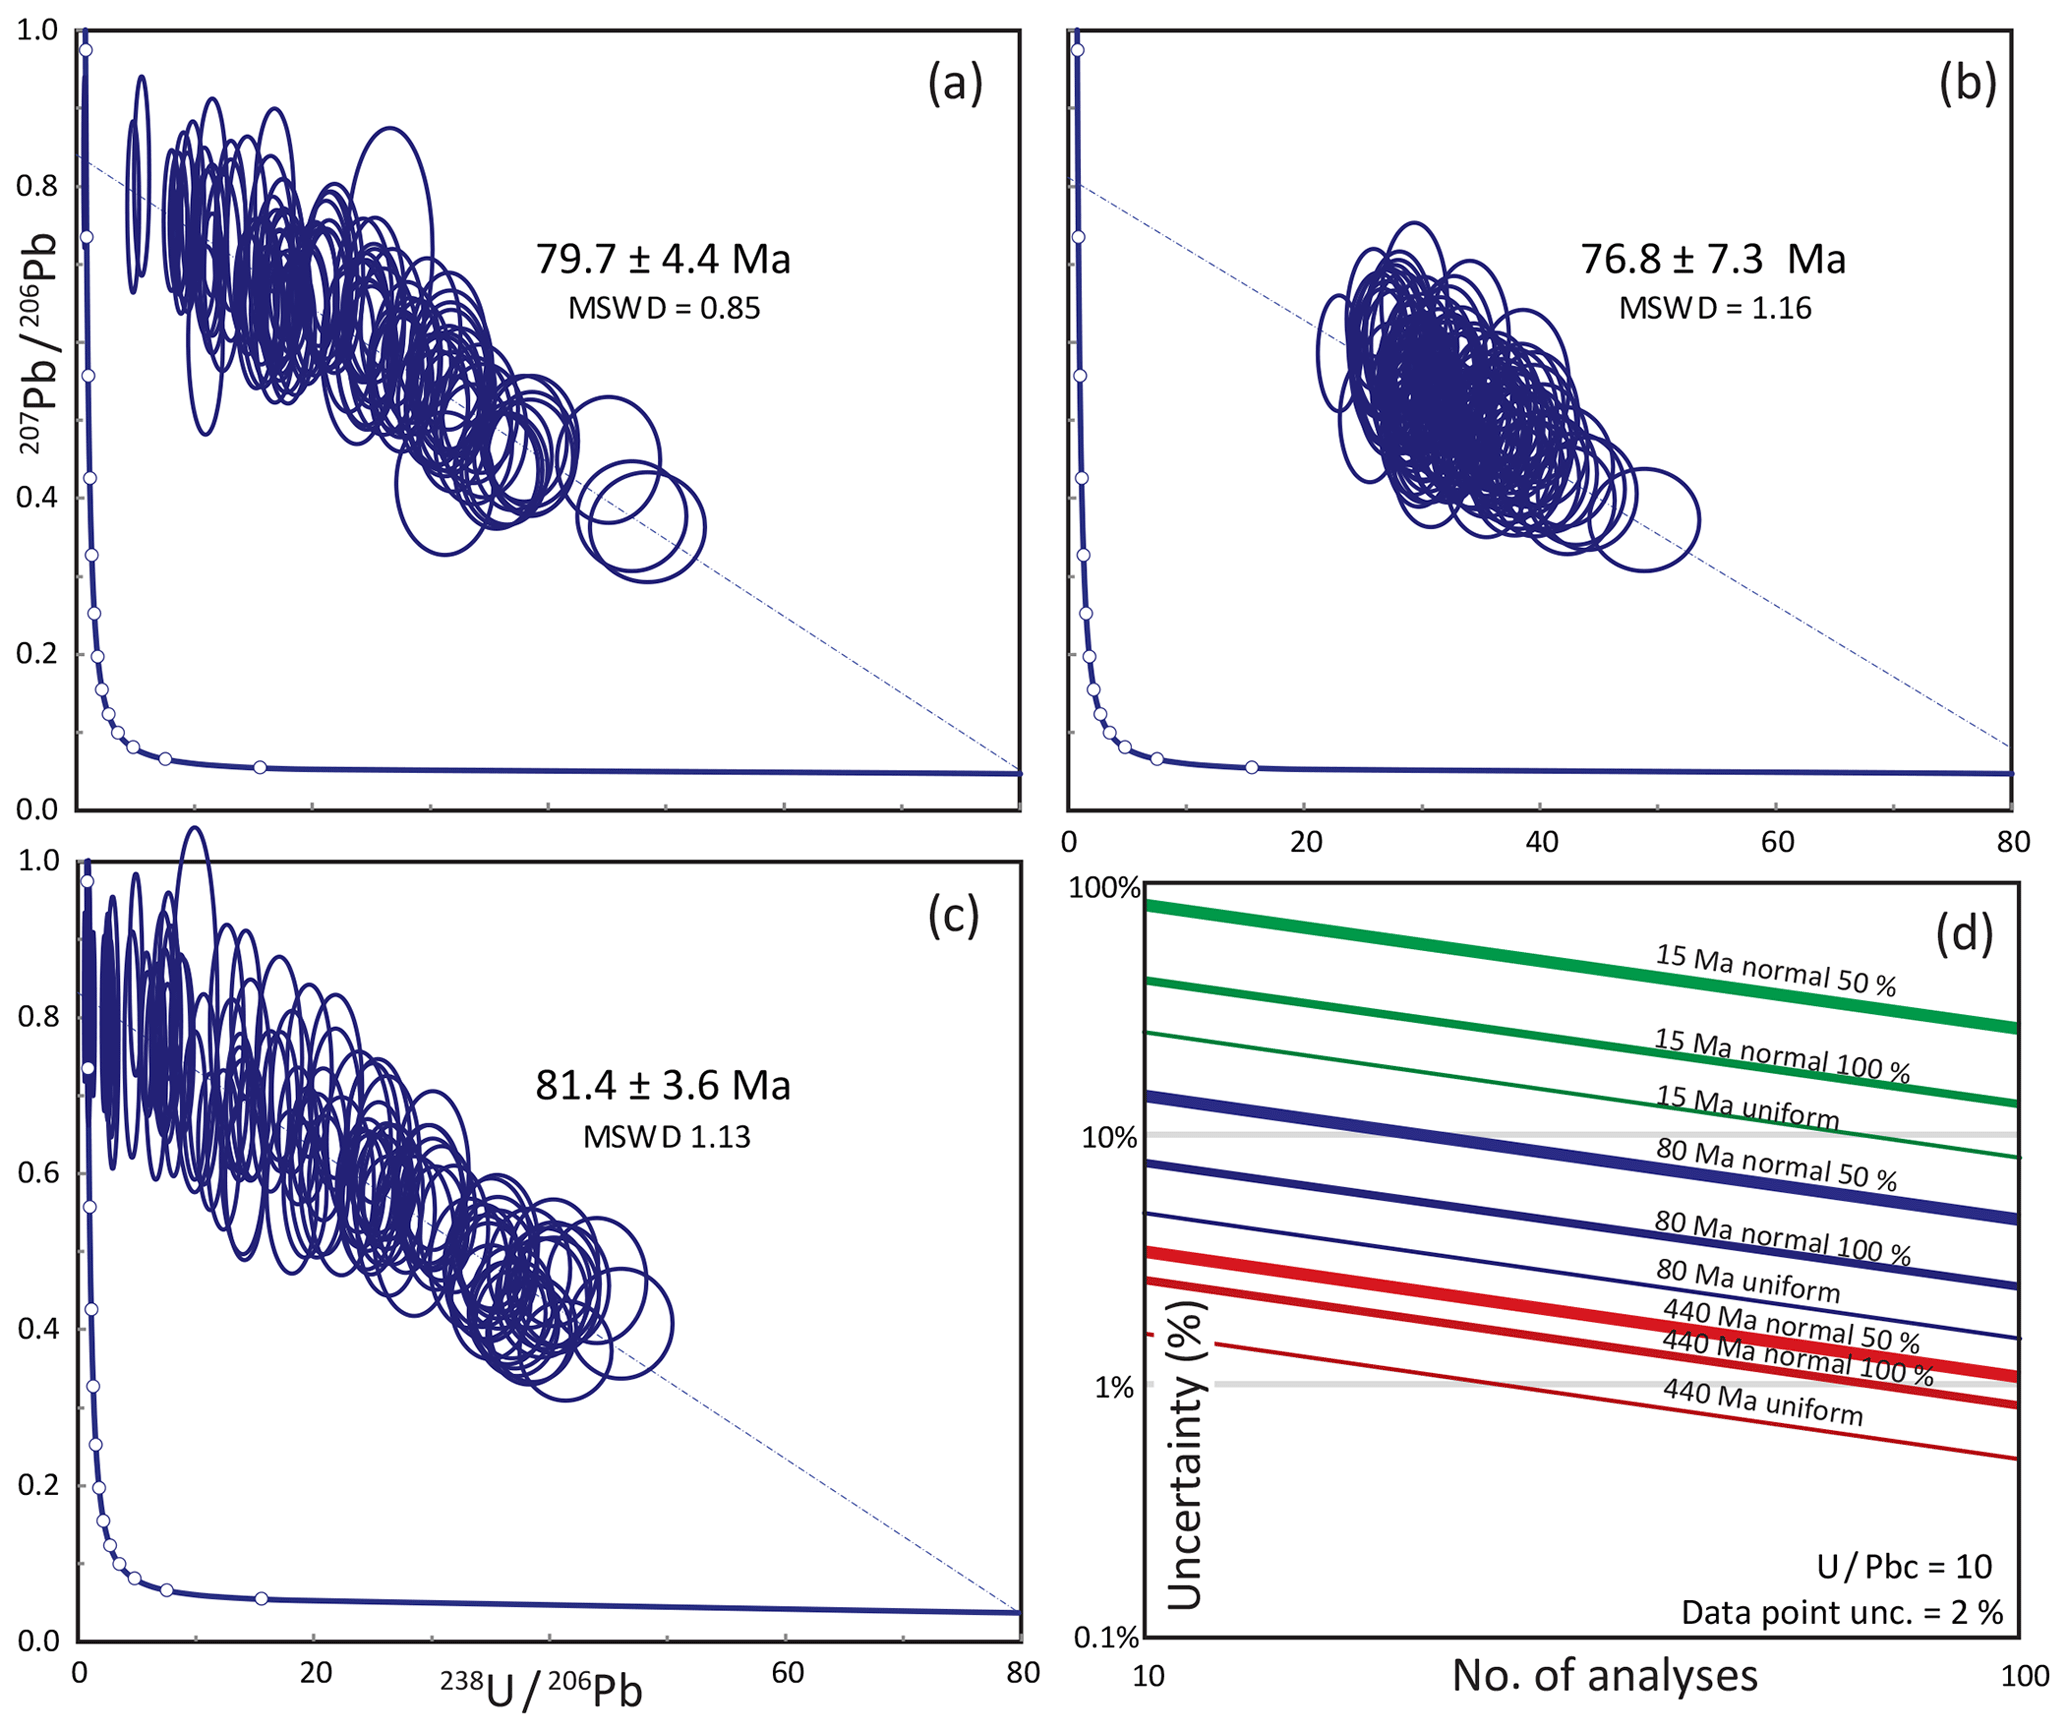
Figure 5Panels (a)–(c) show an example of the differing randomly generated distributions of 100 analyses with the same maximum U ∕ Pbc. Panel (a) shows a normal distribution for the entire range of U ∕ Pbc; (b) is a normal distribution over the upper 50 % of the same range. The uniform distribution, shown in (c), yields the lowest uncertainties because there are more analyses at both the upper and lower intercepts. Panel (d) shows how the percent uncertainty decreases with number of analyses, depending on the type of 238U ∕ 206Pb distribution depicted in (a)–(c); data in (d) assumed the best case scenario of 2 % uncertainty per data point and a U ∕ Pbc ratio of 10 for samples of 440, 80, and 15 Ma. Best uncertainties are achieved with uniform distributions and maximum spread. Although percent uncertainties are always better for older samples, younger samples yield better absolute uncertainties for well-distributed data.
4.2.1 U and Pbc distribution in calcite
Calculating theoretical limits is complicated, however, because the uncertainty of an isochron depends on the distribution of U and Pbc and thus on the distribution of U ∕ Pb and Pb ∕ Pb ratios. For example, a sample with a given maximum U ∕ Pbc will yield a final precision that increases with the number of analyses, but this improvement depends on the distribution of the U ∕ Pbc ratios. The distribution of U and Pb, and thus 238U ∕ 206Pb and 207Pb ∕ 206Pb, in calcite has not been a particular subject of study (but see Roberts et al., 2020), but a cursory analysis of the reference materials and unknowns presented in this paper shows that U and Pb concentrations follow normal distributions; RMs that contain sufficient U (WC-1 and Duff Brown Tank) display a near-normal distribution of U, whereas the distribution of U concentration of samples and RMs with lower U contents (ASH15 and unknowns) are lognormal (Fig. 4). Like U, Hg-corrected 204Pb counts (a proxy for common Pb) are normally distributed in RMs and unknowns; 208Pb counts are similar. The resulting 238U ∕ 206Pb ratios of RMs are normally distributed, but unknowns vary and can be rather uniform (e.g., C273C). The manner by which the type of distribution affects the final uncertainty is demonstrated in Fig. 5. The precision of a Tera–Wasserburg isochron is best defined by precisely defined end points with maximum spread; as such, except for samples with extreme U ∕ Pbc, a uniform distribution of 238U ∕ 206Pb ratios results in better final age precision than does a normal distribution. For example, a sample that is 440 Ma with normally distributed data (and ratios ±3σ from the mean) requires nearly 2 times as many points to achieve the same precision as a sample with uniformly distributed data over the same U ∕ Pb range (Fig. 5d; though this also depends on the maximum U ∕ Pbc). For normally distributed data with the same maximum U ∕ Pbc but only 50 % of the spread (i.e., more tightly clustered; Fig. 5b), the number of necessary data points increases further, excepting samples with extreme U ∕ Pbc (these data would be less dependent on the precision of the upper intercept).
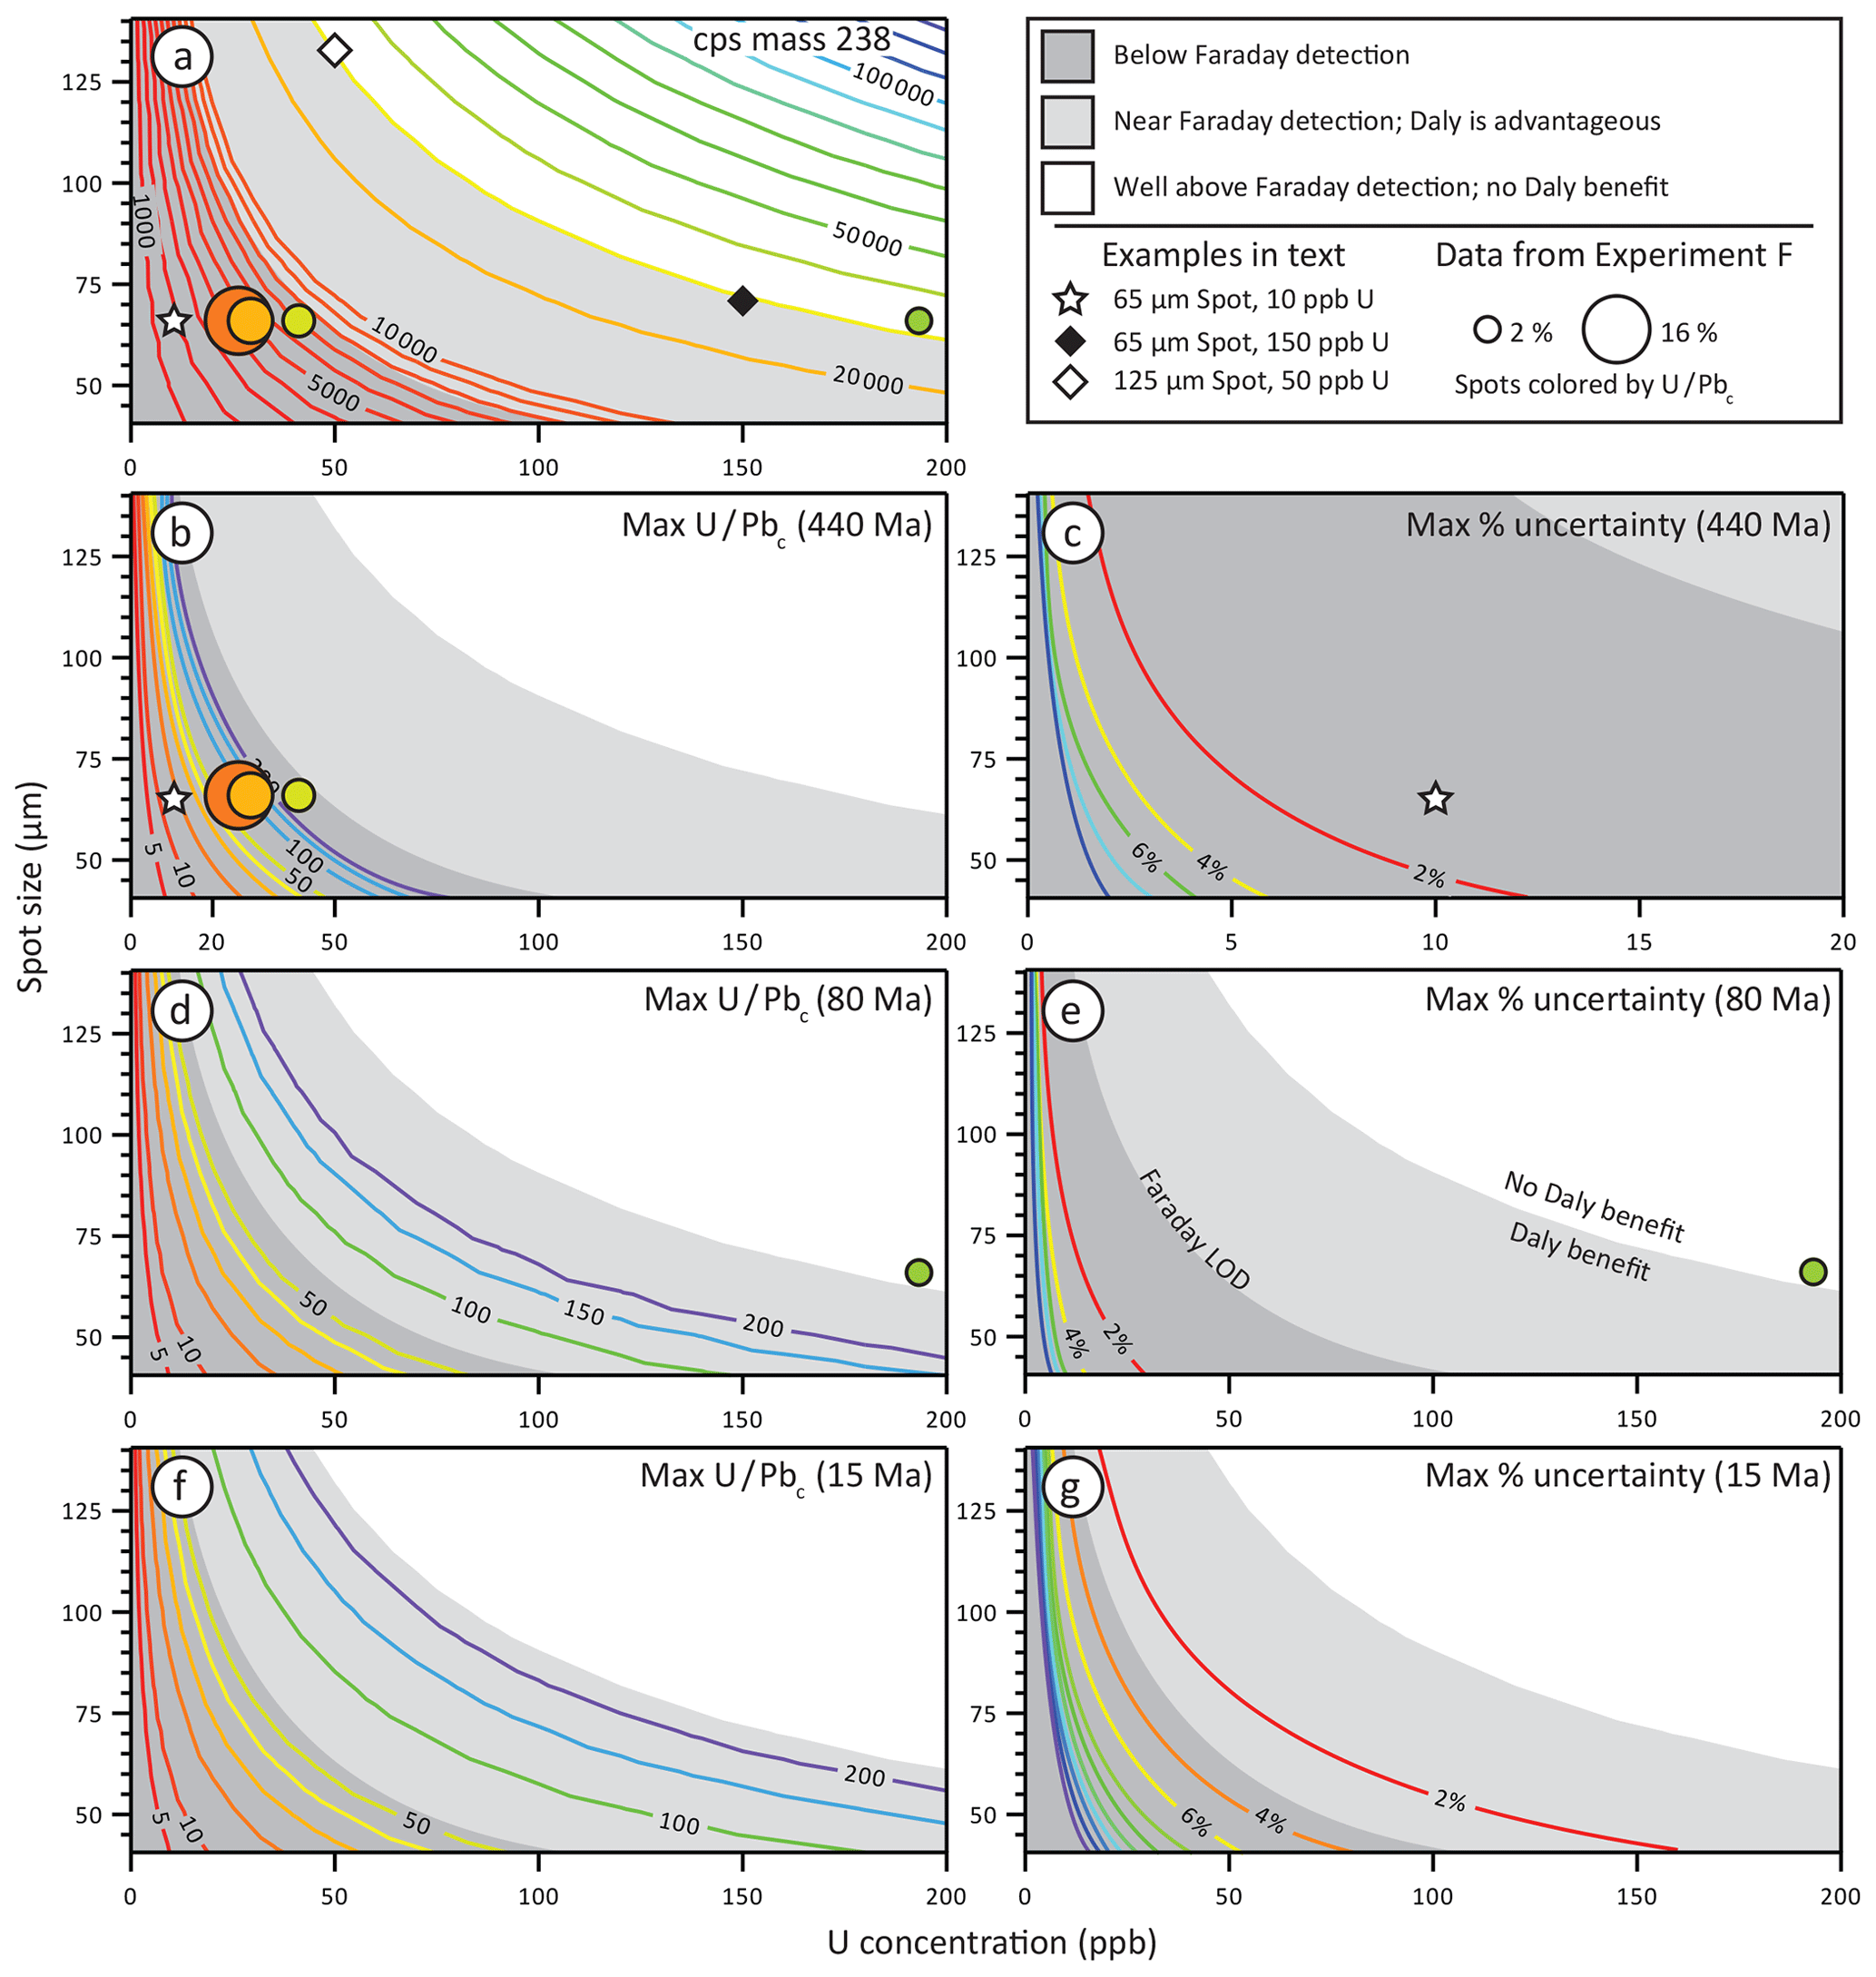
Figure 6Panel (a) shows the count rate expected with the Nu P3D given for a given spot size at a laser energy of ∼ 1 J cm−2 and 10 Hz. Panels (b), (d), (f) show the maximum U ∕ Pbc that can be achieved with the given U concentration and spot size (colored contours); the star symbol in (b) illustrates an example that a 65 µm spot with 10 ppb U can yield a U ∕ Pbc no better than ∼ 13, otherwise 207Pb will be below detection (i.e., < 30 cps; example explained in text). Colored circles indicate analyses of unknowns in Experiment F (238U on the Faraday; Table 2; 65 µm, average U parts per billion); color represents the maximum U ∕ Pbc ratio – taken from Table 2 – and the size represents the final uncertainty. Note that the maximum U ∕ Pbc correlates with U concentration. In all plots, the grey area (dark and light) represents the region in which measurement of 238U on a Daly is advantageous to that on a Faraday; open and filled diamonds in (a) represent examples in text in which spots smaller or lower in U are favorably measured on the Daly detector. Dark grey region represents spot sizes and U concentrations too low for measurement on a Faraday detector. Panels (c), (e), and (g) show the best possible uncertainty (colored contours) at the given count rates and spot sizes for 100 analyses, all with the same U concentration but a uniform distribution of 238U ∕ 206Pb ratios. Star symbol in (c) explained in text.
4.2.2 U and Pbc distribution in calcite
To compare theoretical data with those obtained from this study – i.e., in order to best represent a natural dataset – we present and discuss models (using the same Excel sheet as that in Sect. 4.1) with 100 uniformly distributed 238U ∕ 206Pb data points acquired for 10 s at 10 Hz, recognizing that, as stated above, this is likely a best-case scenario. We explore the implications of varying maximum U ∕ Pbc ratios rather than 238U ∕ 206Pb ratios because the former are independent of sample age. The results of the model are shown in Fig. 6. Because the precision of analyses in an ion-counter-only configuration is limited by the count rate of 207Pb, we calculate the maximum U ∕ Pbc ratio that can be achieved for different concentrations of U. For example, a 440 Ma sample with 10 ppb U run with a 65 µm spot size will yield ∼ 1500–2000 cps of U (star symbol in Fig. 6a, b, c). The maximum U ∕ Pbc that could be achieved with this count rate will be ∼ 13 because any higher values will yield too few counts of 207Pb to be measured. Assuming constant U concentration and normally distributed 238U ∕ 206Pb ratios, the best precision on the age of this sample is 0.6 % – considerably better than expected for LA-ICPMS (e.g., Horstwood et al., 2016). As a comparison, sample C283A contains an average of 10 ppb U (and maximum of 40 ppb) and thus yield a similar average count rate of 238U. Its maximum U ∕ Pbc of 26 is considerably less than the maximum theoretical value based on the concentration of that particular analysis because its Pb concentration is well above detection. It should be no surprise then that the age uncertainty is higher than the theoretical value at that count rate, but it is also higher than the theoretical value for a U ∕ Pbc of 26. Several factors may explain this: (1) though 100 analyses were measured, 32 were imprecise and rejected; (2) the distribution of 238U ∕ 206Pb ratios is not uniform; (3) laser instability, detector response time, laser-induced elemental fractionation (LIEF), signal instability, etc., add uncertainty beyond that based on counting statistics; and (4) low U ∕ Pbc values likely have less U and Pb than in the model.
Although optimistic, this model serves as a guide for the limitation of analyses of calcite by LA-ICPMS, given U concentration, maximum U ∕ Pbc, and spot size. First, for all but the youngest samples (≪ 15 Ma), measurement with the P3D can be advantageous for samples with lower U or those necessitating small spot sizes (e.g., < 150 ppb U and < 70 µm, or < 50 ppb U and < 125 µm; symbols in Fig. 6a); this is shown as the light and dark grey areas in Fig. 6 (i.e., the area below the “no Daly benefit line” in Fig. 6e). However, if, for example, the sample contains concentrations > 100 ppb U and the spot can be > 100 µm, there is no advantage to using the all-Daly configuration, and if there is significant material (i.e., spot size can be > 200 µm), any LA-ICPMS will provide the best possible results (that is, the precision will be limited not by the count rate, but rather other factors such as differences in LIEF and matrix effects). Second, it is highly unlikely, even with extreme spot sizes and rep rates, that samples with ≪ 1 ppb U can be analyzed. Third, older samples – when run on the P3D – reach their best possible uncertainty (ca. 2 %) with U concentrations of 10–15 ppb; samples as young as 80 Ma require little more than 30 ppb U, and samples as young as 15 Ma require up to 150 ppb U at moderate spot sizes. Though 2 % final uncertainty requires greater concentrations of U for younger samples (> 2500 cps 238U are needed for an 80 Ma sample, and > 12 000 cps 238U for a 15 Ma sample), it should be noted that – at a given concentration, spot size, and U ∕ Pbc – absolute uncertainty is relatively independent of age; for example, a sample with a 65 µm spot and 10 ppb U yields an uncertainty of just over 2 Ma, whether the sample is 15, 80, or 440 Ma. Finally, though not depicted directly in Fig. 6, precise ages can be obtained from data with rather low U ∕ Pbc values. For example, 100 spots with 2 % uncertainty yields a final uncertainty of 5–15 Ma (2σ) for samples with U ∕ Pbc ratios as low as 1–2. That said, data with such low U ∕ Pbc ratios should be viewed with caution, as systematic uncertainties – such as those introduced by inconsistencies in RM isotopic measurements – can lead to large errors when extrapolating data clustered near the upper intercept.
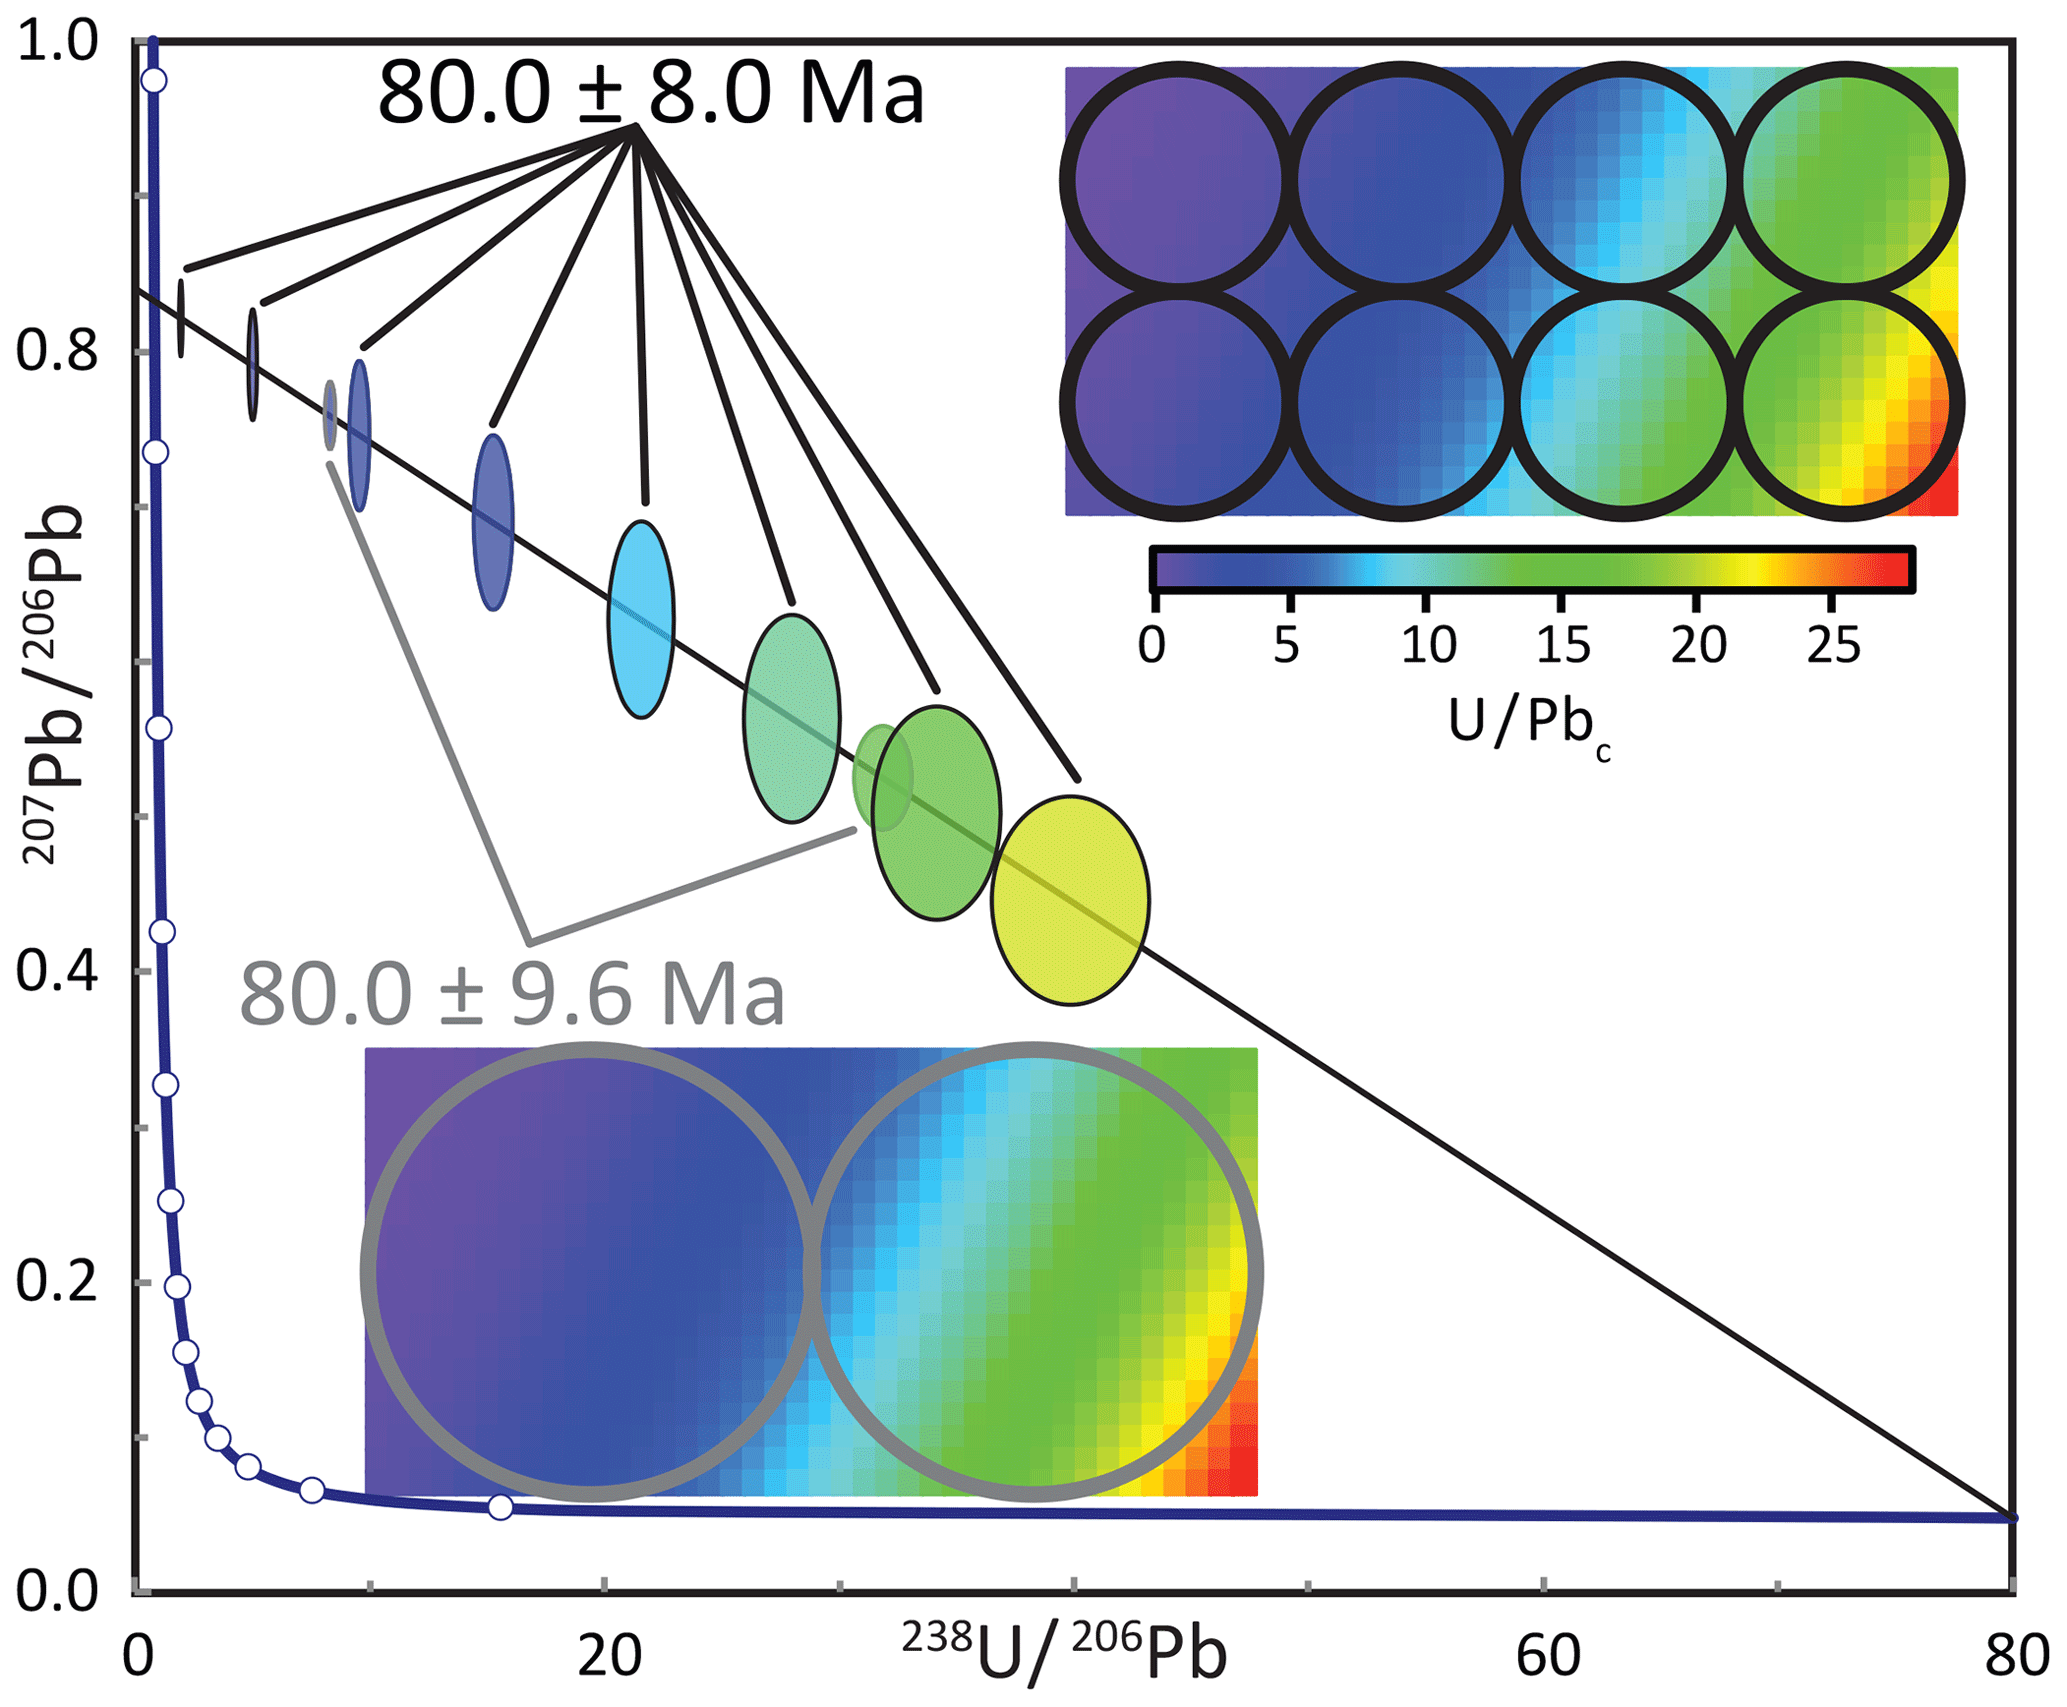
Figure 7Tera–Wasserburg diagram representing the analysis of a heterogeneous medium using different spot sizes. Though the bigger spot sizes yield smaller individual uncertainties, the smaller spots take advantage of the spread in U ∕ Pbc ratios and thus yield a better overall uncertainty on the lower intercept age.
4.3 More spots, deeper spots, or bigger spots?
The theoretical models discussed above use a 10 s integration time to compare the models to the empirical data. As discussed above, precision can be improved by increasing the number of analytical spots, but each spot can also be ablated for longer or at a higher rep rate (i.e., making deeper pits rather than more pits). One might imagine that these methods might be equally effective; however, there are two important points to consider. First, individual spot precision is limited to the long-term reproducibility of down-hole measurements and is generally no better than 2 %; this precision is more difficult to assess in calcite because most known reference materials exhibit moderate isotopic heterogeneity (e.g., Roberts et al., 2017). Thus, if increasing the depth of the pit yields analytical uncertainties < 2 %, then the excess pit depth is wasted and overall uncertainty fails to improve. Second, whereas increasing the number of spots leads to a linear increase in the total number of counts (and thus an increase in precision by ), an increase in pit depth does not lead to a linear increase in counts because ablation yields decrease with pit depth. Thus, if an increase in total counts could yield better precision, that increase should come from more and shallower laser pits rather than fewer and deeper pits.
It is also possible to increase precision by increasing the spot size. In fact, an argument could be made that an SC-ICPMS that measures 250 µm spots is just as effective as a MC-ICPMS that measures 100 µm spots. Though this argument has merit, the downside is twofold; (1) some regions of interest are simply not large enough to permit a spot 2.5× as wide, and (2) U and/or Pb (i.e., U ∕ Pbc) may be heterogeneous at scales smaller than the spot size, mixing calcite of different age or reducing the range of isotopic ratios that are used to construct an isochron. Figure 7 demonstrates that even though larger spots can yield a better per-spot precision, analyzing the same volume of material with smaller spots can yield better age precision because it can take advantage of the heterogeneous U and Pb concentrations typical of calcite.
-
Unlike geochronometers with high U and little to no common Pb – such as zircon and monazite – U–Pb dates of minerals with low U and significant common Pb can be limited by the count rates of the parent U rather than the daughter Pb.
-
Given a limit of detection of ∼ 8000 cps for on a Faraday and the sensitivity of the Nu P3D, samples with as little as 20 ppb U can be analyzed with a 100 µm spot at 10 Hz and as little as 5 ppb for a 200 µm spot. Even so, the Faraday is less precise than the Daly at count rates of < 30 000 cps, corresponding to U concentrations of ca. 75 and 20 ppb, with the same respective spot sizes and rep rates.
-
When 238U is analyzed on a Daly, the limit of detection drops by a factor of > 1000 and the analytical capability is thus limited by the LOD of Pb – 207Pb in almost all cases – and the ratio required for optimum precision. The typical LOD of 206Pb and 207Pb is ca. 50 cps; it is greater for higher-sensitivity instruments, and those with a higher background of common Pb. For a desired U ∕ Pbc ratio of ca. 5–10 for old and young samples, respectively, the required count rate of 238U would be 500–1000 cps or ca. 5–10 times smaller than can be analyzed on a Faraday detector. The analysis of 238U on a Daly, therefore, increases the analytical capability to ca. 0.5–2 ppb U for a 100–200 µm spot, respectively.
-
Although the percentage uncertainty that can be achieved with limited concentrations of U is considerably different among samples with different ages, the absolute uncertainty is approximately the same. For example, samples with 1500 cps 238U yield a maximum possible uncertainty of ca. 2 Ma, nearly independent of age (older samples yield slightly higher absolute uncertainties). However, because most LA-ICPMS facilities can achieve up to 2 % precision on final age calculations, younger samples can yield better absolute uncertainties; these can only be achieved at high U concentrations, which limits the advantage of the Nu P3D for young samples.
-
Given enough material and analytical time, an SC-ICPMS should, in theory, be capable of measuring samples with concentrations of approximately 2–10 times (i.e., 1–20 ppb U) that of the Nu P3D. However, because of their lower cycle times and inability to make concurrent measurements, SC-ICPMS instruments likely require considerably higher concentrations of U to obtain comparable date precision.
The code described in this paper is available on request from the author.
All data described herein are contained within the data Supplement.
These samples were limited to 25.4 cm epoxy mounts. If necessary, the author can inquire with the provider should one like access to the sample(s).
The supplement related to this article is available online at: https://doi.org/10.5194/gchron-2-343-2020-supplement.
The authors declare that they have no conflict of interest.
This article is part of the special issue “In situ carbonate U–Pb geochronology”. It is a result of the Goldschmidt conference, Barcelona, Spain, 18–23 August 2019.
This paper was greatly improved by the reviews of David M. Chew and Randy Parrish.
This paper was edited by Catherine Mottram and reviewed by David M. Chew and Randy Parrish.
Burisch, M., Gerdes, A., Walter, B. F., Neumann, U., Fettel, M., and Markl, G.: Methane and the origin of five-element veins: Mineralogy, age, fluid inclusion chemistry and ore forming processes in the Odenwald, SW Germany, Ore Geol. Rev., 81, 42–61, https://doi.org/10.1016/j.oregeorev.2016.10.033, 2017.
Chew, D. M., Petrus, J. A., and Kamber, B. S.: U-Pb LA-ICPMS dating using accessory mineral standards with variable common Pb, Chem. Geol., 363, 185–199, https://doi.org/10.1016/j.chemgeo.2013.11.006, 2014.
Goodfellow, B. W., Viola, G., Bingen, B., Nuriel, P., and Kylander-Clark, A. R.: Palaeocene faulting in SE Sweden from U-Pb dating of slickenfibre calcite, Terra Nova, 29, 321–328, 2017.
Hansman, R. J., Albert, R., Gerdes, A., and Ring, U.: Absolute ages of multiple generations of brittle structures by U-Pb dating of calcite, Geology, 46, 207–210, https://doi.org/10.1130/G39822.1, 2018.
Hill, C. A., Polyak, V. J., Asmerom, Y., and Provencio, P. C. T. C.: Constraints on a Late Cretaceous uplift, denudation, and incision of the Grand Canyon region, southwestern Colorado Plateau, USA, from U-Pb dating of lacustrine limestone, Tectonics, 35, 896–906, https://doi.org/10.1002/2016tc004166, 2016.
Hoff, J. A., Jameson, J., and Hanson, G. N.: Application of Pb Isotopes to the Absolute Timing of Regional Exposure Events in Carbonate Rocks - an Example from U-Rich Dolostones from the Wahoo Formation (Pennsylvanian), Prudhoe Bay, Alaska, J. Sediment. Res. A, 65, 225–233, 1995.
Horstwood, M. S. A., Košler, J., Gehrels, G., Jackson, S. E., McLean, N. M., Paton, C., Pearson, N. J., Sircombe, K., Sylvester, P., Vermeesch, P., Bowring, J. F., Condon, D. J., and Schoene, B.: Community-Derived Standards for LA-ICP-MS U-(Th-)Pb Geochronology – Uncertainty Propagation, Age Interpretation and Data Reporting, Geostand. Geoanal. Res., 40, 311–332, https://doi.org/10.1111/j.1751-908X.2016.00379.x, 2016.
Mangenot, X., Gasparrini, M., Gerdes, A., Bonifacie, M., and Rouchon, V.: An emerging thermochronometer for carbonate-bearing rocks: Delta(47) ∕ (U-Pb), Geology, 46, 1067–1070, https://doi.org/10.1130/G45196.1, 2018.
Nuriel, P., Weinberger, R., Kylander-Clark, A. R., Hacker, B., and Craddock, J.: The onset of the Dead Sea transform based on calcite age-strain analyses, Geology, 45, 587–590, 2017.
Nuriel, P., Wotzlaw, J.-F., Ovtcharova, M., Vaks, A., Stremtan, C., Šala, M., Roberts, N. M. W., and Kylander-Clark, A. R. C.: The use of ASH-15 flowstone as a matrix-matched reference material for laser-ablation U-Pb geochronology of calcite, Geochronology Discuss., https://doi.org/10.5194/gchron-2020-22, in review, 2020.
Parrish, R. R., Parrish, C. M., and Lasalle, S.: Vein calcite dating reveals Pyrenean orogen as cause of Paleogene deformation in southern England, J. Geol. Soc., 175, 425–442, https://doi.org/10.1144/jgs2017-107, 2018.
Paton, C., Hellstrom, J., Paul, B., Woodhead, J., and Hergt, J.: Iolite: Freeware for the visualisation and processing of mass spectrometric data, J. Anal. Atom. Spectrom., 26, 2508–2518, https://doi.org/10.1039/c1ja10172b, 2011.
Rasbury, E. T., Hanson, G. N., Meyers, W. J., and Saller, A. H.: Dating of the time of sedimentation using U-Pb ages for paleosol calcite, Geochim. Cosmochim. Ac., 61, 1525–1529, https://doi.org/10.1016/S0016-7037(97)00043-4, 1997.
Rasbury, E. T., Hanson, G. N., Meyers, W. J., Holt, W. E., Goldstein, R. H., and Saller, A. H.: U-Pb dates of paleosols: Constraints on late Paleozoic cycle durations and boundary ages, Geology, 26, 403–406, https://doi.org/10.1130/0091-7613(1998)026<0403:Updopc>2.3.Co;2, 1998.
Richards, D. A., Bottrell, S. H., Cliff, R. A., Strohle, K., and Rowe, P. J.: U-Pb dating of a speleothem of Quaternary age, Geochim. Cosmochim. Ac., 62, 3683–3688, https://doi.org/10.1016/S0016-7037(98)00256-7, 1998.
Roberts, N. M. W. and Walker, R. J.: U-Pb geochronology of calcite-mineralized faults: Absolute timing of rift-related fault events on the northeast Atlantic margin, Geology, 44, 531–534, https://doi.org/10.1130/G37868.1, 2016.
Roberts, N. M. W., Rasbury, E. T., Parrish, R. R., Smith, C. J., Horstwood, M. S. A., and Condon, D. J.: A calcite reference material for LA-ICP-MS U-Pb geochronology, Geochem. Geophy. Geosy., 18, 2807–2814, https://doi.org/10.1002/2016GC006784, 2017.
Roberts, N. M. W., Drost, K., Horstwood, M. S. A., Condon, D. J., Chew, D., Drake, H., Milodowski, A. E., McLean, N. M., Smye, A. J., Walker, R. J., Haslam, R., Hodson, K., Imber, J., Beaudoin, N., and Lee, J. K.: Laser ablation inductively coupled plasma mass spectrometry (LA-ICP-MS) U–Pb carbonate geochronology: strategies, progress, and limitations, Geochronology, 2, 33–61, https://doi.org/10.5194/gchron-2-33-2020, 2020.
Spencer, K. J., Hacker, B. R., Kylander-Clark, A. R. C., Andersen, T. B., Cottle, J. M., Stearns, M. A., Poletti, J. E., and Seward, G. G. E.: Campaign-style titanite U-Pb dating by laser-ablation ICP: Implications for crustal flow, phase transformations and titanite closure, Chem. Geol., 341, 84–101, https://doi.org/10.1016/j.chemgeo.2012.11.012, 2013.
Wang, Z. S., Rasbury, E. T., Hanson, G. N., and Meyers, W. J.: Using the U-Pb system of calcretes to date the time of sedimentation of elastic sedimentary rocks, Geochim. Cosmochim. Ac., 62, 2823–2835, https://doi.org/10.1016/S0016-7037(98)00201-4, 1998.
Winter, B. L. and Johnson, C. M.: U-Pb Dating of a Carbonate Subaerial Exposure Event, Earth Planet. Sc. Lett., 131, 177–187, https://doi.org/10.1016/0012-821x(95)00026-9, 1995.