the Creative Commons Attribution 4.0 License.
the Creative Commons Attribution 4.0 License.
 | 15 Dec 2020
Development of a multi-method chronology spanning the Last Glacial Interval from Orakei maar lake, Auckland, New Zealand
Kathryn E. Fitzsimmons
Jenni L. Hopkins
Andreas Nilsson
Toshiyuki Fujioka
David Fink
Charles Mifsud
Marcus Christl
Raimund Muscheler
Paul C. Augustinus
Northern New Zealand is an important location for understanding Last Glacial Interval (LGI) palaeoclimate dynamics, since it is influenced by both tropical and polar climate systems which have varied in relative strength and timing. Sediments from the Auckland Volcanic Field maar lakes preserve records of such large-scale climatic influences on regional palaeo-environment changes, as well as past volcanic eruptions. The sediment sequence infilling Orakei maar lake is continuous, laminated, and rapidly deposited, and it provides a high-resolution (sedimentation rate above ∼ 1 m kyr−1) archive from which to investigate the dynamic nature of the northern New Zealand climate system over the LGI. Here we present the chronological framework for the Orakei maar sediment sequence. Our chronology was developed using Bayesian age modelling of combined radiocarbon ages, tephrochronology of known-age rhyolitic tephra marker layers, 40Ar∕39Ar-dated eruption age of a local basaltic volcano, luminescence dating (using post-infrared–infrared stimulated luminescence, or pIR-IRSL), and the timing of the Laschamp palaeomagnetic excursion. We have integrated our absolute chronology with tuning of the relative palaeo-intensity record of the Earth's magnetic field to a global reference curve (PISO-1500). The maar-forming phreatomagmatic eruption of the Orakei maar is now dated to > 132 305 years (95 % confidence range: 131 430 to 133 180 years). Our new chronology facilitates high-resolution palaeo-environmental reconstruction for northern New Zealand spanning the last ca. 130 000 years for the first time as most NZ records that span all or parts of the LGI are fragmentary, low-resolution, and poorly dated. Providing this chronological framework for LGI climate events inferred from the Orakei sequence is of paramount importance in the context of identification of leads and lags in different components of the Southern Hemisphere climate system as well as identification of Northern Hemisphere climate signals.
- Article
(19204 KB) - Full-text XML
-
Supplement
(151 KB) - BibTeX
- EndNote


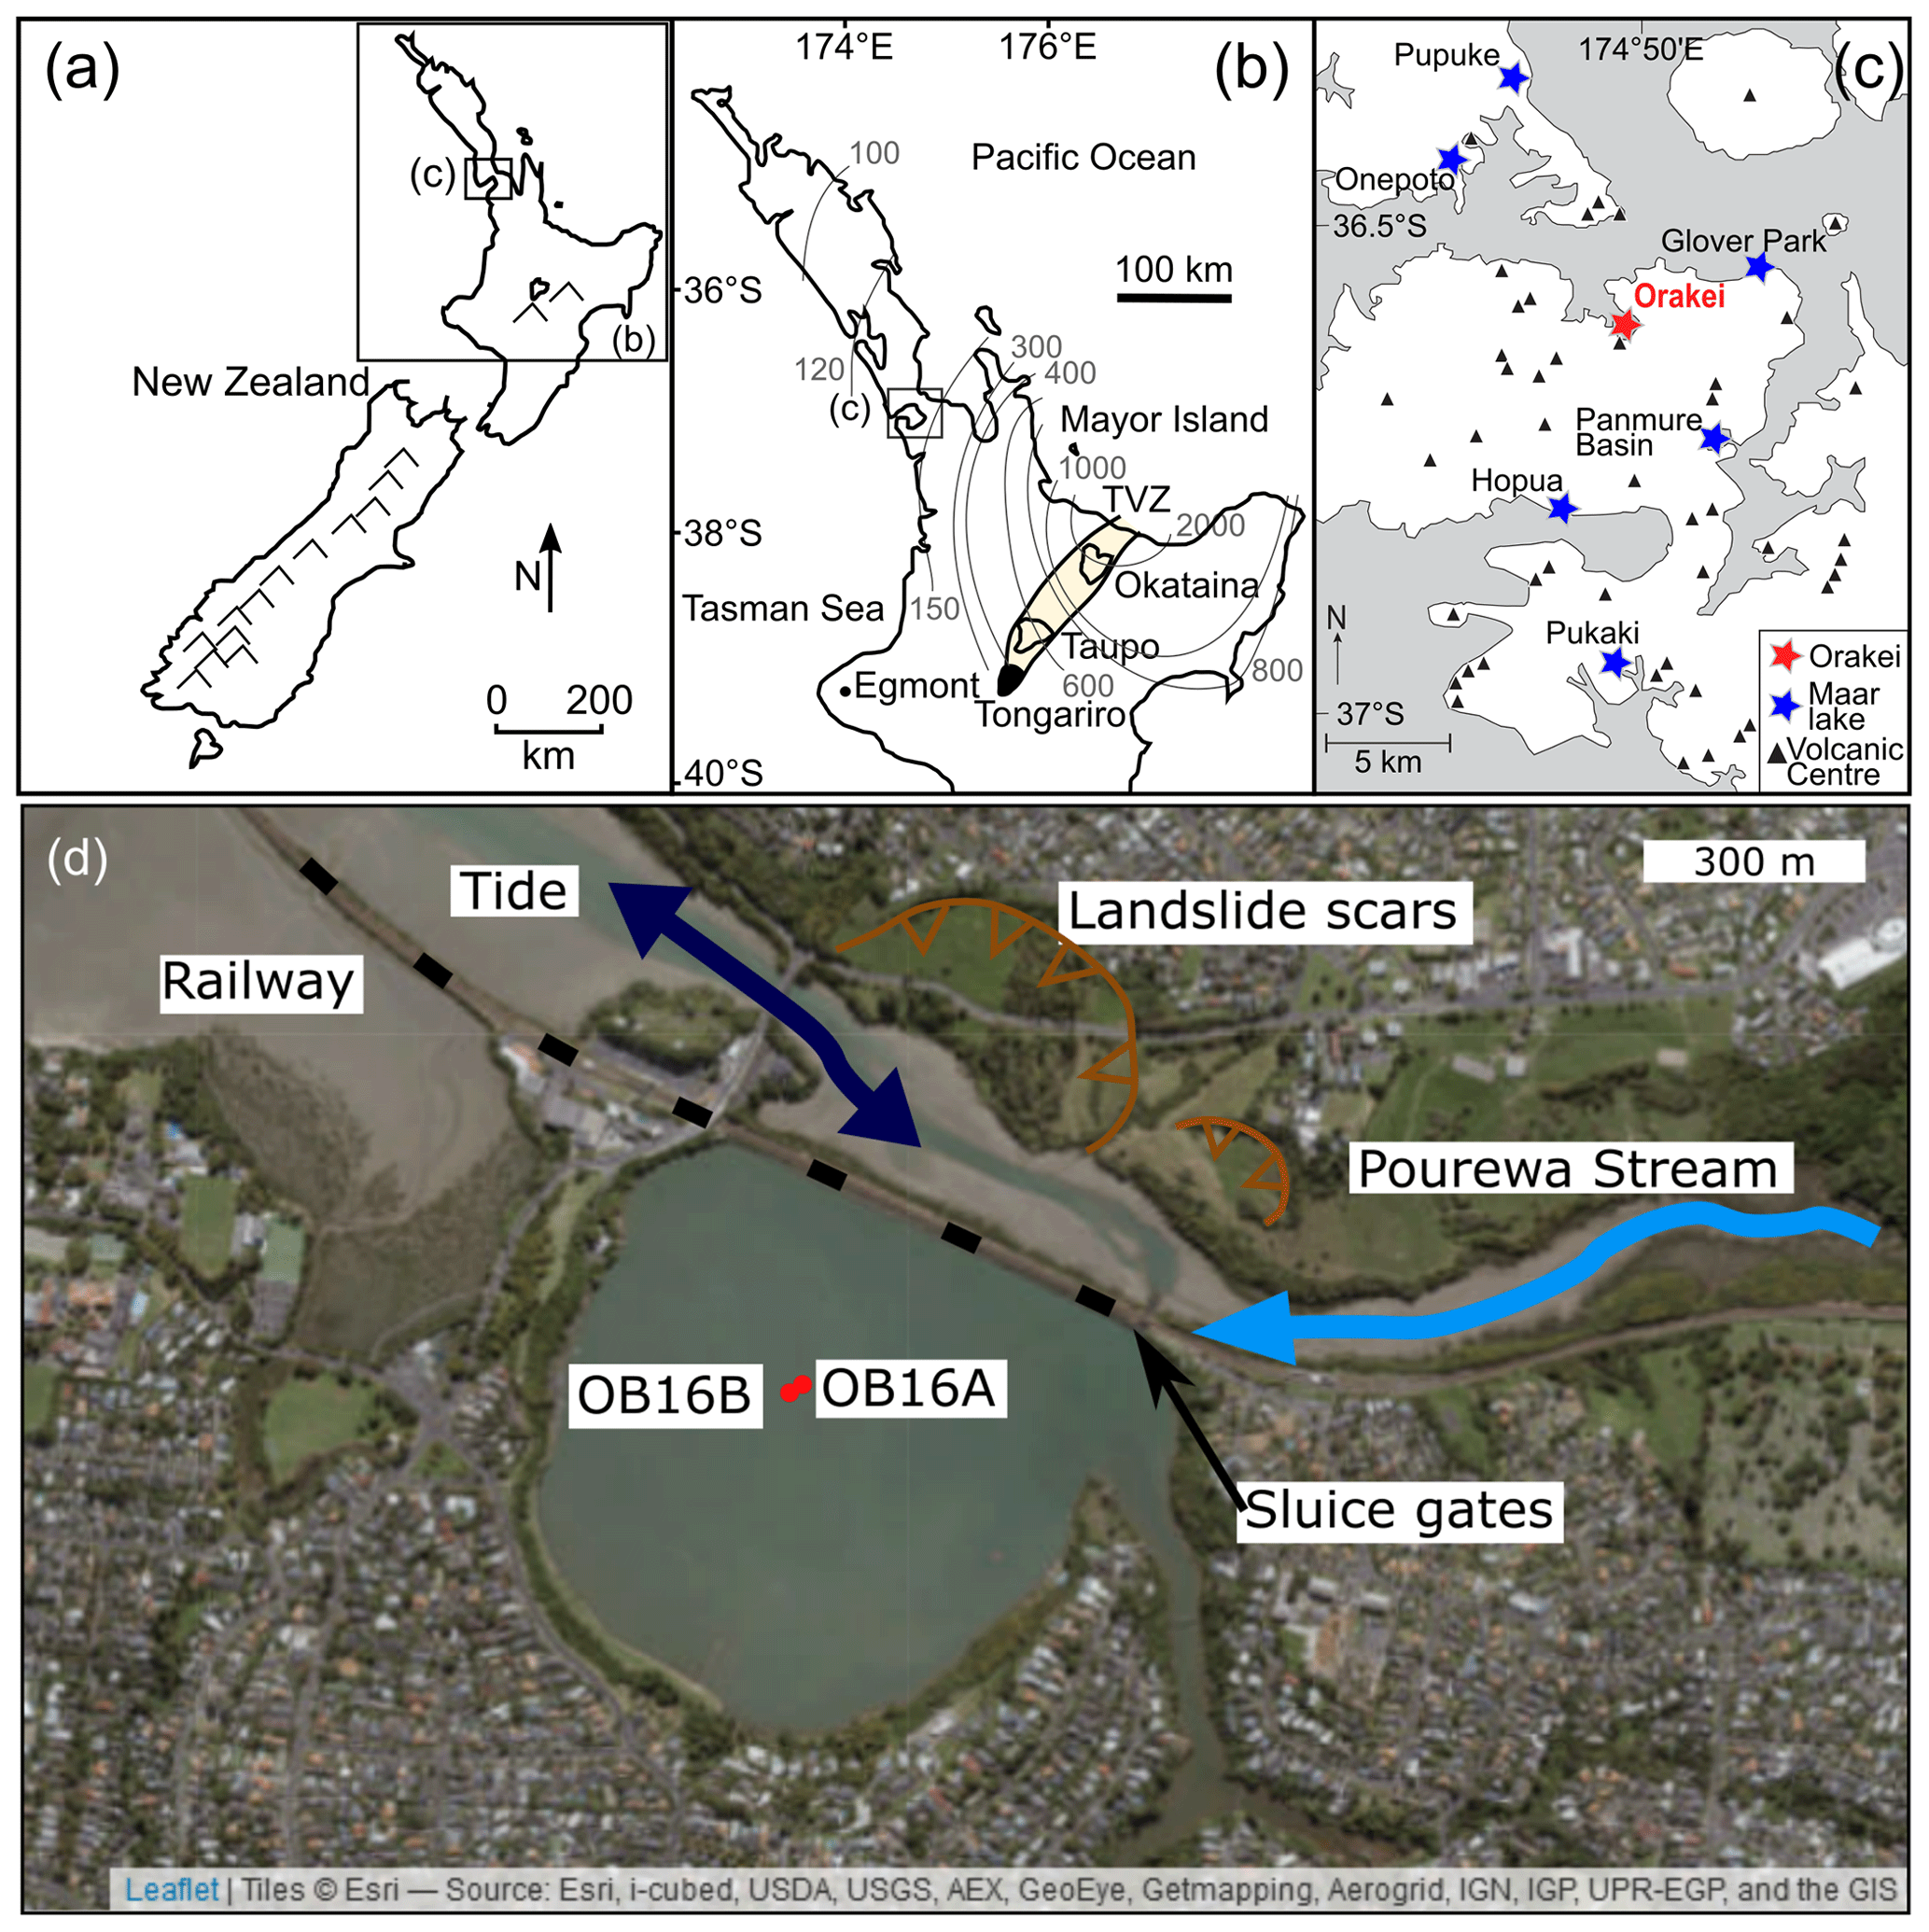
Figure 1Map of the Orakei maar study area. (a) New Zealand with insets (b) and (c) marked. (b) New Zealand's North Island with Auckland (c) and the major volcanic source centres marked; the extent of the TVZ is shaded in yellow. Thin grey lines and numbers are isopachs (in mm) of the widespread Rotoehu tephra (modified from Lowe, 2011) highlighting the importance of the TVZ tephras as age markers in sediment records from New Zealand's North Island. (c) Auckland Volcanic Field showing the position of Orakei Basin. (d) Satellite image (ESRI World Imagery) show the coring locations with red dots and other important features of the surroundings of the maar. Modified after Hopkins et al. (2017) and Peti and Augustinus (2019).
A better understanding of past climatic change, and coeval responses of the terrestrial ecosystems, is fundamental for quantifying the nature, magnitude, rates, and drivers of these changes. However, temporal and spatial uncertainties prevent accurate understanding of the generation and transmission of climate events in a global context (Alley et al., 2003; Broecker, 2003; NGRIP Members, 2004; Seelos et al., 2009; Shanahan et al., 2009; Vandergoes et al., 2005). The incomplete picture of the spatial and temporal variability of terrestrial responses to climatic forcing globally is partly due to two factors: (1) a paucity of complete, long, and high-resolution terrestrial records of past climatic change at the Southern Hemisphere mid-latitudes, and (2) large chronological uncertainties of the few available records spanning the Last Glacial Interval (LGI; 115 000–12 000 cal years BP). In this context, the laminated sediment sequences from maar lakes in the Auckland Volcanic Field (AVF) provide key palaeoclimate records for the LGI and beyond (e.g. Augustinus et al., 2012; Augustinus, 2007; Pepper et al., 2004; Stephens et al., 2012).
The AVF is located in the city of Auckland towards the north of the North Island of New Zealand (Fig. 1) and consists of 53 basaltic volcanic centres that have erupted in the past ca. 200 000 years (e.g. Lindsay et al., 2011; Leonard et al., 2017). Of these 53 AVF volcanoes, 13 centres are extant or palaeo-maar crater lakes, ranging from ca. 200 000 to ca. 100 000 years in age (Augustinus, 2007, 2016). Seven of the maar lake sequences have been drilled to date, and all contain well-laminated lacustrine sediment intercalated with tephra from a range of AVF and other volcanic centres in the Taupo Volcanic Zone (TVZ). This study focuses on the lacustrine sediment sequence contained in Orakei Basin, deposited following the phreatomagmatic eruption forming the maar crater until the post-glacial sea level rise breached the crater rim and led to the current connection between Orakei Basin and the sea (Fig. 1; Peti and Augustinus, 2019). The sediment record from the Orakei maar palaeolake is unprecedented in its combination of length, resolution, and completeness in the context of the terrestrial south-west (SW) Pacific. The Orakei archive has the potential to facilitate reconstruction of the most detailed picture yet of past climatic changes in this part of the Southern Hemisphere, a region bridging the westerly-dominated mid-latitudes and the subtropics (Peti and Augustinus, 2019).
In this study, we integrate numerical dating techniques (tephrochronology, radiocarbon, luminescence) and correlative dating (tuning of palaeomagnetic field variations established by the relative palaeo-intensity (RPI) and meteoric 10Be) to develop an original age–depth model of the Orakei maar lake sediments. Here we apply and assess the utility of each of these approaches in the context of the development of the Orakei maar lake sediment sequence chronology.
A preliminary age model had been presented based on rhyolitic tephra marker layers in Peti and Augustinus (2019). In comparison to this earlier model, the present study re-evaluates the tephra identification and adds radiocarbon and luminescence dates, as well as palaeomagnetic measurements and variations in 10Be deposition. This study develops a robust chronological framework for the long lacustrine sediment sequence retrieved from Orakei maar (Peti and Augustinus, 2019). This independent chronology for this record will improve temporal constraints on regional palaeoclimatic and palaeo-environmental reconstructions from the New Zealand sector of the SW Pacific, thereby enhancing our ability to identify leads and lags in climate teleconnections between the poles and tropics.
Orakei maar lies adjacent to the sea at the mouth of the Waitematā Harbour, where it joins the Hauraki Gulf through the Tamaki Strait (Fig. 1). The Orakei maar was formed as the result of a highly explosive phreatomagmatic eruption (126 150 ± 3320 years (2σ); Hopkins et al., 2017). Since then it has hosted a lake that persisted for most of its history, protected by a ca. 50 m high tuff ring from which material has slumped into the lake basin at various times and at various magnitudes (Peti and Augustinus, 2019).
Sedimentation in the Orakei maar lake was dominated by autochthonous biogenic processes with contributions from distal aeolian transport and mass flows from erosion of the steep crater rim (Fig. 1d), since the catchment was mostly constrained by the tuff ring surrounding the maar lake (Fig. 1d). A short period of fluvial sedimentation interrupted endorheic lacustrine conditions (Peti and Augustinus, 2019). Postglacial sea level rise breached the crater rim abruptly at ca. 9000 cal years BP, after which 18.6 m of estuarine muds were rapidly deposited, controlled by tidal inflow given Orakei Basin's proximity to the sea (Fig. 1; Hayward et al., 2008; Peti and Augustinus, 2019). Orakei Basin is presently connected to the sea by artificially controlled inflow and outflow following the construction of a railway embankment in the 1920s (Hayward and Hayward, 1999) and is surrounded by residential areas (Fig. 1c, d).
Orakei maar and the Auckland area are dominated by a warm temperate-to-subtropical climate (Hessell, 1988) with a mean annual temperature of 15 ∘C. The mean annual rainfall is 1000–1400 mm, with drier summers and wetter winters (Hessell, 1988; Hurnard, 1979). On a larger scale, New Zealand experiences a spatially variable climate dependent on synoptic-scale pressure systems, wind regimes, latitude, topography, and marine proximity. These dynamic climate subsystems likely have expanded and contracted through time, thereby influencing the long-term climate of the Orakei area. Kidson (2000) described six regional climate zones in New Zealand from north to south, which experience very different climate parameters. Persistent mid-latitude westerly circulation brings moisture-laden air masses to much of New Zealand (Hessell, 1988), although the northern parts of the archipelago, including the Orakei area, are also seasonally influenced by the subtropical anticyclonic belt (Alloway et al., 2007; Barrell et al., 2013). The modern landscape and vegetation of Auckland have been heavily modified by human activity (Shane and Sandiford, 2003) following Maori arrival in the late 13th century (Newnham et al., 2018).
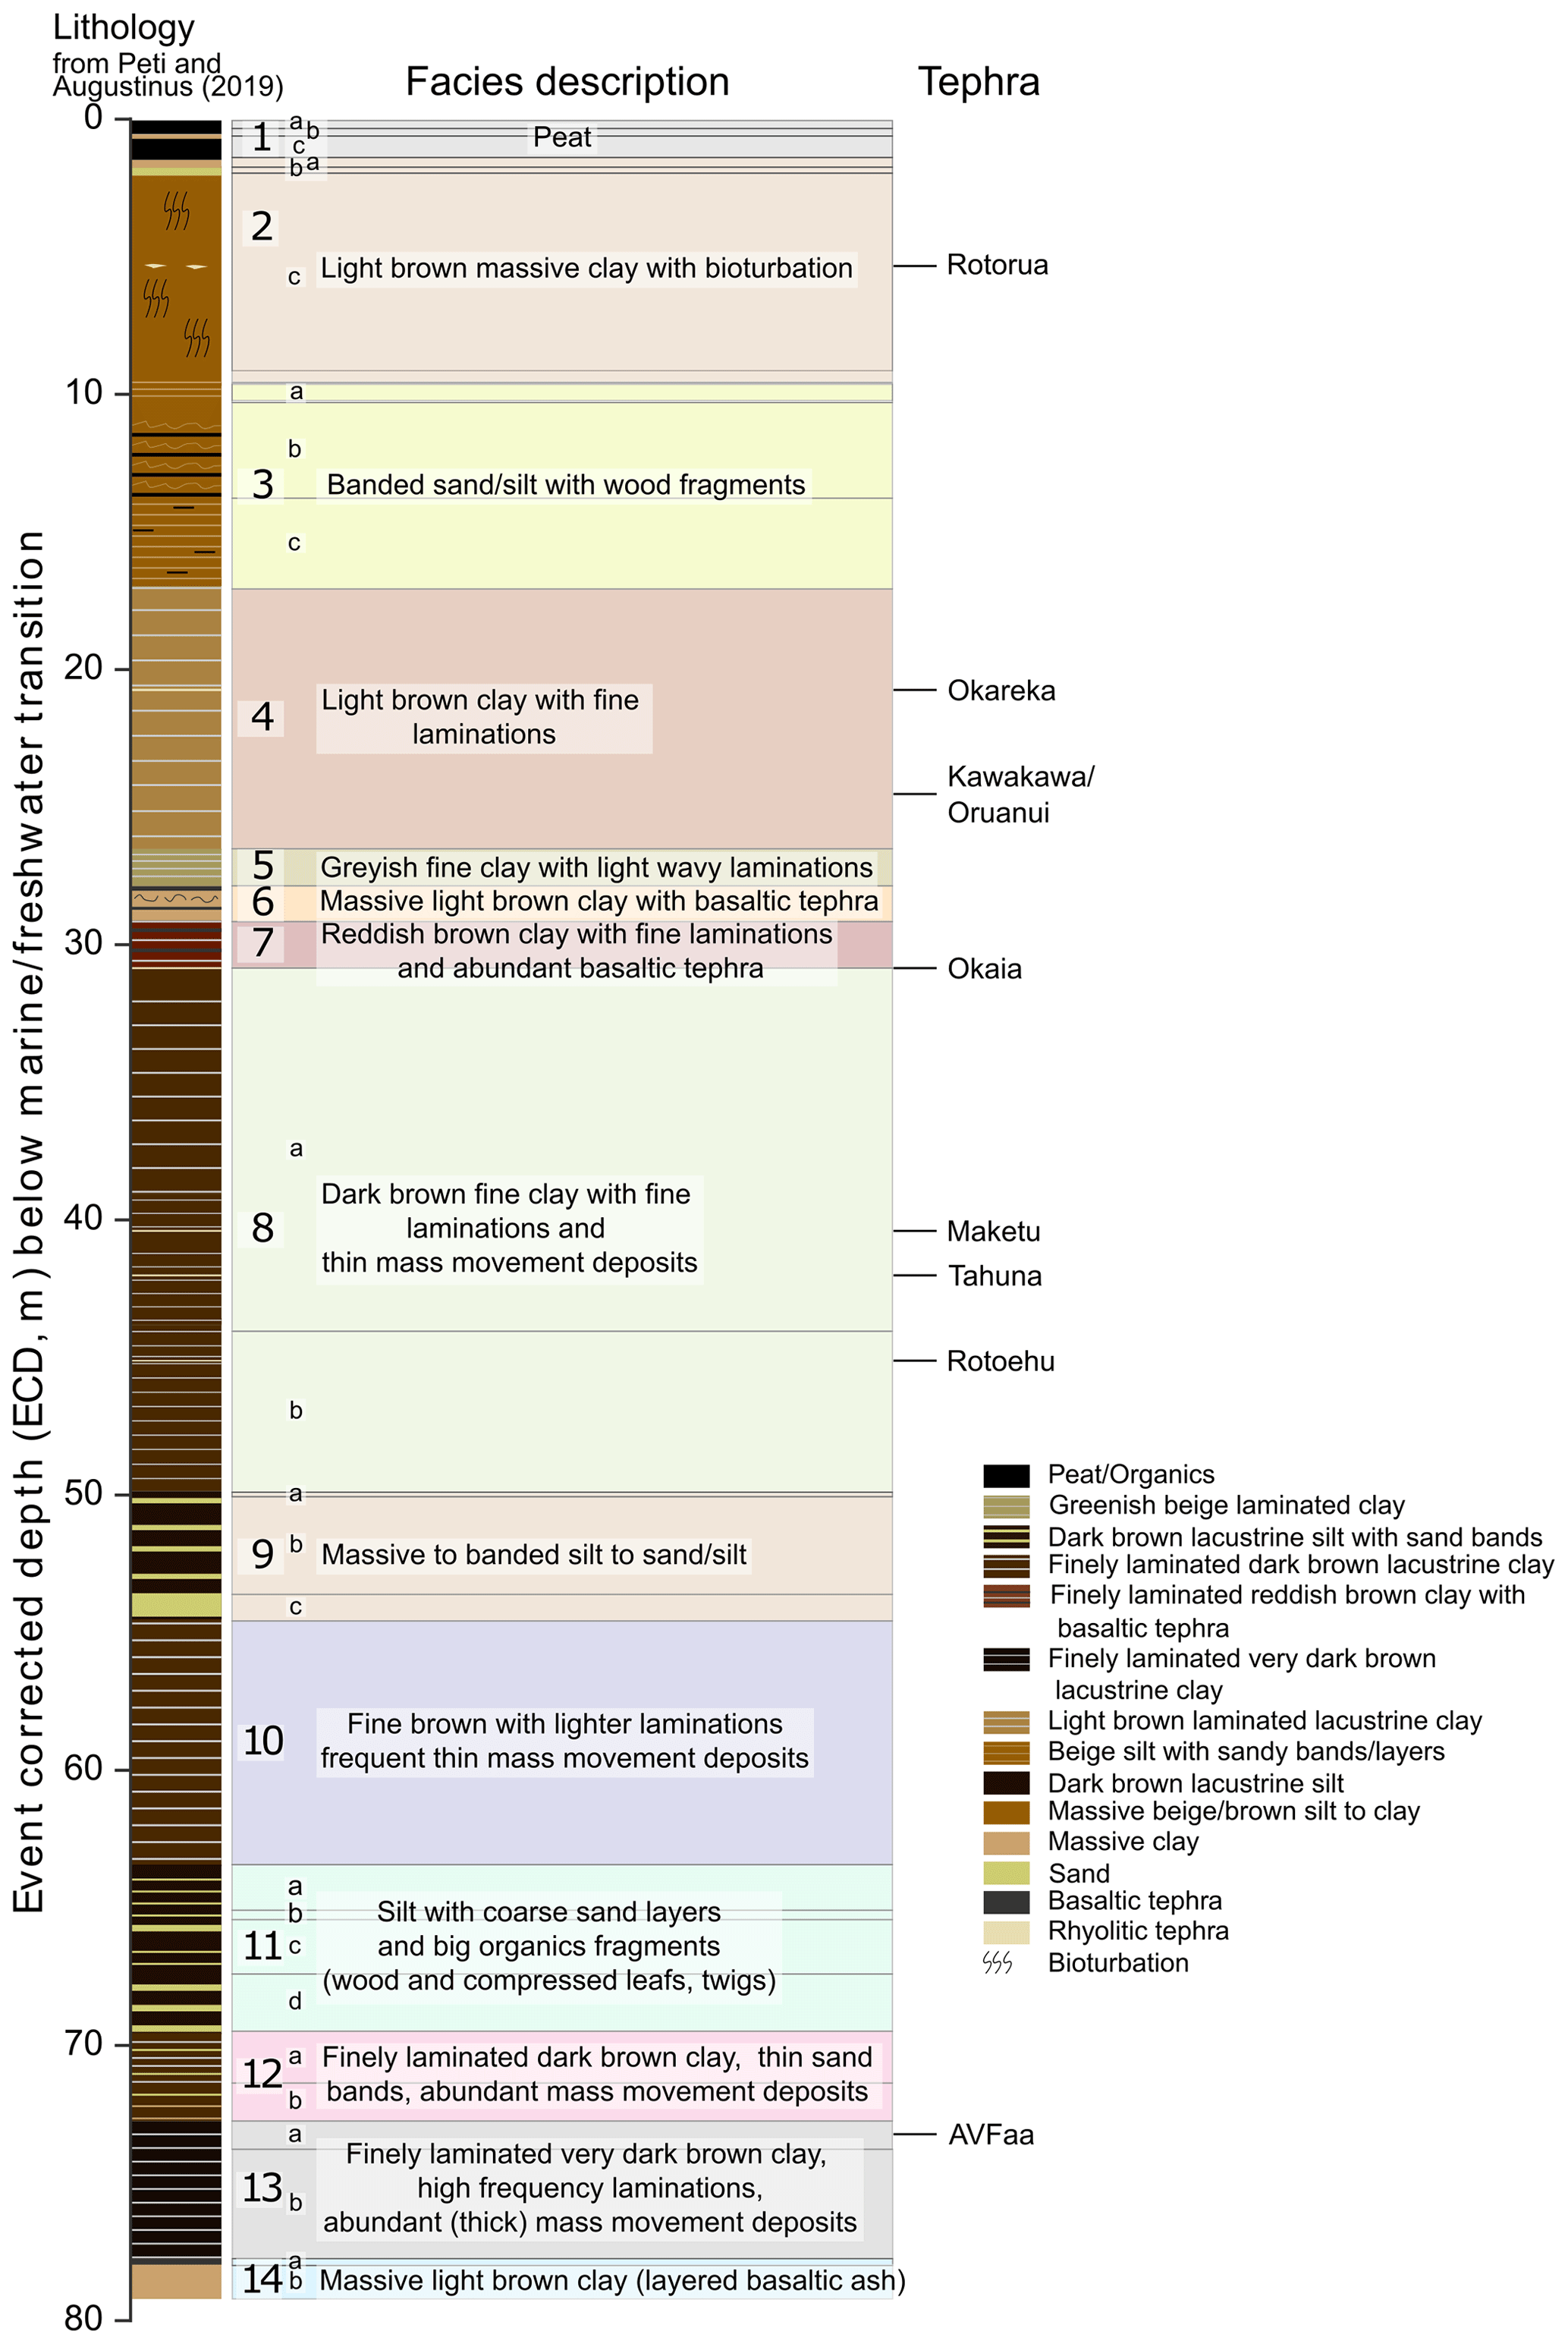
Figure 2Simplified lithology and summarised facies unit description of the Orakei sediment sequence. After Peti and Augustinus (2019).
The Orakei sediment sequence is a composite of several overlapping cores (Peti and Augustinus, 2019). Two overlapping cores with a 50 cm vertical offset were retrieved from Orakei Basin in 2016 using wireline drilling in 1 m sections. The sediment sections collected in 2016 were combined with a shorter core collected in 2007 to produce a complete composite stratigraphy as described in Peti and Augustinus (2019). The Orakei sediment sequence consists of 14 sediment facies units overlying the Waitematā sandstone basement and basaltic volcanic ejecta from the maar-forming eruption; it is summarised in Fig. 2 (Peti and Augustinus, 2019). The Orakei maar core chronology presented here was established based on the event-corrected depth (ECD; Peti and Augustinus, 2019), in which all identified events of instantaneous deposition (tephra layers and mass movement deposits) have been removed.
3.1 Tephrochronology
Detailed tephrochronology is possible since several volcanic centres from the TVZ, North Island, New Zealand, frequently ejected large volumes of rhyolitic material throughout the late Quaternary, repeatedly mantling the Auckland region with volcanic ash providing isochronous tephra marker layers (e.g. Shane and Hoverd, 2002; Molloy et al., 2009; Zawalna-Geer et al., 2016) in the AVF maar lake sequences (Fig. 1).
Tephra identification of eight visible layers was undertaken by major element analysis of glass shards via electron microprobe analyses (EMPAs) following standard protocols as described in Peti et al. (2019). EMPAs were performed by a JEOL JXA-8230 Superprobe at Victoria University of Wellington. A minimum of 10 individual glass shards in carbon-coated epoxy mounts were analysed using wavelength diffraction spectroscopy (WDS) with a static defocused beam at 10 µm and 8 nA. Major element oxide concentrations were determined using the ZAF1 correction method and normalised to 100 % to account for variable degrees of post-eruption hydration (Shane, 2000). Compositional data, such as major element percentages, are non-normally distributed and highly constrained by the closed-sum effect (Aitchison, 1986). For this reason, we transformed the major element oxide concentrations using the centralised-log-ratio transformation (clr in the R package “compositions 1.40–2”; van den Boogaart et al., 2018) prior to principal component analysis (PCA) using the prcomp command in the “stats” package as part of R version 3.5.3 (R Core Team, 2020).
The age for the Okareka tephra layer was re-calculated using 14C ages from Molloy et al. (2009) as follows: only 14C ages from leaf fragments were accepted for the age determination of the Okareka tephra layer from the Molloy et al. (2009) 14C dataset. The 14C ages OZK262 and OZK263 were combined in OxCal 4.3 (Bronk Ramsey, 2009) with the “R_combine” command to obtain a combined conventional radiocarbon age for the Okareka tephra (used in Sect. 3.2 for reservoir-correction determination), which was then calibrated with SHCal20 (Hogg et al., 2020).
3.2 Radiocarbon dating
Radiocarbon dating was used to refine the tephrochronology-based age estimates of the Orakei sequence. Twenty-five macrofossils (twigs and bark) were extracted for radiocarbon dating, rinsed with de-ionised water and dried at 40 ∘C. Twenty-eight bulk sediment samples were also extracted from 1 cm thick slices, dried at 40 ∘C, and thoroughly homogenised. Anomalously old radiocarbon ages in lacustrine sediment samples can arise due to a freshwater reservoir effect, resulting from water rich in dissolved ancient calcium carbonate (Philippsen, 2013). We made efforts to restrict radiocarbon dating to short-lived terrestrial material, but the scarcity of macrofossils often obviated this approach so that we also used bulk sediment 14C dates at the risk of obtaining anomalously old ages via incorporating old carbon. To determine facies-dependent freshwater reservoir-effect corrections, we compared paired radiocarbon ages from terrestrial macrofossils and bulk sediment taken from the same depth. For facies unit 4, we selected the age of the Okareka tephra layer instead of a macrofossil and sediment sample OZX348, and samples OZX341 (wood) and OZX347 (bulk sediment) for facies 8 following the recommendations of Philippsen (2013).
Radiocarbon dating of organic macrofossils and bulk sediment was conducted at the Australian Nuclear Science and Technology Organisation (ANSTO) (Fink et al., 2004), apart from one macrofossil sample at the Radiocarbon Dating Laboratory (Department of Geology, Lund University) and one published date (NZA28865) from the Rafter Radiocarbon Laboratory (GNS, New Zealand). Samples for accelerator mass spectrometry (AMS) measurement were pre-treated with 2 M HCl to remove carbonate, 0.5–4 % NaOH to remove humic and fulvic acids, and then 2 M HCl to remove absorbed CO2 from the atmosphere during the preparation process. After drying, the samples were combusted, graphitised, and analysed at the respective AMS facilities. Ages were reservoir-corrected and calibrated using the SHCal20 calibration curve (Hogg et al., 2020) as part of the age–depth modelling process (see Sect. 3.7).
3.3 Luminescence dating
Luminescence dating, a technique which determines the time elapsed since crystalline minerals such as quartz and feldspar were last exposed to sunlight (Aitken, 1990), was also applied. In this case, feldspar was used for luminescence dating, since New Zealand's relatively young geological history precludes effective dating of quartz due to reduced sensitisation of the luminescence signal (Almond et al., 2007). Feldspar is common in the Orakei sediments; its comparatively brighter infrared-stimulated luminescence (IRSL) signal was used to date deposition of the lake sediment. The most stable known signal from feldspar, known as post-infrared–infrared-stimulated luminescence (pIR-IRSL), was used for the Orakei sediments > 50 000 years old since it was recently demonstrated to be effective for dating lacustrine feldspars (Roberts et al., 2018). Luminescence dating of feldspar from 10 samples was undertaken for the Orakei core. The fine-grained fraction was targeted in order to maximise the percentage component of non-volcanic, distally sourced dust, which is more likely to yield a reliable luminescence signal. The sediment cores were stored wrapped in light-proof plastic at 4 ∘C until opened and subsampled for luminescence dating under subdued orange light at the University of Auckland (UoA, New Zealand), taking care to only sample the innermost parts of the core for dating. Samples were taken to ensure maximal spread over the > 45 000-year interval of the Orakei sequence, based on a preliminary age model which extrapolates the sedimentation rate between the two oldest tephra layers of known age (Tahuna and Rotoehu).
Luminescence dating sample pre-treatment for polymineral fine grains (4–11 µm) was undertaken at the Max Planck Institute for Chemistry (Mainz, Germany) following published methods (Mauz and Lang, 2004) and involved HCl and H2O2 digestion, sieving, and settling. Additionally, coarse-grained K-feldspar (90–115 µm) was extracted from sample L20 (A0113) by density separation using lithium heterotungstate for comparison with the fine-grained signal. The other samples yielded insufficient coarse-grained material for dating. Samples were loaded using a pipette onto 10–15 1 cm diameter stainless steel discs depending on the amount of material remaining after chemical preparation. Additional details are included in Appendix B.
The equivalent dose (De) was measured using the pIR-IRSL protocol stimulated at 290 ∘C (pIR-IRSL290) to minimise the potential for feldspar signal fading (Buylaert et al., 2012; Thiel et al., 2011, 2014). Measurements were undertaken using an automated Risø TL-DA-20 reader using infrared (IR) LEDs for illumination, with the resulting signal detected by an EMI 0235QA photomultiplier tube with a D410 filter for feldspar (Bøtter-Jensen, 1997; Bøtter-Jensen et al., 1999). Irradiation was provided by a calibrated 90Sr ∕ 90Y beta source (Bøtter-Jensen et al., 2000). An internal alpha contribution of 0.12 was assumed for the samples, in order to account for the lower luminescence efficiency of alpha radiation relative to the beta and gamma components (Rees-Jones, 1995; Rees-Jones and Tite, 1997). A higher stimulation temperature was chosen based on equivocal results of the preheat plateau test which showed substantial inter-aliquot scatter irrespective of measurement temperature (Fig. B1). The accepted aliquots of all samples yielded either normal distributions, which were typically very wide, or skewed distributions indicative of incomplete bleaching. In the first case, equivalent-dose values were calculated using the Central Age Model (CAM) (Galbraith et al., 1999). In the latter, equivalent dose was calculated using the Minimum Age Model (MAM; Olley et al., 2004; Fig. B2). Further details can be found in Appendix B.
Subsamples were collected for dose rate analysis from the same depth in the core as each dating sample. These were dried and homogenised. A weighed part of this sample was ashed at 950 ∘C, and K concentrations were obtained by X-ray fluorescence (XRF) at the University of Waikato, Hamilton (New Zealand; see Appendix B for further details). The other weighed part was treated with HNO3 and hydrofluoric acid (HF) at ANSTO, from which U and Th concentrations were obtained by inductively coupled plasma mass spectrometry (ICP-MS) at the University of Auckland (see Appendix B for further details). The measured activities of the radioactive elements K, Th, and U were converted to dose rates using published factors (Adamiec and Aitken, 1998; Guerin et al., 2011). Dose rate attenuation was estimated using published values (Mejdahl, 1979) and the sediment moisture content. Water content was estimated assuming saturation of the lacustrine sediments, taking into account water loss in the laboratory subsequent to core extraction (Lowick and Preusser, 2009). Substantial uncertainties in water content of 20 % ± 10 % were included in order to mitigate potential inaccuracies in the dose rate calculations due to desiccation. Cosmic-ray dose rates were calculated based on sediment density estimates, altitude, latitude, longitude, and depth, following Prescott and Hutton (1994). Cosmic-ray dose rate values were negligible (< 0.01 Gy kyr−1) due to the depths of the samples within the lake sediments.
3.4 Palaeomagnetism
Synchronous changes observed in multiple proxies allow the transfer of chronological information from one record to another. For example, correlation of changes preserved in polar ice cores and sediment archives can be made on the basis of fluctuations in geomagnetic field intensity (reconstructed from palaeomagnetic measurements such as the ratio of natural to anhysteretic remanent magnetisation (relative palaeo-intensity); Stockhecke et al., 2014). Palaeomagnetic measurements down-core can also be used to identify magnetic excursions of known age, for integration into an absolute-age model.
Sediments below ∼ 40 m depth (representing ages > ca. 36 000 years) were used for palaeomagnetic measurements. The upper (younger) interval of the Orakei sequence was not used for palaeomagnetism as it can be reliably dated with radiocarbon, and we note that the presence of numerous basaltic tephra layers can obscure a reliable palaeomagnetic signal (Nilsson et al., 2011). This is a problem especially around the age of the Mono Lake excursion, which correlates with a flare-up of the basaltic volcanoes of the AVF around 30 000 cal years BP (Molloy et al., 2009). Measurements of the natural remanent magnetisation (NRM), anhysteretic remanent magnetisation (ARM), and saturation isothermal remanent magnetisation (SIRM) were conducted using a 2G Enterprises model 760-R SQUID magnetometer equipped with an automatic three-axis alternating field (AF) demagnetisation system at Lund University (Sweden). Oriented standard (volume = 7 cm3) plastic palaeomagnetic sampling cubes were used, with 48 samples treated as pilot samples and progressively demagnetised in 5 mT increments from 0 to 40 mT, and in 10 mT increments up to a maximum AF of 80 mT. The remaining samples were demagnetised in increments of 5 up to 30 mT, and in increments of 20 mT from 40 mT to a maximum AF field of 80 mT. Preliminary analyses on the pilot samples indicated that a stable single-component magnetisation, demagnetising towards the origin, could usually be isolated between 15 and 80 mT (see Appendix C). This interval was therefore used to isolate the characteristic remanent magnetisation (ChRM) using principal component analysis (Kirschvink, 1980). Samples with maximum angular deviation (MAD) > 15, mostly associated with weak NRMs, were rejected.
ARMs were induced in a peak AF of 80 mT with a DC bias field of 0.05 mT. The ARMs were measured and AF demagnetised in increments of 5 mT from 0 to 30 mT, and in increments of 20 mT from 40 to 80 mT in the pilot samples and in increments of 10 mT from 20 to 40 mT in all remaining samples. SIRMs were induced with a DC field of 1 T using a Redcliffe 700 BSM pulse magnetiser. Volume-specific magnetic susceptibility (κ) was measured using an AGICO MFK1-FA Kappabridge.
RPIs were estimated by normalising the NRM20 mT with the magnetic-concentration-dependent ARM20 mT. There remains a possibility for some minor RPI variations induced by changes in lithology and indirectly by magnetic grain size and concentration, which we attempt to correct with a facies-dependent correction factor in coarser sediments (see details in Sect. 4.4).
3.5 Beryllium-10
With regard to terrestrial sediment archives, 10Be-inferred dating is a relatively recent approach with utility for chronology development for sediment records beyond ca. 50 000 years (limit of radiocarbon dating). Though the radioactive decay of 10Be has been used to date sediment much older than the Orakei sequence (e.g. Frank et al., 2008; Simon et al., 2020a), no study has been published yet applying 10Be variations in sediment cores as a relative dating tool by comparison to RPI reference data beyond the Laschamp excursion (Nilsson et al., 2011). Meteoric cosmogenic 10Be is produced in the atmosphere via nuclear reactions of cosmic-ray particles with nuclei such as nitrogen and oxygen. 10Be readily attaches to aerosols and dust and, with a short residence time of ∼ 1 year, is deposited on the Earth surface mainly via precipitation (Willenbring and von Blanckenburg, 2010). In open depositional environments (i.e. deep-sea and polar-ice cores), variability in (normalised) 10Be concentrations can be used as a proxy of past geomagnetic field variation (e.g. Frank et al., 1997; Muscheler et al., 2005). In terrestrial settings, such as lakes, catchment processes and lithology (i.e. erosion, soil geochemistry, aeolian input, grain size) complicate 10Be provenance, delivery, and accumulation and hence the identification of a 10Be production signal (e.g. Czymzik et al., 2015; Nilsson et al., 2011). To overcome such complexity, one approach is to normalise 10Be measurements to an element or isotope with similar geochemical properties, such as 9Be, where it has been demonstrated that the authigenic 10Be ∕ 9Be ratio can compensate for effects of catchment processes and grain size variations (e.g. Bourles et al., 1989; Wittmann et al., 2012). Although the Orakei catchment is small, grain size and lithology variability throughout the core is problematic due to in-wash events of clastic grains. In this study, we extract both authigenic 10Be and 9Be to compensate for the effect of grain size and possible variation in catchment processes. Meteoric 10Be and authigenic 9Be were measured in order to detect variations in cosmogenic nuclide production rates to supplement palaeomagnetic measurements (Sect. 3.4).
Laminated sediment intervals below ∼ 40 m depth were targeted for cosmogenic 10Be measurements with a focus on the lower half of the sequence.
Fifty-nine samples were processed for AMS measurements at ANSTO. Sample preparation (detailed in Appendix D) followed White et al. (2019) and involved 1 cm thick core slices (representing ca. 25-year duration; average sedimentation accumulation rate (SAR) of 0.04 cm yr−1), from which 0.5 to 1 g of dried, homogenised sediment was treated with 6 M HCl for 2 h to leach out the authigenic 10Be and 9Be. A subsample of each leachate was extracted to measure 9Be concentration (White et al., 2019) using an Agilent 7700 ICP-MS at the Mass Spectrometry Equipment Centre (UoA, New Zealand). 9Be spike, derived from 10Be-free beryl mineral, was added to the remainder of the leachate prior to treatment with HF and HClO4 to remove silicon and boron complexes. Beryllium was separated from other cations by passage through anion and cation exchange columns, converted to Be(OH)2, oxidised to BeO at 800 ∘C, and finally mixed with Nb powder. AMS 10Be ∕ 9Be measurements of these 59 samples were performed at the Centre for Accelerator Science, ANSTO (Australia), on the 6 MV SIRIUS accelerator (Wilcken et al., 2019). The measured 10Be ∕ 9Be values were normalised to either the 2007-KN5-2 (nominal ratio of ) or the 2007-KN5-3 () standard (Nishiizumi et al., 2007). Full-chemistry procedural blank 10Be ∕ 9Be ratios range from 1.1 to and are 1 % of the measured sample ratios.
Ten additional samples were prepared at Lund University to increase the 10Be resolution during the Laschamp excursion. Each sample consists of a 10 cm interval, representing ca. 250-year duration (SAR = ∼ 0.04 cm yr−1). Samples were weighed; homogenised; spiked with 9Be; and leached with H2O2, HCl, and HNO3. Separation and precipitation of Be(OH)2 was achieved by treatment with ammonia solution and NaOH for pH adjustment and followed by oxidation to BeO at 600 ∘C (see details in Appendix D). AMS 10Be ∕ 9Be measurements of these 10 samples were performed at ETH (Eidgenössische Technische Hochschule) Zurich. Authigenic 9Be was not analysed for these 10 samples and was considered negligible compared to the 9Be spike mass following measurements at UoA and ANSTO (see above). The measured 10Be ∕ 9Be ratios were normalised to the ETH Zurich in-house standard material S2007N, which has a nominal 10Be ∕ 9Be ratio of (Christl et al., 2013) and is consistent with the 2007-KN 10Be ∕ 9Be standards used at ANSTO. All measured 10Be concentrations were several orders of magnitude higher than the background of full-chemistry procedural blanks, so that blank corrections were negligible.
3.6 Correlation of magnetic relative palaeo-intensity for relative dating
We applied relative dating using magnetic RPI to sediments older than ca. 45 000 years to supplement the absolute age information provided by luminescence (pIR-IRSL) dating (see Sect. 4.3). It is crucial to avoid circularity in tuning climate proxies based on assumed synchroneity when the presence or absence of this possible synchroneity is actually an overarching study objective (Blaauw, 2012). Hence, we make use of the relative intensity of the Earth's magnetic field (RPI), which is considered to be a globally synchronous signal over millennial timescales (e.g. Channell et al., 2000; Laj et al., 2004). This approach was successful in Lake Van (Turkey), where several RPI minima were aligned to provide a chronologic framework (Hatfield et al., 2020; Stockhecke et al., 2014).
We use a dynamic programming algorithm to align the Orakei RPI with the virtual axial dipole moment (VADM) reference curve from the marine PISO-1500 stack (Channell et al., 2009). Dynamic time warping (DTW) aligns time series datasets through generalised dynamic programming (Hay et al., 2019) and has been adapted for palaeomagnetic vector data by Hagen et al. (2020). The DTW algorithm calculates every possible match between the reference and query time series at every stratum (data point), producing a cost matrix. This cost matrix quantifies the Euclidean distance between each point in the query time series and each point in the reference time series. Under step-pattern constraints, an optimal alignment path is then found through the cost matrix which represents the optimal alignment path between both time series (Hagen et al., 2020). The step pattern only allows two directions in the path. This prevents the creation of age inversions and heavily penalises alignments between points with very different indices, so that major jumps and/or hiatuses are very unlikely. The DTW approach relies on (mostly) complete time series with a substantial component that overlaps between the reference and query time series (Hay et al., 2019).
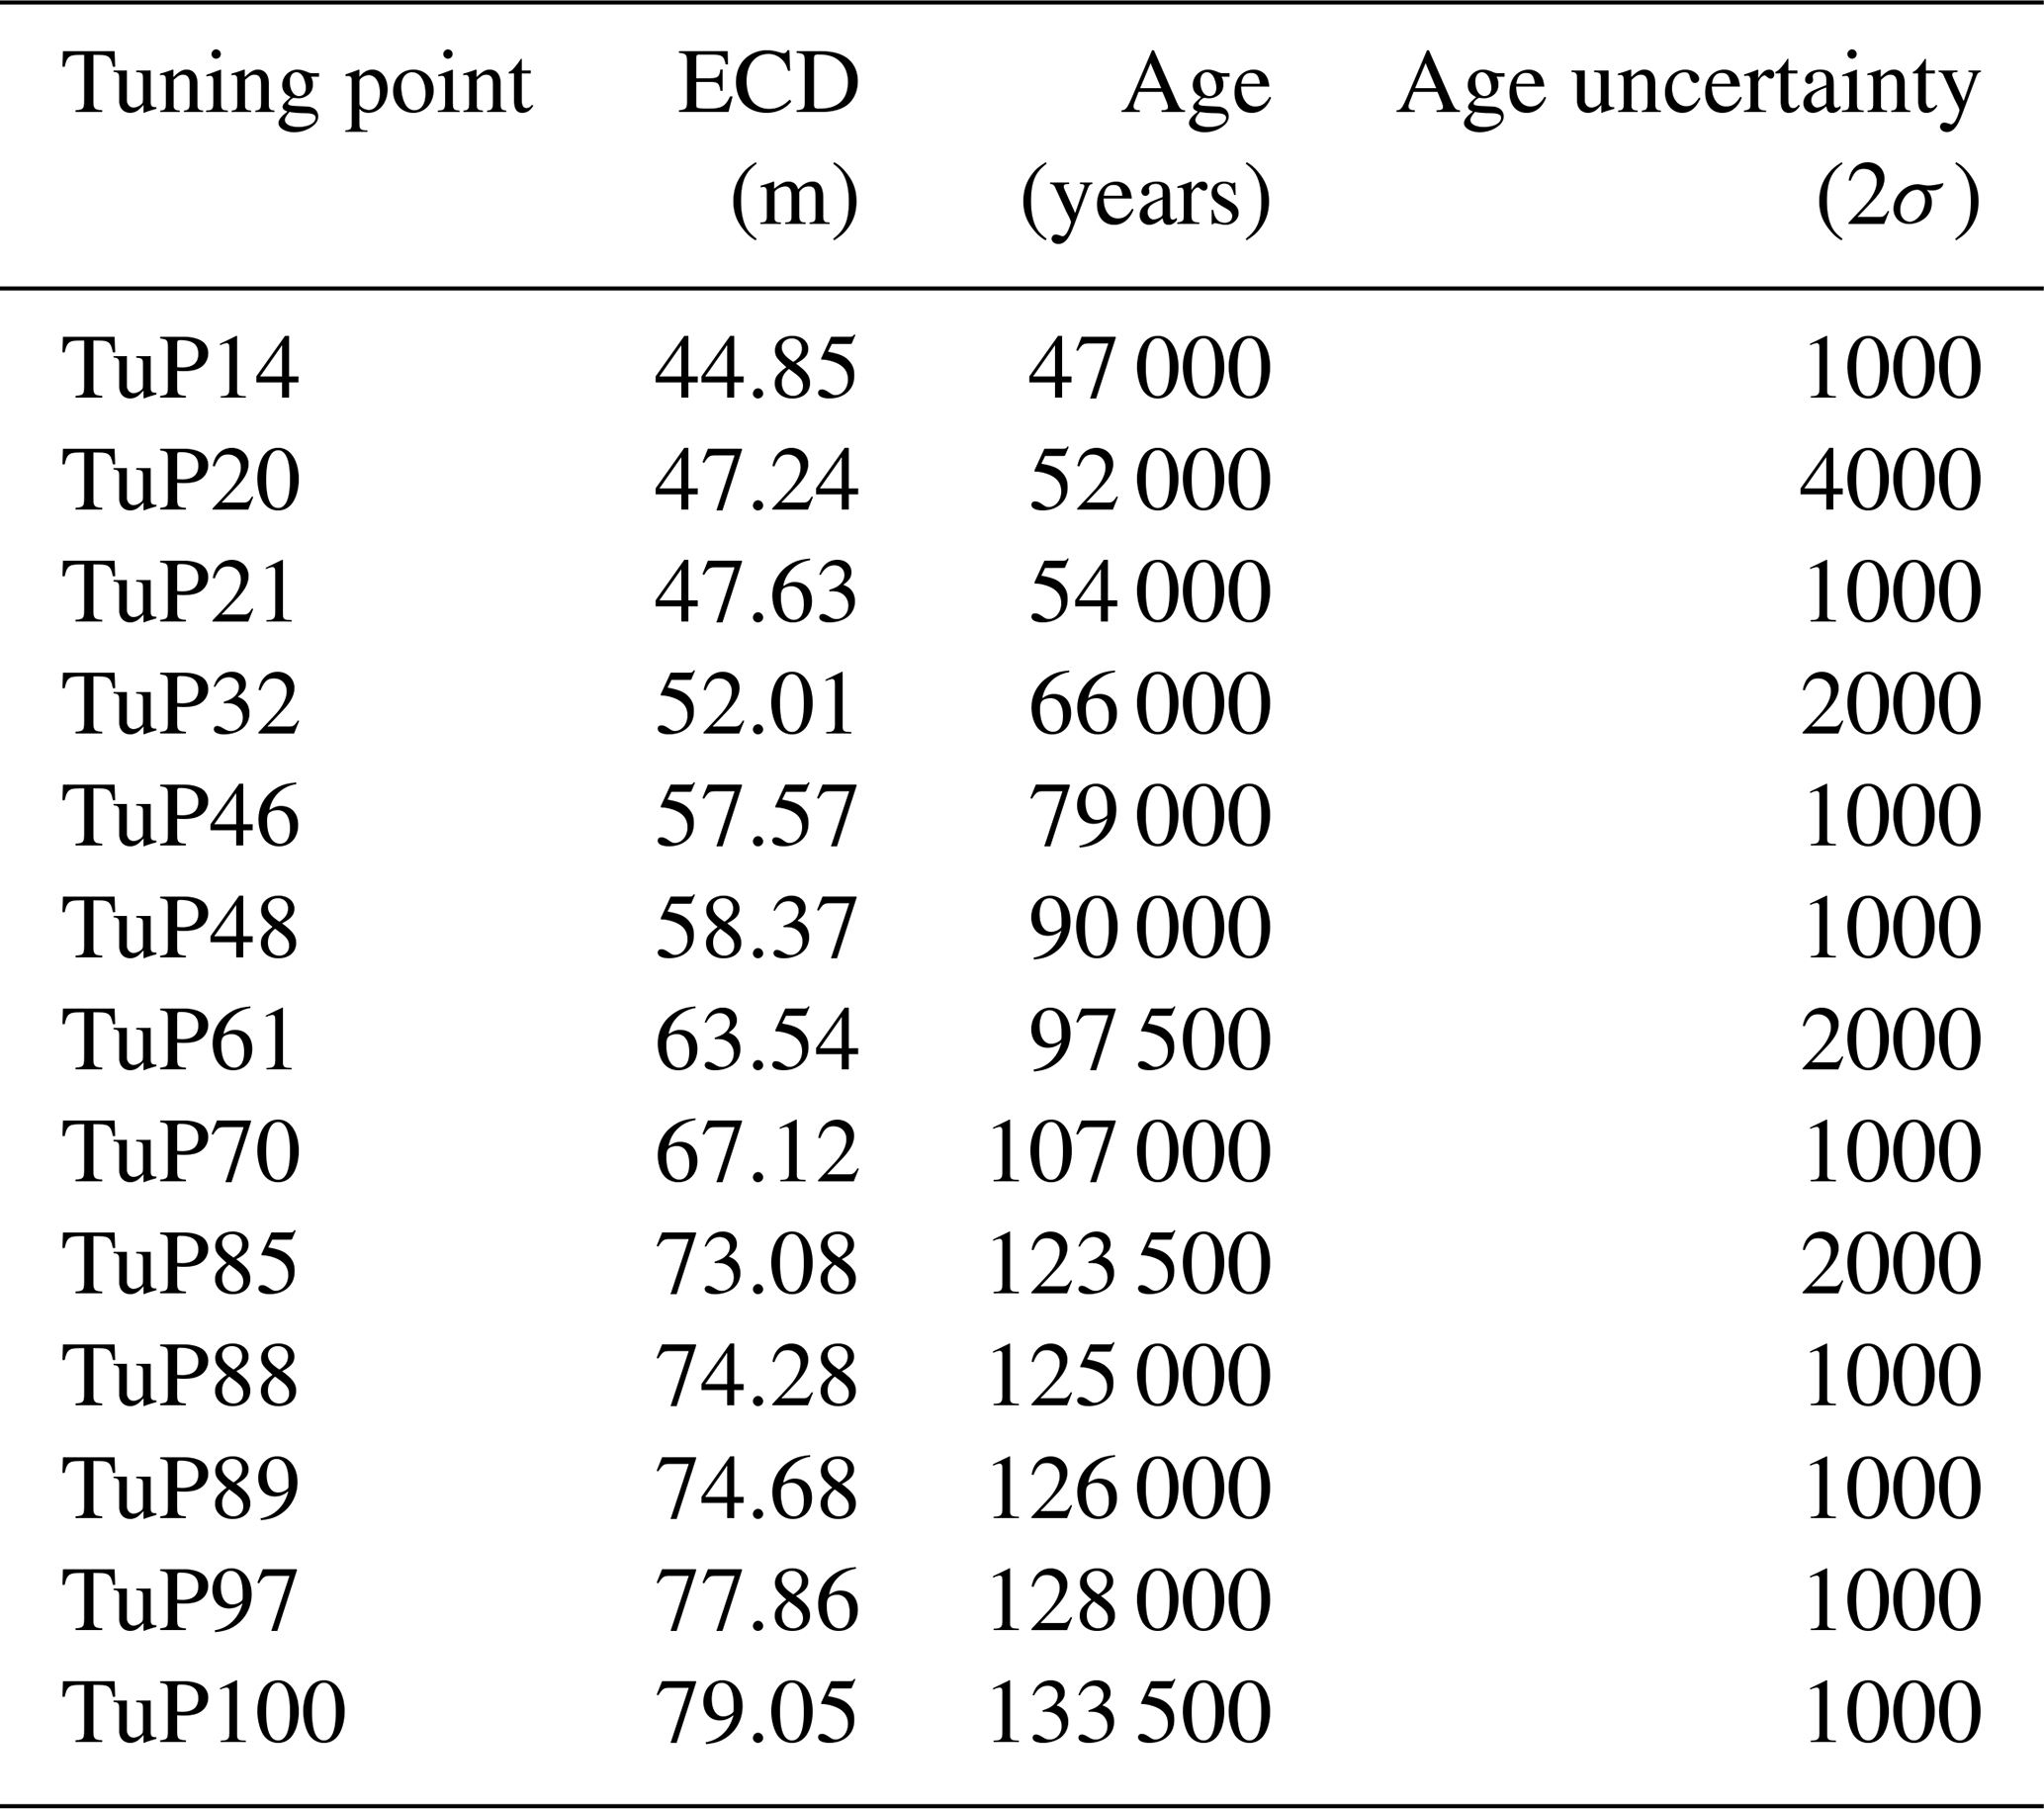
Visual inspection of the Orakei RPI and the variation of the PISO-1500 VADM (Channell et al., 2009) over the period of ca. 30 000–140 000 cal years BP suggests strong similarities between both curves (see Sect. 4.6). These similarities facilitate an improvement of the absolute-age model by tuning the Orakei RPI to the PISO chronology. The PISO-1500 stack has a temporal resolution of one data point per 1000 years. To reach a similar resolution in both time series, the Orakei RPI was interpolated to match the resolution of the PISO-1500 stack and at the same time to smooth possibly unreliable features in the Orakei RPI record. Records were scaled by subtracting the mean of the time series and dividing by its standard deviation. DTW was then performed in R (package dtw; Giorgino, 2009) with closed start and open end points on the two time series, and using a Euclidean distance-based cost matrix and symmetric step pattern. We integrated 13 tuning points from the resulting alignment path into a Bacon age model. We selected 12 random tuning points supplemented by the basal tuning point. We chose to select these tuning points randomly (apart from the basal point) in order to prevent any bias that involved selecting points to arrive at a favoured solution. The depth and age values of these 13 tuning points were incorporated into the Bacon age modelling process (see Sect. 3.7). The standard deviation for these tuning points reflects the match between the RPI and PISO so that a point matched to several ages has a larger standard deviation spanning the entire range of matched ages.
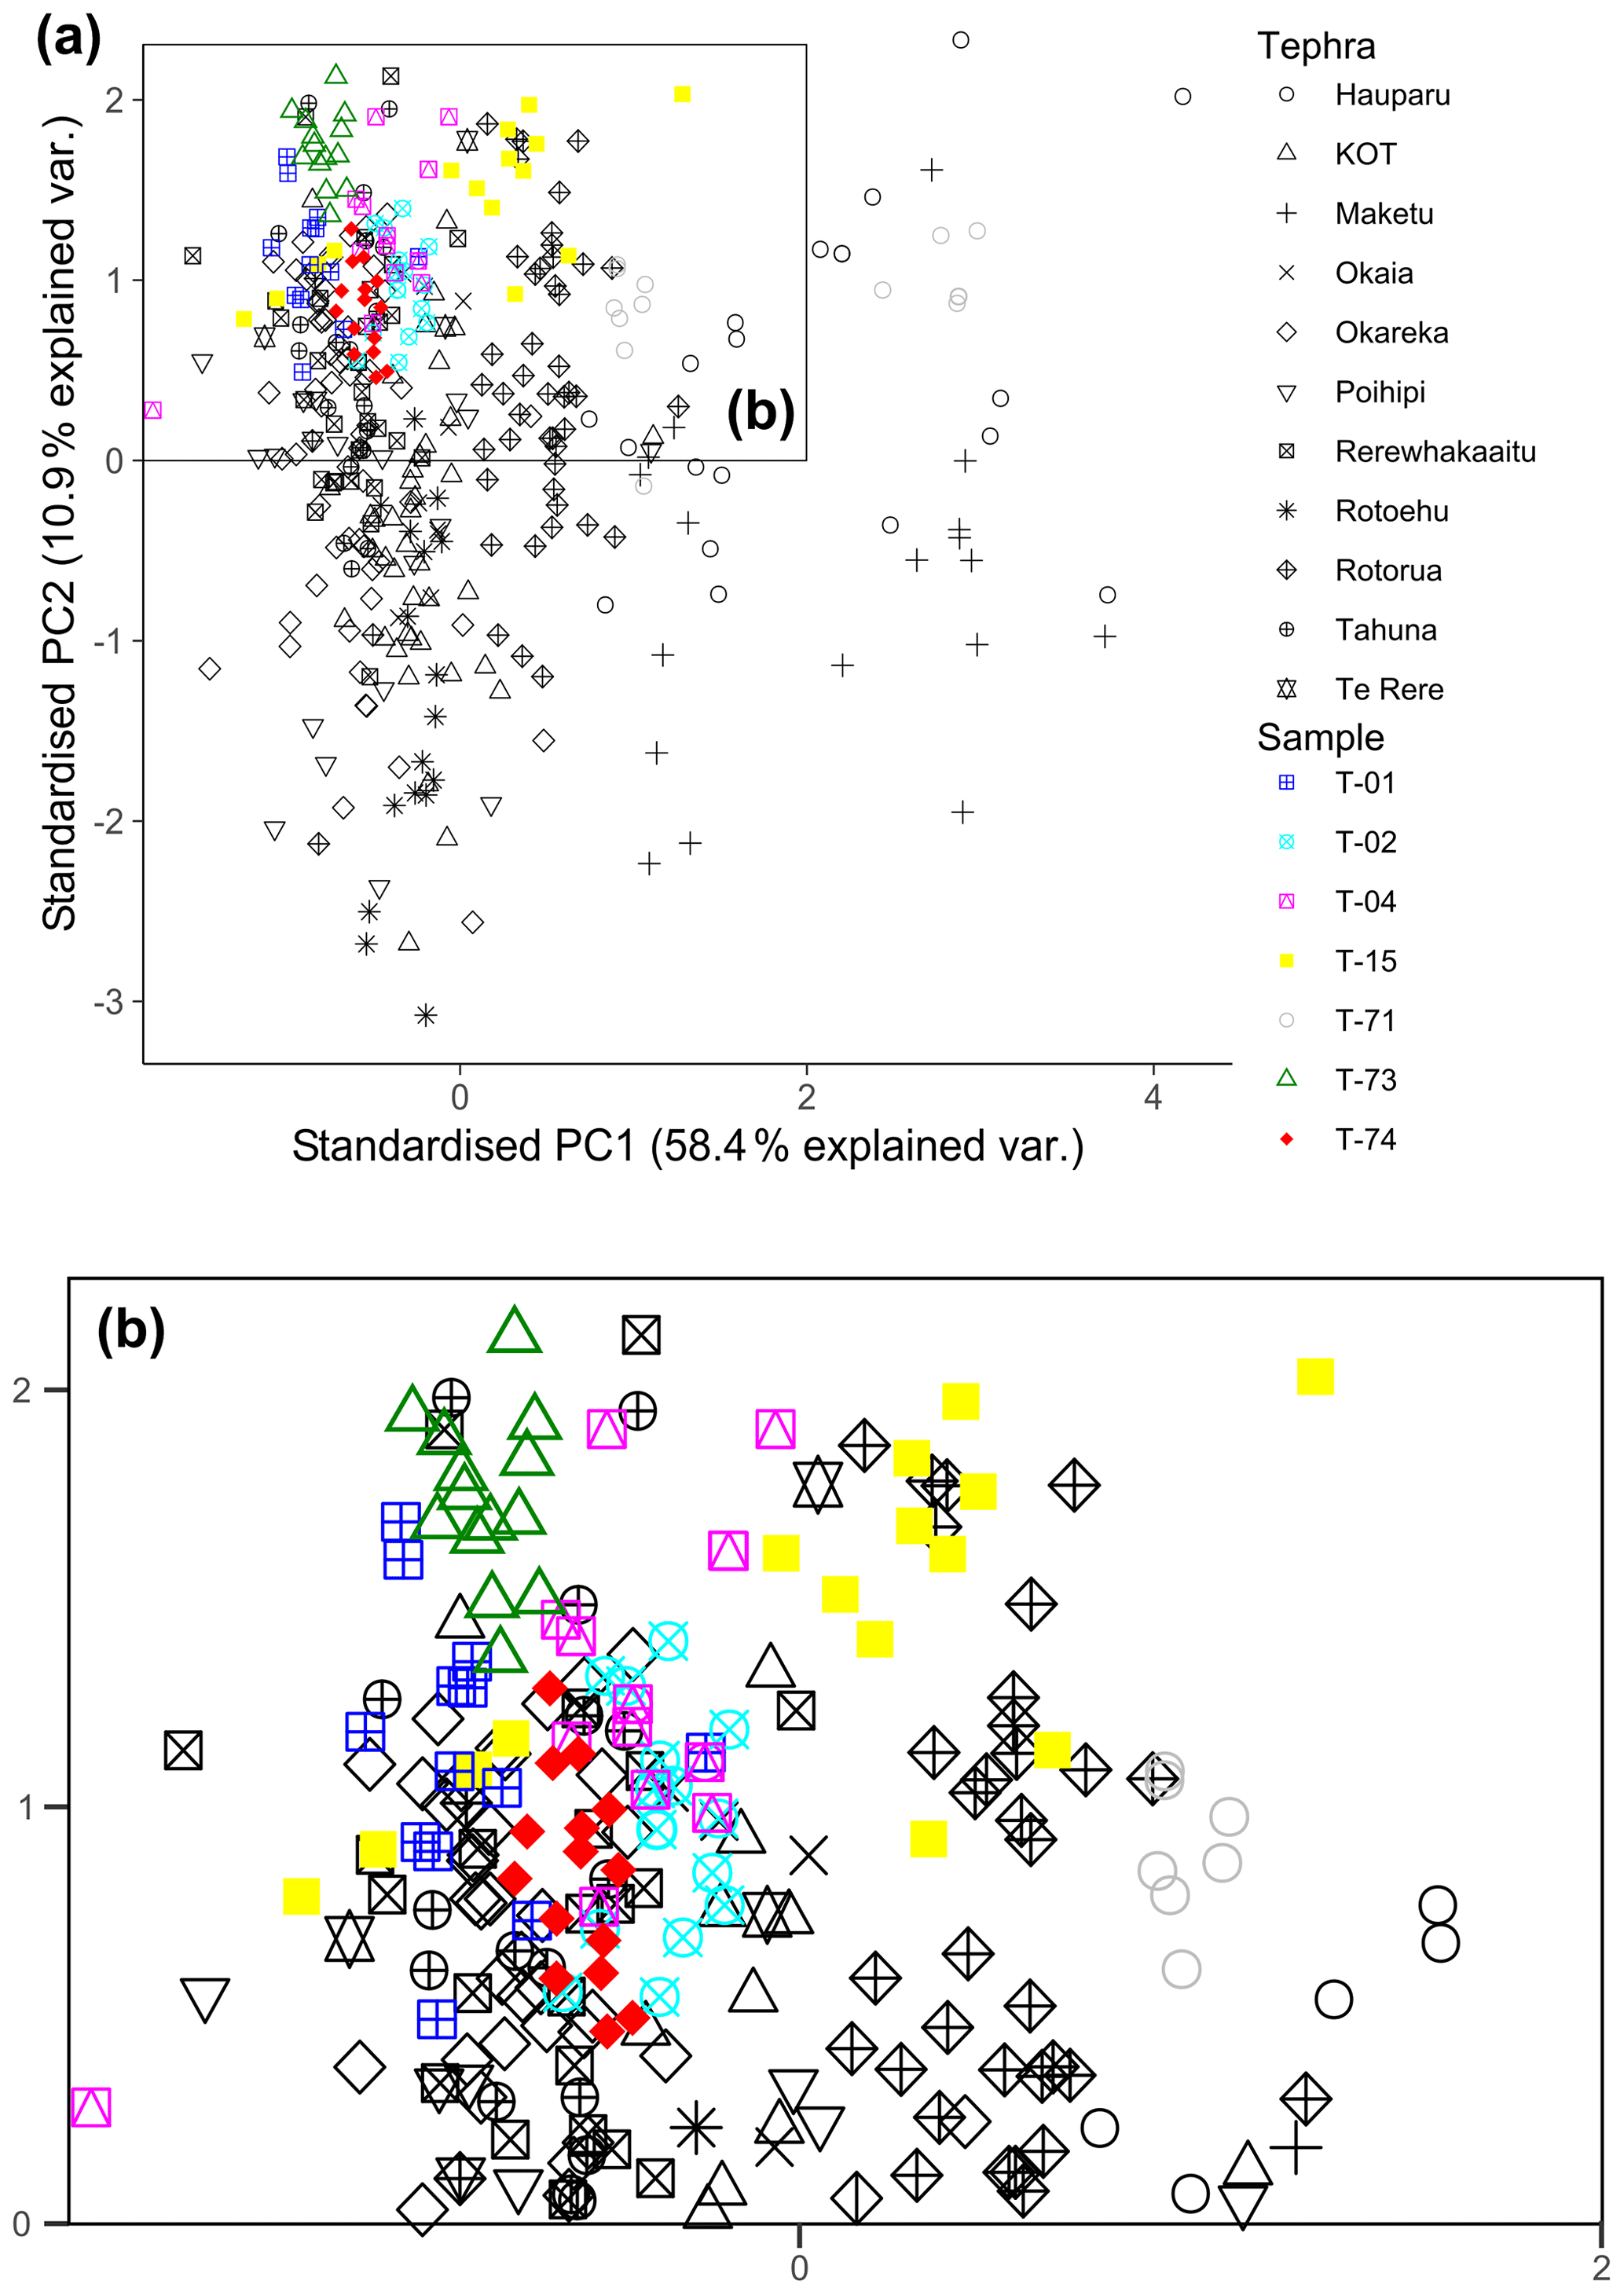
Figure 3(a) PCA individuals of reference tephra EMPA data (in black symbols from Lowe et al., 2013; Molloy et al., 2009) and Orakei samples (in coloured symbols). (b) Enlarged inset from (a). Symbols and references as in (a).
Table 2Identified rhyolitic tephra layers in the Orakei sediment sequence. For source locations see Fig. 1.
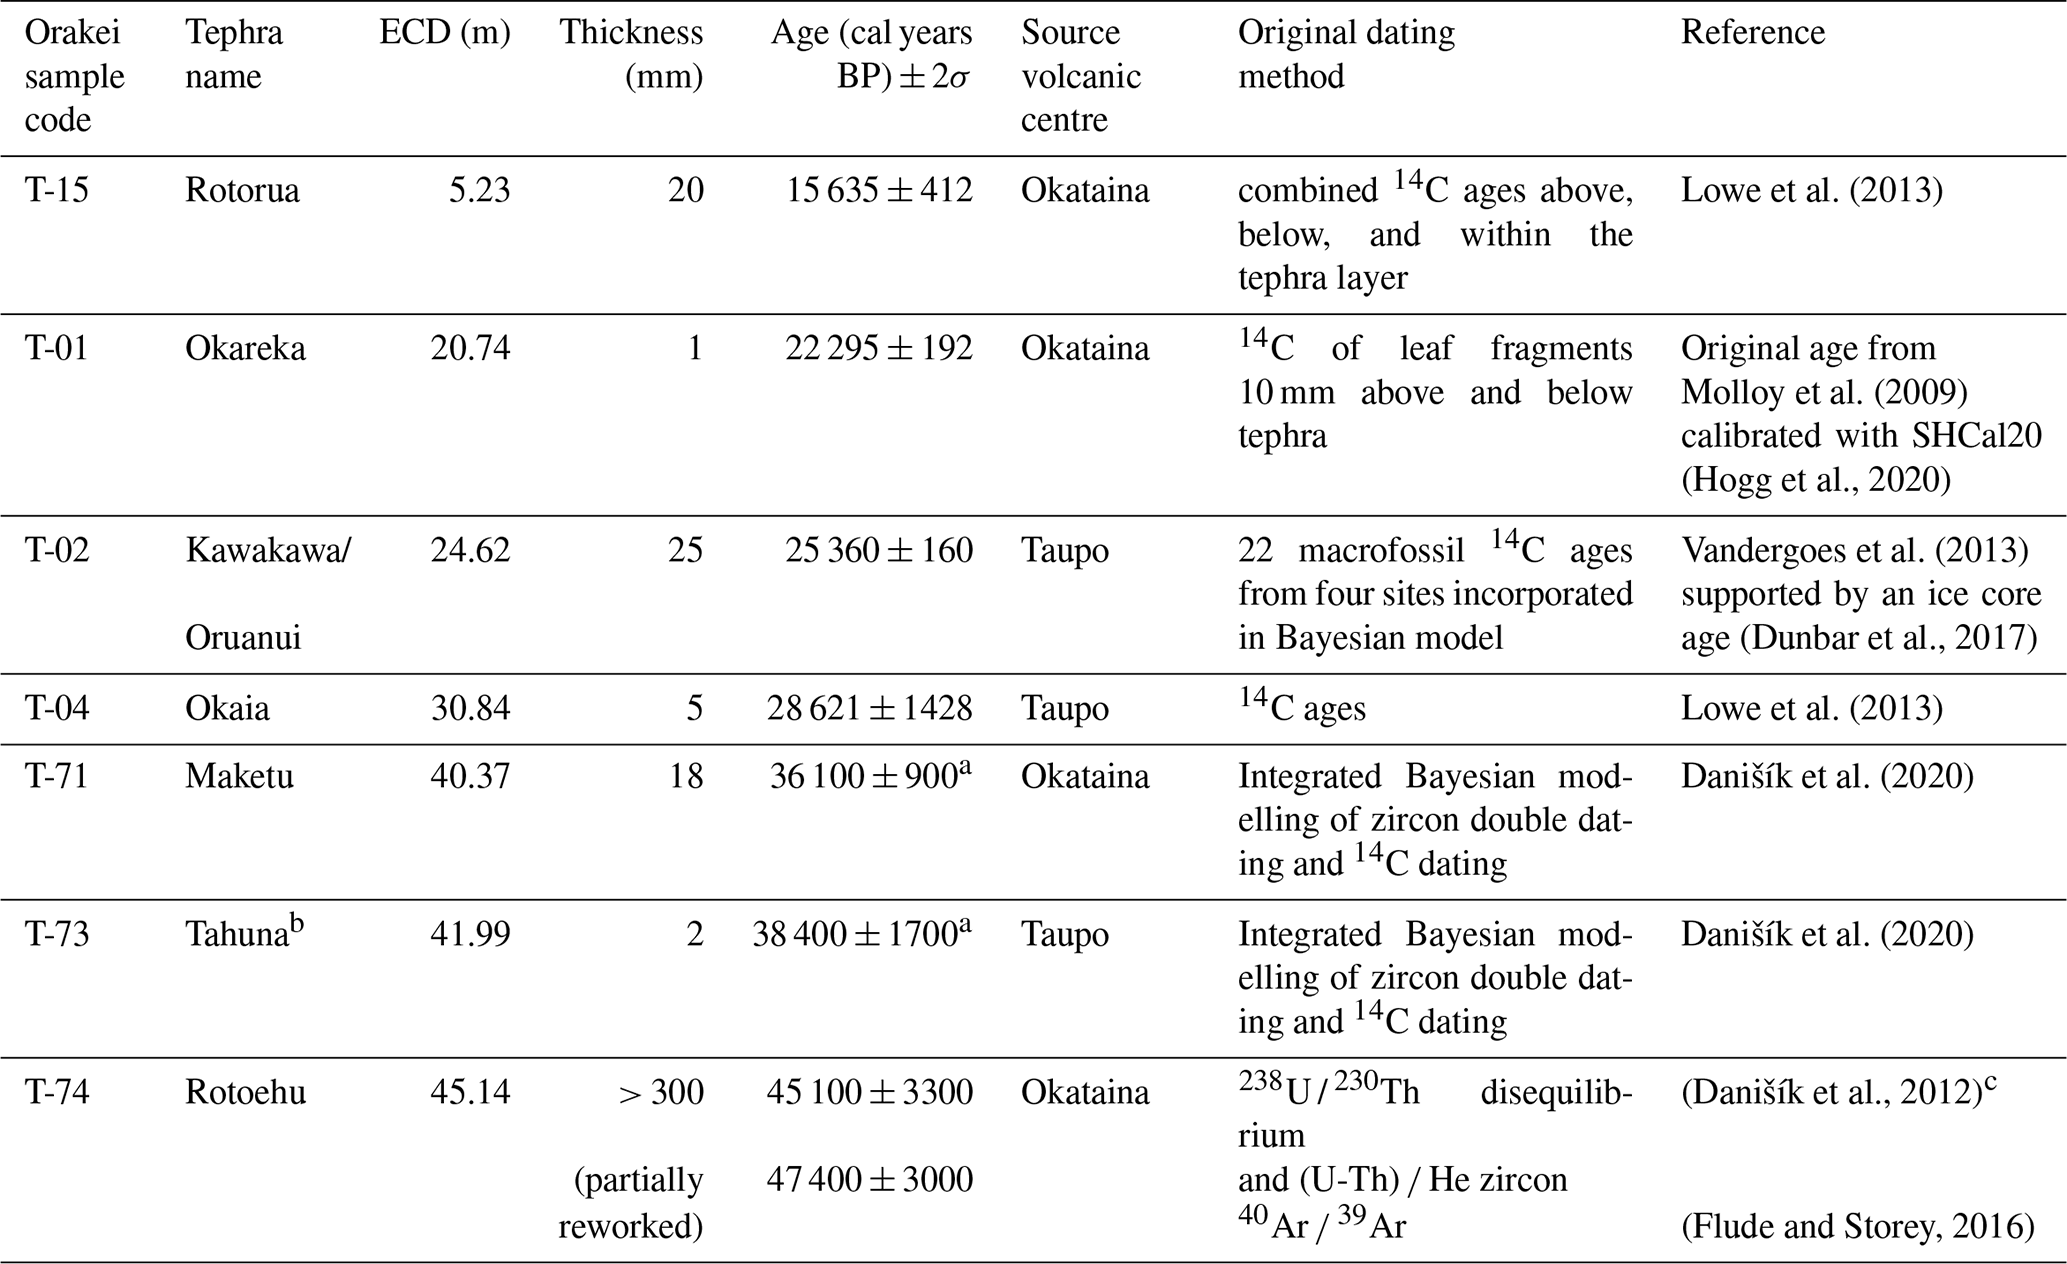
a Note that Danišík et al. (2020) calculated
non-symmetrical errors of +900–800 cal years BP (Maketu) and +1700–1400 cal years BP (Tahuna) but that Bacon does not accommodate non-symmetrical
errors by default, so that we use the larger term of each error respectively
in the positive and negative directions.
b We note that Loame et al. (2019)
dated the Tahuna layer to 38 870 ± 1106 (2σ) cal years BP.
However, we prefer the more recent age constrained by several samples and
two techniques (Danišík et al., 2020) but note
their strong agreement.
c Many ages for the Rotoehu tephra (Rotoiti eruption) have been proposed
based on a variety of direct and indirect dating methods spanning
approximately the age range 40–60 kyr. The combined 238U ∕ 230Th
disequilibrium and (U-Th) ∕ He zircon age of 45 100 ± 3300 (2σ) years, concordant with radiocarbon ages (Danišík
et al., 2012), is in better agreement with the radiocarbon ages of this study
(see Table 3) and thus used in the presented chronology.
3.7 Bacon age model development
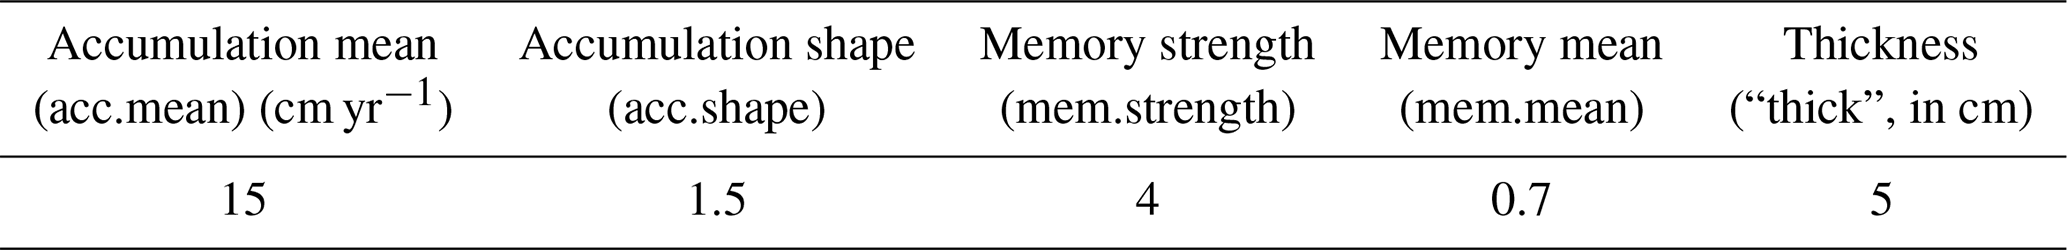
The final age–depth model for the entire Orakei sediment sequence was produced using the Bacon package (Bayesian accumulation model), using rbacon 2.4.3 (Blaauw and Christen, 2011, 2020) with a prior accumulation rate of 15 yr cm−1 (assumed from a maximum core age of ca. 130 000 years and a core length of 8000 cm, i.e. ∼ 16.25 yr cm−1). Prior accumulation shape, memory strength, and memory mean were suggested by the Bacon package following Blaauw and Christen (2011) based on the age data provided (see Table 1). The age–depth model is further constrained by the provided rhyolitic tephra, radiocarbon, and luminescence ages from the core (Tables 2–4 respectively); the 234U∕230Th age of the Laschamp excursion as identified by palaeomagnetic direction and intensity using the age of 41 100 ± 350 (2σ) years BP from Lascu et al. (2016); the 40Ar∕39Ar age of the locally sourced basaltic Mt Albert eruption (119 200 ± 5600 (2σ) years; Leonard et al., 2017); and the dated tuning points obtained from matching the Orakei RPI to the PISO-1500 global stack (see Sect. 3.6, Table 5). Reservoir correction and calibration of radiocarbon ages using the Southern Hemisphere calibration curve SHCal20 (Hogg et al., 2020) were done by Bacon as part of the age modelling procedure (Blaauw and Christen, 2020). A Student's t distribution, essentially a symmetric distribution with longer tails than a typical Gaussian distribution, was used for the radiocarbon ages since it is more robust against outliers (Blaauw, 2010; Blaauw and Christen, 2011; Christen and Pérez E, 2009). Gaussian distributions were assumed for tephra and pIR-IRSL ages, the Laschamp excursion age, and tuning point ages.
Table 3Overview of radiocarbon samples and ages. Reservoir-corrected ages in italics. Outliers in grey. All are calibrated by SHCal20 (Hogg et al., 2020).

a From correlated Orakei 2007 core. b From Hayward et al. (2008). c Reservoir effect assumed from stratigraphically closest facies unit with calculated reservoir effect (see Sect. 4.2).
4.1 Tephrochronology
4.1.1 Rhyolitic tephra layers
The identification of the rhyolitic tephra layers follows Peti et al. (2019) with the addition of the Rotorua tephra and is demonstrated in Fig. 3 using multivariate statistics. PCA was first performed on published tephra EMPA data (black and grey symbols in Fig. 3), which serve as reference tephra in this study. The same scaling and rotation of the reference PCA were then applied to the unknown compositional data, and the tephra layers were thus assigned to their source eruptive events through multivariate similarity (Fig. 3). The identification of tephra layers, and the correlation to their eruption events, is supported by the geochemical composition of the glass shards and stratigraphic position in relation to the AVF framework (Hopkins et al., 2015; Molloy et al., 2009). The resulting identifications then allowed the direct transfer of published ages (or adjusted ages in this study) onto the Orakei sediment sequence.
Tephra sample T-74 could not be clearly identified solely from its major oxide geochemistry (Figs. 3, A1), since many layers show similar geochemical composition. However, its stratigraphic position and substantial thickness (> 30 cm) suggest that this layer is the Rotoehu tephra. Tephra sample T-73 displays the same geochemistry as the Tahuna tephra, an interpretation supported by its stratigraphic position (Figs. 3, A1). Tephra sample T-71 can confidently be assigned to the eruption pair of Hauparu and Maketu (both from Okataina volcanic centre), which occurred within 300 years of each other (Molloy et al., 2009) and show similar major oxide compositions (Fig. 3). Given the similarity between Hauparu and Maketu reference major oxide data (Fig. 3), we cannot confirm from the tephra geochemistry whether T-71 represents the Maketu or Hauparu eruption. Since only one layer has been found, we assign sample T-71 to Maketu given that this was the larger eruption with more widespread and voluminous ashfall (estimated to be 15 km3 for Maketu compared to 10 km3 for Hauparu by Froggatt and Lowe, 1990). From a chronological perspective, this uncertainty in identification is irrelevant, since the two tephra are essentially the same age (Hauparu dates to 36 000 ± 1000–2000 years and Maketu to 36 300 ± 1000–2000 years; ages and generic error ranges of 1000 to 2000 years for rhyolitic tephra older than 21 000 years from Molloy et al., 2009).
The geochemical compositions of tephra T-02 (25 mm thick) and T-04 (5 mm thick) are very similar (Figs. 3, A1). They are positioned between the Okareka and Maketu tephras (above T-02 and below T-04). Stratigraphically feasible candidates include the Te Rere tephra, Kawakawa/Oruanui tephra (KOT), Poihipi tephra, and Okaia tephra (Lowe et al., 2013). Te Rere and Poihipi can be rejected, since neither T-02 nor T-04 shows geochemical overlap with reference data for the products of these two eruptions (Figs. 3, A1). Stratigraphic ordering suggests that T-02 may be the younger KOT, whilst T-04 may correlate to the older Okaia tephra. However, a similar depth in the stratigraphic framework developed for the Orakei sequence (Peti and Augustinus, 2019), and the position of T-04 between several basaltic AVF tephra layers (Peti et al., 2019) suggests an identification of sample T-04 as the KOT as identified by Molloy et al. (2009). This would imply a previously unknown eruption as the source of the thicker T-02 layer (25 mm thick), which is unlikely given the well-studied eruptive history of the Taupo Volcanic Zone (e.g. Lowe et al., 2013). Layer T-02 is well preserved, fining upwards, and shows no signs of reworking (Peti et al., 2019). Its thickness supports identification as KOT, since the Kawakawa/Oruanui eruption was much larger than Okaia (Froggatt and Lowe, 1990), and thus a thicker deposit would be expected in the sediment sequence. Most importantly, the glass shards of both samples show very different morphology in backscatter images (Fig. A2). Shards in T-02 are very large, cuspate, and bubbly with preserved thin bubble walls signifying a very large, explosive eruption. On the other hand, small blocky shards in T-04 suggest a smaller, less explosive eruption (Heiken, 1972; Liu et al., 2015). This observation links sample T-02 to the Kawakawa/Oruanui super-eruption and, out of stratigraphic necessity, T-04 to the smaller Okaia eruption. It follows that Molloy et al. (2009) may have mis-correlated the apparent KOT in light of very similar geochemical compositions between sample and reference data and, following the same assumption, that the larger eruption should have been more easily preserved over the smaller eruption. The true KOT had been missed in a core break in the 2007 Orakei sequence.
Other known major tephra – including Rerewhakaaitu, Te Rere, and Poihipi – were not observed as macroscopic event layers within the Orakei sediment sequence in this study, although they may be present as cryptotephra. Samples T-01 and T-15 can be clearly identified as the Okareka and Rotorua tephras based on geochemistry (Fig. 3) and stratigraphic position.
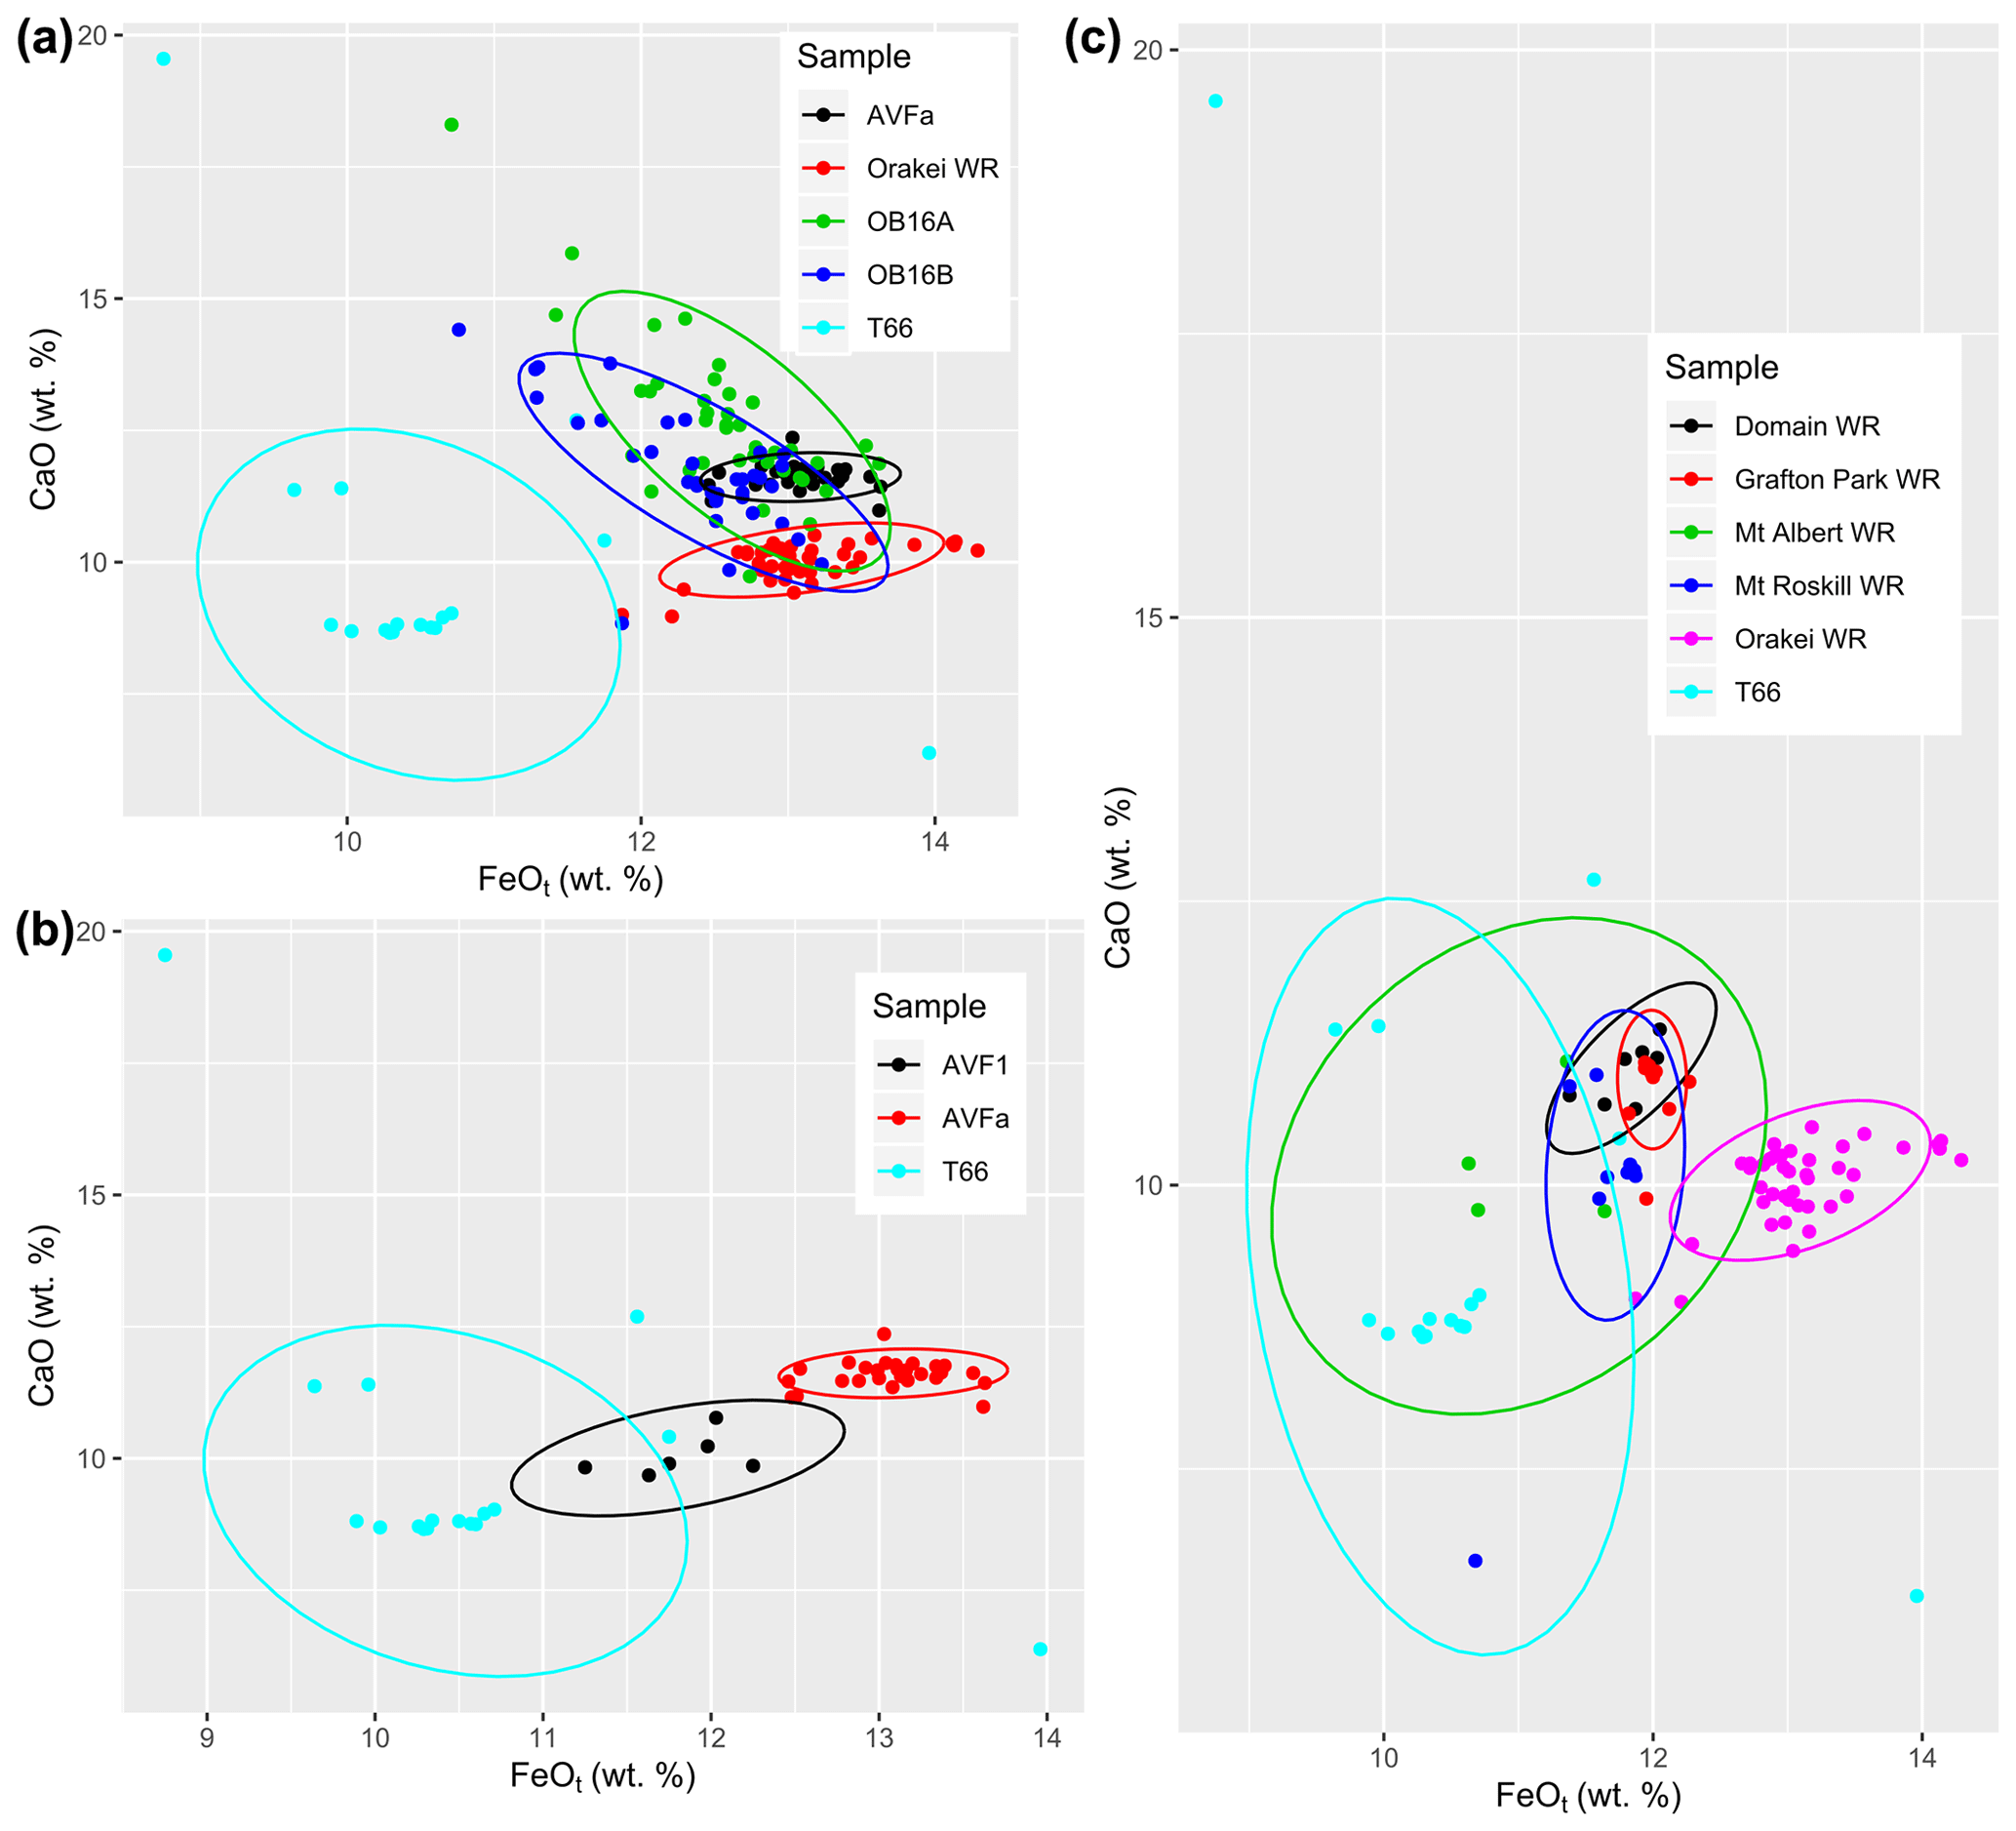
Figure 4FeOt vs. CaO of sample T66 in comparison to tephra and whole-rock (WR) data from the Orakei eruption (a), in comparison with tephra data of the AVF1 and AVFa layers (b), and in comparison with WR data from potential AVF source centres for layer T66 (c) pointing to Mt Albert as the source for this tephra sample. Detailed figures with further major element oxides and extended explanations can be found in Figs. A4–A6.
4.1.2 Basaltic tephra sample T66
An unidentified basaltic tephra layer, sample T66 could not be matched stratigraphically or geochemically to any other AVF tephra layer previously documented in Molloy et al. (2009) or Hopkins et al. (2015, 2017). Its occurrence between the layer AVF1 and the basal eruptive material sourced from the Orakei volcanic centre (Fig. A3) suggests that it is a new, previously undocumented tephra layer from a different AVF source. We confirmed that T66 is not a correlative to the Orakei volcanic centre and/or AVFa tephra layer (Fig. 4a). Furthermore, glass shard geochemistry also obviates correlation to the AVF1 tephra layer (Fig. 4b). We consider T66 to constitute a basaltic tephra that has not so far been encountered in any AVF maar cores (Hopkins et al., 2015, 2017).
Based on the position of T66 between AVF1 (correlated to Domain/Grafton eruption) and AVFa (correlated to Orakei eruption; Hopkins et al., 2017), several AVF volcanoes are potential sources for the T66 tephra (Hopkins et al., 2017; Leonard et al., 2017). Despite the difficulties in comparing whole rock and tephra material based on major element oxides, we compare data from sample T66 to the potential AVF source centres (Fig. 4c): Grafton Park; Mt Albert; Mt Roskill; and the correlatives for AVF1 and AVFa, Domain and Orakei, respectively. Low FeO and SiO2 percentages in Mt Albert whole-rock composition as well as in sample T66 strongly suggest that Mt Albert is the source of the T66 tephra layer (Fig. 4c). The formative eruption of Mt Albert has been Ar–Ar-dated to 119 200 ± 5600 (2σ) years by Leonard et al. (2017), which falls between the ages obtained for AVFa (126 150 ± 3320 (2σ) years; Hopkins et al., 2017) and AVF1 (106 170 ± 4300 (2σ) years: Hopkins et al., 2017; 83 100 years: Molloy et al., 2009), giving further support for this identification. Hence, we conclude that sample T66 is sourced from Mt Albert with an eruptive age of 119 000 ± 5600 (2σ) years. In order to maintain nomenclature consistency, we assign the name “AVFaa” to this tephra layer.
4.2 Radiocarbon dating
All 54 radiocarbon dates from the Orakei core (53 new and the NZA28865 date previously published in Hayward et al., 2008) are summarised in Table 3.
The Bacon age model recognises 13 ages as outliers (24 %), which is in agreement with visual identifications in comparison to the model. Since the model recognises these outliers, there was no need to remove them manually. The four wood sample ages OZW884–887 and three bulk sediment sample ages OZX869, OZX888, and OZX889 are considered outliers, being much older than bracketing ages and thus the age–depth model. These outliers, all between 12.5 and 16.5 m depth, are interpreted as representing fluvial in-wash containing reworked organic matter and, in the case of bulk sediment ages, carry additional uncertainties from necessary reservoir corrections. The ages for OZX873 and OZX882 are also older than anticipated. This is most likely due to the unknown reservoir correction, since no double dating of these facies units (5–7) was possible due to an absence of plant macrofossils. The ages OZW874, OZX340, OZX343, and OZX878 are too young and probably explained by the first three yielding very small masses of organic carbon, whereas the reason for the latter age is unclear.
The facies-dependent reservoir effect is 1026 ± 117 years in facies 4 and 410 ± 170 years in facies 8. Where the reservoir correction is stated with a question mark in Table 3, no reservoir correction for these specific facies could be calculated. In that case we used the reservoir correction from the stratigraphically closest facies (i.e. reservoir correction from facies 4 also applied to facies 3 and 5, marked with a question mark in Table 3).
4.3 Luminescence dating
Luminescence data were obtained for 6 of the 10 fine-grained samples measured from the Orakei series, and for one coarse-grained sample, L20. Samples L18, L20, and L29 yielded insufficient natural signal for equivalent-dose estimation. These are also the youngest luminescence samples according to depth and therefore had accumulated less charge during burial. The sensitivity of the Orakei samples was low for feldspars and may suggest a primary igneous origin.
Table 4Equivalent dose (De), total dose rate data, and pIR-IRSL290 age estimates for the Orakei 4–11 µm polymineral fine-grained samples.
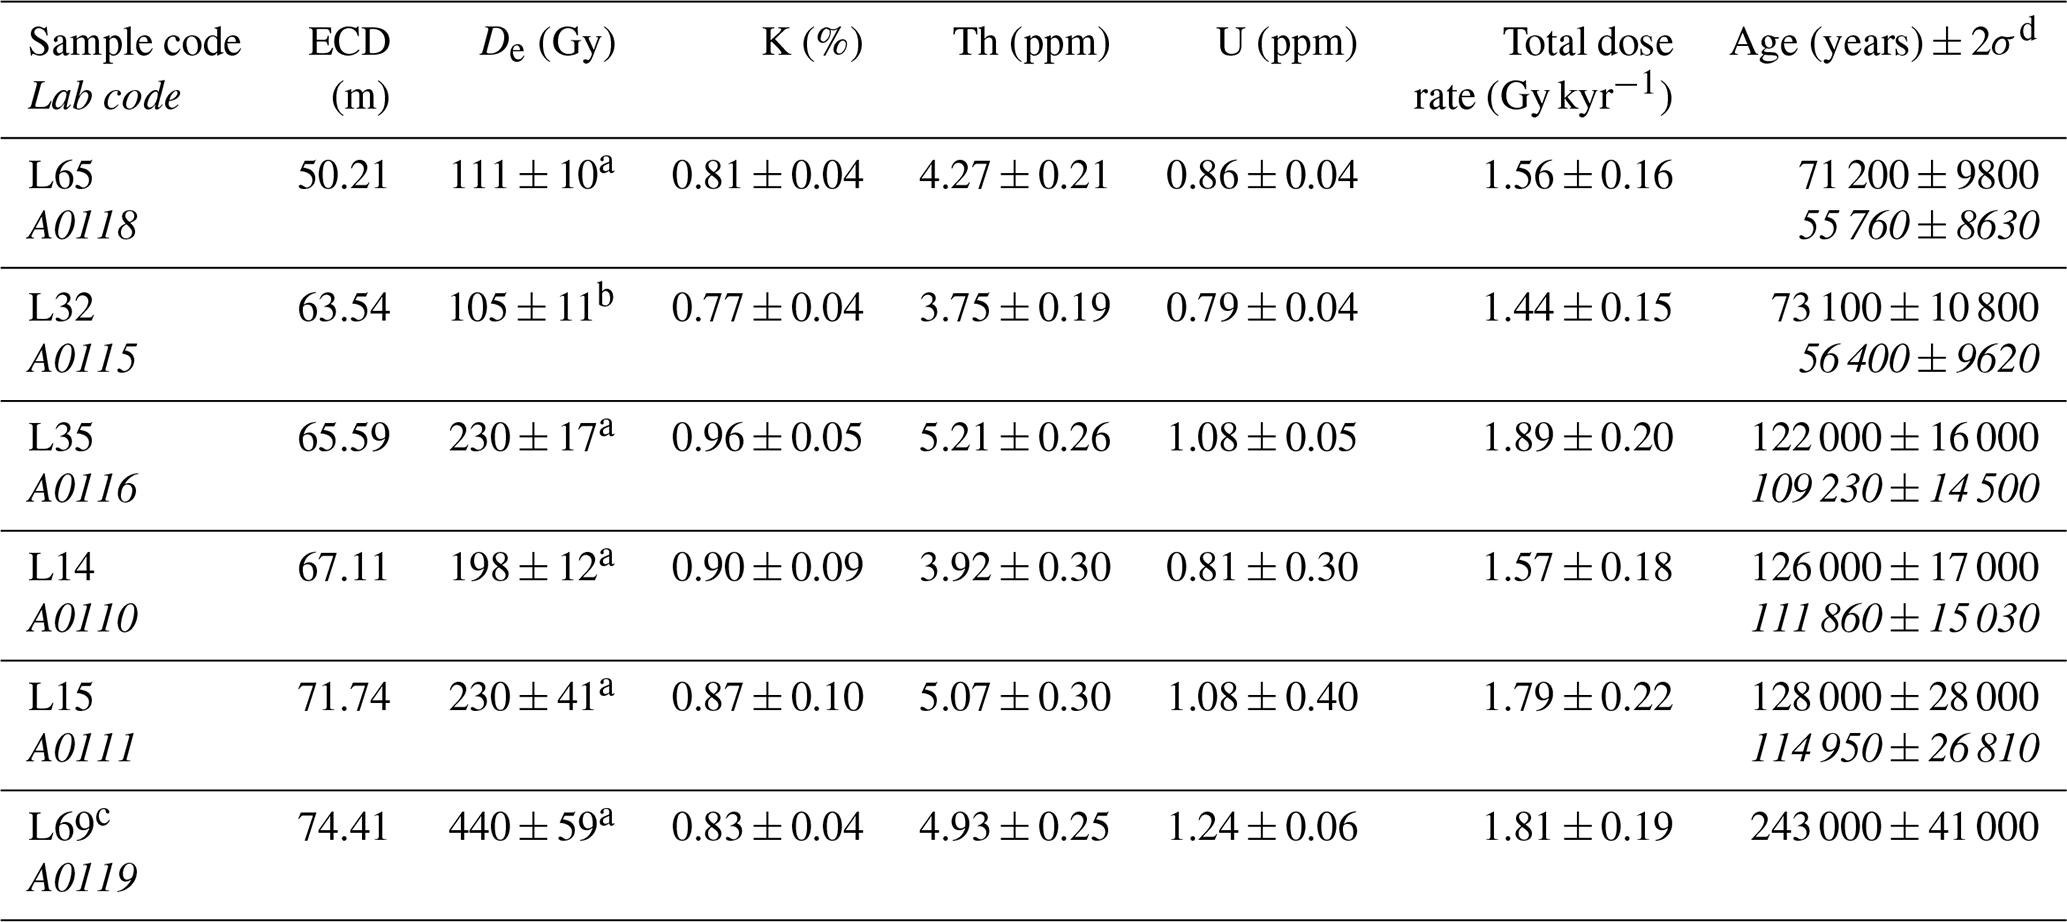
a Calculated using the CAM. b Calculated using the MAM. c Only four aliquots of sample L69 were acceptable but scattered. Hence, we decided against residual dose correction and reject sample L69 as an outlier given insufficient De data. d Ages corrected for residual dose (24 Gy) based on tests on sample L15 are provided in italics. Water contents of 20 ± 10 % were used for all samples.
Table 5Tuning points obtained by dynamic time warping alignment of the Orakei RPI data to the PISO-1500 VADM (Channell et al., 2009).
Results of the remaining six samples are summarised in Table 4. They conform (within 2σ error) to the expected ages based on the other approaches presented here but suffer from limitations as described below and in Appendix B.
The luminescence characteristics of the Orakei samples were not optimal for age determination. Ages could only be calculated by relaxing the acceptance criteria for analysis. The samples are typically very dim, yielding generally low signal counts (Fig. B4a) and low sensitivity. Late background subtraction was used to optimise the signal measured. The sensitivity to test dose over the regenerative cycles of the pIR-IRSL290 protocol typically decreased to 20–30 % of the test dose sensitivity following the natural signal measurements and remained fairly constant over subsequent cycles (Fig. B4b). Dose-response curves could often, but not always, be fitted to an exponential or exponential-plus-linear function but rarely passed through the origin due to the high degree of thermal transfer (Fig. B4c). Recuperation was very high, yielding values of up to 50 %, and recycling ratios were variable but often exceeded 20 % divergence from unity (Table B1). In order to obtain results, aliquots were accepted if dose-response curves could be reasonably fitted; threshold criteria for other quality control measurements such as recycling ratios and recuperation were relaxed such that values of 1.0 ± 0.4 and < 67 % (mostly < 25 %) were accepted for analysis respectively. The residual dose test run on sample L15 (A0111) provided usable signals only in one out of three aliquots, and so the residual correction was made on the basis of that lone aliquot. Despite these limitations, the residual-corrected ages yield results more closely fitting with the age predicted by the matching of the palaeomagnetic RPI to the PISO-1500 stack.
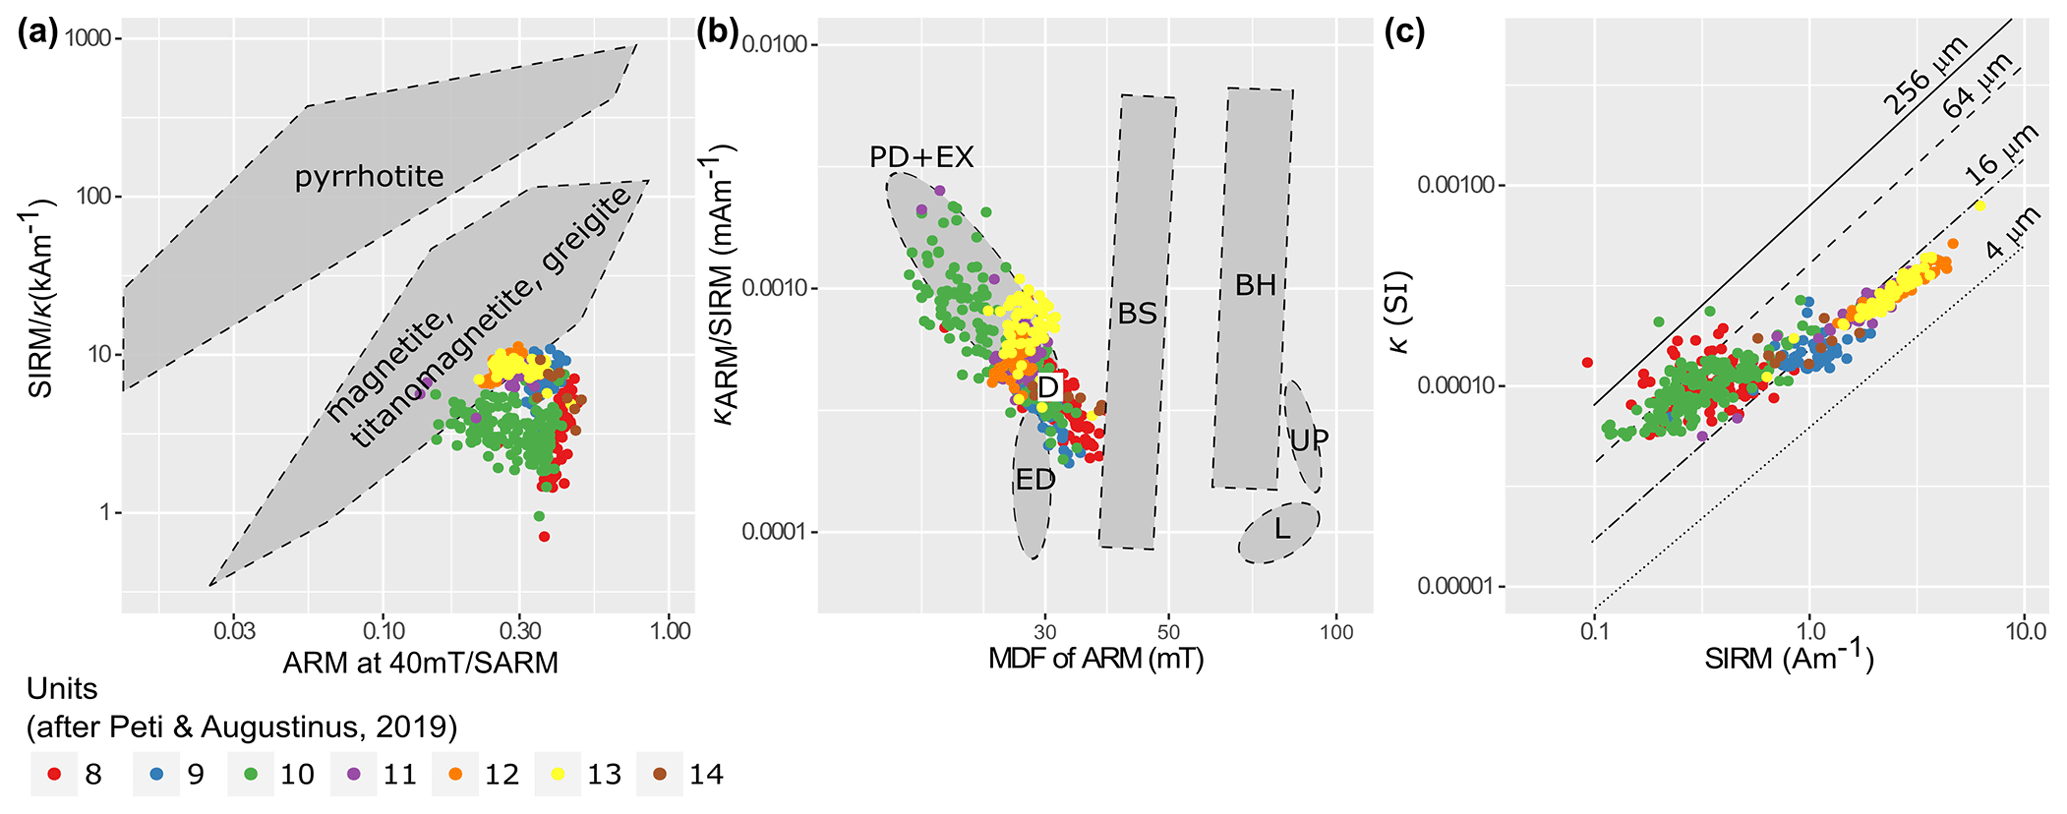
Figure 5Rock magnetic characterisation of the Orakei sediment samples. (a) Qualitative identification of magnetic minerals following Peters and Thompson (1998). SARM: saturated ARM at 0 mT. We note that the ARM at 40 mT ∕ SARM ratios are likely higher than the equivalent measurements of Peters and Thompson (1998) due to the lower maximum AF (80 mT) used to induce the ARM. (b) Magnetic components of Orakei samples in comparison to components defined by Egli (2004). MDF: mean destructive field. κARM: susceptibility of ARM (SARM divided by applied bias field). BH: biogenic hard, high-coercivity magnetosomes. BS: biogenic soft, low-coercivity magnetosomes. D: detrital particles transported in water systems. ED: aeolian dust/wind-blown particles. EX: ultrafine extracellular magnetite. L: maghemite component in loess. PD: pedogenic magnetite. UP: atmospheric particulate matter produced by urban pollution. (c) Estimated magnetic grain size indicator following Thompson and Oldfield (1986, p. 31). SIRM: saturated isothermal remanent magnetisation at 0 mT.
4.4 Palaeomagnetism
Down-core palaeomagnetic measurements of the Orakei sediment sequence were undertaken to support the development of the chronology with the identification of known-age geomagnetic excursions. Additionally, relative changes in the strength of the Earth's magnetic field were estimated to allow the transfer of chronological information from dated sediment sequences showing corresponding variations in the relative palaeo-intensity.
Mineral magnetic data (Fig. 5) of the Orakei sediment sequence are consistent with the detrital magnetite as the main magnetic carrier. Following Peters and Thompson (1998) we classify the magnetic assemblage of the Orakei samples as magnetite/titanomagnetite (Fig. 5a). We identify both detrital and extracellular magnetite components based on the definition of Egli (2004; Fig. 5b), with the latter mostly found in facies 10. Variations in magnetic grain size, estimated following Thompson and Oldfield (1986), suggest that most Orakei sediment samples used for palaeomagnetic measurements fall in the pseudo-single-domain range of magnetite (0.1–20 µm; Fig. 5c), consistent with a detrital origin, although the increased scatter in the lower left half of Fig. 5c, suggesting increasing magnetic grain size, may partly reflect the importance of superparamagnetic (e.g. facies 10) and/or paramagnetic effects in samples with low magnetite concentration. The magnetic data partially fulfils the loosely defined criteria to assess the reliability of palaeo-intensity data from sediments (Tauxe, 1993). It appears that magnetic concentration variations exceed 1 order of magnitude at times, and the magnetic grain size is likely not confined to a very narrow range, but all other criteria are generally fulfilled.
The coring procedure at Orakei prevented useful declination determination. The 1 m long core sections were not oriented with respect to magnetic north–south, and several segments were further rotated as they broke along coarser clastic layers such as tephra.
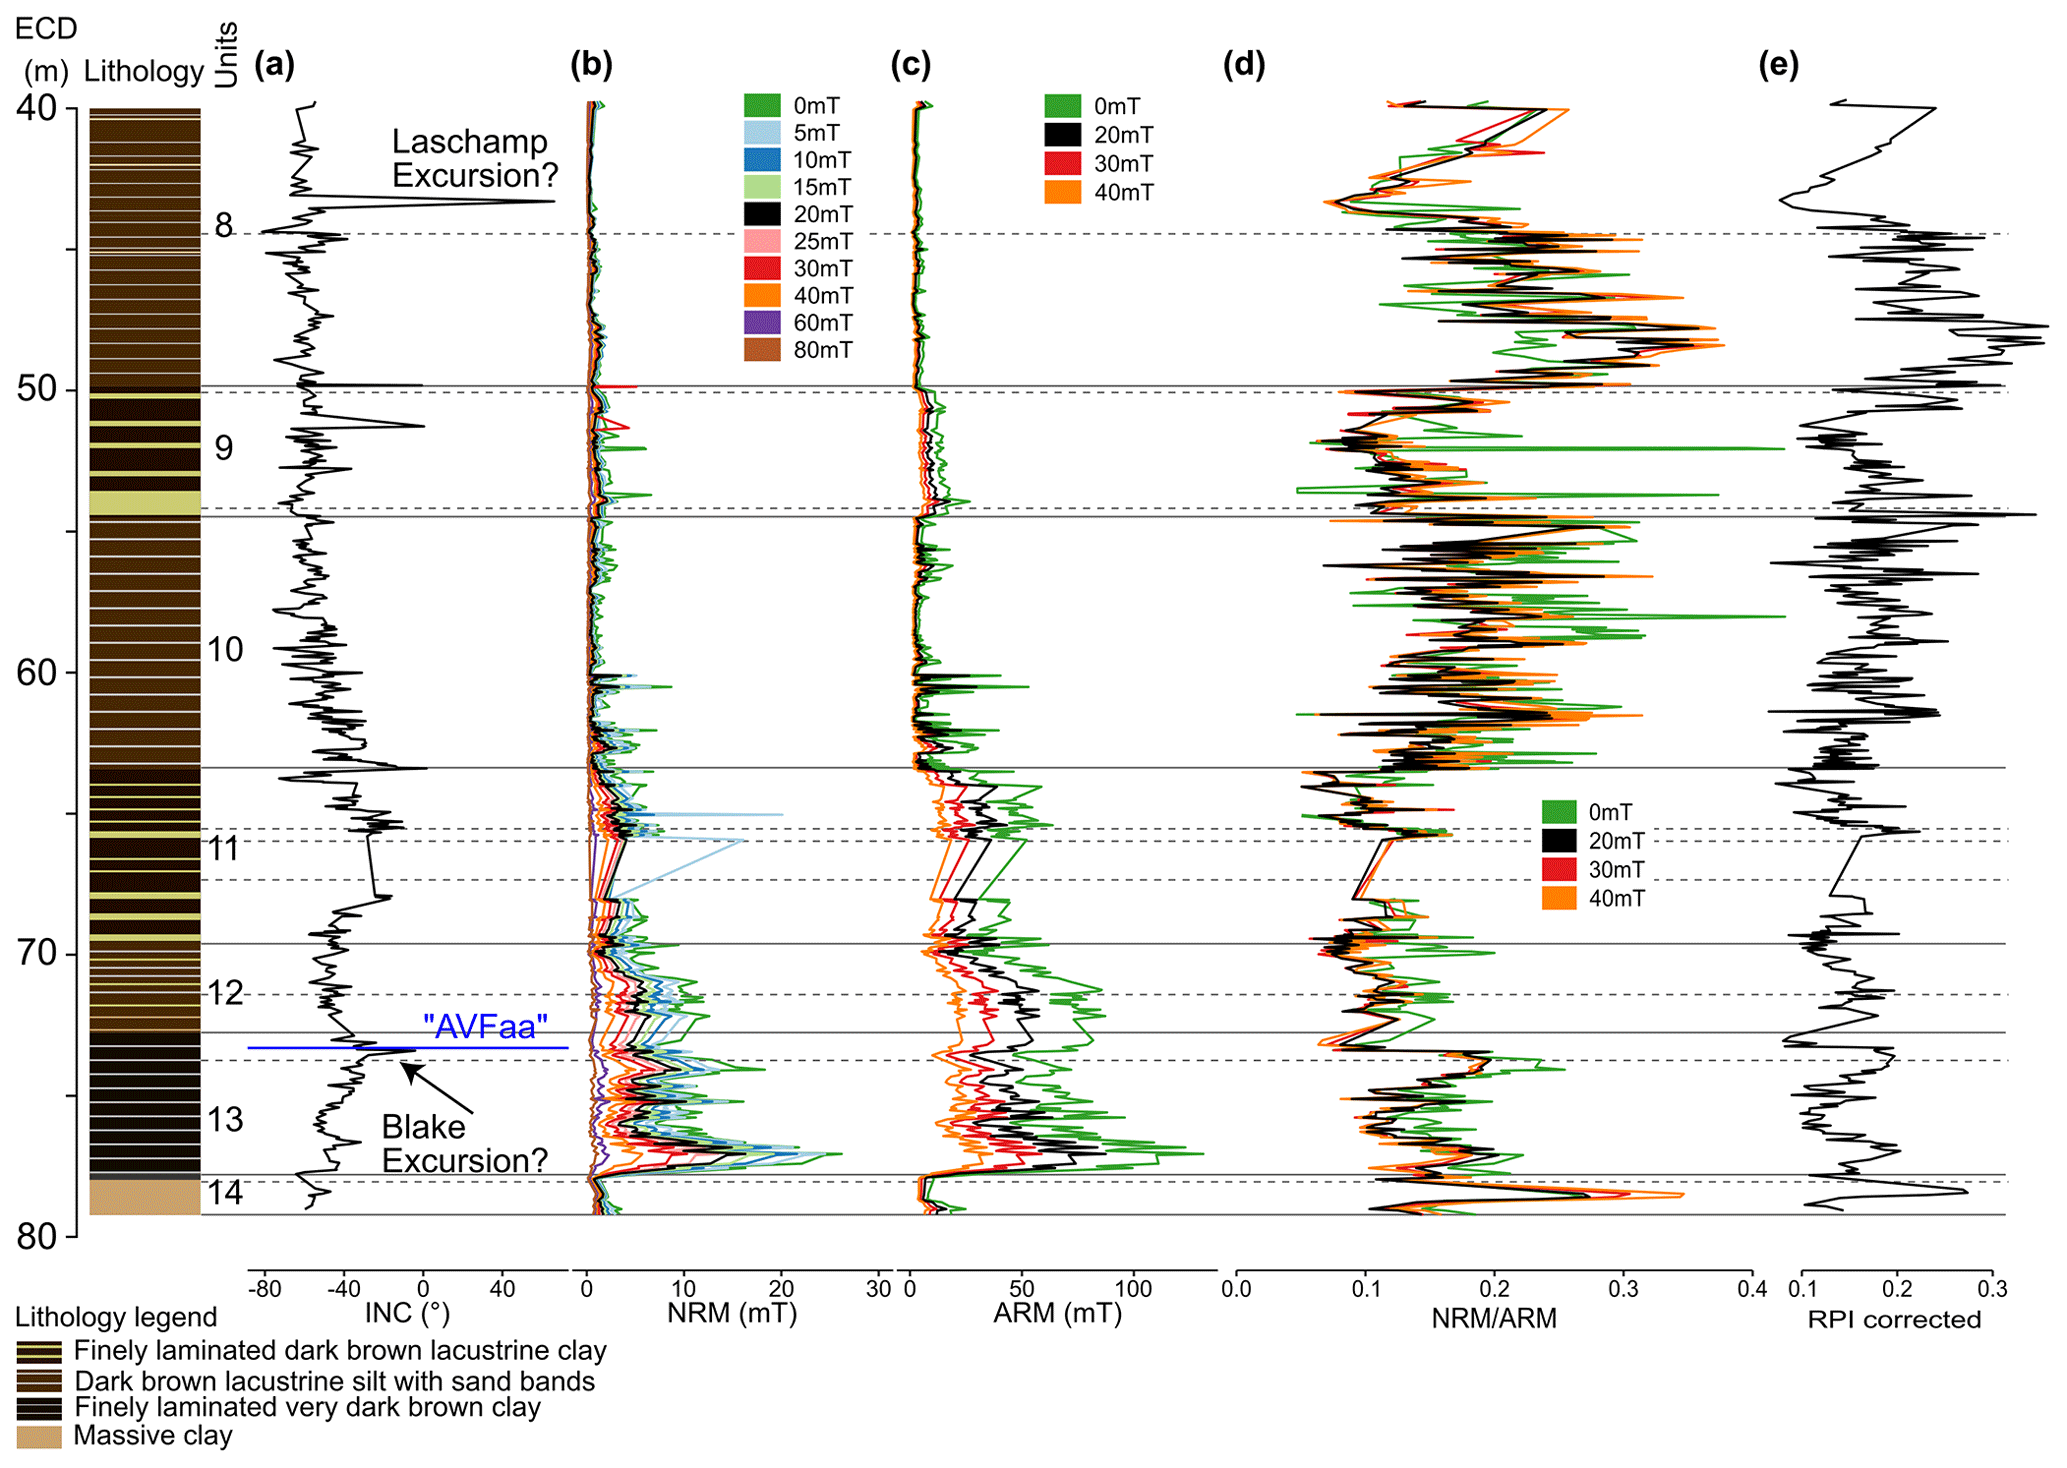
Figure 6(a) Inclination, (b) NRM at different demagnetisation steps, (c) ARM at different demagnetisation steps, (d) NRM ∕ ARM at different demagnetisation steps, and (e) facies-corrected relative palaeo-intensity (RPI) derived from NRM ∕ ARM at 20 mT of the Orakei sediment sequence. Horizontal grey lines mark facies unit boundaries (solid) and sub-unit boundaries (dashed) from Peti and Augustinus (2019).
The ChRM inclination in the lower ∼ 40 m of the Orakei sediment sequence mostly varies from −50 to −60∘, which is consistent with the geocentric axial dipole prediction of −56∘ for the site latitude. A reversed polarity direction with inclination reaching +66∘ is observed at 43.24 m (Fig. 6a). Its position between the Tahuna and Rotoehu tephra layers (see Sect. 4.1) implies that this short-lived reversal can be assigned to the Laschamp excursion (e.g. Cassata et al., 2008; Ingham et al., 2017; Laj et al., 2014; Laj and Channell, 2015; Mochizuki et al., 2006; Roperch et al., 1988) dated to 41 100 ± 350 (2σ) years by Lascu et al. (2016). Significantly shallower inclinations are recorded between ∼ 63 and 68 m, as well as around the facies unit boundary 13–12 at ∼ 73 m (Fig. 4). The inclination flattens to −4.1∘ at 73.42 m, 10 cm below the tephra AVFaa from the Mt Albert eruption (119 200 ± 5600 (2σ) years; Leonard et al., 2017; Fig. 6). This age constraint in proximity to this near-reversed inclination, along with pronounced and sustained decrease in RPI starting at the time of deposition of AVFaa, suggests that it could correspond to the Blake excursion (Smith and Foster, 1969; Thouveny et al., 2004; Tric et al., 1991; Zhu et al., 1994) dated to 116 500 ± 700 to 112 000 ± 1900 (2σ) years by Osete et al. (2012). Other occurrences of reversed or transitional (positive or near-zero) inclinations at 49.77 and 63.38 m, and shallower inclinations between ∼ 63 and 68 m, occur in intervals of coarser grain size, possibly indicating previously unidentified thin mass movement deposits (King, 1955). No data were obtained between 65.8 and 67.78 m due to sand bands preventing sampling of the intercalated laminated sediment as the sample cubes are larger (2.2 cm) than samples taken for other techniques (e.g. 1 cm slices for beryllium; see below).
The NRM and ARM variation of the Orakei sediment sequence show the same broad pattern in each demagnetisation step (Fig. 6b, c). Very low NRM and ARM in facies unit 14 are followed by a sudden increase at ∼ 76 m (Fig. 6b, c), then decreasing stepwise until very low values are reached again at ∼ 60 m. Up to 40 m, NRM and ARM values remain very low, although the ARM curve is interrupted by slightly elevated values in facies unit 9 (∼ 55–50 m; Fig. 6c).
To calculate the relative palaeo-intensity – expressed by the NRM ∕ ARM ratio – we used the NRM and ARM after 20 mT AF demagnetisation, as a similar pattern was obtained from all demagnetisation steps (different colours in Fig. 6d). Valet and Meynadier (1998) and Stanton et al. (2011) show that differences between different methods of obtaining the RPI values are minor. Very low values are associated with the partially reversed polarity direction tentatively identified as the Laschamp excursion (Fig. 6). The strength of the global magnetic field is known to have been exceptionally low during the Laschamp excursion as measured in sediments (e.g. Channell et al., 2009) as well as in lava flows from France (e.g. Laj et al., 2014; Roperch et al., 1988) and New Zealand (Cassata et al., 2008; Ingham et al., 2017; Mochizuki et al., 2006), supporting this interpretation. Equally low RPI values are also observed in facies unit 9 and facies unit 11 (Fig. 6). These facies units represent coarser grain size facies, suggesting that the low RPI values could be artefacts associated with less efficient NRM recording in a higher-energy depositional environment (compare Fig. 2) and observed in a minor anti-correlation between dry bulk density (not shown) and RPI. This may indicate a possible link between sedimentary facies and the efficiency of acquiring an NRM signal, which was not fully removed by the NRM ∕ ARM normalisation procedure. The down-core variation in NRM ∕ ARM (Fig. 4d) is assumed to be proportional to the scatter around a linear trend line in a scatterplot (Fig. C5). The offset between the linear trend lines fitted to the data points of the coarse and the fine-grained facies units indicates only a very small difference in efficiency of NRM acquisition. Nevertheless, we correct this difference with a facies-dependent correction factor applied to the palaeomagnetic intensities of facies 9 and 11 to match the slope of the fine-grained facies. The facies-corrected RPI (shown in Fig. 6e) strongly resembles the raw RPI, and henceforth RPI refers to this facies-corrected RPI.
The Orakei RPI shows marked variation with a short-lived peak at 78.35 m (Fig. 6d) and troughs around 70, 73, and 76 m. Pronounced low RPI values between ∼65 and 61 m are followed by high-frequency variability up to ∼ 55 m and then a pronounced decrease to reach a short-duration trough around 52 m. RPI values then increase toward a maximum around 49 m, followed by a stepwise decrease to a RPI minimum coincident with the Laschamp excursion (Fig. 6d).
The short-duration RPI trough around 52 m aligns with a very shallow inclination of +0.4∘ at 51.2 m (Fig. 6). The combination of inclination, low RPI, and its depth (implying an age of ca. 61 000 years) suggests that this may be the Norwegian–Greenland Sea excursion (Bleil and Gard, 1989; Løvlie, 1989). This probable reversal of the geomagnetic field was considered to be restricted to high latitudes accompanied by a global low in geomagnetic field intensity and has been confirmed at various northern high-latitude sites (Channell et al., 1997; Nowaczyk et al., 1994, 2003; Nowaczyk and Baumann, 1992; Nowaczyk and Frederichs, 1999; Simon et al., 2012; Xuan et al., 2012). However, low field strength and potentially excursional directions have also been interpreted as the Norwegian–Greenland Sea excursion in Black Sea sediments (Liu et al., 2020; Nowaczyk et al., 2013) and the western equatorial Pacific (Lund et al., 2017). The occurrence of the Norwegian–Greenland Sea excursion in the Orakei maar lake record would thus constitute its first observation this far south, although additional samples are needed to confirm its occurrence in the Orakei record.
4.5 Beryllium
Relative changes in the 10Be production rate in the atmosphere, at first order, should reflect fluctuations in the relative strength of the Earth's magnetic field, whilst on shorter time scales it should reflect solar magnetic shielding assuming a constant galactic cosmic-ray flux (e.g. Frank et al., 1997; Muscheler et al., 2005). As such, the direct-fallout meteoric 10Be record can be expected to provide an inverse record to the relative palaeo-intensity time series (Elsasser et al., 1956; Ménabréaz et al., 2011). However, in this case, the authigenic 10Be signal contains contributions from non-direct-fallout component(s), such as those associated with catchment-derived erosional influx and material of aeolian origin, and thus may be modulated by associated grain size variability. Authigenic (HCl-extracted) 9Be serves as the normalising factor for 10Be to compensate for such effects but may also indicate shifts in the sedimentary regime on its own as 9Be is commonly released by weathering (Wittmann et al., 2015).
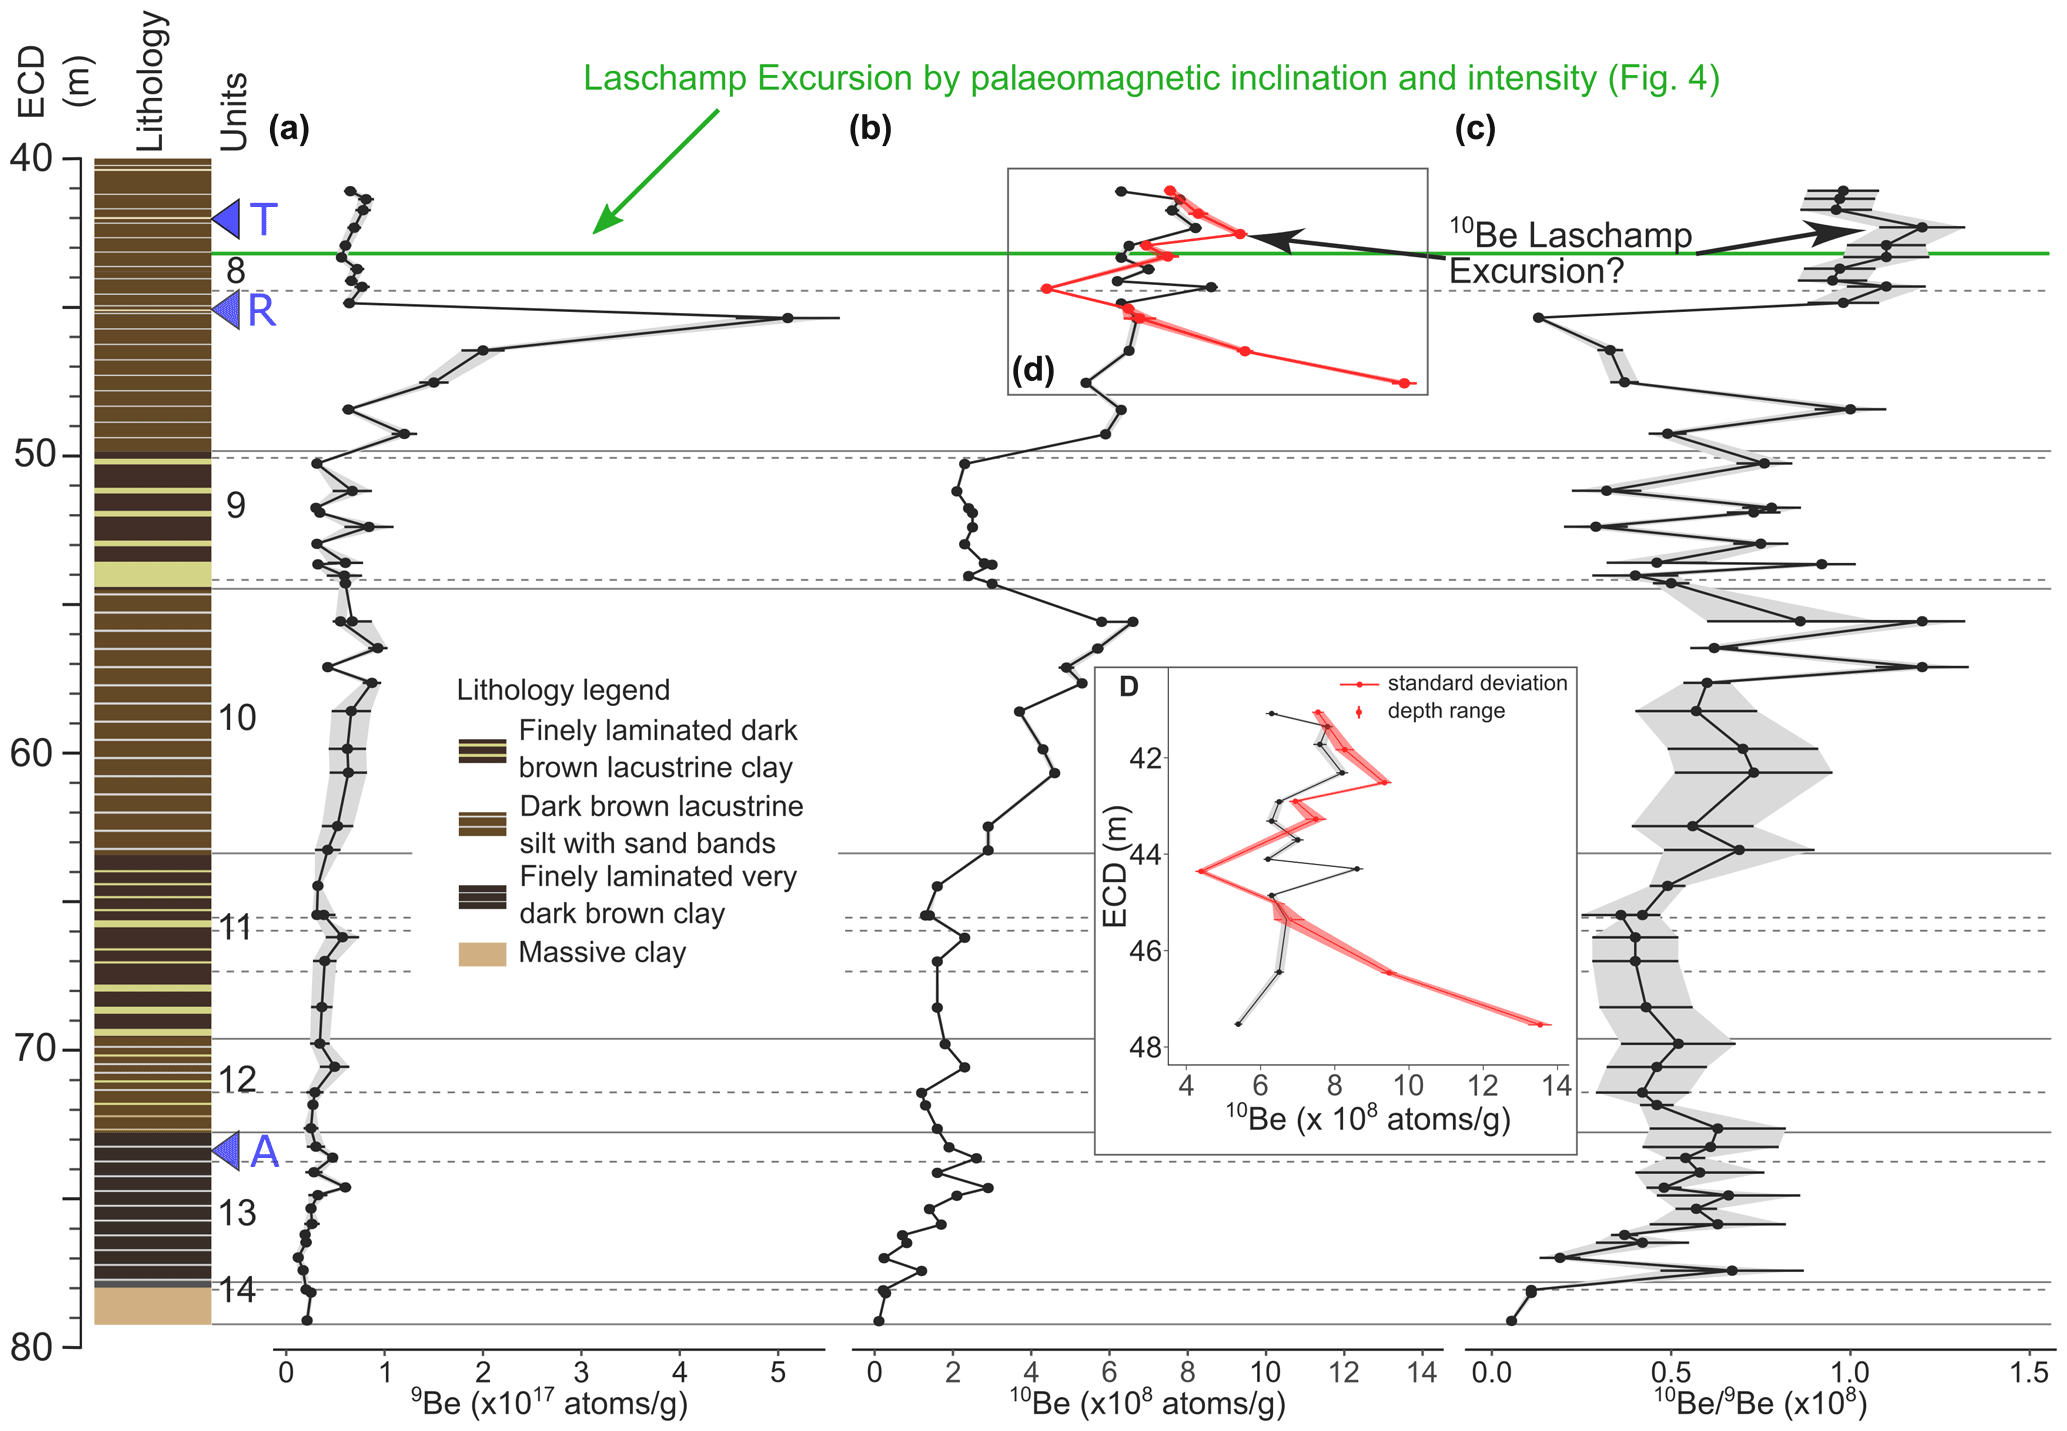
Figure 7Beryllium variation in the lower ∼ 40 m of the Orakei sediment sequence alongside the simplified lithology and facies unit boundaries (solid grey lines) and sub-unit boundaries (dashed grey lines) from Peti and Augustinus (2019). Green line marks the position of the Laschamp excursion according to the palaeomagnetic inclination and intensity (see Fig. 4 and Sect. 4.4). Blue triangles mark positions of the tephra marker layers T: Tahuna (38 400 ± 1700 (2σ) cal years BP); R: Rotoehu (45 100 ± 3300 (2σ) years BP); and A: “AVFaa” from Mt Albert (119 200 ± 5600 (2σ) years). (a) 9Be concentration ± 1 standard error. (b) 10Be concentration ± 1 standard error from Lund (red) and ANSTO (black), enlarged interval in (d). (c) 10Be ∕ 9Be ratio ± 1 standard error. Grey and red shading highlight the uncertainty interval. Where error bars are not visible, they are within the size of the data points.
4.5.1 Beryllium-9
9Be shows nearly constant, long-term increasing values from the core base up to large stepwise increase between 50 and 45 m, reaching its maximum of ∼ 6×10¹⁷ atoms g−1 just below the Rotoehu tephra layer and then returning to constant (near pre-peak) values up-core (Fig. 7a). The large peak between 47 and 45 m may reflect accelerated weathering and erosion in the catchment and/or wind-blown deposits with a different 9Be inventory, although the catchment is confined to the crater rim environment and enhanced weathering and erosion are not apparent at this depth in the Orakei core.
4.5.2 Beryllium-10
The 10Be record (from ANSTO; black in Fig. 7b, d) increases up-core, peaking at the top of unit 10 (∼ 57 m), interrupted by a prominent trough in facies unit 9 and followed by relatively constant values across facies unit 8, punctuated by discernible peaks at ∼ 44 and ∼ 42 m. The Lund–ETH 10Be data largely follow the ANSTO 10Be but deviates considerably for three of its deepest four samples (i.e. below ∼ 44 m; Fig. 7b, d). The reason for this discrepancy is unclear, but it may be due to very heterogenic lithologies or represent a sampling or analytical artefact.
The trough in 10Be in the coarser facies unit 9 (50–55 m depth) is interpreted to be caused by a higher proportion of coarser (sandy) grains and, hence, reduced surface density of 10Be per gram, reflecting apparent reduction of surface area per unit of mass in coarser grains. The same behaviour of the 10Be profile is observed in facies unit 11 (∼ 64–69 m depth, sand and silt dominated), but the trough is not as distinct as in facies unit 9 (Fig. 7b). This is likely a response to the more effective separation between distinct coarse-grained sand bands, which have been removed on the ECD, and intercalated finer silt from which the beryllium samples originate. On the other hand, in facies unit 9, the sand bands are less distinct, and the beryllium sample material likely originates from a multi-modal grain size distribution in which particles of different grain sizes (clay, silt, sand) are mixed.
4.5.3 Beryllium-10 ∕ beryllium-9 ratio
In order to correct for catchment processes that modulate the 10Be concentration (e.g. sediment influx variability, grain size variation, and geochemical variation in beryllium transport and deposition), the 10Be ∕ 9Be ratio (Bourlès et al., 1989) is plotted in Fig. 7c. The data incur high analytical uncertainties originating from low-level 9Be ICP-MS measurements near detection limits (ranging from < 1 to 13 ppb, with most data < 2 ppb, to which we assigned 30 % errors). Very low ratios in facies unit 14 are followed by elevated ratios in unit 13, which are largely maintained to ∼ 48 m depth (Fig. 7c). The uppermost studied interval is characterised by a pronounced 10Be ∕ 9Be trough (due to the strong 9Be peak at 45.5 m) followed by an abrupt increase near coincident with facies unit boundary 8b–8a (dashed grey line in Fig. 7c) and associated with elevated values up to ∼ 40 m depth (Fig. 5c).
The conspicuous sawtooth profile in the 10Be ∕ 9Be ratio in facies unit 9 originates from 9Be measurement uncertainties (Fig. 7a, c) rather than from the bimodal grain size distribution of sand and silt, which we avoided. Samples were measured for 10Be and 9Be in two campaigns in 2018 and 2019, with the former having larger uncertainties. Thus, we attribute the scatter mostly to measurement uncertainties rather than a true signal of the geomagnetic field strength, cosmogenic nuclide production, or sediment influx. In summary, 10Be ∕ 9Be ratios are associated with large uncertainties preventing any correlation to palaeomagnetic variations with high confidence as the ratio does not respect the homogeneous mixing of both isotopes prior to scavenging. On the other hand, 10Be data – except for unit 9, where effects of larger grain size cannot be ruled out – are probably more reliable and discussed further below.
4.5.4 Palaeomagnetic excursions in the beryllium record
Elevated 10Be deposition during a palaeomagnetic excursion, such as the Laschamp excursion (McHargue et al., 1995), enables the use of peaks in the 10Be concentration record to identify dated excursions and hence to include them in the age modelling process. Based on the estimated age range covered by the lower ∼ 40 m of the Orakei sediment sequence, for which we have obtained a beryllium isotope record, we expected to see elevated 10Be (and/or 10Be ∕ 9Be) during the Laschamp and Blake excursions. The magnitude of the peak above baseline would depend on the magnitude of the decrease in palaeomagnetic field intensity and the impact of competing terrestrial processes which can also alter beryllium delivery and deposition.
The Tahuna (38 400 ± 1700 (2σ) cal years BP) and Rotoehu (45 100 ± 3300 (2σ) years BP) tephra layers serve as upper and lower age markers, respectively, for the Laschamp excursion in the Orakei sediment sequence. For a detailed, high-resolution study of this interval, we use 10Be data from ANSTO and Lund–ETH (Fig. 7d). Aside from one data point at ∼ 44.5 m and two data points below 46 m depth, the two curves overlap well despite the Lund–ETH samples above 46 m representing mixed sediment from 10 cm intervals (i.e. ∼ 250 years) and the ANSTO samples representing 1 cm sediment slices (i.e. ∼ 25 years) of sediment only. Three Lund–ETH samples below 46 m, which deviate the most from ANSTO data, represent mixed material from 2 cm intervals (∼ 50 years). Again, we have no clear explanation of this discrepancy, but it likely is due to heterogenic lithologies and/or represents a sampling or analytical artefact.
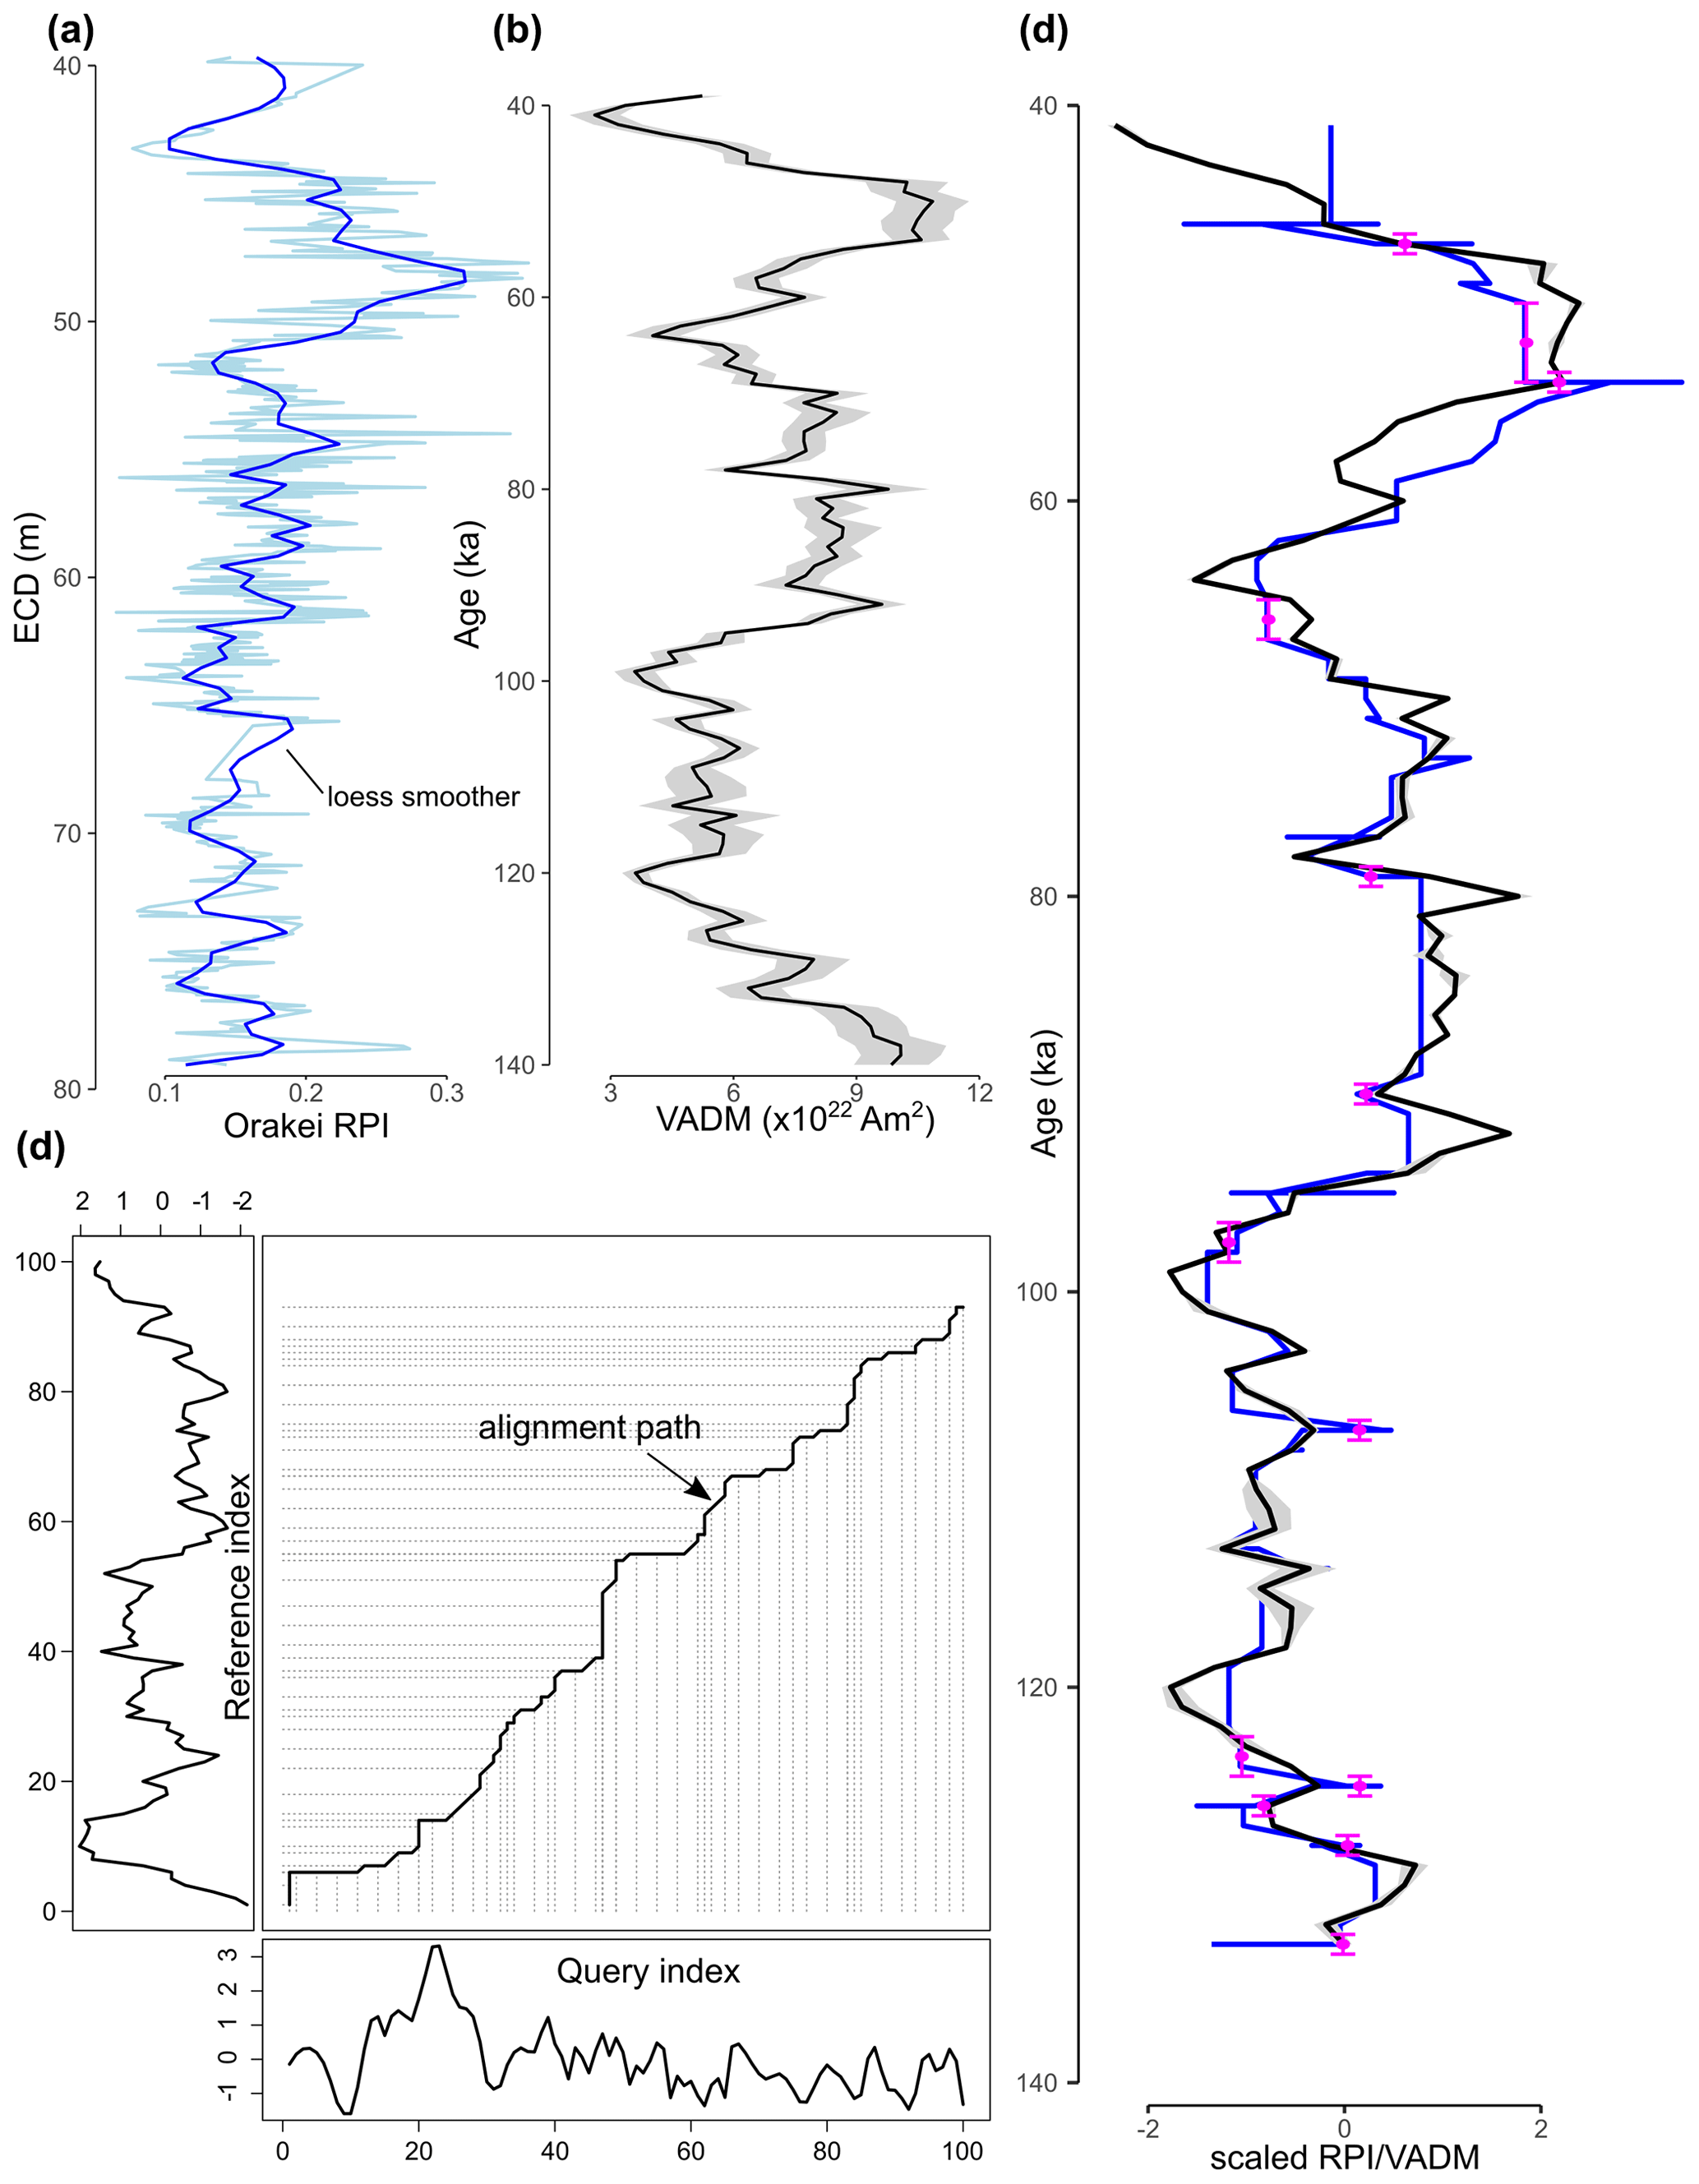
Figure 8(a) Orakei RPI (NRM ∕ ARM at 20 mT, light blue) with loess smoother (dark blue). (b) PISO-1500 (Channell et al., 2009) ± standard error. (c) DTW alignment path (solid black line) with scaled Orakei RPI as the query curve below and scaled PISO-1500 VADM as the reference curve to the left. Dotted grey lines highlight aligned points between both curves. (d) Both curves scaled after DTW alignment on the same age scale with selected random tuning points and age uncertainty of ± 2σ.
10Be shows increasing values from ∼ 44 to 42 m with a distinct peak at 42.5 m and return to lower 10Be at 41 m depth (Fig. 7d). This peak may represent the Laschamp excursion at Orakei, as also observed at nearby Lake Pupuke (Nilsson et al., 2011), and the onset may be placed at 43.3 m depth, which aligns well with the sharp reversal in palaeomagnetic inclination (Fig. 6a) and RPI minimum (Fig. 6d; see Sect. 4.4).
The 10Be increase in the lower part of the section (facies unit 13) is interrupted by smaller peaks – a pattern not observed in the previous 10Be records (Simon et al., 2016). Furthermore, none of these peaks stand out above background level as would be expected for the Blake excursion (116 500 ± 700 to 112 000 ± 1900 (2σ) years; Osete et al., 2012). However, the AVFaa tephra (119 200 ± 5600 (2σ) years; Leonard et al., 2017) provides a suitable time marker in proximity to where the Blake excursion is expected as an RPI low, hence a peak in 10Be (Fig. 7). Two small peaks in 10Be at 73.6 and 74.6 m may correspond to the inferred level of the Blake excursion (Fig. 7c). However, the Blake excursion is not independently identifiable in the Orakei sediment sequence, neither in the palaeomagnetic inclination or intensity (RPI) records (see Sect. 4.4, Fig. 6) nor in the cosmogenic 10Be record. Consequently, the Blake excursion is not used to inform the chronology development.
In the present study, the 10Be data, although showing trends and variability correlated with different facies units, are limited in their ability to directly reflect geomagnetic field variations, whilst the 10Be ∕ 9Be data suffered from large analytical uncertainties. For example, the Laschamp reduction in geomagnetic field strength approximately doubled the globally averaged atmospheric production rate of 10Be as observed in polar ice core (e.g. Wagner et al., 2000) and marine sediment (e.g. Simon et al., 2020b) 10Be records. In this study, the inferred Laschamp 10Be is no larger than ×1.3 above adjacent base level 10Be, and the Blake excursion barely stands out. Variations in the 10Be ∕ 9Be data suggest strong catchment and/or regional influences on isotopic beryllium records that may not easily be compensated for via normalisation with 9Be. Therefore, the interpretation of 10Be in terms of geomagnetic field changes and its utility for dating appears to be rather limited in the context of the Orakei maar sediment sequence.
4.6 Tuned palaeomagnetic RPI curve
Initial visual inspection highlighted the similarities between the Orakei RPI curve and the PISO-1500 stack (Fig. 8a, b). The fit of both curves following DTW alignment (Fig. 8c) is presented in Fig. 8d. The stretching and compressing by the DTW alignment become visible in the aligned RPI curve, which shows strong agreement with the PISO-1500 stack, although some minor fluctuations between ca. 80 000 and 95 000 years appear only in the PISO-1500 stack (Fig. 8d).
Neither 10Be concentration nor 10Be ∕ 9Be curves display a comparable pattern, likely due to an unidentified catchment-influx overprint. We therefore do not incorporate the beryllium results into the tuned chronology.
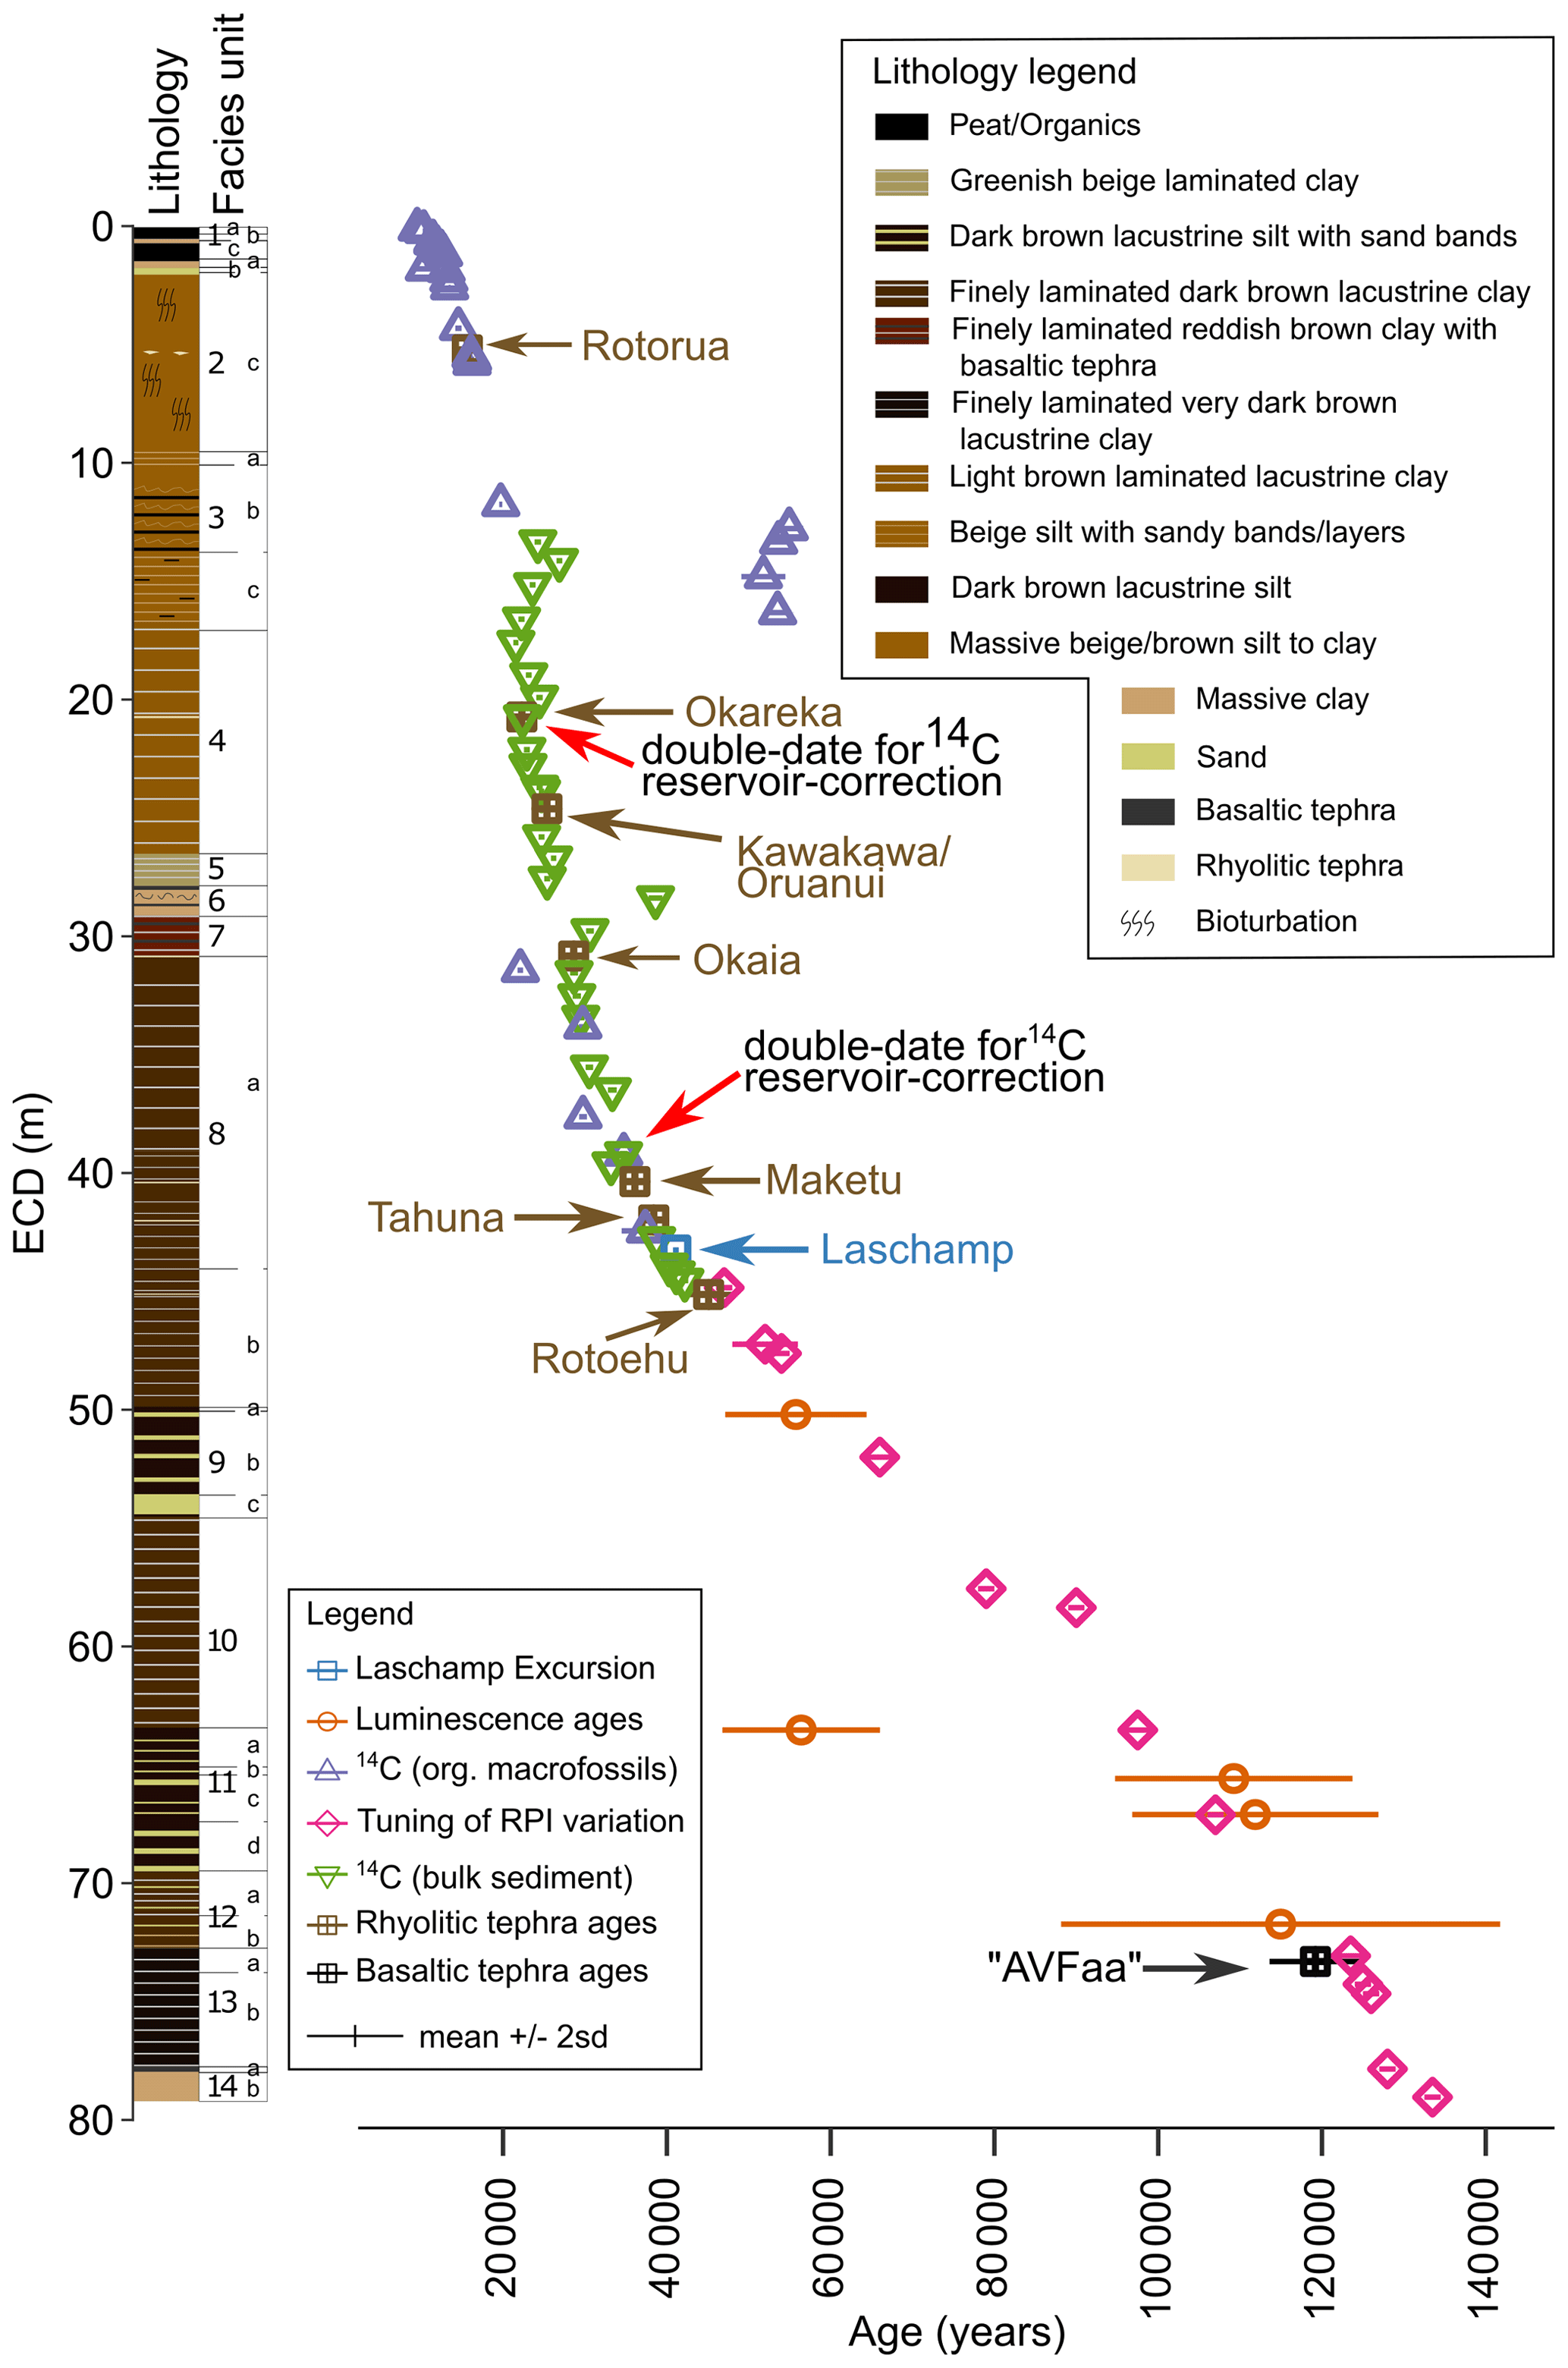
Figure 9Simplified lithology and summarised facies units of the Orakei sediment sequence (from Peti and Augustinus, 2019) with ages (± 2σ) used in the current chronology study (identified tephras marked with names – for published and adjusted (this study) ages see Table 2). Red arrows mark double dates undertaken for 14C reservoir correction (see Sect. 3.2). Note that radiocarbon dates have been calibrated and reservoir-corrected where applicable as noted in Table 1.
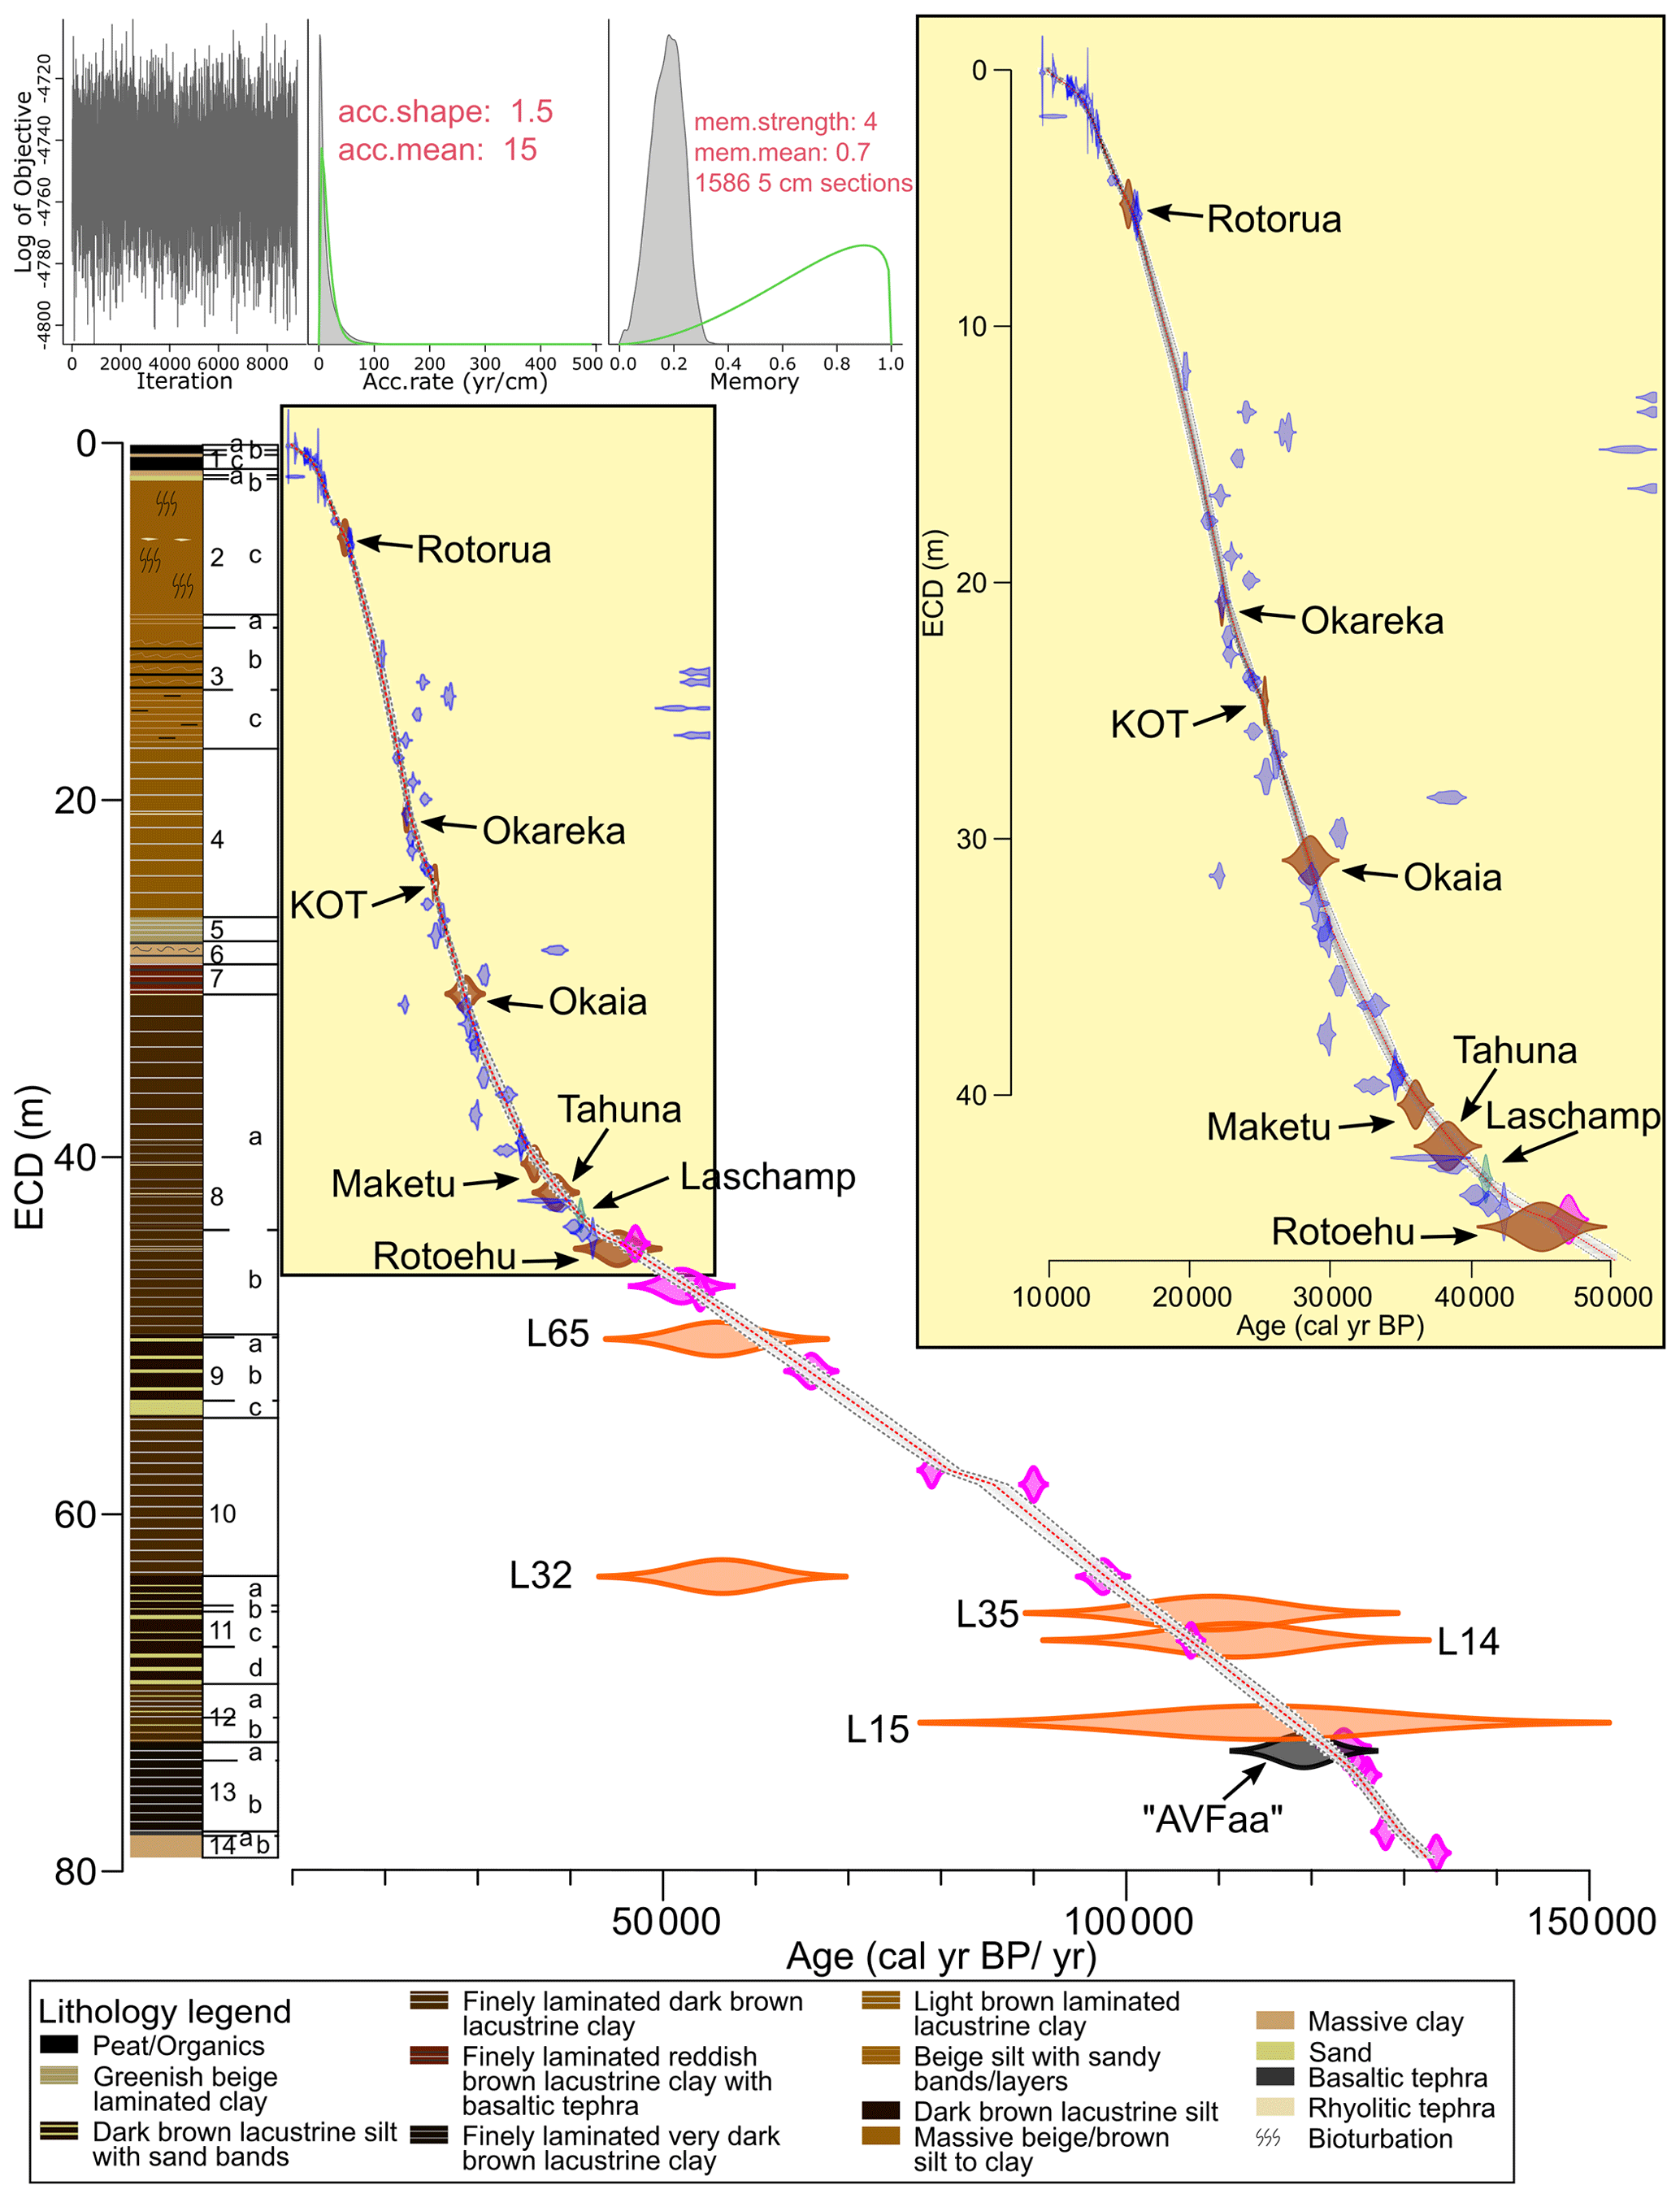
Figure 10Orakei age model spanning the entire sediment sequence using the event-corrected depth obtained by Bacon age modelling. Dotted red line marks the mean age model; dotted grey lines mark the 95 % confidence limits. Inset enlarges the interval of ca. 45 000 cal years BP. Blue symbols mark calibrated radiocarbon ages, brown symbols mark rhyolitic tephra ages (marked by name), green symbol marks the age of the Laschamp excursion, orange symbols mark luminescence ages (marked by sample codes), pink symbols mark tuning points from DTW alignment of Orakei RPI to PISO-1500 VADM, and the black symbol marks the age of the basaltic “AVFaa” tephra identified as sourced from the Mt Albert volcano. Lithology and facies units from Peti and Augustinus (2019).
4.7 Integration of multiple chronologies: the Orakei age model
All ages from radiocarbon dating, tephrochronology, the Laschamp excursion, luminescence dating, and the RPI tuning points obtained in the Orakei sediment core are presented in Fig. 9. The age of the Blake excursion has not been used for the chronology development, since its identification in the Orakei sequence is equivocal in both the palaeomagnetic and 10Be data, and the AVFaa tephra provides an age for the chronology development close to the position of the possible Blake excursion. The age model obtained using Bacon is shown in Fig. 10. The mean 95 % confidence age range is 1431 years, with a minimum of 220 years at 2.57 m ECD and a maximum of 3231 years at 59.23 m ECD. Only 68 % of all ages overlap with the 95 % range of the age–depth model.
The Orakei age–depth model defines the age of onset of lacustrine sedimentation (at 79.24 m ECD) as 132 305 years (95 % confidence range: 131 430–133 180 years). Following that, the age–depth model is predominantly guided by the RPI tuning points (Fig. 10) despite not always passing through or near the mean. This occurs as the modelling process is designed to avoid strong or abrupt changes in the accumulation rate unless supported by a hiatus (which has not been observed). Nevertheless, a notable inflection of the age model occurs at ca. 59 m caused by nearby tuning points of different ages which represent the interval of ca. 80 000 to 95 000 years, in which two RPI minima are matched by the DTW algorithm but the intermittent variations are not captured in the Orakei RPI (Fig. 8d). Whilst this inflection is not supported by any noticeable sedimentological change in the facies model, the strong match between Orakei RPI and PISO after the age modelling process (Fig. C6) gives credibility to this behaviour of the age model, although it might be slightly overexaggerating the change given the more robust uncertainty estimations of the tuning points. The Orakei age model agrees well with the AVFaa tephra age (Fig. 10). Except for sample L32, the Orakei age model lies well within the error ranges of the accepted luminescence ages (L15, L14, L35, L65; Fig. 8), despite their limitations. Aside from the outliers (see Sect. 4.2), most radiocarbon ages, all known-age rhyolitic marker tephras, and the Laschamp excursion age agree well with the Orakei age–depth model in its upper half (Fig. 10). The facies units 6 and 7, as well as (parts of) 2 and 3, are, however, much less well constrained. The radiocarbon dating density is less than ideal given the lack of in situ, datable terrestrial macrofossils in these facies units. Furthermore, the absence of macrofossils adds uncertainty to the freshwater reservoir or input of old carbon correction estimates and potentially introduces additional error in the bulk sediment radiocarbon ages of the bulk sediment (Fig. 10). The shape of the age–depth model (steepness, inflection points, angles) represents changes in the sedimentation rate, which are described in Sect. 4.8 and shown in Fig. 11.
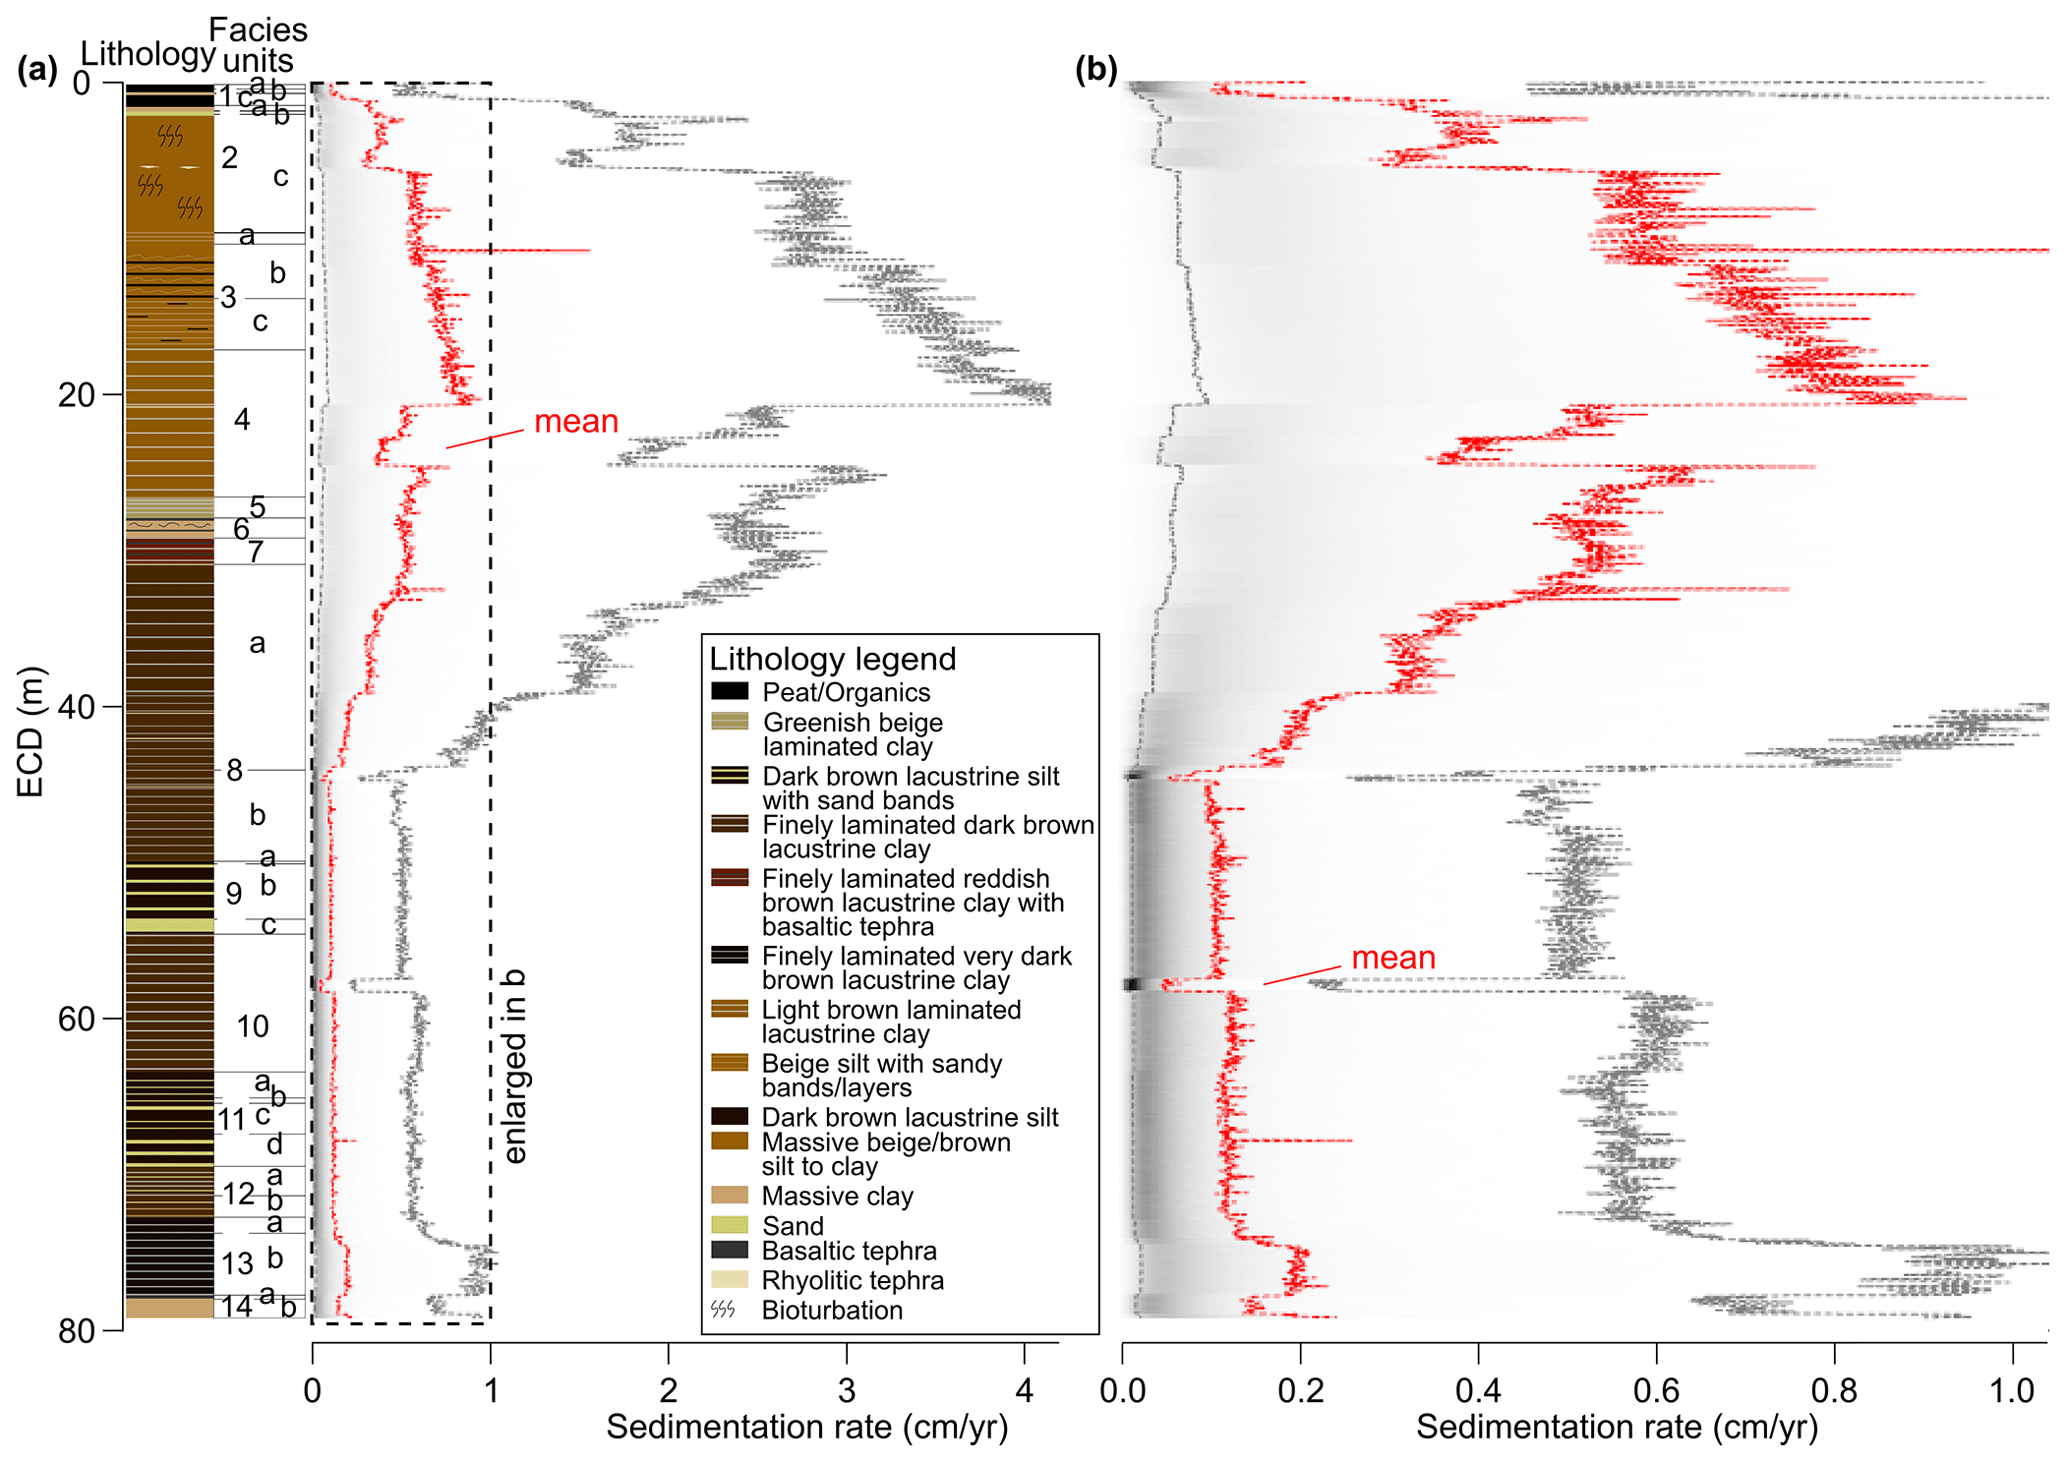
Figure 11(a) Sedimentation rate variation of the Orakei sediment sequence in centimetres per year from Bacon (Blaauw and Christen, 2020). (b) Enlarged 0–1 cm yr−1 interval from (a). Dotted red line marks the mean sedimentation rate; dotted grey lines mark the 95 % confidence limits obtained by Bacon. Simplified lithology and facies units from Peti and Augustinus (2019).
4.8 Sedimentation rate variability
At the Orakei core base the sedimentation rate is ∼ 0.2 cm yr−1 and maintains a fairly constant rate, except for a short-term drop within the finely laminated facies unit 10 caused by the inflection in the age model described in Sect. 4.7 to ∼ 45 m in facies unit 8 (Fig. 11). Stepwise accelerations in sedimentation rate follow and reach ∼ 0.6 cm yr−1 around the boundary between the facies units 8 and 7. An interval with slightly decreased sedimentation rates in facies unit 4 is followed by a jump to the maximum sedimentation rate of ∼ 0.9 cm yr−1 at ∼ 20 m (Fig. 11). A high but slowly decreasing sedimentation rate towards the Orakei core top follows in facies units 3 and 2, with an abrupt drop to ∼ 0.4 cm yr−1 at 8 m (Fig. 11). Another strong decrease in sedimentation rate occurs at the onset of the peat interval (facies unit 1), which records values below 0.2 cm yr−1 (Fig. 11).
The stepwise increase in sedimentation rate at ∼ 45 m nearly coincides with the change in chronometer from RPI tuning points to tephra and 14C ages. Whilst we cannot entirely disprove an influence of the chronometer change on the increase in sedimentation rate, we do note several observations that support this sedimentation rate change being method-independent: (1) it is a stepwise change, not a sudden change, at the exact change point in chronometer. (2) In the interval where both chronometers overlap, albeit very shortly, the Rotoehu tephra and the uppermost RPI tuning point agree well (Fig. 10). (3) The increase in sedimentation rate does occur at the transition from facies unit 8b to 8a. These sub-facies differ in their colour contrasts between the laminations, potentially indicating slightly different chemical composition and thus a slightly different depositional context which may well agree with a different sedimentation rate. (4) Further changes in sedimentation rate, even larger in magnitude than at ∼ 45 m, occur at other positions in the sediment sequence independent of strong lithological or facies changes (and independent of chronometer changes), such as at ∼ 39 m and within facies unit 4 (Fig. 11).
5.1 Strengths and weaknesses of the Orakei age–depth model
A strength of the Orakei chronology lies in its multi-method approach and high dating density and resolution in the post-45 000 years BP range using Bayesian age–depth modelling. The Orakei age model agrees with the well-constrained ages of all rhyolitic tephra marker layers found in the sequence, highlighting another strength of the presented chronology. The fit between the reference PISO-1500 stack (Channell et al., 2009) and the Orakei RPI is robust for the pre-45 000 years BP section of the record (see Fig. C6). Using the Earth's magnetic field strength for relative dating, the Orakei age–depth model is independent of presumptions of climate event synchroneity, which is one of the central questions of studies using this tuning approach to chronology development (Blaauw, 2012). Avoiding this circularity allows reliable intra- and inter-hemispheric comparison of the Orakei sequence to independently dated proxy records of environmental, climatic, and oceanographic change, for example Greenland and Antarctic ice cores (EPICA Community Members, 2006; NGRIP Members, 2004; Rasmussen et al., 2014); marine sediment cores (Carolin et al., 2013); and terrestrial records from Australia (Kemp et al., 2020), South America (Zolitschka et al., 2013), and central and eastern Europe (Lézine et al., 2010; Pickarski et al., 2015; Seelos et al., 2009).
Relative dating using DTW alignment and absolute age control does not require any correction for down-core compaction, which is notoriously difficult to estimate and would have been necessary if the basal age were primarily derived from sedimentation rate extrapolation (Allen, 2000; Bird et al., 2004; Stanley and Hait, 2000). The integration of the DTW-derived tuning points into the Bayesian Bacon age model allows for some flexibility, since the age model does not have to pass directly through the chosen mean of the tuning point if this does not agree with other calculated ages and/or violates the assumptions of smoothness.
The weaknesses of the Orakei chronology include difficulty in assessing the sedimentological context of facies units 5 to 7 and the unknown freshwater reservoir correction for 14C measurements due to an absence of datable macrofossils. This results in higher age uncertainty, complicating the validation of sedimentation rates for this interval. Luminescence dating and the 10Be variation were not as robust as hoped, most likely due to the inferred detrital volcanic source of the pIR-IRSL samples and unaccounted-for variability in catchment sediment processes impacting the beryllium isotope influx.
The DTW tuning approach only works successfully if a long overlap between the reference and query time series is present and is dependent on the absence of (large) gaps in the query record. The Orakei core is characterised by continuous sedimentation since ca. 130 000 years ago. However, the Orakei RPI record shows a gap between 65.8–67.89 m ECD where no samples could be collected. This has potential implications for the alignment of the RPI to the PISO-1500 stack, since it is not known how much of the RPI record is missing. The resolution (and quality) of the alignment achieved through DTW is restricted by the resolution (and quality) of the reference and original datasets. Whilst well suited to the task thanks to continuous sedimentation, the PISO-1500 stack has a resolution of 1000 years per measurement (Channell et al., 2009), whereas the Orakei RPI record has a theoretical average resolution of one measurement per 168 years, although it is likely smoothed by magnetisation acquisition in the sediments. Even though our approach of assigning errors to the ages of the tuning points considers the fit between the tuned curves, a more rigorous procedure to error estimation is desired for future applications. Furthermore, our approach relies on an approximate age at or near the core base, which is necessary to estimate the total time interval contained in the record and thus to select the corresponding section in the reference data for reliable tuning of both curves. In our study, this is achieved by the AVFaa tephra for most of the Orakei sediment sequence and allows a fairly well constrained basal age by extrapolation. Our random selection of a finite number of DTW tuning points may influence the resulting age model. However, additional tuning points reduce the flexibility of the Bacon age modelling process, which may result in overfitting of the age–depth model and unrealistically precise confidence ranges for the final model.
5.2 Validation of the final age model
In order to assess the validity of the Orakei sediment core chronology, we expect variability in sedimentation rate to be in agreement with the observed lithological changes. The major difference in sedimentation rate of the upper ∼ 40 m of the core, which has higher rates than the lower ∼ 40 m of the Orakei core (Fig. 11), supports this hypothesis, since we observe a dominance of finely laminated sediment in much of the lower facies units 8–14, and much thicker laminations (unit 4) and fluvially in-washed sand (unit 3) in the upper part of the core. However, there is no significant link between lithology and sedimentation rate in other parts of the core as observed in the near-constant sedimentation rate from the core base into the sandy facies unit 11 at ∼ 65 m ECD, and again in the alternating silts and sands of facies unit 9, and up to ∼ 45 m ECD in facies unit 8. All visible mass movement deposits have been removed from the sequence on the ECD used in this study; after removal of the sand bands (visible mass movement deposits), a constant sedimentation rate for the remaining matrix of laminated clay and sand does not conflict with observed lithological changes. The slowest sedimentation rate of the entire sequence is observed in an interval of very fine laminations (facies unit 10; Fig. 11), which is consistent with slow sedimentation in a quiet depositional environment dominated by in-lake production of biological particles and characterised by the absence of mass movement deposits indicative of instantaneous deposition. However, fine laminations observed below 70 m ECD in facies units 12 and 13 (Figs. 2, 11) also include multiple (mostly thin) mass movement deposits. Whilst these have been removed from the sequence, it is plausible that some thin mass movement deposits (< 1 mm thickness) could have been missed, thereby explaining the faster sedimentation rate compared to facies unit 10 (Fig. 11).
The age model in the lower interval of the Orakei sediment sequence is additionally supported by the agreement within 2σ between the tephra ages of Rotoehu (45 100 ± 3300 (2σ) years; Danišík et al., 2012) and AVFaa (119 200 ± 5600 (2σ) years; Leonard et al., 2017) and the solution obtained by the DTW alignment between the Orakei RPI and PISO (ca. 47 000 years and ca. 124 500 years, respectively; see Fig. 10).
The laminated sediment interval above ∼ 45 m ECD is characterised by a uniform acceleration in sedimentation consistent with the thicker laminations in this section of the core. Comparing sedimentation rate with the lithology is hampered by our poor understanding of the depositional mechanisms associated with facies units 5 to 7. A fast sedimentation rate is consistent with facies unit 6, a massive unit containing reworked basaltic tephra, which may indicate near-instantaneous deposition and thicker laminations in facies unit 5. Generally, higher sedimentation rates agree well with thick laminations in facies unit 4, fluvial sand bands in facies unit 3, and massive deposition in a shallow lake indicated by bioturbation in facies unit 2 (Fig. 11). Very slow sedimentation inferred for facies unit 1 is reasonable considering that this is peat.
Overall, whilst limitations in any age–depth model are inevitable, we nevertheless find that the Orakei sedimentation rates agree reasonably well with the observed changes in sedimentary facies types and properties. Furthermore, our study improves substantially on the simple extrapolation age models previously employed in the AVF maar sequences, especially > 40 000 years BP (e.g. Molloy et al., 2009).
The importance of reliable chronologies for palaeo-environmental studies in lake sediment sequences cannot be overemphasised. For this reason, we developed a detailed chronology for the Orakei maar lake sediment sequence, the highest-resolution and most complete lake sediment record spanning the LGI from the terrestrial SW Pacific region. The chronology developed here significantly improves upon previous age models for AVF maar lakes, which until now have largely relied on sedimentation rate inter- and extrapolation, especially beyond the radiocarbon dating limit (e.g. Molloy et al., 2009; Hopkins et al., 2017). Our robust and high-resolution age model provides the essential chronological framework for event-based palaeo-environmental and palaeoclimatic reconstruction over the LGI without which such work would not be feasible.
Our study also highlighted difficulties involved in combining absolute ages with relative dating of RPI variability in Bayesian age modelling. Estimating a realistic error for the tuning points so as to incorporate them into the Bayesian age model is problematic and potentially underestimates the 95 % confidence range of the age model.
Several recommendations for future development of chronologies in comparable sediment sequences are proposed from this study:
-
RPI variations are suitable for correlative dating with other records due to their independence from assumptions on climatic (a)synchroneity between regions, as long as independent age control is provided. In different depositional settings this may be successfully supplemented or replaced by beryllium-10 variability, since both are indicators of magnetic field strength.
-
We cannot overemphasise the need for continuous and high-resolution sediment sequences for relative dating (tuning). Gaps in the proxy record complicate the alignment and increase age uncertainties. An improved uncertainty assessment of the DTW alignment and resulting tuning points is necessary.
-
Sediment facies without datable, in situ terrestrial macrofossils for radiocarbon dating are not well dated and suffer from the unknown estimation of the freshwater reservoir correction.
Despite the issues encountered with the development of the Orakei maar lake chronology, such an approach is necessary to enable robust records of past climate, especially at the event level, during the LGI that are well known from Northern Hemisphere equivalents such as Eifel maar lakes (Seelos et al., 2009). The ability to develop lake sedimentation chronologies independently of inferred links with climate events is of paramount importance for the reliable extraction of palaeoclimate signals that can then be correlated with similar and well-dated time series of climate change in both intra- and interhemispheric contexts. Only then can we produce the critical missing links between past climate drivers and subsequent events from the poles to the Equator from which to develop a robust understanding of the teleconnections and associated leads and lags within the Southern Hemisphere and global climate system.
The Orakei maar lake work is ongoing with further refinement of the Orakei chronology and palaeo-environmental and palaeoclimatic record expected and application of a similar approach to other select maar lake records from the AVF. It is anticipated that the Orakei maar chronology will form the master chronology against which those developed from the other AVF maar lakes will be compared. Such a comparison is particularly feasible given the widespread and excellent preservation of marker tephra layers in each maar lake sediment sequence that has already been used to develop the complete record of distal tephra to have reached the Auckland area, both from the TVZ and from the local AVF volcanic centre eruptions. The ability of the multi-method approach detailed here to produce robust ages for tephra and hence volcanic events beyond the limit of the radiocarbon method is of importance for reliable determination of past eruption frequencies and hazards associated with both the local AVF volcanic centres and those sourced from the TVZ. This is of particular relevance given the fact that the city of Auckland is built around 53 basaltic volcanoes, the last of which erupted only 504 ± 5 (2σ) cal years BP (Needham et al., 2011).
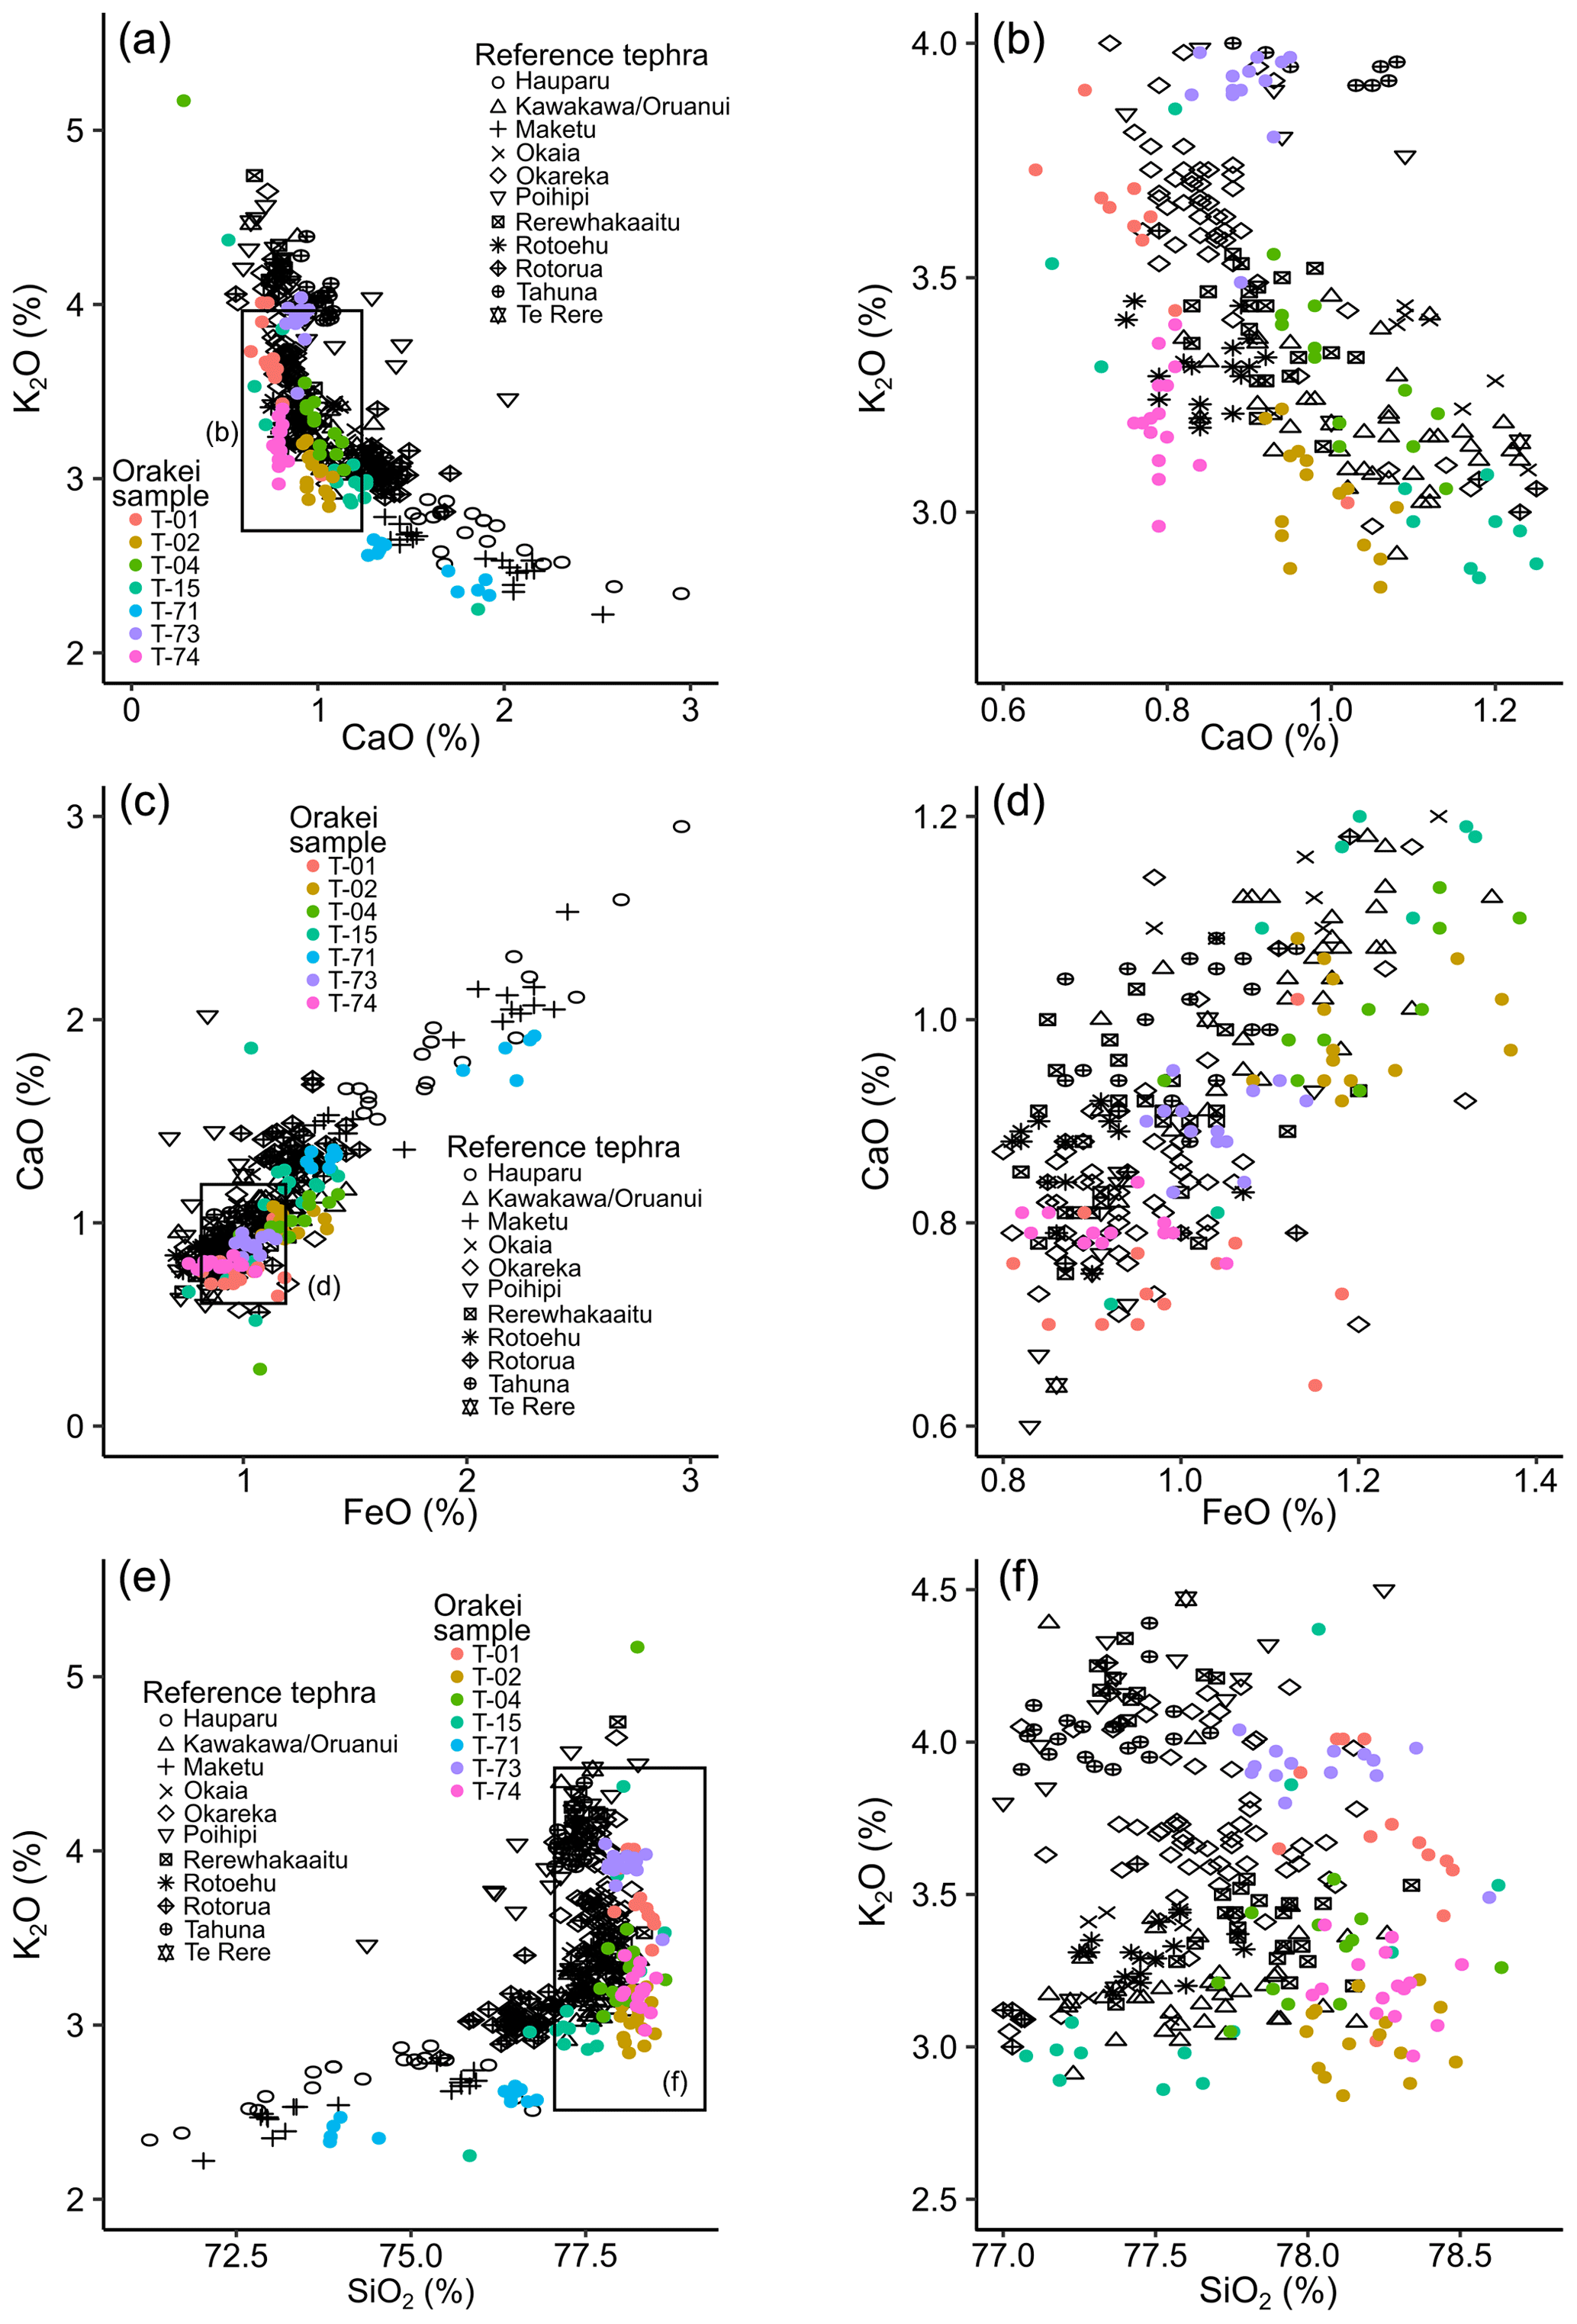
Figure A1Major element oxide bivariate plots of reference tephra data (black) and Orakei samples (colourful points). Marked insets are enlarged on the right-hand side.
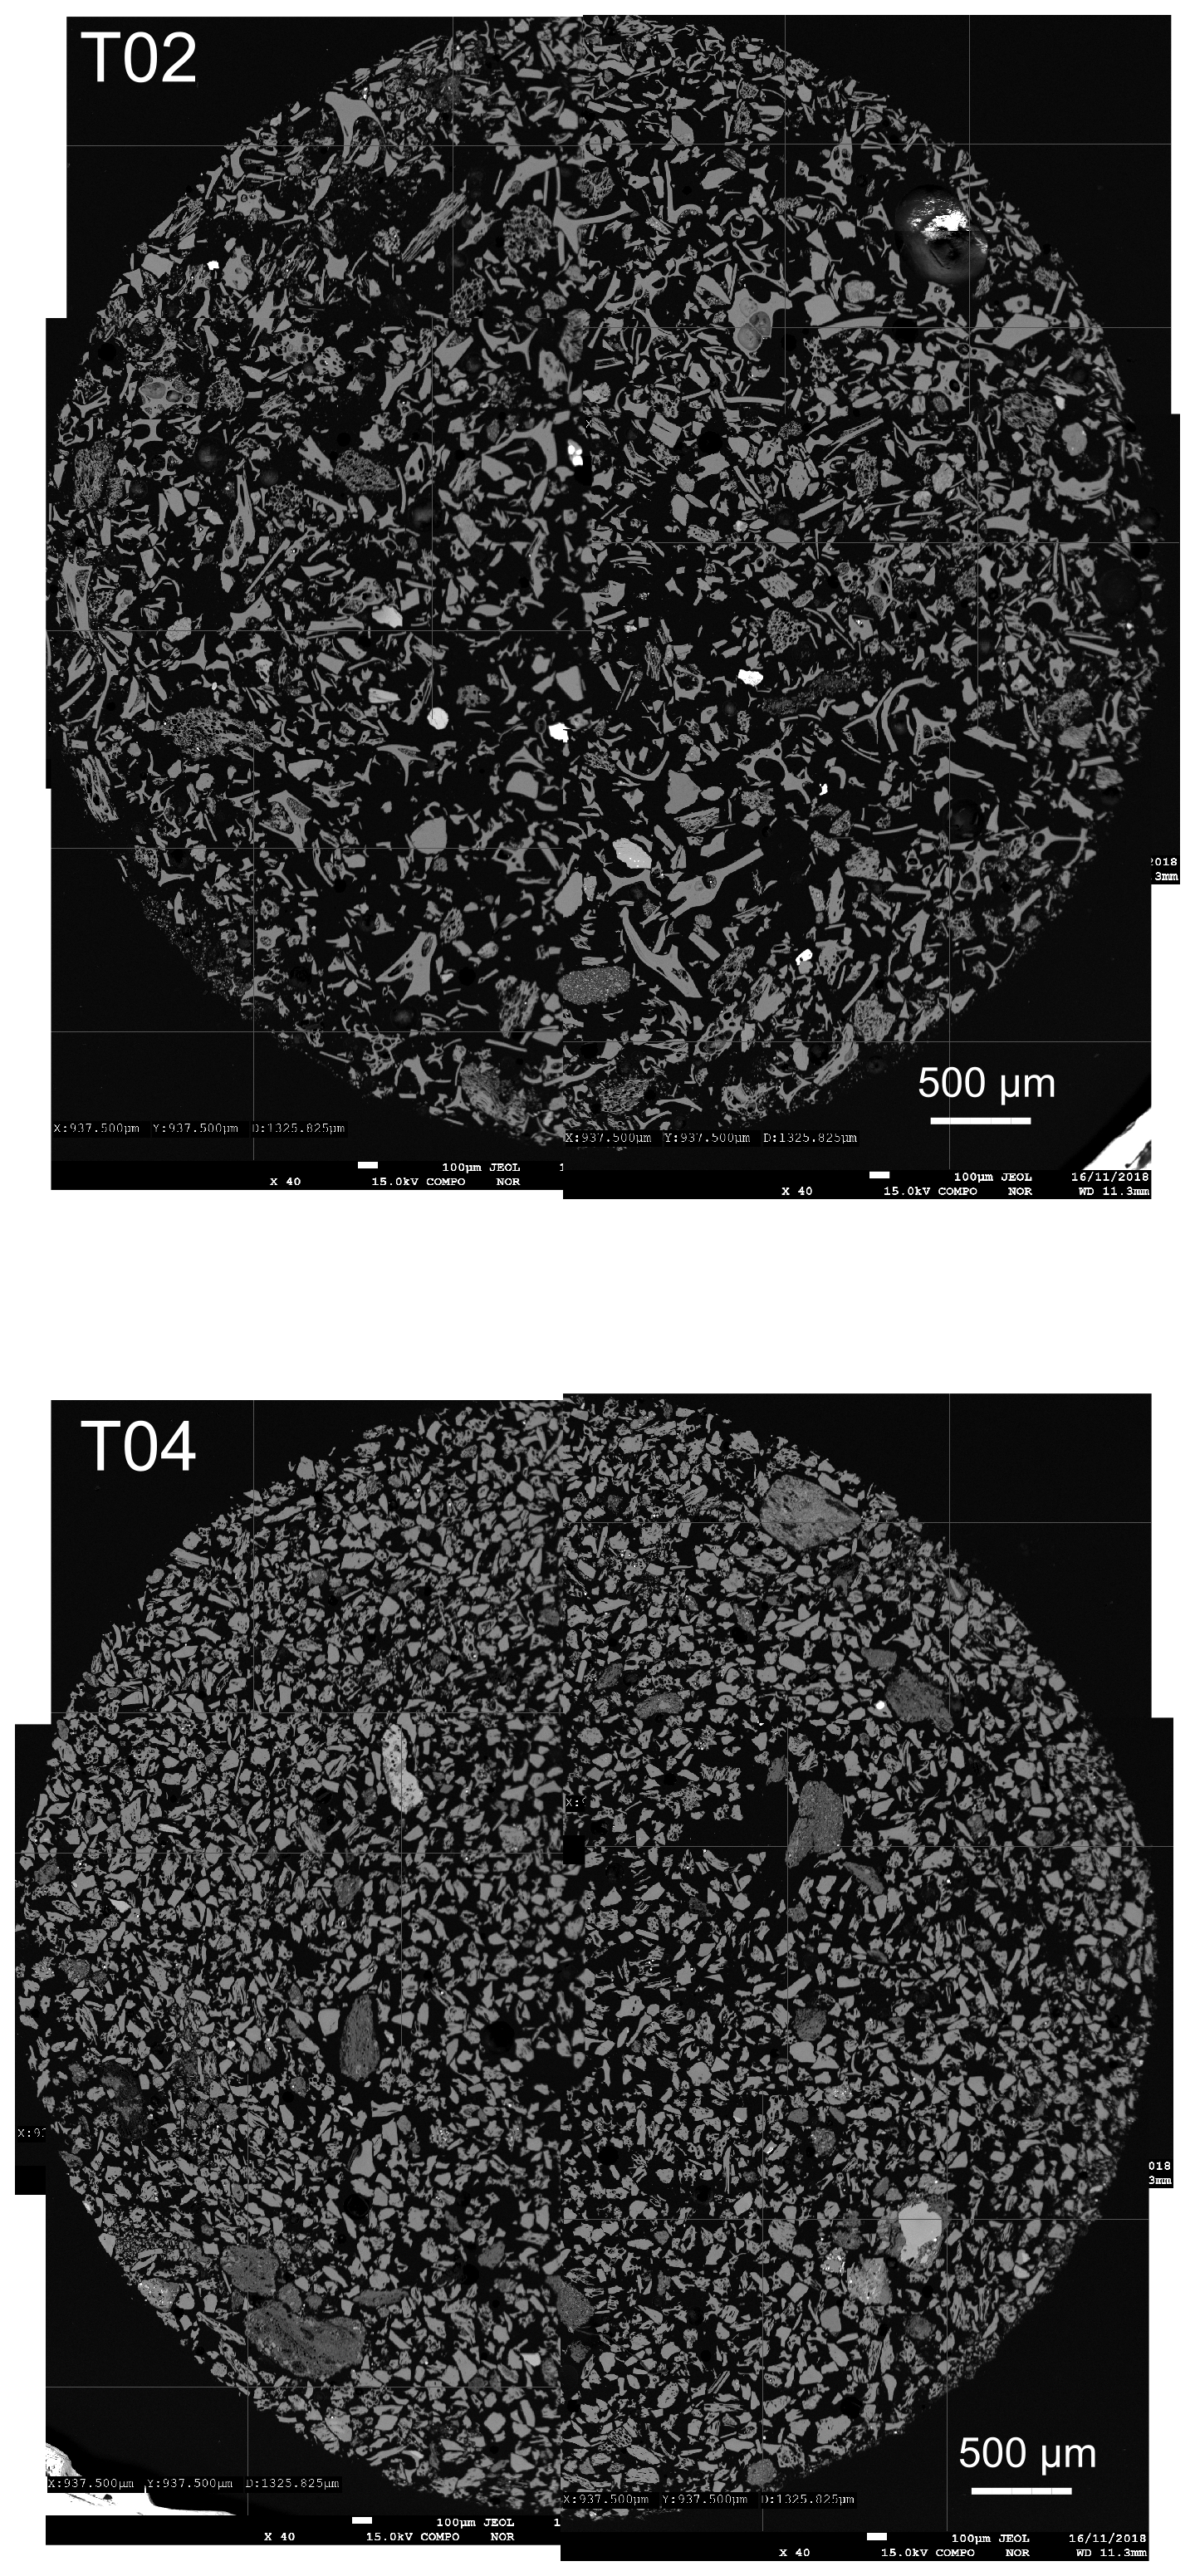
Figure A2Backscatter images of samples T02 and T04. The large cuspate shards with preserved thin bubble walls in T02 signify a very large, very explosive eruption, in comparison to the small blocky shards in T04, suggesting a smaller, less explosive eruption.

Figure A3Lower section of the Orakei 2016 composite sequence highlighting the position of the T66 layer between the stratigraphically matched position of the AVF1 horizon and the primary eruptive material from the Orakei volcanic centre correlated to tephra layer AVFa by Hopkins et al. (2017).
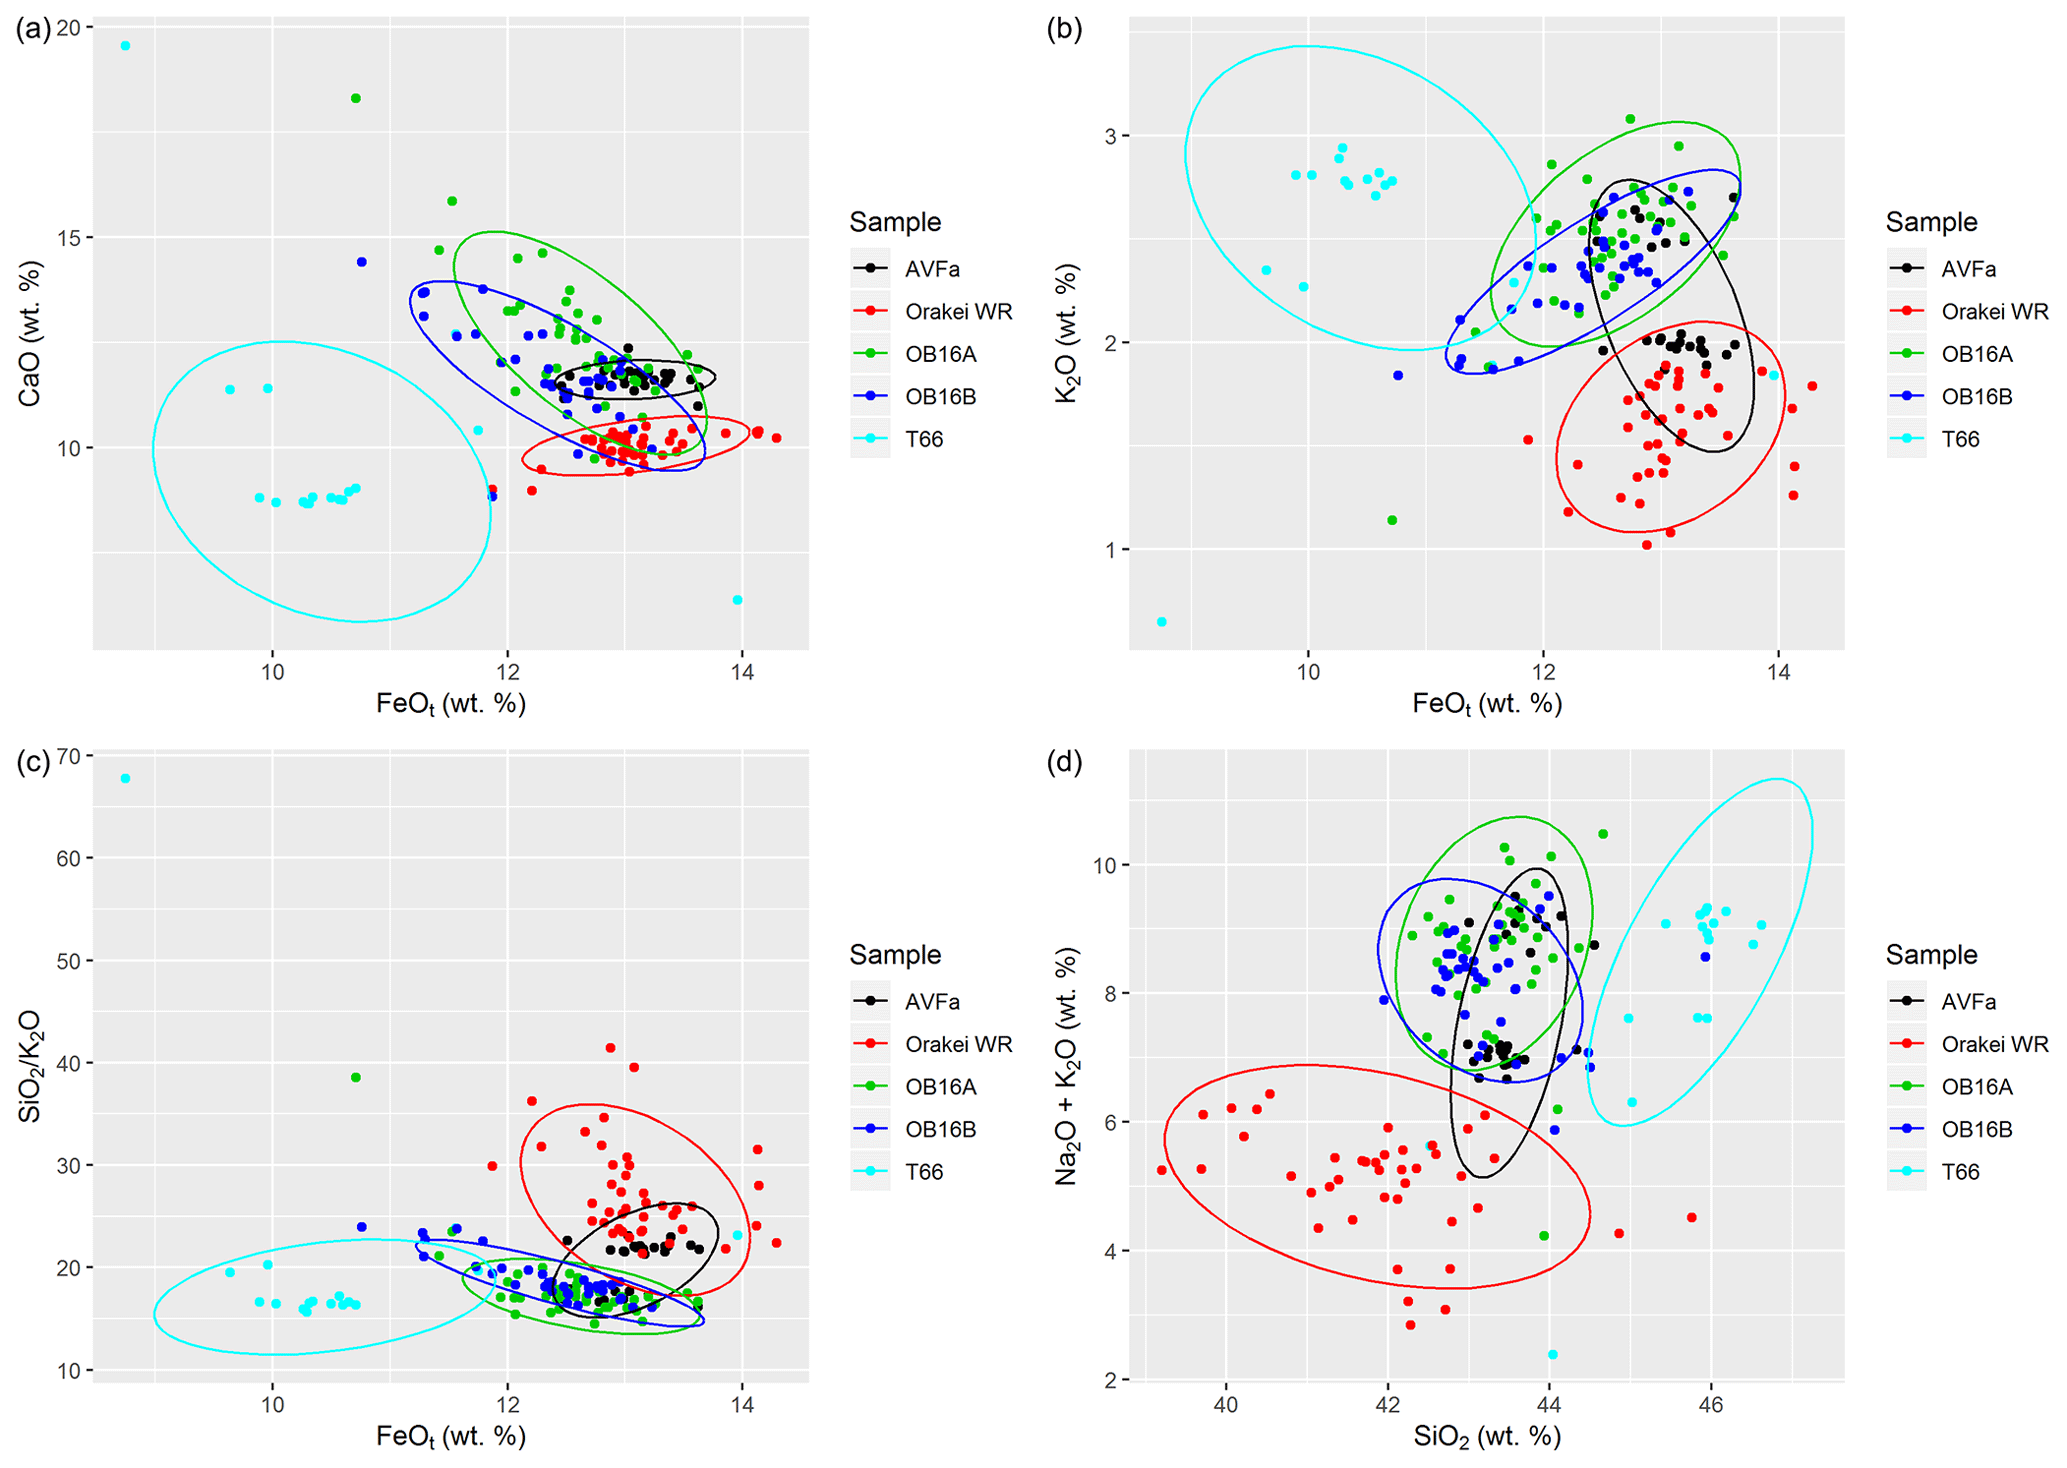
Figure A4Comparison of sample T66 to AVFa (tephra layer from Glover Park core; correlated to the Orakei eruptive centre; Hopkins et al., 2017), Orakei whole-rock (WR) data, and eruptive material from Orakei in the A and B cores of this study (OB16A, OB16B). Note that T66 overlaps with neither of these samples, suggesting that this is a tephra layer from a different eruption. Ellipses follow a multivariate t distribution (Fox and Weisberg, 2011).
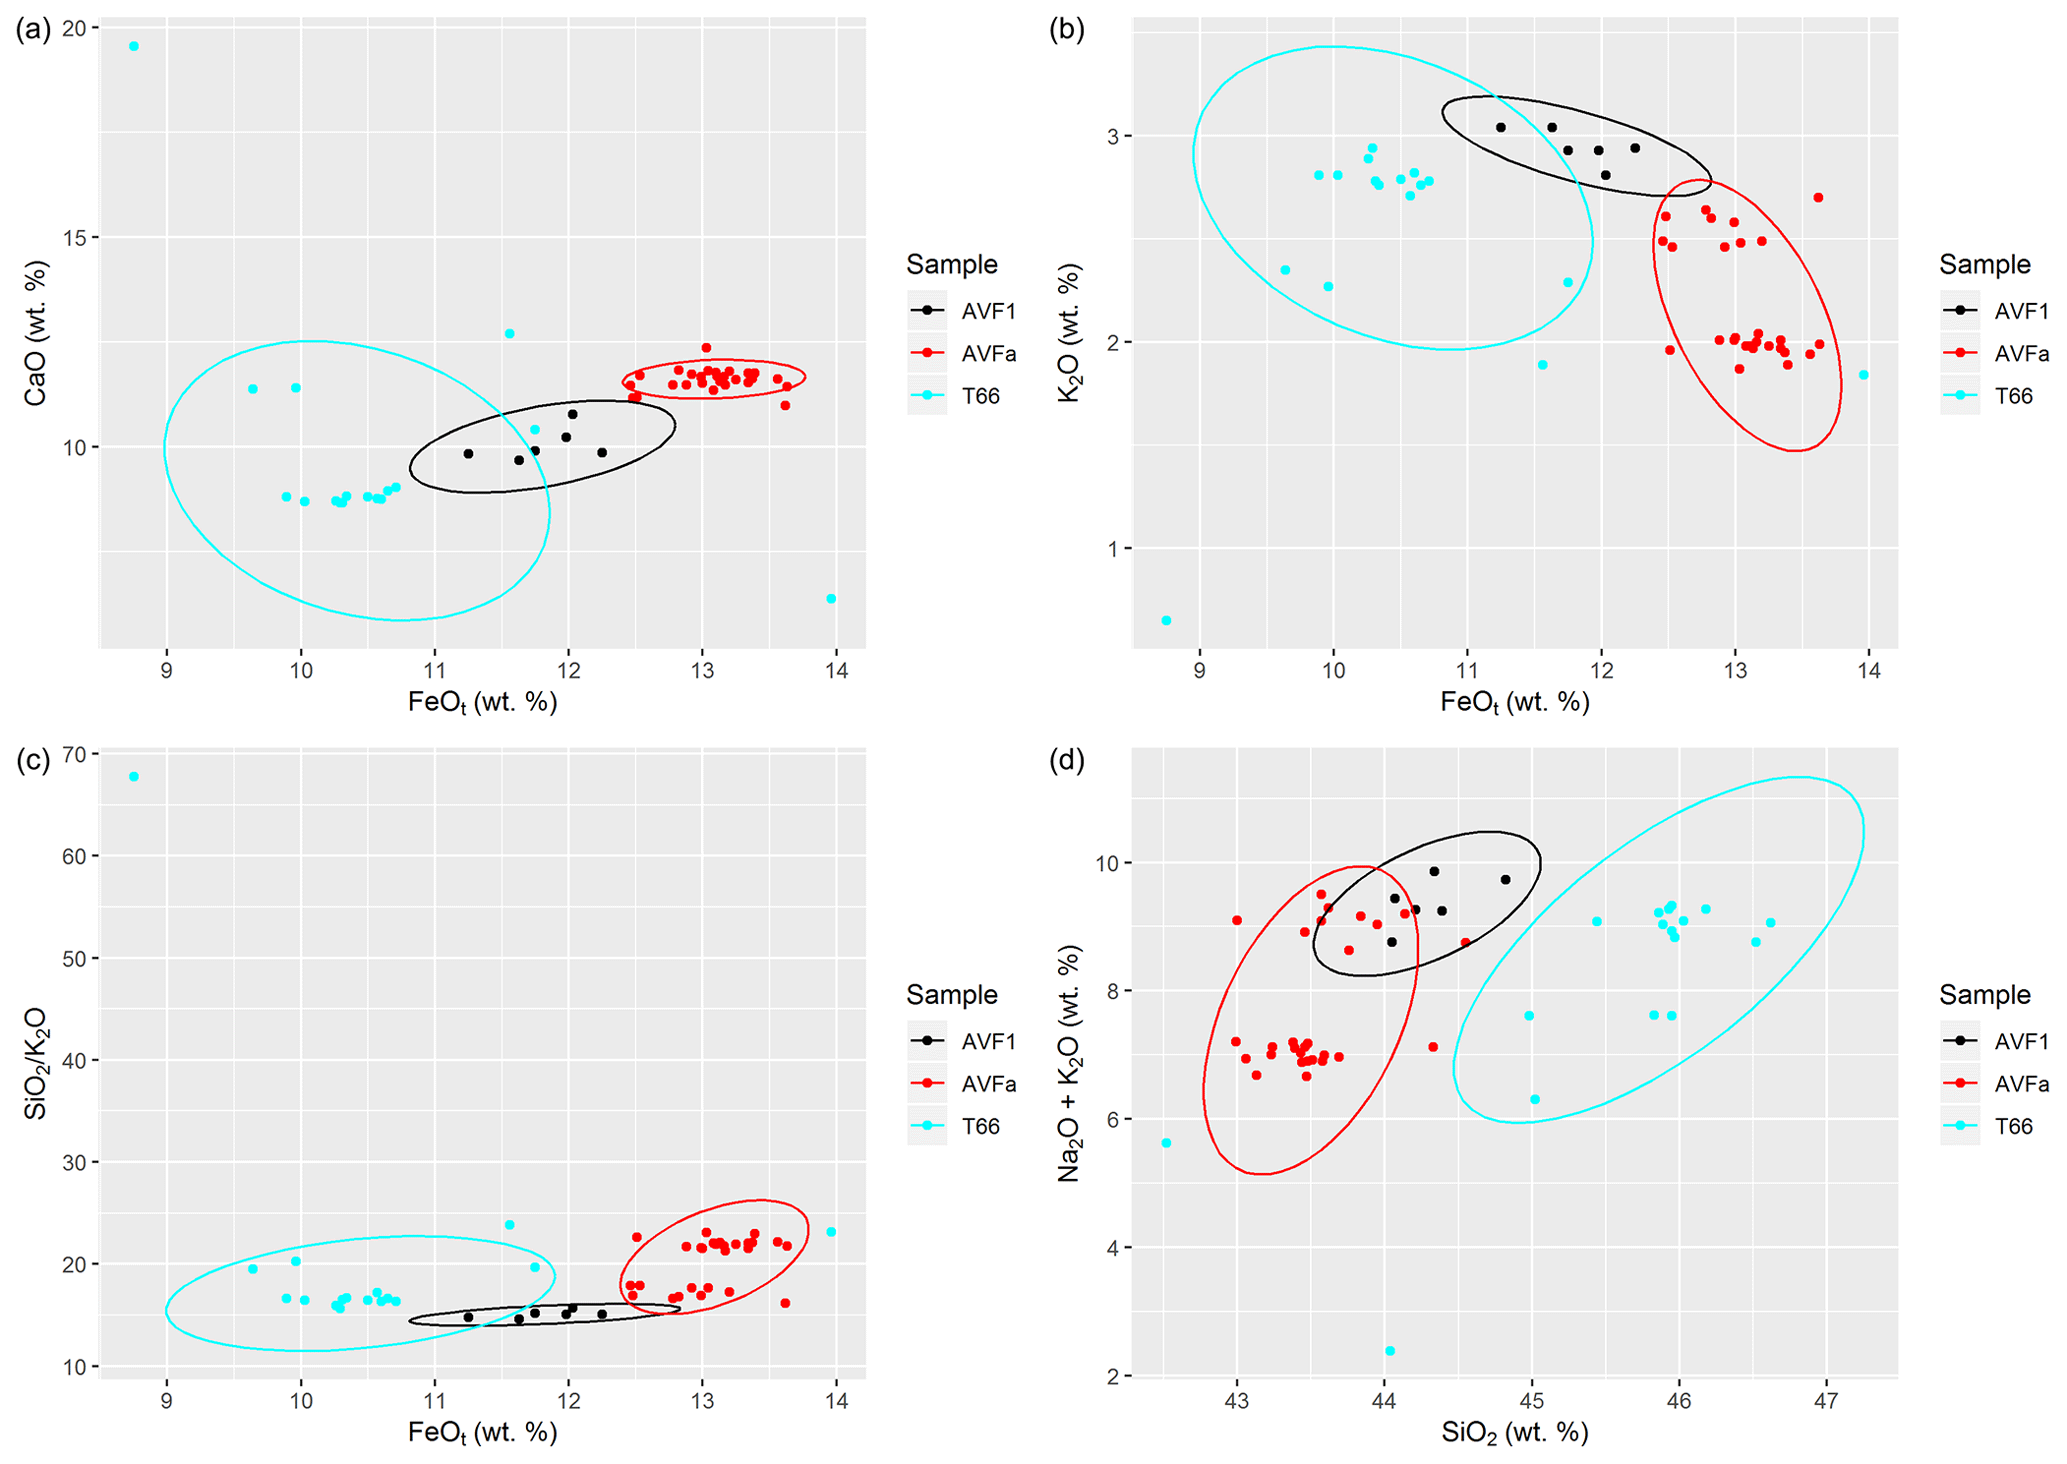
Figure A5Comparison of sample T66 to AVF1 (tephra layer in Orakei 2007 core: Hopkins et al., 2015; Molloy et al., 2009; correlated to Domain: Hopkins et al., 2017) and AVFa (tephra layer from Glover Park core correlated to the Orakei volcanic centre; Hopkins et al., 2015, 2017). Note that T66 overlaps with neither layer and thus is considered an eruption not previously found in the AVF maar cores. Ellipses follow a multivariate t distribution (Fox and Weisberg, 2011).
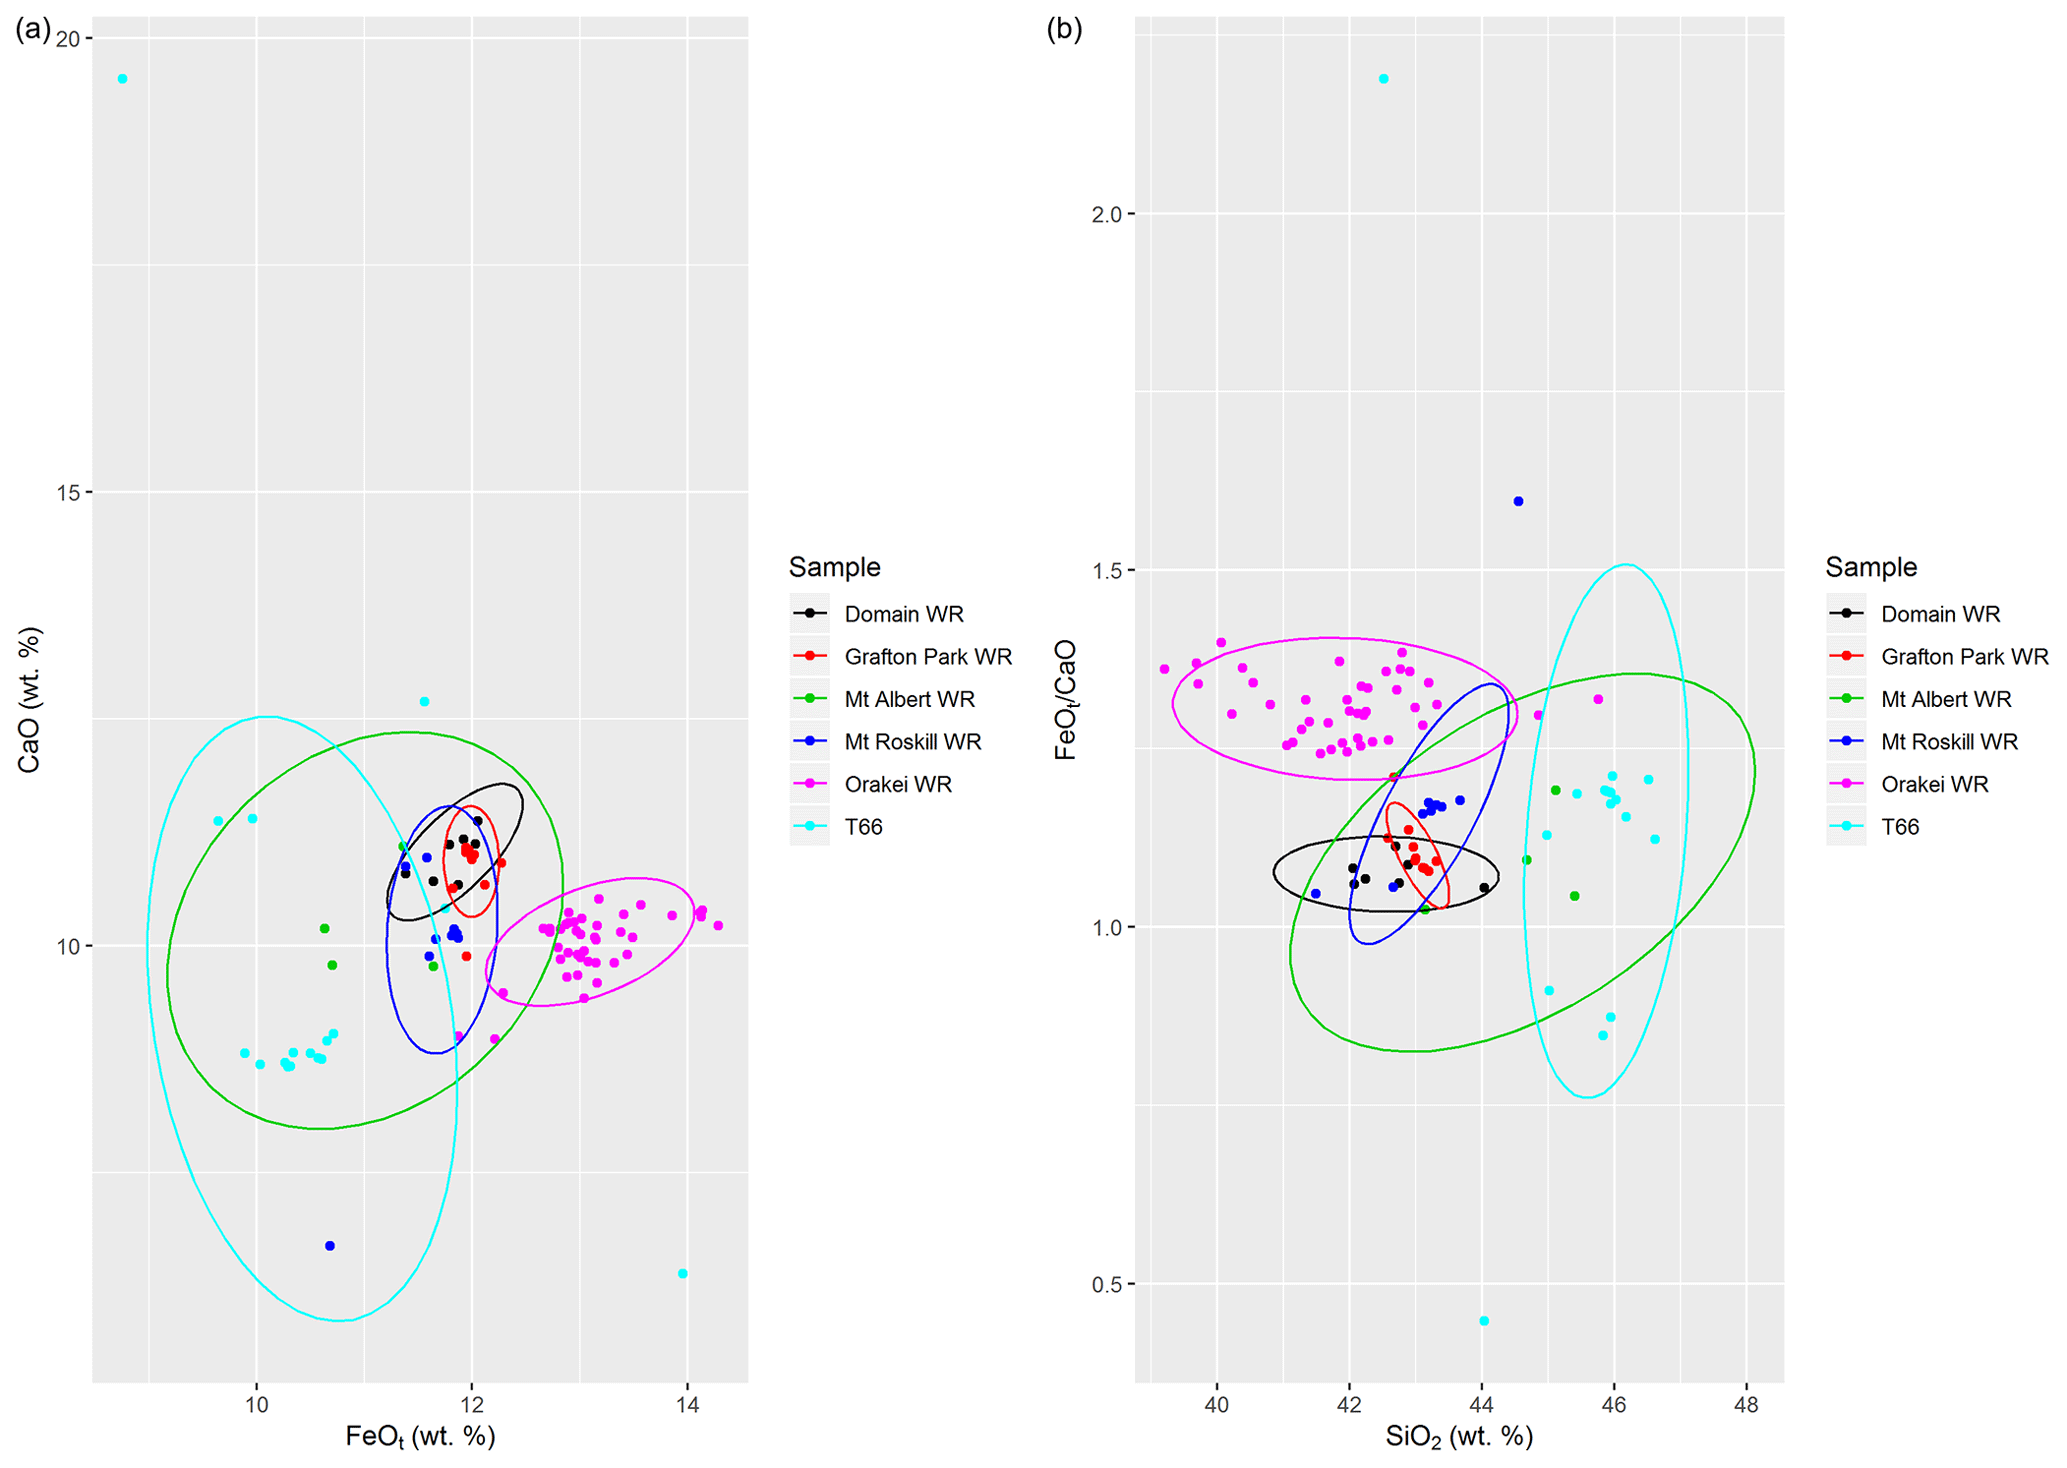
Figure A6Matching of T66 to possible source volcanic centres (WR: whole-rock data) for this tephra layer. Despite complications of correlating glass shard EMPA chemistry to whole-rock geochemistry, the most likely source volcanic centre candidate for tephra T66 is Mt Albert as only the data and 95 % confidence ellipse of Mt Albert WR data overlap with the T66 tephra EMPA data. Ellipses follow a multivariate t distribution (Fox and Weisberg, 2011).
B1 Methods
We undertook luminescence dating of polymineral fine-grained (4–11 µm) material from selected samples of the Orakei core, focusing on the feldspar signal. The fine-grained fraction was targeted in order to maximise the percentage component of non-volcanic, distally sourced dust, which is more likely to yield a reliable luminescence signal. Additionally, coarser-grained (63–90 µm) aliquots of two selected samples (L15 and L20) were run.
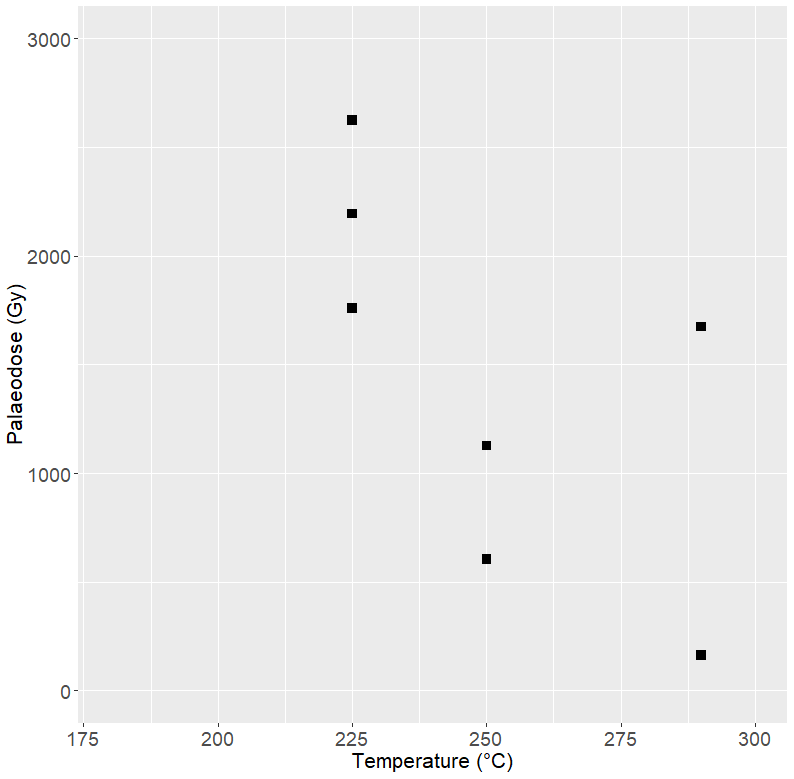
Figure B1Preheat plateau for fine-grained sample L15 (A0111), showing substantial scatter between aliquots measured with the same preheat temperature, as well as between all aliquots.
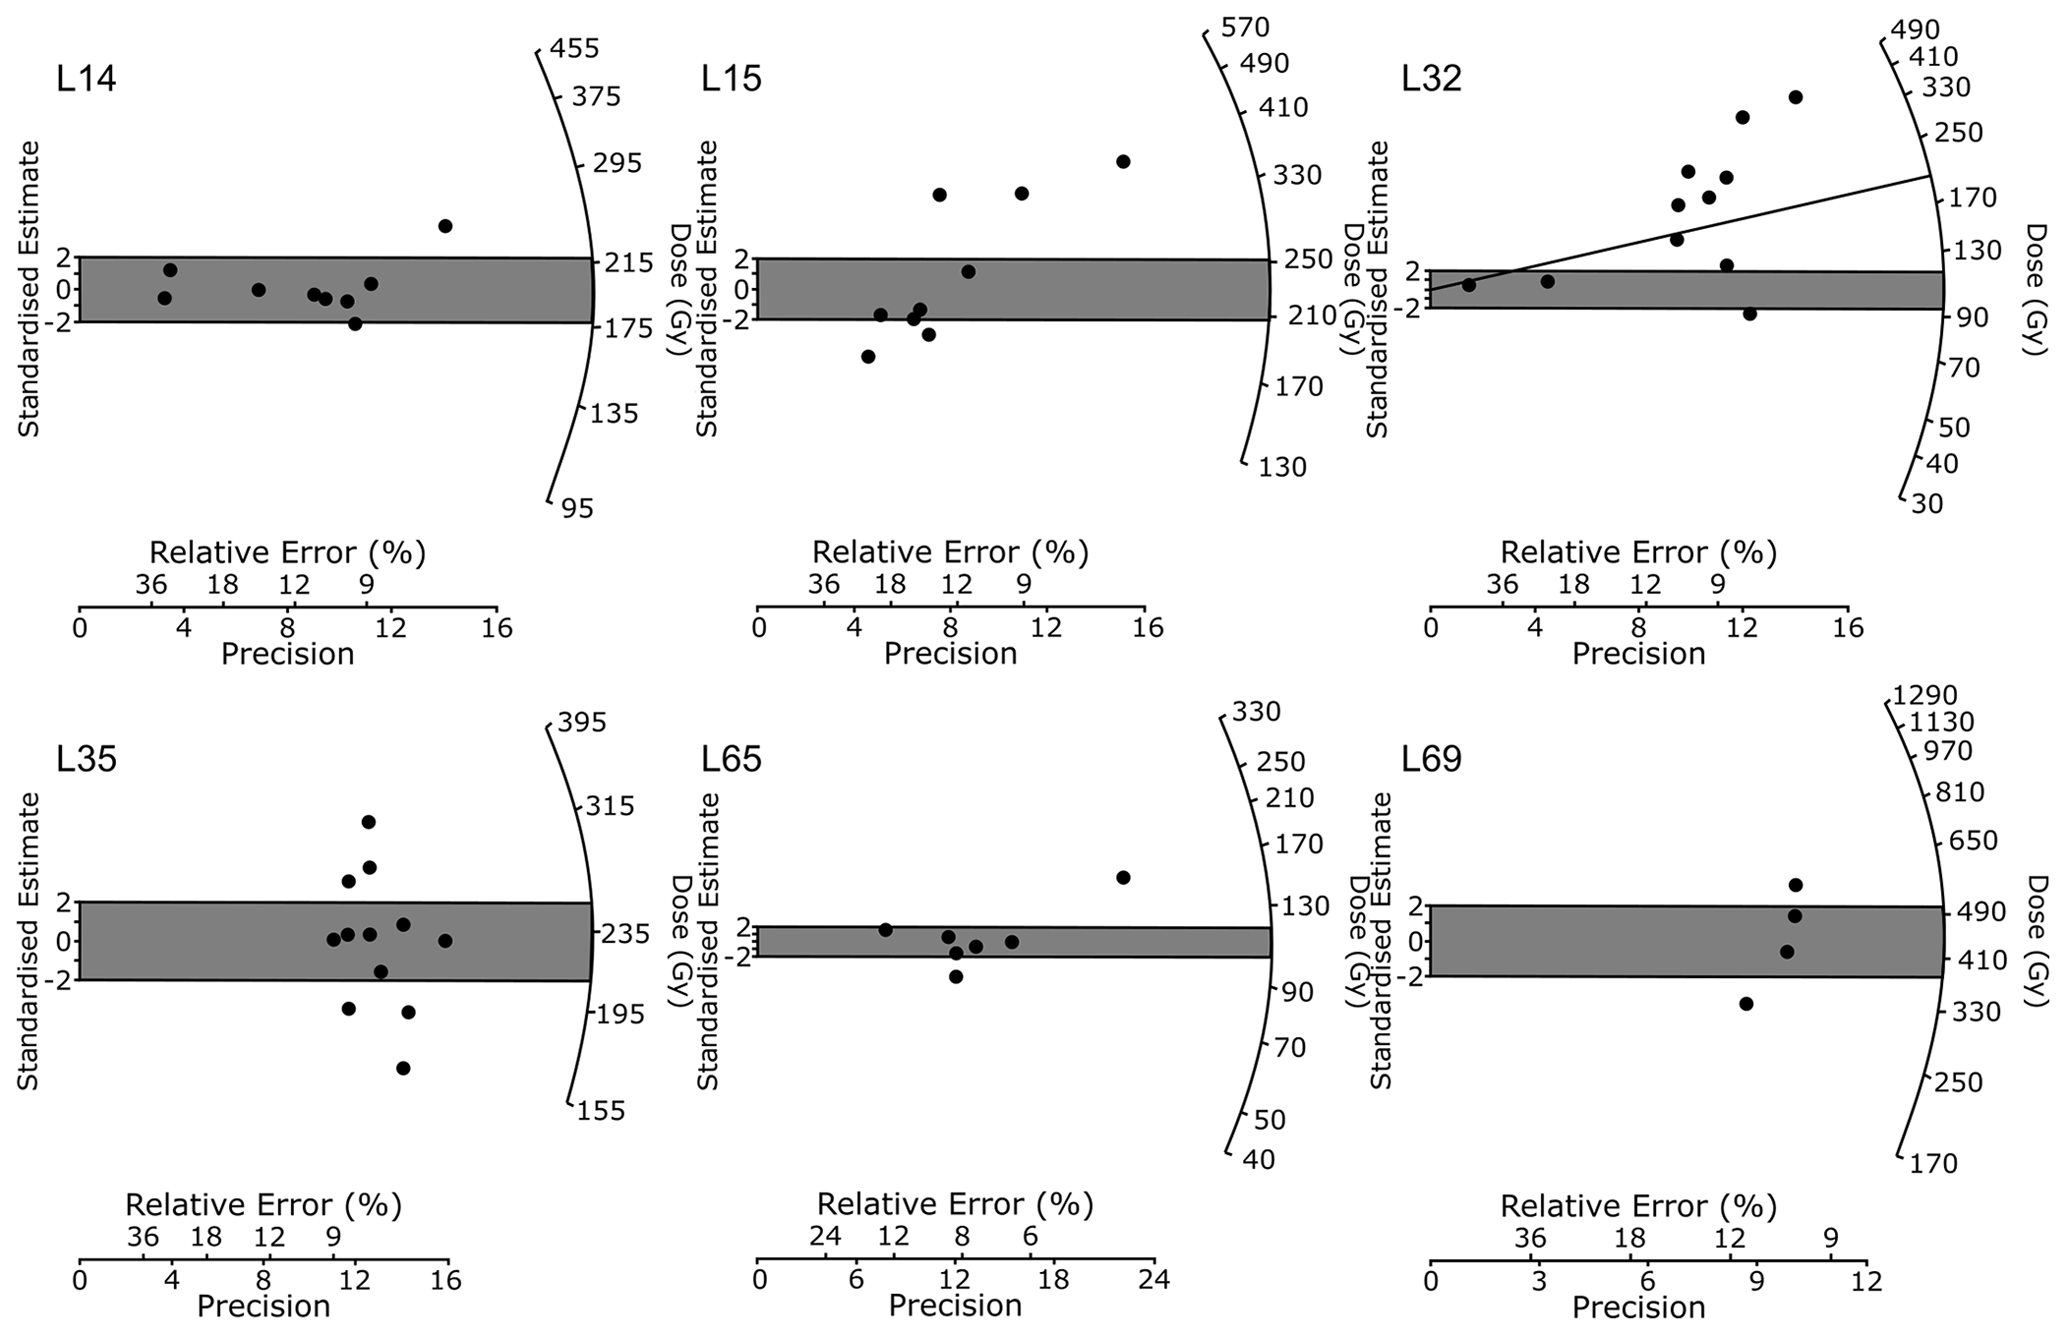
Figure B2Radial plots showing the dose distributions of accepted aliquots for all fine-grained samples, as well as the calculated central age (shaded area). In the case of L32 (A0115), the shaded area corresponds to the minimum age calculated using the MAM, and the line corresponds to the equivalent dose, which would yield the expected age according to a preliminary core age model.
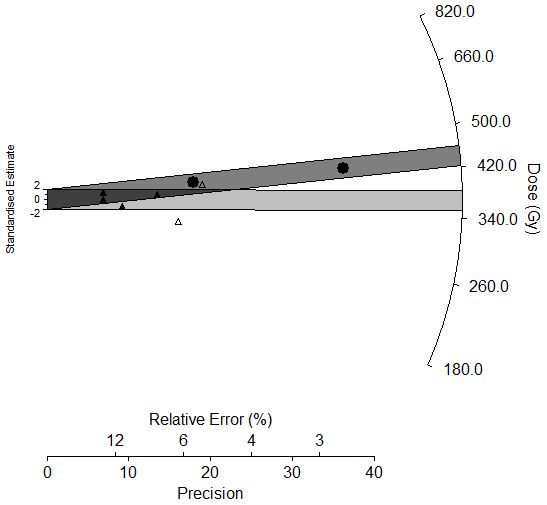
Figure B3Radial plot showing the doses of accepted aliquots for the coarser-grained sample L20 (A0113). Aliquots run using the IR50 preheat are shown as black circles, with the darker grey shaded area; those run using the higher-temperature preheat are shown as open triangles, and the CAM age shaded in lighter grey.

Figure B4Illustration of luminescence characteristics of the Orakei core sediments using the pIR-IRSL290 protocol: (a) typical natural pIR-IRSL290 signal decay for datable sample L14 (A0110); (b) change in sensitivity response to test dose over the regenerative dose cycles for sample L35 (A0116), showing reduction in effective charge transfer throughout the protocol in the typical sample; and (c) dose-response curve for representative aliquot of sample L35 (A0116), showing exponential fit but high Lx ∕ Tx value for the zero-dose step, illustrating a high degree of thermal transfer in the sediments.
Table B1Summary of luminescence characteristics arising from pIR-IRSL290 protocol measurements.

The sediment cores were stored wrapped in light-proof plastic at 4 ∘C until being opened and subsampled for luminescence dating under subdued orange light at the University of Auckland (New Zealand), taking care to only sample the innermost parts of the core for dating. Samples were taken to ensure maximal spread over the > 45 000-year interval of the Orakei sequence following a preliminary age model by extrapolation of the sedimentation rate calculated between the two oldest identified and dated tephra layers (Tahuna and Rotoehu; see Table 2). Luminescence dating sample pre-treatment for polymineral fine grains (4–11 µm) was undertaken at the Max Planck Institute for Chemistry (Mainz, Germany) following published methods (Mauz and Lang, 2004) involving hydrochloric acid and hydrogen peroxide digestion, sieving, and settling. Enough material remained after digestion, sieving, and settling for production of 15 aliquots of the polymineral fine-grained component, except for sample L69 (A0119), which produced 10 aliquots. Each aliquot was pipetted onto 10 mm diameter stainless steel cups for De measurements. Additionally, K-feldspar was extracted from the coarser-grained material (90–115 µm) of sample L20 (A0113) by density separation using lithium heterotungstate. Large aliquots (8 mm diameter) were prepared from this material for equivalent-dose measurement.
Equivalent dose was measured on the fine-grained samples using the pIR-IRSL290 protocol, stimulated at 290 ∘C to minimise the potential for feldspar signal fading (Buylaert et al., 2012; Thiel et al., 2011, 2014), and based on equivocal results of the preheat plateau test which showed substantial inter-aliquot scatter irrespective of measurement temperature (Fig. B1). For the coarse-grained sample L20 (A0113), 12 aliquots were run using the pIR-IRSL290 protocol using an IR preheat temperature of 50 ∘C, and another 12 aliquots using the same protocol with an IR preheat temperature of 200 ∘C, in order to compare luminescence characteristics in response to changing parameters. De measurements were undertaken using an automated Risø TL-DA-20 reader using IR LEDs for illumination, with the resulting signal detected by an EMPI 9235QA photomultiplier tube with a D410 filter for feldspar (Bøtter-Jensen, 1997; Bøtter-Jensen et al., 1999). Irradiation was provided by a calibrated 90Sr ∕ 90Y beta source (Bøtter-Jensen et al., 2000). An internal alpha contribution of 0.12 was assumed for the samples, in order to account for the lower luminescence efficiency of alpha radiation relative to the beta and gamma components (Rees-Jones, 1995; Rees-Jones and Tite, 1997). The accepted aliquots of all samples yielded either normal distributions, which were typically very wide, or skewed distributions indicative of incomplete bleaching. In the first case, De values were calculated using the CAM (Galbraith et al., 1999); in the latter, De was calculated using the MAM (Olley et al., 2004) (Fig. B2). For the coarse-grained sample L20 (A0113), 2 out of 12 aliquots run with an IR50 preheat were not saturated with respect to dose, in comparison with 6 out of 12 aliquots from the IR200 preheat. Whilst this suggests better results using the higher preheat, the resulting equivalent doses were similar, as illustrated in the radial plot in Fig. B3.
Samples for dose rate determination were digested with HNO3 and HF at ANSTO (Sydney, Australia). U and Th concentrations were then obtained from these solutions on an Agilent 7700 ICP-MS at the Mass Spectrometry Equipment Centre (University of Auckland, New Zealand). K concentrations were obtained from XRF measurements on fusion discs on a SPECTRO X-LAB 2000 polarising energy-dispersive X-ray fluorescence spectrometer at the University of Waikato (New Zealand). The measured activities of the radioactive elements K, Th, and U were converted to dose rates using published factors (Adamiec and Aitken, 1998; Guerin et al., 2011). Dose rate attenuation was estimated using published values (Mejdahl, 1979) and the core sediment moisture content. Water content was estimated assuming saturation of the lacustrine sediments, taking into account water loss in the laboratory subsequent to core extraction (Lowick and Preusser, 2009). Substantial uncertainties in water content were included in order to mitigate potential inaccuracies in the dose rate calculations as a result of desiccation. Cosmic-ray dose rates were calculated based on sediment density estimates, altitude, latitude, longitude, and depth, following Prescott and Hutton (1994); these values were negligible (< 0.01 Gy kyr−1) due to the depth within the lake sediments.
B2 Results
B2.1 Finer-grained samples
Results were obtained for the six samples measured in the series and for the coarse-grained sample L20 (A0113). Samples L18, L20, and L29 (A0112, A0113, and A0114 respectively) yielded insufficient natural signal for equivalent-dose estimation (note that these are the youngest samples according to the depth, which explains why less charge has accumulated to date). The remarkably low sensitivity for feldspars may suggest a primary igneous origin. The remaining samples provided ages, although the luminescence characteristics were not optimal for age determination, as discussed below. Ages could only be calculated by relaxing the acceptance criteria for analysis; the results, however, broadly conform (within 2σ error) to the expected ages based on the projected age model. The polymineral fine-grained samples from the Orakei core do not exhibit optimal characteristics for the pIR-IRSL290 protocol. The samples are typically very dim, yielding generally low signal counts (Fig. B4a) and low sensitivity. Late background subtraction was used to optimise the signal measured. The sensitivity to test dose over the regenerative cycles of the pIR-IRSL290 protocol typically decreased to 20 %–30 % of the test dose sensitivity following the natural signal measurement and remained fairly constant over subsequent cycles (Fig. B4b). Recuperation was very high, yielding values of up to 50 %, and recycling ratios were variable but often exceeded 20 % divergence from unity (Table B1). Dose-response curves could often, but not always, be fitted to an exponential or exponential-plus-linear function and rarely passed through the origin due to the high degree of thermal transfer (Fig. B4c). In order to obtain any results at all, aliquots were accepted if dose-response curves could be reasonably fitted; threshold criteria for other quality control measurements such as recycling ratios, recuperation, and sensitivity change were (by necessity) relaxed.
Additional quality control measurements were undertaken on sample L15 (A0111), which yielded the largest amount of datable material and therefore the possibility to make extra aliquots for these tests. A dose-recovery test on two aliquots of this sample provided a dose-recovery ratio of 1.03 (Fig. B5), although it should be noted that thermal transfer remained high and the applied dose (ca. 56 Gy) was substantially lower than the measured equivalent dose (ca. 230 Gy) (the magnitude of the applied dose can result in different dose-recovery behaviours; Doerschner et al., 2016, and references therein). There was no appreciable residual dose measured in sample L15 (A0111) (Fig. B5), therefore indicating that correction for inherited prior dose in the less easily bleached pIR signal is not necessary (Buylaert et al., 2012).
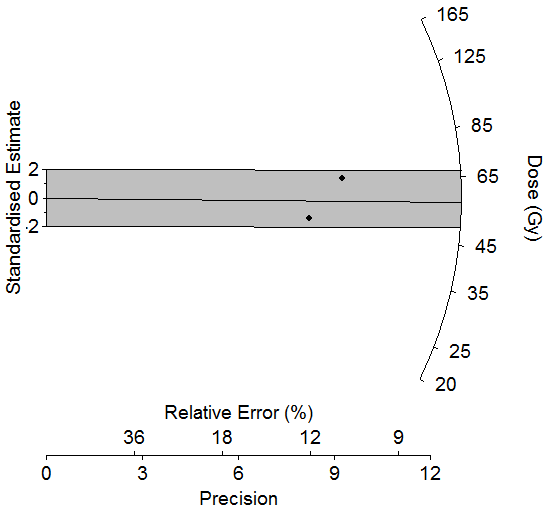
Figure B5Dose-recovery distribution from two aliquots of sample L15 (A0111). The shaded region corresponds to the standard deviation of the measured CAM dose; the line corresponds to the applied radiation dose.
Table B2Results for the coarse-grained sample L20 (A0113) of different IRSL preheat temperatures.
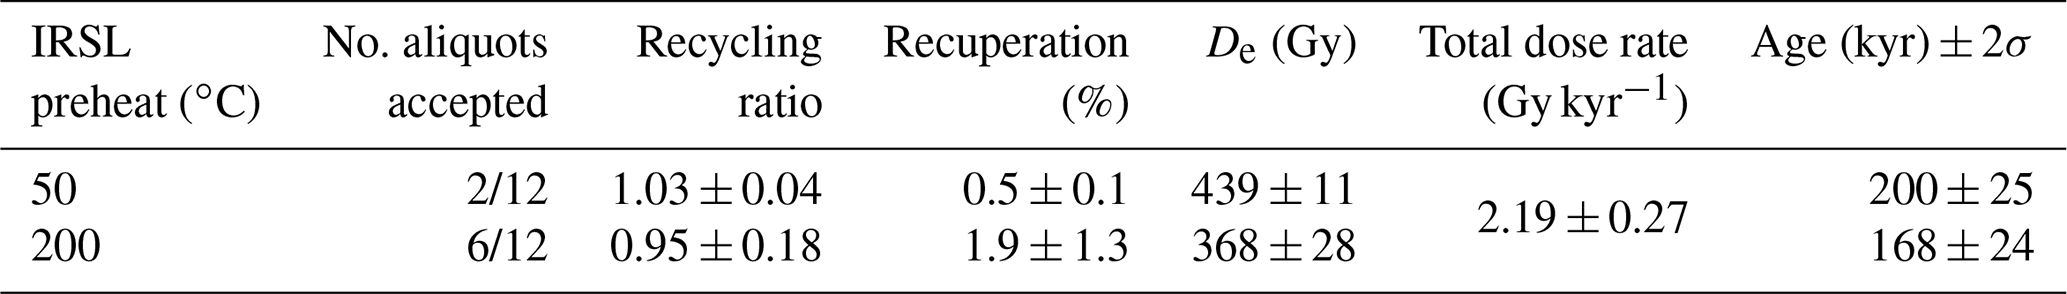
Residual dose tests were undertaken on sample L15. Residual dose in the order of 24 Gy was observed in one aliquot of sample L15 (A0111). Not only negligible residual signal but also poor dose-response characteristics were observed in the remaining two aliquots measured. Residual dose corrections of 24 Gy were made on the Orakei samples on the basis of the L15 aliquot, resulting in younger ages than first calculated. The residual-corrected age results are listed in italics in Table 4 of the main text.
B2.2 Coarse-grain sample L20 (A0113)
The results for the comparative study of different IRSL preheat temperatures for the coarse-grained sample L20 (A0113) are summarised in Table B2.
By comparison with the fine-grained measurements, the coarse-grained sample exhibited better characteristics: namely, a brighter signal and overall better recycling and thermal transfer. However, sensitivity changes between regenerative doses remained substantial, whilst the equivalent doses were comparable between the aliquots measured with both preheats (Fig. B3). Given the small number of aliquots accepted, we cannot confirm if this younger result is systematic or otherwise. Perhaps most critically, both sets of measurements yield ages that substantially overestimate the predicted age for this sample of ca. 70 kyr and overestimate all ages calculated from fine grains. This result may suggest that the coarser grains were not completely bleached during transport, and it therefore suggests two different sediment transport mechanisms for the fine and coarse grains. Ultimately, we cannot use the coarse-grained results for dating the Orakei core.
Additional figures with palaeomagnetic data.
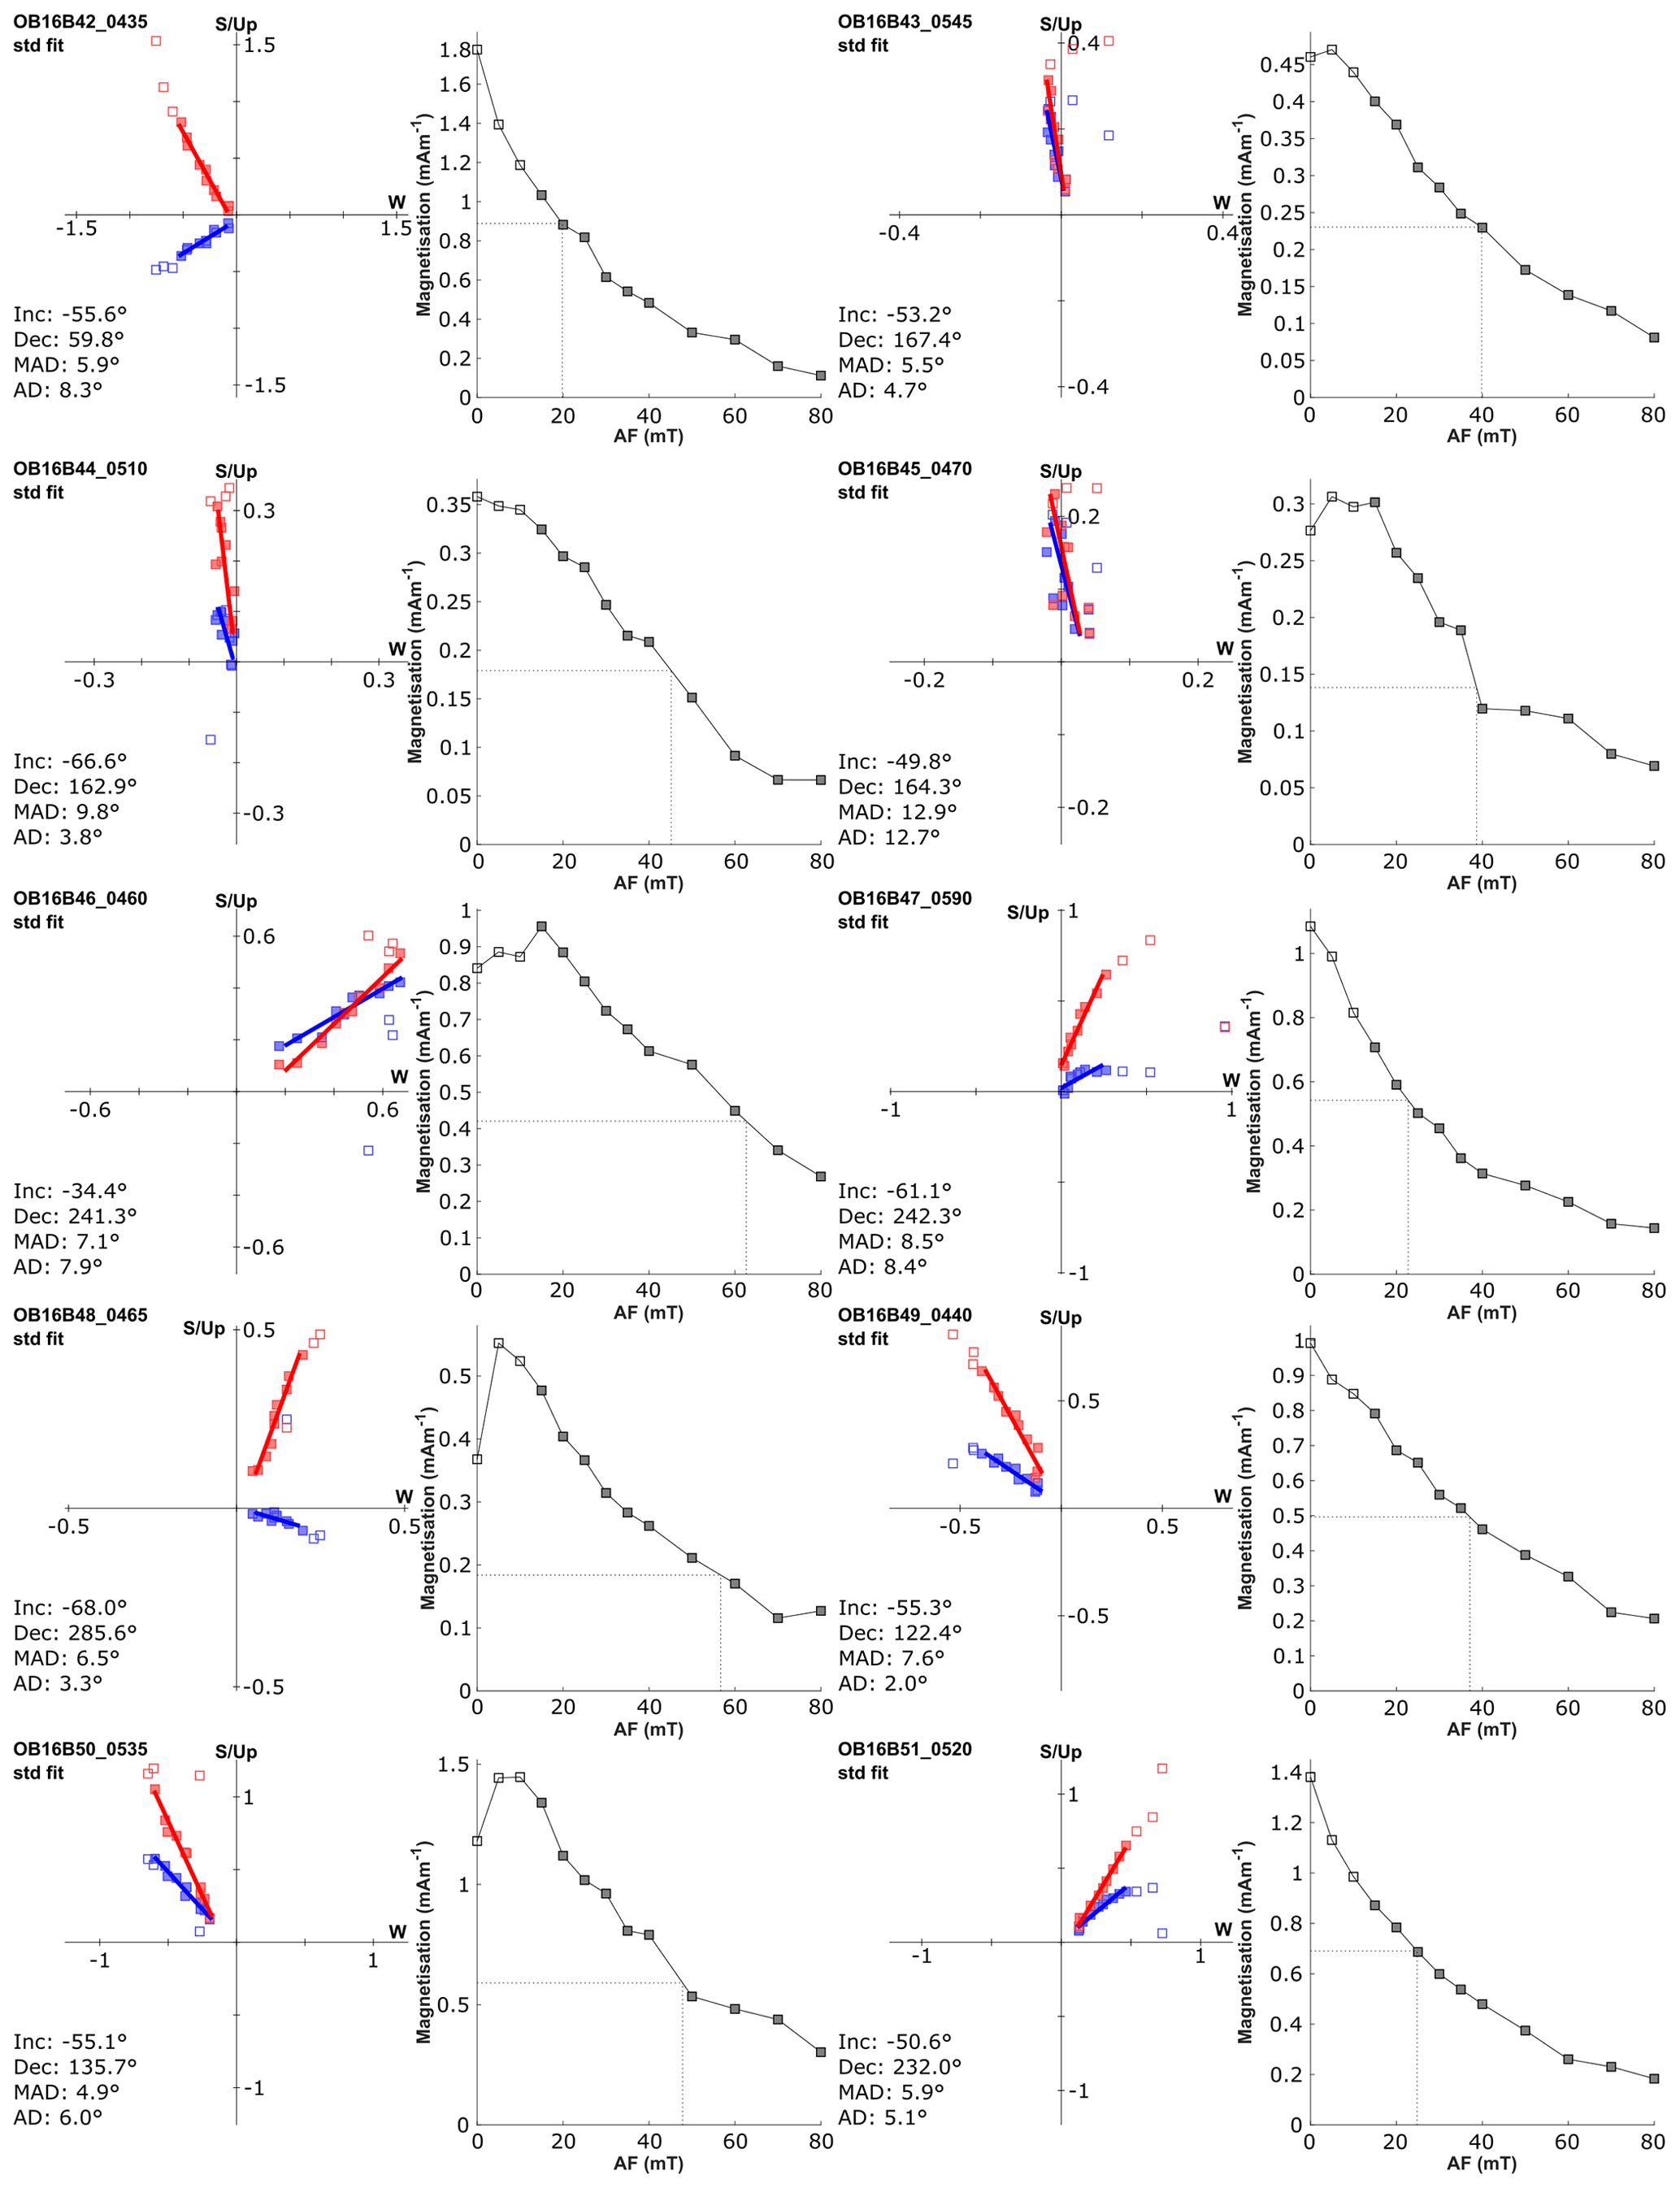
Figure C1Orthogonal plots and intensity of magnetisation after stepwise demagnetisation of pilot samples OB16B42-51.

Figure C2Orthogonal plots and intensity of magnetisation after stepwise demagnetisation of pilot samples OB16B52-61.
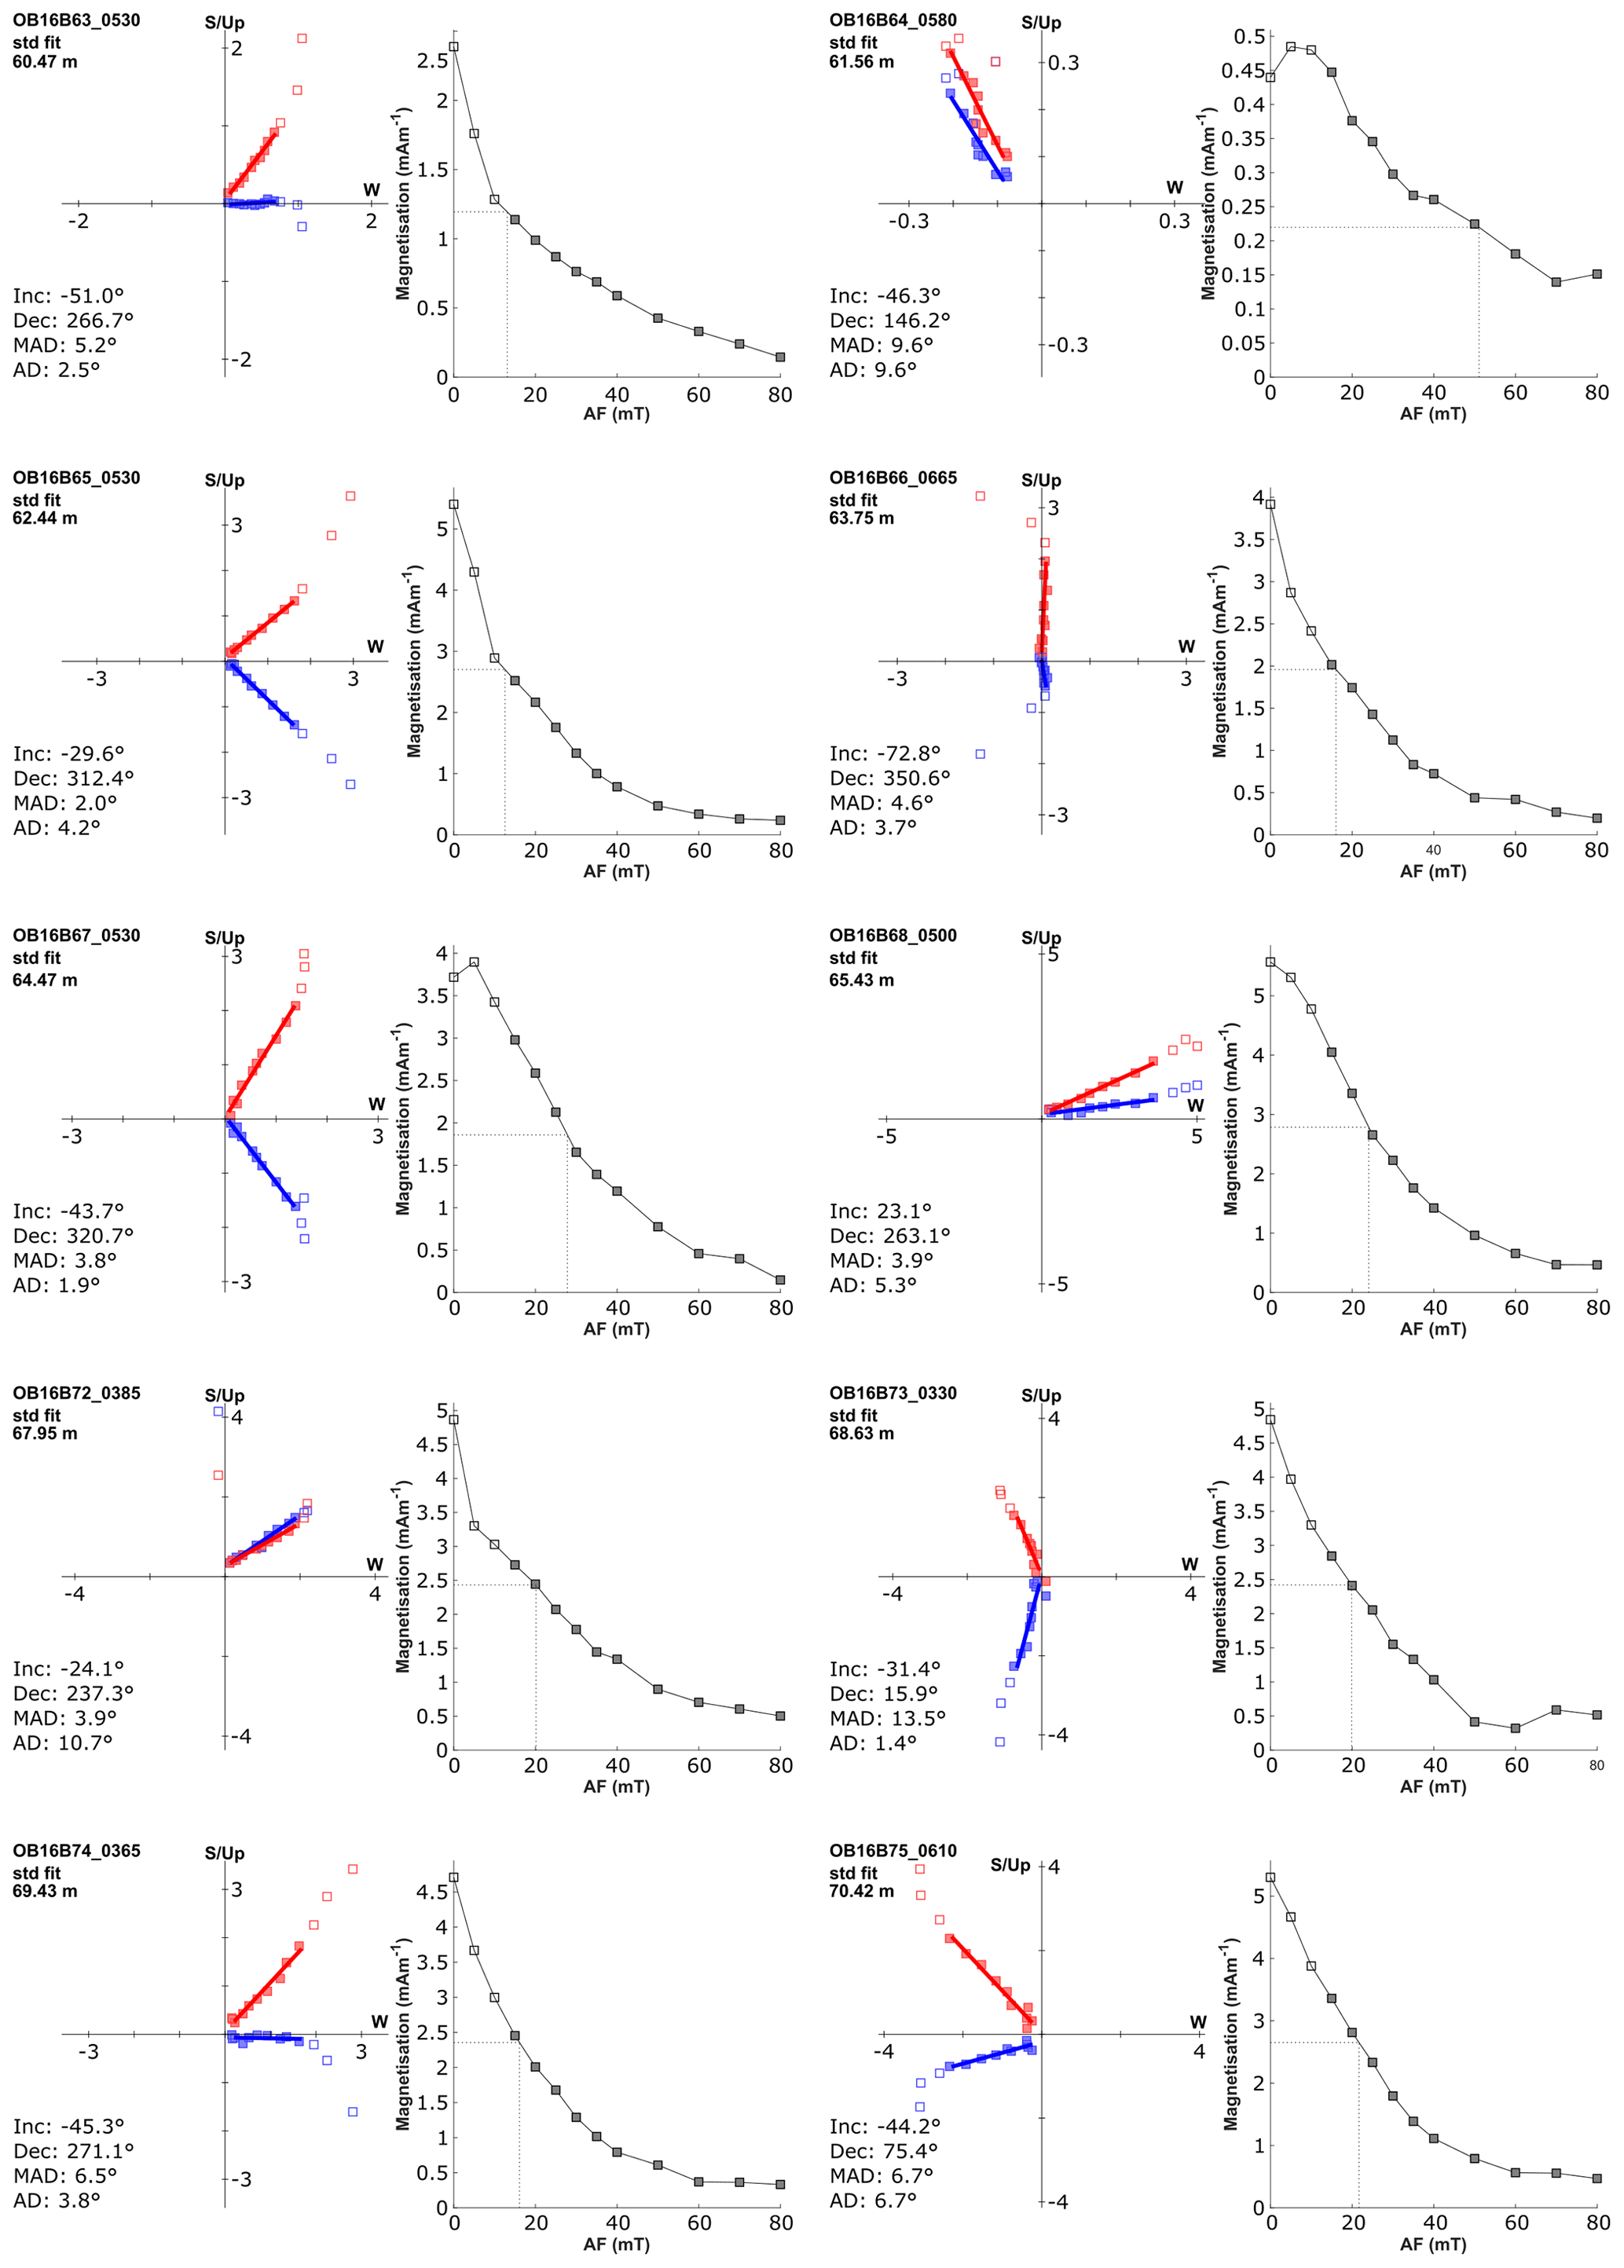
Figure C3Orthogonal plots and intensity of magnetisation after stepwise demagnetisation of pilot samples OB16B63-75.
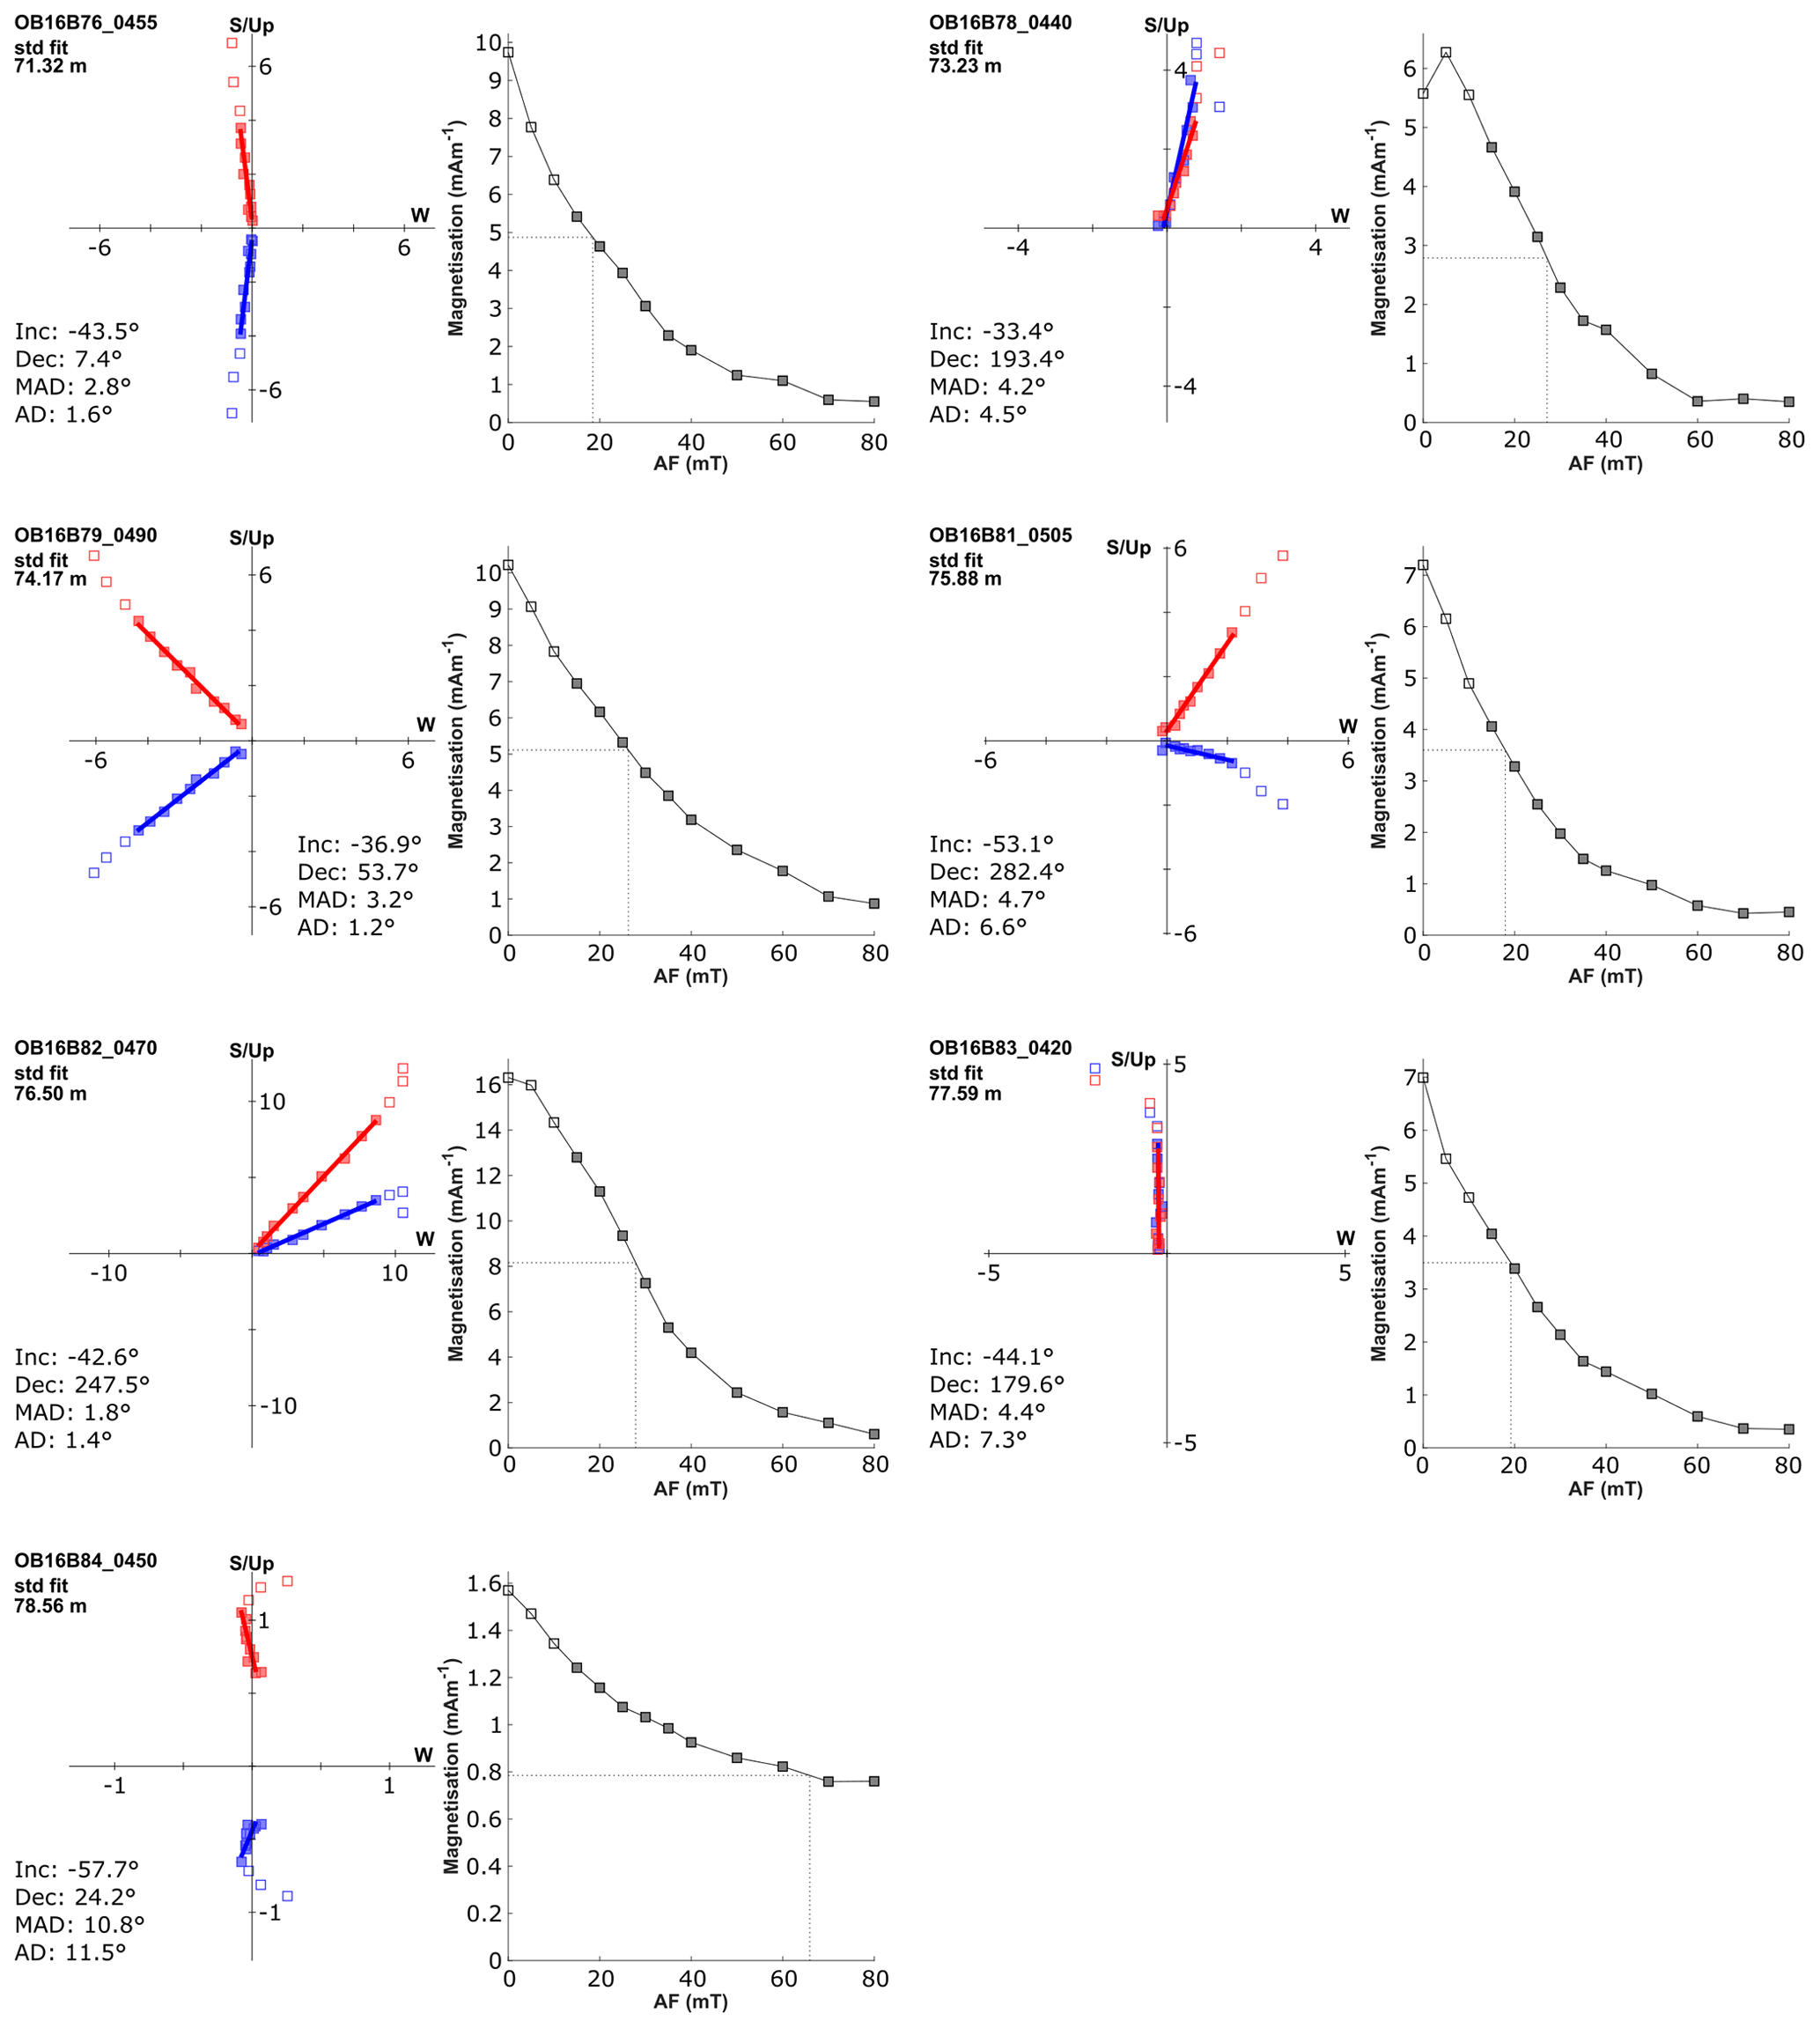
Figure C4Orthogonal plots and intensity of magnetisation after stepwise demagnetisation of pilot samples OB16B76-84.
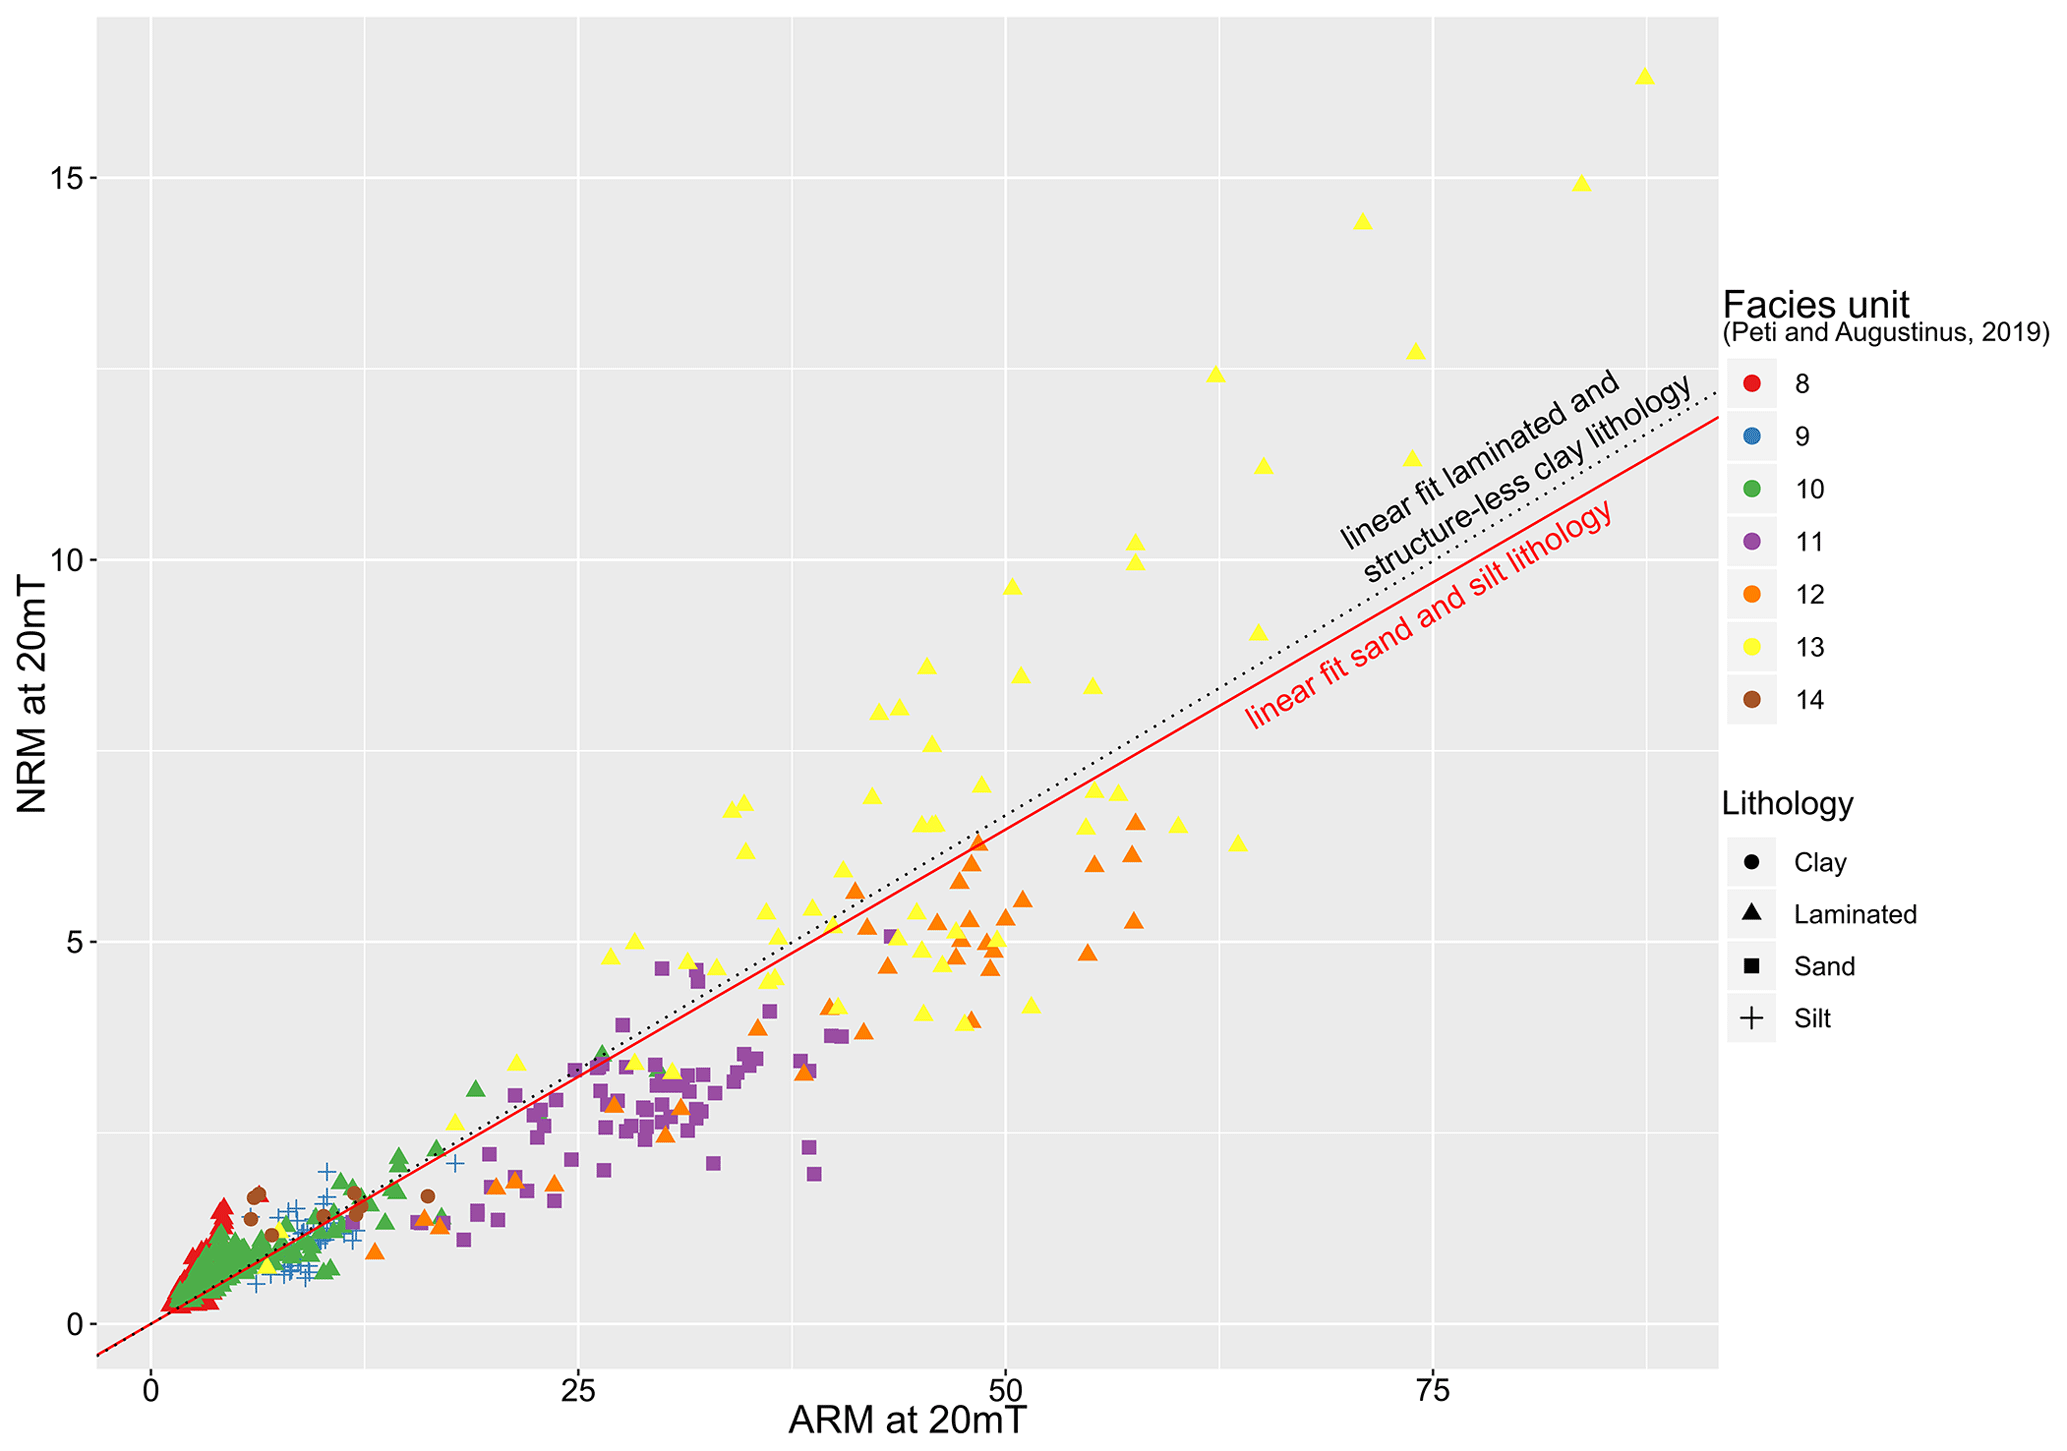
Figure C5Orakei ARM vs. NRM at 20 mT. Note how data points in coarser units with sandy and silty lithology follow a linear trend with a slightly shallower slope (solid red line) than clay-dominated lithologies (dotted black line; laminated or structure-less).
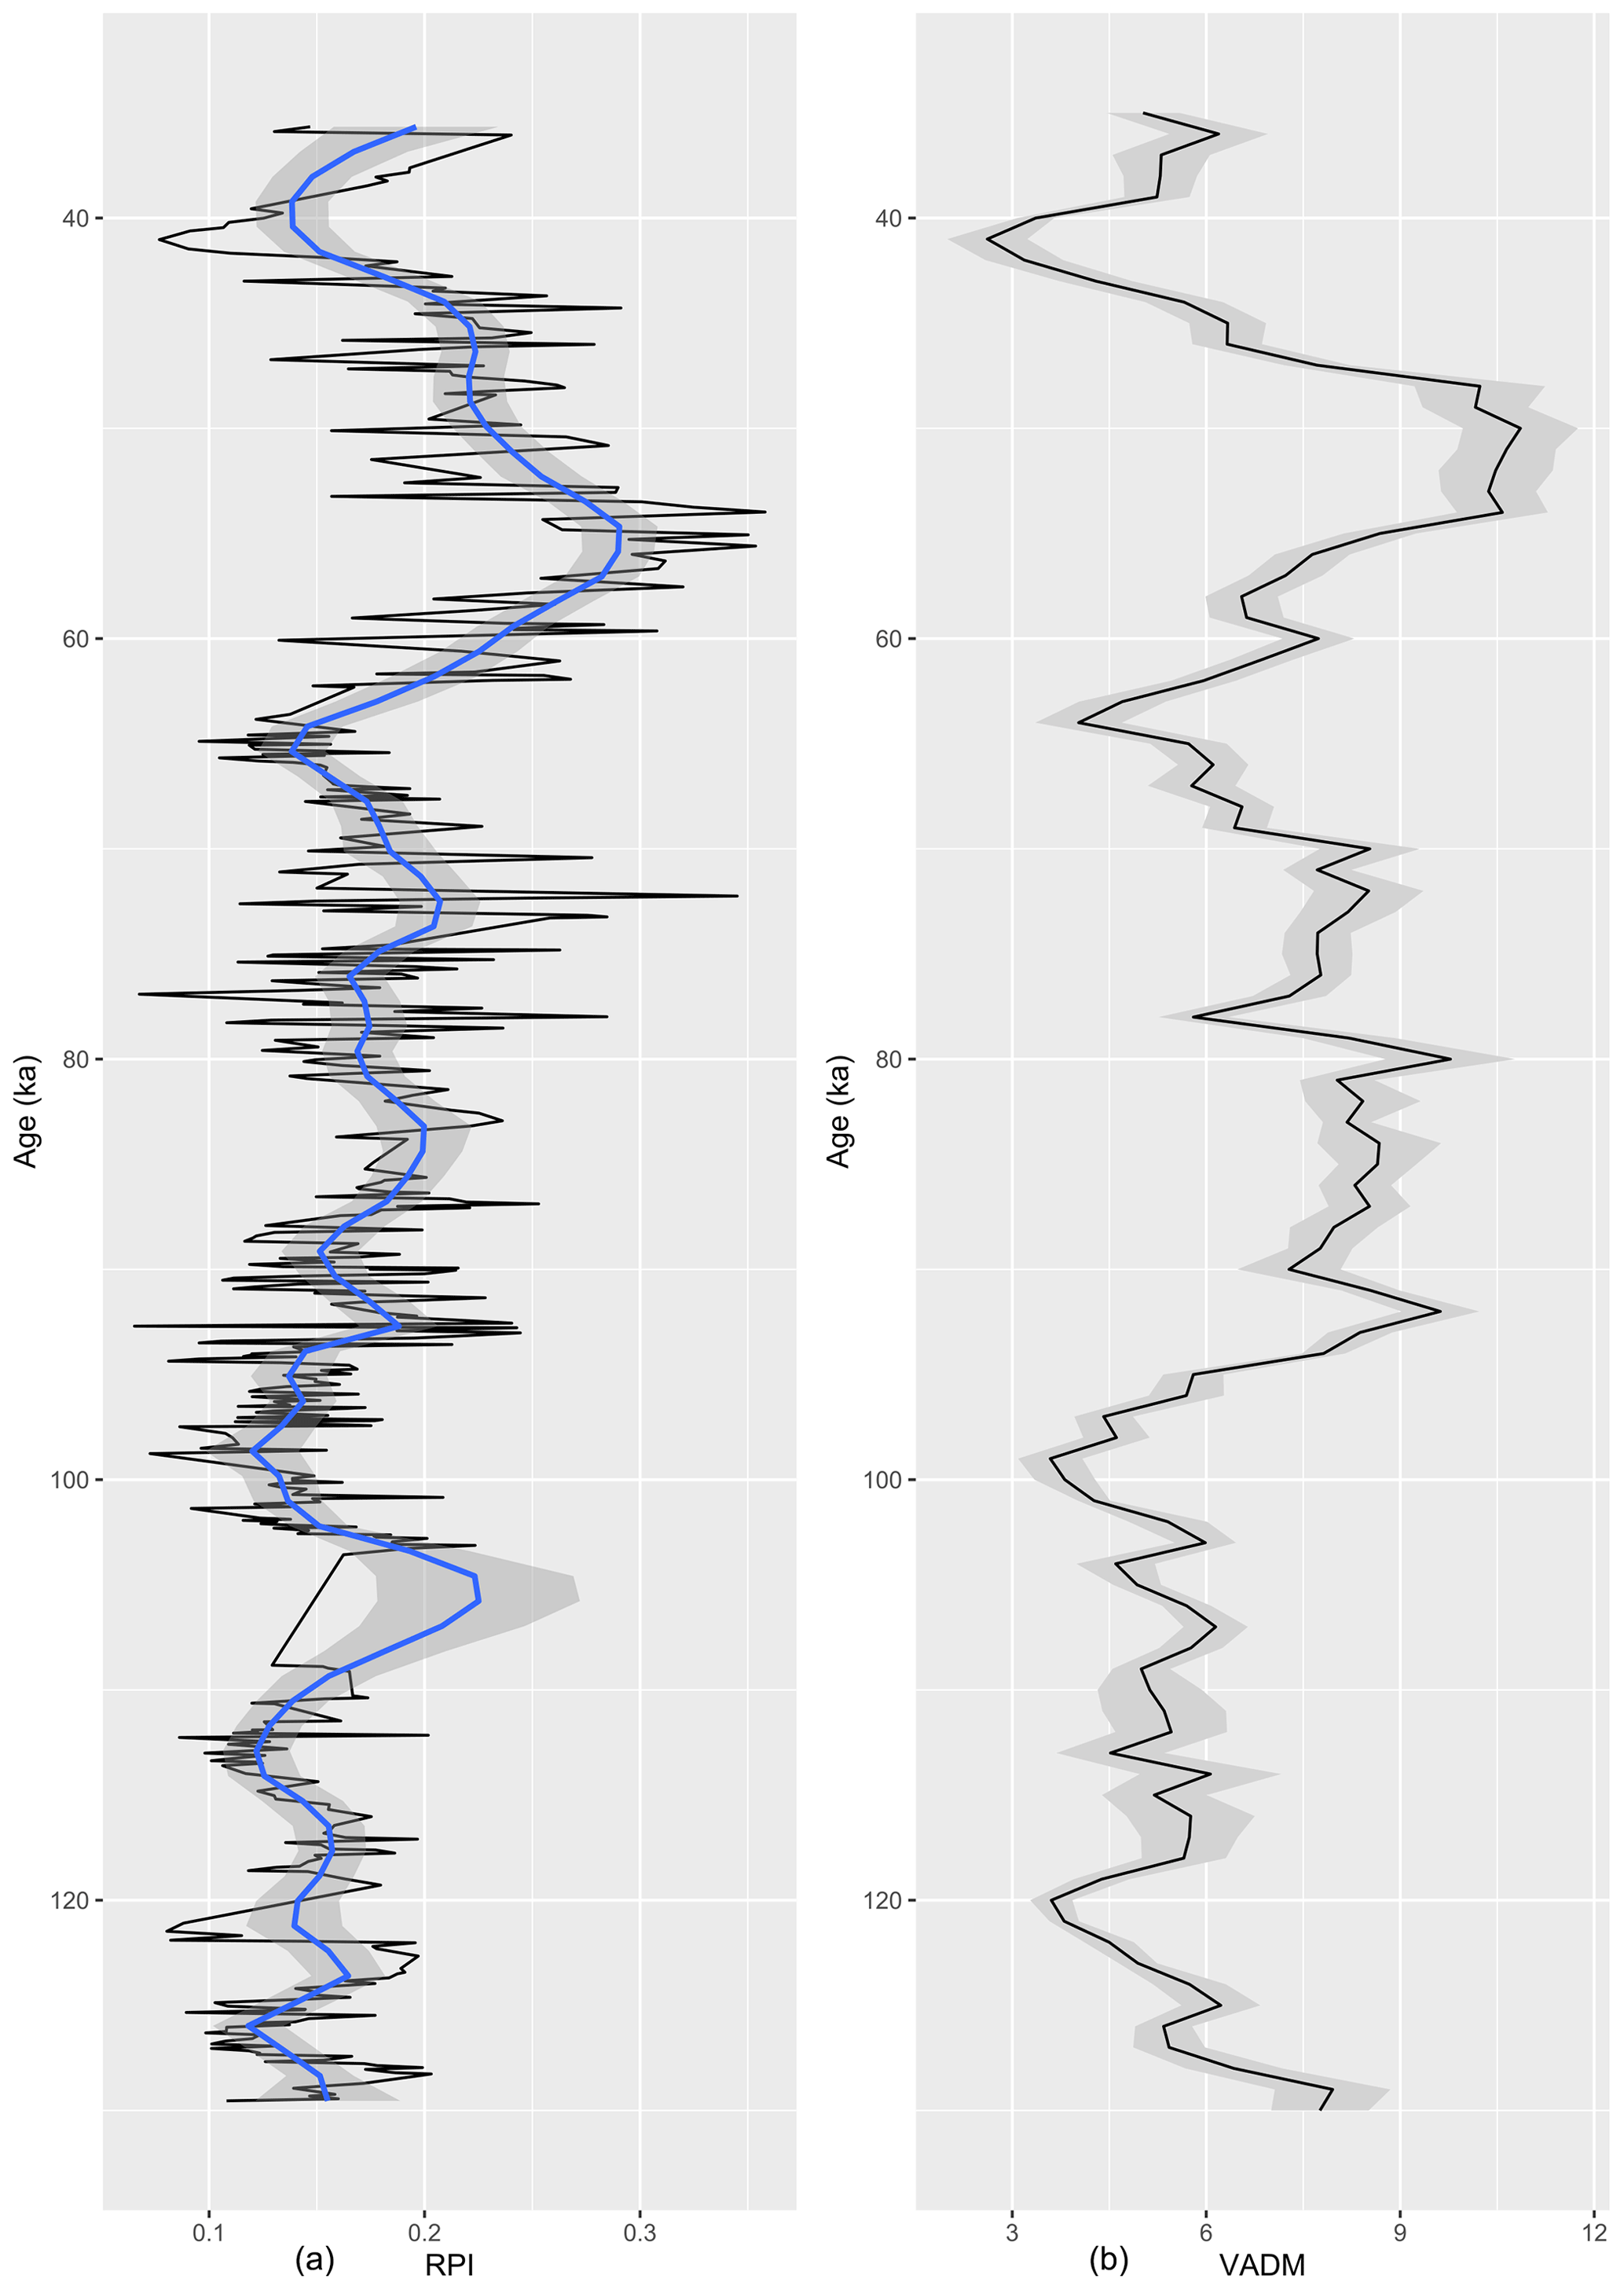
Figure C6Comparison of Orakei RPI (a) and PISO VADM (b) after the age modelling process in Bacon. Note the very good alignment between the smoothed RPI curve and the PISO stack.
Beryllium-10 extraction from sediment samples at ANSTO proceeds as follows (all chemical reagents used are analytical reagent (AR) or ultrapure grade):
-
Label and weigh empty and cleaned 50 mL centrifuge tube (+lid).
-
Fill known weight (approx. 0.5 g) of dried, powdered, and homogenised sediment into centrifuge tube and weigh.
-
Slowly add 10 mL of 6 M HCl to sediment (adjust to 20 mL of 6 M HCl for 1 g samples).
-
Weigh together after reaction subsides.
-
Gently swirl and allow digesting for 2–3 h.
-
Centrifuge at 3600 rpm for 10 min, extract 2 mL of supernatant into a labelled and rated 15 mL centrifuge tube, and weigh.
-
Dilute sample in small centrifuge tube with Milli-Q water to a total volume of ca. 10 mL and weigh accurately. This sample is sent for ICP-MS or ICP-AES (atomic emission spectroscopy) for measurement of native 9Be concentration.
-
Add 0.5 mL of Be carrier to remaining leachate in large centrifuge tube, weighing carrier accurately.
-
Swirl and let stand for ca. 2 h.
-
Centrifuge for 10 min at 3600 rpm and carefully pipette supernatant into new labelled and cleaned 50 mL centrifuge tube.
-
Wash residue with 1 mL of Milli-Q water (2 mL for 1 g samples).
-
Centrifuge again and add supernatant to centrifuge tube from step 10. Repeat washing, centrifuging, and pipetting.
-
Fill centrifuge tube with Milli-Q water up to a volume of 25 mL.
All further steps use the supernatant collected in the new centrifuge tube (see step 10). Sediment residue can be discarded after successful sample preparation.
The following preparation is identical to the steps used in the standard procedure for in situ samples (Child et al., 2000; White et al., 2019).
Beryllium-10 extraction from sediment samples at Lund University and the Swiss Federal Institute of Aquatic Science and Technology (EAWAG) proceeds as follows:
-
Add 9Be carrier to dried and homogenised sample in large beaker.
-
Add 1 mL of 30 % H2O2, 1 mL of 37 % HCl, and 4 mL of H2O.
-
Mix and wait overnight.
-
Centrifuge and decant into beaker.
-
Add 2 mL of 37 % HCl and 2 mL of H2O to centrifuge tube, centrifuge, and decant into same beaker. Discard precipitate.
-
Add 1 mL of 65 % HNO3 and 1 mL of 37 % to beaker. Mix and wait until sample has dissolved.
-
Transfer solution into small centrifuge tubes.
-
Add 2–4 mL of 25 % ammonia solution to reach hydroxide precipitation at pH 10. Mix and wait until precipitation.
-
Centrifuge and discard solution, keeping the precipitate. Wash sample and repeat.
-
Add 4 mL of 40 % NaOH (fresh!) to sample and wait > 5 h. Remove Fe at pH 14.
-
Centrifuge and decant into small centrifuge tube, discarding the precipitate.
-
Add 2–4 mL of 37 % HCl to solution to pH 3. Wait 30 min at room temperature.
-
Centrifuge and decant into small centrifuge tubes.
-
Add 2–4 mL of 25 % ammonia solution to precipitate 10Be at max pH 10. Wait 1–2 h, and then centrifuge and wash sample twice.
-
Transfer precipitate to quartz crucible and dry.
-
Oxidise to BeO in muffle furnace (110 ∘C, 600 ∘C).
-
Press with Nb into AMS cathode.
The datasets are available on PANGAEA at https://doi.org/10.1594/PANGAEA.920773 (beryllium data; Peti et al., 2020a), https://doi.org/10.1594/PANGAEA.921121 (rhyolitic tephra; Peti et al., 2020b), https://doi.org/10.1594/PANGAEA.921122 (basaltic tephra; Peti et al., 2020c), and https://doi.org/10.1594/PANGAEA.921134 (palaeomagnetic data; Peti et al., 2020d). The resulting Orakei sediment sequence age–depth relationship with uncertainty is included as a supplement.
The supplement related to this article is available online at: https://doi.org/10.5194/gchron-2-367-2020-supplement.
The description of the author contributions follows the CRediT (Contributor Roles Taxonomy) system. The conceptualisation was performed by PA. Funding acquisition was performed by PA (Marsden) and LP (AINSE). The formal analysis was performed by LP. Supervision was performed by KF, AN, TF, DF, RM, and PA. The methodology was influenced by LP, AN, CM, and MC. The investigation was performed by LP, KF, JH, and MC. The validation was performed by KF, TF, and RM. The visualisations were made by LP and KF. LP conducted the writing of the original draft; all other authors contributed to the writing with review and editing.
The authors declare that they have no conflict of interest.
Leonie Peti thanks Hannah Marley for tephra, luminescence, radiocarbon, and palaeomagnetic sampling support; Phil Shane for discussing tephras; and Craig Woodward for a discussion about age models.
The Orakei Basin drilling campaign in 2016 was co-funded by DEVORA (funded by the New Zealand Earthquake Commission and the Auckland Council and led by Jan Lindsay, University of Auckland, and Graham Leonard, GNS Science) and a grant from the Royal Society of New Zealand Marsden Fund (UOA1415 to Paul C. Augustinus). The palaeomagnetic work at Lund University was funded by the same Marsden Fund (UOA1415). We acknowledge the financial support for the Centre for Accelerator Science, at ANSTO, through the Australian National Collaborative Research Infrastructure Strategy (NCRIS). Leonie Peti would like to thank AINSE Limited for providing financial assistance (Award – PGRA 12196) to enable work at the ANSTO Centre for Accelerator Science (radiocarbon dating and beryllium-10). This work was partially supported by the Swedish Research Council (grant DNR2013-8421 to Raimund Muscheler).
We thank three anonymous reviewers and Quentin Simon for helpful reviews, and Richard Staff for editorial handling and helpful comments, which have all improved the quality of the age model and this paper.
This research has been supported by the Marsden Fund (grant no. UOA1415), the Australian Institute of Nuclear Science and Engineering (grant no. PGRA 12196), and the Vetenskapsrådet (grant no. DNR2013-8421).
This paper was edited by Richard Staff and reviewed by three anonymous referees.
Adamiec, G. and Aitken, M.: Dose-rate conversion factors: update, Ancient TL, 16, 37–50, 1998.
Aitchison, J.: The statistical analysis of compositional data, Chapman and Hall, London, New York, 1986.
Aitken, M. J.: Science-based Dating in Archaeology, Longman, London, New York, 1990.
Allen, J.: Holocene coastal lowlands in NW Europe?: autoeompaction and the uncertain ground, in: Coastal and Estuarine Enviromnents: sedimentology, geomorphology and geoarchaeolog, edited by: Pye, K. and Allen, J., The Geological Society of London, London, 239–252, 2000.
Alley, R. B., Marotzke, J., Nordhaus, W. D., Overpeck, J. T., Peteet, D. M., Pielke Jr., R. A., Pierrehumbert, R. T., Rhines, P. B., Stocker, T. F., Talley, L. D., and Wallace, J. M.: Abrupt Climate Change, Science, 299, 2005–2010, 2003.
Alloway, B. V., Lowe, D. J., Barrell, D. J. A., Newnham, R. M., Almond, P. C., Augustinus, P. C., Bertler, N. A. N., Carter, L., Litchfield, N. J., McGlone, M. S., Shulmeister, J., Vandergoes, M. J., Williams, P. W., and NZ-INTIMATE members: Towards a Climate Event Stratigraphy for New Zealand over the past 30000 years (NZ-INTIMATE project), J. Quat. Sci., 22, 9–35, https://doi.org/10.1002/Jqs.1079, 2007.
Almond, P. C., Shanhun, F. L., Rieser, U., and Shulmeister, J.: An OSL, radiocarbon and tephra isochron-based chronology for Birdlings Flat loess at Ahuriri Quarry, Banks Peninsula, Canterbury, New Zealand, Quatern. Geochronol., 2, 4–8, https://doi.org/10.1016/j.quageo.2006.06.002, 2007.
Augustinus, P., Cochran, U., Kattel, G., D'Costa, D., and Shane, P.: Late Quaternary paleolimnology of Onepoto maar, Auckland, New Zealand: Implications for the drivers of regional paleoclimate, Quat. Int., 253, 18–31, https://doi.org/10.1016/j.quaint.2011.02.028, 2012.
Augustinus, P. C.: NZ-Maars: Extracting High Resolution Paleoclimate Records from Maar Crater Lakes, Auckland, New Zealand, Past Clim. Dyn. A South. Perspect., 15, 18–20, 2007.
Augustinus, P. C.: Probing the history of New Zealand's Orakei maar, EOS T. Am. Geophys. Un., 97, 1–7, https://doi.org/10.1029/2016EO059227, 2016.
Barrell, D. J. A., Almond, P. C., Vandergoes, M. J., Lowe, D. J., and Newnham, R. M.: A composite pollen-based stratotype for inter-regional evaluation of climatic events in New Zealand over the past 30 000 years (NZ-INTIMATE project), Quat. Sci. Rev., 74, 4–20, https://doi.org/10.1016/j.quascirev.2013.04.002, 2013.
Bird, M. I., Fifield, L. K., Chua, S., and Goh, B.: Calculating Sediment Compaction For Radiocarbon Dating Of Intertidal Sediments, Radiocarbon, 46, 421–435, 2004.
Blaauw, M.: Methods and code for “classical” age-modelling of radiocarbon sequences, Quat. Geochronol., 5, 512–518, https://doi.org/10.1016/j.quageo.2010.01.002, 2010.
Blaauw, M.: Out of tune: The dangers of aligning proxy archives, Quat. Sci. Rev., 36, 38–49, https://doi.org/10.1016/j.quascirev.2010.11.012, 2012.
Blaauw, M. and Christen, J. A.: Flexible paleoclimate age-depth models using an autoregressive gamma process, Bayesian Anal., 6, 457–474, https://doi.org/10.1214/11-BA618, 2011.
Blaauw, M. and Christen, J. A.: rbacon: Age-Depth Modelling using Bayesian Statistics, R package version 2.4.2, available at: https://CRAN.R-project.org/package=rbacon, last access: 14 December 2020.
Bleil, U. and Gard, G.: Chronology and correlation of Quaternary magnetostratigraphy and nanno- fossil biostratigraphy in Norwegian-Greenland Sea sediments, Geol. Rundschau, 78, 1173–1187, 1989.
Bøtter-Jensen, L.: Luminescence techniques: Instrumentation and methods, Radiat. Meas., 27, 749–768, https://doi.org/10.1016/S1350-4487(97)00206-0, 1997.
Bøtter-Jensen, L., Mejdahl, V., and Murray, A. S.: New light on OSL, Quat. Sci. Rev., 18, 303–309, https://doi.org/10.1016/S0277-3791(98)00063-8, 1999.
Bøtter-Jensen, L., Bulur, E., Duller, G. A. T., and Murray, A. S.: Advances in luminescence measurement systems, Radiat. Meas., 32, 523–528, 2000.
Bourlès, D., Raisbeck, G. M., and Yiou, F.: 10Be and 9Be in marine sediments and their potential for dating, Geochim. Cosmochim. Act., 53, 443–452, 1989.
Broecker, W. S.: Does the Trigger for Abrupt Climate Change Reside in the Ocean or in the Atmosphere?, Science, 300, 1519–1522, 2003.
Bronk Ramsey, C.: Bayesian Analysis of Radiocarbon Dates, Radiocarbon, 51, 337–360, https://doi.org/10.1017/S0033822200033865, 2009.
Buylaert, J. P., Jain, M., Murray, A. S., Thomsen, K. J., Thiel, C., and Sohbati, R.: A robust feldspar luminescence dating method for Middle and Late Pleistocene sediments, Boreas, 41, 435–451, https://doi.org/10.1111/j.1502-3885.2012.00248.x, 2012.
Carolin, S. A., Cobb, K. M., Adkins, J. F., Clark, B., Conroy, J. L., Lejau, S., Malang, J.. and Tuen, A. A.: Varied Response of Western Pacific Hydrology to Climate Forcings over the Last Glacial Period, Science, 340, 1564–1567, 2013.
Cassata, W. S., Singer, B. S., and Cassidy, J.: Laschamp and Mono Lake geomagnetic excursions recorded in New Zealand, Earth Planet. Sc. Lett., 268, 76–88, https://doi.org/10.1016/j.epsl.2008.01.009, 2008.
Channell, J. E. T., Hodell, D. A., and Lehman, B.: Relative geomagnetic paleointensity and δ18O at ODP Site 983 (Gardar Drift, North Atlantic) since 350 ka, Earth Planet. Sc. Lett., 153, 103–118, 1997.
Channell, J. E. T., Stoner, J. S., Hodell, D. A., and Charles, C. D.: Geomagnetic paleointensity for the last 100 kyr from the sub-antarctic South Atlantic: a tool for inter-hemispheric correlation, Earth Planet. Sc. Lett., 175, 145–160, 2000.
Channell, J. E. T., Xuan, C., and Hodell, D. A.: Stacking paleointensity and oxygen isotope data for the last 1.5 Myr (PISO-1500), Earth Planet. Sc. Lett., 283, 14–23, https://doi.org/10.1016/j.epsl.2009.03.012, 2009.
Child, D., Elliott, G., Mifsud, C., Smith, A. M., and Fink, D.: Sample processing for earth science studies at ANTARES, Nucl. Instruments Methods Phys. Res. B, 172, 856–860, 2000.
Christen, J. A. and Pérez E, S.: A New Robust Statistical Model for Radiocarbon Data, Radiocarbon, 51, 1047–1059, https://doi.org/10.1017/s003382220003410x, 2009.
Christl, M., Vockenhuber, C., Kubik, P. W., Wacker, L., Lachner, J., Alfimov, V., Synal, H.-A., and Synal, H.: The ETH Zurich AMS facilities: Performance parameters and reference materials, Nucl. Inst. Methods Phys. Res. B, 294, 29–38, https://doi.org/10.1016/j.nimb.2012.03.004, 2013.
Czymzik, M., Muscheler, R., Brauer, A., Adolphi, F., Ott, F., Kienel, U., Dräger, N., Słowiński, M., Aldahan, A., and Possnert, G.: Solar cycles and depositional processes in annual 10Be from two varved lake sediment records, Earth Planet. Sc. Lett., 428, 44–51, https://doi.org/10.1016/j.epsl.2015.07.037, 2015.
Danišík, M., Shane, P., Schmitt, A. K., Hogg, A., Santos, G. M., Storm, S., Evans, N. J., Keith Fifield, L., and Lindsay, J. M.: Re-anchoring the late Pleistocene tephrochronology of New Zealand based on concordant radiocarbon ages and combined 238U/230Th disequilibrium and (U-Th) ∕ He zircon ages, Earth Planet. Sc. Lett., 349–350, 240–250, https://doi.org/10.1016/j.epsl.2012.06.041, 2012.
Danišík, M., Lowe, D. J., Schmitt, A. K., Friedrichs, B., Hogg, A. G., and Evans, N. J.: Sub-millennial eruptive recurrence in the silicic Mangaone Subgroup tephra sequence , New Zealand , from Bayesian modelling of zircon double-dating and radiocarbon ages, Quat. Sci. Rev., 246, 106517, https://doi.org/10.1016/j.quascirev.2020.106517, 2020.
Doerschner, N., Hernandez, M., and Fitzsimmons, K. E.: Sources of variability in single grain dose recovery experiments: Insights from Moroccan and Australian samples, Ancient TL, 34, 14–25, 2016.
Dunbar, N. W., Iverson, N. A., Van Eaton, A. R., Sigl, M., Alloway, B. V., Kurbatov, A. V., Mastin, L. G., McConnell, J. R., and Wilson, C. J. N.: New Zealand supereruption provides time marker for the Last Glacial Maximum in Antarctica, Sci. Rep., 7, 3–10, https://doi.org/10.1038/s41598-017-11758-0, 2017.
Egli, R.: Characterization of individual rock magnetic components by analysis of remanence curves, 1. Unmixing natural sediments, Stud. Geophys. Geod., 48, 391–446, 2004.
Elsasser, W., Ney, E. P., and Winckler, J. R.: Cosmic-Ray intensity and geomagnetism, Nature, 178, 1226–1227, 1956.
EPICA Community Members: One-to-one coupling of glacial climate variability in Greenland and Antarctica, Nature, 444, 195–198, https://doi.org/10.1038/nature05301, 2006.
Fink, D., Hotchkis, M., Hua, Q., Jacobsen, G., Smith, A. M., Zoppi, U., Child, D., Mifsud, C., Van Der Gaast, H., Williams, A., and Williams, M.: The ANTARES AMS facility at ANSTO, Nucl. Instruments Methods Phys. Res. B, 223–224, 109–115, https://doi.org/10.1016/j.nimb.2004.04.025, 2004.
Flude, S. and Storey, M.: 40Ar ∕ 39Ar age of the Rotoiti Breccia and Rotoehu Ash, Okataina Volcanic Complex, New Zealand, and identification of heterogeneously distributed excess40Ar in supercooled crystals, Quat. Geochronol., 33, 13–23, https://doi.org/10.1016/j.quageo.2016.01.002, 2016.
Fox, J. and Weisberg, S.: An R Companion to Applied Regression, 2nd edn., SAGE Publications, Thousand Oaks, California, USA, 2011.
Frank, M., Schwarz, B., Baumann, S., Kubik, P. W., Suter, M., and Mangini, A.: A 200 kyr record of cosmogenic radionuclide production rate and geomagnetic field intensity from 10Be in globally stacked deep-sea sediments, Earth Planet. Sc. Lett., 149, 121–129, https://doi.org/10.1016/S0012-821X(97)00070-8, 1997.
Frank, M., Backman, J., Jakobsson, M., Moran, K., Regan, M. O., King, J., Haley, B. A., Kubik, P. W., and Garbe-Schönberg, D.: Beryllium isotopes in central Arctic Ocean sediments over the past 12.3 million years: Stratigraphic and paleoclimatic implications, Paleoceanography, 23, 1–12, https://doi.org/10.1029/2007PA001478, 2008.
Froggatt, P. C. and Lowe, D. J.: A review of late quaternary silicic and some other tephra formations from New Zealand: Their stratigraphy, nomenclature, distribution, volume, and age, New Zeal. J. Geol. Geophys., 33, 89–109, https://doi.org/10.1080/00288306.1990.10427576, 1990.
Galbraith, R. F., Roberts, R. G., Laslett, G. M., Yoshida, H., and Olley, J. M.: Optical Dating of Single and Multiple Grains of Quartz From Jinmium Rock Shelter, Northern Australia: Part I, Experimental Design and Statistical Models, Archaeometry, 41, 339–364, 1999.
Giorgino, T.: Computing and Visualizing Dynamic Time Warping Alignments in this reference of Giorgino 2009: The dtw Package, J. Stat. Softw., 31, 1–24, 2009.
Guerin, G., Mercier, N., and Adamiec, G.: Dose-rate conversion factors: update, Ancient TL, 29, 5–8, 2011.
Hagen, C. J., Reilly, B. T., Stoner, J. S., and Creveling, J. R.: Dynamic Time Warping of Paleomagnetic Secular Variation Data, Geophys. J. Int., 1–45, 2020.
Hatfield, R. G., Stoner, J. S., Solada, K. E., Morey, A. E., Woods, A., Chen, C. Y., McGee, D., Abbott, M. B., and Rodbell, D. T.: Paleomagnetic Constraint of the Brunhes Age Sedimentary Record From Lake Junín, Peru, Front. Earth Sci., 8, 1–18, https://doi.org/10.3389/feart.2020.00147, 2020.
Hay, C. C., Creveling, J. R., Hagen, C. J., Maloof, A. C., and Huybers, P.: A library of early Cambrian chemostratigraphic correlations from a reproducible algorithm, Geology, 47, 457–460, 2019.
Hayward, B. W., Morley, M. S., Sabaa, A. T., Grenfell, H. R., Daymond-King, R., Molloy, C., Shane, P. A., and Augustinus, P. A.: Fossil Record Of The Post-Glacial Marine Breaching Of Auckland's Volcanic Maar Craters, Rec. Auckl. Museum, 45, 79–99, 2008.
Hayward, C. M. and Hayward, B. W.: Human Impact On Orakei Basin, Auckland, Tane, 37, 137–152, 1999.
Heiken, G.: Morphology and Petrography of Volcanic Ashes, Geol. Soc. Am. Bull., 83, 1961–1988, 1972.
Hessell, J. W. D.: The climate and weather of the Auckland region, New Zealand Meteorological Service, 1988.
Hogg, A. G., Heaton, T. J., Hua, Q., Palmer, J. G., Turney, C. S. M., Southon, J., Bayliss, A., Blackwell, P. G., Boswijk, G., Bronk Ramsey, C., Pearson, C., Petchey, F., Reimer, P., Reimer, R., and Wacker, L.: Shcal20 Southern Hemisphere Calibration, 0–55 000 YEARS CAL BP, Radiocarbon, 62, 759–778, https://doi.org/10.1017/RDC.2020.59, 2020.
Hopkins, J. L., Millet, M. A., Timm, C., Wilson, C. J. N., Leonard, G. S., Palin, J. M., and Neil, H.: Tools and techniques for developing tephra stratigraphies in lake cores: A case study from the basaltic Auckland Volcanic Field, New Zealand, Quat. Sci. Rev., 123, 58–75, https://doi.org/10.1016/j.quascirev.2015.06.014, 2015.
Hopkins, J. L., Wilson, C. J. N., Millet, M. A., Leonard, G. S., Timm, C., McGee, L. E., Smith, I. E. M., and Smith, E. G. C.: Multi-criteria correlation of tephra deposits to source centres applied in the Auckland Volcanic Field, New Zealand, Bull. Volcanol., 79, 55, https://doi.org/10.1007/s00445-017-1131-y, 2017.
Hurnard, S. M.: Auckland's climate, in: Natural History of Auckland: an Introduction, edited by: Brook, P. J., Auckland Institute and Museum, Auckland, 31–34, 1979.
Ingham, E., Turner, G. M., Conway, C. E., Heslop, D., Roberts, A. P., Leonard, G., Townsend, D., and Calvert, A.: Volcanic records of the Laschamp geomagnetic excursion from Mt Ruapehu, New Zealand, Earth Planet. Sc. Lett., 472, 131–141, https://doi.org/10.1016/j.epsl.2017.05.023, 2017.
Kemp, C. W., Tibby, J., Arnold, L. J., Barr, C., Gadd, P. S., Marshall, J. C., Mcgregor, G. B., and Jacobsen, G. E.: Climates of the last three interglacials in subtropical eastern Australia inferred from wetland sediment geochemistry, Palaeogeogr. Palaeoclimatol. Palaeoecol., 538, 109463, https://doi.org/10.1016/j.palaeo.2019.109463, 2020.
Kidson, J. W.: An Analysis of New Zealand Synoptic Types and Their Use in Defining Weather Regimes, Int. J. Climatol., 20, 299–316, 2000.
King, R. F.: The Remanent Magnetism Of Artificially Deposited Sediments, eophysical Supplements to the Monthly Notices of the Royal Astronomical Society, 7, 115–134, https://doi.org/10.1111/j.1365-246X.1955.tb06558.x, 1955.
Kirschvink, J. L.: The least-squares line and plane and the analysis of palaeomagnetic data, Geophys. J. Int., 62, 699–718, 1980.
Laj, C. and Channell, J. E. T.: Geomagnetic Excursions, in: Treatise on Geophysics, Elsevier B.V., 343–383, 2015.
Laj, C., Kissel, C., and Beer, J.: High Resolution Global Paleointensity Stack Since 75 kyr (GLOPIS-75) Calibrated to Absolute Values, in: Timescales of the paleomagnetic field, vol. 145, edited by: Channell, J. E. T., Kent, D. V., Lowrie, W., and Meert, J. G., American Geophysical Union, Washington, DC, 255–265, 2004.
Laj, C., Guillou, H., and Kissel, C.: Dynamics of the earth magnetic field in the 10–75 kyr period comprising the Laschamp and Mono Lake excursions: New results from the French Chaîne des Puys in a global perspective, Earth Planet. Sc. Lett., 387, 184–197, https://doi.org/10.1016/j.epsl.2013.11.031, 2014.
Lascu, I., Feinberg, J. M., Dorale, J. A., Cheng, H., and Edwards, R. L.: Age of the Laschamp excursion determined by U-Th dating of a speleothem geomagnetic record from North America, Geology, 44, 139–142, https://doi.org/10.1130/G37490.1, 2016.
Leonard, G. S., Calvert, A. T., Hopkins, J. L., Wilson, C. J. N., Smid, E. R., Lindsay, J. M., and Champion, D. E.: High-precision 40Ar ∕ 39Ar dating of Quaternary basalts from Auckland Volcanic Field, New Zealand, with implications for eruption rates and paleomagnetic correlations, J. Volcanol. Geotherm. Res., 343, 60–74, https://doi.org/10.1016/j.jvolgeores.2017.05.033, 2017.
Lézine, A., Grafenstein, U. Von, Andersen, N., Belmecheri, S., Bordon, A., Caron, B., and Cazet, J.: Lake Ohrid, Albania, provides an exceptional multi-proxy record of environmental changes during the last glacial – interglacial cycle, Palaeogeogr. Palaeoclimatol. Palaeoecol., 287, 116–127, https://doi.org/10.1016/j.palaeo.2010.01.016, 2010.
Lindsay, J., Leonard, G., Smid, E., and Hayward, B.: Age of the Auckland Volcanic Field: a review of existing data, New Zeal. J. Geol. Geophys., 54, 379–401, https://doi.org/10.1080/00288306.2011.595805, 2011.
Liu, E. J., Cashman, K. V., and Rust, A. C.: Optimising shape analysis to quantify volcanic ash morphology, GeoResJ, 8, 14–30, https://doi.org/10.1016/j.grj.2015.09.001, 2015.
Liu, J., Nowaczyk, N. R., Panovska, S., Korte, M., and Arz, H. W.: The Norwegian-Greenland Sea, the Laschamps, and the Mono Lake Excursions Recorded in a Black Sea Sedimentary Sequence, J. Geophys. Res.-Sol. Ea., 125, 1–22, https://doi.org/10.1029/2019JB019225, 2020.
Loame, R. C., Villamor, P., Lowe, D. J., Milicich, S. D., Pittari, A., Barker, S. L. L., Rae, A., Gomez-vasconcelos, M. G., Martinez-Martos, M., and Ries, W. F.: Using paleoseismology and tephrochronology to reconstruct fault rupturing and hydrothermal activity since ca. 40 ka in Taupo Rift, New Zealand, Quat. Int., 500, 52–70, https://doi.org/10.1016/j.quaint.2019.02.031, 2019.
Løvlie, R.: Palaeomagnetic excursions during the last interglacial/glacial cycle: A synthesis, Quat. Int., 3/4, 5–11, 1989.
Lowe, D. J.: Tephrochronology and its application: A review, Quat. Geochronol., 6, 107–153, https://doi.org/10.1016/j.quageo.2010.08.003, 2011.
Lowe, D. J., Blaauw, M., Hogg, A. G., and Newnham, R. M.: Ages of 24 widespread tephras erupted since 30 000 years ago in New Zealand, with re-evaluation of the timing and palaeoclimatic implications of the Lateglacial cool episode recorded at Kaipo bog, Quat. Sci. Rev., 74, 170–194, https://doi.org/10.1016/j.quascirev.2012.11.022, 2013.
Lowick, S. E. and Preusser, F.: A method for retrospectively calculating the water content for silt-dominated desiccated core samples, Ancient TL, 27, 9–14, 2009.
Lund, S., Schwartz, M., and Stott, L.: Long-term palaeomagnetic secular variation and excursions from the western Equatorial Pacific Ocean (MIS2-4), Geophys. J. Int., 209, 587–596, https://doi.org/10.1093/gji/ggx029, 2017.
Mauz, B. and Lang, A.: Removal of the feldspar-derived luminescence component from polymineral fine silt samples for optical dating applications: evaluation of chemical treatment protocols and quality control procedures, Ancient TL, 22, 1–8, 2004.
McHargue, L. R., Damon, P. E., and Donahue, D. J.: Enhanced cosmic-ray production of 10Be coincident with the Mono Lake and Laschamp Geomagnetic Excursions, Geophys. Res. Lett., 22, 659–662, https://doi.org/10.1029/95GL00169, 1995.
Mejdahl, V.: Thermoluminescence Dating: Beta-Dose Attenuation in Quartz Grains, Archaeometry, 21, 61–72, 1979.
Ménabréaz, L., Thouveny, N., Bourlès, D. L., Deschamps, P., Hamelin, B., and Demory, F.: The Laschamp geomagnetic dipole low expressed as a cosmogenic 10Be atmospheric overproduction at ∼ 41 ka, Earth Planet. Sc. Lett., 312, 305–317, https://doi.org/10.1016/j.epsl.2011.10.037, 2011.
Mochizuki, N., Tsunakawa, H., Shibuya, H., Cassidy, J., and Smith, I. E. M.: Palaeointensities of the Auckland geomagnetic excursions by the LTD-DHT Shaw method, Phys. Earth Planet. Int., 154, 168–179, https://doi.org/10.1016/j.pepi.2005.09.005, 2006.
Molloy, C., Shane, P., and Augustinus, P.: Eruption recurrence rates in a basaltic volcanic field based on tephralayers in maar sediments: Implications for hazards in the Auckland volcanic field, Bull. Geol. Soc. Am., 121, 1666–1677, https://doi.org/10.1130/B26447.1, 2009.
Muscheler, R., Beer, J., Kubik, P. W., and Synal, H.-A.: Geomagnetic field intensity during the last 60 000 years based on 10Be and 36Cl from the Summit ice cores and 14C, Quat. Sci. Rev., 24, 1849–1860, https://doi.org/10.1016/j.quascirev.2005.01.012, 2005.
Needham, A. J., Lindsay, J. M., Smith, I. E. M., Augustinus, P., and Shane, P. A.: Sequential eruption of alkaline and sub-alkaline magmas from a small monogenetic volcano in the Auckland Volcanic Field, New Zealand, J. Volcanol. Geotherm. Res., 201, 126–142, https://doi.org/10.1016/j.jvolgeores.2010.07.017, 2011.
Newnham, R., Lowe, D. J., Gehrels, M., and Augustinus, P.: Two-step human–environmental impact history for northern New Zealand linked to late-Holocene climate change, Holocene, 28, 1093–1106, 2018.
NGRIP Members: High-resolution record of Northern Hemisphere climate extending into the last interglacial period, Nature, 431, 147–151, 2004.
Nilsson, A., Muscheler, R., Snowball, I., Aldahan, A., Possnert, G., Augustinus, P., Atkin, D., and Stephens, T.: Multi-proxy identification of the Laschamp geomagnetic field excursion in Lake Pupuke, New Zealand, Earth Planet. Sc. Lett., 311, 155–164, https://doi.org/10.1016/j.epsl.2011.08.050, 2011.
Nishiizumi, K., Imamura, M., Caffee, M. W., Southon, J. R., Finkel, R. C., and Mcaninch, J.: Absolute calibration of 10Be AMS standards Kunihiko, Nucl. Instruments Methods Phys. Res. B, 258, 403–413, https://doi.org/10.1016/j.nimb.2007.01.297, 2007.
Nowaczyk, N. R. and Baumann, M.: Combined high-resolution magnetostratigraphy and nannofossil biostratigraphy for late Quaternary Arctic Ocean sediments, Deep-Sea Res., 39, S567–S601, 1992.
Nowaczyk, N. R. and Frederichs, T. W.: Geomagnetic events and relative palaeointensity variations during the past 300 ka as recorded in Kolbeinsey Ridge sediments, Iceland Sea?: indication for a strongly variable geomagnetic field, Int. J. Earth Sci., 88, 116–131, 1999.
Nowaczyk, N. R., Frederichs, T. W., Eisenhauer, A., and Gard, G.: Magnetostratigraphic data from late Quaternary sediments from the Yermak Plateau , Arctic Ocean: evidence for four geomagnetic polarity events within the last 170 Ka of the Brunhes Chron, Geophys. J. Int., 117, 453–471, 1994.
Nowaczyk, N. R., Antonow, M., Knies, J., and Spielhagen, R. F.: Further rock magnetic and chronostratigraphic results on reversal excursions during the last 50 ka as derived from northern high latitudes and discrepancies in precise AMS 14C dating, Geophys. J. Int., 155, 1065–1080, 2003.
Nowaczyk, N. R., Frank, U., Kind, J., and Arz, H. W.: A high-resolution paleointensity stack of the past 14 to 68 ka from Black Sea sediments, Earth Planet. Sc. Lett., 384, 1–16, https://doi.org/10.1016/j.epsl.2013.09.028, 2013.
Olley, J. M., Pietsch, T., and Roberts, R. G.: Optical dating of Holocene sediments from a variety of geomorphic settings using single grains of quartz, Geomorphology, 60, 337–358, https://doi.org/10.1016/j.geomorph.2003.09.020, 2004.
Osete, M.-L., Martin-Chivelet, J., Rossi, C., Edwards, R. L., Egli, R., Munoz-Garcia, M. B., Wang, X., Pavon-Carrasco, F. J., and Heller, F.: The Blake geomagnetic excursion recorded in a radiometrically dated speleothem, Earth Planet. Sc. Lett., 353–354, 173–181, https://doi.org/10.1016/j.epsl.2012.07.041, 2012.
Pepper, A. C., Shulmeister, J., Nobes, D. C., and Augustinus, P. A.: Possible ENSO signals prior to the Last Glacial Maximum, during the last deglaciation and the early Holocene, from New Zealand, Geophys. Res. Lett., 31, 1–4, https://doi.org/10.1029/2004GL020236, 2004.
Peters, C. and Thompson, R.: Magnetic identification of selected natural iron oxides and sulphides, J. Magn. Magn. Mater., 183, 365–374, 1998.
Peti, L. and Augustinus, P. C.: Stratigraphy and sedimentology of the Orakei maar lake sediment sequence (Auckland Volcanic Field , New Zealand), Sci. Drill., 25, 47–56, 2019.
Peti, L., Gadd, P. S., Hopkins, J. L., and Augustinus, P. C.: Itrax μ-XRF core scanning for rapid tephrostratigraphic analysis: a case study from the Auckland Volcanic Field maar lakes, J. Quat. Sci., 1–12, https://doi.org/10.1002/jqs.3133, 2019.
Peti, L., Nilsson, A., Muscheler, R., Fitzsimmons, K. E., Fink, D., Fujioka, T., Mifsud, C., Hopkins, J. L., Christl, M., andAugustinus, P. C.: Beryllium-10 in sediment cores OB16A and OB16B from Orakei maar, Auckland, New Zealand, PANGAEA, https://doi.org/10.1594/PANGAEA.920773, 2020a.
Peti, L., Nilsson, A., Muscheler, R., Fitzsimmons, K. E., Fink, D., Fujioka, T., Mifsud, C., Hopkins, J. L., Christl, M., andAugustinus, P. C.: Rhyolitic tephra composition in sediment cores OB16A and OB16B from Orakei maar, Auckland, New Zealand, PANGAEA, https://doi.org/10.1594/PANGAEA.921121, 2020b.
Peti, L., Nilsson, A., Muscheler, R., Fitzsimmons, K. E., Fink, D., Fujioka, T., Mifsud, C., Hopkins, J. L., Christl, M., andAugustinus, P. C.: Basaltic tephra composition in sediment cores OB16A and OB16B from Orakei maar, Auckland, New Zealand, PANGAEA, https://doi.org/10.1594/PANGAEA.921122, 2020c.
Peti, L., Nilsson, A., Muscheler, R., Fitzsimmons, K. E., Fink, D., Fujioka, T., Mifsud, C., Hopkins, J. L., Christl, M., and Augustinus, P. C.: Paleomagnetic data from sediment cores OB16A and OB16B from Orakei maar, Auckland, New Zealand, PANGAEA, https://doi.org/10.1594/PANGAEA.921134, 2020d.
Philippsen, B.: The freshwater reservoir effect in radiocarbon dating, Herit. Sci., 1, 1–19, https://doi.org/10.1186/2050-7445-1-24, 2013.
Pickarski, N., Kwiecien, O., Djamali, M., and Litt, T.: Vegetation and environmental changes during the last interglacial in eastern Anatolia (Turkey): a new high-resolution pollen record from Lake Van, Palaeogeogr. Palaeoclimatol. Palaeoecol., 435, 145–158, https://doi.org/10.1016/j.palaeo.2015.06.015, 2015.
Prescott, J. R. and Hutton, J. T.: Cosmic ray contributions to dose rates for luminescence and ESR dating: Large depths and long-term time variations, Radiat. Meas., 23, 497–500, https://doi.org/10.1016/1350-4487(94)90086-8, 1994.
R Core Team: R: A Language and Environment for Statistical Computing, R Foundation for Statistical Computing, Vienna, Austria, available at: https://www.r-project.org, last access: 30 October 2020.
Rasmussen, S. O., Bigler, M., Blockley, S. P., Blunier, T., Buchardt, S. L., Clausen, H. B., Cvijanovic, I., Dahl-Jensen, D., Johnsen, S. J., Fischer, H., Gkinis, V., Guillevic, M., Hoek, W. Z., Lowe, J. J., Pedro, J. B., Popp, T., Seierstad, I. K., Peder Steffensen, J., Svensson, A. M., Vallelonga, P., Vinther, B. M., Walker, M. J. C., Wheatley, J. J., and Winstrup, M.: A stratigraphic framework for abrupt climatic changes during the Last Glacial period based on three synchronized Greenland ice-core records: refining and extending the INTIMATE event stratigraphy, Quat. Sci. Rev., 106, 14–28, https://doi.org/10.1016/j.quascirev.2014.09.007, 2014.
Rees-Jones, J.: Optical dating of young sediments using fine-grain quartz, Ancient TL, 13, 9–14, 1995.
Rees-Jones, J. and Tite, M. S.: Optical Dating Results for British Archaeological Sediments, Archaeometry, 39, 177–187, https://doi.org/10.1111/j.1475-4754.1997.tb00797.x, 1997.
Roberts, H. M., Bryant, C. L., Huws, D. G., and Lamb, H. F.: Generating long chronologies for lacustrine sediments using luminescence dating: a 250,000 year record from Lake Tana, Ethiopia, Quaternary Sci. Rev., 202, 66–77, https://doi.org/10.1016/j.quascirev.2018.10.037, 2018.
Roperch, P., Bonhommet, N., and Levi, S.: Paleointensity of the earth's magnetic field during the Laschamp excursion and its geomagnetic implications, Earth Planet. Sc. Lett., 88, 209–219, 1988.
Seelos, K., Sirocko, F., and Dietrich, S.: A continuous high-resolution dust record for the reconstruction of wind systems in central Europe (Eifel, Western Germany) over the past 133 ka, Geophys. Res. Lett., 36, L20712, https://doi.org/10.1029/2009GL039716, 2009.
Shanahan, T. M., Overpeck, J. T., Anchukaitis, K. J., Beck, J. W., Cole, J. E., Dettman, D. L., Peck, J. A., Scholz, C. A., and King, J. W.: Atlantic Forcing of Persistent Drought in West Africa, Science, 324, 377–380, 2009.
Shane, P.: Tephrochronology: a New Zealand case study, Earth-Sci. Rev., 49, 223–259, 2000.
Shane, P. and Hoverd, J.: Distal record of multi-sourced tephra in Onepoto Basin, Auckland, New Zealand: Implications for volcanic chronology, frequency and hazards, Bull. Volcanol., 64, 441–454, 2002.
Shane, P. and Sandiford, A.: Paleovegetation of marine isotope stages 4 and 3 in Northern New Zealand and the age of the widespread Rotoehu tephra, Quat. Res., 59, 420–429, https://doi.org/10.1016/S0033-5894(03)00044-9, 2003.
Simon, Q., St-Onge, G., and Hillaire-Marcel, C.: Late Quaternary chronostratigraphic framework of deep Baffin Bay glaciomarine sediments from high-resolution paleomagnetic data, Geochem. Geophy. Geosy., 13, 1–24, 2012.
Simon, Q., Bourlès, D. L., Bassinot, F., Nomade, S., Marino, M., Ciaranfi, N., Girone, A., Maiorano, P., Thouveny, N., Choy, S., Dewilde, F., Scao, V., Isguder, G., and Blamart, D.: Authigenic 10Be/9Be ratio signature of the Matuyama–Brunhes boundary in the Montalbano Jonico marine succession, Earth Planet. Sc. Lett., 460, 255–267, https://doi.org/10.1016/j.epsl.2016.11.052, 2016.
Simon, Q., Ledru, M.-P., Oliveira Sawakuchi, A., Favier, C., Mineli, T. D., Grohmann, C. H., Guedes, M., Bard, E., Thouveny, N., Garcia, M., Tachikawa, K., Rodríguez-Zorro, P. A., and ASTER Team: Chronostratigraphy of a 1.5 ± 0.1 Ma composite sedimentary record from Colônia basin (SE Brazil): Bayesian modeling based on paleomagnetic, authigenic 10Be/9Be, radiocarbon and luminescence dating, Quat. Geochronol., 58, 101081, https://doi.org/10.1016/j.quageo.2020.101081, 2020a.
Simon, Q., Thouveny, N., Bourlès, D. L., and Valet, J.: Cosmogenic 10Be production records reveal dynamics of geomagnetic dipole moment (GDM) over the Laschamp excursion (20–60 ka), Earth Planet. Sc. Lett., 550, 116547, https://doi.org/10.1016/j.epsl.2020.116547, 2020b.
Smith, J. D. and Foster, J. H.: Geomagnetic Reversal in Brunhes Normal Polarity Epoch, Science, 163, 565–567, 1969.
Stanley, D. J. and Hait, A. K.: Deltas, radiocarbon dating, and measurements of sediment storage and subsidence, Geology, 28, 295–298, 2000.
Stanton, T., Nilsson, A., Snowball, I., and Muscheler, R.: Assessing the reliability of Holocene relative palaeointensity estimates: a case study from Swedish varved lake sediments, Geophys. J. Int., 187, 1195–1214, https://doi.org/10.1111/j.1365-246X.2011.05049.x, 2011.
Stephens, T., Atkin, D., Cochran, U., Augustinus, P., Reid, M., Lorrey, A., Shane, P., and Street-Perrott, A.: A diatom-inferred record of reduced effective precipitation during the Last Glacial Coldest Phase (28.8–18.0 cal kyr BP) and increasing Holocene seasonality at Lake Pupuke, Auckland, New Zealand, J. Paleolimnol., 48, 801–817, https://doi.org/10.1007/s10933-012-9645-y, 2012.
Stockhecke, M., Kwiecien, O., Vigliotti, L., Anselmetti, F. S., Beer, J., Çağatay, M. N., Channell, J. E. T., Kipfer, R., Lachner, J., Litt, T., Pickarski, N., and Sturm, M.: Chronostratigraphy of the 600 000 year old continental record of Lake Van (Turkey), Quat. Sci. Rev., 104, 8–17, https://doi.org/10.1016/j.quascirev.2014.04.008, 2014.
Tauxe, L.: Sedimentary records of relative paleointensity of the geomagnetic field: Theory and practice, Rev. Geophys., 31, 319–354, 1993.
Thiel, C., Buylaert, J. P., Murray, A., Terhorst, B., Hofer, I., Tsukamoto, S., and Frechen, M.: Luminescence dating of the Stratzing loess profile (Austria) – Testing the potential of an elevated temperature post-IR IRSL protocol, Quat. Int., 234, 23–31, https://doi.org/10.1016/j.quaint.2010.05.018, 2011.
Thiel, C., Horváth, E., and Frechen, M.: Revisiting the loess/palaeosol sequence in Paks, Hungary: A post-IR IRSL based chronology for the “Young Loess Series”, Quat. Int., 319, 88–98, https://doi.org/10.1016/j.quaint.2013.05.045, 2014.
Thompson, R. and Oldfield, F.: Environmental magnetism, 1st edn., Allen & Unwin, London, 1986.
Thouveny, N., Carcaillet, J., Moreno, E., Leduc, G., and Nérini, D.: Geomagnetic moment variation and paleomagnetic excursions since 400 kyr BP: a stacked record from sedimentary sequences of the Portuguese margin, Earth Planet. Sc. Lett., 219, 377–396, https://doi.org/10.1016/S0012-821X(03)00701-5, 2004.
Tric, E., Laj, C., Valet, J. P., Tucholka, P., Paterne, M., and Guichard, F.: The Blake geomagnetic event: transition geometry, dynamical characteristics and geomagnetic significance, Earth Planet. Sc. Lett., 102, 1–13, https://doi.org/10.1016/0012-821X(91)90013-8, 1991.
Valet, J.-P. and Meynadier, L.: A comparison of different techniques for relative paleointensity, Geophys. Res. Lett., 25, 89–92, 1998.
van den Boogaart, K. G., Tolosana-Delgado, R., and Bren, M.: compositions: Compositional Data Analysis R package version 1.40-2, available at: https://cran.r-project.org/package=compositions (last access: 10 July 2020), 2018.
Vandergoes, M. J., Newnham, R. M., Preusser, F., Hendy, C. H., Lowell, T. V, Fitzsimons, S. J., Hogg, A. G., Kasper, H. U., and Schluchter, C.: Regional insolation forcing of late Quaternary climate change in the Southern Hemisphere, Nature, 436, 242–245, https://doi.org/10.1038/nature03826, 2005.
Vandergoes, M. J., Hogg, A. G., Lowe, D. J., Newnham, R. M., Denton, G. H., Southon, J., Barrell, D. J. A., Wilson, C. J. N., McGlone, M. S., Allan, A. S. R., Almond, P. C., Petchey, F., Dabell, K., Dieffenbacher-Krall, A. C., and Blaauw, M.: A revised age for the Kawakawa/Oruanui tephra, a key marker for the Last Glacial Maximum in New Zealand, Quat. Sci. Rev., 74, 195–201, https://doi.org/10.1016/j.quascirev.2012.11.006, 2013.
Wagner, G., Masarik, J., Beer, J., Baumgartner, S., Imboden, D., Kubik, P. W., Synal, H.-A., and Suter, M.: Reconstruction of the geomagnetic field between 20 and 60 kyr BP from cosmogenic radionuclides in the GRIP ice core, Nucl. Instruments Methods Phys. Res. Sect. B Beam Interact. with Mater. Atoms, 172, 597–604, https://doi.org/10.1016/S0168-583X(00)00285-8, 2000.
White, D. A., Fink, D., Post, A. L., Simon, K., Galton-Fenzi, B., Foster, S., Fujioka, T., Jeromson, M. R., Blaxell, M., and Yokoyama, Y.: Beryllium isotope signatures of ice shelves and sub-ice shelf circulation, Earth Planet. Sc. Lett., 505, 86–95, 2019.
Wilcken, K. M., Fujioka, T., Fink, D., Fülöp, R. H., Codilean, A. T., Simon, K., Mifsud, C., and Kotevski, S.: SIRIUS Performance: 10Be, 26Al and 36Cl measurements at ANSTO, Nucl. Inst . Methods Phys. Res. B, 455, 300–304, https://doi.org/10.1016/j.nimb.2019.02.009, 2019.
Willenbring, J. K. and von Blanckenburg, F.: Meteoric cosmogenic Beryllium-10 adsorbed to river sediment and soil: Applications for Earth-surface dynamics, Earth-Sci. Rev., 98, 105–122, https://doi.org/10.1016/j.earscirev.2009.10.008, 2010.
Wittmann, H., Blanckenburg, F. Von, Bouchez, J., Dannhaus, N., Naumann, R., Christl, M., and Gaillardet, J.: The dependence of meteoric 10Be concentrations on particle size in Amazon River bed sediment and the extraction of reactive 10Be/9Be ratios, Chem. Geol., 318–319, 126–138, https://doi.org/10.1016/j.chemgeo.2012.04.031, 2012.
Wittmann, H., Blanckenburg, F., Dannhaus, N., Bouchez, J., Gaillardet, J., Guyot, J. L., Maurice, L., Roig, H., Filizola, N., and Christl, M.: A test of the cosmogenic 10Be(meteoric)/9Be proxy for simultaneously determining basin-wide erosion rates, denudation rates, and the degree of weathering in the Amazon basin, J. Geophys. Res.-Earth Surf., 120, 2498–2528, https://doi.org/10.1002/2015JF003581.Received, 2015.
Xuan, C., Channell, J. E. T., Polyak, L., and Darby, D. A.: Paleomagnetism of Quaternary sediments from Lomonosov Ridge and Yermak Plateau: implications for age models in the Arctic Ocean, Quat. Sci. Rev., 32, 48–63, https://doi.org/10.1016/j.quascirev.2011.11.015, 2012.
Zawalna-Geer, A., Lindsay, J. M., Davies, S., Augustinus, P., and Davies, S.: Extracting a primary Holocene crytoptephra record from Pupuke maar sediments, Auckland, New Zealand, J. Quaternary Sci., 31, 442–457, https://doi.org/10.1002/jqs.2866, 2016.
Zhu, R. X., Zhou, L. P., Laj, C., Mazaud, A., and Ding, Z. L.: The Blake geomagnetic polarity episode recorded in Chinese loess, Geophys. Res. Lett., 21, 697–700, 1994.
Zolitschka, B., Anselmetti, F., Ariztegui, D., Corbella, H., Francus, P., Lücke, A., Maidana, N. I., Ohlendorf, C., Schäbitz, F., and Wastegård, S.: Environment and climate of the last 51 000 years – new insights from the Potrok Aike maar lake Sediment Archive Drilling prOject (PASADO), Quat. Sci. Rev., 71, 1–12, https://doi.org/10.1016/j.quascirev.2012.11.024, 2013.
The ZAF correction method refers to the consideration of the atomic number (Z), absorption of X-rays (A), and fluorescence (F).
- Abstract
- Introduction
- Regional setting
- Material and methods
- Results
- Discussion
- Conclusions and outlook for chronology development of long sediment sequences
- Appendix A: Tephra
- Appendix B: Luminescence dating
- Appendix C: Palaeomagnetism
- Appendix D: Beryllium
- Data availability
- Author contributions
- Competing interests
- Acknowledgements
- Financial support
- Review statement
- References
- Supplement