the Creative Commons Attribution 4.0 License.
the Creative Commons Attribution 4.0 License.
 | 19 Apr 2021
Uranium incorporation in fluorite and exploration of U–Pb dating
Louise Lenoir
Thomas Blaise
Andréa Somogyi
Benjamin Brigaud
Jocelyn Barbarand
Claire Boukari
Julius Nouet
Aurore Brézard-Oudot
Maurice Pagel
The age of ore deposits constitutes a decisive element in understanding their formation. Deciphering their precise chronology may be a challenge in the absence of mineral phases that can be dated by conventional geochronometers. Fluorite is very common either as the major or accessory mineral in a wide variety of ores and may provide information regarding the origin and timing of mineralizing fluid flows. In this contribution, we explore U–Pb dating on fluorite crystals from the world-class carbonate strata-bound fluorite ore of Pierre-Perthuis in Burgundy (Morvan massif, France). The uranium distribution within fluorite is mapped using induced fission-track and synchrotron radiation X-ray fluorescence nano-imaging, showing that higher U content is measured in an overgrowth of fluorite (Flog) as a discrete band. Preservation of a micrometer-thick zonation in U, associated with other substituted elements such as Sr, Y, Fe and Zr, implies that neither solid-state diffusion nor dissolution–recrystallization occurred. These U-bearing external fluorite overgrowths contain solid inclusions of about 30 µm globular pyrite crystals with a mean δ34S of −23.6 ± 0.4 ‰V-CDT. We propose that the U incorporation in the fluorite lattice results from the development of a redox front during bacterial sulfate reduction. Flog generation sampled and analyzed by laser ablation–inductively coupled plasma mass spectrometry (LA-ICP-MS) on four different crystals provides identical U–Pb ages within the limits of analytical uncertainty. Considered altogether, these four crystals yield an age estimate of 40.0 ± 1.7 Ma, not corrected for matrix-related elemental fractionation. Our results show that fluorite LA-ICP-MS U–Pb geochronology has potential for dating distinct crystal growth stages, although further research should be conducted to evaluate its accuracy.
- Article
(16125 KB) - Full-text XML
-
Supplement
(629 KB) - BibTeX
- EndNote


Sedimentary rocks lying unconformably on a crystalline basement may host large concentrations of authigenic F, Ba, Pb, Zn and U minerals that are of economic interest (Boiron et al., 2002; Gigon et al., 2020; Gigoux et al., 2015; Leach et al., 2005; Sizaret, 2006). These unconformity-related deposits are usually the result of multiple episodes of fluid flow, inducing mineral dissolution–recrystallization, remobilization and precipitation (Chi et al., 2018; Walter et al., 2018). Knowing the timing of these successive fluid flow events is essential for building robust genetic models for mineral deposits. Fluorite, one of the 27 raw materials defined as crucial for the economy of the European Union (European Commission, 2017), commonly occurs in mineral assemblages in veins or strata-bound deposits. Fluorite Sm–Nd geochronology (Chesley et al., 1991; Galindo et al., 1994; Dill et al., 2011) might help to reconstruct the geological scenario that led to the mineral deposition, together with other direct radiometric dating of authigenic phases, either by bulk dissolution, e.g., Rb–Sr on sphalerite (Nakai et al., 1993), Re–Os on molybdenite (Markey et al., 1998; Stein et al., 2001) and Re–Os on pyrite (Cardon, 2007; Mathur et al., 2000), or by in situ sampling and analysis, e.g., Ar–Ar on adularia (Cathelineau et al., 2012; Mark et al., 2005), Ar–Ar on Mn oxides (Deng and Li, 2017) or U–Pb on uraninite (Alexandre et al., 2009; Martz et al., 2019).
However, it is common that fluorite Sm–Nd geochronology produces errorchrons, and additionally, when the age estimation is considered geologically consistent, results may be unreliable due to poor analytical precision. Moreover, it is sometimes difficult to interpret Sm–Nd ages when they are obtained from the bulk dissolution of a crystal fragment that may be composed of several growth stages. To overcome these issues, a non-radiometric method based on the acquisition of chemical remnant magnetization in fluorite has been developed and employed to date fluorite deposits in areas where the geodynamic evolution and the apparent polar wander path are well documented (Kawasaki and Symons, 2008; Symons, 1994; Symons et al., 2017). Along with other elements, fluorite accepts the incorporation of U and Pb in its crystal lattice in substitution for Ca2+ (typically at low concentrations from a few parts per million to a few per mill; Piccione et al., 2019). As a result, fission-track (Grønlie et al., 1990) and (U–Th) He (Evans et al., 2005; Wolff et al., 2015) thermochronology have been tested in fluorite. Wolff et al. (2016) show that He diffusion in fluorite varies depending on elemental substitution in the crystal lattice.
In recent years, in situ U–Pb geochronology has been successfully applied to a growing number of mineral matrices, including calcite and dolomite (Burisch et al., 2017), hematite (Walter et al., 2018), opal (Nuriel et al., 2019), cassiterite (Moscati and Neymark, 2020), Mn-rich chrysocolla and pseudomalachite (Kahou et al., 2020), epidote (Peverelli et al., 2021), and nacrite and fluorite (Piccione et al., 2019). Piccione et al. (2019) reported for the first time laser ablation–inductively coupled plasma mass spectrometry (LA-ICP-MS) U–Pb ages acquired on fluorite that are consistent with those of adjacent nacrite crystals, showing that fluorite U–Pb geochronology can constrain the timing of fluid flows and provide favorable U Pb. However, the incorporation and retention of U and Pb in the crystal structure of CaF2 are very poorly documented, hence currently limiting the reliability of fluorite U–Pb dating. Moreover, compared to other common Pb-bearing minerals, fluorite sampling by laser ablation presents some additional analytical challenges, such as laser-induced damage (De Bonis et al., 2014; Jia et al., 2005; Rafique et al., 2012) and ejection of solid fragments causing variable ablation rates (Gogoll et al., 1996).
The aim of this study is to examine the spatial distribution of U and Pb and to further explore small-scale LA-ICP-MS U–Pb geochronology in fluorite crystals. The unconformity-related F–Ba ore in Pierre-Perthuis (Morvan massif, France) was chosen as a case study. This ore has been investigated in previous studies (Gigoux et al., 2015, 2016), and a generation of macroscopic geodic fluorite has been dated at 130 ± 15 Ma by Sm–Nd geochronology (Gigoux et al., 2015). As in many other F–Ba deposits, the most commonly used geochronometers are lacking in Pierre-Perthuis, making it an interesting target to gain knowledge on fluorite precipitation ages through fluorite U–Pb dating. Through the use of various petro-geochemical investigations involving multiple analytical methods, including induced fission-track mapping, synchrotron radiation X-ray fluorescence nano-imaging, secondary ion mass spectrometry and LA-ICP-MS, this paper will address the following questions.
-
How are U and Pb spatially distributed within micrometer-thick fluorite growth bands?
-
How is U incorporated in fluorite?
-
Are U and Pb effectively retained in fluorite?
-
Can we use fluorite U–Pb geochronology to gain knowledge of the chronology of fluid flows?
The studied area is located at the unconformity between the Paris Basin and the French Massif Central (FMC), about 200 km southeast of Paris. The Paris Basin is an intracratonic sedimentary basin that formed above Cadomian and Variscan basement rocks (Guillocheau, 2000). The FMC was structured during the Variscan orogeny (Lardeaux et al., 2014; Vialette, 1973). The northern edge of the FMC corresponds to the Morvan massif made up mostly of granitic rocks emplaced during the early and late Carboniferous (Lardeaux et al., 2014; Vialette, 1973). The northern Morvan basement is composed of three granitic units (namely Avallon, Lormes and Les Settons) and a metamorphic unit (lower gneiss unit). The Pierre-Perthuis ore is spatially related to an unconformity between the Avallon granite basement and the Late Triassic sediments on the northwestern part of the Morvan massif (Fig. 1a). Two main geological units crop out at Pierre-Perthuis: (1) the Avallon two-mica granite, which shows a weathered zone of about 0.5 to 3 m thickness at its top; and (2) 4 to 8 m of silicified dolostone that corresponds to the Assise de Chitry Formation (Fm), a Carnian–Norian dolomite formation (235–208 Ma) silicified after the deposition (Fig. 1b). The main fluorite mineralization forms euhedral (cubic habits) fluorite crystals dispersed within the silicified dolomite rock. A second occurrence forms centimeter cubic fluorite in geodic cavities that crystallized under a relatively narrow temperature range of 80–100 ∘C (Gigoux et al., 2016). Both fluorite mineralizations are complemented by two barite stages (an early small blade-shaped barite stage and a late fan-shaped pink barite stage), three quartz stages (a microcrystalline stage responsible for the silicification of the Assise de Chitry Fm co-precipitated with chalcopyrite, followed by a quartz fringe stage and a late granular stage) and at least four sulfide stages.
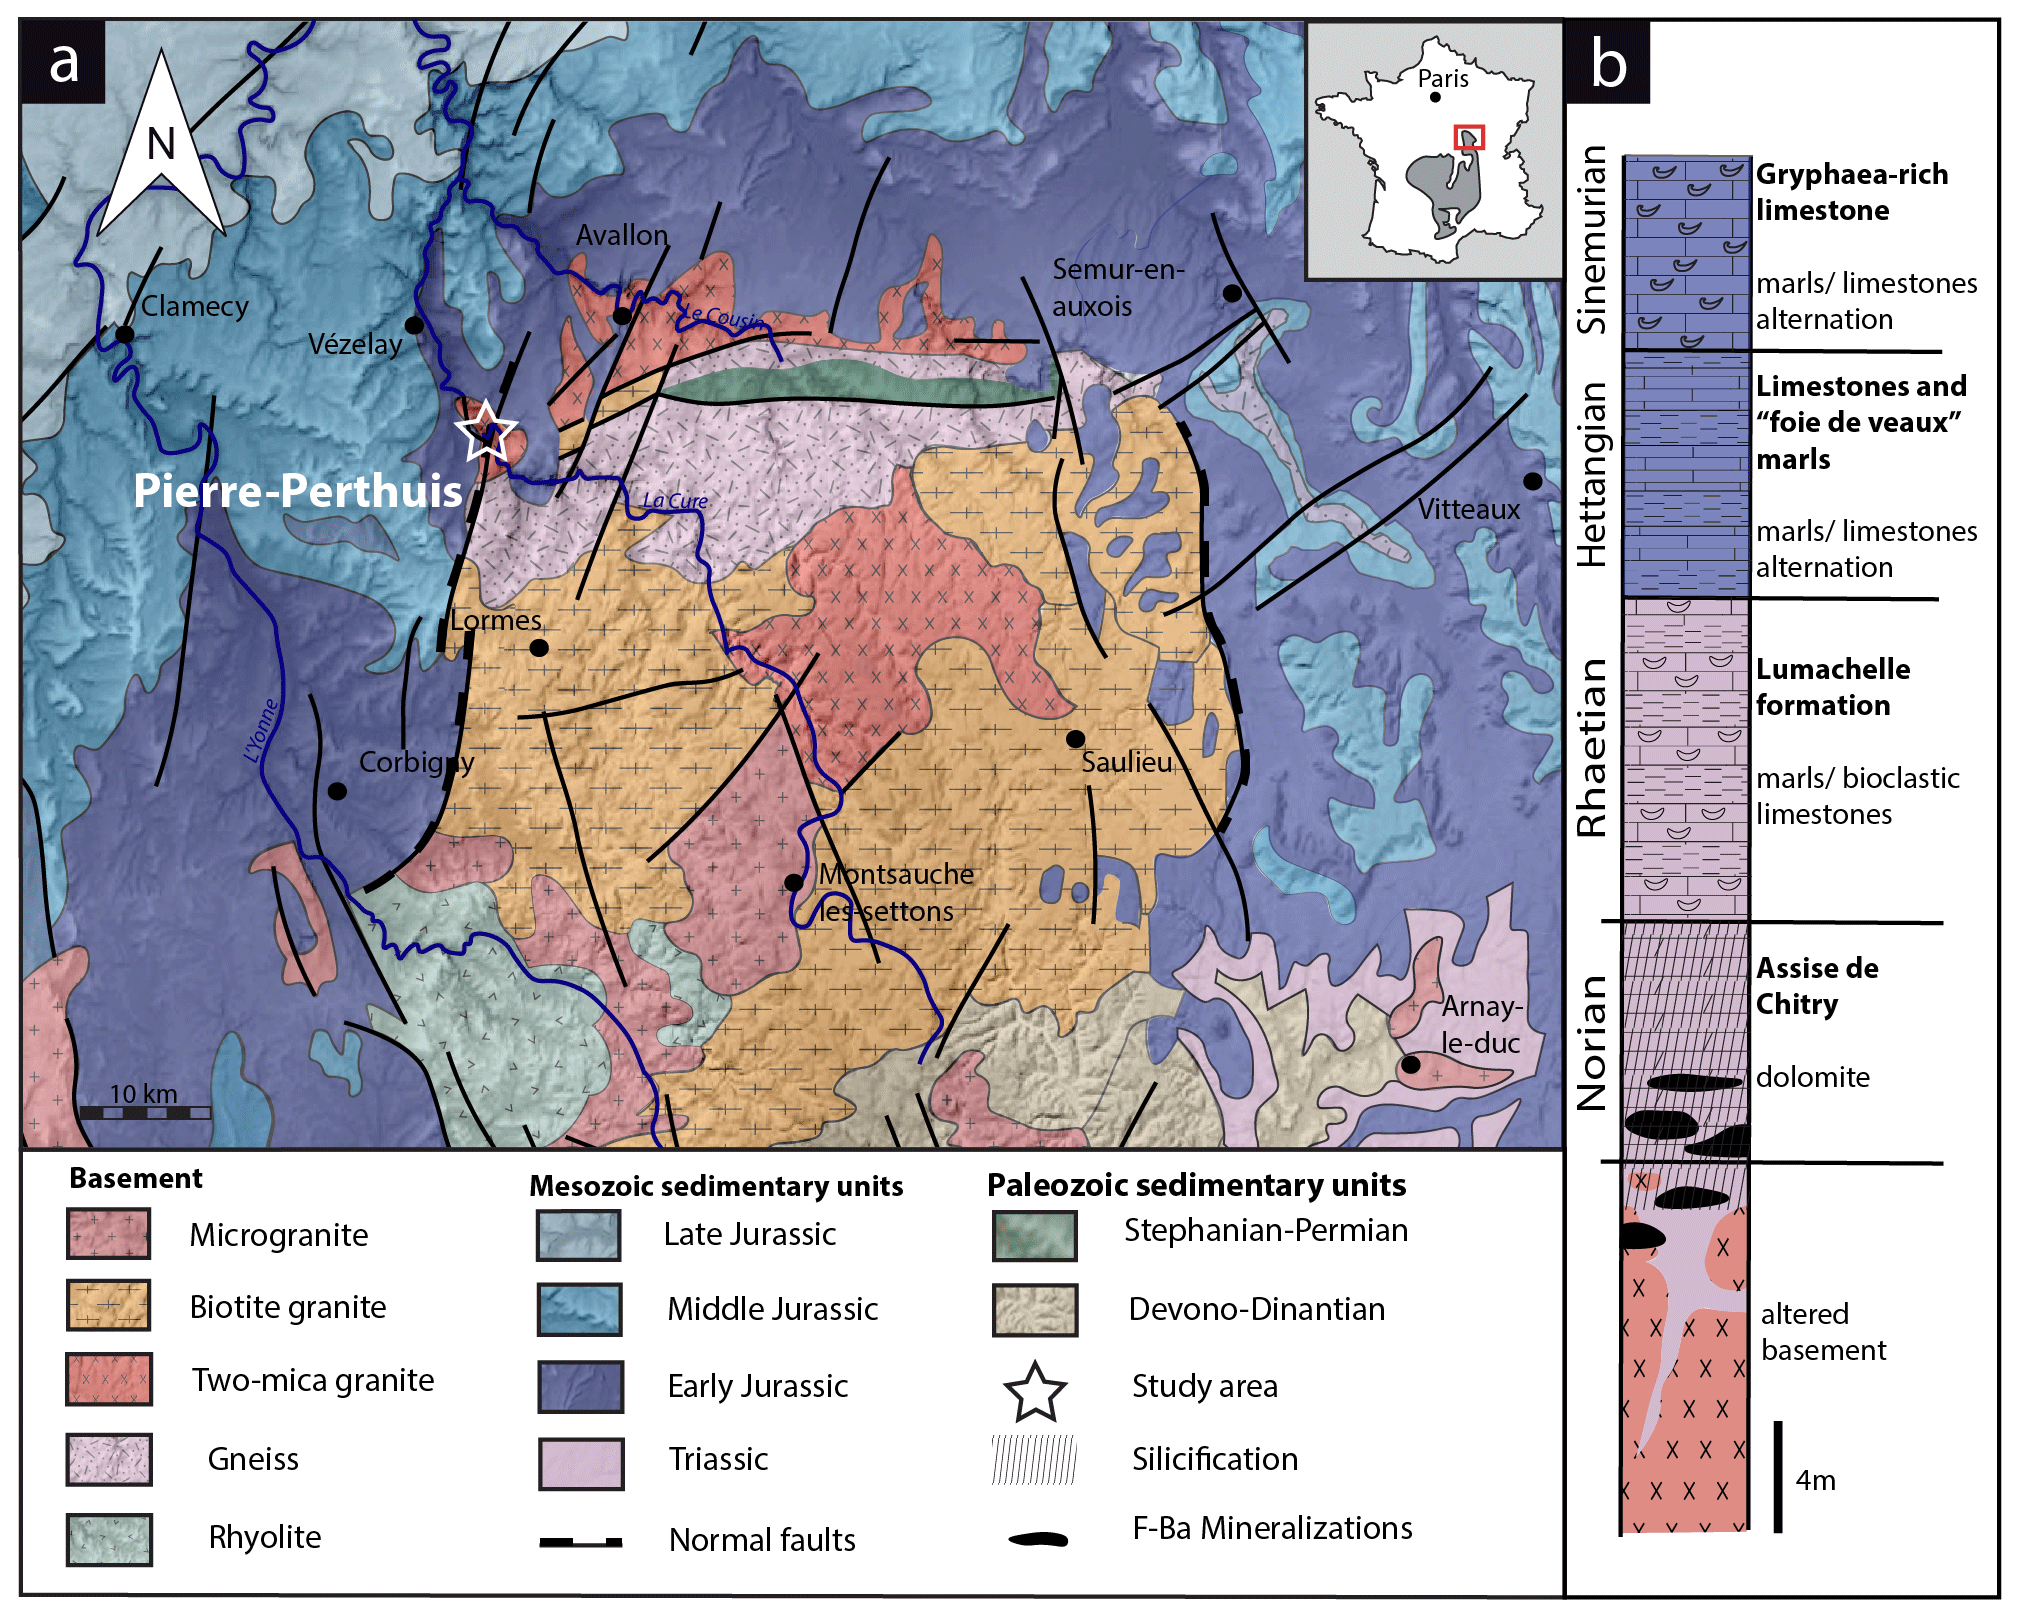
Figure 1(a) Geological map of the Morvan massif with the location of the strata-bound fluorite ore of Pierre-Perthuis (modified according to the 1 : 1 000 000 geological map, BRGM) and its (b) stratigraphic log modified according to Soulé de Lafont and Lhégu (1980).
3.1 Sampling strategy
The Pierre-Perthuis district is composed of three areas: (1) Bois Dampierre, (2) Bois de l'Epenay and (3) La roche percée (Fig. 2a). All samples were collected at the Pierre-Perthuis ore from outcropping rocks in the weathered granite (Fig. 2b) close to the sedimentary cover and are summarized in Table 1.
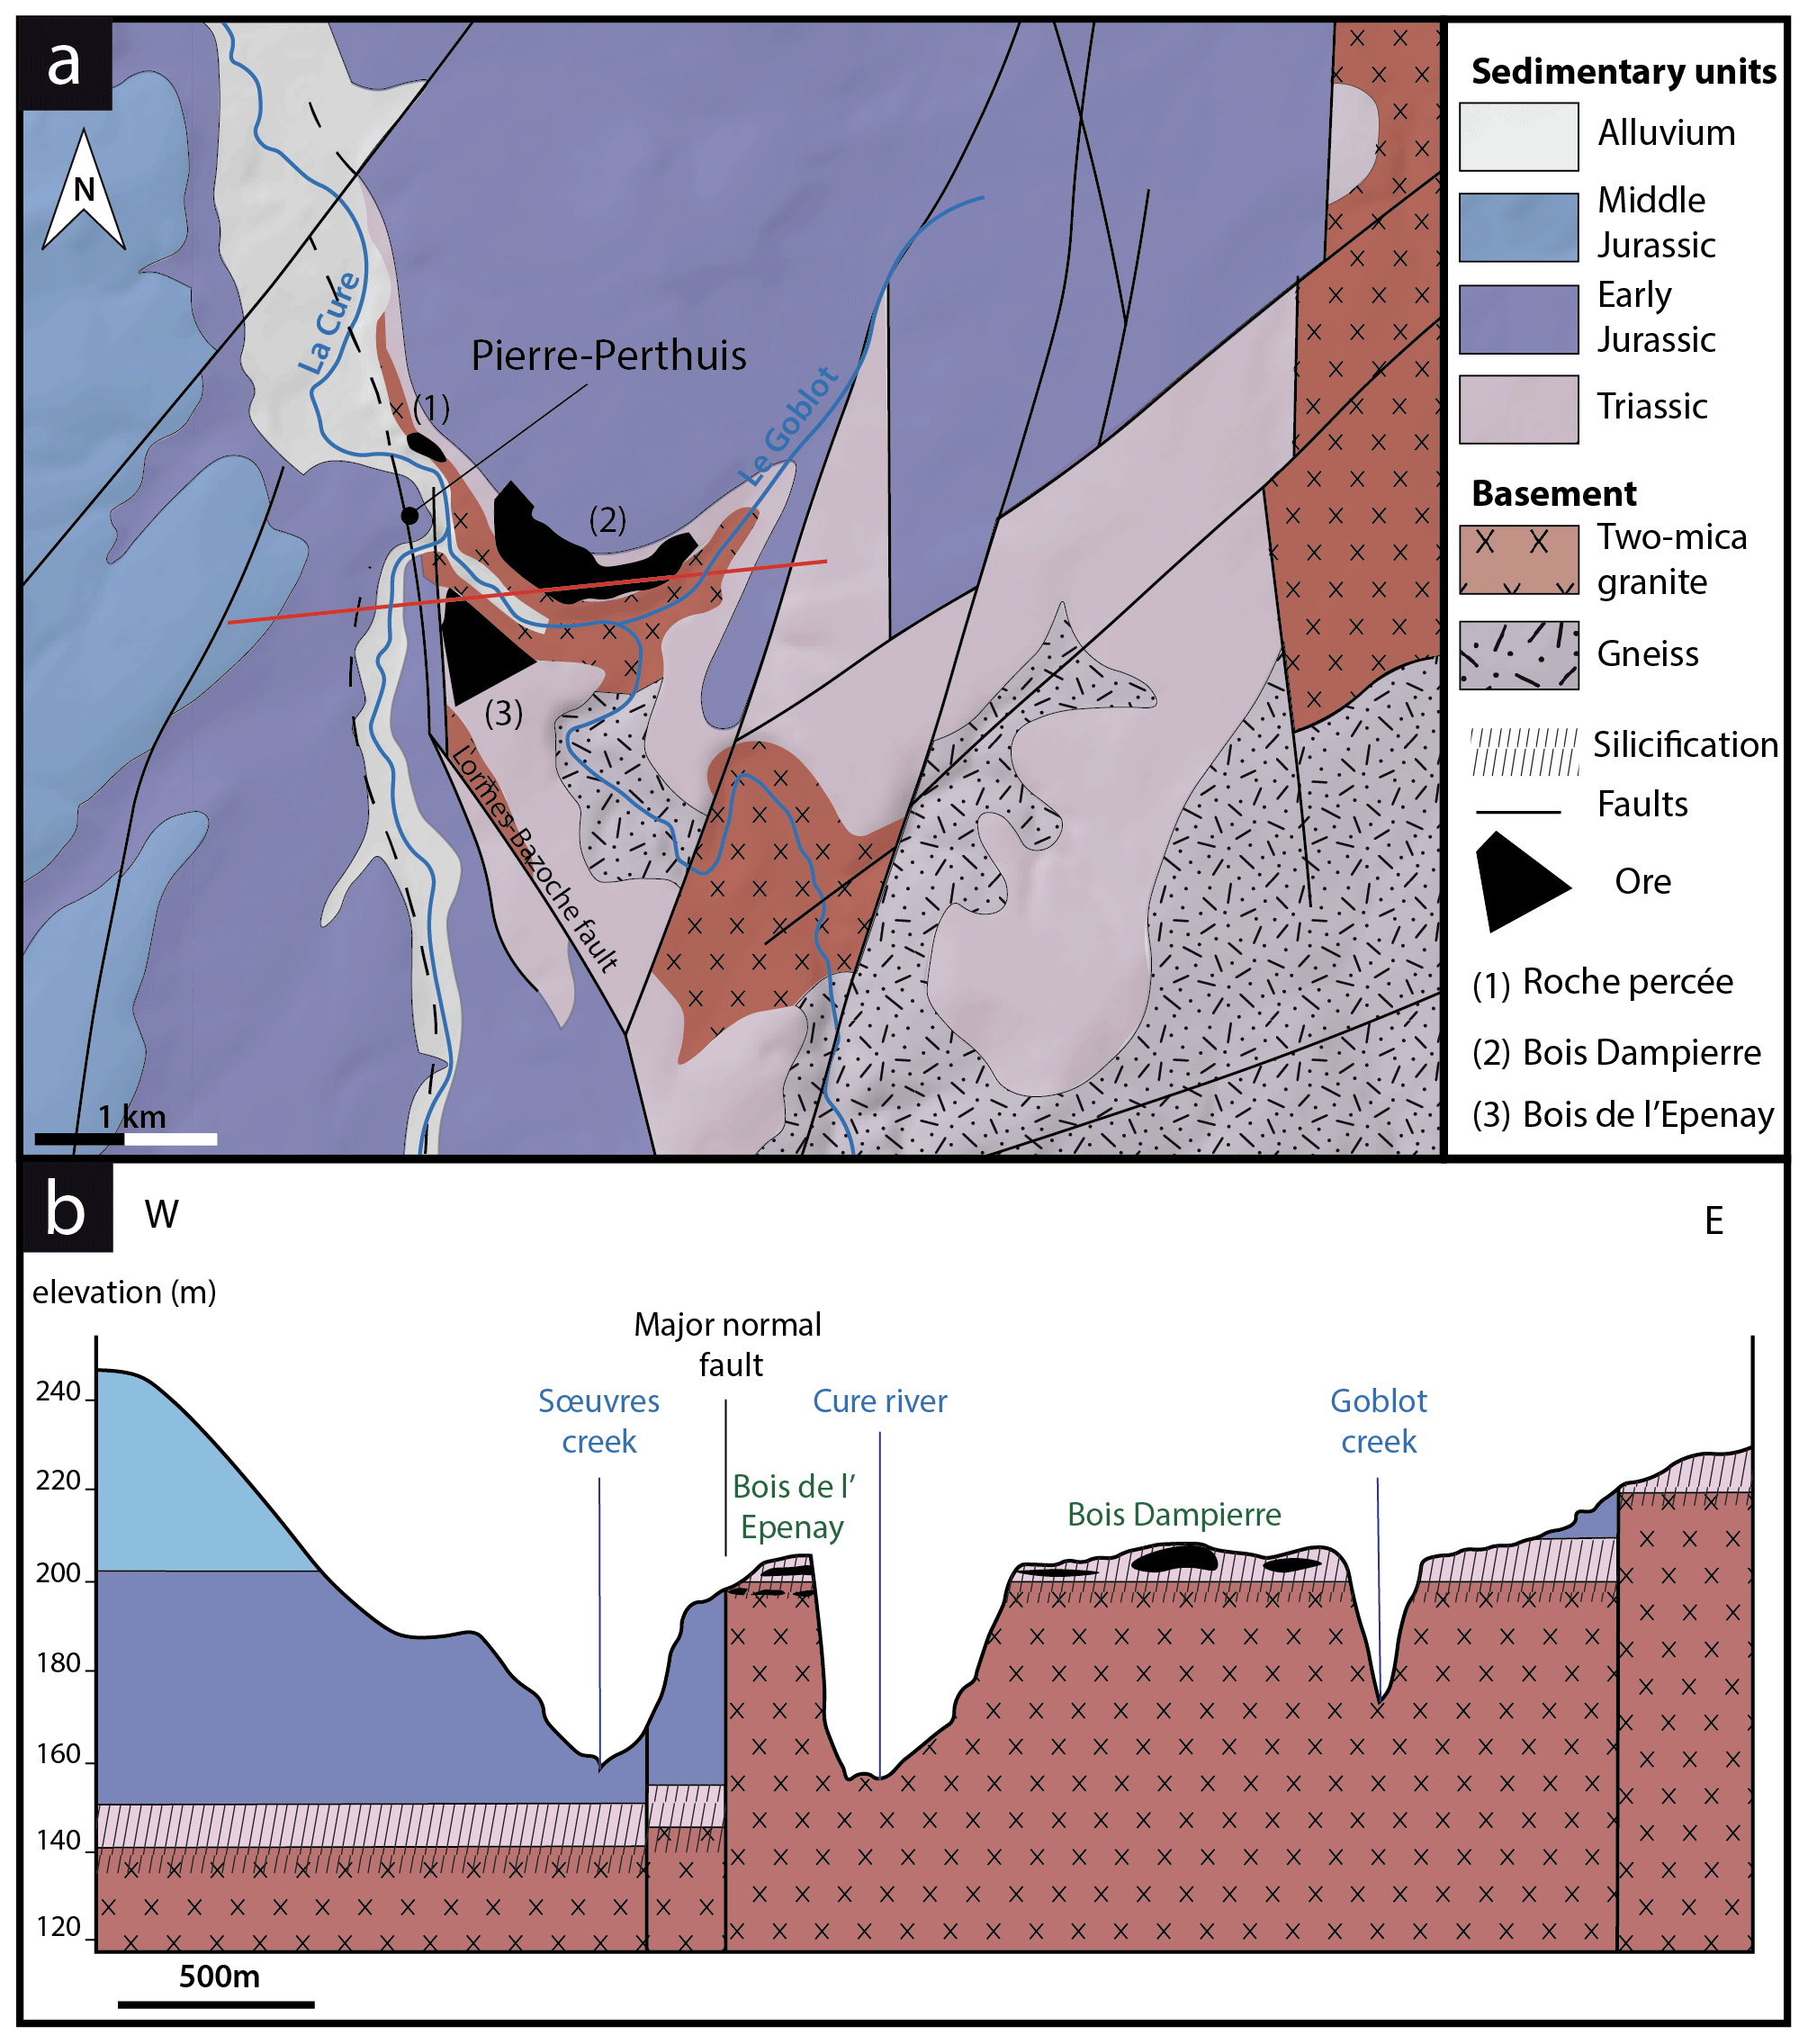
Figure 2(a) Location of the mineralized outcrops at Pierre-Perthuis and (b) a W–E geological profile localized on the geological map by the red line, modified according to the 1 : 50 000 geological map of Avallon (Horon et al., 1966; Gigoux et al., 2016; Soulé de Lafont and Lhégu, 1980).
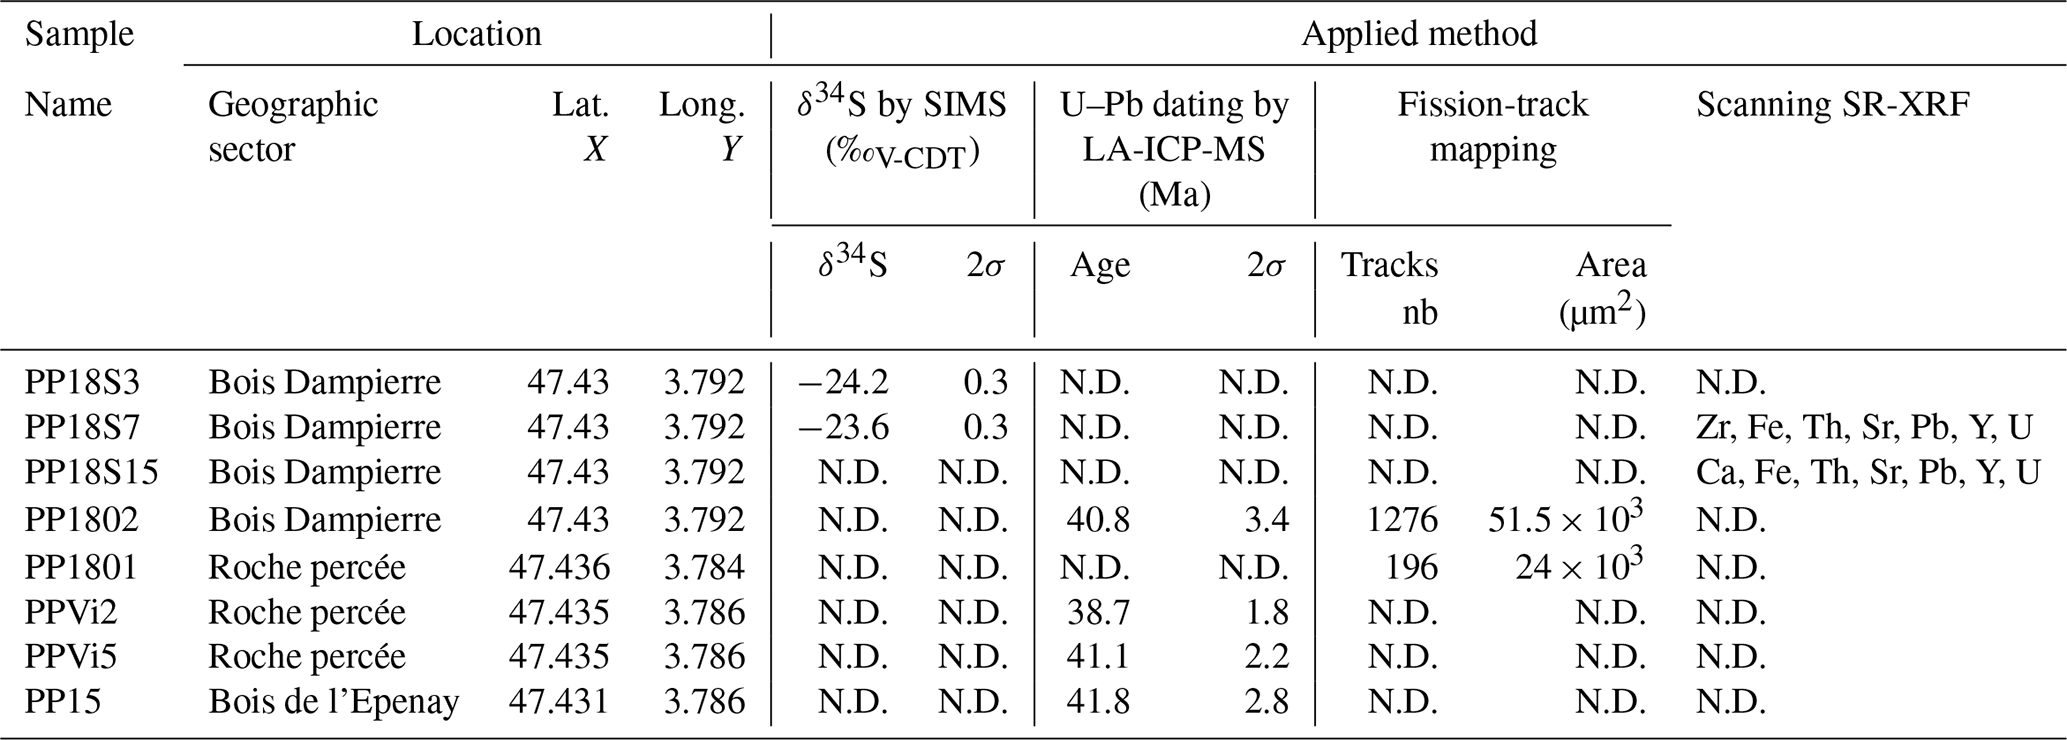
Table 1Sample location, sulfur stable isotopic composition of pyrite, fluorite U–Pb age, fission track and scanning SR-XRF of fluorite (N.D. – not determined).
3.2 Petrographic observations
Polished thin sections were investigated with optical microscopy in transmitted and reflected light, as well as under cathodoluminescence (CL) equipment composed of a BX41 microscope coupled to a cold cathode from NewTec operating at 12 kV and 200–300 µA and a Qicam Fast 1394 digital camera. More details about the cathodoluminescence activators and inhibitors in fluorite can be found in Baele et al. (2012) and Kempe et al. (2002). Uncoated polished thin sections were also imaged and analyzed by scanning electron microscopy (SEM, Phenom X Pro) using a charge compensation sample holder in backscattered electron mode (BSE). Images were produced at an acceleration voltage of 15 keV. Semi-quantitative elemental compositions were measured through energy-dispersive X-ray spectrometry (EDS) at an acceleration voltage of 15 keV and an accumulation time of 30 s.
3.3 Uranium distribution mapping
To map the U distribution in fluorite crystals of the Pierre-Perthuis ore, the fission-track cartography based on the induced fission of 235U was carried out using the external detector method (Gleadow, 1981). Fluorite crystals were mounted in an epoxy resin and polished. Polished sections were covered by muscovite detectors in close contact and irradiated in the Research Neutron Source Heinz Maier-Leibnitz (FRM II) at the Technical University of Munich (Garching, Germany). Thermal neutron fluence was 1 × 10¹⁶ neutrons cm−2. Track densities are calibrated using the standard reference glass CN5 with a total U concentration of 12.17 ppm. After irradiation, the external detectors were detached and etched in 48 % HF at 20 ± 1 ∘C for 20 min. Induced fission tracks revealed on detectors were observed and counted using a Leica DMLM optical microscope in transmitted light with 1000× magnification.
The correction factor for U concentration between a standard and any unknown geological material depends on the range of latent track lengths and the density of materials (Enkelmann et al., 2005). The latent track lengths of fission particles (2R) in fluorite have been simulated using SRIM® software (Ziegler et al., 2010). Numerical data employed and results of these simulations are summarized in Table A1. The calculated correction factor (Fcorr) for U concentration in fluorite is 0.866.
3.4 Scanning synchrotron radiation X-ray fluorescence nano-imaging
Fluorite crystals were mounted in an epoxy resin, polished on both sides to a thickness of 100 µm and cut into 5 mm edge squares. These mounts were fixed on Teflon rings and positioned perpendicular to the incoming X-ray beam.
Seven fluorite samples were scanned by synchrotron radiation X-ray fluorescence (SR-XRF) using the Nanoscopium hard X-ray nanoprobe beamline (Bergamaschi et al., 2017; Somogyi et al., 2015) of synchrotron SOLEIL (Université Paris-Saclay, Saint Aubin, France). Elemental distribution mapping was acquired from these polished sections in different areas at a spatial resolution varying from 50 nm to 1 µm and with an integration time per pixel varying from 150 to 20 ms. The 18 keV monochromatic X-ray beam was focused on the crystal samples by a Kirckpatrick–Baez nano-focusing mirror. This excitation energy of 18 keV was chosen farther away from the U-L3 absorption edge (17.168 keV) in order to avoid overlapping the U-L3 X-ray lines and the Compton scattering peak of the incident X-ray beam from the sample. This allows the optimization of the analytical sensitivity of U due to the reduced spectral background below the U-L3 lines. To obtain nanometer-scale resolution elemental maps on square-millimeter-sized samples, a fast continuous scanning technique (FLYSCAN) has been employed (Lanzirotti et al., 2010; Medjoubi et al., 2013). Full XRF spectra were collected at each pixel of the scans by two silicon drift detectors of 50 mm2 useful area (KETEK H50, KETEK GmbH) with XMAP (XIA LLC) fast digital multichannel analyzer cards. The XRF detectors were placed at 20∘ relative to the sample surface (Somogyi et al., 2015).
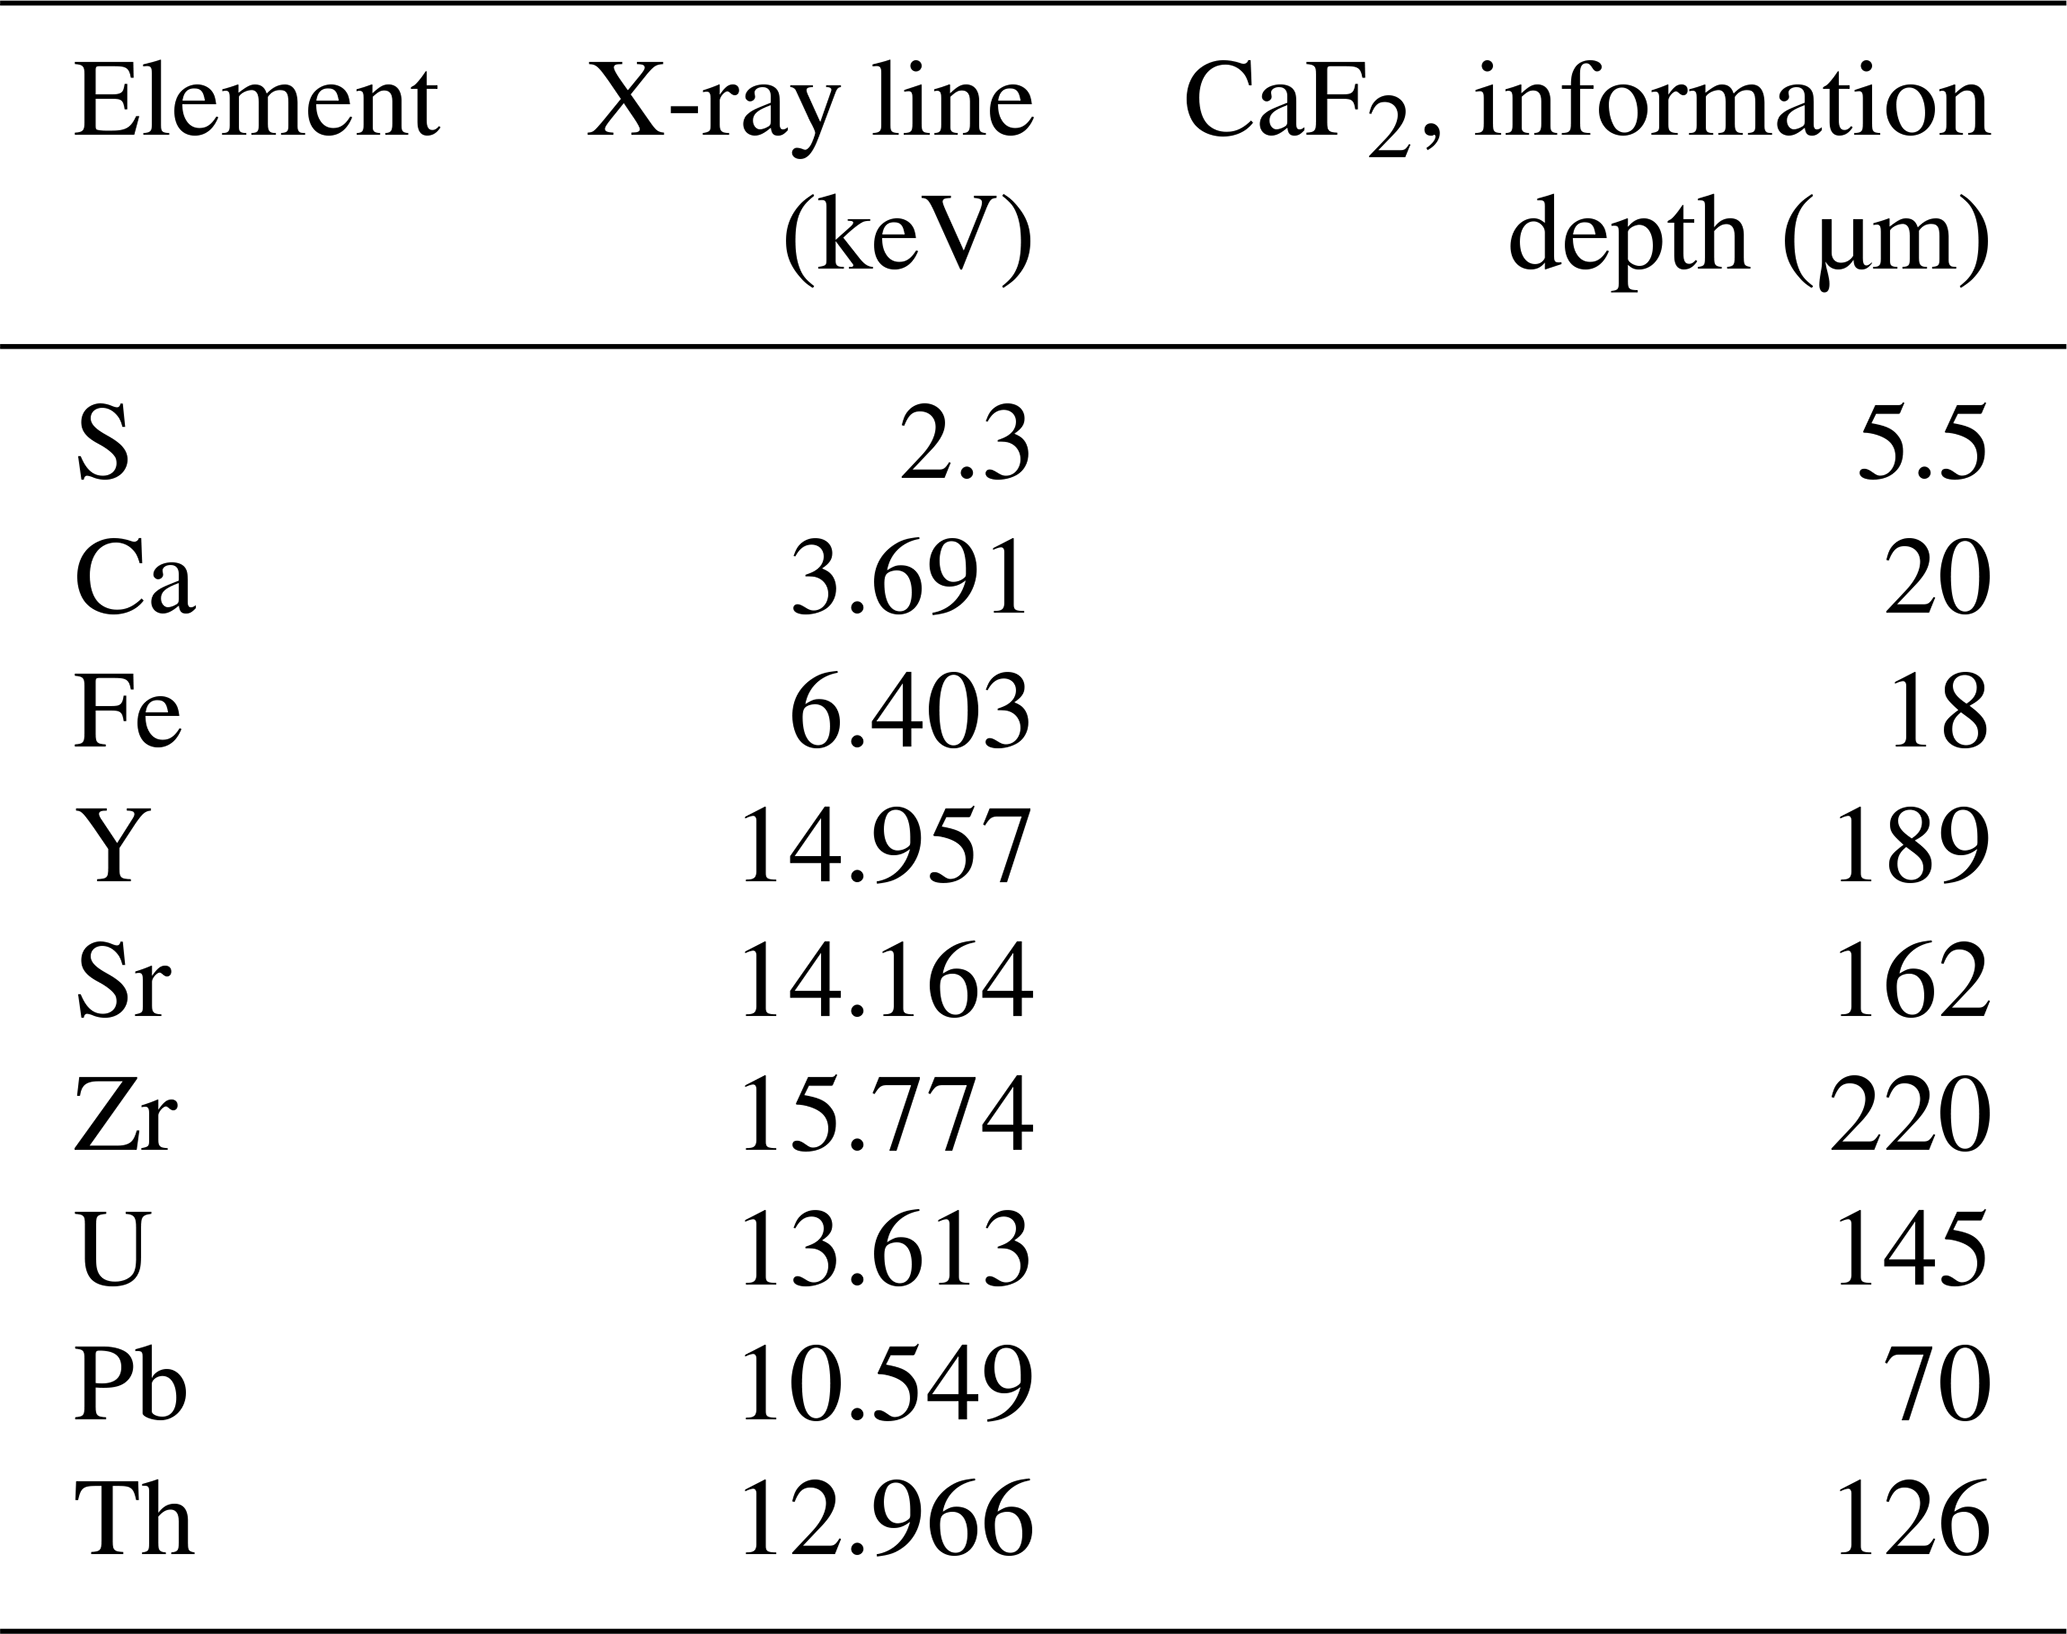
The high-resolution scans consisted of 100 000–300 000 individual XRF spectra corresponding to an XRF spectrum at each image pixel. In order to treat this dataset, as a first step we used the XRF sum spectrum of the entire scanned area to identify the main elements present. The distribution maps of these elements were reconstructed by an in-house MATLAB® code. Because the scanned areas sometimes included different mineral matrices (fluorite and pyrite) or successive growth bands of distinct chemical composition in the same mineral, sub-zones were defined by the MATLAB® code from the elemental distribution maps in order to extract the average XRF spectrum corresponding exclusively to the targeted mineral matrix or growth band. These sub-zones, or regions of interest (ROIs), were selected by using ImageJ® software (Schneider et al., 2012). The mean XRF spectra of the ROIs were fitted using PyMCA® software (Solé et al., 2007). This allowed us to identify additional elements present only in tiny areas or in small quantities (e.g., Th) and as such not detectable in the sum spectrum of the whole sample area. As a second step, the elemental distribution maps of all the identified elements were reconstructed by correcting for spectral overlaps depending on the intensity ratios of the X-ray lines. The depth of information specific to each element included in the present paper is documented in Table A3.
3.5 Sulfur stable isotope composition of pyrite
Sulfur isotopes were measured by secondary ion mass spectrometry (SIMS) using a multi-collector CAMECA IMS1270 E7 microprobe at the Centre de Recherches Pétrographiques et Géochimiques (CRPG, Université de Lorraine and CNRS) in Nancy (France). Samples that were already prepared for synchrotron XRF spectromicroscopy were reused. They were glued on a glass slide, then coated with a layer of 30 nm of Au. To accurately locate the SIMS analysis, petrographic observations using reflected light microscopy were carried out before and after gold plating. Pyrite inclusions in fluorite were sputtered with a 10 kV Cs+ primary ion beam with a current of 2.7 nA. A normal-incidence electron gun was used for charge compensation. 32S− and 34S− secondary ions were detected in multi-collection mode using two Faraday cups. Samples were pre-sputtered for 120 s with a beam raster of 20 × 20 µm prior to signal acquisition to minimize surface contamination. Faraday cup backgrounds were measured during the pre-sputtering before each analysis and then used for correcting the data. Typical count rates of 32S− and 34S− were 4.8 × 10⁸ and 2 × 10⁷ counts per second (cps), respectively, during 30 cycles of 4.96 s acquisition time. The spot size was about 15 µm in diameter. A nominal mass resolution () of 4998 was used to resolve interference with hydrides.
A Sierra pyrite sample was used as an internal matrix-match standard to correct the sulfur isotopic ratio. Data were integrated as a 32S 34S ratio (δ34S in ‰) and referenced to the Vienna-Canyon Diablo Troilite (V-CDT) scale (Ding et al., 2001). Homogeneity of the Sierra pyrite has been documented by LaFlamme et al. (2016) with three analytical techniques (EPMA: electron probe micro analysis, wavelength-dispersive X-ray spectroscopy maps and SEM-BSE) and its δ34S measured by fluorination gas-source mass spectrometry at 2.17 ± 0.08 ‰V-CDT. Measurements were carried out through daily sequences consisting of five analyses of matrix-match reference material followed by spots on unknown samples. For the first session, Sierra pyrite was measured at 0.94 ± 0.02 ‰V-CDT and at 0.92 ± 0.02 ‰V-CDT for the second analytical session. Instrumental mass fractionation (IMF) for 34SS− was quantified during each analytical session using all the replicated analyses of the matrix-match standard. During the first session the IMF was −1.23 ± 0.34 ‰V-CDT and −1.25 ± 0.28 ‰V-CDT for the second. Final uncertainties are reported at a 95 % confidence level (2σ), propagating the systematic uncertainty of the primary reference material Sierra pyrite (3.7 %; LaFlamme et al., 2016) and the propagated correction for instrumental mass fractionation through the analytical session by quadratic addition.
3.6 In situ U–Pb geochronology
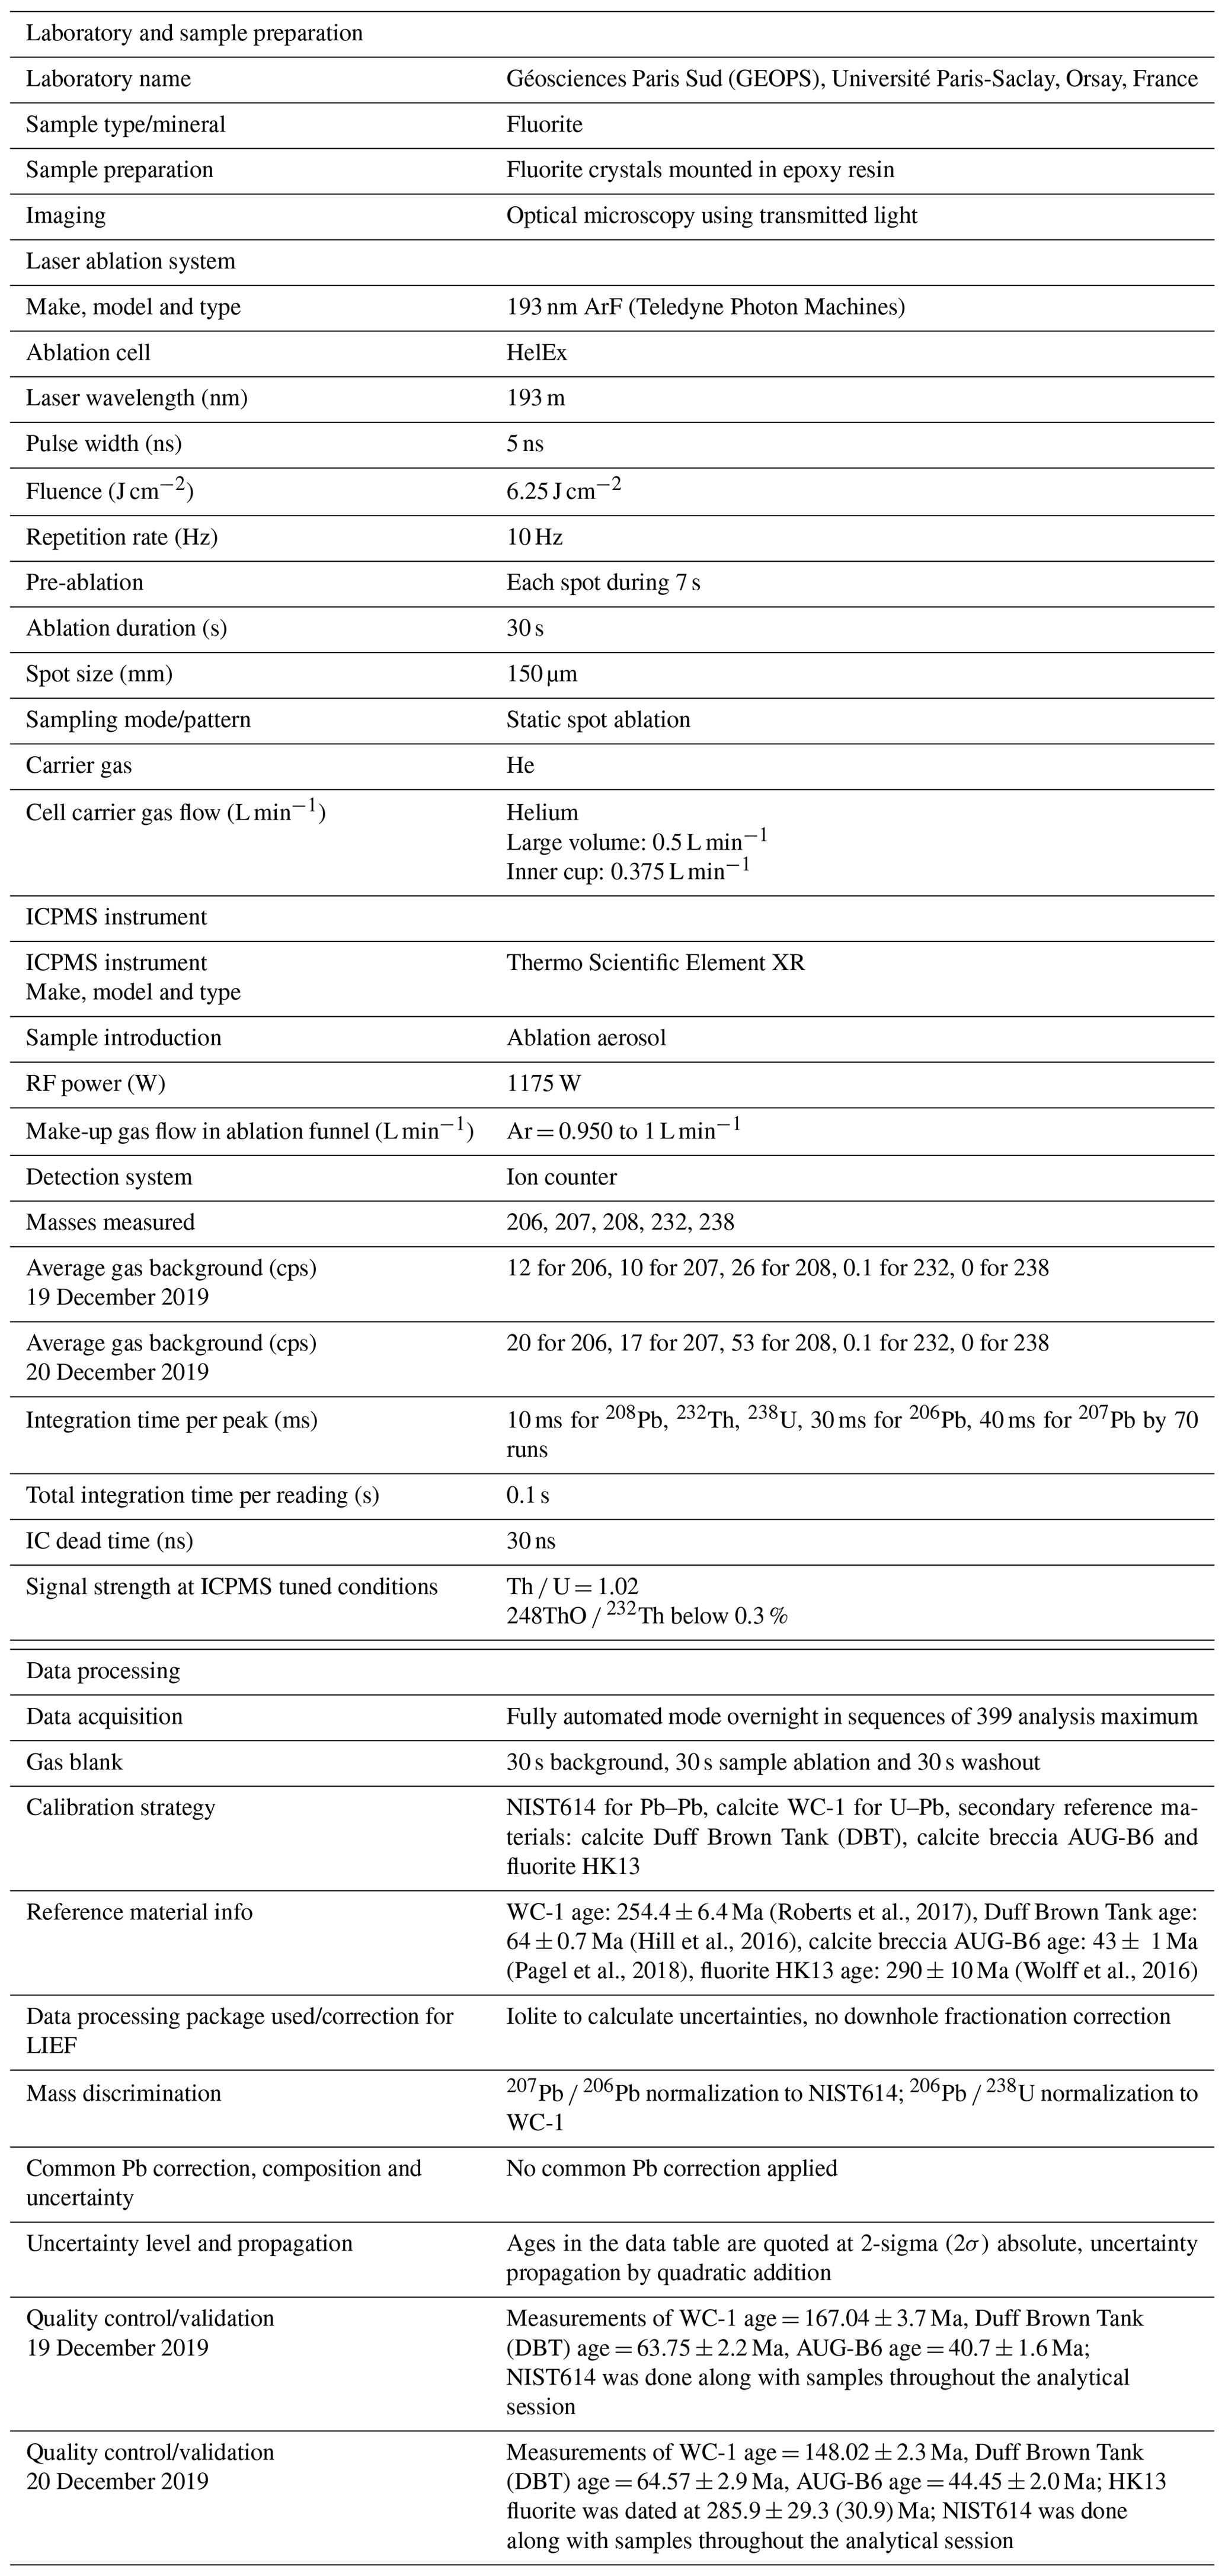
Uranium and Pb isotopic compositions were measured for four fluorite samples showing fluorite overgrowth (Flog): (1) PPVi2 (n = 16), (2) PPVi5 (n = 20), (3) PP1802 (n = 30) and (4) PP15 (n = 26). This was done using a 193 nm excimer laser (Teledyne, Photon Machines) coupled to a Thermo Scientific™ sector field inductively coupled plasma mass spectrometer (SF-ICP-MS), ELEMENT XR (Thermo Fisher Scientific, Waltham, USA), at the Geosciences laboratory (GEOPS) of the University Paris-Saclay.
The overall analytical procedure follows the methods used for LA-ICP-MS U–Pb geochronology of carbonates (Roberts et al., 2020) developed at the University Paris-Saclay for calcite (Brigaud et al., 2020) – see Table A4 for analytical details. The main difference concerns the laser energy needed to ablate fluorite. Indeed, a fluence of 6 J cm−2 was required to ablate our natural fluorite crystals. To properly correct for downhole fractionation (DF) and other sources of laser-induced elemental fractionation (LIEF) on the measured 206Pb 238U ratios, a fluorite primary reference material (RM) should be used. However, such a fluorite RM does not exist yet. Thus, similarly to Piccione et al. (2019), we used a calcite RM, the Permian Reef Complex Walnut Canyon WC-1 (Roberts et al., 2017), as the primary reference material. We highlight the fact that our fluorite U–Pb ages are thus not corrected for matrix-related elemental fractionation. To evaluate the accuracy of our U–Pb ages, we included the analysis of a fluorite sample independently dated by (U–Th–Sm) He thermochronology (Wolff et al., 2016). It corresponds to a sodium- and REE-rich (REE: rare earth element) green fluorite from the Horni Krupka deposit in the Czech Republic (named HK13) that has been dated by Wolff et al. (2016) at 290 ± 10 Ma.
The laser beam diameter for fluorite unknowns was 85 µm. Fluorite crystals were ablated at a repetition rate of 10 Hz and a fluence of 6.25 J cm−2. Calcite reference materials, including WC-1 primary standard and two secondary standards that are detailed below, were ablated at a repetition rate of 8 Hz, a fluence of 1 J cm−2 and a beam diameter of 150 µm. Glass reference materials NIST612 and NIST614 (Jochum et al., 2011) were ablated at a repetition rate of 10 Hz, a fluence of 6.25 J cm−2 and a beam size of 40 µm for NIST612 and 110 µm for NIST614.
Each analysis consists of 30 s background acquisition followed by 30 s of sample ablation and 30 s washout. Prior to analysis, each spot was pre-ablated for 7 s at a frequency of 10 Hz and with a fluence of 6.25 J cm−2 for reference material (NIST) and fluorite samples. The frequency was 8 Hz with a fluence of 1 J cm−2 for calcite reference materials. These pre-ablations are over an area larger than the beam diameter to clean the surface (155 µm for calcite, 50 µm for NIST612, 110 µm for fluorite and 135 µm for NIST614) and remove potential surficial Pb contamination. The laser-induced aerosol was carried by He (large volume at 0.5 L min−1 and inner cup at 0.375 L min−1) from the sample cell to a mixing funnel in which the sample and He are mixed with 0.950 to 1 L min−1 argon to stabilize the aerosol input to the plasma. The signal strength of the ICP-MS was tuned for maximum sensitivity while keeping Th U at 1.02 and ThO Th below 0.3 % on NIST612. Isotopes 206Pb, 207Pb, 208Pb, 232Th and 238U were acquired with integration times per peak of 10 ms for 208Pb, 232Th and 238U, 30 ms for 206Pb, and 40 ms for 207Pb during 70 runs.
We used NIST614 to correct for 207Pb 206Pb fractionation (Jochum et al., 2011). For mass bias correction of the measured 238U 206Pb ratios, we used the WC-1 calcite reference material (Roberts et al., 2017). Two secondary calcite reference materials were analyzed during the analytical sessions: Duff Brown Tank (DBT), dated at 64.0 ± 0.7 Ma by U–Pb isotope dilution–ICP-MS (Hill et al., 2016), and AUG-B6, a calcite breccia dated by LA-ICP-MS U–Pb at 42.99 ± 0.98 Ma (Pagel et al., 2018). Internal secondary reference calcite AUG-B6 comes from the Gondrecourt graben (eastern Paris Basin), part of the European Cenozoic Rift System, and has been routinely analyzed for 2 years at GEOPS (University Paris-Saclay). Measurements have been made by sequences starting with six reference material analyses (two NIST612, two NIST614 and two WC-1) with a repetition of 10 spots on unknown fluorite followed by eight reference material analyses (two NIST614, two WC-1, two DBT and two AUG-B6) and 10 spots on unknown fluorite, ending with six reference material analyses (two NIST612, two NIST614 and two WC-1). Data were acquired in fully automated mode overnight in two sequences of 336 analyses during about 12 h of analysis on 19 and 20 December 2019.
Data were reduced in Iolite© using the NIST614 glass as the primary reference material to correct for baseline, for Pb isotope mass bias and for 206Pb 238U instrumental drift over the sequence time (Lawson et al., 2018; Paton et al., 2011). No downhole fractionation correction is applied in Iolite© (Nuriel et al., 2017). The 2-sigma errors in 207Pb 206Pb and 206Pb 238U ratios measured on NIST614 during the analytical session were propagated to the final age uncertainty of fluorite samples by quadratic addition. During the first session, NIST614 2-sigma error on 207Pb 206Pb was 0.31 % and 1.10 % for 206Pb 238U, and for the second session the 2-sigma errors on 207Pb 206Pb and 238U 206Pb were 2.20 % and 0.69 %, respectively. A signal peak of 206Pb, 207Pb or 238U can occur due to unstable ablation conditions, causing an unusually high 206Pb 238U or 207Pb 206Pb standard error (2σ) typically greater than 20 %. In Fig. A1, we document four examples of LA-ICP-MS intensity signals during fluorite ablation together with the corresponding 3D surface images of laser craters acquired by optical profilometry. A total of 35 spots, having 2σ errors greater than 20 %, were excluded (5 on PPVi5, 7 on PPVi2, 15 on PP1802 and 8 on PP15). Each reduced datum is plotted in a 238U 206Pb versus 207Pb 206Pb Tera–Wasserburg graph using IsoplotR (Vermeesch, 2018). An isochron is drawn and the isochron age is deduced by the intersection on the concordia. For each sequence, the age and uncertainty of WC-1 reference calcite, following normalization using NIST614 glass, were calculated without further normalization using a Tera–Wasserburg intercept age. Following the analytic run, we applied a linear correction factor to correct the 206Pb 238U so that the primary WC-1 yields the correct intercept age (254.4 ± 6.4 Ma; Roberts et al., 2017). For the first session, we obtained 167.0 ± 3.7 Ma for WC-1 with 23 analyses; hence, we applied a linear correction factor of 0.656 to correct all 206Pb 238U ratios of secondary calcite reference materials and fluorite unknowns. For the second analytical session, WC-1 was dated at 148.0 ± 2.3 Ma with 39 analyses. Then, the linear correction factor for the 206Pb 238U ratio was 0.582. We fixed the 207Pb 206Pb ratio at 0.85 for the common Pb based on Stacey and Kramers (1975) when we calculated the Tera–Wasserburg intercept age on WC-1 (Roberts et al., 2017). Regarding unknown fluorite samples, Tera–Wasserburg intercept ages are calculated by plotting each spot from a single sample and by applying the linear correction factor found for WC-1 to the corresponding session to correct the 206Pb 238U ratios. An age is then calculated without fixing the initial 207Pb 206Pb value. Error ellipses of each spots and the error on the Tera–Wasserburg intercept age are 2σ. In each Tera–Wasserburg graph, a first age uncertainty is given that does not include uncertainty propagations (except uncertainties related to the decay constants of 235U and 238U). A second age uncertainty is given in brackets by propagating the systematic uncertainty of primary reference material WC-1 age (2.6 %; Roberts et al., 2017) and the 2-sigma error of the 207Pb 206Pb and 206Pb 238U of the analytical session by quadratic addition. Calculated ages for calcite secondary reference materials analyzed during the two sequences were 40.7 ± 1.6 and 44.4 ± 2.0 Ma for AUG-B6 and 63.7 ± 2.2 and 64.6 ± 2.9 Ma for DBT, without fixing the initial 207Pb 206Pb ratio. These ages are identical within analytical uncertainty to the ages published for these two calcites (Pagel et al., 2018; Hill et al., 2016, respectively). HK13 fluorite was dated at 285.9 ± 29.3 (30.9) Ma. Even though the isochron is less well defined, this U–Pb age matches the (U–Th–Sm) He age obtained by Wolff et al. (2016) at 290 ± 10 Ma.
Tera–Wasserburg diagrams of primary and secondary calcite reference materials and metadata for LA-ICP-MS U–Pb ages of fluorite can be found in Figs. A2–A3 and Table A4 of Appendix A. Metadata can be found in the Supplement.
4.1 Petrographic observations
Three fluorite generations are described below and illustrated in Fig. 3a. The first fluorite stage is composed of 50 µm to 1 mm white cubes disseminated in the altered granite and mainly in the Assise de Chitry Fm, named euhedral fluorite Fleuh (Gigoux et al., 2016). These crystals may sometimes form centimeter-sized aggregates (Fig. 3a).
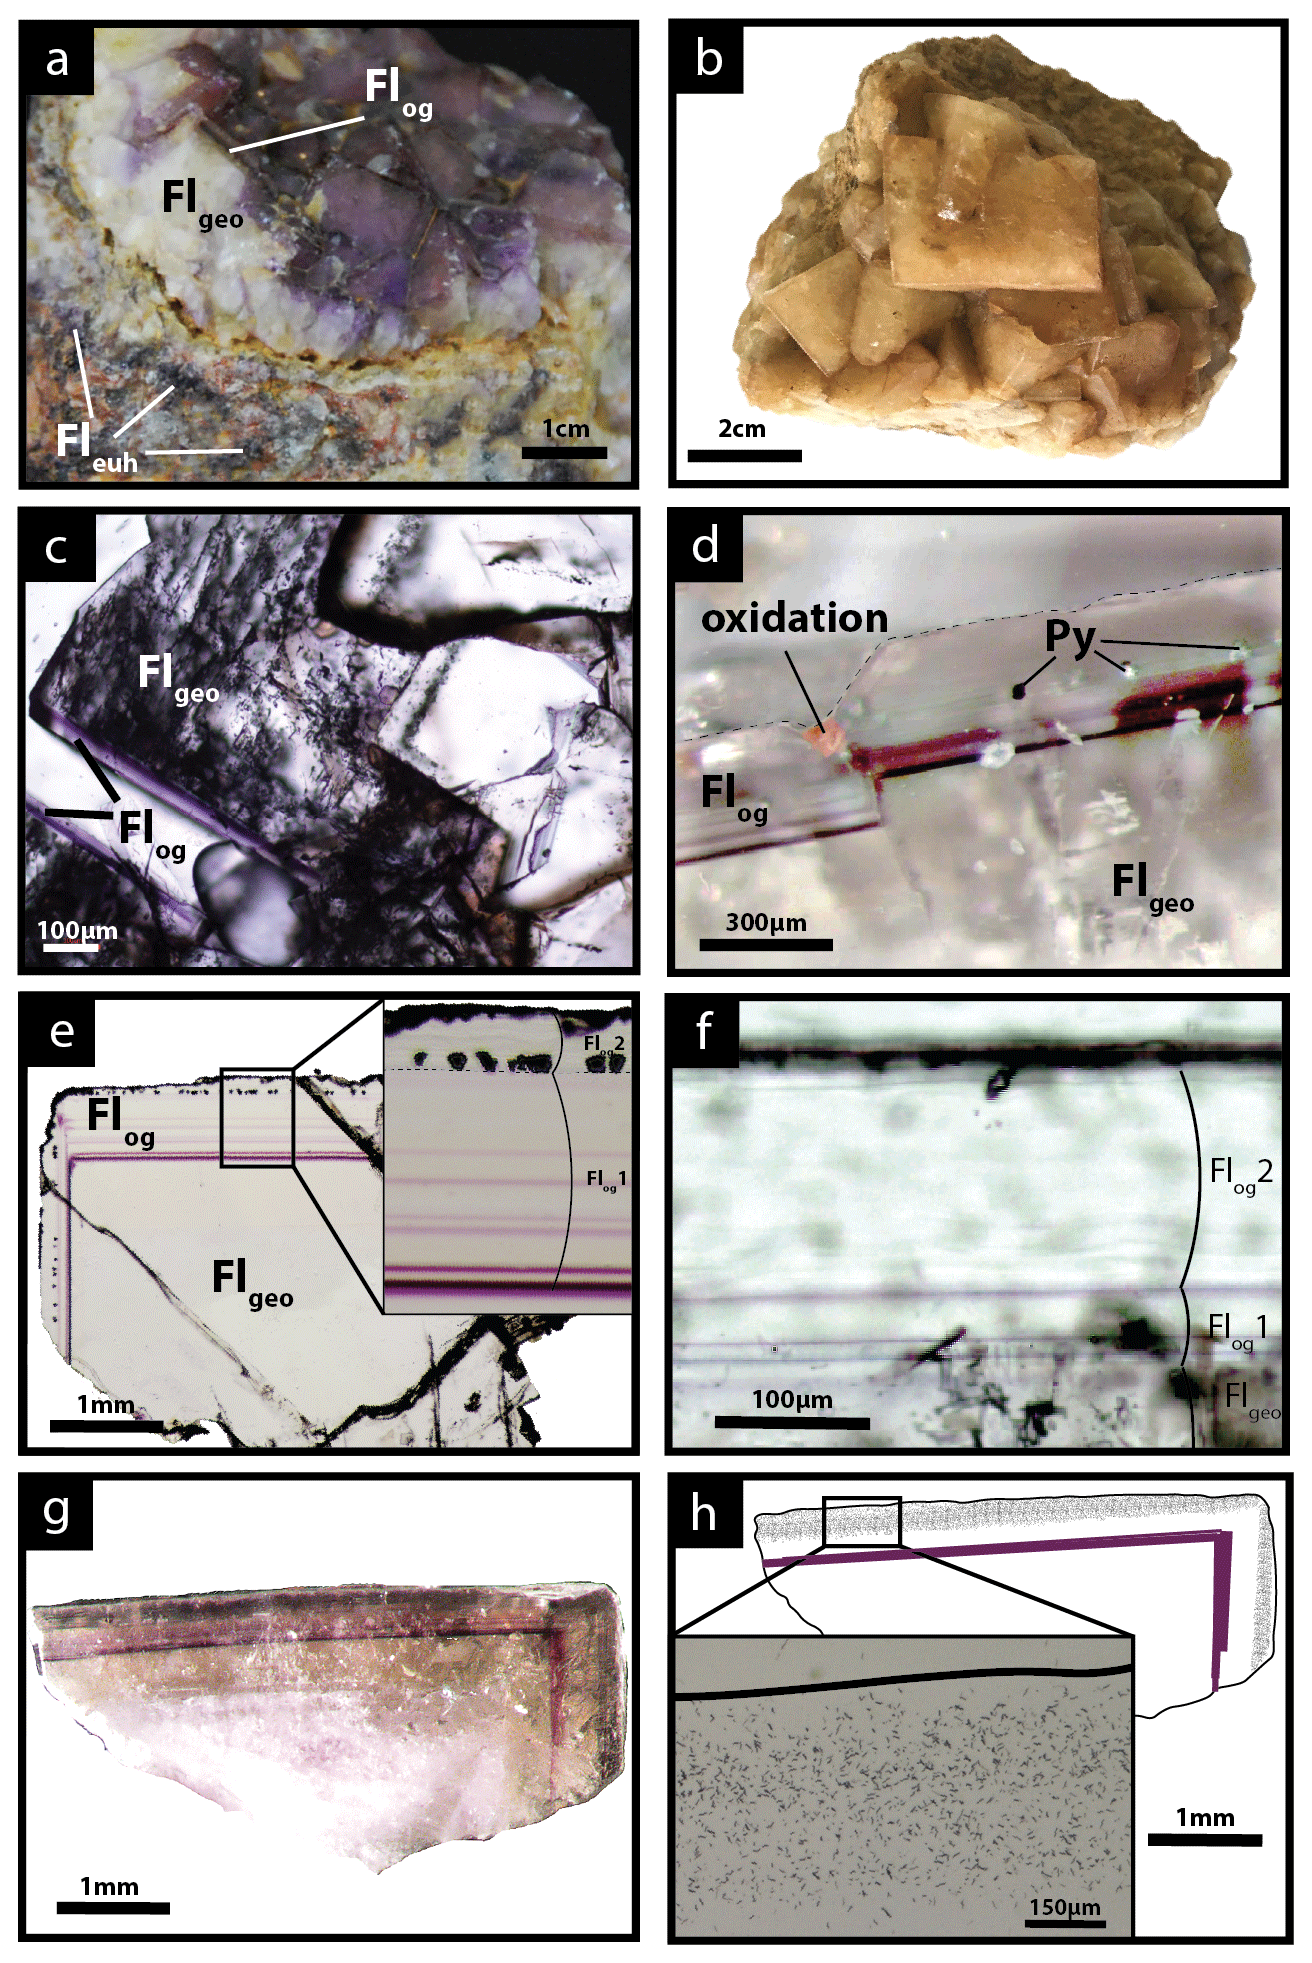
Figure 3Photographs of the fluorite stages from the Pierre-Perthuis ore. (a) Geode in the altered granite with milky white cubic crystals (Flgeo) and the translucent fluorite overgrowth (Flog) delimited by a thin purple band. The euhedral fluorite (Fleuh) forms patches in the Avallon granite (from Gigoux et al., 2015). (b) Centimetric cubes of Flgeo, (c) transmitted light microscopy photography of Flgeo and the overgrowth corresponding to Flog, (d) photography of the limit between Flgeo and Flog with a pyrite crystal affected by a fracture and oxidized, and (e) transmitted light microphotograph of a geodic fluorite crystal with the two stages constituting Flog: (1) a translucent fluorite initiated by one or several purple rims (Flog1) and (2) a final growth stage of laminar fibrous fluorite with pyrite inclusions (Flog2). (f) Microphotograph in transmitted light focused on Flog2 showing a laminar texture, (g) photography in transmitted light of an irradiated crystal of Flgeo + Flog, and (h) corresponding interpreted map of the induced fission-track distribution in a crystal illustrated in panel (g) with a zoom into the muscovite detector.
The second stage fills geodic cavities or centimetric veinlets that are several centimeters to pluri-decimetric. This geodic fluorite (Flgeo) forms millimetric to centimetric well-developed white and yellow translucent cubes, which are more or less interlinked (Fig. 3b). These crystals are fractured and contain many fluid inclusions (Fig. 3c).
Geodic fluorites (Flgeo) sometimes display one or several overgrowths (Flog). These overgrowths form the third and last stage of fluorite. They appear translucent in transmitted plane-polarized light and do not contain any fluid inclusions (see Figs. 3c and A4). From the center to the border, two growth phases have been noted: (1) a translucent fluorite initiated by one or several purple rims (Flog1) and (2) a second growth stage of fluorite with a laminar texture (Flog2), delineated by a fringe of well-aligned small globular pyrite crystals of about 30 µm (Fig. 3e and f). These pyrite crystals are rarely oxidized along fractures (Fig. 3d).
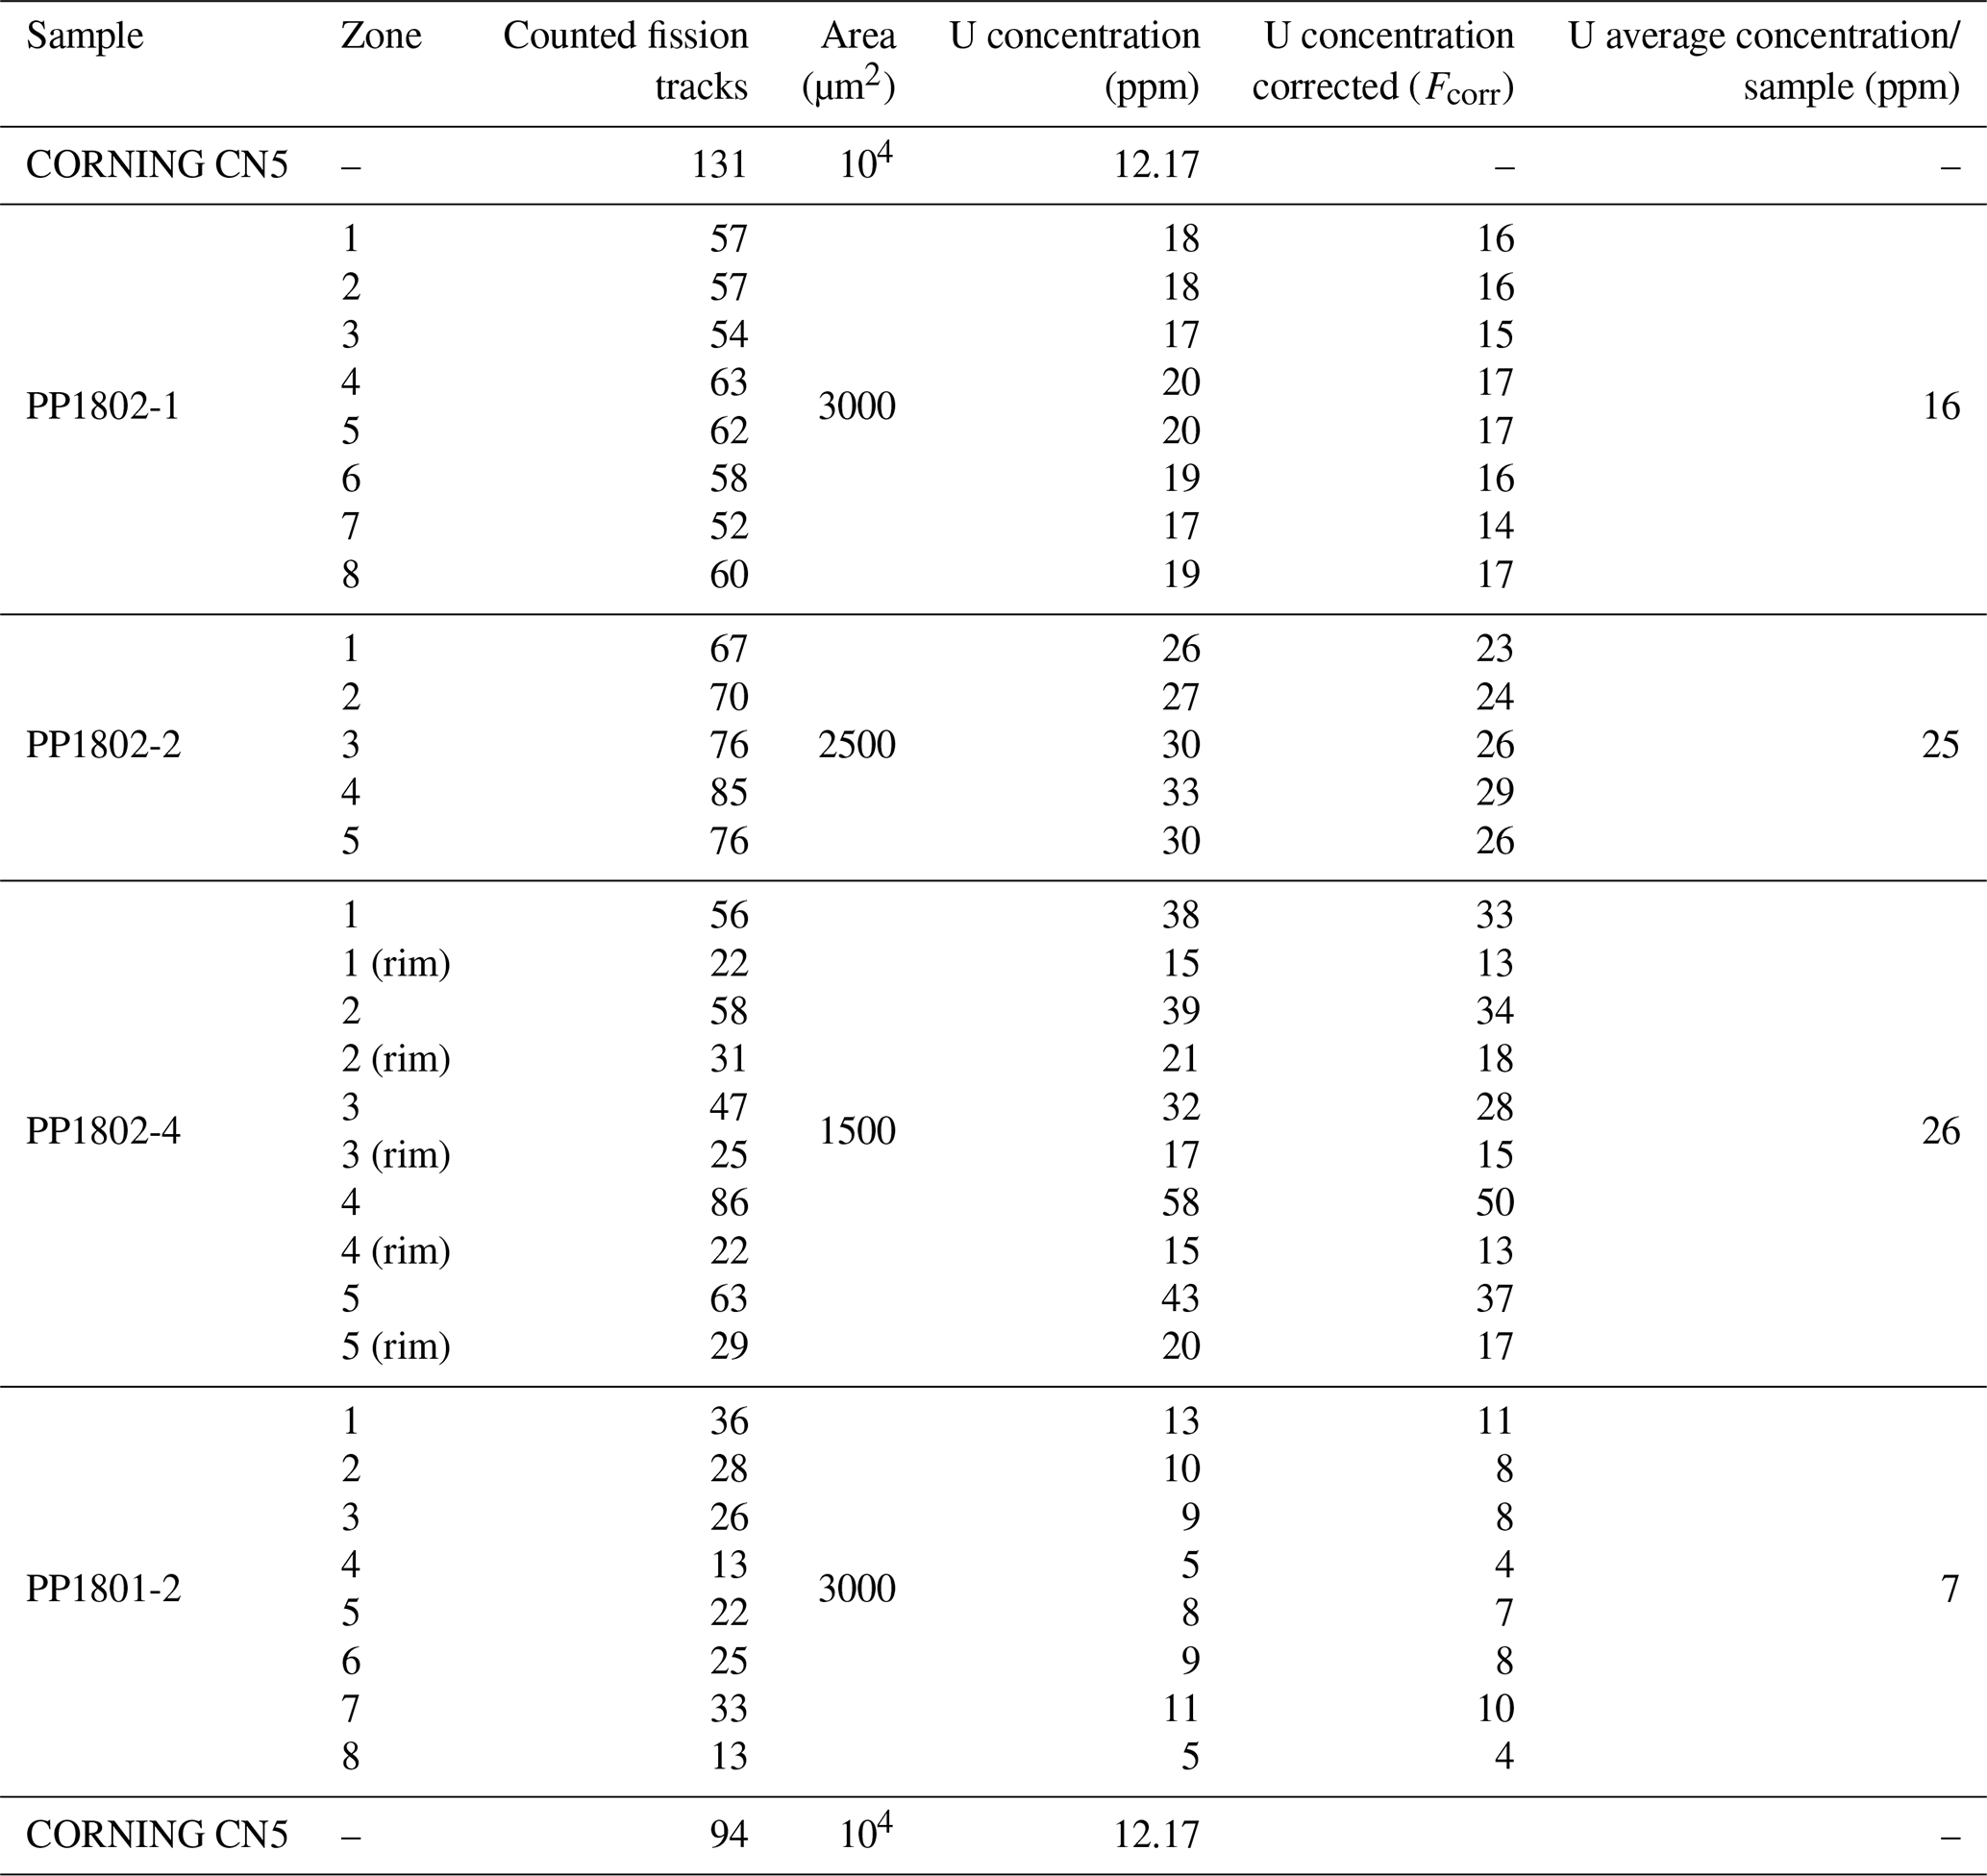
Fission-track mapping carried out on Flgeo, Flog1 and Flog2 shows that Flgeo and Flog1 are almost devoid of tracks, while a high track density is observed in Flog2 (Fig. 3g and h). Uranium is only detected and measured in Flog2, with the U concentration varying from 4 to 50 ppm according to the track counting zones and an average of 7 to 26 ppm per sample (see Table A2 for details).
4.2 Sulfur stable isotope composition
SIMS analyses were carried out for two fluorite crystals containing pyrite inclusions in their rims (Fig. 4). Five pyrite crystals in sample PP18S3 have δ34S values varying from −23.1 ‰V-CDT to −24.9 ‰V-CDT. The sulfur isotopic ratio of pyrite from sample PP18S7 varies from −19.9 ‰V-CDT to −24.7 ‰V-CDT. The mean of δ34S values for PP18S3 and PP18S7 are −24.2 ‰V-CDT and −23.6 ‰V-CDT, respectively. The 2-sigma uncertainty is below 0.4 ‰V-CDT.
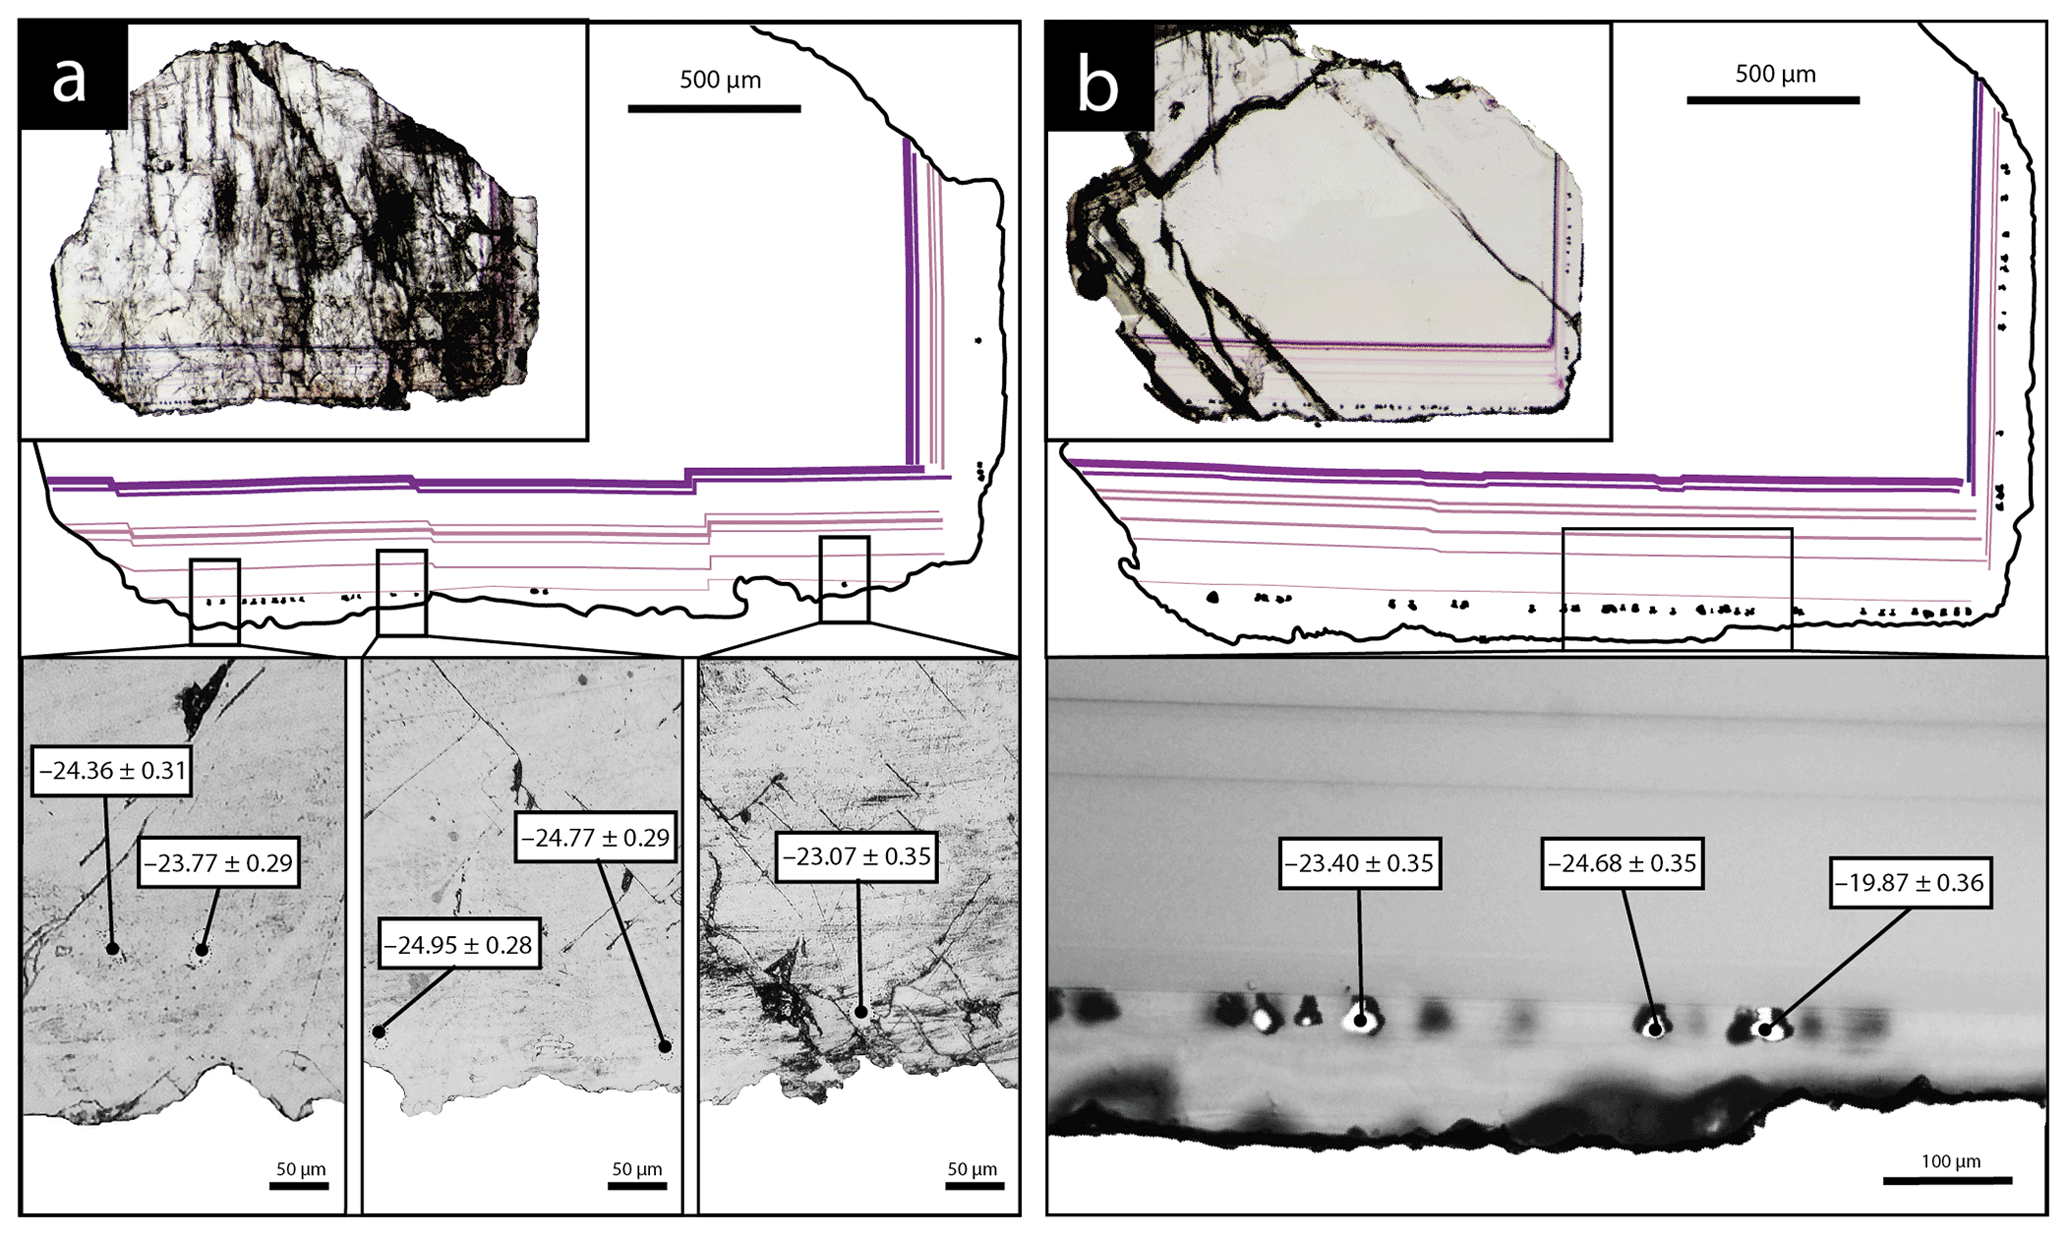
Figure 4Location of SIMS analyses and the δ34S measurements (‰V-CDT) for (a) sample PP18S3 and (b) sample PP18S7. Microphotographs in the upper half are in transmitted plane-polarized light, and microphotographs at the bottom are gold metallized zoomed areas in reflected plane-polarized light.
4.3 SR-XRF mapping
We studied in detail two samples that contain the last two generations of fluorite (Flgeo and Flog described above) to investigate geochemical heterogeneities. PP18S7 shows several pyrite crystals at various depths, while PP18S15 shows a single pyrite at the surface of the sample (Fig. 5a and b, respectively). Synchrotron radiation XRF mapping of a transect from Flgeo to Flog2 shows areas of a lower concentration of Ca exclusively within the Flog2 (Fig. 5b) and higher concentrations of substituted elements such as Zr, Y, Sr, U, Th and Pb (Fig. 5a). Lead is present in both the pyrite crystals (Fig. 5a) and in Flog2 (Fig. 6).
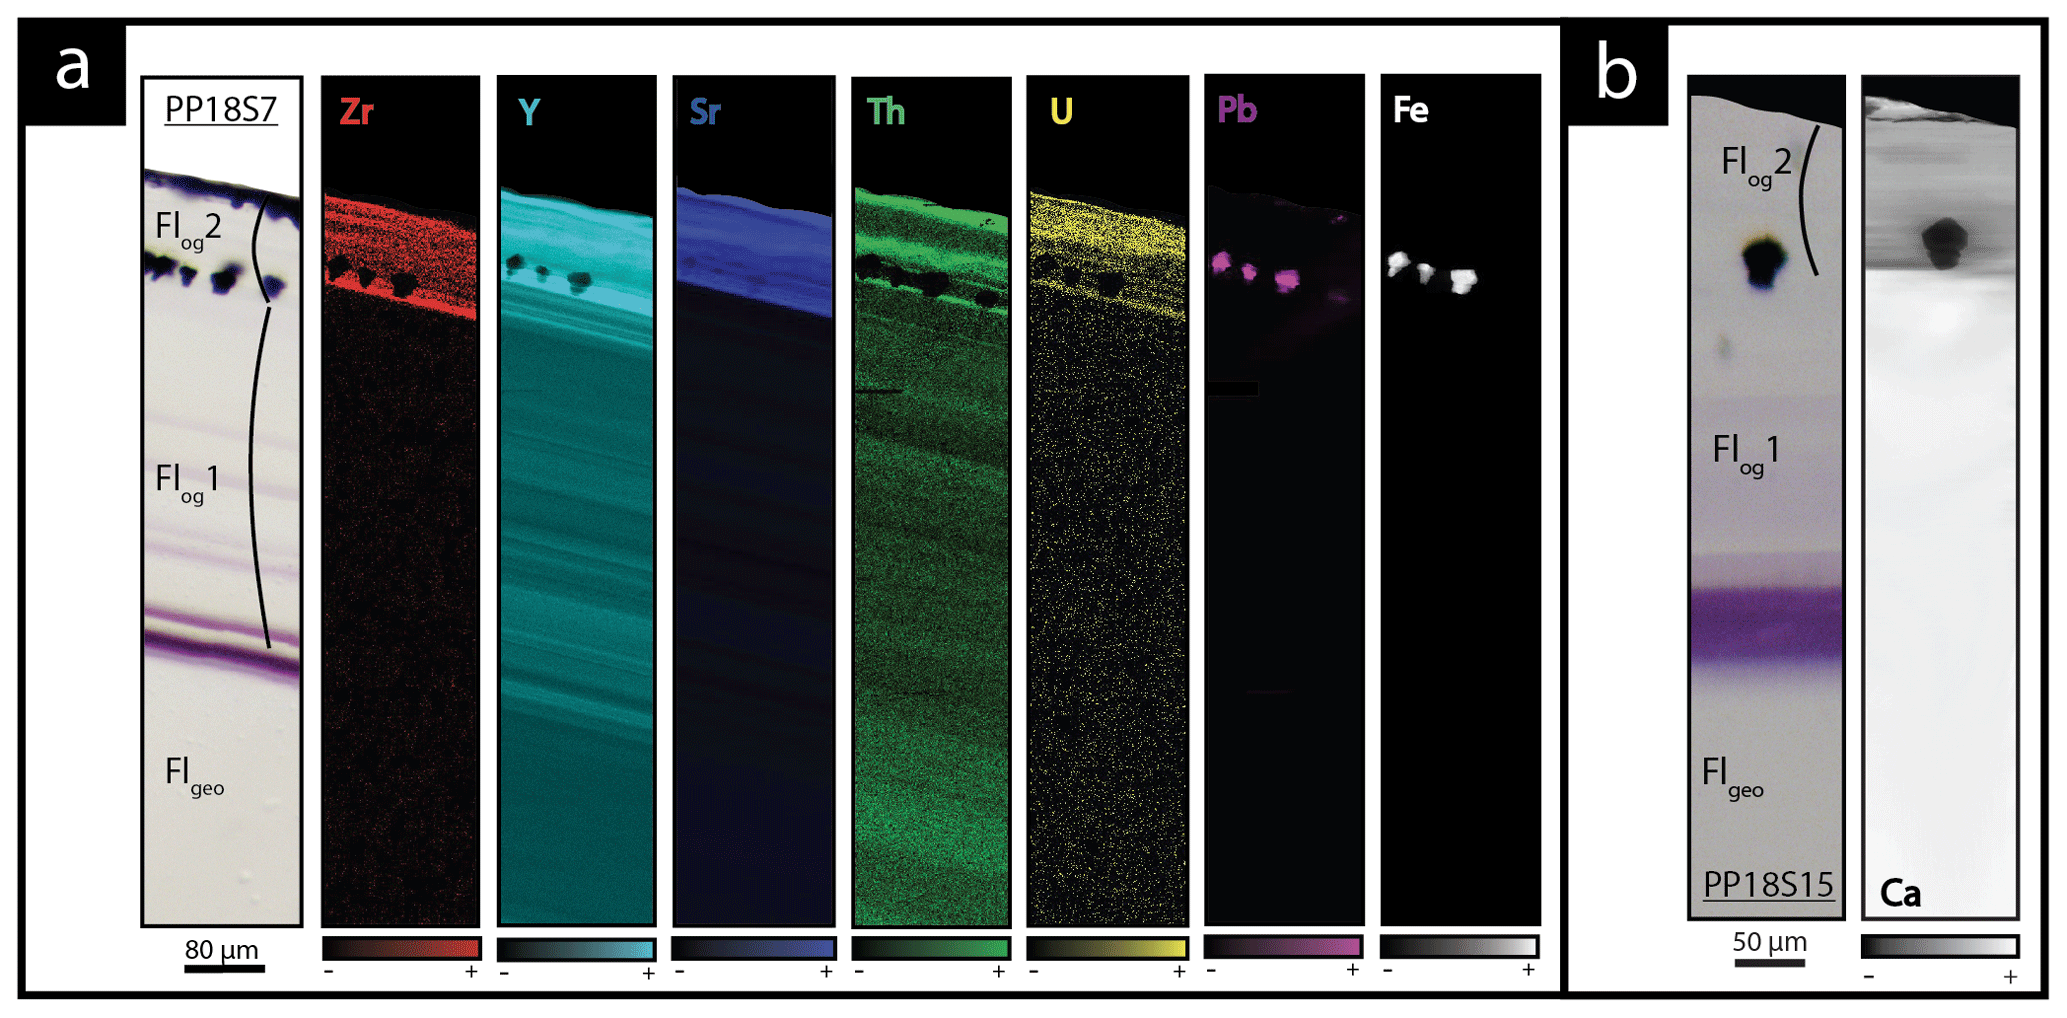
Figure 5Transmitted plane-polarized light microphotographs and corresponding synchrotron radiation X-ray fluorescence elemental maps through a transect from the core crystal of Flgeo to the Flog rim from (a) sample PP18S7 and (b) PP18S15. Black areas indicate a concentration below the limit of detection of the element. Globular pyrite crystals are included in Flog2.
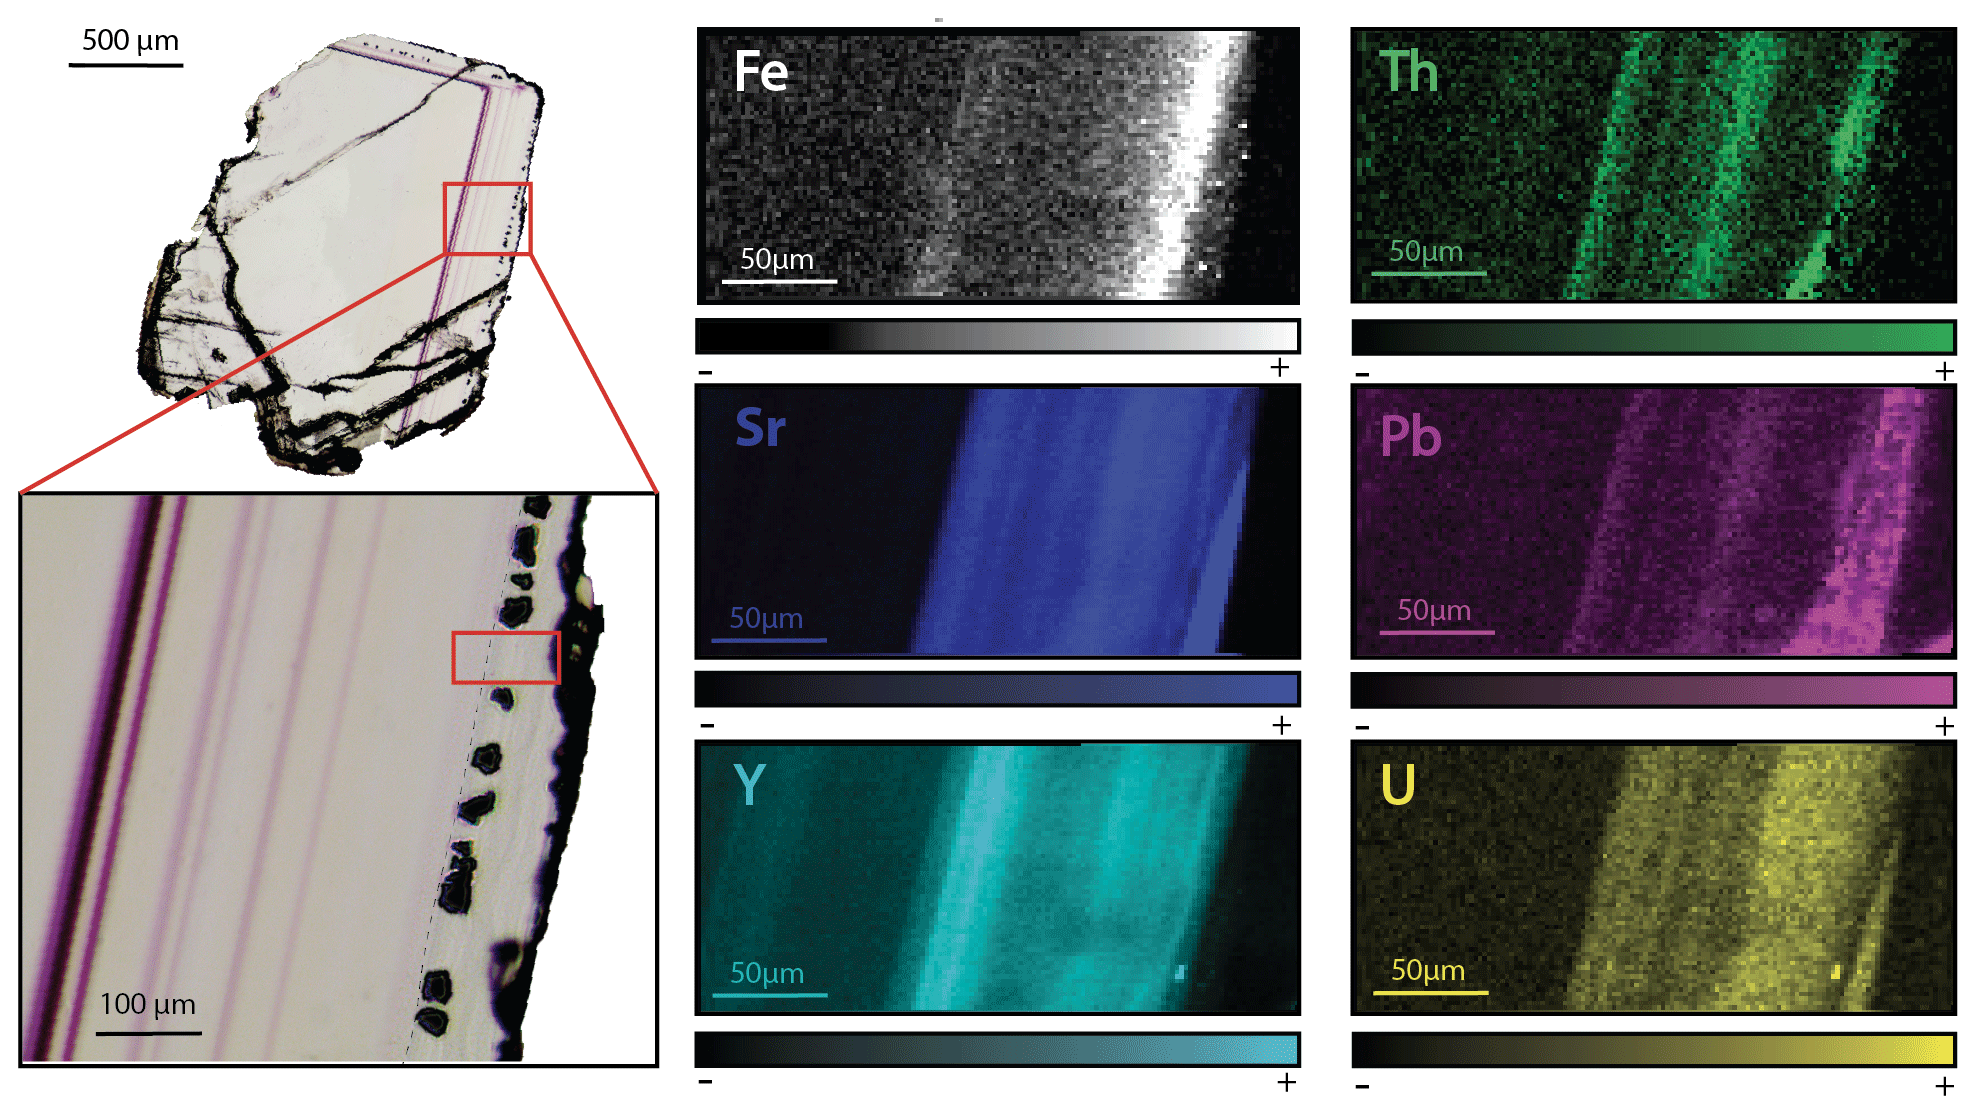
Figure 6SR-XRF imaging of the transition between Flog1 and Flog2 in PP18S15 showing the distribution of Fe, Th, Sr, Pb, Y and U contents. Map dimensions are 261 µm × 122 µm.
Other maps have been generated with a focus on the transition between Flog1 and Flog2 (Fig. 6), highlighted as distinct by petrographic observations and fission-track mapping (Fig. 3f and h). This map reveals elemental substitution and U incorporation. At this scale, SR-XRF mapping shows enrichment in Fe, Th, Sr, Pb, Y and U in Flog2. Lead was detected by SR-XRF mapping, and its spatial distribution in Flog2 is correlated with Th (Fig. 6) but not with U (Fig. A5).
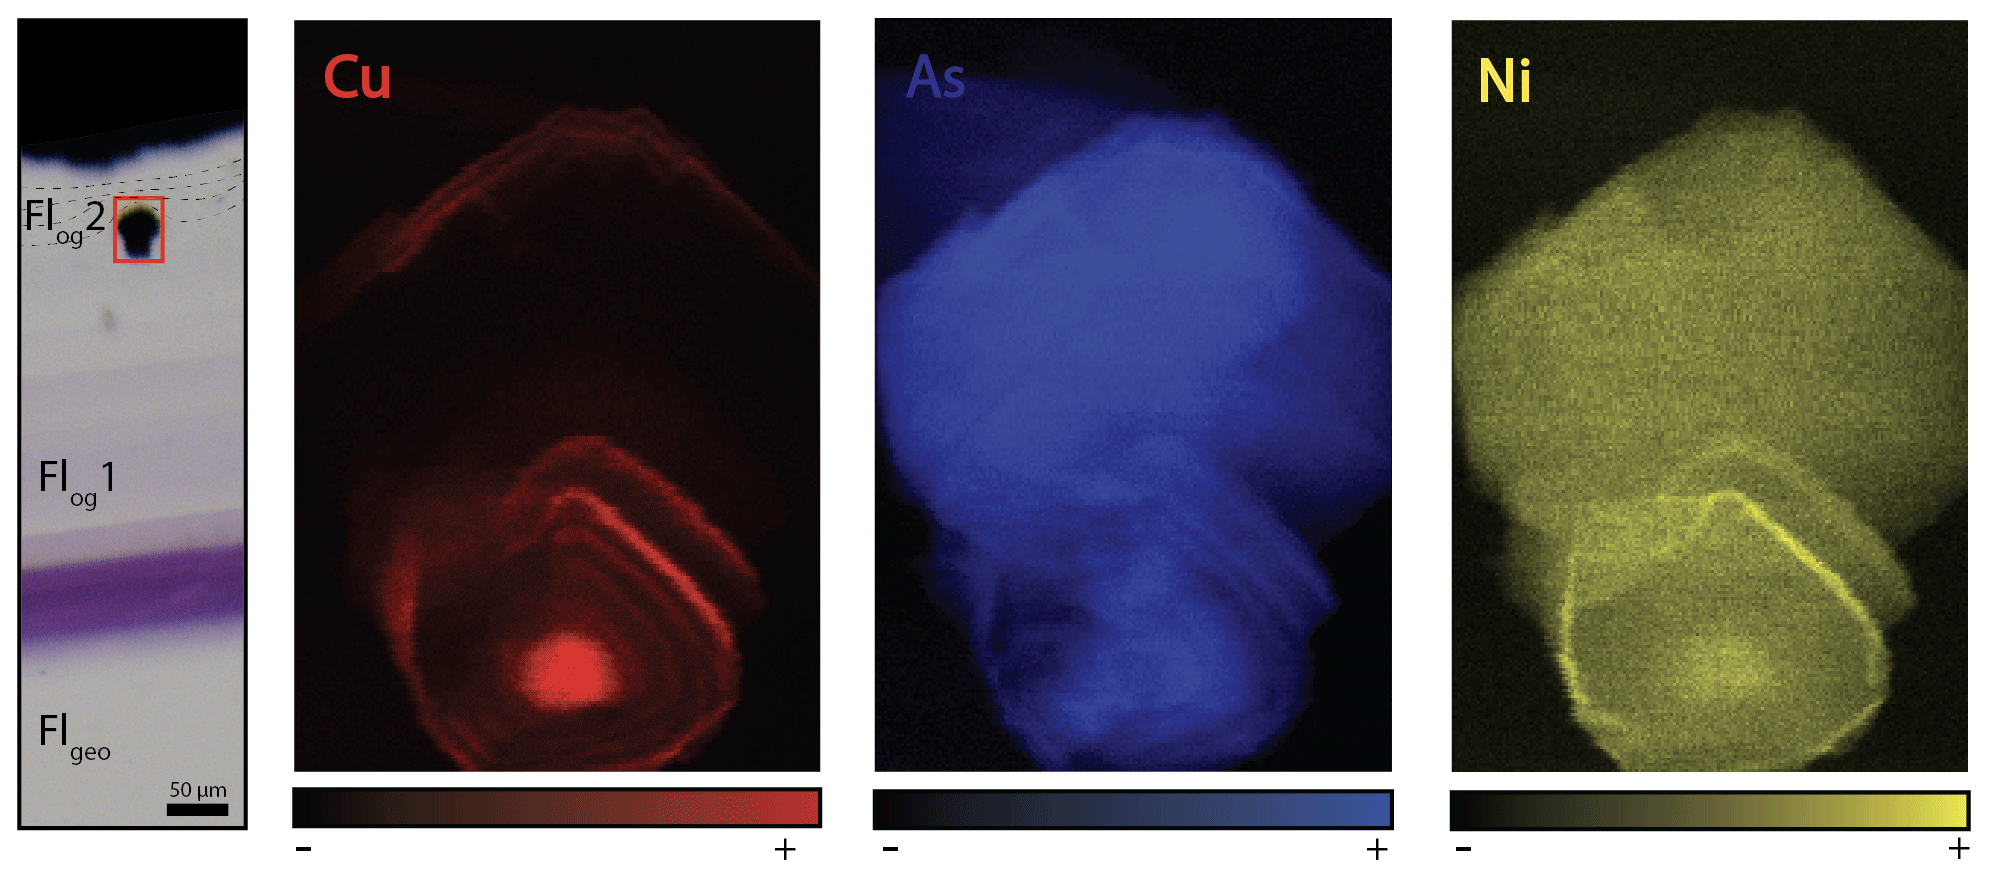
Figure 7Copper, arsenic and nickel distribution maps of a pyrite included in Flog2. Map dimensions are 52 µm × 76 µm.
The details of the pyrite in Flog2 reveal concentric zonation in Cu, As and Ni (Fig. 7).
4.4 Laser ablation U–Pb geochronology
Four isochrons were calculated, with an initial 207Pb 206Pb composition ranging from 0.815 to 0.840 (Tera–Wasserburg graphs were generated without anchoring the upper intercept of the discordia line to a given 207Pb 206Pb composition). Outer rims of geodic fluorite crystals from Pierre-Perthuis yield an age of 38.7 ± 1.5 (1.8) Ma with 9 analyses and an MSWD of 0.68 (Fig. 8a) for PPVi2, 41.1 ± 1.8 (2.2) Ma (MSWD = 1 and n = 15) for PPVi5 (Fig. 8b), 40.8 ± 3.0 (3.4) Ma for PP1802 with 11 analyses and an MSWD = 0.6 (Fig. 8c), and 41.8 ± 2.4 (2.8) Ma for PP15 (MSWD = 1.5 and n = 22; Fig. 8d). As these ages are identical within analytical uncertainties, all data from the different crystals but corresponding to the same generation according to petrography were then plotted in a single graph (Fig. 8e), giving an age of 40.0 ± 0.9 (1.7) Ma (MSWD = 1.2). Because U is variable in the samples, data are well distributed in the Tera–Wasserburg space, and the isochron is rather well constrained.
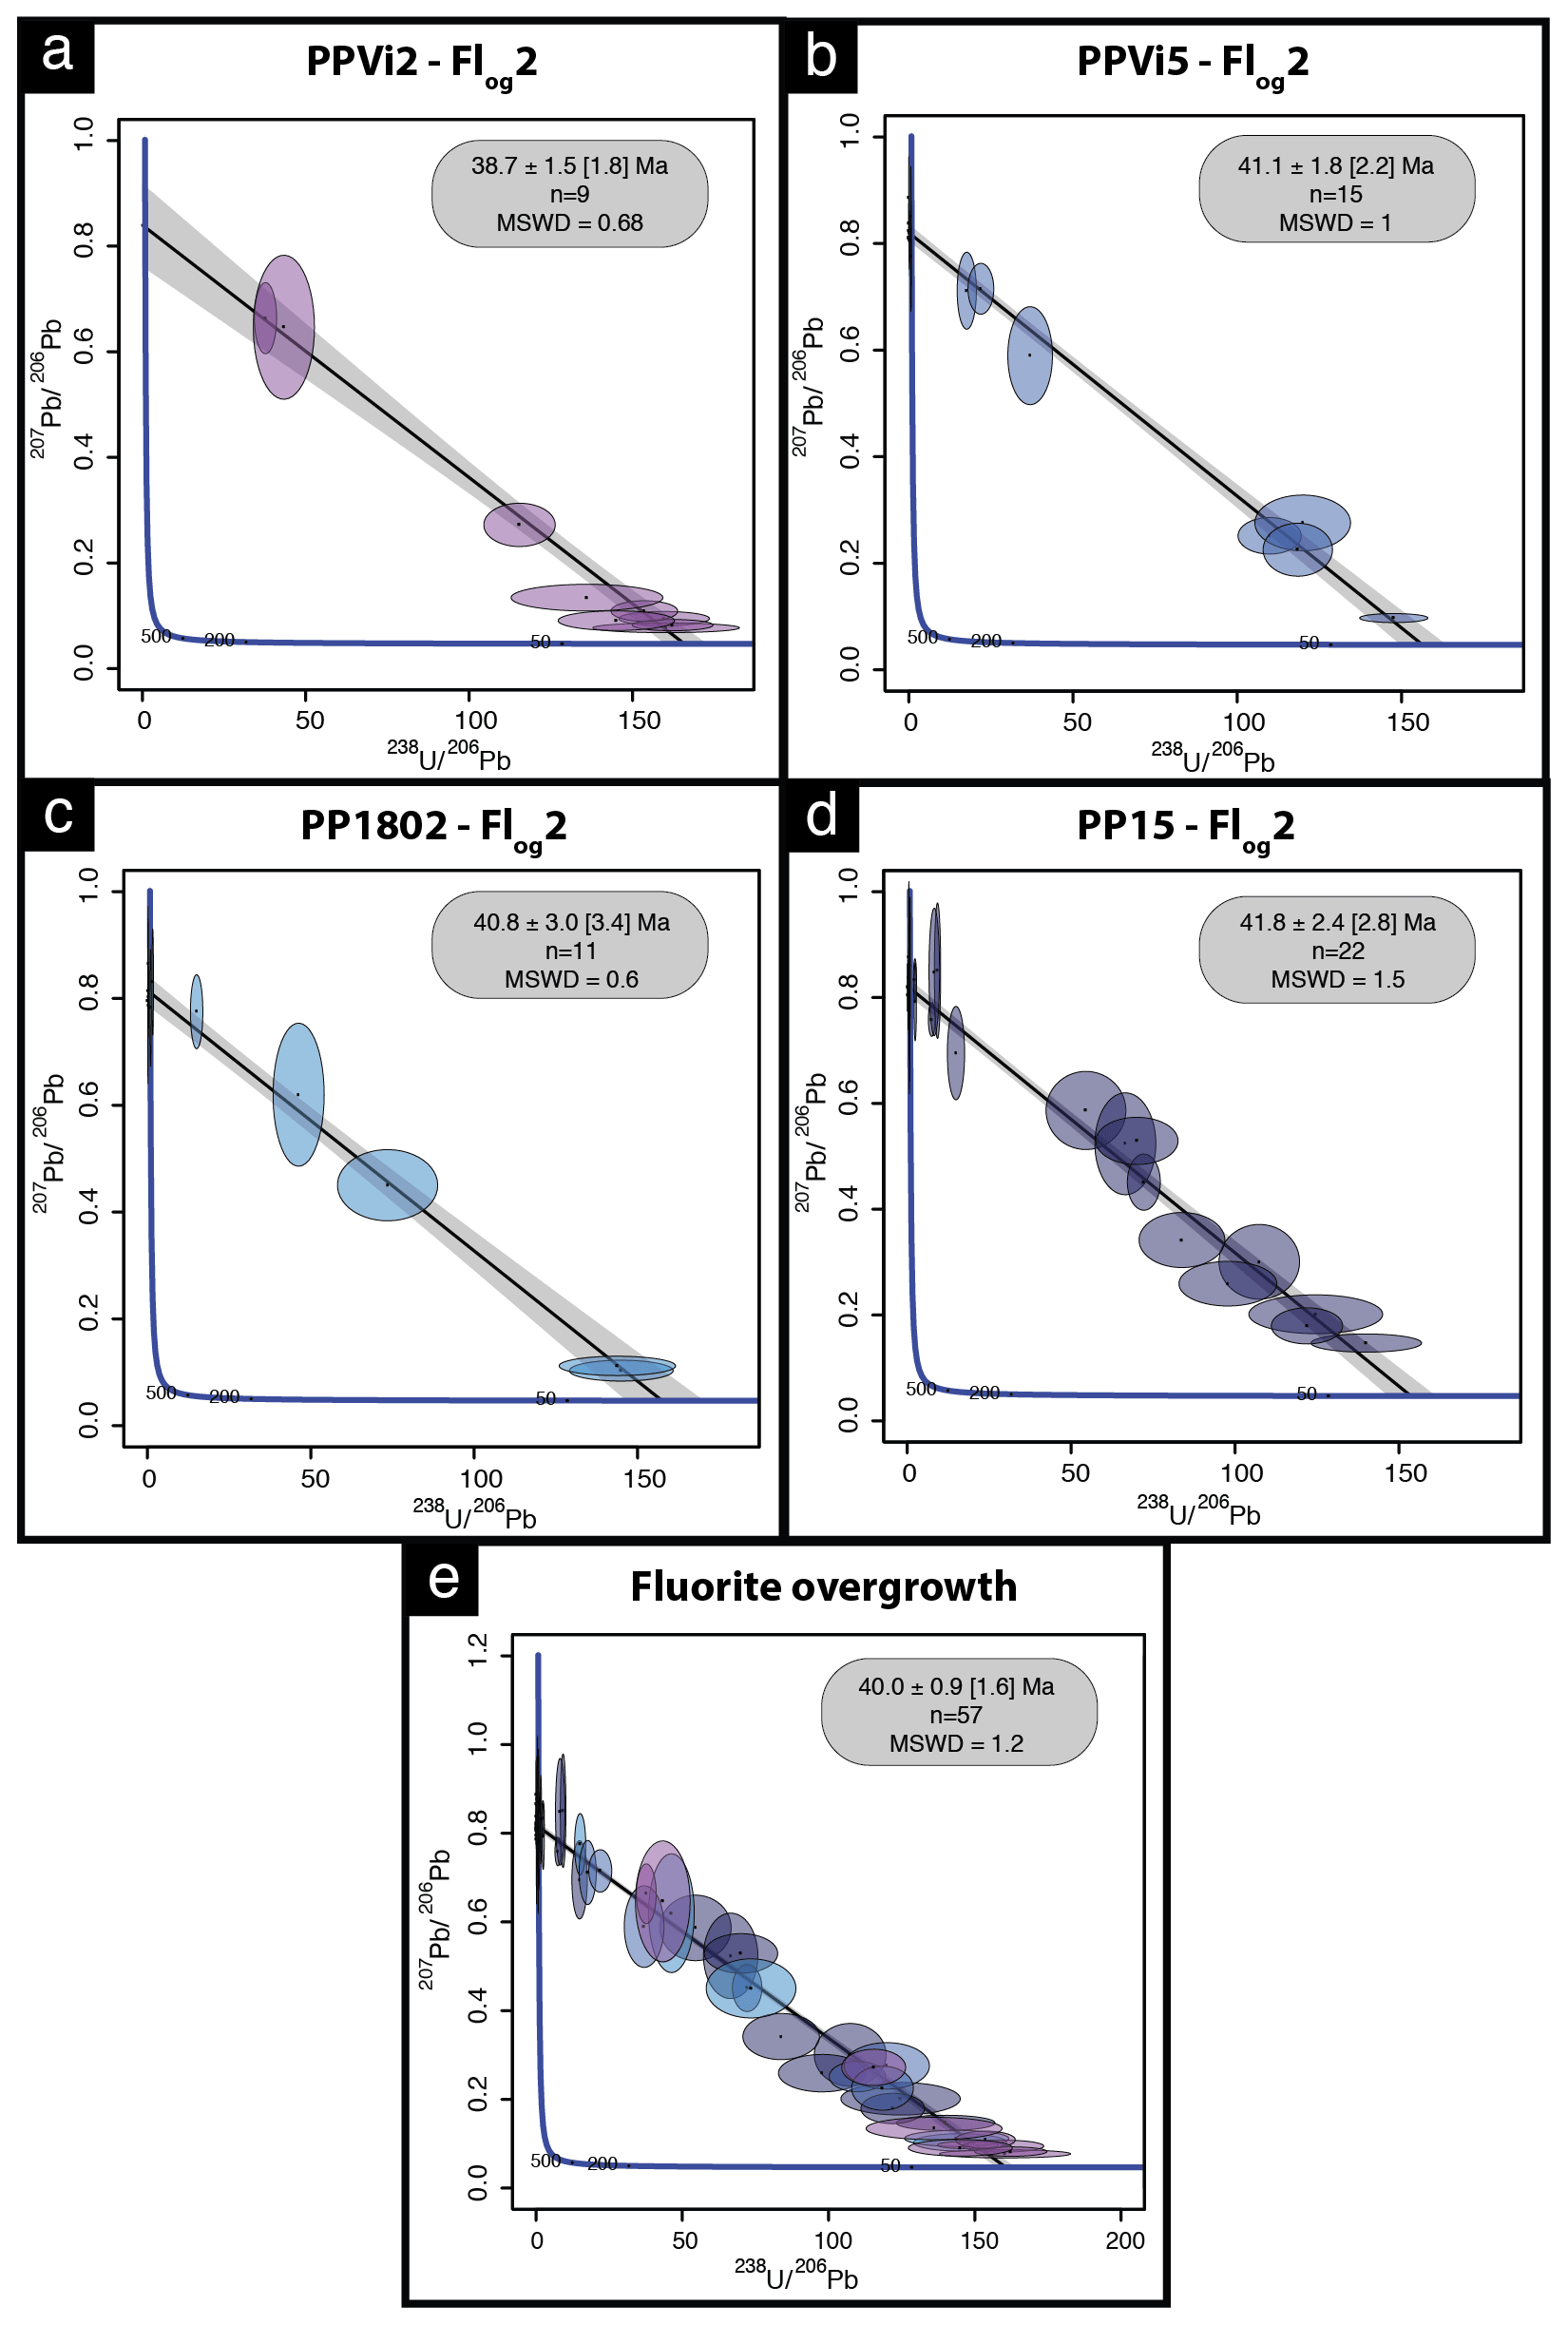
Figure 8Tera–Wasserburg diagram of LA-ICP-MS data for fluorite. (a–d) U–Pb ages of the four fluorite overgrowth (Flog2) samples. (e) Isochron obtained from the compilation of all data illustrated in panels (a)–(d); n is the number of analytical spots for each sample.
To evaluate the accuracy of fluorite LA-ICP-MS U–Pb dating in the absence of calibration against a fluorite primary RM, we tested the HK13 fluorite, a sample independently dated at 290 ± 10 Ma by (U–Th–Sm) He thermochronology (Wolff et al., 2016). Although we found an age of 285.9 ± 30.9 Ma (Fig. A3), interpretation of results is somehow limited by a poor data spread on the Tera–Wasserburg diagram and by rather large uncertainties regarding single analytical spots related to unstable ablation rates.
5.1 Uranium and lead incorporation in fluorite
The fluorite overgrowths are composed of two distinct layers: (1) Flog1, which is devoid of U, and (2) Flog2, in which U was effectively incorporated within the crystal and correlated with precipitation of pyrite. Flog2 appears colorless with an internal fibrous texture. We did not observe any pleochroic halos like Dill and Weber (2010) documented in fluorite around actinide-rich inclusions. Fission-track mapping instead shows a homogeneous incorporation of U (Fig. 3g and h). On a smaller scale, SR-XRF reveals micrometer-scale fluctuations in U concentrations along the growth directions, correlated with the incorporation of other substituted elements such as Sr and Zr (Fig. 5). The incorporation of Zr in the fluorite lattice, together with U, may reflect a contribution from the leaching of volcanic glasses. Indeed, correlations between U and Zr concentrations have been documented in various U deposits spatially associated with volcanic rocks or volcanic fragments reworked in sandstones and conglomerates (Forbes et al., 1984; Cinelu and Cuney, 2006; Pons, 2015). Late Variscan ignimbrites crop out ca. 35 km south of Pierre-Perthuis (Carpena et al., 1984).
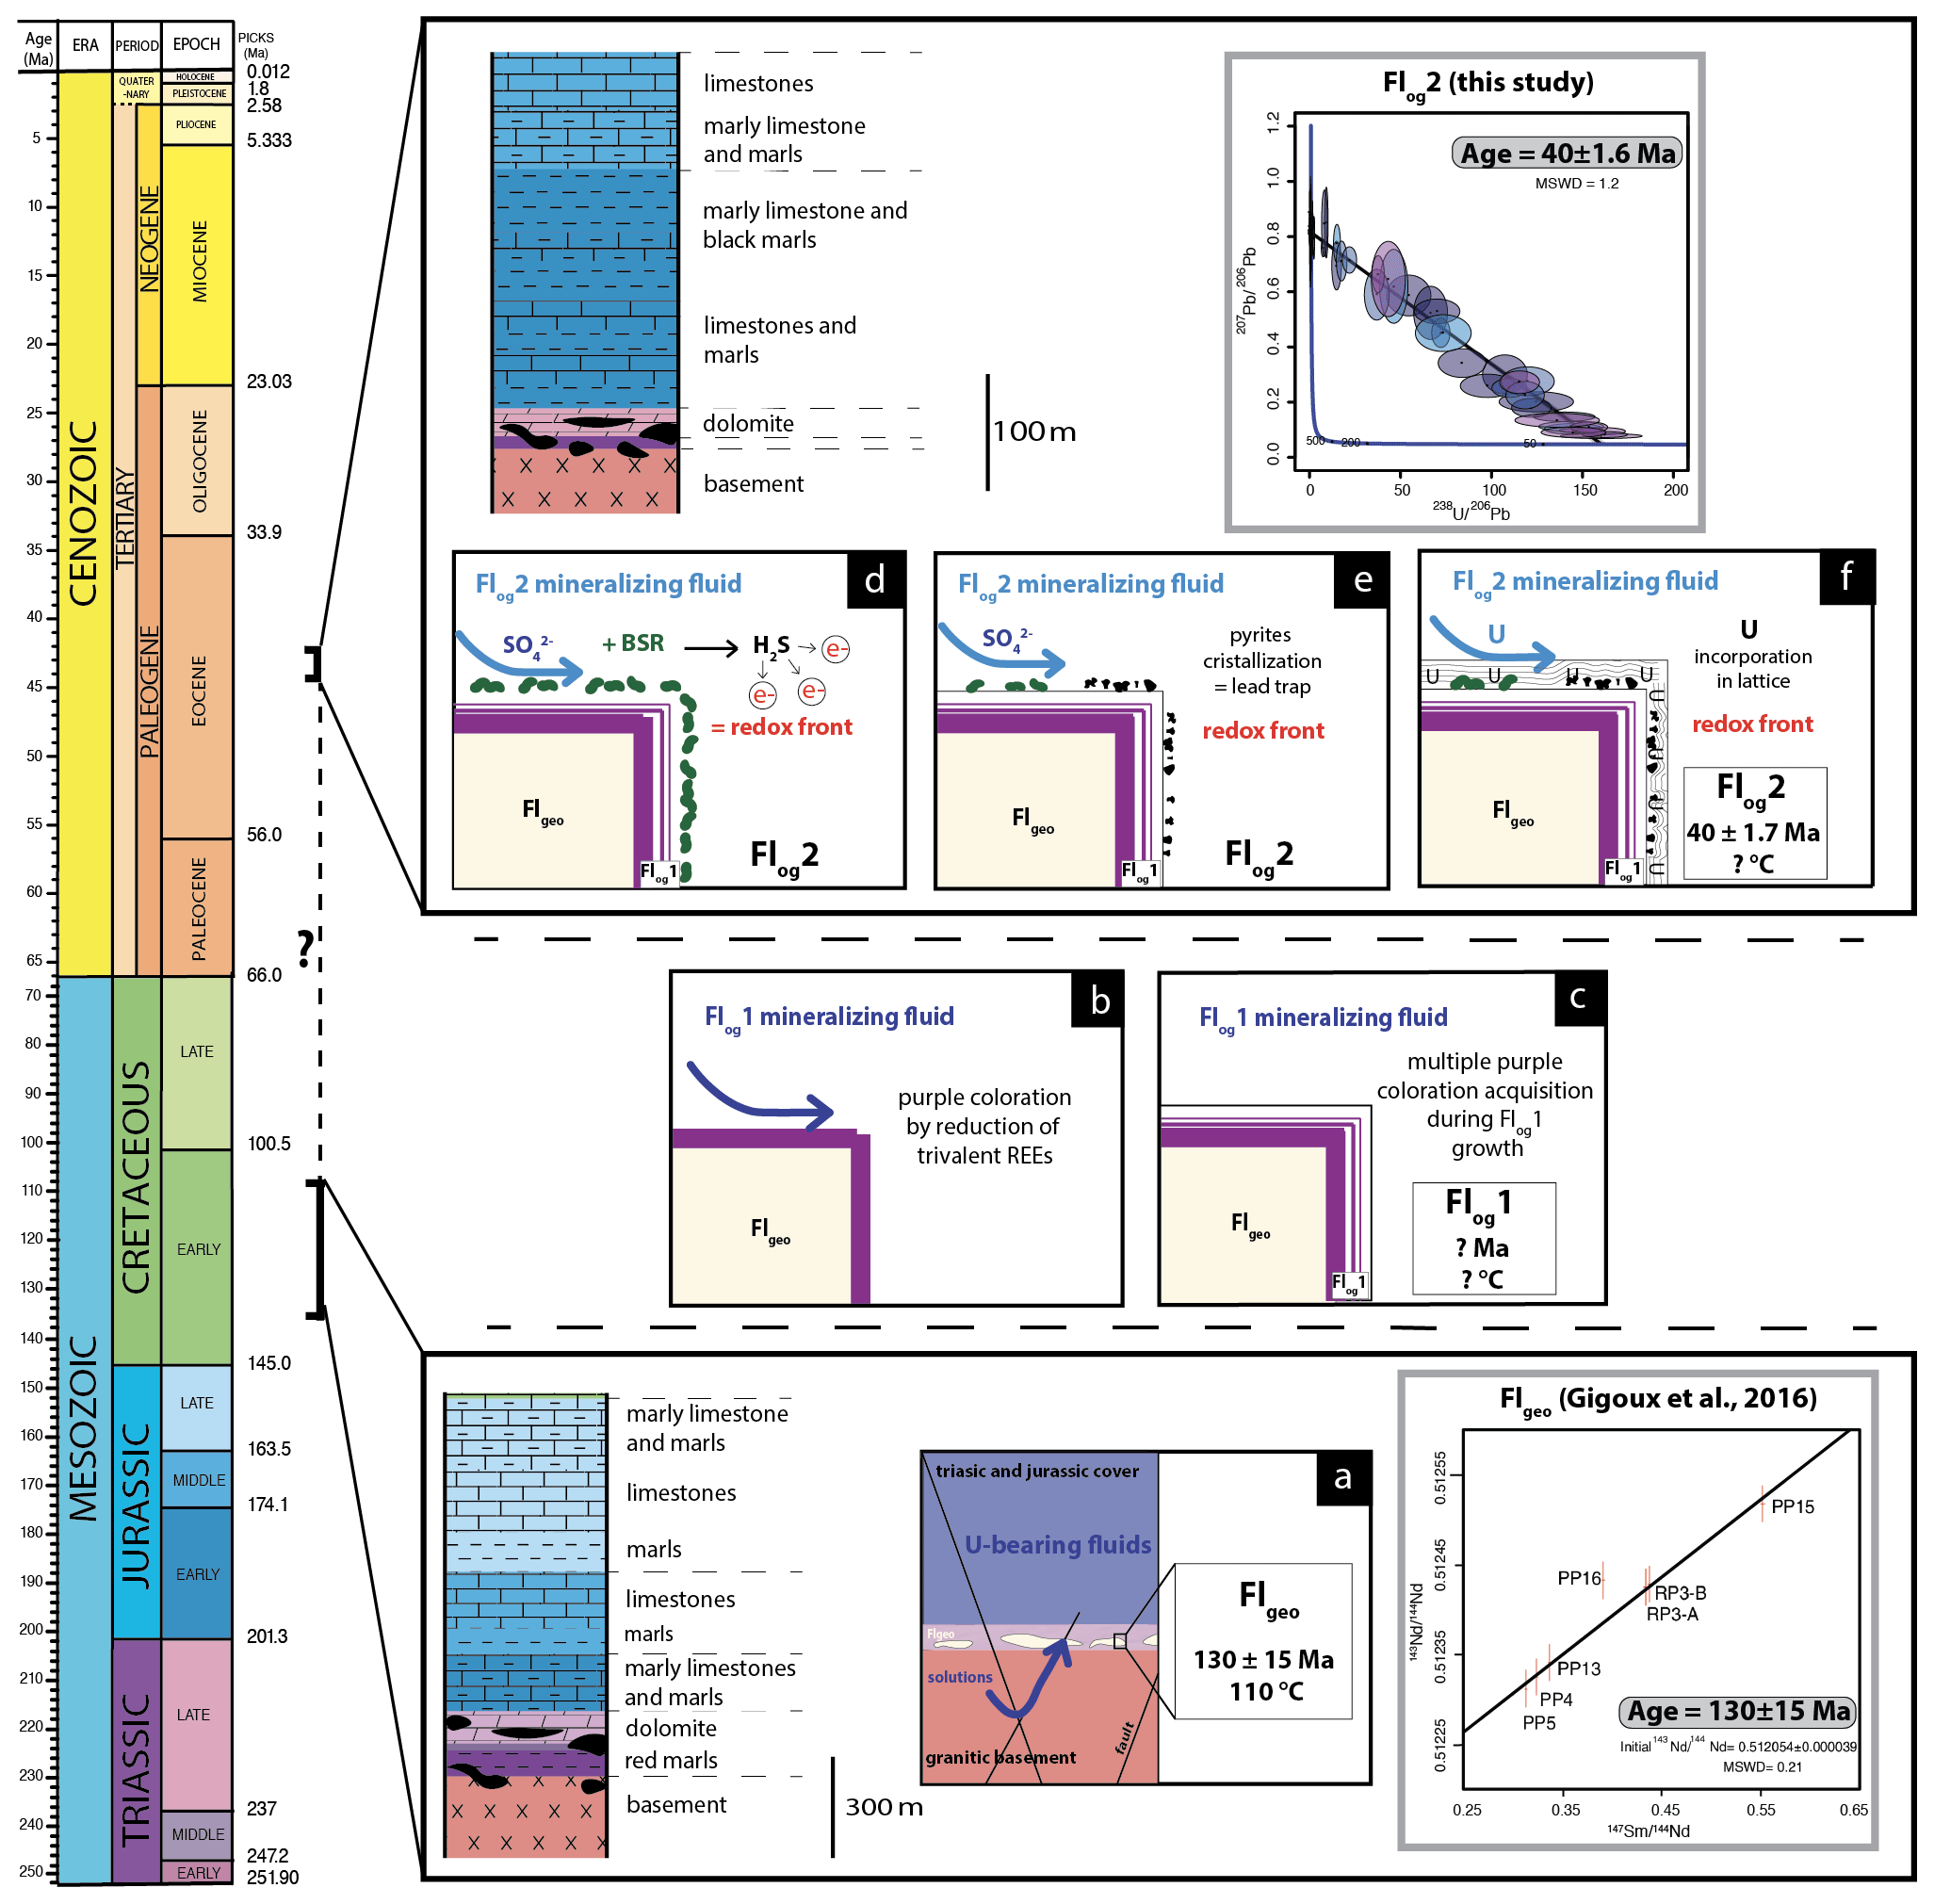
Figure 9Conceptual model of U incorporation in the fluorite lattice. (a) Uranium is leached by F-rich solutions flowing through the granitic basement and reaching Flgeo in the basement–cover interface. (b) Formation of purple layers on the fluorite surface by F-bearing fluids. (c) Crystallization of Flog1. (d) A local redox front is generated by BSR. (e) S species react with Fe oxyhydroxides or dissolved Fe to form pyrite. (f) U is incorporated in Flog2.
The transition between Flog1 and Flog2 may be explained by the development of a redox front, causing U incorporation in the crystal lattice. The presence of numerous pyrite crystals in Flog2, similar to those reported by Dill and Weber (2010), characterizes a reducing environment that probably initiated the precipitation of U. Pyrite is common in roll-front U deposits (Bonnetti et al., 2015; Cai et al., 2007; Campbell et al., 2012; Ingham et al., 2014). Globular pyrites, similar to those observed in Flog2, are usually interpreted as biogenic in origin (Belyi et al., 1972; Blakeman et al., 2002; Chen et al., 2019; Bonnetti et al., 2020; Cai et al., 2007; Rackley, 1972). This hypothesis is supported by the sulfur stable isotope composition of the pyrites included in Flog2 (mean δ34S = −23.6 ‰V-CDT). The homogeneous δ34S of these pyrites indicates a large amount of sulfate available for reduction by bacteria in an open system (Hough et al., 2019; Magnall et al., 2016). Concentric incorporation of Ni, As and Cu (Fig. 7) was reported in both biogenic (Baumgartner et al., 2020) and abiogenic pyrite (Wu et al., 2019). Barbarand et al. (2013) show that the basement of the southeastern Paris Basin was subjected to temperatures less than 60 ∘C during the Eocene period. This temperature estimate is compatible with bacterial activity. Hence, we propose that U incorporation in Flog2 is related to bacterial sulfate reduction (BSR; Fig. 9). The solubility of U was enhanced by F-bearing solutions (Xing et al., 2019) that leached the granitic basement through the fracture network (Fig. 9a). When reaching the unconformity between the basement and the sedimentary cover, a local redox front generated by BSR causes U to precipitate (Fig. 9d). BSR produces sulfur species reacting with iron oxyhydroxides or dissolved iron to form iron disulfides (Fig. 9e; Bonnetti et al., 2017; Machel, 2001). The incorporation of U, together with other elements (Figs. 5 and 6), may have been enhanced through their adsorption by bacterial biofilms developed at the surface of fluorite crystals (Fig. 9f). Indeed, the collomorphic fibrous texture of the external overgrowth Flog2 in the Pierre-Perthuis crystals could result from the development of biofilms in pore–geode linings (see Figs. 3f and 4b, lower right; Fig. 6, lower left; and Fig. A4). Although the secretion of extracellular polymeric substances leading to the formation of bacterial biofilms on pyrite has been extensively documented, their development at the surface of fluorite crystals remains largely unexplored apart from Heim et al. (2012), who reported tubular structures within fluorite-filling fractures in the Äspö diorite in Sweden, interpreted as fossilized microbial biofilms.
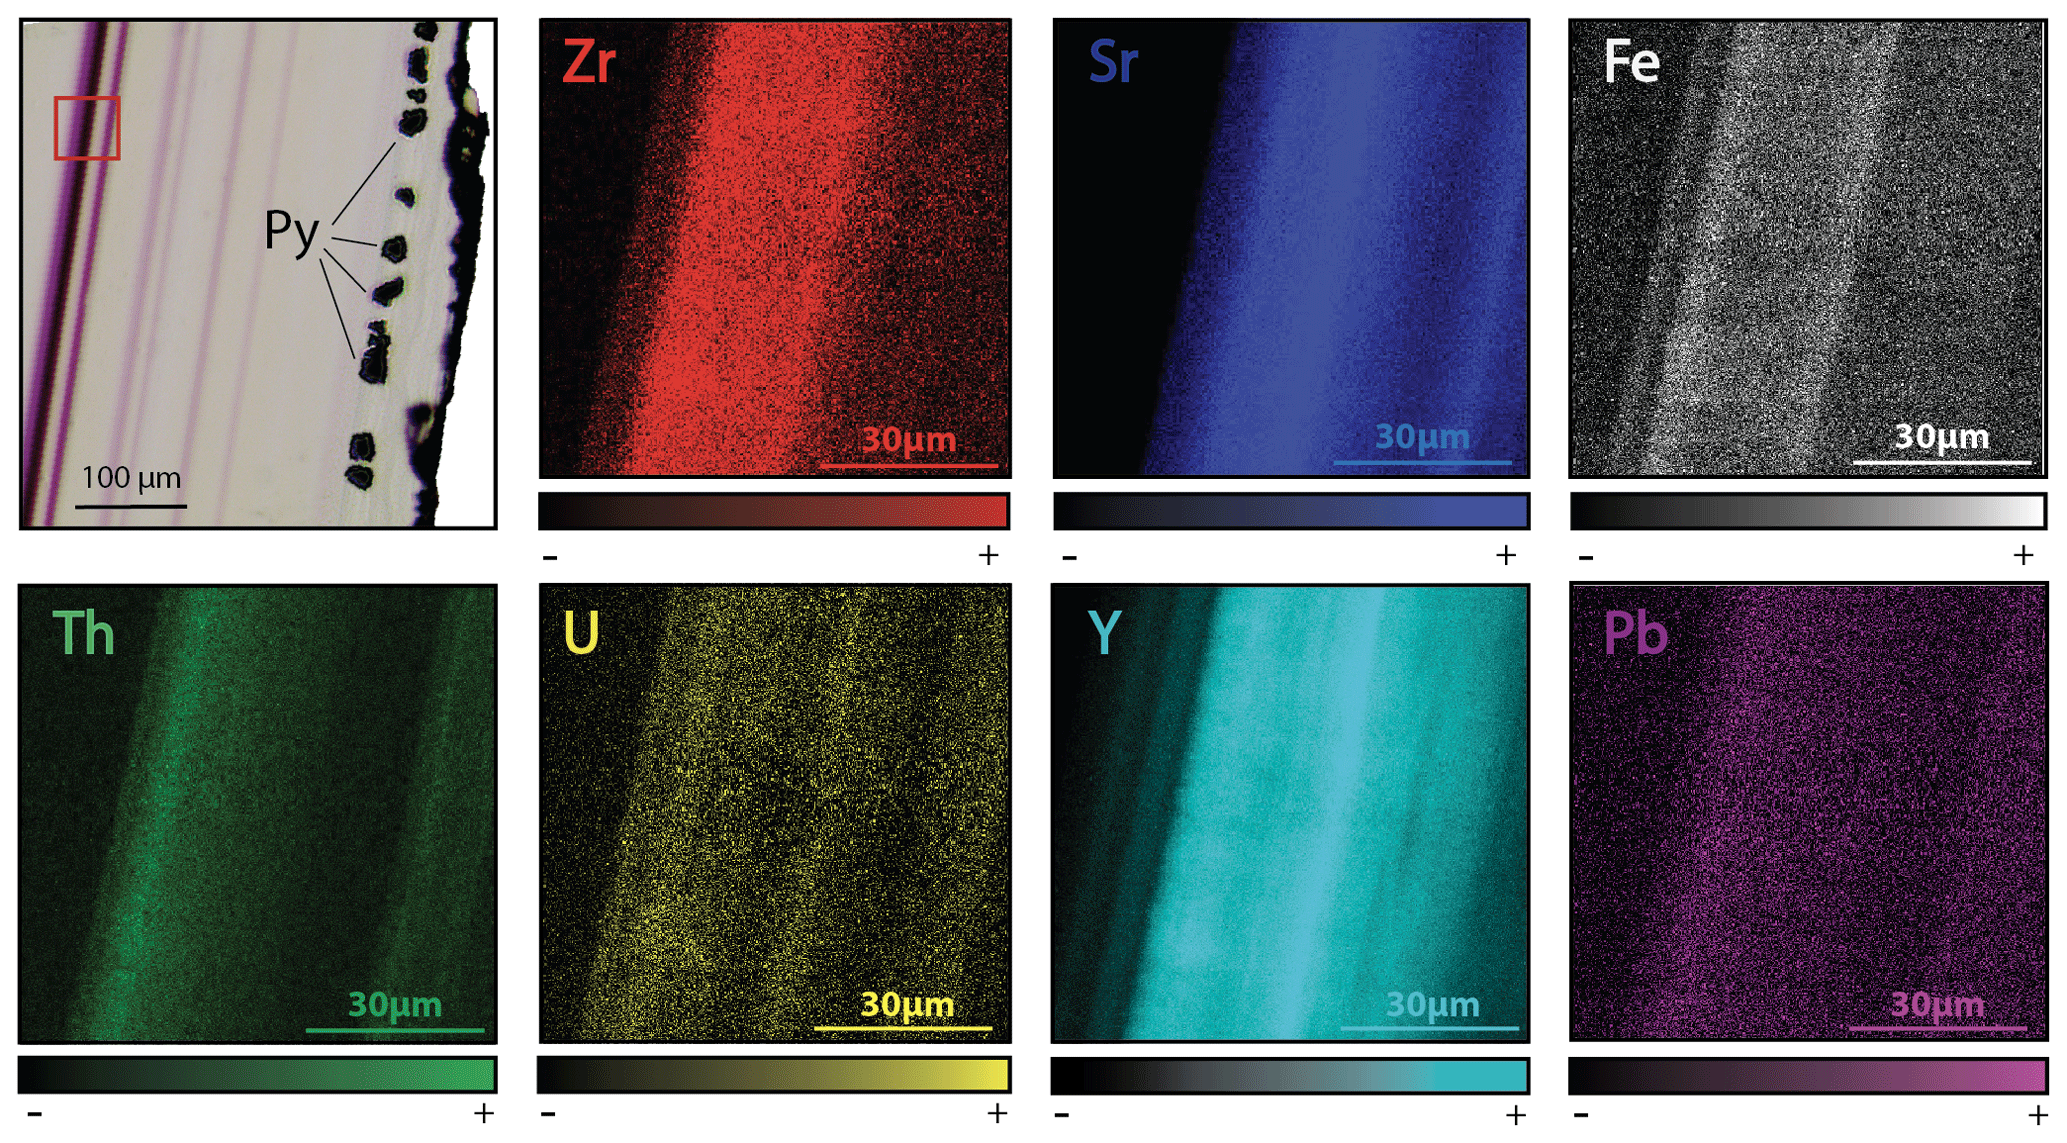
Figure 10Transmitted plane-polarized light photography from PP18S7 and corresponding synchrotron X-ray fluorescence elemental maps. The area of the XRF scan is outlined by a red box on the photograph. Map dimensions are 80 × 80 µm.
The development of purple colorations in fluorite has long been recognized to be related to the vicinity of U-bearing minerals (Chatagnon et al., 1982; Pi et al., 2007). Bill and Calas (1978) proposed that the incorporation of Eu2+, together with metallic calcium colloids formed by long-time irradiation, can cause purple colorations. Chatagnon et al. (1982) and later Kempe et al. (2002) show that such colorations have rather been caused by the reduction and stabilization of Tm and Ho in the divalent state under irradiation by the radioactive decay series of U. SR-XRF mapping focused on small well-defined purple growth bands (Fig. 10) shows enrichment in U and Th. Because the width of such bands is sometimes less than 10 µm, we have discarded the hypothesis of a coloration acquired through internal alpha irradiation (Dill and Weber, 2010; Pi et al., 2007; Vochten et al., 1977). Moreover, it must be noted that such coloration is not developed in the U-bearing Flog2 layer (Figs. 5 and 6). We rather suggest that coloration was acquired through external gamma irradiation. In the following section, we will further discuss the spatial distribution and retention of U and Pb as well as the reliability of the U–Pb geochronometer in fluorite.
5.2 Fluorite U–Pb geochronology
5.2.1 Retention of U in fluorite
We further discuss potential alterations of the U–Pb geochronometer through (1) the development of fractures and cleavages, (2) dissolution and recrystallization, and (3) solid-state diffusion.
-
Fractures and cleavages.
Fluorite is well known to develop cleavages and fractures. Although cleavages are abundant in the core of the crystals (Flgeo), they are rare on the rims (Fig. 3c). Scarce fractures crosscutting Flog2 were observed, causing the oxidation of pyrite (Fig. 3e). Adjacent pyrite crystals being unaffected, these fractures only generated local alterations and were consequently avoided in LA-ICP-MS analyses (Fig. 3d).
-
Dissolution and recrystallization.
Dissolution and re-precipitation of fluorite in hydrothermal deposits are common (Burisch et al., 2017). In Pierre-Perthuis, some crystals show irregular surfaces, demonstrating that a late fluid event was able to slightly dissolve fluorite. These corroded crystals were not selected for LA-ICP-MS analyses. In the other crystals, the preservation of pyrite crystals, the internal fibrous texture of fluorite, and the perfect geometric relationship between Flgeo and Flog (Fig. 3d and e) demonstrate that Flog2 was not dissolved and recrystallized.
-
Solid-state diffusion.
Cherniak et al. (2001) determined the diffusion rates of Sr, Y and REE in natural fluorite and concluded that no significant diffusion (< 100 µm) should occur at temperatures below 500 ∘C. Bosze and Rakovan (2002), however, document diffuse boundaries between REE sectoral zoning in fluorite, interpreted as resulting from the diffusion of these elements over a distance of 200–300 µm. In Pierre-Perthuis, the preservation of ca. 10 µm thick violet bands with sharp terminations demonstrates the absence of significant REE diffusion (Kempe et al., 2002). SR-XRF mapping also shows the preservation of Sr, Y, Th, Pb and U-rich bands of a thickness of ca. 10 µm (Fig. 6), providing evidence for the absence of solid-state diffusion of these elements in our samples. Although the crystallization temperature of Flog2 is unknown due to the absence of fluid inclusions, a maximum temperature of 100 ∘C is speculated based (1) on the fluid inclusion homogenization temperature ranging from 80 to 100 ∘C for Flgeo at Pierre-Perthuis (Gigoux et al., 2016), (2) δ34S values of pyrite suggesting BSR and (3) the fact that the paleotemperatures reached by the Assise de Chitry Fm in the area were low during the Cenozoic period (Barbarand et al., 2013; Gigoux et al., 2016). We thus conclude that U and Pb did not diffuse within Flog2.
5.2.2 In situ LA-ICP-MS U–Pb dating
The uranium concentration in fluorite is highly variable (Piccione et al., 2019; Walter et al., 2018; Wolff et al., 2016) and is often insufficient for U–Pb dating (Piccione et al., 2019). In the Pierre-Perthuis fluorite ore, the geodic fluorite Flgeo, dated at 130 ± 15 Ma by Sm–Nd (Gigoux et al., 2015), could not have been tested for U–Pb geochronology because it contains no U. Likewise, Flog1 is not amenable to U–Pb dating. The first fluorite generation, Fleuh, precipitated during the dissolution of the host dolomite rock and therefore contains too many carbonate impurities that cannot be excluded from sampling in LA-ICP-MS.
Compared to U–Pb geochronology of other common Pb-bearing minerals such as calcite (e.g., Roberts et al., 2020), fluorite U–Pb geochronology presents some additional analytical challenges. Laser-induced damage in fluorite has been extensively studied (De Bonis et al., 2014; Jia et al., 2005; Rafique et al., 2012; Reichling et al., 1994). Due to thermal stress and shock waves, large fractures and the ejection of solid fragments commonly occur during the first laser shots (Gogoll et al., 1996; Johansen et al., 1995). A 7 s pre-ablation, excluded from data used for U–Pb age calculation, helps in getting more stable ablation rates.
Ablation quality depends on numerous factors including laser parameters (wavelength, fluence and repetition rate) and intrinsic crystallographic features like orientation, chemical impurities, fluid inclusions or defects (Gogoll et al., 1996). Therefore, ablation rate and quality may largely vary from one natural fluorite crystal to another.
Variations in ablation rates (crater depth to crater diameter) may generate variable downhole fractionation (DF). To minimize DF, a low laser fluence (typically 1 J cm−2) and a large diameter are generally preferred (Mangenot et al., 2018). However, a fluence of at least 6 J cm−2 was required to ablate Flog2. Optical profilometry measurements of ablation pits in Flog2 reveal variable laser crater aspect ratios (see Fig. A1 for measured crater depths by optical profilometry). The total crater depths, including the material excluded for analysis during the 7 s pre-ablation, vary from 103 to 145 µm in Pierre-Perthuis fluorite samples and is ca. 210 µm for the HK13 fluorite (see Table A5). To correct for DF, a matrix-match primary RM can be used if laser ablation generates similar crater aspect ratios between the reference material and unknown samples (Elisha et al., 2020; Guillong et al., 2020). Such a matrix-match RM is not yet available for fluorite U–Pb geochronology (Piccione et al., 2019). However, even with the use of such an RM, DF correction may turn out to be incorrect because of variable crater aspect ratios in fluorite. Further research is needed to improve the precision and accuracy of fluorite U–Pb geochronology through the systematic comparison of LA-ICP-MS crater aspect ratios in fluorite samples of known ages. In addition to DF, other sources of elemental fractionation should also be investigated, such as the influence of the chemical composition of the aerosol (Sylvester, 2008). Piccione et al. (2019) reported comparable U–Pb ages acquired on fluorite and associated nacrite, suggesting that this effect may not introduce a significant bias.
5.3 U–Pb age significance and wider considerations regarding radiometric dating of ore deposits
In the absence of elemental fractionation correction against a fluorite RM, the age of the last generation of fluorite in Pierre-Perthuis ore (Flog2), 40.0 ± 1.7 Ma, may be overestimated or underestimated. Considering an age offset of 20 % as an extreme case (Guillong et al., 2020), this age estimate still significantly differs from the Sm–Nd age of 130 ± 15 Ma (Gigoux et al., 2015) for the prior geodic fluorite crystals Flgeo.
Bergerat (1984) proposed an N–S compressive stress field during the Eocene through microstructural analysis in the studied area, interpreted as the consequence of the Pyrenean compression. Evidence of late Eocene brittle deformation and associated fluid flows is also found in the eastern Paris Basin, ca. 150 km northeast of Pierre-Perthuis, where calcite-cementing hydraulic breccias were dated at 43 ± 1 Ma (Brigaud et al., 2020; Pagel et al., 2018). Volcanic activity in the northern part of the French Massif Central has been reported by Bellon et al. (1974) and Lefort and Agarwal (2002) during this period about 80–120 km southeast of the study area. In conclusion, a local compressive stress field related to the propagation of N–S Pyrenean compression in the intraplate domain may have generated fluid flows and the crystallization of Flog2.
In Pierre-Perthuis, the geodic fluorite crystals Flgeo yield an Sm–Nd age of 130 ± 15 Ma (Gigoux et al., 2015). Here, we show that later fluid flows took place during the Cenozoic period, recorded as rims overlaying Flgeo. Hence, at least two mineralizing events occur during a time period of ca. 90 Myr.
In some ore deposits, the fluorite Sm–Nd system is the only available geochronometer. However, errorchrons and imprecise ages may result. In such cases, U–Pb geochronology of authigenic phases with elevated common Pb such as calcite (Rasbury and Cole, 2009), hematite (Walter et al., 2018), chalcedony (Nuriel et al., 2011) or nacrite (Piccione et al., 2019) offers new perspectives to gain knowledge on the successive chronology of mineralizing fluid flows. In Pierre-Perthuis, however, as in some other F–Ba deposits, these minerals are absent. A late Eocene age estimate for the last fluorite-mineralizing event reveals that the ore formation is polygenic. Fluorite was deposited during several successive fluid flows induced by the reactivation of faults affecting the granitic basement. Small-scale radiometric dating of single growth bands in authigenic phases makes it possible to determine the chronology of these multiple crystallization events. Future research should be conducted to test the U–Pb geochronometer in fluorite crystals dated by Sm–Nd and other direct ((U–Th–Sm) He) or indirect methods.
We have explored the U–Pb geochronometer in fluorite. In the Pierre-Perthuis F–Ba deposit, U was found in the most external rim of fluorite crystals. SR-XRF mapping demonstrates the preservation and retention of micrometer-thick zonation in the U concentration in fluorite. Petrographic observations coupled to induced fission tracks and SR-XRF mapping show that U is incorporated in the fluorite crystal lattice by elemental substitution. The incorporation of U is related to bacterial sulfate reduction, evidenced by globular pyrite inclusions. Relying on careful and detailed petrography, we show that such growth bands can be dated by U–Pb geochronology. The Tera–Wasserburg lower intercept yields an age of 40.0 ± 1.7 Ma, not corrected for matrix-related elemental fractionation. This age estimate corresponds to the last minor fluorite-mineralizing event. Since the crystal cores were previously dated at 130 ± 15 Ma by Sm–Nd, at least two episodes of fluid flow occurred during ca. 90 Myr. Future research should be conducted to correct for 238U 206Pb fractionation during LA-ICP-MS analysis in fluorite through the definition of a fluorite reference material.
A1 Uranium concentration measured by counted fission tracks
The range of latent track lengths of fission particles depends on the density of materials; the correction factor between two matrixes is given by Enkelmann et al. (2005). The latent fission-track lengths corresponding to the combined ranges of the light (Lt) and heavy (Hv) nuclide ejected in opposite directions from the fission of 235U after capture of a thermal neutron (Jonckheere, 2003) have been simulated by SRIM® software (Ziegler et al., 2010). The numerical values for the mass and energy of these nuclides are taken from Kahn and Forgue (1967); the glass standard reference CN5 density is from De Corte et al. (1998), and all data and simulation results are summarized in Table A1.
Table A1Data used to calculate the correction factor for U concentration in fluorite using induced fission-track mapping in SRIM® software. (a) Mass (MA) and energy (E0) of heavy (Hv) and light (Lt) nuclides produced by the fission of 235U. (b) The formula and density (d) of the two simulated materials. (c) The latent track lengths (2R) obtained by adding the simulated range lengths of both nuclides. (d) Uranium concentration correction factor (Fcorr) calculated for fluorite with glass standard material (Enkelmann et al., 2005).
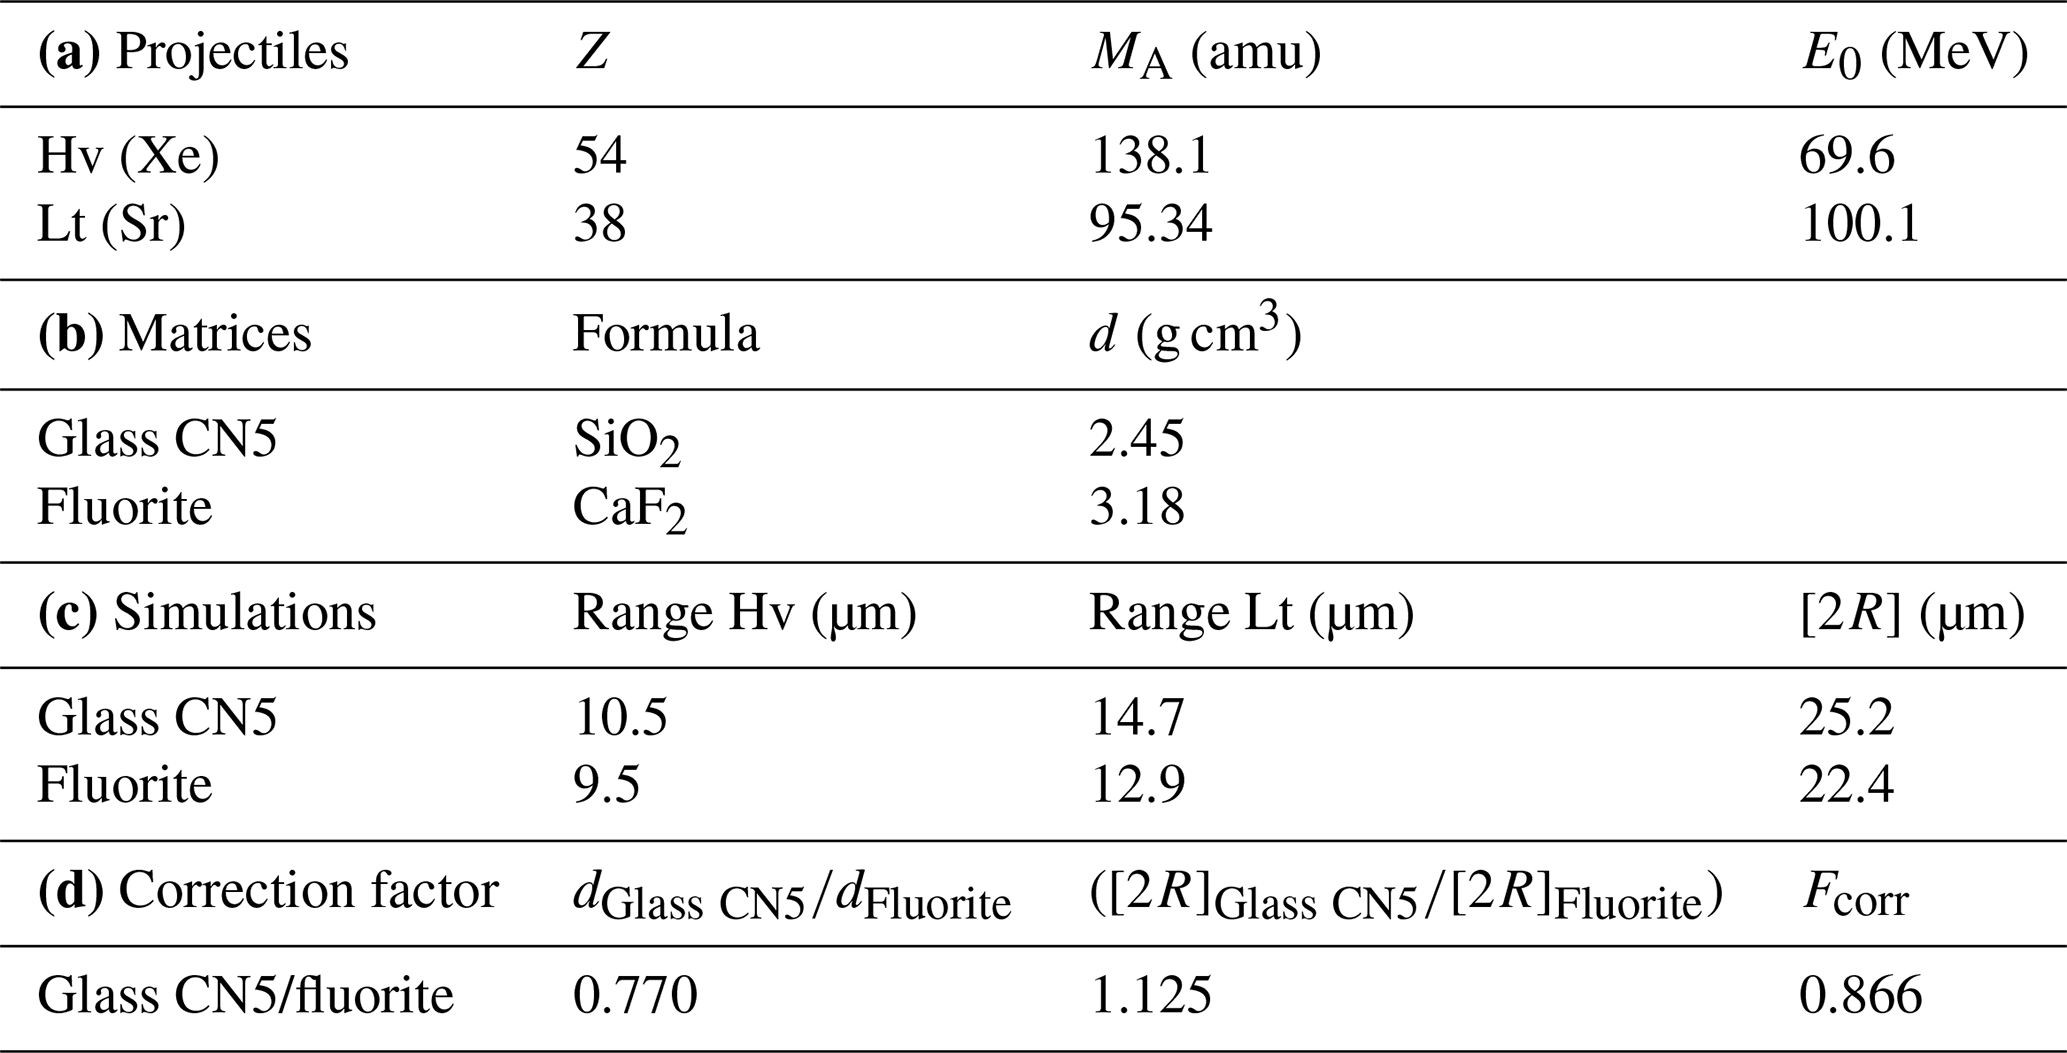
Table A2Fission-track analytical results. Counted areas are distributed along Flog2 on different samples. The correcting factor employed for U concentration calculation on each sample depends on the counted area and followed a bracketing method (thanks to the two CN5 standards certified at 12.17 ppm).
A2 Estimation of the penetration depth of SR-XRF
Table A3Information depth estimation (µm) and measured X-ray line (keV) of the SR-XRF method in fluorite for each element.
A3 LA-ICP-MS U–Pb dating parameters
Table A4Data for fluorite LA-ICP-MS U–Pb analysis at University Paris-Saclay, GEOPS laboratory.
A4 Depth and diameter of laser craters
3D images of laser craters have been acquired with an optical profilometer 3D Contour GT-X (Bruker Corp., Billerica, MA, USA) in VSI (vertical shift interference) mode at GeePs laboratory, Université Paris-Saclay. This instrument produces 3D images of a surface and also depth profiles on chosen axes thanks to Vision® analysis software (VISIONx Inc., Pointe Claire, Quebec, Canada). The VSI mode is based on white light vertical scanning interferometry, with measurable topography up to 1 mm and a vertical resolution of 3 nm. Lateral resolution measurements are a function of the objective magnification (× 50 magnification was used for this study), giving a lateral resolution of 0.2 µm.
Table A5Statistical analysis of crater depths induced by laser ablation for U–Pb dating by an optical profilometer. The total crater depths and volumes include the 7 s pre-ablation (N.D. – not determined).

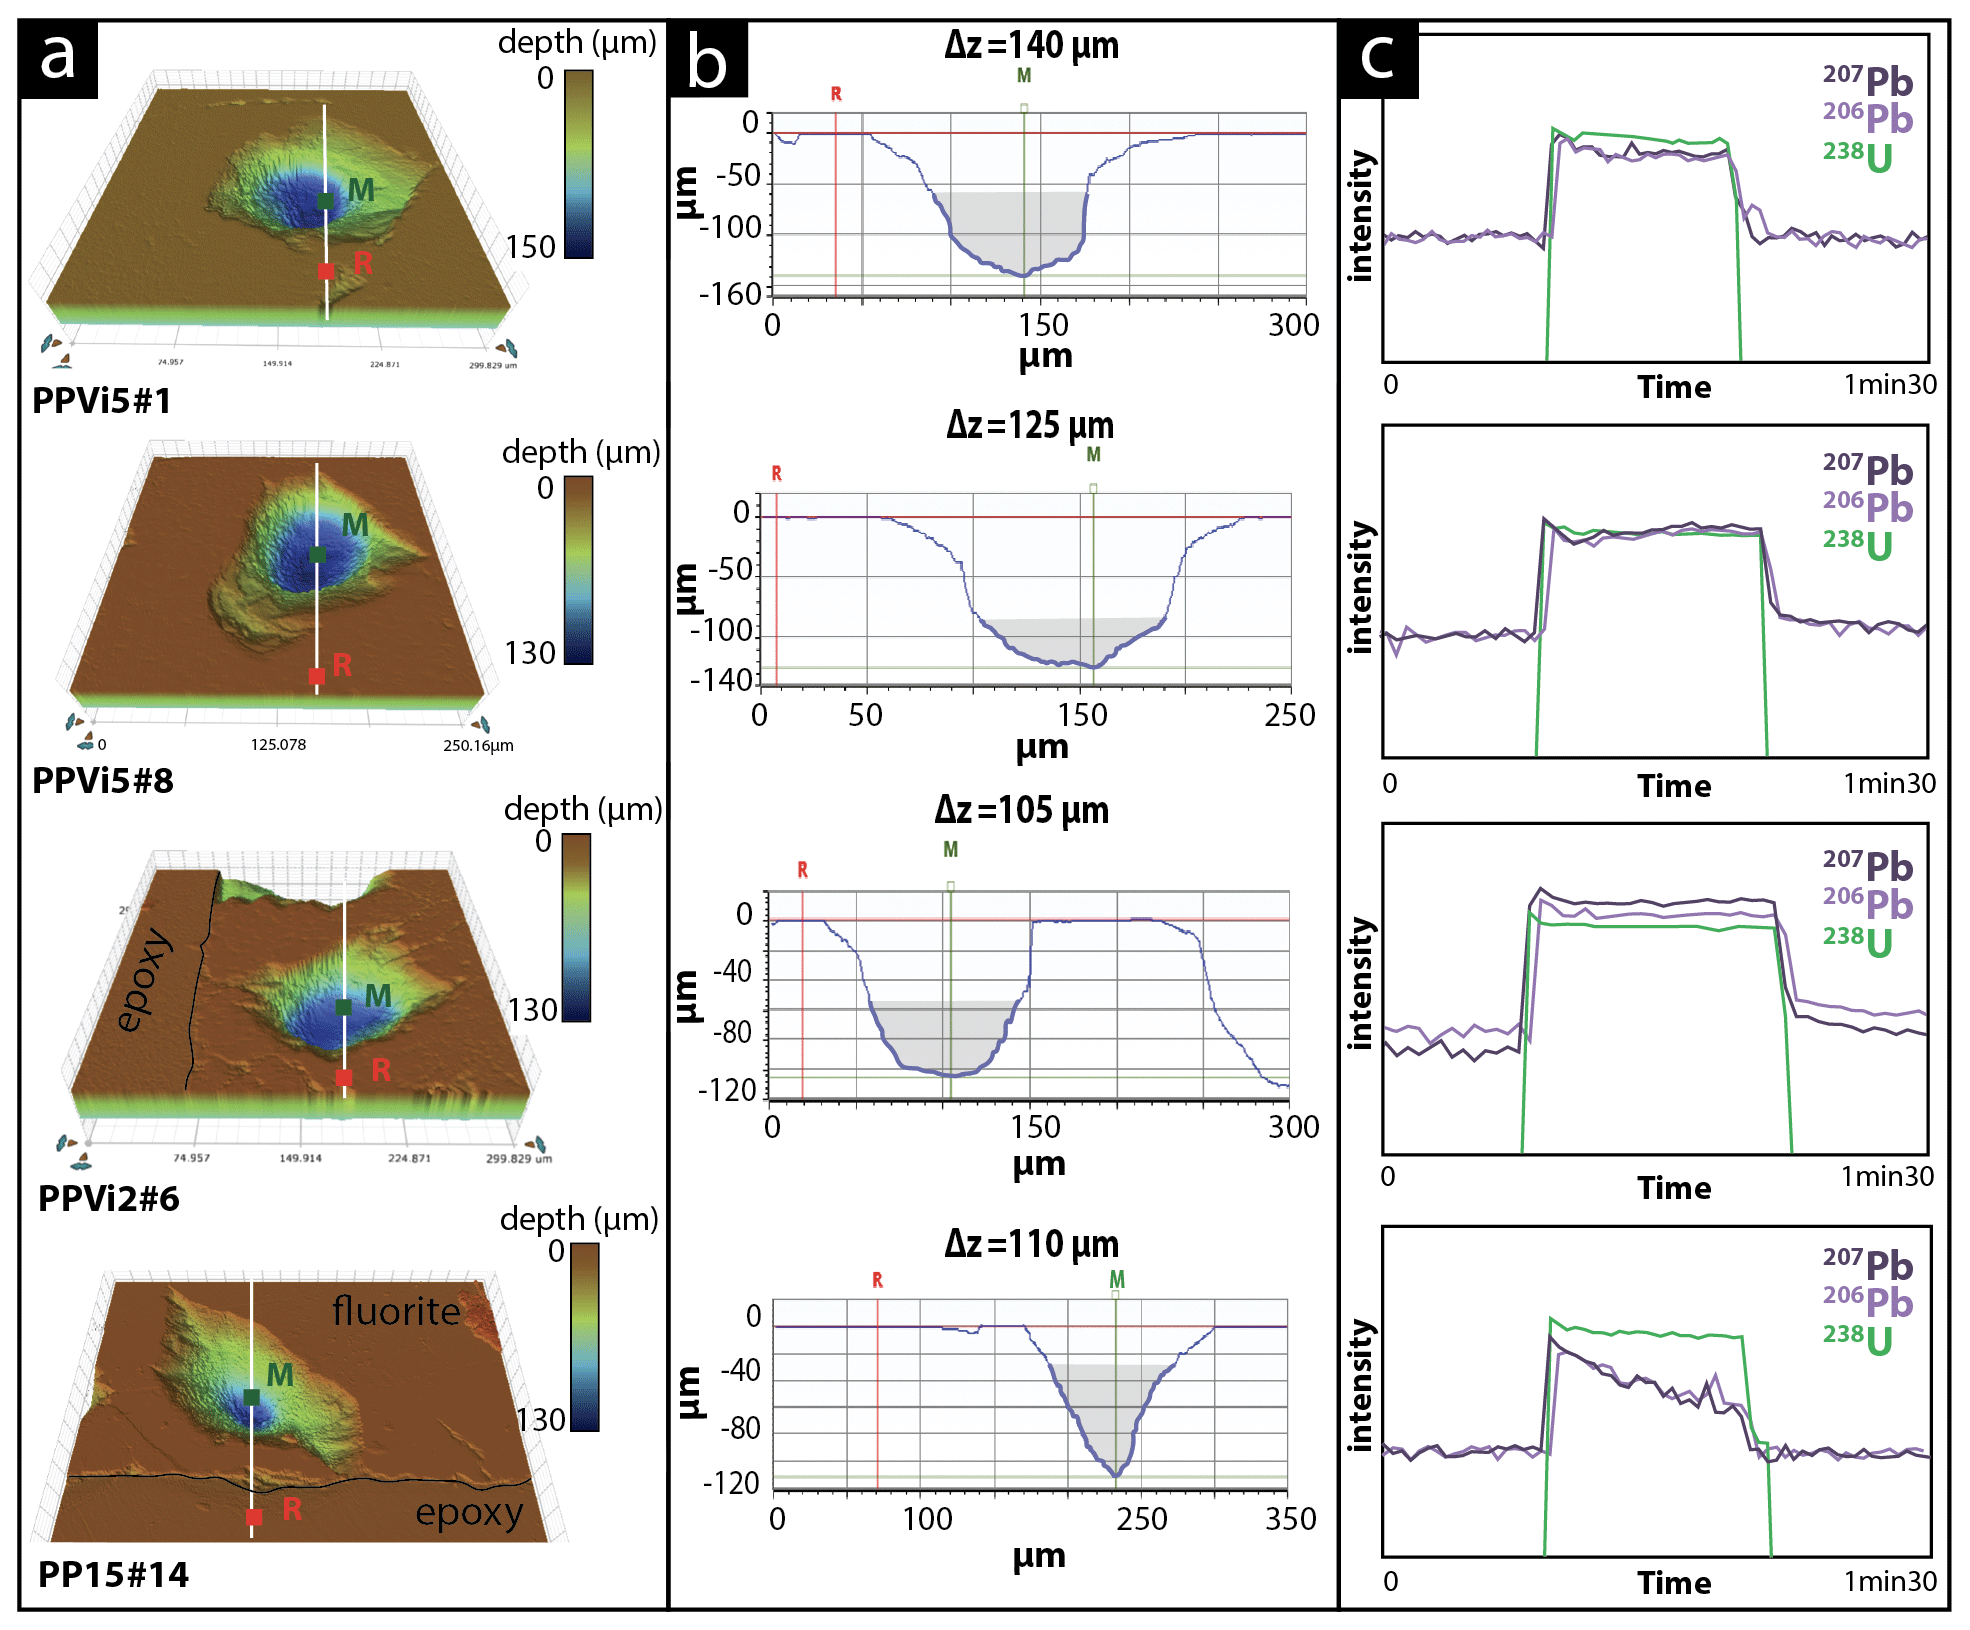
Figure A1Various crater aspects induced by laser ablation on different fluorite sample (a) 3D surface images of craters reconstructed by an optical profilometer. (b) Corresponding 2D axial section with the measurement of crater depth thanks to two markers: R (the average value of the planar surface around the crater) and M (the deepest point in the crater) expressed as Δz (µm); illustrated in grey is the volume below a crater diameter of 85 µm. (c) The corresponding LA-ICP-MS signal intensity of 238U, 206Pb and 207Pb during the laser ablation. Analyses PPVi5 no. 8, PPVi5 no. 1 and PPVi2 no. 6 were included in the Tera–Wasserburg diagrams, while PP15 no. 14 is an example of an analysis discarded due to variable 238U 206Pb.
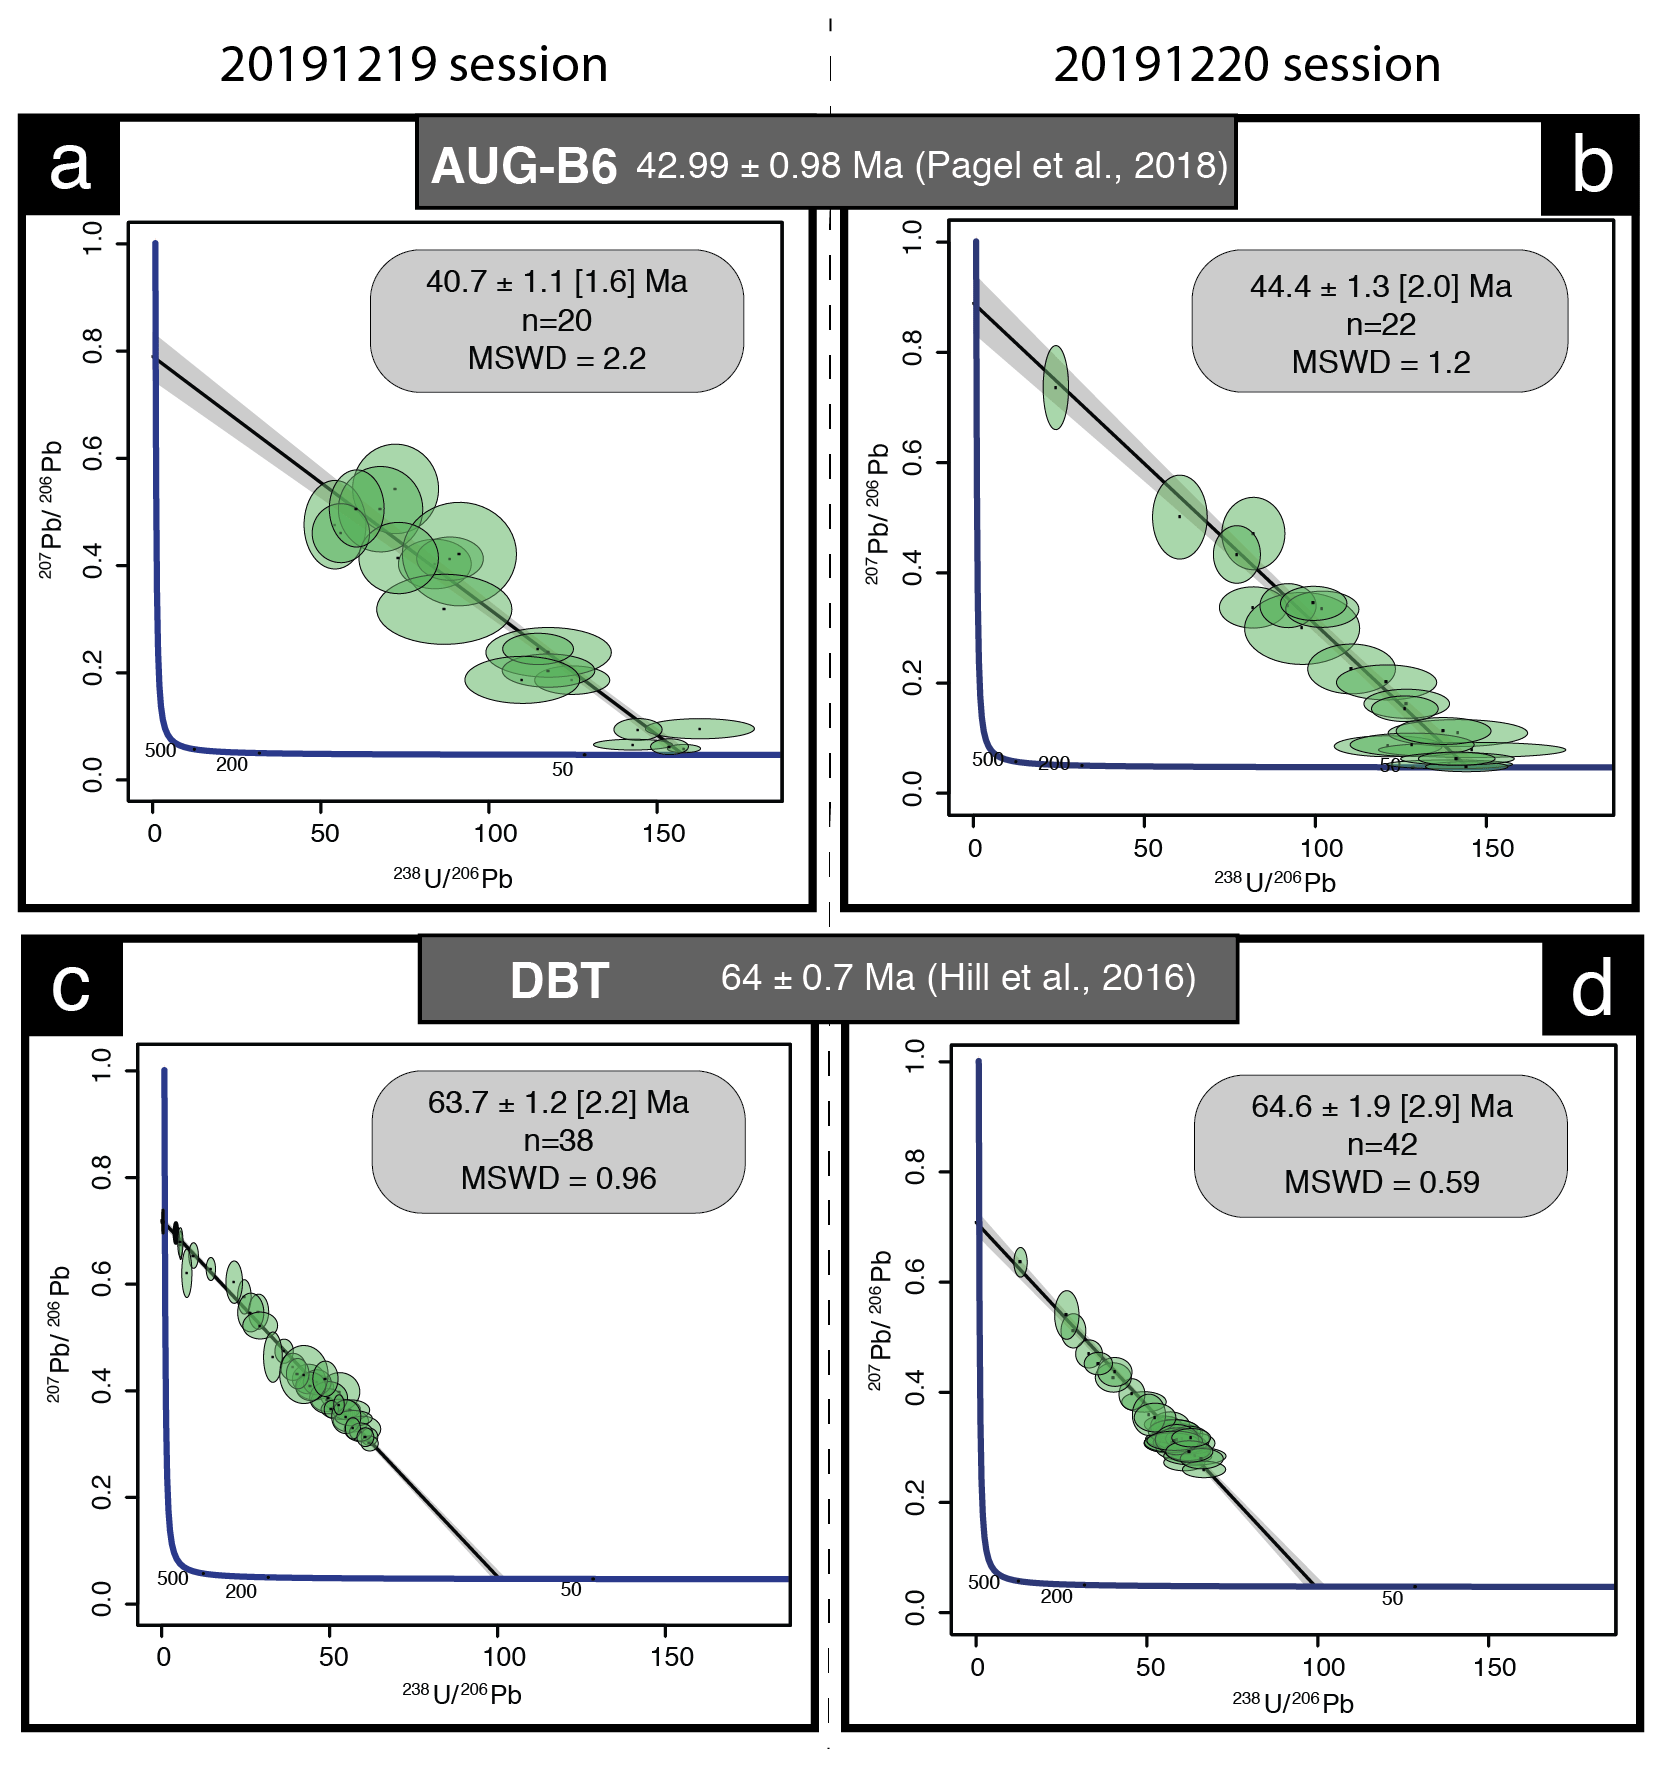
Figure A2Tera–Wasserburg diagrams of secondary calcite reference materials. (a, b) Tera–Wasserburg diagrams displaying corrected ages for the calcite of the Gondrecourt graben AUG-B6 measured during the two analytical sessions. (c, d) Tera–Wasserburg diagram displaying the Duff Brown Tank corrected ages measured during the two analytical sessions.

Figure A3Tera–Wasserburg diagrams of secondary fluorite reference materials; HK13 fluorite dated at 290 ± 10 Ma by Wolff et al. (2016).
A5 Petrographic observations

Figure A4Microphotography of the fluorite stages from the Pierre-Perthuis ore showing the contrast in fluid inclusion concentrations between Flgeo and Flog. Py: pyrite.
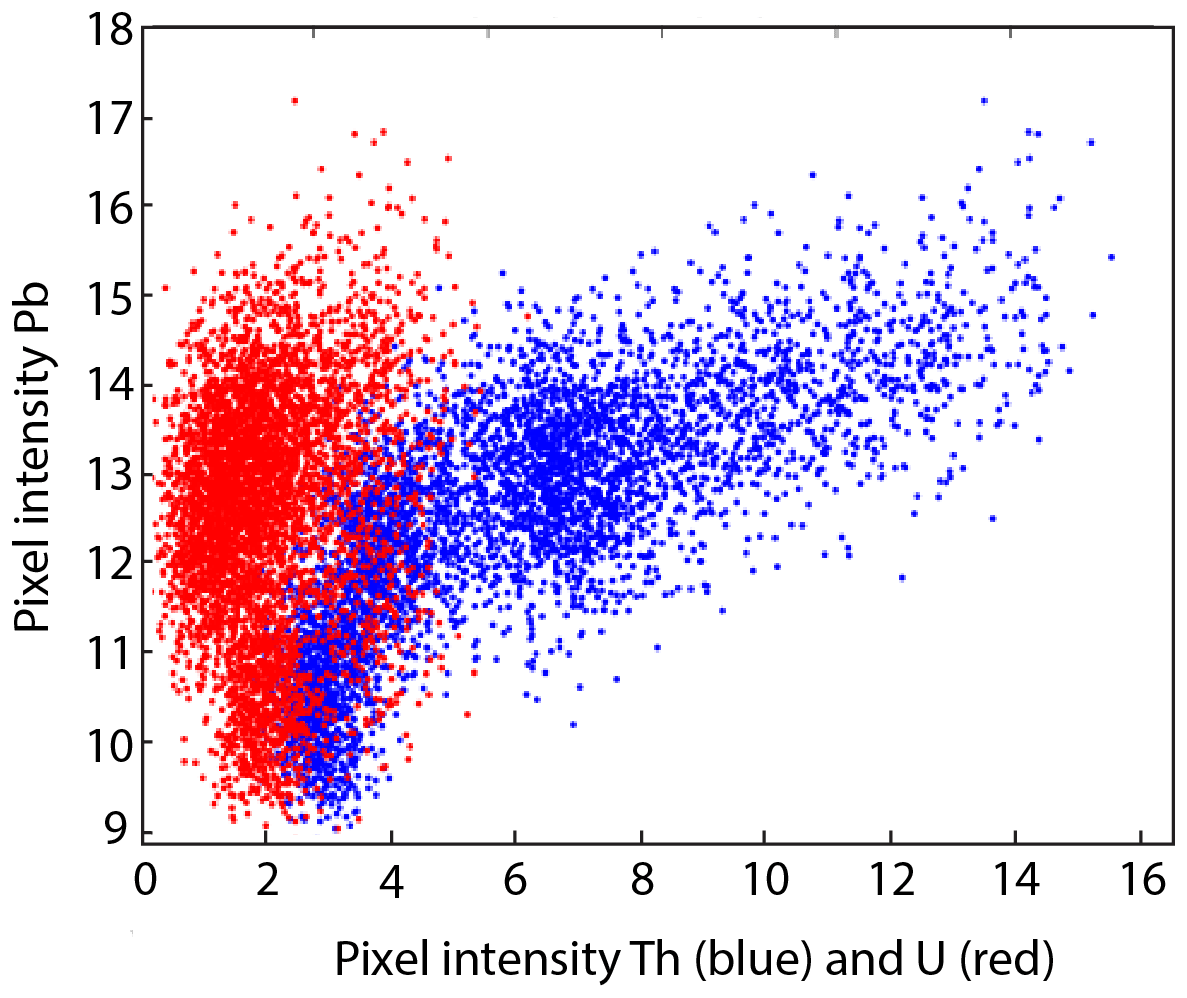
Figure A5Scatter plot of Pb as a function of Th (blue) and U (red) in pixel intensities, corresponding to the scanned area illustrated in Fig. 6.
The MATLAB (r) code developed in-house and used for SR-XRF elemental mapping is specific to the software and hardware environment of the Nanoscopium beamline of SOLEIL in order to optimize it for on-line fast data treatment during experiments. As such, this software is not intended to be publicly available. However, there are freewares, such as the PyMCA software, which can be applied to data treatment a posteriori (we also applied PyMCA for some a posteriori data treatment tasks).
All data are included in the paper and in the Supplement.
The supplement related to this article is available online at: https://doi.org/10.5194/gchron-3-199-2021-supplement.
JN and CB were involved in the preparation of the fluorite samples for SEM observations, SR-XRF and induced fission-track mapping. AS directed the elemental mapping experiments on the Nanoscopium beamline at synchrotron SOLEIL and supervised SR-XRF data interpretation. ABO carried out the measurements by 3D optical profilometry at the Group of Electrical Engineering Paris (GeePs) laboratory. JB, BB and MP were involved in fieldwork, data interpretation and the improvement of the paper. LL and TB participated in every step of the study and prepared the paper.
The authors declare that they have no conflict of interest.
The authors acknowledge SOLEIL for the provision of synchrotron radiation facilities and thank Kadda Medjoubi for assistance in using the Nanoscopium beamline. The authors would like to thank Kadda Medjoubi for support and the scientific discussions during SR-XRF experiments on the Nanoscopium beamline at SOLEIL. We acknowledge Nordine Bouden and Johan Villeneuve for the acquisition of sulfur stable isotope ratios by SIMS at the CRPG. We would like to thank Frederic Haurine for his assistance during the acquisition of the U–Pb analyzes performed on the LA-ICP-MS, which is part of the PANOPLY platform (GEOPS-LSCE). Portions of this research were carried out at the SOLEIL synchrotron radiation laboratory, a national user facility operated by CEA and CNRS (Proposal number: 20190188). This research was partly funded by TelluS Program CESSUR “Connaissance et Technologie du Sous-Sol pour son Exploitation et Usage Durable” of CNRS/INSU. Reinhard Wolff is warmly thanked for sharing fluorite sample HK13. This paper greatly benefited from the detailed reviews of Istvàn Dunkl, Troy Rasbury, associate editor Axel Schmitt and editor Klaus Mezger.
This research has been supported by the TelluS Program CESSUR “Connaissance et Technologie du Sous-Sol pour son Exploitation et Usage Durable” of CNRS/INSU.
This paper was edited by Axel Schmitt and reviewed by Troy Rasbury and István Dunkl.
Alexandre, P., Kyser, K., Thomas, D., Polito, P., and Marlat, J.: Geochronology of unconformity-related uranium deposits in the Athabasca Basin, Saskatchewan, Canada and their integration in the evolution of the basin, Miner. Deposita, 44, 41–59, https://doi.org/10.1007/s00126-007-0153-3, 2009.
Baele, J.-M., Monin, L., Navez, J., and André, L.: Systematic REE Partitioning in Cubo-Dodecahedral Fluorite from Belgium Revealed by Cathodoluminescence Spectral Imaging and Laser Ablation-ICP-MS, Proceedings of the 10th International Congress for Applied Mineralogy (ICAM), 1–5 August 2011, Trondheim, Norway, 23–30, https://doi.org/10.1007/978-3-642-27682-8_4, 2012.
Barbarand, J., Quesnel, F., and Pagel, M.: Lower Paleogene denudation of Upper Cretaceous cover of the Morvan Massif and southeastern Paris Basin (France) revealed by AFT thermochronology and constrained by stratigraphy and paleosurfaces, Tectonophysics, 608, 1310–1327, https://doi.org/10.1016/j.tecto.2013.06.011, 2013.
Baumgartner, R. J., Van Kranendonk, M. J., Pagès, A., Fiorentini, M. L., Wacey, D., and Ryan, C.: Accumulation of transition metals and metalloids in sulfidized stromatolites of the 3.48 billion-year-old Dresser Formation, Pilbara Craton, Precambrian Res., 337, 105534, https://doi.org/10.1016/j.precamres.2019.105534, 2020.
Bellon, H., Gillot, P. Y., and Nativel, P.: Eocene volcanic activity in Bourgogne, Charollais, Massif Central (France), Earth Planet. Sc. Lett., 23, 53–58, https://doi.org/10.1016/0012-821X(74)90029-6, 1974.
Belyi, V., Vinogradov, V., and Lisitsin, A.: Sulfur isotope composition of uranium roll ore bodies and its genetic significance, Litologiya i Poleznye Iskopaemye, 6, 42–53, 1972.
Bergamaschi, A.: Développements méthodologiques et logiciels pour l'imagerie X multimodale par balayage sur la ligne de lumière Nanoscopium, Thèse de doctorat, Université Paris Saclay, Saint-Aubin, France, 146 pp., 2017.
Bergerat, F.: La fracturation nivernaise: Influences bourguignonne et centralienne sur la structuration du Nivernais, Bulletin d'information des géologues du bassin de Paris, 21, 27–31, 1984.
Bill, H. and Calas, G.: Color centers, associated rare-earth ions and the origin of coloration in natural fluorites, Phys. Chem. Miner., 3, 117–131, https://doi.org/10.1007/BF00308116, 1978.
Blakeman, R. J., Ashton, J. H., Boyce, A. J., Fallick, A. E., and Russell, M. J.: Timing of Interplay between Hydrothermal and Surface Fluids in the Navan Zn + Pb Orebody, Ireland: Evidence from Metal Distribution Trends, Mineral Textures, and 34S Analyses, Econ. Geol., 97, 73–91, https://doi.org/10.2113/gsecongeo.97.1.73, 2002.
Boiron, M. C., Cathelineau, M., Banks, D. A., Buschaert, S., Fourcade, S., Coulibaly, Y., Michelot, J. L., and Boyce, A.: Fluid transfers at a basement/cover interface Part II: Large-scale introduction of chlorine into the basement by Mesozoic basinal brines, Chem. Geol., 192, 121–140, 2002.
Bonnetti, C., Cuney, M., Michels, R., Truche, L., Malartre, F., Liu, X., and Yang, J.: The Multiple Roles of Sulfate-Reducing Bacteria and Fe-Ti Oxides in the Genesis of the Bayinwula Roll Front-Type Uranium Deposit, Erlian Basin, NE China, Econ. Geol., 110, 1059–1081, https://doi.org/10.2113/econgeo.110.4.1059, 2015.
Bonnetti, C., Liu, X., Zhaobin, Y., Cuney, M., Michels, R., Malartre, F., Mercadier, J., and Cai, J.: Coupled uranium mineralisation and bacterial sulphate reduction for the genesis of the Baxingtu sandstone-hosted U deposit, SW Songliao Basin, NE China, Ore Geol. Rev., 82, 108–129, https://doi.org/10.1016/j.oregeorev.2016.11.013, 2017.
Bonnetti, C., Zhou, L., Riegler, T., Brugger, J., and Fairclough, M.: Large S isotope and trace element fractionations in pyrite of uranium roll front systems result from internally-driven biogeochemical cycle, Geochim. Cosmochim. Ac., 282, 113–132,, https://doi.org/10.1016/j.gca.2020.05.019, 2020.
Bosze, S. and Rakovan, J.: Surface-structure-controlled sectoral zoning of the rare earth elements in fluorite from Long Lake, New York, and Bingham, New Mexico, USA, Geochim. Cosmochim. Ac., 66, 997–1009, https://doi.org/10.1016/S0016-7037(01)00822-5, 2002.
Brigaud, B., Bonifacie, M., Pagel, M., Blaise, T., Calmels, D., Haurine, F., and Landrein, P.: Past hot fluid flows in limestones detected by Δ47–(U-Pb) and not recorded by other geothermometers, Geology, 48, 851–856, https://doi.org/10.1130/G47358.1, 2020.
Burisch, M., Walter, B. F., and Markl, G.: Silicification of Hydrothermal Gangue Minerals in Pb-Zn-Cu-Fluorite-Quartz-Baryte Veins, Can. Mineral., 55, 501–514, https://doi.org/10.3749/canmin.1700005, 2017.
Cai, C., Dong, H., Li, H., Xiao, X., Ou, G., and Zhang, C.: Mineralogical and geochemical evidence for coupled bacterial uranium mineralization and hydrocarbon oxidation in the Shashagetai deposit, NW China, Chem. Geol., 236, 167–179, https://doi.org/10.1016/j.chemgeo.2006.09.007, 2007.
Campbell, K. M., Kukkadapu, R. K., Qafoku, N. P., Peacock, A. D., Lesher, E., Williams, K. H., Bargar, J. R., Wilkins, M. J., Figueroa, L., Ranville, J., Davis, J. A., and Long, P. E.: Geochemical, mineralogical and microbiological characteristics of sediment from a naturally reduced zone in a uranium-contaminated aquifer, Appl. Geochem., 27, 1499–1511, https://doi.org/10.1016/j.apgeochem.2012.04.013, 2012.
Cardon, O.: Datation Re-Os sur pyrite et traçage des sources des métaux dans des gisements de type porphyre et épithermal neutre: Exemple des gisements de Bolcana, Troita et Magura, Monts Apuseni, Roumanie, Thèse de doctorat, Université Henri Poincaré, Nancy, France, 234 pp., 2007.
Carpéna, J., Doubinger, J., Guérin, R., Juteau, J. and Monnier, M.: Le volcanisme acide de l'ouest-morvan dans son cadre géologique: caractéristique géochimique, structurale et chronologique de mise en place, B. Soc. Geol. Fr., 5, 839–859, 1984.
Cathelineau, M., Boiron, M.-C., Fourcade, S., Ruffet, G., Clauer, N., Belcourt, O., Coulibaly, Y., Banks, D. A., and Guillocheau, F.: A major Late Jurassic fluid event at the basin/basement unconformity in western France: and K–Ar dating, fluid chemistry, and related geodynamic context, Chem. Geol., 322–323, 99–120, https://doi.org/10.1016/j.chemgeo.2012.06.008, 2012.
Chatagnon, B., Galland, D., Gloux, P., and Méary, A.: L'lon Paramagnétique Tm2+ dans la Fluorite: Un Témoin de la Radioactivité dans le Gisement, Miner. Deposita, 17, 411–422, https://doi.org/10.1007/BF00204469, 1982.
Chen, Y., Jin, R., Miao, P., Li, J., Guo, H., and Chen, L.: Occurrence of pyrites in sandstone-type uranium deposits: Relationships with uranium mineralization in the North Ordos Basin, China, Ore Geol. Rev., 109, 426–447, https://doi.org/10.1016/j.oregeorev.2019.03.037, 2019.
Cherniak, D. J., Zhang, X. Y., Wayne, N. K., and Watson, E. B.: Sr, Y, and REE diffusion in fluorite, Chem. Geol., 181, 99–111, https://doi.org/10.1016/S0009-2541(01)00267-4, 2001.
Chesley, J. T., Halliday, A. N., and Scrivener, R. C.: Samarium-Neodymium Direct Dating of Fluorite Mineralization, Science, 252, 949–951, https://doi.org/10.1126/science.252.5008.949, 1991.
Chi, G., Li, Z., Chu, H., Bethune, K. M., Quirt, D. H., Ledru, P., Normand, C., Card, C., Bosman, S., Davis, W. J., and Potter, E. G.: A shallow-burial mineralization model for the unconformity-related uranium deposits in the Athabasca basin, Econ. Geol., 113, 1209–1217, https://doi.org/10.5382/econgeo.2018.4588, 2018.
Cinelu, S. and Cuney, M.: Sodic metasomatism and U–Zr mineralization: A model based on the Kurupung batholith (Guyana), Goldschmidt conference, 27 August–1 September 2006, Melbourne, Australia, A103, https://doi.org/doi:10.1016/j.gca.2006.06.120, 2006.
De Bonis, A., Santagata, A., Galasso, A., Sansone, M., and Teghil, R.: Femtosecond laser ablation of CaF2: Plasma characterization and thin films deposition, Appl. Surf. Sci., 302, 145–148, https://doi.org/10.1016/j.apsusc.2013.09.089, 2014.
De Corte, F., Bellemans, F., van den Haute, P., Ingelbrecht, C., and Nicholl, C.: A new U doped glass certified by the European Commission for the calibration of fission-track dating, in: Advances in Fission-Track Geochronology, Springer Dordrecht, The Netherlands, 67–78, https://doi.org/10.1007/978-94-015-9133-1_5, 1998.
Deng, X.-D. and Li, J.-W.: Mineralogy and geochronology of supergene Mn-oxides in the Dongxiangqiao deposit, Hunan Province, South China, Miner. Petrol., 111, 253–265, https://doi.org/10.1007/s00710-016-0466-y, 2017.
Dill, H. G. and Weber, B.: Accessory minerals of fluorite and their implication regarding the environment of formation (Nabburg-Wölsendorf fluorite district, SE Germany), with special reference to fetid fluorite (“Stinkspat”), Ore Geol. Rev., 37, 65–86, https://doi.org/10.1016/j.oregeorev.2010.01.004, 2010.
Dill, H. G., Hansen, B. T., and Weber, B.: REE contents, REE minerals and SmNd isotopes of granite- and unconformity-related fluorite mineralization at the western edge of the Bohemian Massif: With special reference to the Nabburg-Wölsendorf District, SE Germany, Ore Geol. Rev., 40, 132–148, https://doi.org/10.1016/j.oregeorev.2011.06.003, 2011.
Ding, T., Valkiers, S., Kipphardt, H., De Bièvre, P., Taylor, P. D. P., Gonfiantini, R., and Krouse, R.: Calibrated sulfur isotope abundance ratios of three IAEA sulfur isotope reference materials and V-CDT with a reassessment of the atomic weight of sulfur, Geochim. Cosmochim. Ac., 65, 2433–2437, https://doi.org/10.1016/S0016-7037(01)00611-1, 2001.
Elisha, B., Nuriel, P., Kylander-Clark, A., and Weinberger, R.: Towards in-situ U–Pb dating of dolomites, Geochronology Discuss. [preprint], https://doi.org/10.5194/gchron-2020-19, in review, 2020.
Enkelmann, E., Jonckheere, R., and Ratschbacher, L.: Absolute measurements of the uranium concentration in thick samples using fission-track detectors, Nucl. Instrum. Meth. B, 229, 489–498, https://doi.org/10.1016/j.nimb.2005.01.003, 2005.
European Commission: Study on the review of the list of critical raw materials: final report, Directorate General for Internal Market, Industry, Entrepreneurship and SMEs, Deloitte Sustainability, British Geological Survey, Bureau de Recherches Géologiques et Minières, and Toegepast natuurwetenschappelijk onderzoek, Publications Office, Luxemburg, 2017.
Evans, N. J., Wilson, N. S. F., Cline, J. S., McInnes, B. I. A., and Byrne, J.: Fluorite (U–Th)He thermochronology: Constraints on the low temperature history of Yucca Mountain, Nevada, Appl. Geochem., 20, 1099–1105, https://doi.org/10.1016/j.apgeochem.2005.02.008, 2005.
Forbes, P., Pacquet, A., Chantret, F., Oumarou, J., and Pagel, M.: Marqueurs du volcanisme dans le gisement d'uranium d'Akouta (République du Niger), Cr. Acad. Sci. II, 298, 647–650, 1984.
Galindo, C., Tornos, F., Darbyshire, D. P. F., and Casquet, C.: The age and origin of the barite-fluorite (Pb-Zn) veins of the Sierra del Guadarrama (Spanish Central System, Spain): a radiogenic (Nd, Sr) and stable isotope study, Chem. Geol., 112, 351–364, https://doi.org/10.1016/0009-2541(94)90034-5, 1994.
Gigon, J., Deloule, E., Mercadier, J., Huston, D. L., Richard, A., Annesley, I. R., Wygralak, A. S., Skirrow, R. G., Mernagh, T. P., and Masterman, K.: Tracing metal sources for the giant McArthur River Zn-Pb deposit (Australia) using lead isotopes, Geology, 48, 478–482, https://doi.org/10.1130/G47001.1, 2020.
Gigoux, M., Delpech, G., Guerrot, C., Pagel, M., Augé, T., Négrel, P., and Brigaud, B.: Evidence for an Early Cretaceous mineralizing event above the basement/sediment unconformity in the intracratonic Paris Basin: paragenetic sequence and Sm-Nd dating of the world-class Pierre-Perthuis stratabound fluorite deposit, Miner. Deposita, 50, 455–463, https://doi.org/10.1007/s00126-015-0592-1, 2015.
Gigoux, M., Brigaud, B., Pagel, M., Delpech, G., Guerrot, C., Augé, T., and Négrel, P.: Genetic constraints on world-class carbonate- and siliciclastic-hosted stratabound fluorite deposits in Burgundy (France) inferred from mineral paragenetic sequence and fluid inclusion studies, Ore Geol. Rev., 72, 940–962, https://doi.org/10.1016/j.oregeorev.2015.09.013, 2016.
Gleadow, A. J. W.: Fission-track dating methods: What are the real alternatives?, Nuclear Tracks, 5, 3–14, https://doi.org/10.1016/0191-278X(81)90021-4, 1981.
Gogoll, S., Stenzel, E., Johansen, H., Reichling, M., and Matthias, E.: Laser-damage of cleaved and polished CaF2 at 248 nm, Nucl. Instrum. Meth. B, 116, 279–283, https://doi.org/10.1016/0168-583X(96)00061-4, 1996.
Grønlie, A., Harder, V., and Roberts, D.: Preliminary fission-track ages of fluorite mineralisation along fracture zones, inner Trondheimsfjord, Central Norway, Norsk geologisk tidsskrift, 70, 173–178, 1990.
Guillocheau, F.: Evolution tectonique méso-cénozoïque du bassin de Paris: contraintes stratigraphiques 3D, Geodin. Acta, 13, 189–245, https://doi.org/10.1016/S0985-3111(00)00118-2, 2000.
Guillong, M., Wotzlaw, J.-F., Looser, N., and Laurent, O.: Evaluating the reliability of U–Pb laser ablation inductively coupled plasma mass spectrometry (LA-ICP-MS) carbonate geochronology: matrix issues and a potential calcite validation reference material, Geochronology, 2, 155–167, https://doi.org/10.5194/gchron-2-155-2020, 2020.
Heim, C., Lausmaa, J., Sjövall, P., Toporski, J., Dieing, T., Simon, K., Hansen, B. T., Kronz, A., Arp, G., Reitner, J., and Thiel, V.: Ancient microbial activity recorded in fracture fillings from granitic rocks (Äspö Hard Rock Laboratory, Sweden): Ancient microbial activity recorded in fracture fillings, Geobiology, 10, 280–297, https://doi.org/10.1111/j.1472-4669.2012.00328.x, 2012.
Hill, C. A., Polyak, V. J., Asmerom, Y., and Provencio, P. P.: Constraints on a Late Cretaceous uplift, denudation, and incision of the Grand Canyon region, southwestern Colorado Plateau, USA, from U-Pb dating of lacustrine limestone, Tectonics, 35, 896–906, https://doi.org/10.1002/2016TC004166, 2016.
Horon, O., Megnien, C., and Lefavrais-Raymond, A.: Carte géologique de la France, feuille 466: Avallon, France, 1 / 50 000, BRGM, Orléans, France, 1966.
Hough, G., Swapp, S., Frost, C., and Fayek, M.: Sulfur Isotopes in Biogenically and Abiogenically Derived Uranium Roll-Front Deposits, Econ. Geol., 114, 353–373, https://doi.org/10.5382/econgeo.2019.4634, 2019.
Ingham, E. S., Cook, N. J., Cliff, J., Ciobanu, C. L., and Huddleston, A.: A combined chemical, isotopic and microstructural study of pyrite from roll-front uranium deposits, Lake Eyre Basin, South Australia, Geochim. Cosmochim. Ac., 125, 440–465, https://doi.org/10.1016/j.gca.2013.10.017, 2014.
Jia, T. Q., Li, X. X., Feng, D. H., Cheng, C. F., Li, R. X., Chen, H., and Xu, Z. Z.: Theoretical and experimental study on femtosecond laser induced damage in CaF2 crystals, Appl. Phys. A-Mater., 81, 645–649, https://doi.org/10.1007/s00339-004-2685-z, 2005.
Jochum, K. P., Weis, U., Stoll, B., Kuzmin, D., Yang, Q., Raczek, I., Jacob, D. E., Stracke, A., Birbaum, K., Frick, D. A., Günther, D., and Enzweiler, J.: Determination of Reference Values for NIST SRM 610-617 Glasses Following ISO Guidelines, Geostand. Geoanal. Res., 35, 397–429, https://doi.org/10.1111/j.1751-908X.2011.00120.x, 2011.
Johansen, H., Gogoll, S., Stenzel, E., and Reichling, M.: Scanning electron microscopical inspection of uncoated CaF2 single crystals, Phys. Status Solidi A, 150, 613–624, https://doi.org/10.1002/pssa.2211500205, 1995.
Jonckheere, R.: On the densities of etchable fission tracks in a mineral and co-irradiated external detector with reference to fission-track dating of minerals, Chem. Geol., 200, 41–58, https://doi.org/10.1016/S0009-2541(03)00116-5, 2003.
Kahn, S. and Forgue, V.: Range-energy relation and energy loss of fission fragments in solids, Phys. Rev., 163, 290–296, https://doi.org/10.1103/PhysRev.163.290, 1967.
Kahou, Z. S., Brichau, S., Poujol, M., Duchêne, S., Campos, E., Leisen, M., d'Abzac, F.-X., Riquelme, R., and Carretier, S.: First U-Pb LA-ICP-MS in situ dating of supergene copper mineralization: case study in the Chuquicamata mining district, Atacama Desert, Chile, Miner. Deposita, 56, 239–252, https://doi.org/10.1007/s00126-020-00960-2, 2020.
Kawasaki, K. and Symons, D. T. A.: Paleomagnetism of fluorite veins in the Devonian St. Lawrence granite, Newfoundland, Canada, Can. J. Earth Sci., 45, 969–980, https://doi.org/10.1139/E08-045, 2008.
Kempe, U., Plötze, M., Brachmann, A., and Böttcher, R.: Stabilisation of divalent rare earth elements in natural fluorite, Miner. Petrol., 76, 213–234, 2002.
LaFlamme, C., Martin, L., Jeon, H., Reddy, S. M., Selvaraja, V., Caruso, S., Bui, T. H., Roberts, M. P., Voute, F., Hagemann, S., Wacey, D., Littman, S., Wing, B., Fiorentini, M., and Kilburn, M. R.: In situ multiple sulfur isotope analysis by SIMS of pyrite, chalcopyrite, pyrrhotite, and pentlandite to refine magmatic ore genetic models, Chem. Geol., 444, 1–15, https://doi.org/10.1016/j.chemgeo.2016.09.032, 2016.
Lanzirotti, A., Tappero, R., and Schulze, D. G.: Practical Application of Synchrotron-Based Hard X-Ray Microprobes in Soil Sciences, in: Developments in Soil Science, Elsevier, 27–72, https://doi.org/10.1016/S0166-2481(10)34002-5, 2010.
Lardeaux, J. M., Schulmann, K., Faure, M., Janoušek, V., Lexa, O., Skrzypek, E., Edel, J. B., and Štípská, P.: The Moldanubian Zone in the French Massif Central, Vosges/Schwarzwald and Bohemian Massif revisited: differences and similarities, Geol. Soc. Spec. Publ., 405, 7–44, https://doi.org/10.1144/SP405.14, 2014.
Lawson, M., Shenton, B. J., Stolper, D. A., Eiler, J. M., Rasbury, E. T., Becker, T. P., Phillips-Lander, C. M., Buono, A. S., Becker, S. P., Pottorf, R., Gray, G. G., Yurewicz, D., and Gournay, J.: Deciphering the diagenetic history of the El Abra Formation of eastern Mexico using reordered clumped isotope temperatures and U-Pb dating, Geol. Soc. Am. Bull., 130, 617–629, https://doi.org/10.1130/B31656.1, 2018.
Leach, D. L., Sangster, D. F., Kelley, K. D., Large, R. R., Garven, G., Allen, C. R., Gutzmer, J., and Walters, S.: Sediment-hosted lead-zinc deposits: A global perspective, Econ. Geol., 3, 561–607, https://doi.org/10.5382/AV100.18, 2005.
Lefort, J. P. and Agarwal, B. N. P.: Topography of the Moho undulations in France from gravity data: their age and origin, Tectonophysics, 350, 193–213, https://doi.org/10.1016/S0040-1951(02)00114-2, 2002.
Machel, H. G.: Bacterial and thermochemical sulfate reduction in diagenetic settings – old and new insights, Sediment. Geol., 140, 143–175, https://doi.org/10.1016/S0037-0738(00)00176-7, 2001.
Magnall, J. M., Gleeson, S. A., Stern, R. A., Newton, R. J., Poulton, S. W., and Paradis, S.: Open system sulphate reduction in a diagenetic environment – Isotopic analysis of barite (δ34S and δ18O) and pyrite (δ34S) from the Tom and Jason Late Devonian Zn–Pb–Ba deposits, Selwyn Basin, Canada, Geochim. Cosmochim. Ac., 180, 146–163, https://doi.org/10.1016/j.gca.2016.02.015, 2016.
Mangenot, X., Gasparrini, M., Rouchon, V., and Bonifacie, M.: Basin-scale thermal and fluid flow histories revealed by carbonate clumped isotopes (Δ47) – Middle Jurassic carbonates of the Paris Basin depocentre, Sedimentology, 65, 123–150, https://doi.org/10.1111/sed.12427, 2018.
Mark, D. F., Parnell, J., Kelley, S. P., Lee, M., Sherlock, S. C., and Carr, A.: Dating of Multistage Fluid Flow in Sandstones, Science, 309, 2048–2051, https://doi.org/10.1126/science.1116034, 2005.
Markey, R., Stein, H. J., and Morgan, J. W.: Highly precise Re–Os dating for molybdenite using alkaline fusion and NTIMS, Talanta, 45, 935–946, https://doi.org/10.1016/S0039-9140(97)00198-7, 1998.
Martz, P., Mercadier, J., Perret, J., Villeneuve, J., Deloule, E., Cathelineau, M., Quirt, D., Doney, A., and Ledru, P.: Post-crystallization alteration of natural uraninites: Implications for dating, tracing, and nuclear forensics, Geochim. Cosmochim. Ac., 249, 138–159, https://doi.org/10.1016/j.gca.2019.01.025, 2019.
Mathur, R., Ruiz, J., Titley, S., Gibbins, S., and Margotomo, W.: Different crustal sources for Au-rich and Au-poor ores of the Grasberg Cu–Au porphyry deposit, Earth Planet. Sc. Lett., 183, 7–14, https://doi.org/10.1016/S0012-821X(00)00256-9, 2000.
Medjoubi, K., Leclercq, N., Langlois, F., Buteau, A., Lé, S., Poirier, S., Mercère, P., Sforna, M. C., Kewish, C. M., and Somogyi, A.: Development of fast, simultaneous and multi-technique scanning hard X-ray microscopy at Synchrotron Soleil, J. Synchrotron Radiat., 20, 293–299, https://doi.org/10.1107/S0909049512052119, 2013.
Moscati, R. J. and Neymark, L. A.: U-Pb geochronology of tin deposits associated with the Cornubian Batholith of southwest England: Direct dating of cassiterite by in situ LA-ICPMS, Miner. Deposita, 55, 1–20, https://doi.org/10.1007/s00126-019-00870-y, 2020.
Nakai, S., Halliday, A. N., Kesler, S. E., Jones, H. D., Kyle, J. R., and Lane, T. E.: Rb-Sr dating of sphalerites from Mississippi Valley-type (MVT) ore deposits, Geochim. Cosmochim. Ac., 57, 417–427, https://doi.org/10.1016/0016-7037(93)90440-8, 1993.
Nuriel, P., Rosenbaum, G., Uysal, T. I., Zhao, J., Golding, S. D., Weinberger, R., Karabacak, V., and Avni, Y.: Formation of fault-related calcite precipitates and their implications for dating fault activity in the East Anatolian and Dead Sea fault zones, Geol. Soc. Spec. Publ., 359, 229–248, https://doi.org/10.1144/SP359.13, 2011.
Nuriel, P., Weinberger, R., Kylander-Clark, A. R. C., Hacker, B. R., and Craddock, J. P.: The onset of the Dead Sea transform based on calcite age-strain analyses, Geology, 45, 587–590, https://doi.org/10.1130/G38903.1, 2017.
Nuriel, P., Miller, D. M., Schmidt, K. M., Coble, M. A., and Maher, K.: Ten-million years of activity within the Eastern California Shear Zone from U-Pb dating of fault-zone opal, Earth Planet. Sc. Lett., 521, 37–45, https://doi.org/10.1016/j.epsl.2019.05.047, 2019.
Pagel, M., Bonifacie, M., Schneider, D. A., Gautheron, C., Brigaud, B., Calmels, D., Cros, A., Saint-Bezar, B., Landrein, P., Sutcliffe, C., Davis, D., and Chaduteau, C.: Improving paleohydrological and diagenetic reconstructions in calcite veins and breccia of a sedimentary basin by combining Δ47 temperature, δ18O water and U-Pb age, Chem. Geol., 481, 1–17, https://doi.org/10.1016/j.chemgeo.2017.12.026, 2018.
Paton, C., Hellstrom, J., Paul, B., Woodhead, J., and Hergt, J.: Iolite: Freeware for the visualisation and processing of mass spectrometric data, J. Anal. Atom. Spectrom., 26, 2508, https://doi.org/10.1039/c1ja10172b, 2011.
Peverelli, V., Ewing, T., Rubatto, D., Wille, M., Berger, A., Villa, I. M., Lanari, P., Pettke, T., and Herwegh, M.: U – Pb geochronology of epidote by laser ablation inductively coupled plasma mass spectrometry (LA-ICP-MS) as a tool for dating hydrothermal-vein formation, Geochronology, 3, 123–147, https://doi.org/10.5194/gchron-3-123-2021, 2021.
Pi, T., Solé, J., Golzarri, J., Rickards, J., and Espinosa, G.: Autoradiography of geological fluorite samples for determination of uranium and thorium distribution using nuclear track methodology, Rev. Mex. Fis., 53, 57–60, 2007.
Piccione, G., Rasbury, E. T., Elliott, B. A., Kyle, J. R., Jaret, S. J., Acerbo, A. S., Lanzirotti, A., Northrup, P., Wooton, K., and Parrish, R. R.: Vein fluorite U-Pb dating demonstrates post – 6.2 Ma rare-earth element mobilization associated with Rio Grande rifting, Geosphere, 15, 1958–1972, https://doi.org/10.1130/GES02139.1, 2019.
Pons, T.: Caractérisation des oxy-hydroxydes de fer et des éléments associés (S, Se, As, Mo, V, Zr) dans les environnements redox favorables aux gisements d'uranium, Thèse de doctorat, Université Paris Sud, Orsay, France, 280 pp., 2015.
Rackley, R. I.: Environment of Wyoming Tertiary uranium deposits, AAPG Bull., 56, 755–774, 1972.
Rafique, M. S., Bashir, S., Husinsky, W., Hobro, A., and Lendl, B.: Surface analysis correlated with the Raman measurements of a femtosecond laser irradiated CaF2, Appl. Surf. Sci., 258, 3178–3183, https://doi.org/10.1016/j.apsusc.2011.11.059, 2012.
Rasbury, E. T. and Cole, J. M.: Directly dating geologic events: U-Pb dating of carbonates, Rev. Geophys., 47, RG3001, https://doi.org/10.1029/2007RG000246, 2009.
Reichling, M., Johansen, H., Gogoll, S., Stenzel, E., and Matthias, E.: Laser-stimulated desorption and damage at polished CaF2 surfaces irradiated with 532 nm laser light, Nucl. Instrum. Methods, 91, 628–633, https://doi.org/10.1016/0168-583X(94)96299-5, 1994.
Roberts, N. M. W., Rasbury, E. T., Parrish, R. R., Smith, C. J., Horstwood, M. S. A., and Condon, D. J.: A calcite reference material for LA-ICP-MS U-Pb geochronology, Geochem. Geophy. Geosys., 18, 2807–2814, https://doi.org/10.1002/2016GC006784, 2017.
Roberts, N. M. W., Drost, K., Horstwood, M. S. A., Condon, D. J., Chew, D., Drake, H., Milodowski, A. E., McLean, N. M., Smye, A. J., Walker, R. J., Haslam, R., Hodson, K., Imber, J., Beaudoin, N., and Lee, J. K.: Laser ablation inductively coupled plasma mass spectrometry (LA-ICP-MS) U–Pb carbonate geochronology: strategies, progress, and limitations, Geochronology, 2, 33–61, https://doi.org/10.5194/gchron-2-33-2020, 2020.
Schneider, C. A., Rasband, W. S., and Eliceiri, K. W.: NIH Image to ImageJ: 25 years of image analysis, Nat. Methods, 9, 671–675, https://doi.org/10.1038/nmeth.2089, 2012.
Sizaret, S.: Genèse du Système Hydrothermal à Fluorine-Barytine-Fer de Chaillac, (Indre, France), Thèse de doctorat, Université d'Orléans, Orléans, France, 271 pp., 2006.
Solé, V. A., Papillon, E., Cotte, M., Walter, P., and Susini, J.: A multiplatform code for the analysis of energy-dispersive X-ray fluorescence spectra, Spectrochim. Acta B, 62, 63–68, https://doi.org/10.1016/j.sab.2006.12.002, 2007.
Somogyi, A., Medjoubi, K., Baranton, G., Le Roux, V., Ribbens, M., Polack, F., Philippot, P., and Samama, J.-P.: Optical design and multi-length-scale scanning spectro-microscopy possibilities at the Nanoscopium beamline of Synchrotron Soleil, J. Synchrotron Radiat., 22, 1118–1129, https://doi.org/10.1107/S1600577515009364, 2015.
Soulé de Lafont, D. and Lhégu, J.: Les gisements stratiformes de fluorine du Morvan (sud-est du Bassin de Paris, France), Fascicules sur les gisements Français 2, Paris, France, p. 40, 1980.
Stacey, J. S. and Kramers, J. D.: Approximation of terrestrial lead isotope evolution by a two-stage model, Earth Planet. Sc. Lett., 26, 207–221, 1975.
Stein, H. J., Markey, R. J., Morgan, J. W., Hannah, J. L., and Schersten, A.: The remarkable Re-Os chronometer in molybdenite: how and why it works, Terra Nova, 13, 479–486, https://doi.org/10.1046/j.1365-3121.2001.00395.x, 2001.
Sylvester, P. J. (Ed.): Matrix effects in laser ablation-ICP-MS, in: Laser Ablation–ICP–MS in the Earth Sciences: Current practices and outstanding issues (Short Course), Mineralogical Association of Canada, 40, 67–78, 2008.
Symons, D. T. A.: Paleomagnetism and the Late Jurassic genesis of the Illinois-Kentucky fluorspar deposits, Econ. Geol., 89, 438–449, https://doi.org/10.2113/gsecongeo.89.3.438, 1994.
Symons, D. T. A., Kawasaki, K., Tornos, F., Velasco, F., and Rosales, I.: Temporal constraints on genesis of the Caravia-Berbes fluorite deposits of Asturias, Spain, from paleomagnetism, Ore Geol. Rev., 80, 754–766, https://doi.org/10.1016/j.oregeorev.2016.08.020, 2017.
Vermeesch, P.: IsoplotR: A free and open toolbox for geochronology, Geosci. Front., 9, 1479–1493, https://doi.org/10.1016/j.gsf.2018.04.001, 2018.
Vialette, Y.: Age des granites du Massif Central, B. Soc. Geol. Fr., S7-XV, 260–270, https://doi.org/10.2113/gssgfbull.S7-XV.3-4.260, 1973.
Vochten, R., Esmans, E., and Vermeirsch, W.: Study of the solid and gaseous inclusions in the fluorites from Wölsendorf (Bavaria, F. R. of Germany) and Margnac (Haute Vienne, France) by microprobe and mass spectrometry, Chem. Geol., 20, 253–263, 1977.
Walter, B. F., Gerdes, A., Kleinhanns, I. C., Dunkl, I., von Eynatten, H., Kreissl, S., and Markl, G.: The connection between hydrothermal fluids, mineralization, tectonics and magmatism in a continental rift setting: Fluorite Sm-Nd and hematite and carbonates U-Pb geochronology from the Rhinegraben in SW Germany, Geochim. Cosmochim. Ac., 240, 11–42, https://doi.org/10.1016/j.gca.2018.08.012, 2018.
Wolff, R., Dunkl, I., Kempe, U., and von Eynatten, H.: The Age of the Latest Thermal Overprint of Tin and Polymetallic Deposits in the Erzgebirge, Germany: Constraints from Fluorite (U-Th-Sm)He Thermochronology, Econ. Geol., 110, 2025–2040, https://doi.org/10.2113/econgeo.110.8.2025, 2015.
Wolff, R., Dunkl, I., Kempe, U., Stockli, D., Wiedenbeck, M., and von Eynatten, H.: Variable helium diffusion characteristics in fluorite, Geochim. Cosmochim. Ac., 188, 21–34, https://doi.org/10.1016/j.gca.2016.05.029, 2016.
Wu, Y.-F., Fougerouse, D., Evans, K., Reddy, S. M., Saxey, D. W., Guagliardo, P., and Li, J.-W.: Gold, arsenic, and copper zoning in pyrite: A record of fluid chemistry and growth kinetics, Geology, 47, 641–644, https://doi.org/10.1130/G46114.1, 2019.
Xing, Y., Etschmann, B., Liu, W., Mei, Y., Shvarov, Y., Testemale, D., Tomkins, A., and Brugger, J.: The role of fluorine in hydrothermal mobilization and transportation of Fe, U and REE and the formation of IOCG deposits, Chem. Geol., 504, 158–176, https://doi.org/10.1016/j.chemgeo.2018.11.008, 2019.
Ziegler, J. F., Ziegler, M. D., and Biersack, J. P.: SRIM – The stopping and range of ions in matter, Nucl. Instrum. Meth. B, 268, 1818–1823, https://doi.org/10.1016/j.nimb.2010.02.091, 2010.