the Creative Commons Attribution 4.0 License.
the Creative Commons Attribution 4.0 License.
 | 04 May 2021
The closure temperature(s) of zircon Raman dating
Birk Härtel
Raymond Jonckheere
Bastian Wauschkuhn
Lothar Ratschbacher
Zircon Raman dating based on irradiation damage is a debated concept but not an established geo-/thermochronological method. One issue is the temperature range of radiation-damage annealing over geological timescales. We conducted isochronal and isothermal annealing experiments on radiation-damaged zircons between 500 and 1000 ∘C for durations between 10 min and 5 d to describe the annealing kinetics. We measured the widths (Γ) and positions (ω) of the ν1(SiO4), ν2(SiO4), and ν3(SiO4) internal Raman bands, and the external rotation Raman band at ∼974, 438, 1008, and 356 cm−1 after each annealing step. We fitted a Johnson–Mehl–Avrami–Kolmogorov and a distributed activation energy model to the fractional annealing data, calculated from the widths of the ν2(SiO4), ν3(SiO4), and external rotation bands. From the kinetic models, we determined closure temperatures Tc for damage accumulation for each Raman band. Tc ranges from 330 to 370 ∘C for the internal ν2(SiO4) and ν3(SiO4) bands; the external rotation band is more sensitive to thermal annealing (Tc∼260 to 310 ∘C). Our estimates are in general agreement with previous ones, but more geological evidence is needed to validate the results. The Tc difference for the different Raman bands offers the prospect of a multi-closure-temperature zircon Raman thermochronometer.
- Article
(5533 KB) - Full-text XML
-
Supplement
(216 KB) - BibTeX
- EndNote


Zircon (ZrSiO4) is used with several geochronometers because of the substitution of U and Th for Zr in its lattice. Its occurrence in various types of rocks and high chemical and mechanical resistance make it useful for geochronological applications. The α disintegration of U and Th creates lattice disorder by the impact of α particles and the recoil of daughter nuclei. The zircon Raman spectrum is sensitive to lattice damage: the downshift and broadening of the Raman bands provide a quantitative measure for the radiation damage (Nasdala et al., 1995, 1998, 2001; Palenik et al., 2003; Váczi and Nasdala, 2017).
Zircon dating by measuring the accumulated radiation-damage density and the U and Th content was first suggested by Holland and Kulp (1950) and Hurley and Fairbairn (1953), who proposed the quantification of the damage density from the gravimetric density or X-ray diffraction (XRD) analyses. Deliens et al. (1977) calculated “infrared apparent ages” for a suite of Precambrian zircons from the radiation-damage-induced changes in the infrared (IR) spectrum. Pidgeon et al. (1998) analogously suggested zircon dating based on Raman measurements of the radiation damage. The advantages of the determination of radiation damage with Raman over XRD or IR spectroscopy are the simple sample preparation and standardization, short measurement time, high spatial resolution, and the sensitive damage response of the Raman bands over a broad range of damage densities (Nasdala et al., 1995; Pidgeon et al., 1998). Zircon Raman dating has been discussed in several studies (Nasdala et al., 2001; Pidgeon, 2014; Pidgeon et al., 2016, 2018; Hueck et al., 2018; Jonckheere et al., 2019), but it is not an established geochronological method. One of the key issues for the geological application of a zircon Raman geo-/thermochronometer is the quantification of radiation-damage annealing over geological timescales (Nasdala et al., 2001, 2002; Geisler and Pidgeon, 2002).
Radiation damage is annealed at elevated temperatures with the exact temperature depending on the annealing duration (Zhang et al., 2000a; Geisler et al., 2001; Nasdala et al., 2001; Pidgeon et al., 2016). Figure 1 shows the Raman spectra of a zircon subjected to progressive annealing. The Raman bands shift to higher wavenumbers, towards the band positions of well-ordered zircon, and become narrower and more intense. This loss of damage with temperature and time is a problem for the interpretation of zircon Raman dates as crystallization ages (Nasdala et al., 2001, 2002) but unlocks the potential for determining cooling ages and analyzing the thermal histories of natural zircon samples (Resentini et al., 2020). Annealing of radiation damage also affects He diffusion and is thus a process that needs to be taken into account in the interpretation of (U–Th) He dates of zircon (Ginster et al., 2019; Anderson et al., 2020). Since the Raman analysis of zircon is non-destructive, there is a high potential for including zircon Raman dating into a multi-method geochronological workflow on zircon.
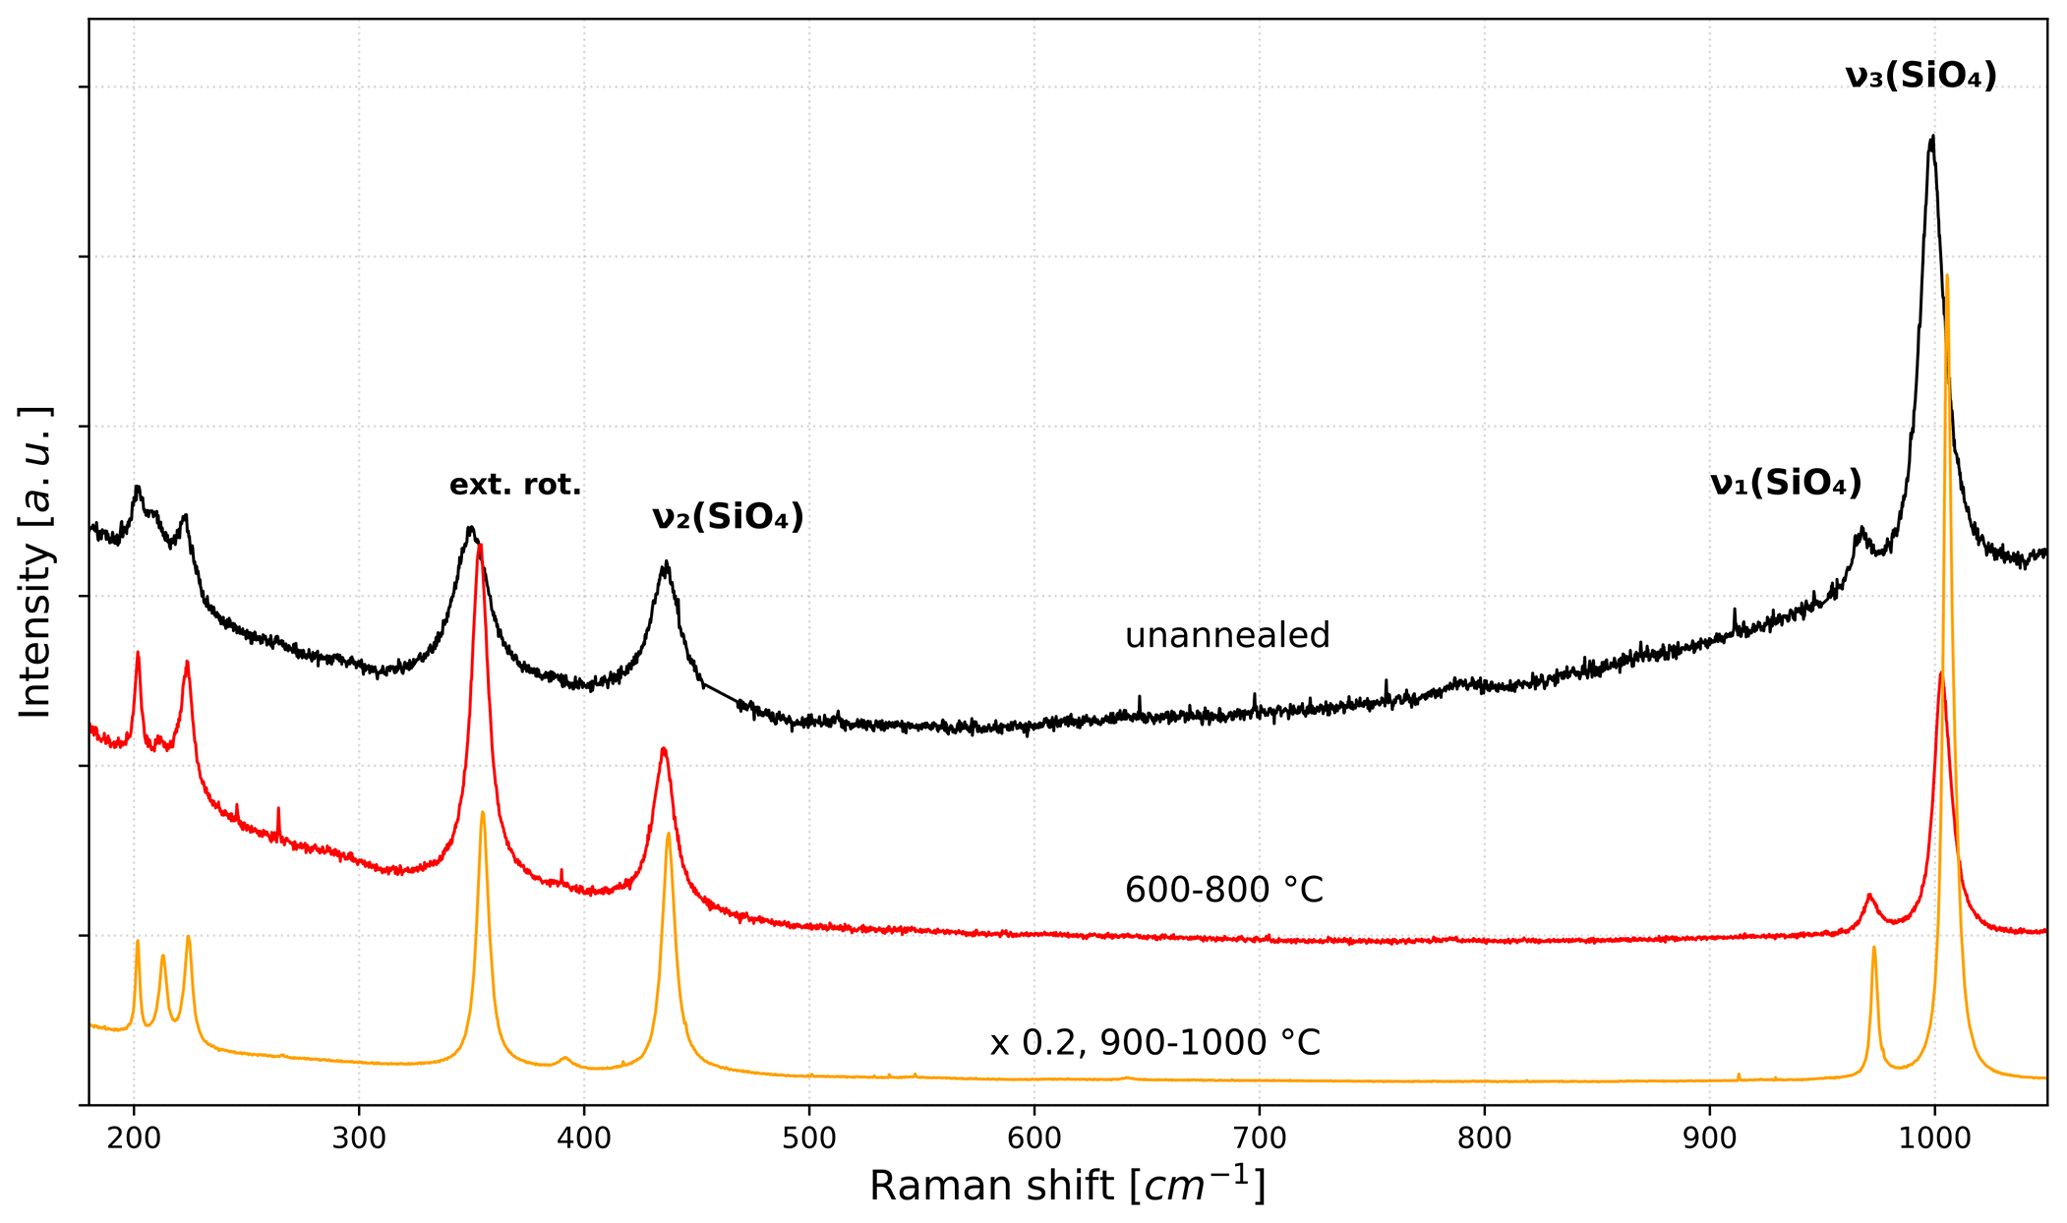
Figure 1Raman spectrum of an unannealed, radiation-damaged zircon (black, damage density /g, calculated after Váczi and Nasdala, 2017) compared with the spectra after its cumulative annealing for 1 h at 600, 1 h at 700, and 1 h at 800 ∘C (red), and additional heating for two 1 h steps at 900 and 1000 ∘C (orange). The intensities of the latter two spectra are reduced by a factor of 5 for comparison.
A thermochronometer is characterized by its closure temperature Tc, the temperature of the dated sample at the time of its apparent age (Dodson, 1973, 1979). Tc estimates for α-damage annealing range from ∼130 ∘C for natural samples at isothermal conditions in the German Continental Deep Drilling Program (KTB) borehole (Jonckheere et al., 2019) to ∼650 ∘C for the re-crystallization of metamict zircon based on the retention of Pb in zircons that were heated to these temperatures (Mezger and Krogstad, 1997). Pidgeon (2014) placed Tc between 230 and 320 ∘C based on the comparison of Raman ages with other thermochronological data of the same geological units.
Previous laboratory annealing experiments distinguished several annealing stages based on the changes of lattice constants measured by XRD (Weber, 1993; Colombo and Chrosch, 1998a, b) and on changes in the relationship of Raman shift (ω3) to bandwidth (Γ3, as full width at half maximum; FWHM) of the ν3(SiO4) Raman band (Geisler et al., 2001; Geisler, 2002; Ginster et al., 2019; Dias et al., 2020). Figure 2 plots ω3 against Γ3 for the experiments of Geisler (2002) and Ginster et al. (2019). The offset and difference in slope between the damage accumulation and annealing trends are evident. Breaks in slope of the annealing trend mark transitions between the annealing stages. A sharp break separates the steep stage (I) and the flat stage (II), but a more gradual transition occurs between stage II and a stage III assumed by Geisler (2002). Stage I is dominated by elimination of point defects in the basal plane of the crystal structure by tilting and twisting of the ZrO8 polyhedra (Ríos et al., 2000); stage II is ascribed to crystallization of amorphous domains (Colombo and Chrosch, 1998a; Capitani et al., 2000; Geisler et al., 2001; Geisler, 2002; Ginster et al., 2019); stage III is related to diffusion of point defects that form due to extension in the c direction. These point defects are assumed to be more stable due to the strong linkage of the SiO4 and ZrO8 polyhedra in the c direction, and their elimination includes a re-alignment of tilted SiO4 tetrahedra (Ríos et al., 2000; Geisler, 2002).
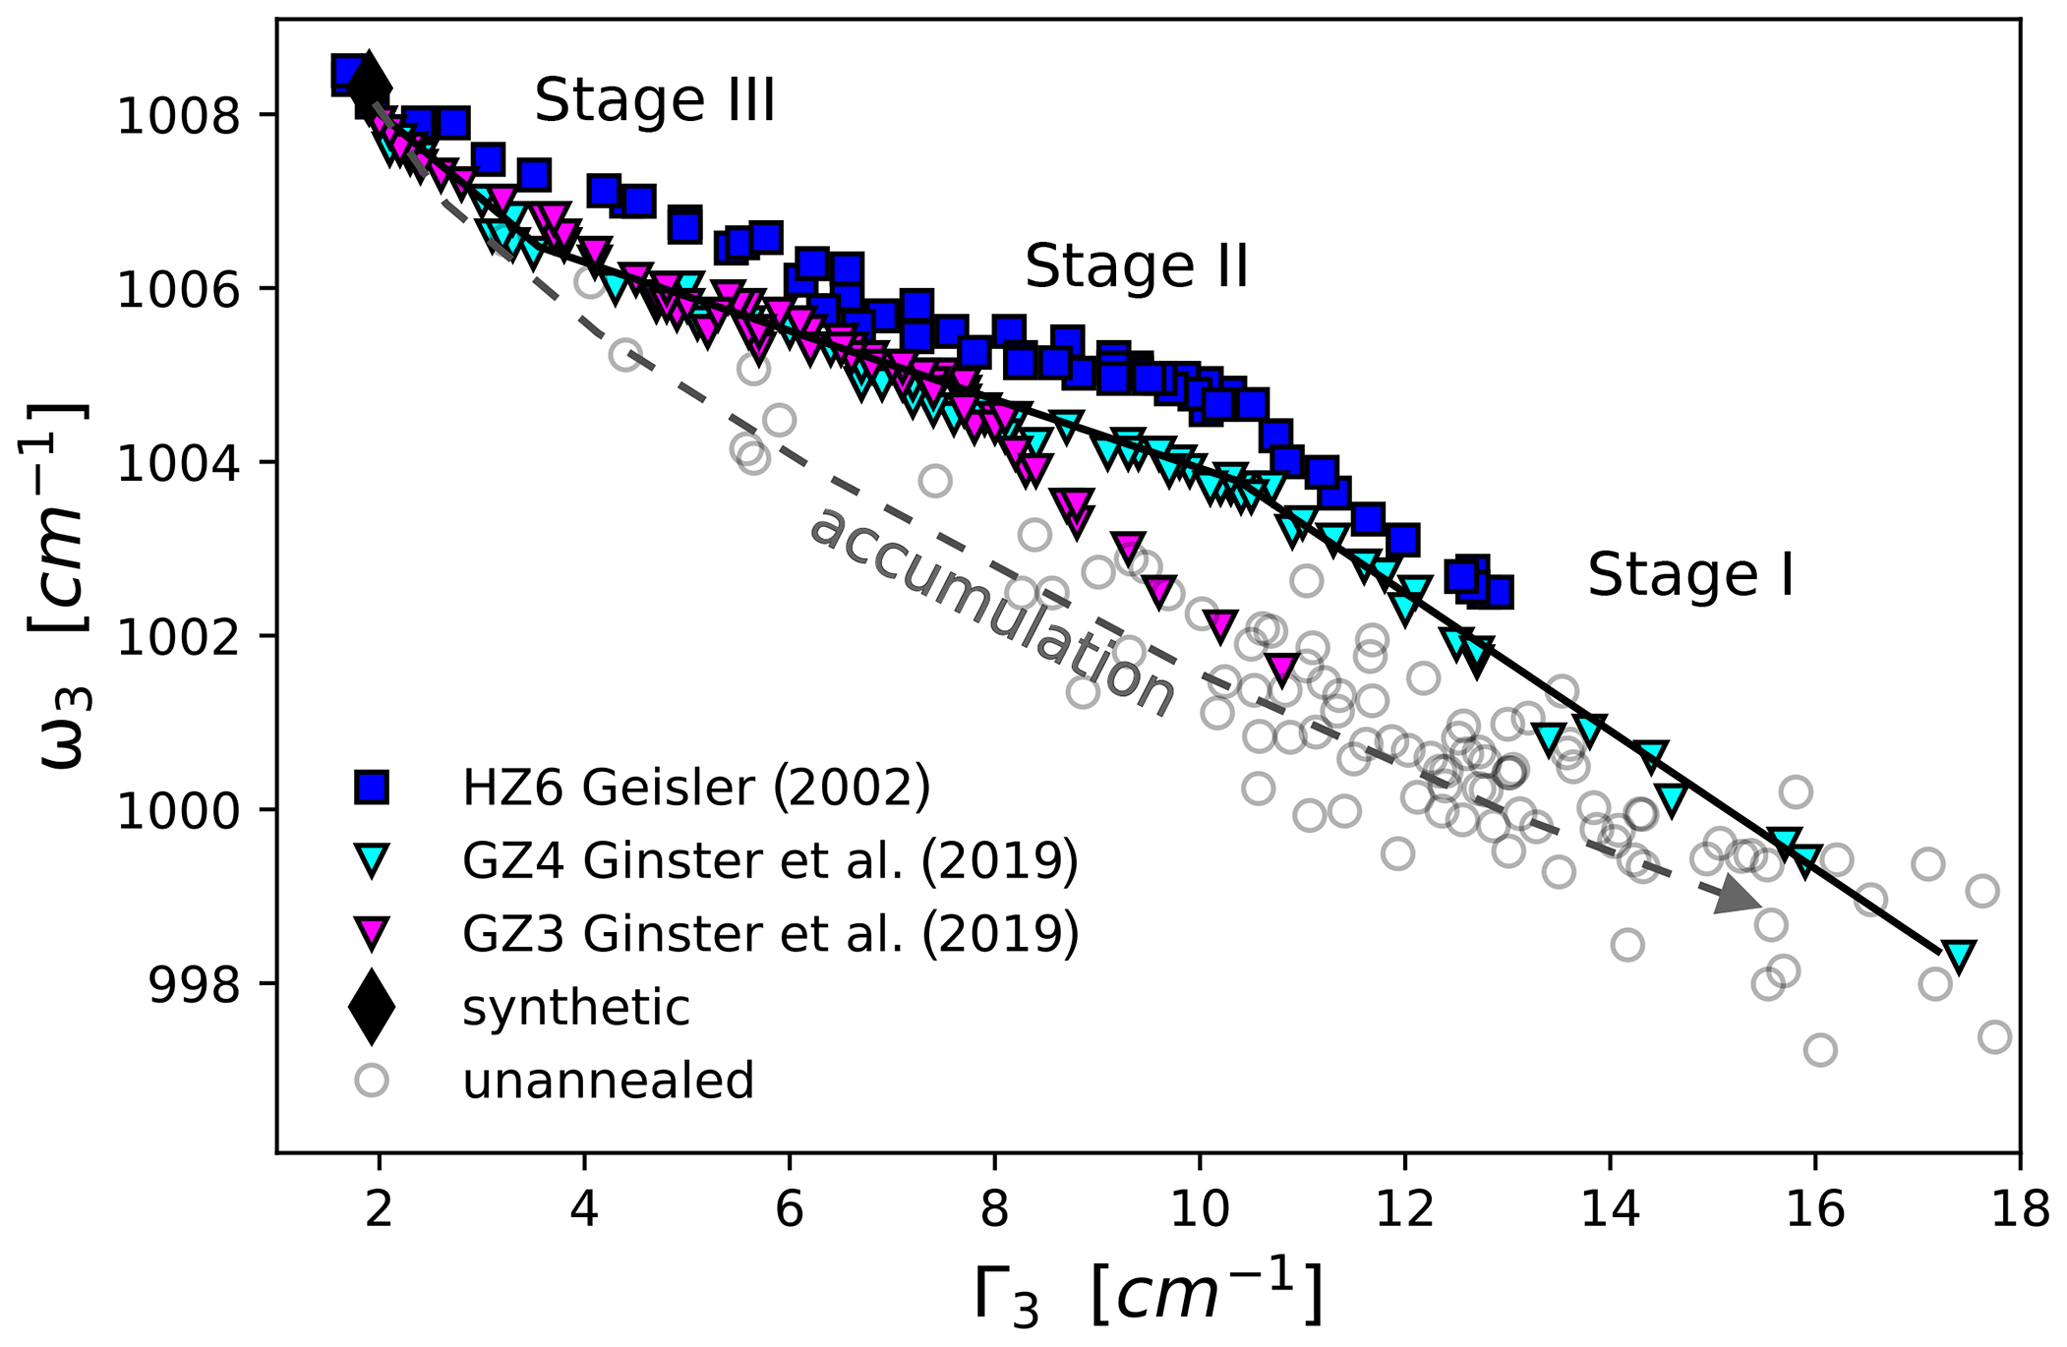
Figure 2Position-bandwidth (ω–Γ) plot of the zircon ν3(SiO4) band, showing the stage I–III annealing data of Geisler (2002) and Ginster et al. (2019) compared to the radiation-damage accumulation trend (dashed gray arrow), based on the unannealed starting material of our experiment. The black annealing trajectory shows the difference in slope between the stages leading up to the values of synthetic zircon.
We aim to investigate the change of the major Raman bands due to annealing and to estimate Tc. We track the changes of ω and Γ of the ν1(SiO4), ν2(SiO4), and ν3(SiO4) internal Raman bands, and the external rotation band at ∼974, 438, 1008, and 356 cm−1 (Kolesov et al., 2001), for isochronal annealing runs at different temperatures. The Raman data for these bands and three other external bands that we do not use for further analysis are listed in the Supplement (Tables S1 and S2). We fit two kinetic models to the widths of the three most intense Raman bands for isothermal annealing for different time intervals and temperatures and consider their extrapolation to geological timescales. We discuss the closure temperatures calculated from the models in comparison to previous Tc estimates.
2.1 Zircon samples
We separated zircon from a sample of the Oederan Forest subtype of the Late Carboniferous Schweddey ignimbrite from the Flöha Basin in Saxony, Germany. Löcse et al. (2019) report U–Pb zircon ages of 309.0 ± 1.8 and 309.4 ± 2.6 Ma for the samples (MfNC-2014-01 and MfNC-2014-02) taken from this lithology. We selected these samples because we assume that the zircon has retained the radiation damage accumulated since their crystallization. Zircon separation was carried out as described in Sperner et al. (2014). The zircon grains for the annealing experiments were hand-picked under a binocular microscope. The grains are prismatic with dominant {100} prisms and {101} pyramids. Their lengths range from ∼150 to 300 µm. They are transparent to translucent and colorless to brownish red. Löcse et al. (2019) described oscillatory and sector zoning in zircons from this ignimbrite. Some zircons show inclusions of apatite or quartz. The damage densities calculated from the measured Γ3 using the calibration of Váczi and Nasdala (2017) range from ∼22 to /g; they can thus be classified as slightly to highly damaged. We discarded grains with cracks that might fall apart upon heating or cooling. For comparison, we measured a zircon synthesized as pure ZrSiO4 by Guillong et al. (2015).
2.2 Raman spectrometry
We measured the Raman spectra using a TriVista spectrometer (Princeton Instruments) in single mode connected to an Olympus BX51WI microscope with a 50× (numerical aperture of 0.75) objective. The spot size on the sample was ∼2 µm; the depth likely exceeds ∼5 µm. The power of the 488 nm incident laser light on the sample was ∼12 mW. We chose this laser wavelength to increase the Raman intensity compared to the more traditionally used 514, 532, or 633 nm. Replicate measurements on in-house standards show that the laser power does not affect the lattice damage. The wavenumber calibration used the 219.2, 520.7, and 1001.4 cm−1 bands of sulfur, silicon, and polystyrene. The spectral resolution is ∼0.8 cm−1 and the pixel resolution on the detector is ∼0.2 cm−1. We measured the zircon spectra as a single measurement per spot, acquiring 10 spectra for 20 s each in step-and-glue mode. In step-and-glue mode, several spectra are recorded at different detector positions to cover a larger range of wavenumbers at high pixel resolution. We measured three steps spanning 170 to 1100 cm−1, adding up to a total acquisition time of 10 min. We cut the spectra into three Raman band groups and fitted the bands with Lorentz functions using a third-order polynomial for background subtraction. We measured one spot in most grains, but in some grains we measured one spot at the center and one at the rim. We also excluded spectra showing Raman bands of inclusions or asymmetric bands resulting from low- and high-damage domains (Nasdala et al., 2005). We corrected the bandwidth for the instrumental function following Tanabe and Hiraishi (1980).
2.3 Annealing experiments
We performed isothermal and isochronal annealing runs in a Linn LM111.06 and a Nabertherm LT3/11 muffle oven. For each run, we prepared a set of 6 to 12 zircon grains covering a broad range of initial α damage to be annealed together. The zircon grains were individually wrapped in Monel 400 foil (a nickel/copper alloy) and inserted in the pre-heated oven in a ceramic crucible. The temperatures of the isothermal annealing runs ranged from 500 to 1000 ∘C for cumulative annealing times of 10, 30, 90 min, 5 h, 1, and 5 d. The experiments followed the approach of Geisler et al. (2001) with each zircon being annealed in consecutive steps at a constant temperature and cooled for the measurement between the steps.
In the isochronal experiments, we annealed the zircons for 1 h runs at 600 to 1000 ∘C with a 100 ∘C interval. The Raman spectrum was measured at room temperature after each run. The locations of the measurement spots on the zircon grains were recorded before each annealing step to assure measurements at the same locations. Grains that disintegrated during annealing were discarded. We rejected measurements when we had reason to doubt that they were in the same spot as the previous measurements on the same grain.
3.1 Changes in band position and width
The changes in band position, bandwidth, and intensity are different for each Raman band (Fig. 1) as reported in earlier studies (Zhang et al., 2000a; Geisler, 2002; Dias et al., 2020). Figure 3 shows plots of ω vs. Γ for the isochronal annealing runs (Supplement Table S1).
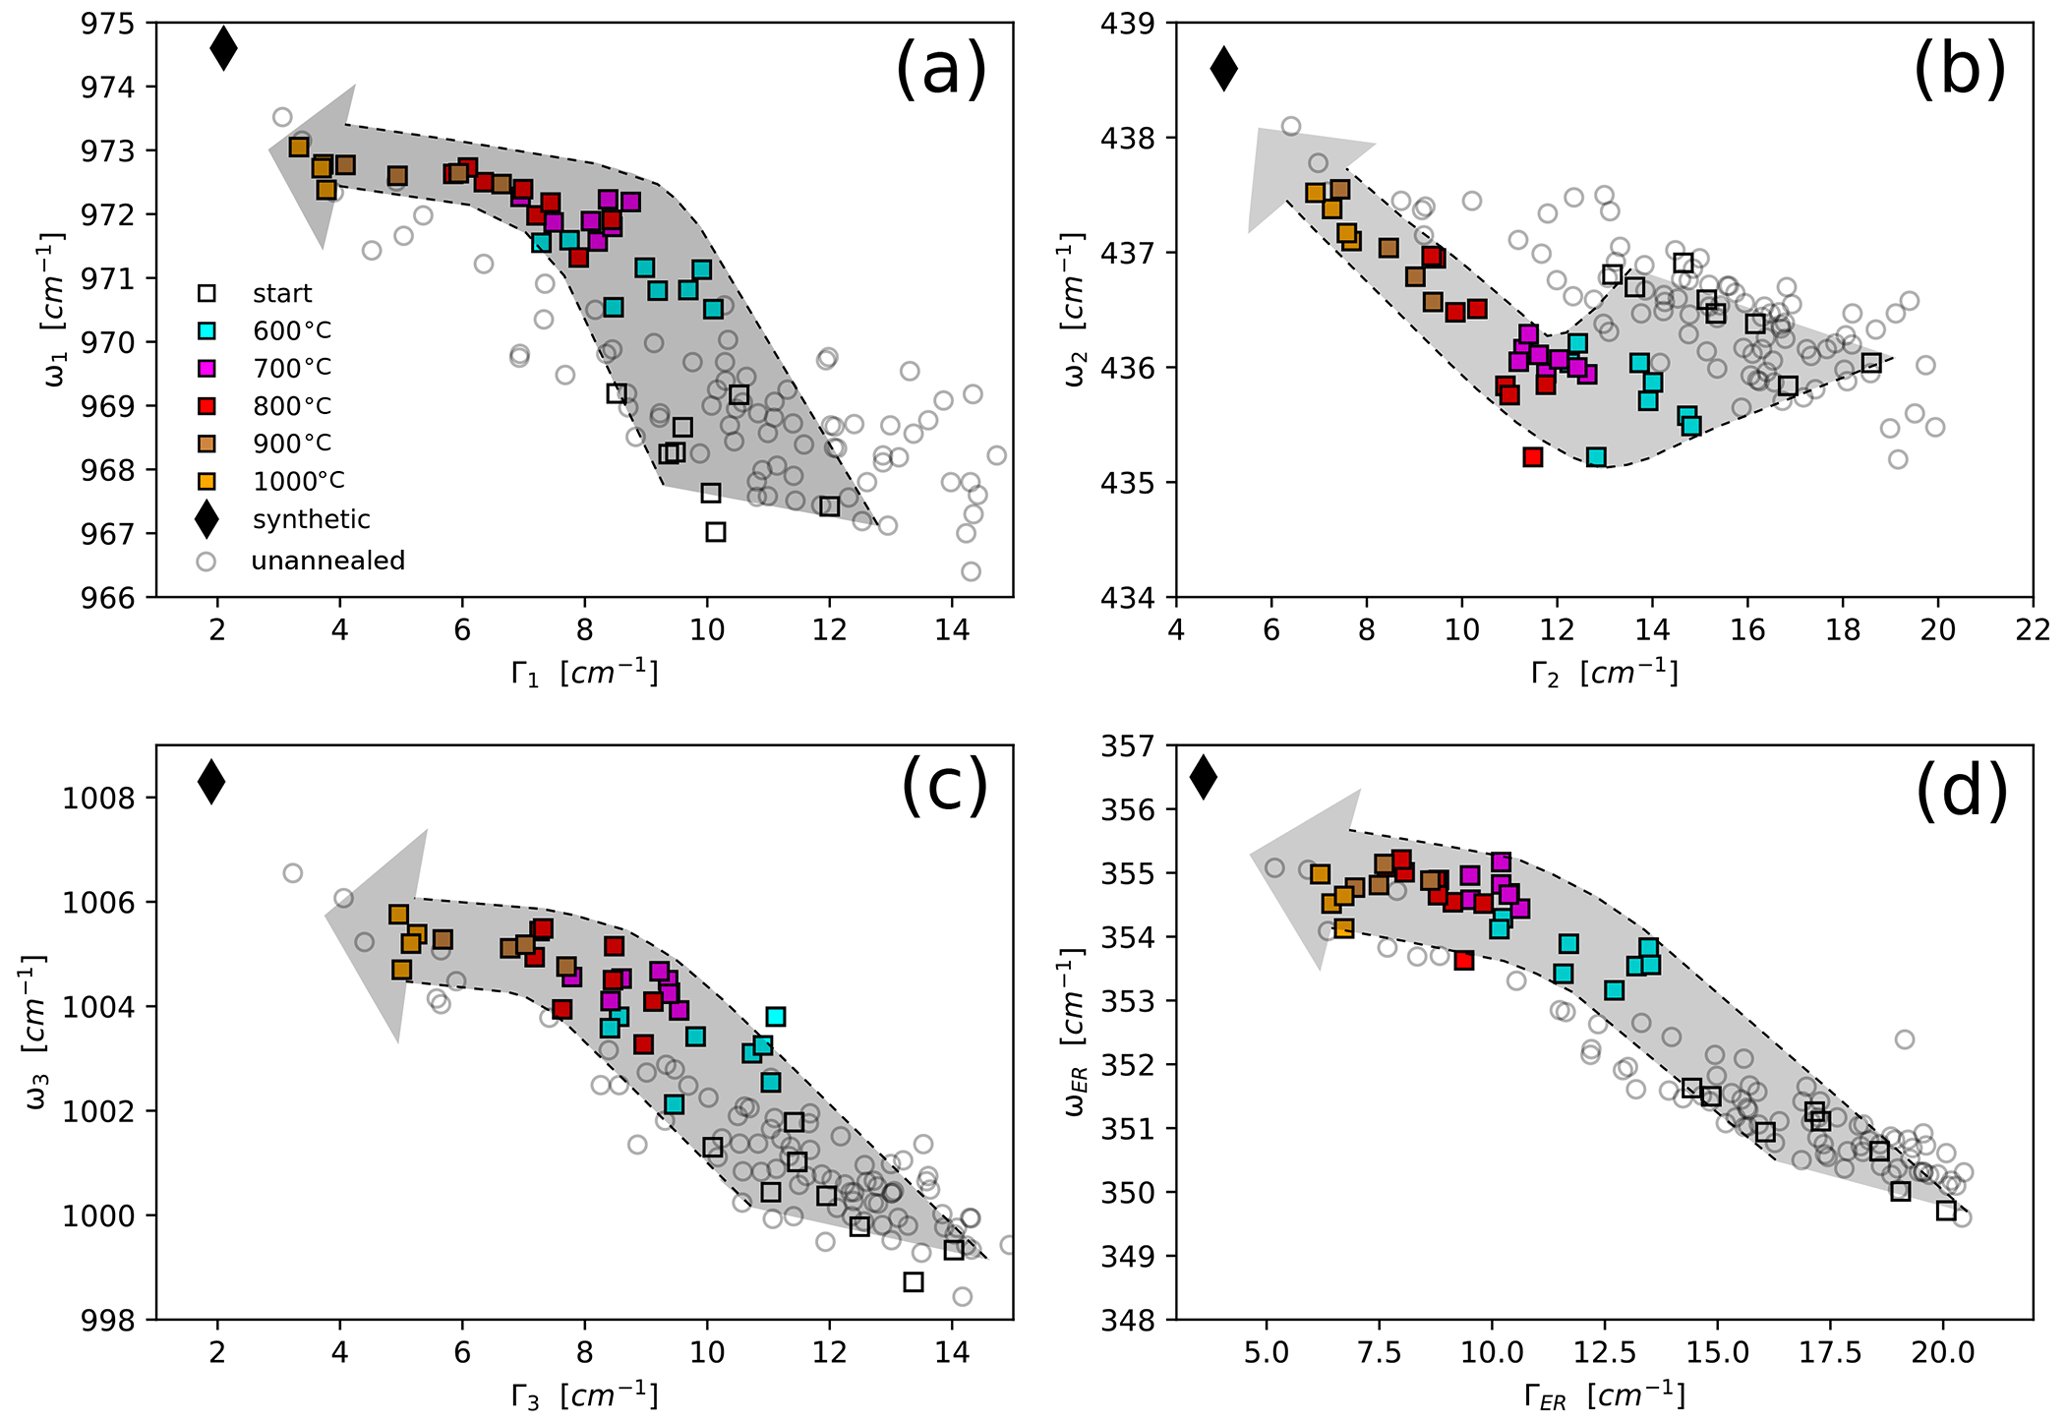
Figure 3ω–Γ plots of the ν1(SiO4) (a), ν2(SiO4) (b), ν3(SiO4) (c), and external rotation (ER) (d) Raman bands for the isochronal annealing runs for 1 h between 600 and 1000 ∘C. Gray circles represent the unannealed zircons from which the annealed samples were selected. The shaded arrows serve as guides, encompassing the range of subparallel annealing trajectories for the annealed zircons from different starting points. The dashed lines approximately mark the lowest- and highest-damage trajectories.
The different bands exhibit a common trend of decreasing Γ and increasing ω with increasing temperature but follow distinct trajectories through the ω–Γ space. Overall, those for the ν1(SiO4), ν3(SiO4), and external rotation bands resemble that of ν3(SiO4) in Fig. 2 with a steep segment at the beginning, followed by a change in the slope towards a flatter trend. We observed the greatest changes for ω3 and ΓER. We interpret the change in the slope at ∼700 ∘C as the transition from stage I to stage II annealing (Geisler et al., 2001). The slopes of stage I and stage II segments are different for each band. A striking difference exists between the ν2(SiO4) band near 438 cm−1 and the other bands. During stage I, ω2 decreases, whereas the other three bands shift to higher wavenumbers. The decrease of ω2 reverses at higher temperatures at the onset of stage II of the other bands. Γ2 values decrease throughout the annealing process like the other bandwidths. The scatter of the ω–Γ data around each common trend is limited, producing a well-defined trend for all Raman bands for stage II, irrespective of the different radiation-damage densities in the unannealed zircons. Our data do not show the gradual steepening between stages II and III as in Fig. 2.
Figure 4 traces the ω–Γ trends for two zircon grains with similar initial radiation damage through isothermal annealing at 600 and 1000 ∘C (Supplement Table S2). As expected, annealing proceeds faster at 1000 ∘C. The ω–Γ trends follow the same trajectories as in Fig. 3. The stage I sections of the 1000 ∘C trajectories must be assumed because the first annealing step already reached stage II.
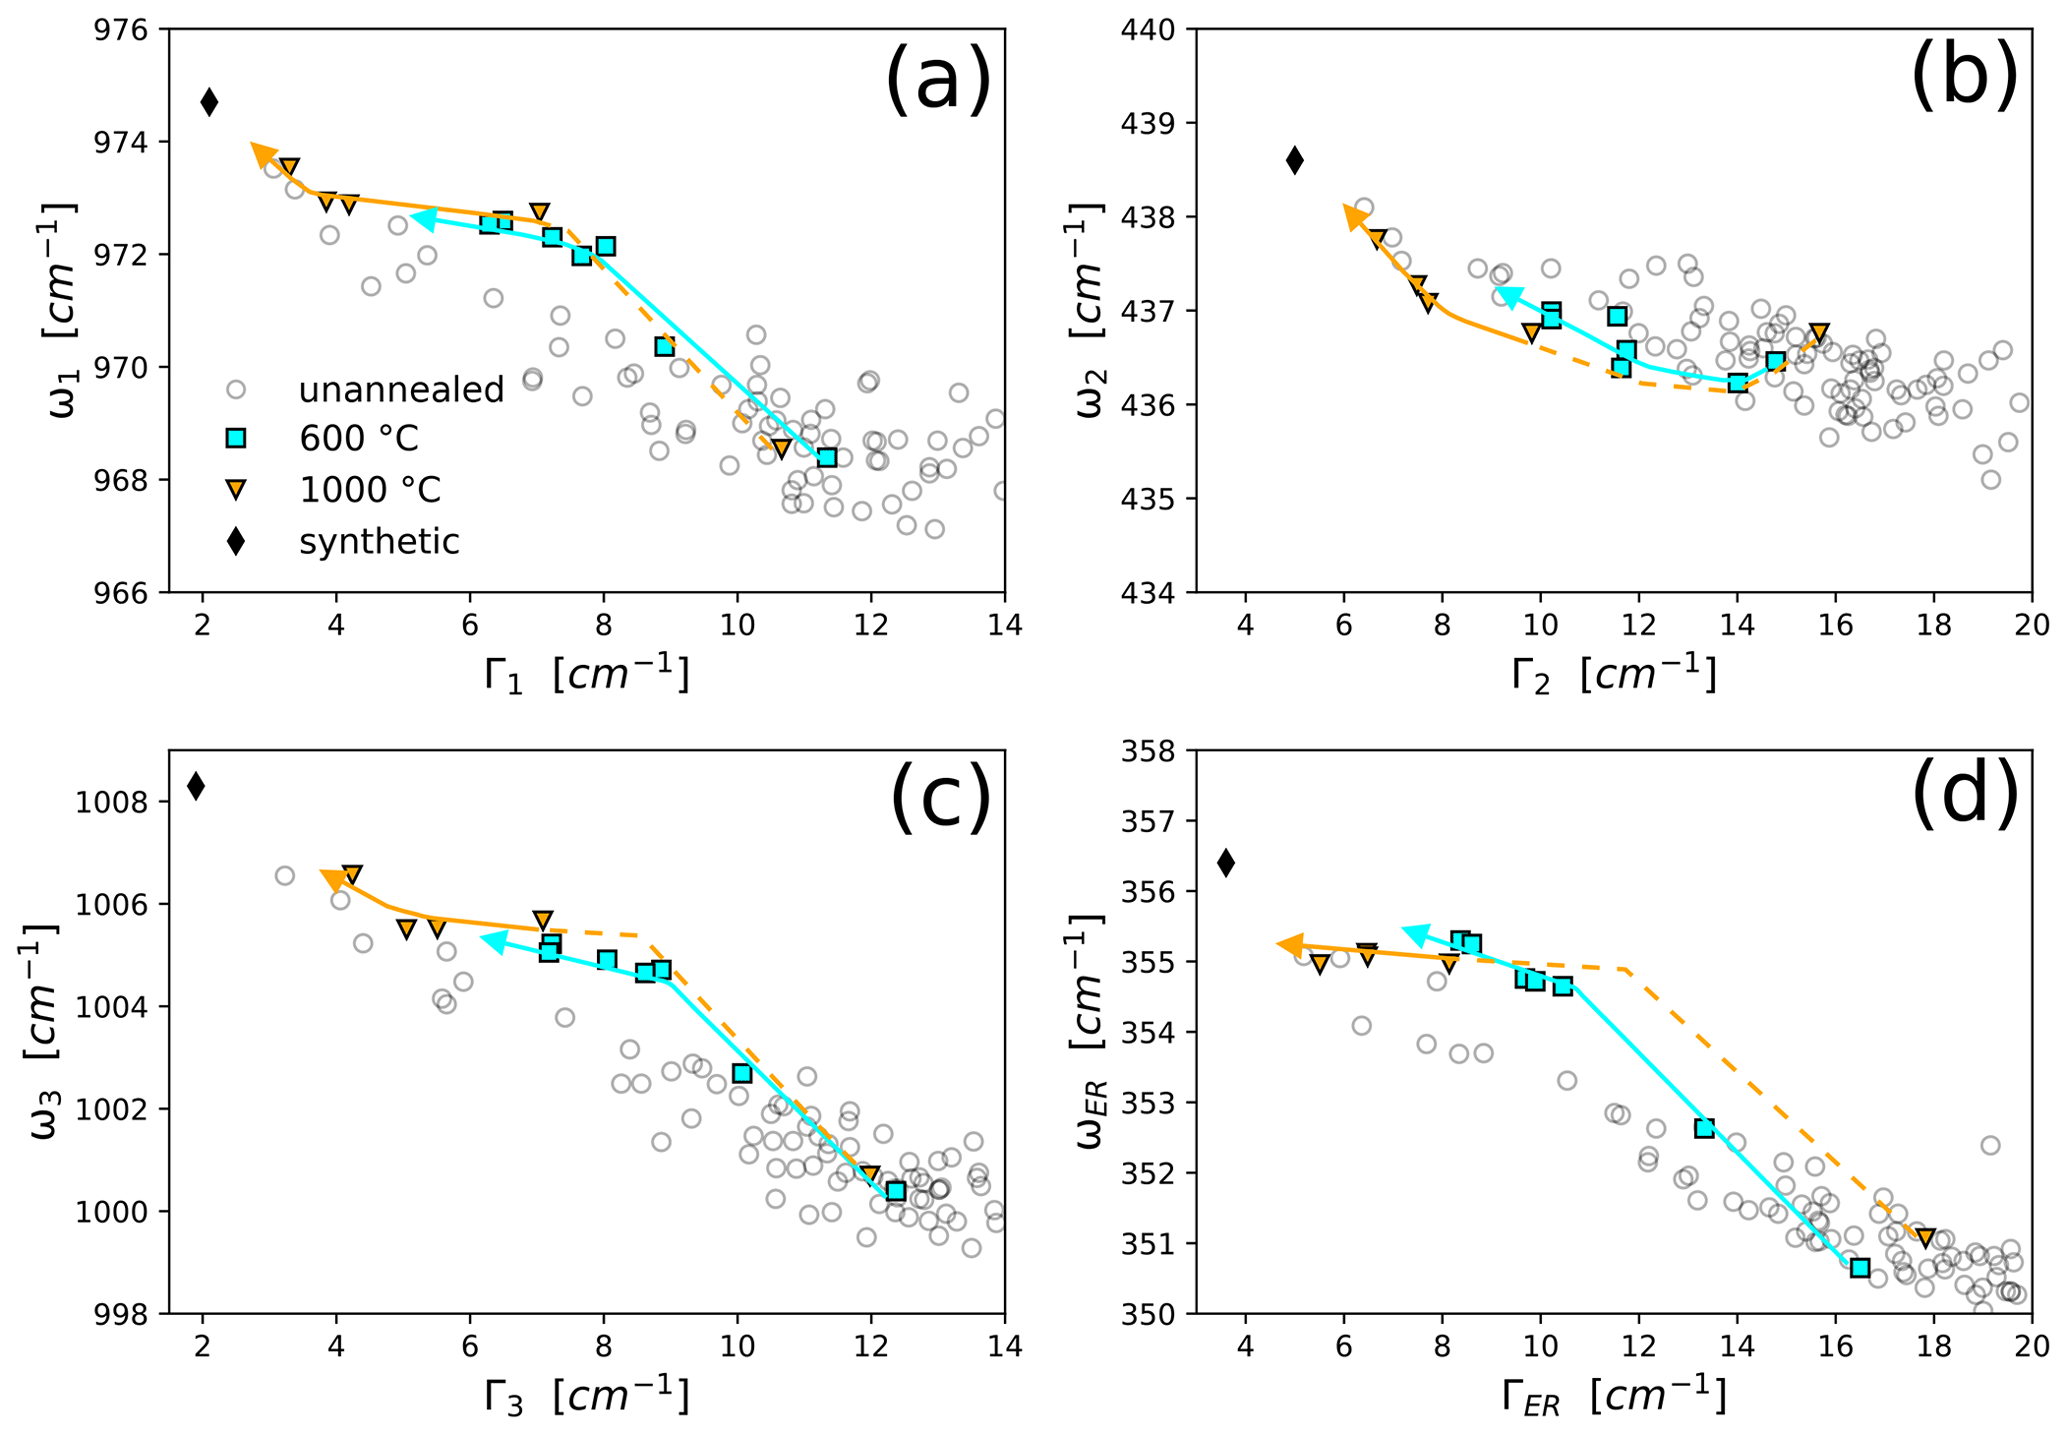
Figure 4ω–Γ plots of the ν1(SiO4) (a), ν2(SiO4) (b), ν3(SiO4) (c), and ER (d) Raman bands for the isothermal annealing runs of two zircons at 600 and 1000 ∘C. The initial damage density was /g for both zircons. Annealing durations were 10, 30, and 90 min, 5 h, 1, and 5 d for the 600 ∘C experiment and 10, 30, and 90 min, and 1 d for the 1000 ∘C. Gray circles represent the unannealed zircons from which the annealed samples were selected. The arrows are orientation guides for the annealing trajectories. The dashed line represents an expected trajectory for the stage I annealing at 1000 ∘C, for which the zircon already reached stage II during the first annealing run.
Figure 5 compares the change in band positions of the isochronal runs with the results of Zhang et al. (2000a) and in the ω3 position of Geisler (2002) and Ginster et al. (2019; Fig. 5c). The ω1, ω3, and ωER data define a rising trajectory up to 800 ∘C and a flat annealing trend at higher temperatures. This reflects the trends for stages I and II (Figs. 2, 3, 4). For ω3, most of our data are slightly lower than those of Ginster et al. (2019), consistent with the values of Geisler (2002) but are more strongly annealed than those of Zhang et al. (2000a). We also observed more annealing of ω compared with Zhang et al. (2000a) for the other three bands. The small difference between our isochronal runs for 1 h and the 90 min runs of Ginster et al. (2019) can be attributed to the difference in annealing time.
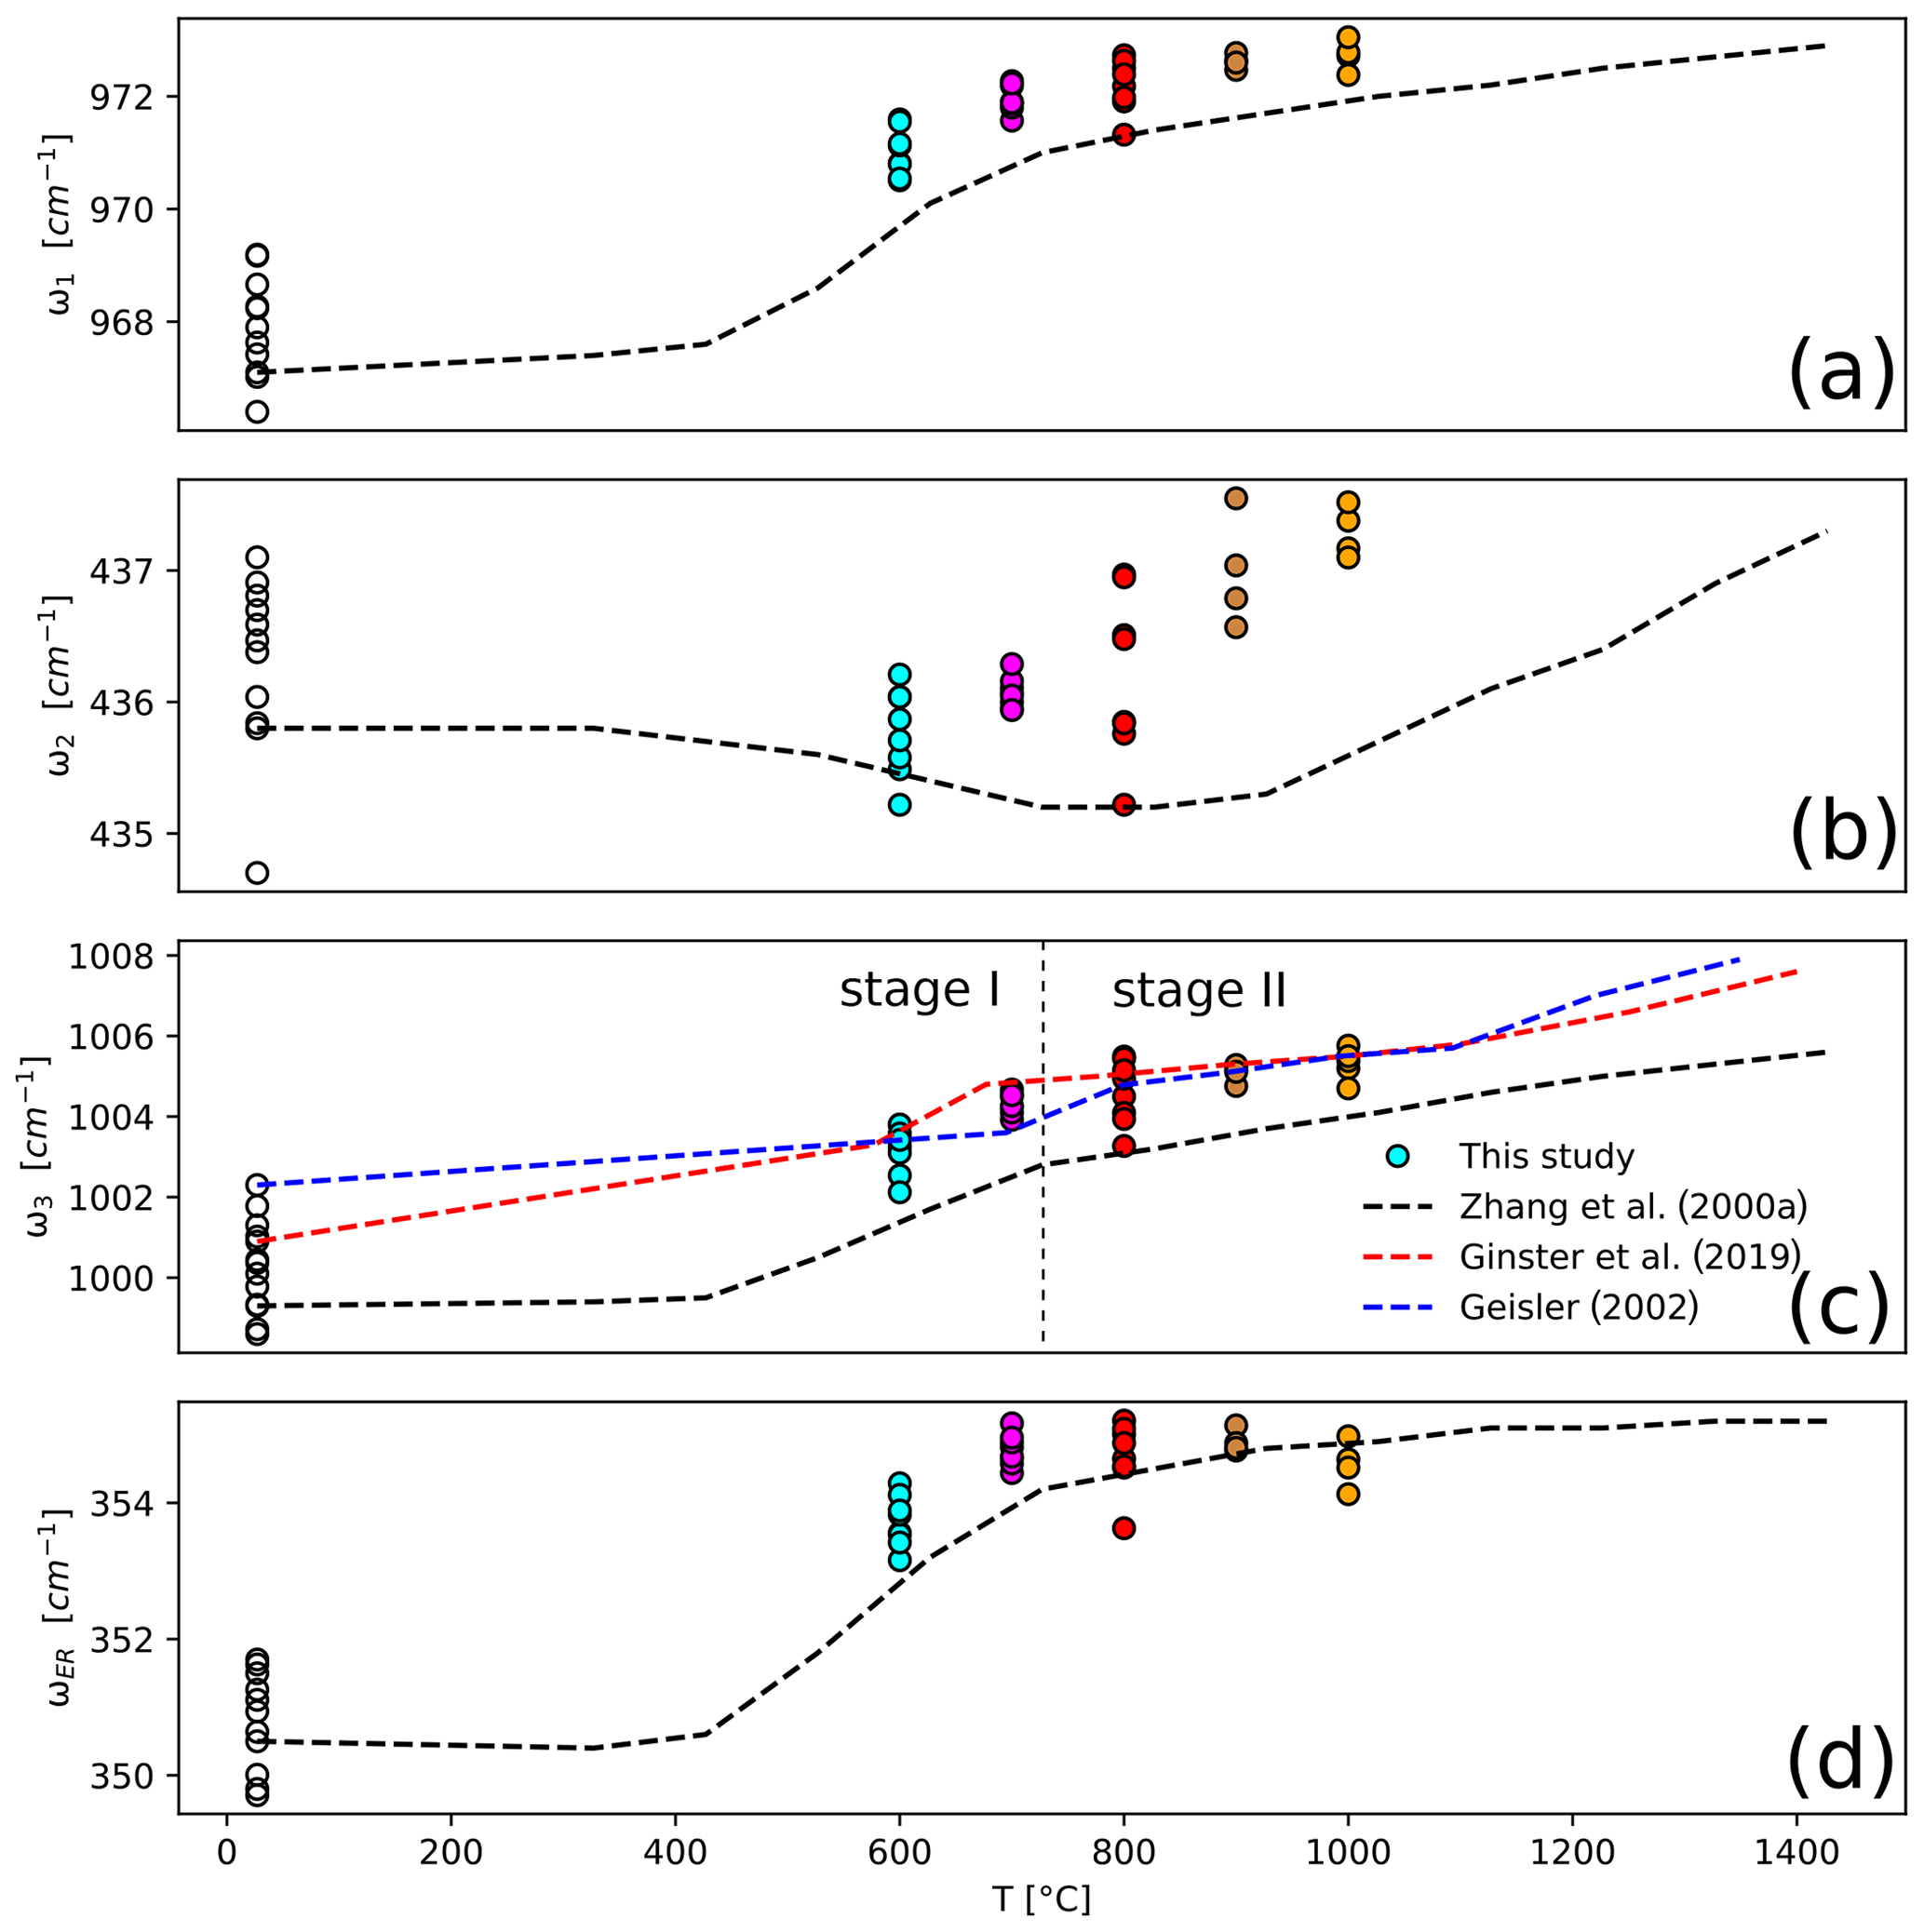
Figure 5ω–temperature plots of the ν1(SiO4) (a), ν2(SiO4) (b), ν3(SiO4) (c), and ER (d) Raman bands for the isochronal experiments compared with the 1 h isochronal annealing data of Zhang et al. (2000a) and the 90 min annealing experiments of Geisler (2002) and Ginster et al. (2019).
The main difference between our results and those of Zhang et al. (2000a) and Geisler (2000) relates to ω2, for which Geisler (2002) reported a sharp increase only in stage III. The data of Zhang et al. (2000a) show a slight decrease of ω2 during the first two stages that reverses in stage III. Our data show an initial drop of ω2, followed by a shift to higher wavenumbers at the onset of stage II.
The differences between the annealing trends for the different Raman bands can be interpreted as a result of the different Raman modes. We present a hypothesis for the downshift and reversal of ω2 during annealing in Appendix B.
Figure 6 plots ω3 vs. Γ3 for our isochronal and isothermal runs, superimposed on the data of Geisler et al. (2001), Geisler (2002), and Ginster et al. (2019). From stage II on, the annealing data define a well-defined common trend, even for zircon samples with different initial damage densities. The samples follow subparallel trajectories through stage I. The convergence towards a common stage II is also apparent for the other Raman bands (Figs. 3 and 4). Stage II is interpreted as representing a state of the zircon lattice that is independent of the damage accumulation history. We assume, based on the interpretation of the successive annealing stages of Colombo and Chrosch (1998a), Ríos et al. (2000), and Geisler et al. (2001), that stage II describes zircons in which the lattice has lost most of its point defects and is predominantly strained by the amorphous domains caused by α recoils. In this case, the position of a zircon along the stage II trend represents the remaining amorphous fraction.
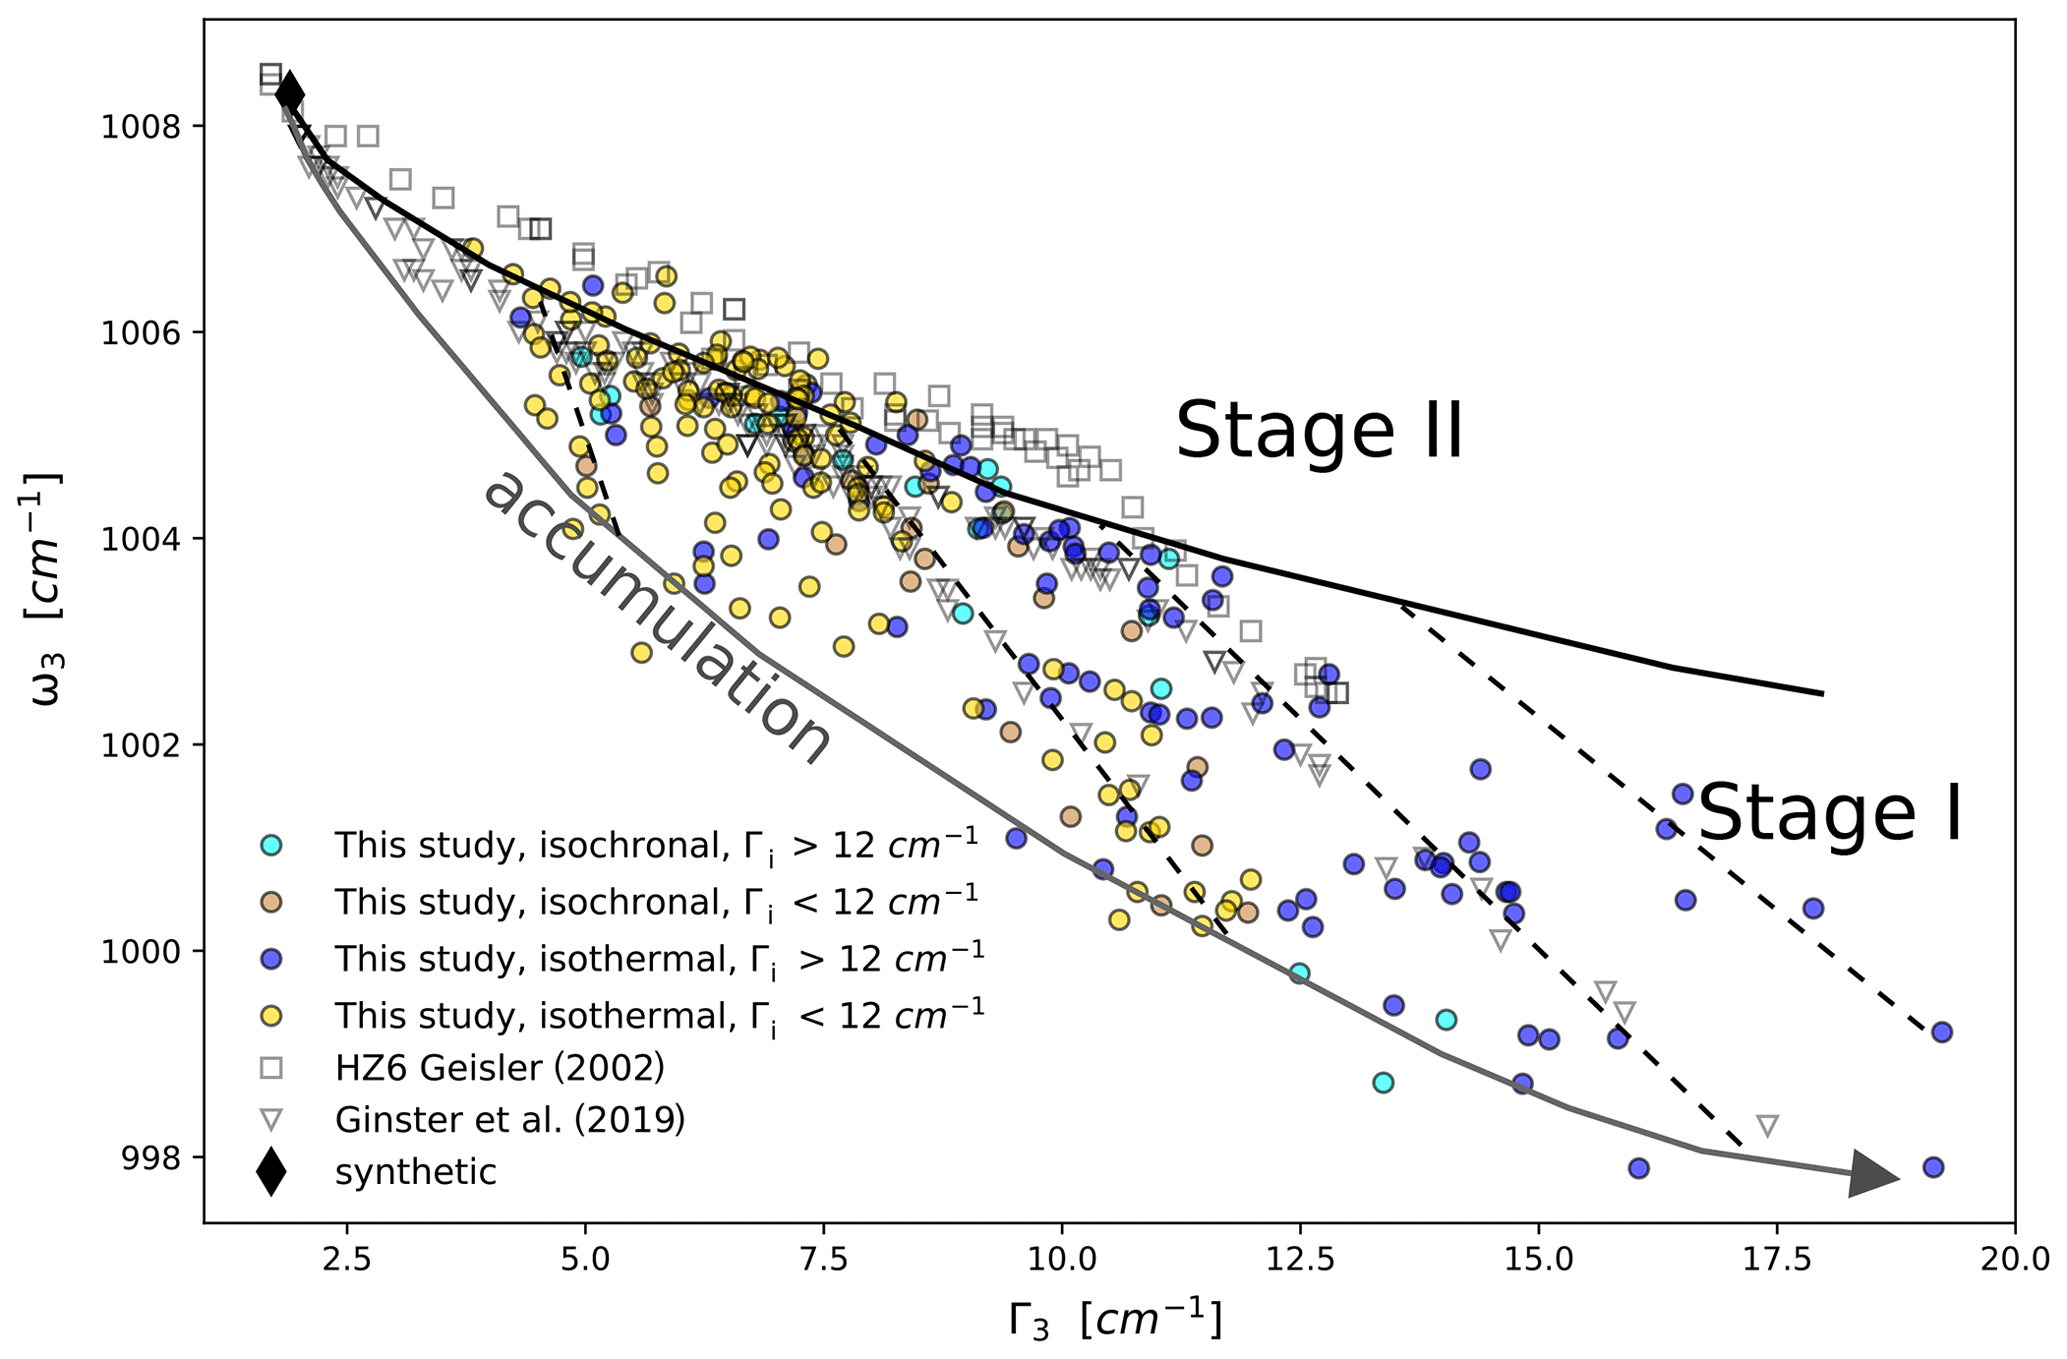
Figure 6Composite ω–Γ plot of the ν3(SiO4) annealing data from this study compared with published data (Geisler, 2002; Ginster et al., 2019). The data are subdivided into isochronal and isothermal runs and samples larger and smaller than an initial Γ3 of 12 cm−1 (/g). Gray arrow: radiation-damage accumulation trajectory based on the unannealed zircons from this study; dashed black lines: stage I annealing; bold black line: stage II annealing.
3.2 Kinetic modeling and closure temperature
For estimating the temperatures at which annealing takes place on geological timescales, we fitted kinetic models to the Raman bandwidth data for the isothermal annealing runs. We fitted Γ2, Γ3, and ΓER, but not Γ1 which shows lower bandwidths than the other bands, implying lower sensitivity to radiation damage. We quantified the fractional lattice repair following isothermal annealing for a time t and a temperature T equivalent to the parameter α of Geisler et al. (2001):
Γi is the bandwidth of the unannealed sample, and Γ(t,T) that after annealing for a (cumulative) time t at temperature T. Γ0 is the bandwidth of undamaged zircon; we assumed 5.0, 1.9, and 3.6 cm−1 for the ν2(SiO4), ν3(SiO4), and external rotation bands, based on the values of the synthetic zircon we measured. Φ=0 indicates no annealing; Φ=1 is complete annealing. We listed values for Φ of the isothermal annealing runs in Supplement Table S2. A Pearson correlation test with Bonferroni correction for multiple testing (Abdi, 2007) showed that none of the co-annealed zircons exhibited a significant dependence of Φ on the initial damage Γi. We calculated the arithmetic mean Φ(t,T) values of each experimental condition (t, T) to approximate equal weighting of the different isothermal annealing runs. Mean values for Φ are listed in Supplement Table S3.
Figure 7 plots Φ against annealing time for the three Raman bands; Φ ranges from ∼0.1 to ∼0.7 for Γ2 and Γ3 and from ∼0.2 to ∼0.8 for ΓER. The trends are approximately linear with logarithmic time and roughly parallel to each other. As expected, Φ increases with time and temperature. The values for ν3(SiO4) are consistent with those of Ginster et al. (2019). Ginster et al. (2019) worked with zircons from Sri Lankan gem gravels which have a crystallization age of ∼550–570 Ma (Holland and Gottfried, 1955; Nasdala et al., 2004) but have only retained ∼55 % of all radiation damage accumulated since their formation (Holland and Gottfried, 1955; Murakami et al., 1991; Nasdala et al., 2004). The time of their partial annealing and the geological processes involved are debated (Nasdala et al., 2004). Our volcanic zircons are analogous in age and tectonic setting to the unannealed Saxonian rhyolite zircons of Nasdala et al. (1998) and thus different in provenance, age, and thermal history. Based on the consistency of ν3(SiO4) annealing data, we assume that the annealing kinetics of our samples and those of Ginster et al. (2019) are applicable to a broad range of zircons.

Figure 7Plots of the annealed fraction Φ against ln annealing time for the ν2(SiO4) (a), ν3(SiO4) (b), and ER (c) Raman bands. The arithmetic means are connected with lines for visual guidance.
We fitted two models to the mean fractions of annealing from the isothermal runs: a Johnson–Mehl–Avrami–Kolmogorov (JMAK) model (Kolmogorov, 1937; Avrami, 1939; Johnson and Mehl, 1939) and a distributed activation energy (DAE) model (Lakshmanan et al., 1991; Lakshmanan and White, 1994). The JMAK model is described by
where n is the Avrami exponent and k is a temperature-dependent rate factor that follows an Arrhenius law:
k0 is a frequency factor, EA an activation energy, and κ the Boltzmann constant. JMAK models are used for describing crystallization processes (Avrami, 1939; Johnson and Mehl, 1939). Since crystallization of amorphous domains takes place during radiation-damage annealing, Geisler et al. (2001) and Geisler (2002) used this model for estimating the activation energies of the radiation-damage annealing stages II and III of zircon. The DAE model assumes that the annealing process draws from a distribution of activation energies. It is applied to processes involving sub-reactions with different activation energies and has been used for describing hydrocarbon decomposition and fission-track annealing (Lakshmanan et al., 1991; Lakshmanan and White, 1994). The fractional repair is expressed as follows:
k0 is a frequency factor and G(E) a Gaussian distribution of activation energies E with mean E0 and standard deviation σ. We fitted both models by minimizing the sum of squared Φ residuals (SSRs). Table 1 lists and Fig. 8 shows the results. The (mean) activation energies are between 2.7 and 3.0 eV for the three bands and both models. In contrast, the k0 values span 3 orders of magnitude. The Avrami exponent is similar for Γ2 and Γ3 (n=0.11) and lower for ΓER (n=0.08). The standard deviations of G(E) are ∼1 eV for the three Raman bands. The best-fit SSRs are comparable for all models, with the lowest values for ΓER. The overall agreement of predicted and measured Φ values is close to 1:1 for all experimental conditions (Fig. 8). The SSR surfaces plotted against log k0 and mean EA show a distinct trough of low SSR that includes the best-fit parameters.
Table 1Parameter estimates for the Johnson–Mehl–Avrami–Kolmogorov (JMAK) and distributed activation energy (DAE) annealing models and calculated closure temperatures Tc for cooling rates of 1, 10, 30, and 100 K Myr−1.
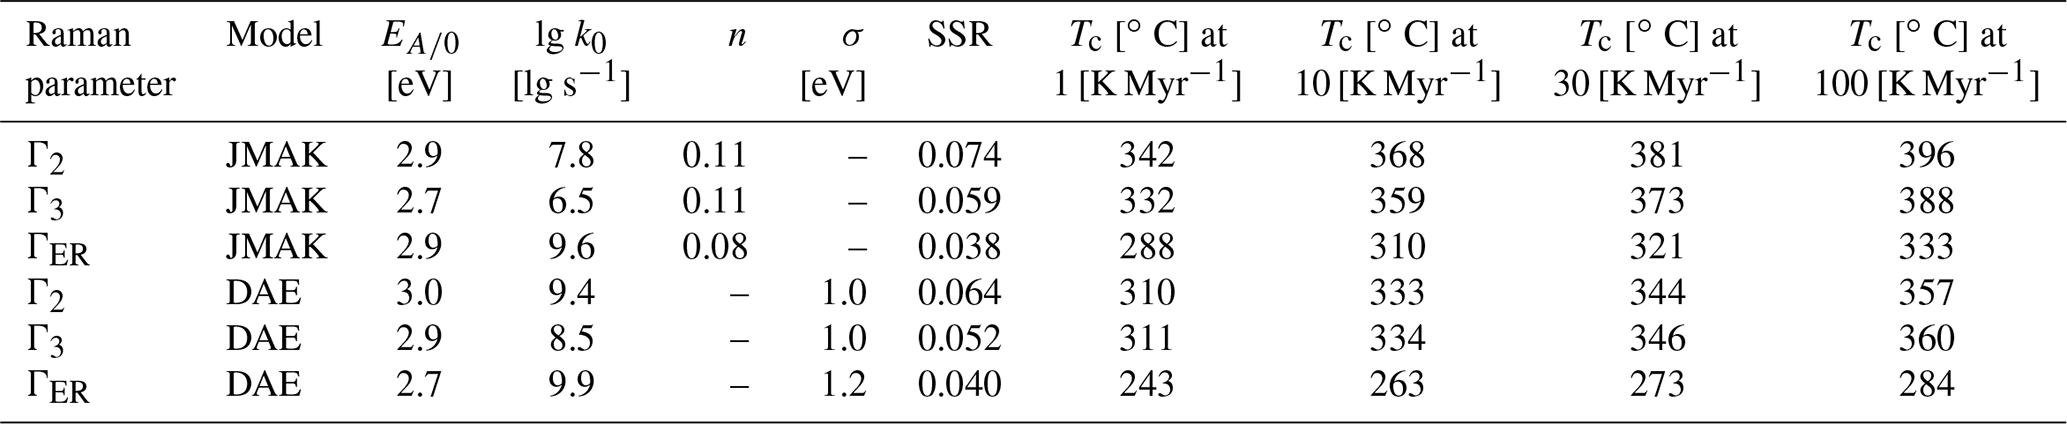

Figure 8Overview of the JMAK (a–c) and DAE (d–f) modeling results for Γ2, Γ3, and ΓER. The left panels compare the predicted and measured Φ values. The right panels show the sum of squared residual (SSR) surfaces as a function of log k0 and EA (JMAK) or E0 (DAE) for optimal values of n and σ (Table 1).
We estimate the closure temperatures Tc with the approach of Dodson (1979) for fission tracks:
The equation considers cooling through the closure temperature following a linear increase of with time; t50 is the time at which half the damage is retained. E is the activation energy (EA; JMAK) or its distribution (G(E); DAE). Equation (5) is equated to the model Eqs. (2), (3), and (4), rearranging and substituting 0.5 for Φ(t,T) (Appendix A):
for the JMAK model and
for the DAE model.
Equations (6) and (7) are solved iteratively for Tc. Table 1 lists the results for cooling rates of 1, 10, 30, and 100 K Myr−1. As expected, Tc is higher for the faster cooling; the difference is ∼20–30 ∘C for a 10-fold increase in cooling rate. Values for Tc at 10 K Myr−1 cooling rate range from 260 to 370 ∘C. The Tc values for all Raman bands are higher for the JMAK than for the DAE models. For both, Tc is highest for Γ2 and lowest for ΓER; Tc for Γ3 is slightly lower than for Γ2. The more sensitive response of ΓER to annealing compared to Γ2 is in agreement with the low temperature annealing results of Dias et al. (2020). We interpret the difference in sensitivity between the external rotation band and the internal bands to the stronger Si–O bonds within the SiO4 tetrahedra and the weaker Zr–O bonds between the tetrahedra (Dawson et al., 1971).
The linear troughs in Fig. 8 reflect a trade-off between EA (E0 for DAE models) and k0. Different parameter pairs fit the data equally well due to the limited range of laboratory annealing times and temperatures (Mialhe et al., 1988; Lakshmanan et al., 1991). The trade-off is a problem for the extrapolation of the experimental data to geological timescales, since Tc varies along the trough.
The kinetic parameters of our JMAK model for Γ3 can be compared to the JMAK-model results of the Geisler et al. (2001) and Geisler (2002) for the stage II and III annealing. Their Avrami exponent (n=0.11) agrees with ours for Γ3. Their activation energy is ∼3.8 eV for stage II and ranges from 6.4 to 6.9 eV in stage III; their log k0 is 9.3 for stage II and >15 in stage III. The differences result mainly from the trade-off between EA (E0) and log k0 and do not necessarily reflect different kinetics. Moreover, most of our data are from annealing stages I and II, whereas those of Geisler et al. (2001) and Geisler (2002) are from stage II and stage III. Their results and those of Ginster et al. (2019) suggest that stage I annealing requires a lower activation energy than stages II and III, which could also in part account for the lower activation energies obtained from our models. The variation of Tc along the SSR troughs in Fig. 8 is also the probable reason for the different Tc estimates for the JMAK and DAE models. There is no independent physical evidence for either model, and both models fit our experimental data equally well (Table 1). Therefore, we assume the DAE value as the lower limit and the JMAK value as the upper limit of the Tc range for each Raman band.
Figure 9a compares our Tc values with previous estimates from geological and experimental evidence. The wide range of Tc (160 to 650 ∘C) is in part due to the different approaches. That of Deliens et al. (1977) resulted from comparing radiation-damage ages of Precambrian zircons, calculated from an internal bending IR band, with the ages determined with established geochronometers. The IR ages tended to be lower than the corresponding titanite U–Pb ages (Tc≳650 ∘C; Stearns et al., 2015) and whole-rock Rb–Sr ages but were mostly higher than mica and feldspar Rb–Sr ages (Tc∼320 to 575 ∘C; Harrison and McDougall, 1980; Giletti, 1991). The zircon radiation-damage Tc estimate of Mezger and Krogstad (1997) is based on the observation that zircons that remained below 600 to 650 ∘C during parts of their geological history experienced Pb loss by Pb leaching from metamict zones.
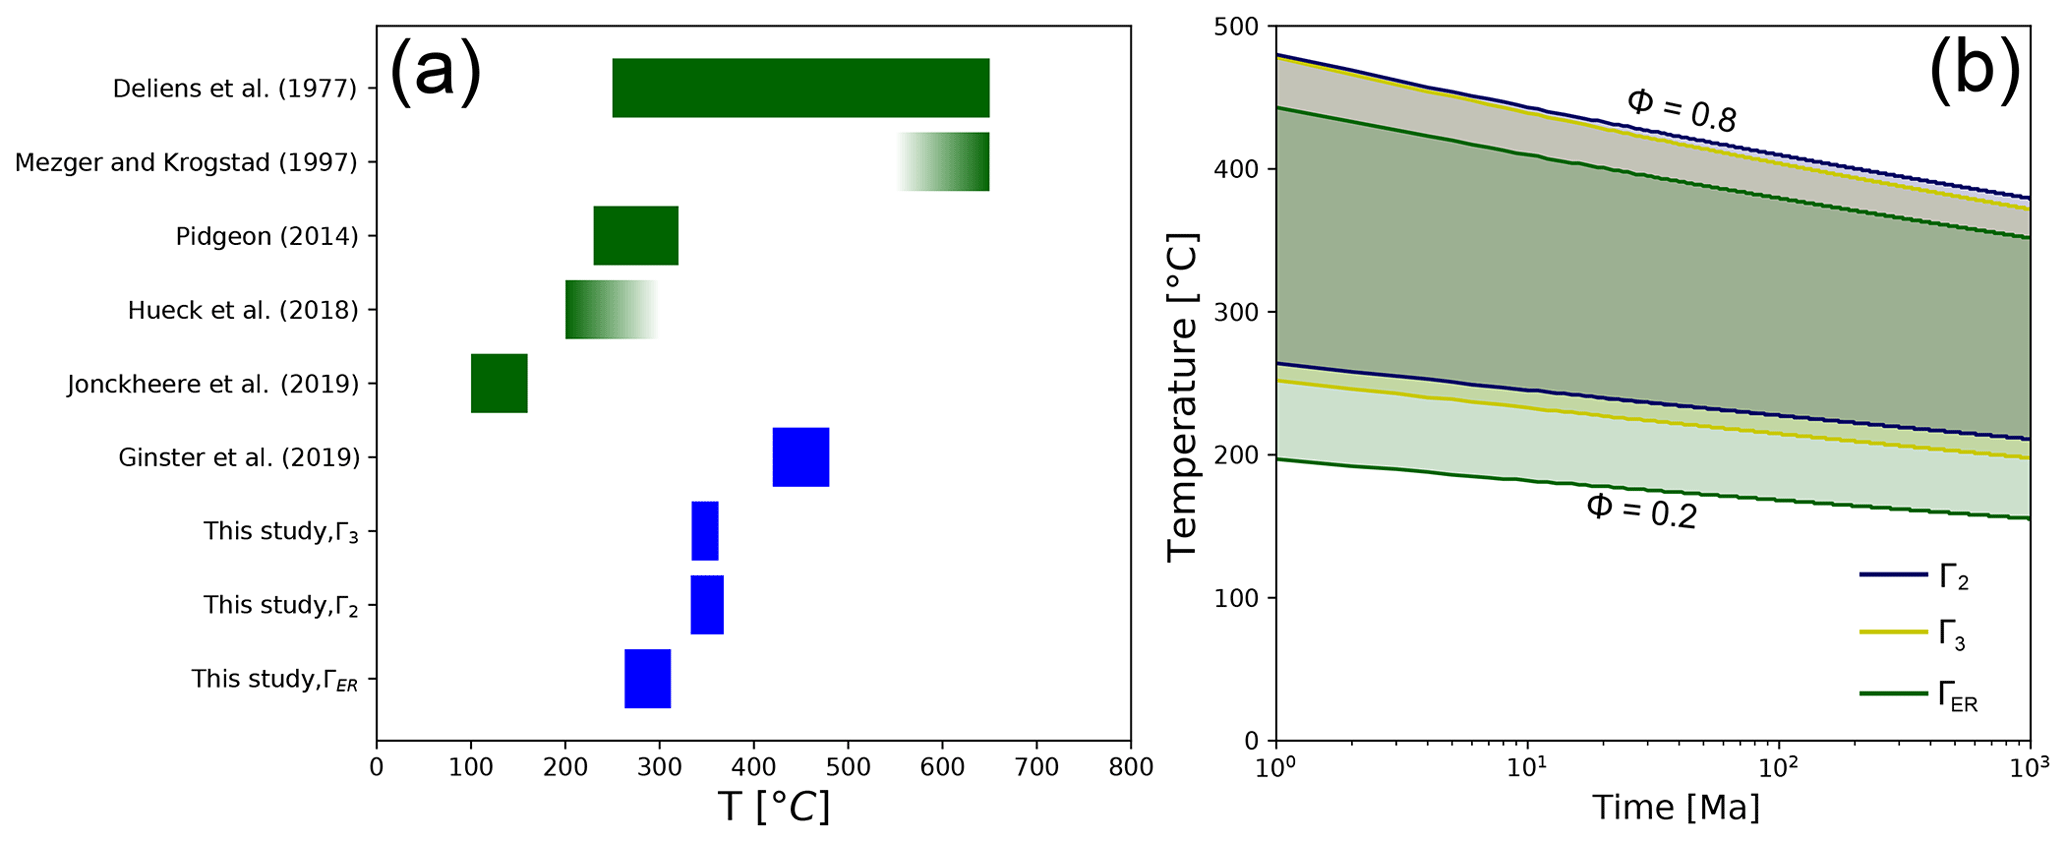
Figure 9(a) Zircon radiation-damage closure temperatures Tc based on annealing experiments (blue) and geological data (green). (b) Partial annealing zones for the JMAK models for Γ2, Γ3, and ΓER for residence times between 1 Ma and 1 Ga. The shaded colors correspond to the extent of the partial annealing zones for the three Raman bands.
Jonckheere et al. (2019) measured Γ3 for isothermal holding for ∼80 Myr at increasing temperatures in the KTB borehole and interpreted its downhole decrease as due to stage I annealing. Hueck et al. (2018) and Pidgeon (2014) dated zircons with Raman based on the Γ3 vs. radiation-dose calibration of Palenik et al. (2003). Hueck et al. (2018) compared their results with corresponding (U–Th) He zircon ages (Tc≈170 to 190 ∘C; Reiners et al., 2004) and age–eU modeling results, finding that their Raman ages were consistently higher than the (U–Th) He ages. Pidgeon (2014) dated zircons from various Australian Precambrian rocks, whose Raman dates were consistent with the biotite Rb–Sr cooling ages (Tc∼320 ∘C, Harrison and McDougall, 1980) for the same units. Pidgeon (2014) placed the onset of stage I zircon radiation-damage annealing at ∼230 ∘C. We calculated a closure temperature for the three Γ3 fanning-linear Arrhenius models of Ginster et al. (2019) at 50 % damage retention. This gives Tc values between 420 and 480 ∘C. Our model estimates a range from 330 to 370 ∘C for Γ2 and Γ3, reflecting the model-dependent extrapolation of the experimental data to geological timescales.
The lower Tc (260 to 310 ∘C) for ΓER suggest that geological zircon radiation-damage annealing cannot be described by a single Tc. Instead, different Raman bands record different parts of the thermal history of a zircon. The dearth of independent experimental and geological data for Γ2 and ΓER makes it difficult to be certain that their closure temperatures are different from that of Γ3, as the annealing data suggest. For the best-studied Raman parameter Γ3, our experimental data favor a closure temperature between 330 and 360 ∘C in the region between the estimates of Pidgeon (2014) and Deliens et al. (1977).
Figure 9b shows the partial annealing zones for the JMAK models for Γ2, Γ3, and ΓER. The partial annealing zone temperatures are highest for Γ2 and lowest for ΓER. Under isothermal holding for >1 Ma, partial annealing occurs at temperatures as low as 200 ∘C, and full annealing requires temperatures above 450 ∘C. The low-temperature boundary is in agreement with the stage I annealing temperature of Pidgeon (2014) but higher than that of Jonckheere et al. (2019); the upper boundary is consistent with full annealing at 600–650 ∘C assumed by Mezger and Krogstad (1997).
The results of our isochronal and isothermal annealing experiments indicate that the ν1(SiO4), ν2(SiO4), ν3(SiO4), and external rotation Raman bands at 974, 438, 1008, and 356 cm−1 of radiation-damaged zircon anneal differently with respect to the bandwidth (Γ) and band position (ω). Γ decreases for all Raman bands during annealing while ω increases, but ω2 drops to lower wavenumbers during the first annealing stage, increasing again from the second annealing stage onward. The different annealing trajectories can help to detect partial annealing in natural zircons.
Our ν3(SiO4) annealing data on volcanic zircons are consistent with those of Ginster et al. (2019), obtained on samples with different provenance, age, and thermal history. This suggests that the results of the annealing experiments are representative of a wide range of natural zircons.
The JMAK and distributed activation energy models yield closure temperatures (Tc) between 260 and 370 ∘C. Overall, this temperature range overlaps with most earlier estimates. The different Tc values for the two kinetic models show that model selection and the trade-offs between the model parameters play a significant role for the extrapolation of laboratory annealing data to geological timescales. This uncertainty in extrapolation emphasizes the need for geological data to constrain Tc. Independent of the model, the calculated Tc is comparable for Γ2 and Γ3 (330 to 370 ∘C) but lower for ΓER (260 to 310 ∘C). This difference offers the prospect of multi-Tc zircon Raman dating using several Raman bands.
Dodson (1973) defined the closure temperature Tc as the temperature of a parent–daughter system at the apparent age of a rock. For fission tracks, Dodson (1979) equates the time for 50 % annealing at the closure temperature to the cooling time constant, defined for a cooling following a linear increase of :
κ is the Boltzmann constant and EA is the activation energy of the annealing process at 50 % annealing. For the JMAK model, the fraction of annealing Φ(t,T) is given by
k0 is a frequency factor, EA the activation energy, and n the Avrami exponent.
Rearranging Eq. (A2) yields
Substituting Eq. (A1) for t and 0.5 for Φ(t,T) yields
Equation (A5) is solved iteratively for Tc, given the model parameters EA, k0, and n in Table 1 and assuming a cooling rate .
For the distributed activation energy model, Φ(t,T) is given by
G(E0,σ) is the Gaussian distribution of activation energies with mean E0 and standard deviation σ; k0 is a frequency factor. Substituting Eq. (A1) for t and 0.5 for Φ(t,T) gives
Equation (A7) is solved iteratively for Tc, given the model parameters E0, σ, and k0 in Table 1 and assuming a cooling rate .
Other than the ν1(SiO4) and ν3(SiO4) stretching modes, ν2(SiO4) is a bending mode whose frequency depends on the angle between the Si–O bonds in the SiO4 tetrahedron (Geisler, 2002). The O–Si–O angle is related to the ratio of the unit cell parameters a and c (Tokuda et al., 2019).
Figure B1 plots c vs. a for the XRD data for the annealing experiments of Colombo and Chrosch (1998a) and Geisler (2002). During damage accumulation, c increases more than a (Salje et al., 1999; Zhang et al., 2000b). The increased ratio reduces the O–Si–O angle between the oxygen atoms shared by Si and Zr (Tokuda et al., 2019), shifting the ν2(SiO4) Raman band to lower wavenumbers. During stage I annealing, the unit cell shrinks anisotropically, reducing a more than c, causing a further increase of and lowering of the O–Si–O angle. The anisotropic shrinkage is thought to be due to the preferential diffusion of point defects in the basal plane of zircon during recovery (Ríos et al., 2000; Colombo and Chrosch, 1998a). We interpret the further decrease of the O–Si–O angle to cause the decrease of ω2 during stage I. The annealing trend in the c vs. a plot changes to a preferential reduction of c during stage II until the values of well-ordered zircon are reached. The decrease of the values is accompanied by the opening of the O–Si–O angle, which we associate with the reversal of ω2 during stage II. The scatter in the unit cell data in Fig. B1 partly masks the trends so that the downshift of ω2 due to the increase in in stage I is not definite but needs future investigation by combined Raman and XRD analyses of annealed zircon.
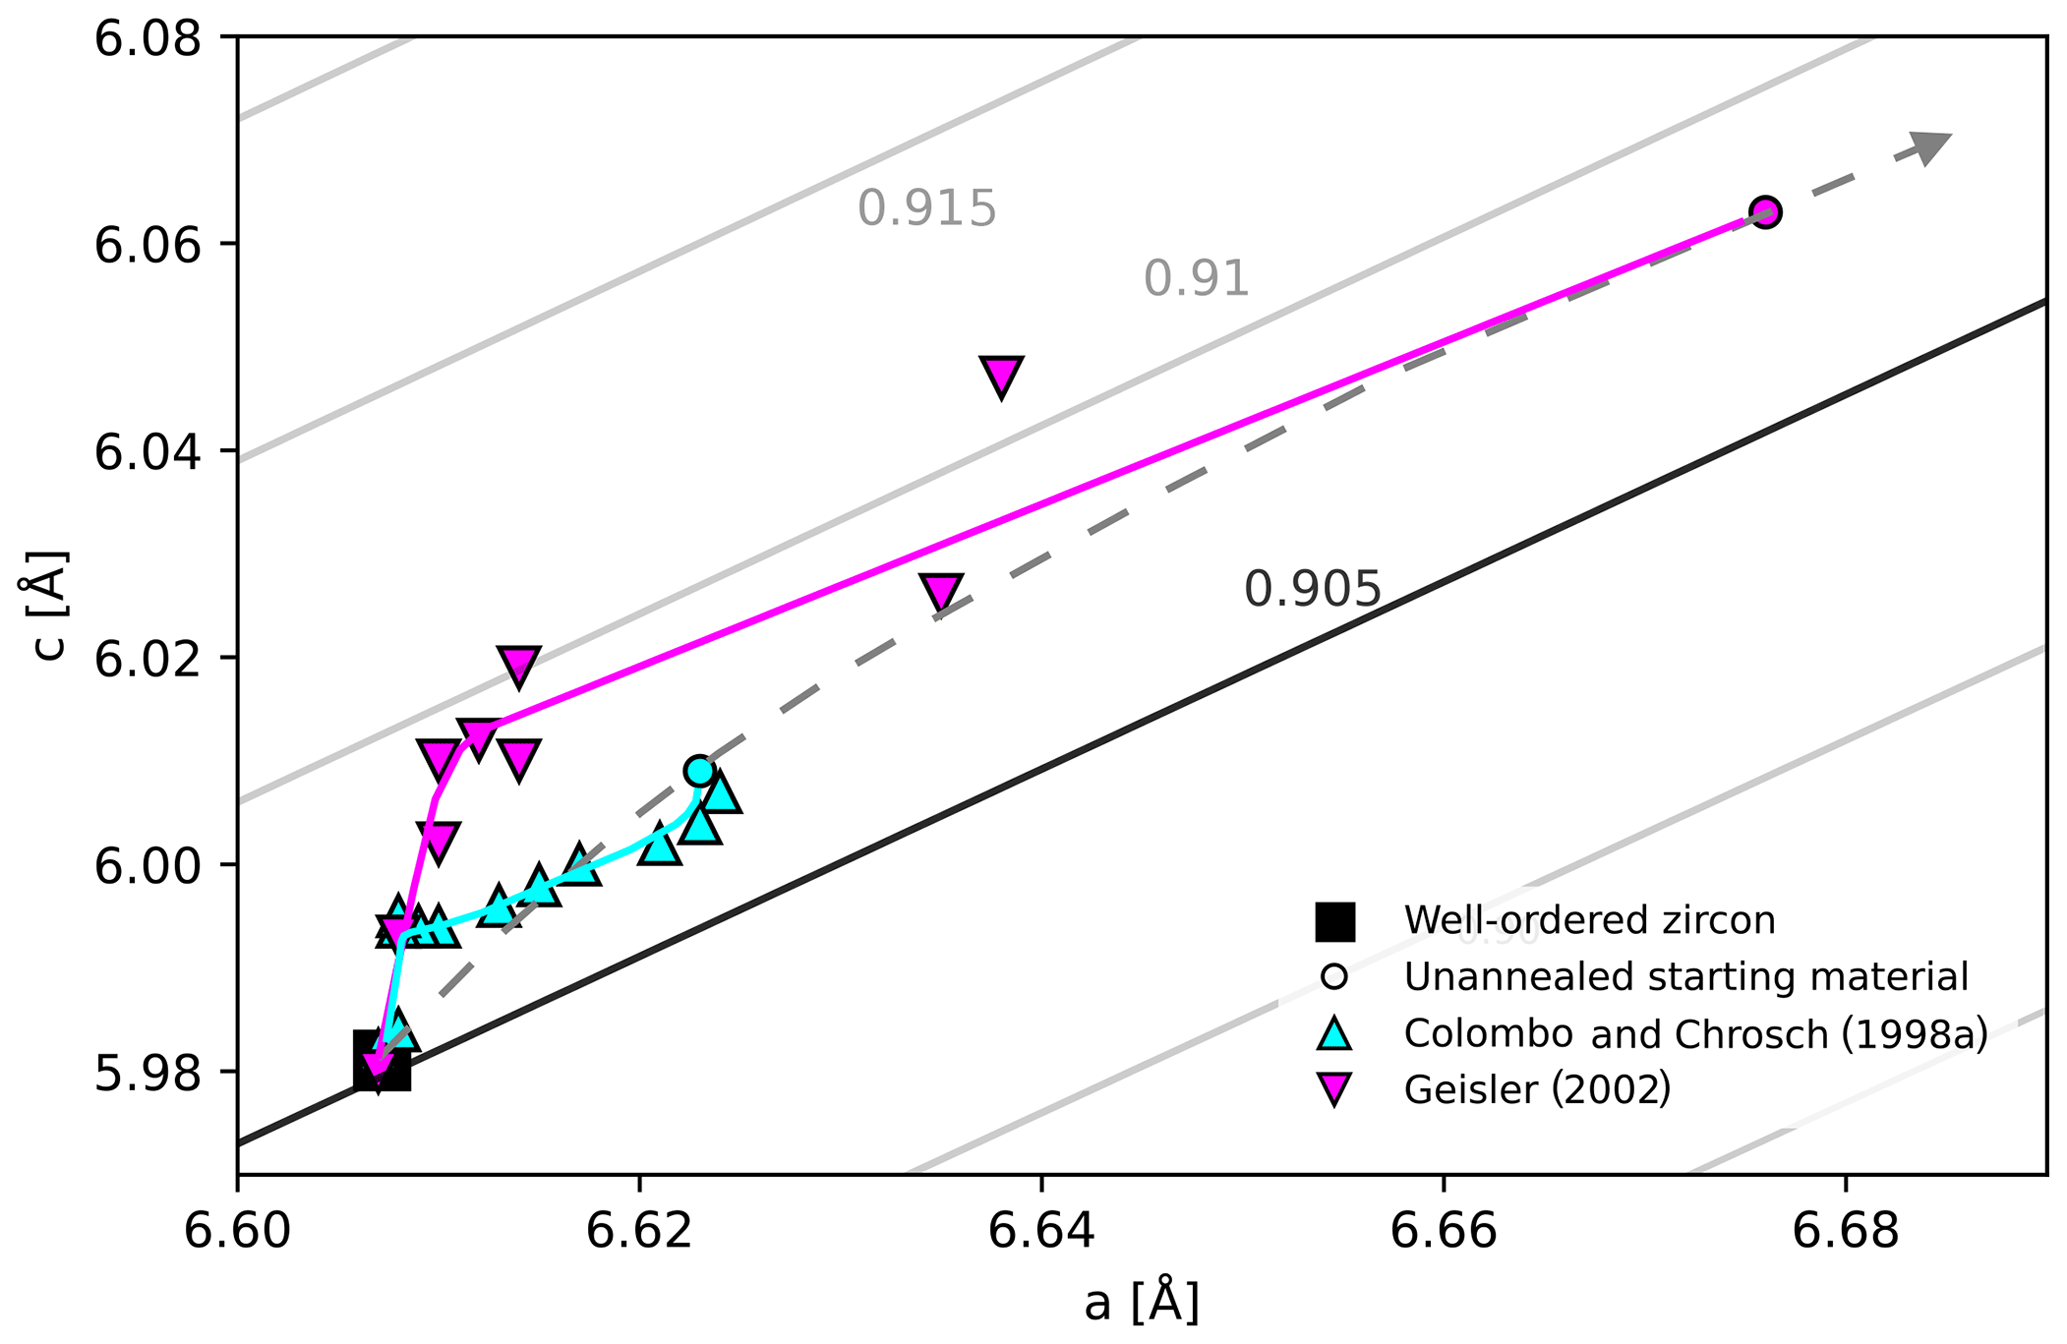
Figure B1Zircon unit cell measurements of Colombo and Chrosch (1998a) and Geisler (2002). The colored lines are the annealing trajectories, starting from different damage densities. The dashed arrow is an accumulation trend based on the unannealed zircons. The continuous black and gray lines indicate constant ratios.
The Raman measurement data are available in the repository for digital research data of the TU Dresden and the TU Bergakademie Freiberg OPARA at http://dx.doi.org/10.25532/OPARA-103 (Härtel et al., 2020).
The supplement related to this article is available online at: https://doi.org/10.5194/gchron-3-259-2021-supplement.
BH and RJ planned the annealing experiments that were carried out by BH and BW. BH did the Raman measurements and the kinetic modeling. RJ and LR contributed to the interpretation of the models. BH prepared the manuscript with contributions from all co-authors.
The authors declare that they have no conflict of interest.
We thank Axel Schmitt (Universität Heidelberg) for providing the synthetic zircon. We thank Beatrix Heller and Airton Dias for their helpful referee comments that improved the manuscript, and Klaus Mezger for the editorial handling.
This research has been supported by the Deutsche Forschungsgemeinschaft (grant no. WA 4390/1-1) and the German Academic Scholarship Foundation (Studienstiftung des deutschen Volkes) granted to Birk Härtel.
This paper was edited by Klaus Mezger and reviewed by Beatrix Heller and Airton Dias.
Abdi, H.: The Bonferroni and Šidák corrections for multiple comparisons, in: Encyclopedia of measurement and statistics, edited by: Salkind, N. J., Sage, Thousand Oaks, California, USA, 2007.
Anderson, A. J., Hanchar, J. M., Hodges, K. V., and van Soest, M. C.: Mapping radiation damage zoning in zircon using Raman spectroscopy: Implications for zircon chronology, Chem. Geol., 538, 119494, https://doi.org/10.1016/j.chemgeo.2020.119494, 2020.
Avrami, M.: Kinetics of phase change. I General Theory, J. Chem. Phys., 7, 1103–1112, 1939.
Capitani, G. C., Leroux, H., Doukhan, J. C., Ríos, S., Zhang, M., and Salje, E. K. H.: A TEM investigation of natural metamict zircons: structure and recovery of amorphous domains, Phys. Chem. Miner., 27, 545–556, 2000.
Colombo, M. and Chrosch, J.: Annealing of natural metamict zircons. I low degree of radiation damage, Radiat. Phys. Chem., 53, 555–561, 1998a.
Colombo, M. and Chrosch, J.: Annealing of natural metamict zircons: II high degree of radiation damage, Radiat. Phys. Chem., 53, 563–566, 1998b.
Dawson, P., Hargreave, M. M., and Wilkinson, G. R.: The vibrational spectrum of zircon (ZrSiO4), J. Phys. C.: Solid St. Phys., 4, 240–256, 1971.
Deliens, M., Delhal, J., and Tarte, P.: Metamictization and U-Pb systematics – a study by infrared absorption spectrometry of Precambrian zircons, Earth Planet. Sci. Lett., 33, 331–344, 1977.
Dias, A. N. C., Constantino, C. J. L., Soares, C. J., and Guedes de Oliveira, S.: Micro-Raman spectroscopy of zircon (ZrSiO4) mineral at annealing conditions usually applied in zircon fission-track annealing dataset, J. Nanosci. Nanotechnol., 20, 1884–1891, 2020.
Dodson, M. H.: Closure temperature in cooling geochronological and petrological systems, Contrib. Mineral. Petrol., 40, 259–274, 1973.
Dodson, M. H.: Theory of cooling ages, in: Lectures in Isotope Geology, edited by: Jäger, E. and Hunziker, J. C., Springer-Verlag, Berlin, Heidelberg, 194–202, 1979.
Geisler, T.: Isothermal annealing of partially metamict zircon: evidence for a three-staged process, Phys. Chem. Miner., 29, 420–429, 2002.
Geisler, T. and Pidgeon, R. T.: Raman scattering from metamict zircon: Comments on “Metamictisation of natural zircon: accumulation versus thermal annealing of radioactivity-induced damage” by Nasdala et al. 2001, Contrib. Mineral. Petrol., 143, 750–755, 2002.
Geisler, T., Pidgeon, R. T., Van Bronswijk, W., and Pleysier, R.: Kinetics of thermal recovery and recrystallization of partially metamict zircon: a Raman spectroscopic study, Eur. J. Mineral., 13, 1163–1176, 2001.
Giletti, B. J.: Rb and Sr diffusion in alkali feldspars, with implications for cooling histories of rocks, Geochim. Cosmochim. Ac., 55, 1331–1343, 1991.
Ginster, U., Reiners, P. W., Nasdala, L., and Chutimun, C. N.: Annealing kinetics of radiation damage in zircon, Geochim. Cosmochim. Ac., 249, 225–246, 2019.
Guillong, M., Schmitt, A. K., and Bachmann, O.: Comment on “Zircon U–Th–Pb dating using LA-ICP-MS: Simultaneous U–Pb and U–Th dating on 0.1 Ma Toya Tephra, Japan” by Hisatoshi Ito, J. Volcanol. Geoth. Res., 296, 101–103, 2015.
Harrison, T. M. and McDougall, I.: Investigation of an intrusive contact, northwest Nelson, New Zealand-1. Thermal, chronological and isotopic constraints, Geochim. Cosmochim. Ac., 44, 1985–2003, 1980.
Härtel, B., Jonckheere, R., Wauschkuhn, B., and Ratschbacher, L.: Supplementary material for Härtel, B., Jonkcheere, R., Wauschkuhn, B., Ratschbacher, L.: The closure temperature(s) of zircon Raman dating, Opara, https://doi.org/10.25532/OPARA-103, 2020.
Holland, H. D. and Gottfried, D.: The effect of nuclear radiation on the structure of zircon, Acta Cryst., 8, 291–300, 1955.
Holland, H. D. and Kulp, J. L.: Geologic age from metamict minerals, Science, 111, 312, https://doi.org/10.1126/science.111.2882.312, 1950.
Hueck, M., Dunkl, I., Heller, B., Stipp Basei, M. A., and Siegesmund, S.: (U-Th) He thermochronology and zircon radiation damage in the South American passive margin: thermal overprint of the Paraná LIP?, Tectonics, 37, 4068–4085, 2018.
Hurley, P. M. and Fairbairn, H. W.: Radiation damage in zircon: A possible age method, Geol. Soc. Am., 64, 659–674, 1953.
Johnson, W. A. and Mehl, R. F.: Reaction kinetics in processes of nucleation and growth, Trans. Am. Inst. Min. Metall. Eng., 135, 416–442, 1939.
Jonckheere, R., Heinz, D., Hacker, B. R., Rafaja, D., and Ratschbacher, L.: A borehole investigation of zircon radiation damage annealing, Terra Nova, 31, 263–270, 2019.
Kolesov, B. A., Geiger, C. A., and Armbruster, T.: The dynamic properties of zircon studied by single-crystal X-ray diffraction and Raman spectroscopy, Eur. J. Mineral., 13, 939–948, 2001.
Kolmogorov, A. N.: On the statistical theory of crystallization in metals, Izv. Acad. Nauk SSSR, Math. Ser., 3, 355–359, 1937.
Lakshmanan, C. C. and White, N.: A new distributed activation energy model using Weibull distribution for the representation of complex kinetics, Energ. Fuel., 8, 1158–1167, 1994.
Lakshmanan, C. C., Bennett, M. L., and White, N.: Implications of multiplicity in kinetic parameters to petroleum exploration: distributed activation energy models, Energ. Fuel., 5, 110–117, 1991.
Löcse, F., Linnemann, U., Schneider, G., Merbitz, M., and Rößler, R.: First U-Pb LA-ICP-MS zircon ages assessed from a volcano-sedimentary complex of the mid-European Variscides (Pennsylvanian, Flöha Basin, SE Germany), Int. J. Earth Sci., 108, 713–733, 2019.
Mezger, K. and Krogstad, E. J.: Interpretation of discordant U-Pb zircon ages: An evaluation, J. Metamorph. Geol., 15, 127–140, 1997.
Mialhe, P., Charles, J.P., and Khoury, A.: The thermodynamic compensation law, J. Phys. D, 21, 383–384, 1988.
Murakami, T., Chakoumakos, B. C., Ewing, R. C., Lumpkin, G. R., and Weber, W. J.: Alpha-decay event damage in zircon, Am. Min., 76, 1510–1532, 1991.
Nasdala, L., Irmer, G., and Wolf, D.: The degree of metamictization in zircon: A Raman spectroscopic study, Eur. J. Mineral., 7, 471–478, 1995.
Nasdala, L., Götze, J., Pidgeon, R. T., Kempe, U., and Seifert, T.: Constraining a SHRIMP U-Pb age: micro-scale characterization of zircons from Saxonian Rotliegend rhyolites, Contrib. Mineral. Petrol., 132, 300–306, 1998.
Nasdala L., Wenzel M., Vavra G., Irmer G., and Kober B.: Metamictisation of natural zircon: accumulation versus thermal annealing of radioactivity-induced damage, Contrib. Mineral. Petrol., 141, 125–144, 2001.
Nasdala, L., Irmer, G., and Jonckheere, R.: Radiation damage ages: Practical concept or impractical vision? – Reply to two comments on “Metamictisation of natural zircon accumulation versus thermal annealing of radioactivity-induced damage”, and further discussion, Contrib. Mineral. Petrol., 143, 758–765, 2002.
Nasdala, L., Reiners, P. W., Garver, J. I., Kennedy, A. K., Stern, R. A., Balan, E., and Wirth, R.: Incomplete retention of radiation damage in zircon from Sri Lanka, Am. Mineral., 89, 219–231, 2004.
Nasdala, L. Hanchar, J. M., Kronz, A., and Whitehouse, M. J.: Long-term stability of alpha particle damage in natural zircon, Chem. Geol., 220, 83–103, 2005.
Palenik, C. S., Nasdala, L., and Ewing, R. C.: Radiation damage in zircon, Am. Mineral., 88, 770–781, 2003.
Pidgeon, R. T.: Zircon radiation damage ages, Chem. Geol., 367, 13–22, 2014.
Pidgeon, R. T., Nasdala, L., and Todt, W.: Determination of radiation damage ages on parts of zircon grains by Raman microprobe: Implications for annealing history and U-Pb stability, Mineral. Mag., 62A, 1174–1175, 1998.
Pidgeon, R. T., Merle, R. E., Grange, M. L., Nemchin, A. A., and Whitehouse, M. J.: Annealing of radiation damage in zircons from Apollo 14 impact breccia 14311: Implications for the thermal history of the breccia, Meteorit. Planet. Sci., 51, 155–166, 2016.
Pidgeon, R. T., Merle, R. E., Grange, M. L., and Nemchin, A. A.: Annealing history of zircons from Apollo 14083 and 14303 impact breccias, Meteorit. Planet. Sci., 53, 2632–2643, 2018.
Reiners, P. W., Spell, T. L., Nicolescu, S., and Zanetti, K. A.: Zircon (U-Th) He thermochronometry: He diffusion and comparisons with 40Ar 39Ar dating, Geochim. Cosmochim. Ac., 68, 1857–1887, 2004.
Resentini, A., Andò, S., Garzanti, E., Malusà, M. G., Pastore, G., Vermeesch, P., Chanvry, E., and Dall'Asta, M.: Zircon as a provenance tracer: Coupling Raman spectroscopy and U–Pb geochronology in source-to-sink studies, Chem. Geol., 555, 119828, https://doi.org/10.1016/j.chemgeo.2020.119828, 2020.
Ríos, S., Malcherek, T., Salje, E. K. H., and Domeneghetti, C.: Localized defects in radiation-damaged zircon, Acta Crystallogr. B, 56, 947–952, 2000.
Salje, E. K. H., Chrosch, J., and Ewing, R. C.: Is “metamictization” of zircon a phase transition?, Am. Mineral., 84, 1107–1116, 1999.
Sperner, B., Jonckheere, R., and Pfänder, J. A.: Testing the influence of high-voltage mineral liberation on grain size, shape and yield, and on fission track and 40Ar 39Ar dating, Chem. Geol., 317, 83–95, 2014.
Stearns, M. A., Hacker, B. R., Ratschbacher, L., Rutte, D., and Kylander-Clark, A. R. C.: Titanite petrochronology of the Pamir gneiss domes: Implications for middle to deep crust exhumation and titanite closure to Pb and Zr diffusion, Tectonics, 34, 784–802, 2015.
Tanabe, K. and Hiraishi, J.: Correction of finite slit width effects on Raman line widths, Spectrochim. Acta A, 36, 341–344, 1980.
Tokuda, M., Yoshiasa, A., Kojitani, H., Hashimoto, S., Uehara, S., Mashimo, T., Tobase, T., and Akaogi, M.: The importance of cation-cation repulsion in the zircon-reidite phase transition and radiation-damaged zircon, Mineral. Mag., 83, 1–7, https://doi.org/10.1180/mgm.2019.27, 2019.
Váczi, T. and Nasdala, L.: Electron-beam-induced annealing of natural zircon: a Raman spectroscopic study, Phys. Chem. Minerals, 44, 389–401, 2017.
Weber, W. J.: Alpha-decay-induced amorphization in complex silicate structures, J. Am. Ceram., 76, 1729–1738, 1993.
Zhang, M., Salje, E. K. H., Capitani, G. C., Leroux, H., Clark, A. M., Schlüter, J., and Ewing, R. C.: Annealing of α-decay damage in zircon: A Raman spectroscopic study, J. Phys. Condens. Matter, 12, 3131–3148, 2000a.
Zhang, M., Salje, E. K. H., Farnan, I., Graeme-Barber, A., Daniel, P., Ewing, R. C., Clark, A. M., and Leroux, H.: Metamictization of zircon: Raman spectroscopic study, J. Phys. Condens. Matter, 12, 1915–1925, 2000b.
- Abstract
- Introduction
- Methods and materials
- Results and discussion
- Conclusions
- Appendix A: Closure temperature equations
- Appendix B: Hypothesis for the downshift of ω2
- Data availability
- Author contributions
- Competing interests
- Acknowledgements
- Financial support
- Review statement
- References
- Supplement