the Creative Commons Attribution 4.0 License.
the Creative Commons Attribution 4.0 License.
 | 01 Jun 2021
Technical note: Analytical protocols and performance for apatite and zircon (U–Th) ∕ He analysis on quadrupole and magnetic sector mass spectrometer systems between 2007 and 2020
Cécile Gautheron
Rosella Pinna-Jamme
Alexis Derycke
Floriane Ahadi
Caroline Sanchez
Frédéric Haurine
Gael Monvoisin
Damien Barbosa
Guillaume Delpech
Joseph Maltese
Philippe Sarda
Laurent Tassan-Got
Apatite and zircon (U–Th) He thermochronological data are obtained through a combination of crystal selection, He content measurement by crystal heating with analysis using noble gas mass spectrometry, and measurement of U, Th, and Sm contents by crystal dissolution as well as solution analysis using inductively coupled plasma mass spectrometry (ICP-MS). This contribution documents the methods for helium thermochronology used at the GEOPS laboratory, Paris-Saclay University, between 2007 and the present that allow apatite and zircon (U–Th) He data to be obtained with precision. More specifically, we show that the He content can be determined with precision (at 5 %) and accuracy using a calibration of the He sensitivity based on the Durango apatite, and its use also appears crucial to check for He and U–Th–Sm analytical problems. The Durango apatite used as a standard is therefore a suitable mineral to perform precise He calibration and yields (U–Th) He ages of 31.1 ± 1.4 Ma with an analytical error of less than 5 % (1σ). The (U–Th) He ages for the Fish Canyon Tuff zircon standard yield a dispersion of about 9 % (1σ) with a mean age of 27.0 ± 2.6 Ma, which is comparable to other laboratories. For the long-term quality control of the (U–Th) He data, attention is paid to evaluating the drift of He sensitivity and blanks through time as well as that of (U–Th) He ages and Th U ratios (with Sm Th when possible), all relying on the use of Durango apatite and Fish Canyon Tuff zircon as standards.
- Article
(4164 KB) - Full-text XML
-
Supplement
(24434 KB) - BibTeX
- EndNote


Apatite and zircon (U–Th) He thermochronology (AHe and ZHe, respectively) is now a mainstream tool to reconstruct the Earth's evolution through the history of cooling and exhumation over the first dozen of kilometers of the Earth's crust (e.g., Farley, 2000, 2002; Gautheron and Zeitler, 2020; Reiners, 2005; Reiners and Brandon, 2006). The geological implications of these data rely on the precision of measurements of He, U, Th, and Sm contents of apatite and zircon crystals by (i) crystal picking and the accuracy of the alpha-ejection correction though crystal shape measurement; (ii) non-destructive He degassing and abundance determination by mass spectrometry; and (iii) U, Th, and Sm analysis after crystal dissolution and solution analysis by inductively coupled mass spectrometry (ICP-MS) as well as on knowledge of He diffusion. Different contributions have already presented parts of the analytical protocols, for example, for crystal dimensions measurements (e.g., Cooperdock et al., 2019; Glotzbach et al., 2019; Herman et al., 2007), He degassing using a laser beam (e.g., Foeken et al., 2006; House et al., 2000), dissolution and analysis of U, Th, Sm, Ca, or Zr (e.g., Evans et al., 2005; Guenthner et al., 2016; Reiners and Nicolescu, 2007), and improvements of noble gas analysis by magnetic sector mass spectrometry (Burnard and Farley, 2000). In addition, several contributions have also been dedicated to the determination of He diffusion in apatite and zircon (e.g., Farley, 2000; Flowers et al., 2009; Gautheron et al., 2009, 2020; Gerin et al., 2017; Guenthner et al., 2013; Goldsmith et al., 2020; Shuster et al., 2006).
In this contribution, we present all the methodologies that have been developed and used in the GEOPS laboratory, Paris-Saclay University, for more than a decade, focusing on the He degassing process and He content analysis, acid digestion, U and Th (Sm and Ca for apatite) analysis by ICP-MS, and data reduction, which all lead to (U–Th) He thermochronological data. The detailed protocols represent one method among many others, and this technical note has no other purpose than to present them. Specifically, analytical details are given on two built-in-house noble gas extraction–purification lines, one coupled to a quadrupole mass spectrometer and the other to a magnetic sector mass spectrometer. An efficient method of He content calibration using fragments of the Durango apatite standard is presented. Finally, (U–Th) He data obtained for 6 to 8 months in the laboratory for Durango apatite and Fish Canyon Tuff (FCT) zircon are presented. The wealth of data, i.e., 272 apatite and 57 zircon measurements, allows us to gain new insights on data acquisition, analytical difficulties, and the reproducibility of He, U, and Th (Sm for apatite) contents as well as (U–Th) He data.
2.1 Apatite and zircon (U–Th) He thermochronological methods
The (U–Th) He thermochronological method is based on the accumulation within the crystal structure of 4He atoms produced by the decay of 238U, 235U, 232Th, and 147Sm to alpha particles that become 4He atoms, and it exploits temperature-dependent 4He diffusion through a crystal lattice. Because the Sm contribution to the He budget is limited, this method is referred to as (U–Th) He, with (U–Th–Sm) He used more recently for phases with measurable Sm content (Ault et al., 2019). Specifically, for apatite and zircon, He is well retained within the crystal structure with a temperature sensitivity of ∼ 40–120 and ∼ 20–200 ∘C, respectively (see the recent review of Ault et al., 2019, for details about the complexity of He retention). Upon alpha decay, the alpha particle is emitted with an important kinetic energy, thus traveling along ∼ 5 to 30 µm before stopping or being ejected from the crystal (Farley et al., 1996; Ziegler, 2008). Apatite and zircon (U–Th) He ages thus require an alpha-ejection correction for disintegrations that happen close to crystal margins (Farley et al., 1996). Apatite and zircon (U–Th) He dating methods then possess specificity in demanding careful extraction of crystals from plutonic, volcanic, or sedimentary rocks using crushing, mineral separation, and crystal selection before He, U, Th, and Sm analyses. Only suitable apatite and zircon crystals should be selected for (U–Th) He dating; then crystal size and geometry should be measured and recorded in order to correct the alpha loss by ejection.
In this technical note, we are focusing on the protocols developed over more than 10 years at the GEOPS laboratory, Paris-Saclay University, and more specifically on He, U, Th, and Sm content determinations, while some details of the scheme used for apatite and zircon preparation and selection are also given. Contributions that have investigated the impact on (U–Th) He dating of crystal quality selection, as well as the size and shape of selected crystals, are an important source for those particular points (e.g., Farley, 2002; Brown et al., 2013; Gautheron et al., 2012; Reiners and Farley, 2001; Reiners, 2005).
2.2 Apatite and zircon sample preparation, picking, and packing
Apatite and zircon crystals are extracted from rocks by classical crushing methods, sieved (mesh < 400 µm), and separated following density (tribromomethane and di-iodomethane – VWR®) and magnetic methods (L-1 Frantz Isodynamic® Separator). Mineral separation can also be performed using other less toxic alternatives such as lithium heteropolytungstate, also known as LST. For the Durango apatite gem crystal, a gentle crushing in an agate mortar allows us to obtain fragments of different sizes. Inclusion-free automorphic apatite and zircons or Durango apatite fragments are picked under a binocular microscope (SZX12 – Olympus®) and selected as a function of fragment size (> 60 µm). For an automorphic crystal, the length, height, and width are measured, and the termination geometry of the crystal (broken faces, pyramids, no pyramids) is recorded. The ejection factor (FT) and equivalent sphere radius (Rs, also called ESR) are determined using the Monte Carlo simulation of Gautheron and Tassan-Got (2010), Gautheron et al. (2012), and Ketcham et al. (2011). As the ejection length for the Th decay chain is higher than that for the U decay chain, the value of Th U ratio is fixed to the measured value to avoid overcorrections or under-corrections (Ketcham et al., 2011; Ziegler, 2008). An internal modification of the Monte Carlo simulation (Qt_LFT software), coupled with an Excel® automatic file generation, is used to calculate the FT, Rs, and crystal weight from a list of different crystal geometries. The Qt_LFT software is available and added as a Supplement to this technical note.
Each apatite and zircon crystal or fragment is respectively placed into a platinum tube (99.95 % purity, 1.0 × 1.0 mm – Johnson Matthey®) or a niobium tube (purity 99.95 %, 1.0 × 1.0 mm – Alfa Aesar®). The choice of the capsule metal (Nb, Pt) for packaging is strictly related to the acid attack protocol. During U, Th, and Sm analysis by means of ICP-MS instruments, the presence of Pt+ ions at high concentration (> 320 µg mL−1) in the sample solution may lead to the formation of the complex platinum argides 194Pt40Ar+, 195Pt40Ar+, and 198Pt40Ar+, which cause isobaric interferences with the measured U isotopes at masses 234, 235, and 238 (Evans et al., 2005; Reiners and Nicolescu, 2007). Apatite chemical digestion can be achieved using acid digestion at low concentration (HNO3 5N ultrapure) and low temperature (65 ∘C), which is not able to dissolve the capsule; therefore, Pt tubes can be used. However, an acid digestion using concentrated acids (HCl and pure HF 27N) at high temperature (220 ∘C) is instead used for zircon, which leads to a total dissolution of the Pt capsule. Therefore, Nb tubes were adopted for zircon. Although niobium–argon complexes do not create isobaric interferences with the analyzed U masses, the solution, which is highly concentrated in Nb, may cause a partial precipitation of uranium and thorium (Evans et al., 2005). The Nb impact on the U and Th content determination will be discussed in detail in Sect. 3.3.
2.3 Helium analysis protocol
The helium content analyses were performed at the GEOPS laboratory, Paris-Saclay University (Orsay, France). Each capsule containing a crystal, fragments, or grain(s) was degassed using either a built-in-house He extraction line coupled with a quadrupole mass spectrometer (Prisma QMG 100 Pfeiffer®), further referred to as the quad line, or another built-in-house line connected to a rehabilitated VG5400® magnetic sector mass spectrometer, further referred to as the VG line. The quad and VG lines are fully automated using LabView® software from the heating phase to the helium analysis. Each portion of the line is divided into sections (extraction, purification, analysis) by pneumatic Swagelok® valves coupled to electro-valves (E.V 3/2 NF Direct Flasque.D2,4 ALU BUNA, TH France®) and activated by pressurized air. Ultrahigh-vacuum conditions (pressure < 10−9 mbar) are guaranteed by using a combination of turbomolecular (HighCube – Pfeiffer®) and ionic pumps (StarCell – Varian®). Figure 1 presents the schematic geometry of the two built-in-house quad and VG lines, with their different parts that are controlled using LabView®.

Figure 1Schematic representation of the built-in-house systems for He extraction, purification, and analysis by a mass spectrometer: (a) quad line and (b) VG line. The part with the He diffusion cell in panel (b) is not used in this study.
Platinum and niobium tubes adopted for sample packaging are suitable because of the low level of hydrogen they release under high vacuum, their malleability, and their U, Th, Sm, and rare Earth element (REE) purity requiring no pre-etching. In addition, being metallic materials, they ensure a homogeneous heat transfer during laser shooting. For the quad line, the Pt–Nb tubes are deposited on a copper planchette having 25 or 49 positions, whereas, for the VG line, the tubes are placed on a stainless-steel (inox) or a copper planchette with 12 or 49 positions. Copper or inox was selected for the planchette material due to their good thermal conductivity and their inertia in vacuum conditions. After each sample loading, the line (quad or VG) is heated overnight at low temperature (< 50 ∘C) using heating tapes to remove any gas adsorbed on their inner walls.
Table 1Sample packing as well as He purification and analysis protocols.
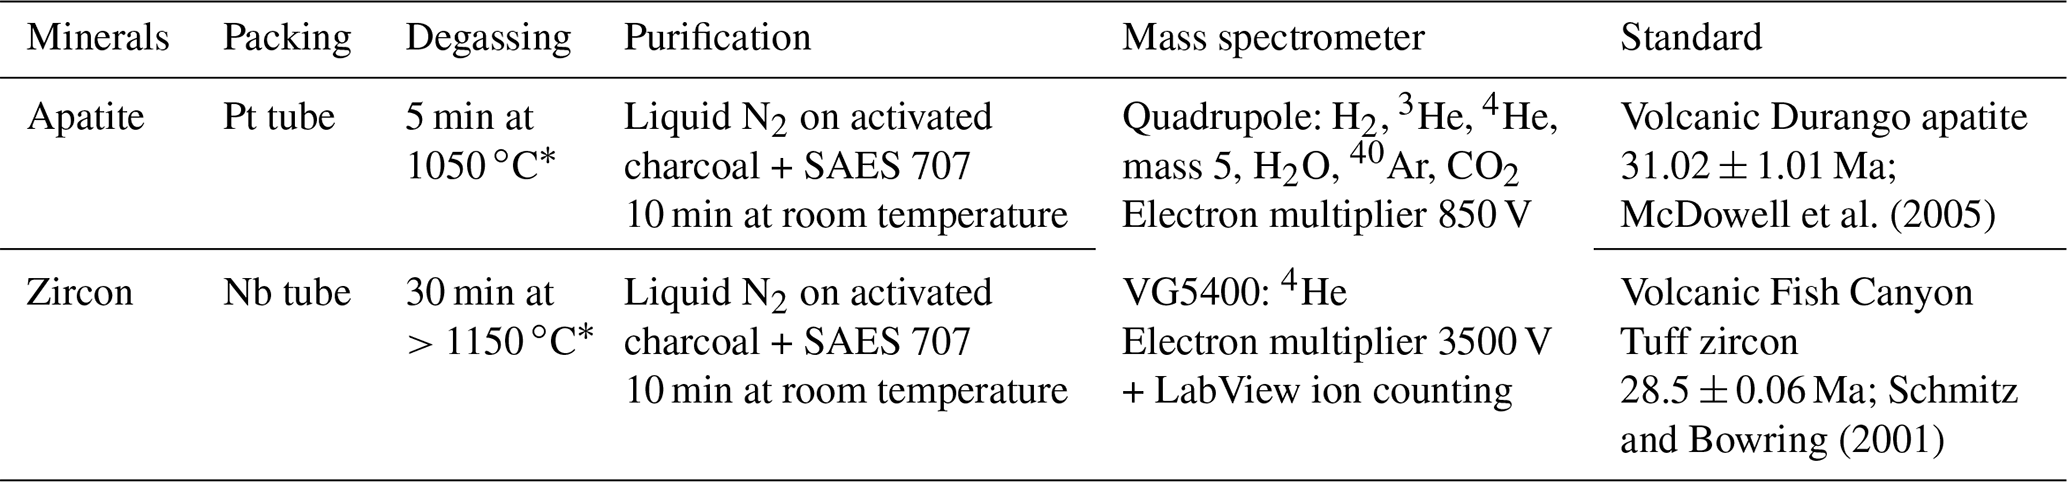
∗ Apatite and zircon can be heated at different temperatures and with different time lengths, especially zircon, which should be heated at higher temperature. Equations established by Fechtig and Kalbitzer (1966) can be used to calculate the minimal time for a given temperature that should be used to ensure complete He degassing, knowing the He diffusion coefficient. It is, however, important not to heat apatite crystals at a temperature that is too high to avoid any issues with U or Th volatilization.
For the quad line, the planchette is placed into a cell that moves under the laser beam using an X–Y motor system (SMC100CC – Newport®) controlled by LabView®. A ytterbium-doped infrared (IR) diode laser (wavelength 1064–1080 nm, power 10 W, Manlight® – Laser2000®), coupled with an optic system placed at a focal distance of 4 cm from the sample, allows heating up the capsules with a beam of ∼ 70 µm diameter. For the VG line, the heating of the tubes is ensured by an infrared Fusions Diode Teledyne® laser moving above the cell, and ultrahigh vacuum can quickly be obtained by heating an empty capsule purposely placed on the copper–inox planchette with the IR laser to remove air adsorbed on it. In both cases, the cell is sealed with a CF63 sapphire window (Caburn®), allowing good transmission of the whole IR laser beam but low He exchange. Each capsule is heated using the heating protocol summarized in Table 1.
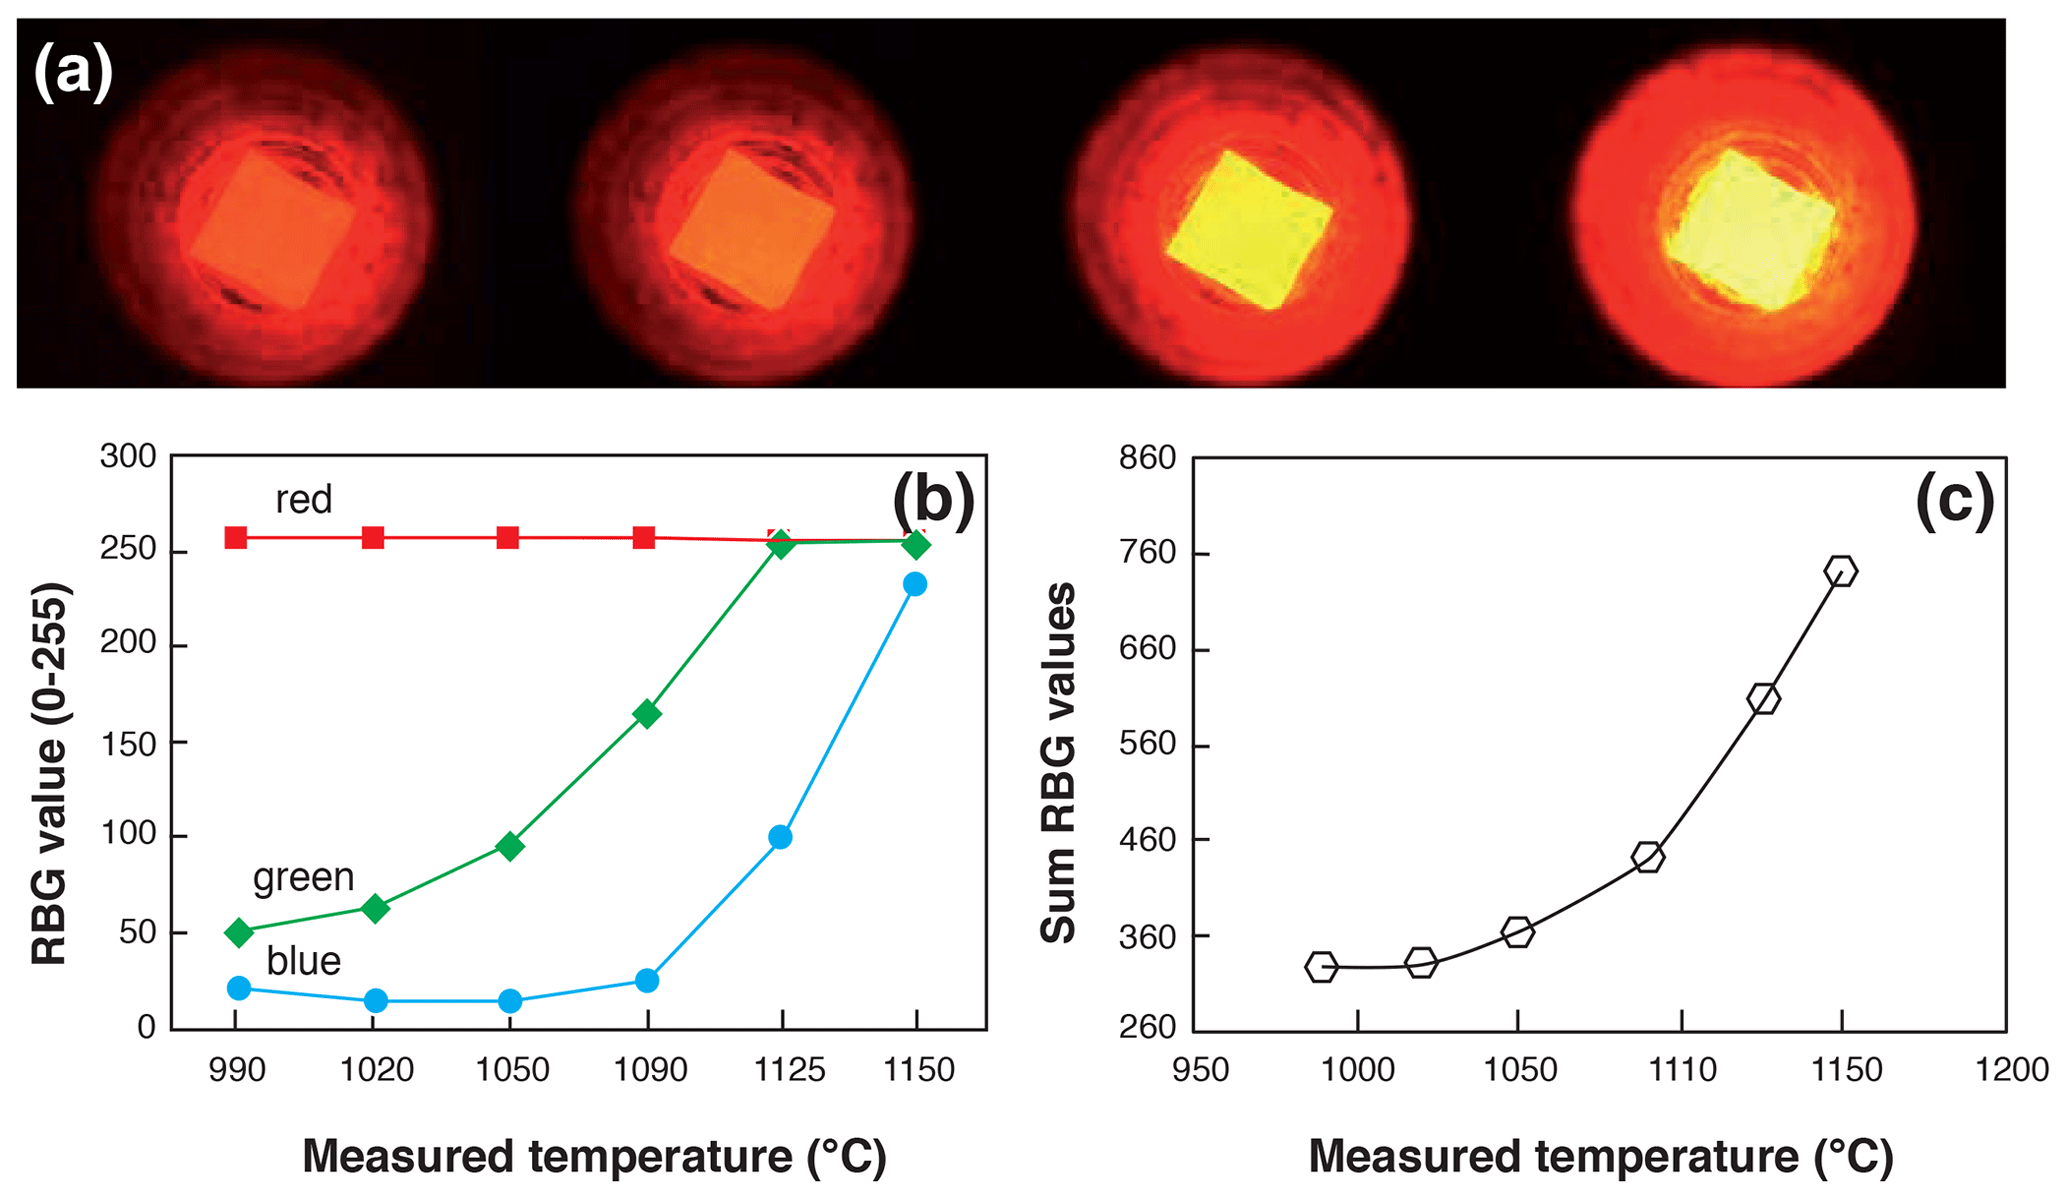
Figure 2Temperature calibration procedure of a heated Pt capsule in visible light. (a) Example of capsules heated with different laser beam intensities showing the change in color. (b, c) Evolution, as a function of the temperature measured using a pyrometer, of the RBG code values and their sum, respectively.
The heating schedule procedure is repeated on each sample until all 4He is degassed, giving a signal back to the background level within less than 2 %. The sample temperature achieved using the laser of the quad line is recorded by means of a LabView® camera and a built-in-house algorithm that converts the total red, green, and blue visible light into a temperature. We use the visible light emission part of the black-body light emission during heating. To this aim, a Pt capsule was heated with increasing values of laser intensity and pictures were taken at different temperatures, as presented in Fig. 2a. At the same time, the temperature of the heated capsule was measured using an external filament extinction pyrometer. This type of pyrometer is currently used to calibrate thermal ionization mass spectrometer (TIMS) filament temperatures. For each recorded picture, a simple image treatment has been realized using LabView® to retrieve the red, blue, and green value on a red–blue–green (RBG) colorimetric coding system that ranges from 0 to 255 (Fig. 2b). As the red signal is already saturated when the capsule is emitting visible light, we chose to sum the signals of the three colors, as shown in Fig. 2c. The obtained RBG sum is correlated with the temperature of the heated capsule. This simple image treatment procedure has been calibrated from 950 to 1150 ∘C for a fixed value of the exposure time of 500 ms. The same image treatment has been automatically applied to each heated capsule, allowing us to retrieve temperature with an estimated error of ±20 ∘C on temperature calculation.
The protocol has been designed for the purpose of degassing apatite crystals or fragments that are packed in a Pt tube; the chosen heating time and temperature schedule should permit us to retrieve all the He from apatite during the first degassing step, as predicted using the mean diffusion coefficient of Farley (2000) for Durango apatite. If the unknown apatite is pure and presents a diffusion coefficient similar to the Durango apatite, the He content of the second step should be similar to background. This protocol thus allows us to detect any He retentive mineral inclusion (e.g., titanite, zircon) that was not seen on picking and contributes to the He budget (Farley, 2002). It can also be used to monitor the impact of radiation damage on the retentiveness of an apatite crystal. For zircon, as mineral inclusions are not an issue for (U–Th) He age interpretation, we simply heat the Nb capsule at a temperature close to image color saturation (∼ 1150 ∘C; Fig. 2) and avoid any overheating problems such as capsule melting. Because Pt and Nb have different emissivity values, the temperature calibration is not totally adapted to Nb. Indeed, the color visible for a given temperature is not the same for Nb and Pt capsules, and the real temperature of an Nb capsule should slightly differ from that displayed. Nevertheless, the zircon crystals can be heated until total He degassing, and neither the poor determination of heating temperature nor the different emissivity values are an issue.
The analysis protocols differ as a function of the type of mass spectrometer used and the type of analyzed minerals.
2.3.1 Quad line
The diffused 4He gas is mixed in the purification line with a known amount of 3He, which is used as a spike, in concentration of about 100 to 1000 times higher than the 4He to be determined. A ∼ 4000 cm3 (cubic centimeter) cylinder (V1), filled by 3He gas, is connected to a pipette made by two welded valves with a small, 5 mm diameter, stainless-steel cylinder placed inside to reduce the volume of the pipette (Fig. 1). The approximate volume of the pipette is ∼ 0.5 cm3 (V2) and allows an 3He amount of 10−9 to 10−10 ccSTP (cubic centimeters at standard temperature and pressure) (∼ 4 × 10⁻¹⁴ to ∼ 4 × 10⁻¹⁵ mol) to be introduced into the line. The amount of 3He decreases in the cylinder by a factor of ∼ 0.9999 () for every shot of gas extracted; therefore, the number of pipettes taken is automatically recorded to take the decrease in 3He in the cylinder into account. These statistics allow the data for He age computation to be calculated with the right amount of 3He spike introduced into the line (see also below). According to the spike conditions reported above (3He in concentration of about 100 to 1000 times higher than 4He), it has been observed that the quad line can perform a total of about 6000 analyses, after which the 3He gas tank is refilled using a 1 L tank filled with 3He (99.5 % – Eurisotop®) at 1 bar.
The sample gas is purified from most of the H2O, CO2, H2, and Ar gases using two liquid nitrogen-cooled traps of activated charcoal, an St707 SAES® getter operated at room temperature, according to different purification protocols adapted for various minerals (Table 1). The use of a hot (> 850 ∘C) titanium sponge getter (3–13 mm, 99.95 % metal basis – Alfa Aesar®) is dedicated to minerals with high CO2 or H2O contents. The access to the entire system of traps, individually connected to the line by means of ultrahigh-vacuum valves (Fig. 1), allows the analysis of a large variety of minerals containing variable abundances of CO2 or H2O, such as calcite or goethite (Allard et al., 2018; Cros et al., 2014). Besides helium isotopes (3He and 4He), H2O, CO2, H2, and Ar gases are additionally measured on the electron multiplier of the Prisma QMG 100 Pfeiffer® quadrupole mass spectrometer to check for the effective purification of the analyzed gas. Such measurements of the gas are repeated 16 times, and a linear regression of the data for the 4He 3He ratio is then calculated and includes a correction of the HD+ isobaric contribution to the 3He signal, even if this contribution is insignificant compared to the 3He spike signal. In addition, we also observe that the signal at mass 4 slightly increases when the H2 signal is higher, which we interpret as either a double H2 molecule having an isobaric impact on mass 4 or the tail of the H2 peak having an influence on the shape of the mass 4 peak. This effect is not negligible for the low 4He signals of typical samples, but an adapted H2 purification protocol allows us to remove this effect: an St701 SAES® getter unit is positioned just ahead of the quadrupole mass spectrometer (Fig. 1). A longer gettering time could be offered as a suitable alternative to reduce the H2 influence on the 4He peak if the addition of a getter to the mass spectrometer is impossible.
The gas purification protocol, combined with 3He spiking, ensures a close-to-constant total pressure in the line and in the quadrupole mass spectrometer. The 4He abundance is calculated from the introduced 3He amount as
with (4He 3He)s and (4He 3He)b being the isotopic ratios measured for the sample and blank, respectively. The 3He amount is determined from the calibrated value, denoted 3Hec, the two volume values (V1 and V2), and two evolution parameters (N and D) using the following equation:
where V1 is the volume of the 3He cylinder (∼ 4000 cm3), V2 the pipette volume (∼ 0.5 cm3), N the pipette number (i.e., N is the number of introductions of the pipette volume), and D the “drift”, an additional parameter introduced to account for the evolution of the sensitivity of the quadrupole mass spectrometer along with external parameters such as temperature or even power failures. Both parameters 3Hec and D are obtained empirically by calibration from several analyses of Durango apatite fragments. D acts as if the pipette volume V2 could vary to mimic the variations of the quadrupole sensitivity and is updated manually according to the results of the Durango standard, which is analyzed regularly, especially every time the source is tuned again. The product thus decreases regularly and homogeneously.
2.3.2 VG line
The diffused 4He is purified from the H2O, CO2, H2, and Ar gases using two St707 SAES® getters and a Ti sponge getter (Fig. 1b). A cryogenic trap from Advanced Research Systems® (ARS), installed more recently, has the capacity to cool activated charcoal down to 8 K. At this temperature, He is efficiently trapped, then further released into a smaller volume at about 50 K. Again, according to the nature of the sample to be analyzed, different purification protocols are adopted (Table 1). Every protocol is fully automatized, and the 4He gas is introduced into the VG5400® magnetic sector mass spectrometer. The filament amperage is chosen to obtain a compromising value for the trap current of 300 to 400 µamps, which is lower than the recommended value for He analysis but ensures a longer lifetime of the filament. Isotope 4He is analyzed by ion counting using a Pfeiffer® electron multiplier (17 dynodes) connected to an Ortec® discriminator and a LabView® counting card. A total of 20 analyses of the 4He signal integrated over 1 s are performed, and the mean 4He signal is recorded (while a linear regression is available, only the mean signal and associated standard deviation are recorded). The dead time of the electronic chain is close to the width of the pulse delivered by the electron multiplier, which is a few nanoseconds. The maximal recorded counting rate being about 3 × 10⁵ cps (counts per second), the dead time correction is always lower than 1 % and is neglected. The system sensitivity is empirically determined from 4He analyses of the Durango standard (see Sect. 3.2), while the internal 4He standard from a ∼ 4000 cm3 cylinder is only used to check for sensitivity change over time and signal reproducibility. The 4He abundance in a sample is computed using
where 4Hes and 4Heb are the signals measured for the sample and blank, respectively, and S is sensitivity in ccSTP He cps−1. The unit ccSTP is not the SI unit for the amount of a substance, but it is a way of expressing gas moles by the volume (cubic centimeter) they would occupy at the standard temperature of 273.15 K = 0 ∘C and the standard pressure of 101 325 Pa = 1 atm. This definition does not follow the 1 bar pressure 1982 IUPAC recommendation but is historically used by the noble gas community. We thus keep this definition of standard pressure and temperature conditions, STP, with 1 mol occupying 22 414 ccSTP.
Durango apatite fragments and/or Fish Canyon Tuff zircon crystals are analyzed regularly (one Durango or Fish Canyon standard analyzed every seven unknown samples) to check the (U–Th) He analysis reproducibility.
2.4 Digestion chemistry protocol
2.4.1 Vessel cleaning
For apatite, we used single-use 4 mL polypropylene (PP) snap-cap tubes (supplier VWR®) that do not need prewashing for our purpose (Table 2).
Table 2Cleaning chemistry and chemistry protocols for prepared solution.
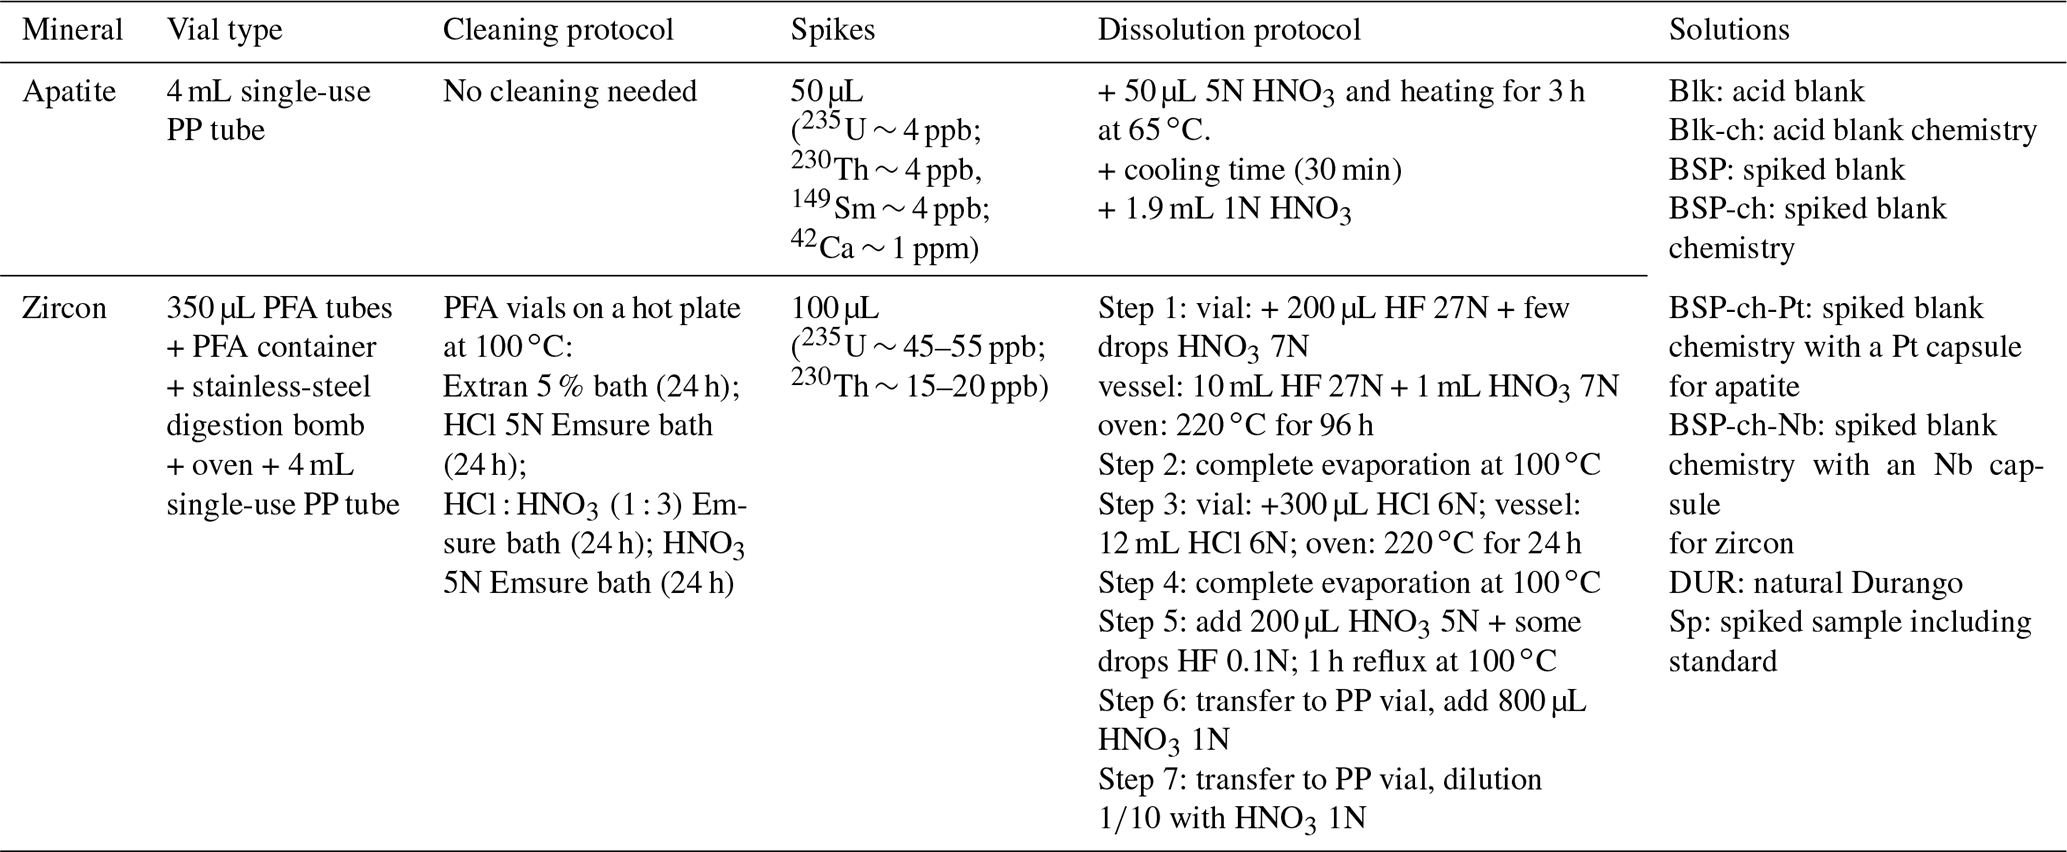
For zircon, the dissolution is made in 350 µL PFA (perfluoroalkoxy Teflon®) Parrish-style vials (Savillex®) placed into a high-pressure–high-temperature dual-wall digestion vessel. Before their use for acid digestion of samples, the vials undergo a series of acid baths in a 250 mL beaker (borosilicate glass – VWR®) placed on a hot plate at 100 ∘C, according to the following sequence. Cycle 1: 24 h bath in diluted 5 % Extran® MA 02 (Merck®) in Milli-Q® water (Milli-Q® HX 7000 SD); cycle 2: 24 h bath in HCl 5N (Emsure® 32 % VWR®); cycle 3: 24 h bath in HCl HNO3 3 1 (HCl Emsure® 32 % VWR®; HNO3 Emsure® for analysis 65 % VWR®); cycle 4: 24 h bath in HNO3 5N (Emsure® 65 % VWR®). Between each bath, vials are rinsed with Milli-Q® water (18 MΩ Direct 8 System – Merck® Millipore®). Vials are finally dried in an oven at 50 ∘C and stored in a hermetically closed PP box until further use (Table 2).
To check their degree of cleanness after the series of cleaning baths, cleaned vials are filled with 200 µL Milli-Q® water and refluxed for 2 h at 100 ∘C; this water is transferred to PP tubes with the addition of 800 µL Milli-Q® water for analysis by ICP-MS of 238U and 232Th natural isotopes as well as spike isotopes 230Th and 235U.
2.4.2 Spike solution composition and calibration
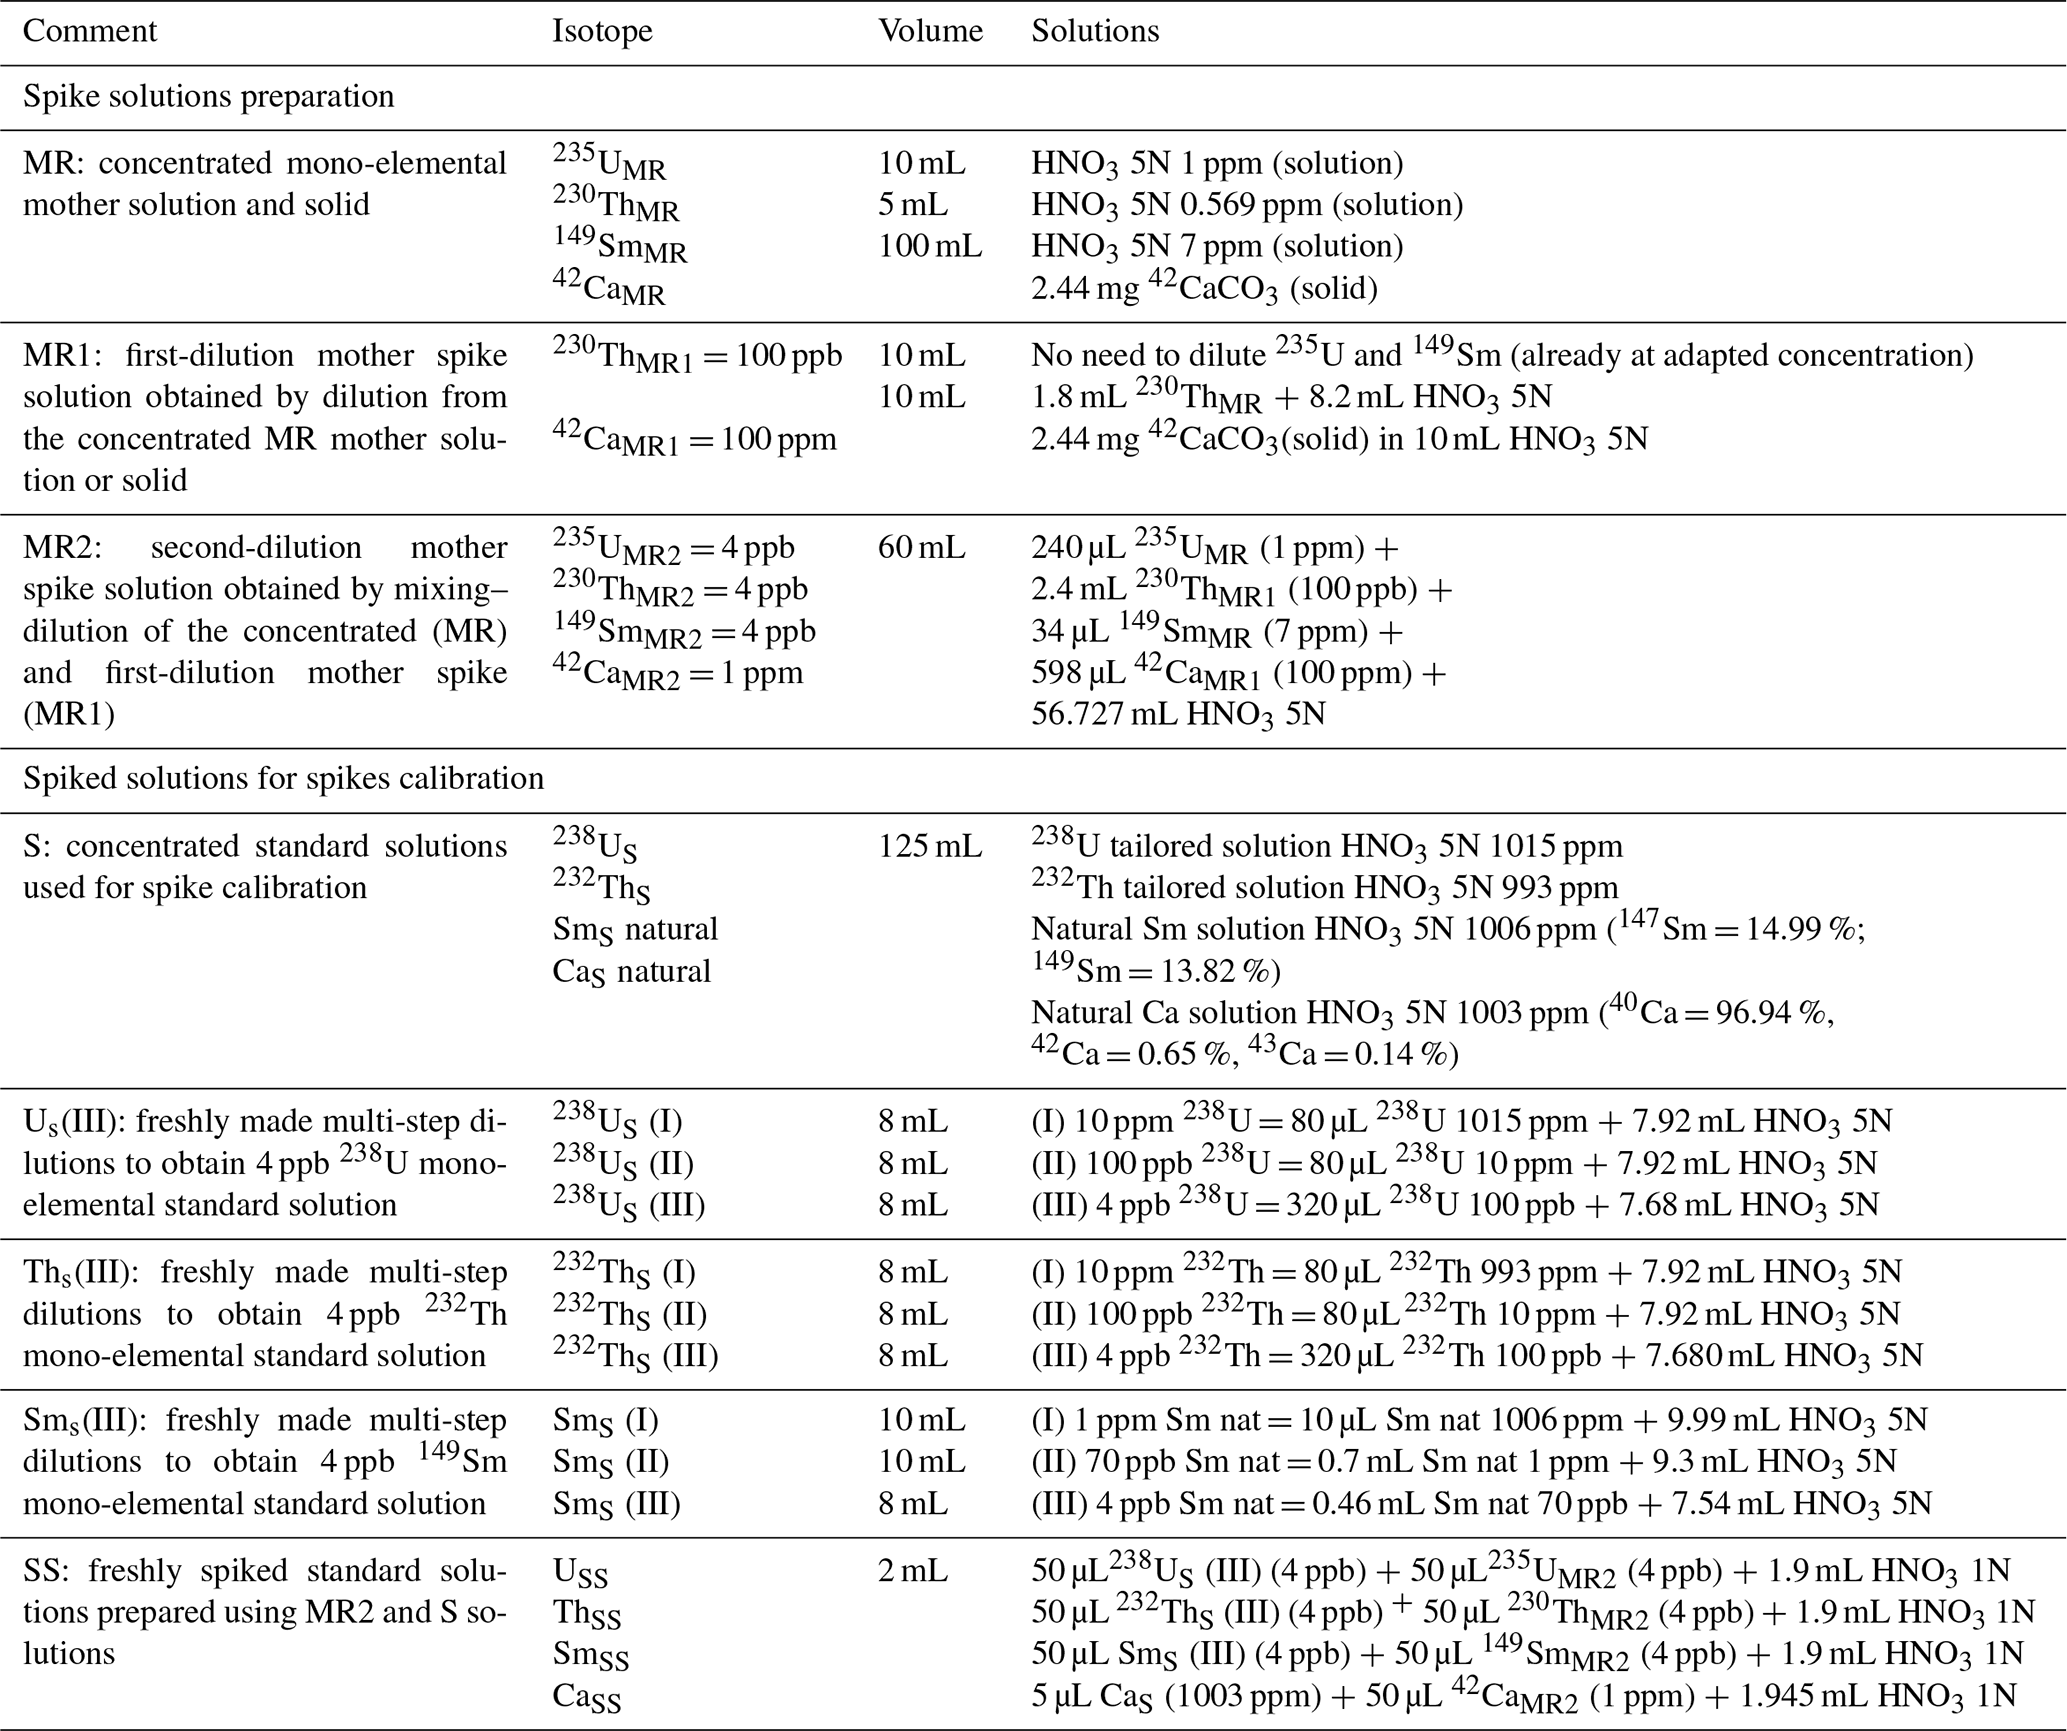
According to the isotopic dilution method, for every apatite sample to be analyzed, a volume of 50 µL of spike (solution MR2) is introduced into the vial before the dissolution protocol (100 µL for zircon). This spike solution is prepared (60 mL) every 6 to 12 months from elemental mother solutions MR1 and MR (Appendix A, Table A1), these being obtained from certified concentrated mono-elemental solutions: for MR, we mix 235U (10 mL, IRRM-50, 4.2543(11) nmol 235U g−1, EU JRC – Belgium), 230Th (5 mL, IRRM-61, 2.474(18) nmol 230Th g−1, EU JRC – Belgium), and 149Sm (100 mL, 7 ppm, 90 %, 47.01 nmol 149Sm g−1, Berry and Assoc® – MI, USA). For apatite analysis, 42Ca (2.44 mg solid 42CaCO3, 97.8 %, BuyIsotope® – Sweden) is added. Detention of EU JRC materials is authorized under laboratory license for radioactive materials (RMs). Other isotopes, such as 233U or 229Th, are also available as isotopic spikes at JRC; however, their high cost due to radioactive nuclear material transport fees is not negligible. For this reason, we chose to use isotopes 235U and 230Th. In more than 10 years of research at the GEOPS laboratory, 16 solutions of spike for apatite and three solutions of spike for zircon have been produced. Since the early development of the (U–Th) He dating method at GEOPS, isotopes other than 235U and 230Th have recently been added to the protocol, namely 149Sm and 42Ca. For zircon, the addition of the isotope 149Sm to the spike solution was discarded due to the negligible impact of 147Sm decay on the He budget compared to the He production from 238U and 232Th.
Before use, the spike solution MR2 is calibrated for U, Th, Sm, and Ca using a series of weighted solutions, each of them obtained by mixing a volume of another mono-elemental standard solution with a volume of the spike MR2 (Appendix A, Table A1): the USS solution contains a 238U mono-elemental solution at 1015 ppm (99.96 %, Analab® France), diluted and mixed with the 235U spike; the ThSS solution contains a 232Th mono-elemental solution at 993 ppm (99.93 %, Analab® France), diluted and mixed with the 230Th spike; the SmSS solution contains a natural Sm solution at 1006 ppm (147Sm = 14.99 %, 149Sm = 13.82 %, Analab® France), diluted and mixed with the 149Sm spike; and the CaSS solution contains a natural Ca solution at 1003 ppm (42Ca = 0.65 %, 43Ca = 0.13 %, Analab® France) mixed with the 42Ca spike. These solutions are then analyzed by ICP-MS to properly calibrate the MR2 spike solution.
2.4.3 Sample digestion protocol
After degassing, each Pt–Nb-conditioned sample is transferred from the planchette into a vial for grain dissolution by acid digestion. Sample digestion is started by adding a volume of 50 µL for apatite (or 100 µL for zircon) of a spike solution into each vial (in HNO3 5N and containing a known amount of 235U and 230Th, plus addition of 149Sm and 42Ca for apatite). According to the nature of the sample, a specific dissolution protocol is followed (acids and heating temperature) (Table 2).
For apatite, the dissolution protocol (Table 2) was adapted from Farley (2002). Dissolution requires a soft acid digestion (HNO3 5N – bidistilled from HNO3 65 – Normapur® – VWR®) performed in a 4 mL single-use polypropylene tube (VWR®) by adding 50 µL of spike (∼ 4 ppb of 235U, 230Th, 149Sm, and ∼ 1 ppm 42Ca) and 50 µL of HNO3 5N. The tube is then placed on a hot plate at 65 ∘C during 3 h for digestion. After digestion and cooling, samples are diluted with 1.9 mL of HNO3 1N and stored at 4 ∘C before ICP-MS analysis (Table 2). Due to the digestion conditions (using diluted acids), the Pt capsule does not dissolve and does not interfere with ICP-MS analysis. Sample digestion is always made with nitric acid, freshly diluted by addition of Milli-Q® water. To minimize possible contamination sources from the environment, storing tubes, or evaporation of the solutions, ICP-MS analysis is scheduled within a few days of sample digestion. After analysis, the Pt capsules are promptly collected, cleaned, and sent back to the manufacturing company according to a recycling or reselling loop contract.
For zircon, the dissolution protocol was slightly adapted from Reiners (2005) and Reiners and Nicolescu (2007). The dissolution is performed in 350 µL PFA Parrish-style vials (Savillex®). Zircons are first spiked with 100 µL of 235U and 230Th (∼ 45 to ∼ 55 ppb of 235U, ∼ 15 to ∼ 20 ppb of 230Th; Table 2). The vials are then placed into a digestion vessel hermetically sealed with a metallic gasket to hold high pressures (IN/PFA-OUT/stainless-steel PA4748, Parr Instrument Company®). The digestion follows several steps summarized in Table 2. Step 1: inside the vials, add 200 µL HF 27N (Suprapur® – VWR®) and a few drops of HNO3 7N (Suprapur® – VWR®); inside the digestion vessel, add 10 mL HF 27N and 1 mL of HNO3 7N. Once sealed, the vessel is heated up at 220 ∘C in an oven and held at high pressure for 96 h. Step 2: the acid solution is evaporated to dryness by placing the vials on a hot plate at 100 ∘C. Step 3: 300 µL HCl 6N (Suprapur® – VWR®) is added to each vial; the Parr vessel is filled with 12 mL HCl 6N, sealed, and heated back at 220 ∘C under pressure for 24 h in an oven. Step 4: the vials are evaporated to dryness on a hot plate at 100 ∘C. Step 5: a reflux is carried out with a combination of HNO3 5N (200 µL) and HF 0.1 N (a few drops) at 100 ∘C for 1 h. Step 6: the solutions are transferred to 4 mL polypropylene tubes where 800 µL HNO3 1N is added. Step 7: a final dilution () is done with freshly prepared HNO3 1N in a second 4 mL PP single-use tube. The solutions are then stored at 4 ∘C before isotopic analysis. To avoid pollution released from the storage tubes or changes in concentration by evaporation of the solutions, the ICP-MS session is always scheduled within a few days after sample dissolution.
In addition to the apatite and zircon samples, the following types of solution are also prepared, as summarized in Table 2: spiked sample (Sp), including Durango and FCT standards; acid blank (Blk) to check acid purity and potential contaminations of tubes; chemistry acid blank (Blk-ch) to check the enrichment contamination in acid caused by the chemistry protocol; spiked blank (BSP) with a weighted volume of spike added to a volume of acid in order to check the variations in concentration of the spike and to take the contribution of natural isotopes contained in the spike into account; spiked blank chemistry (BSP-ch) with a volume of spike in acid undergoing the same dissolution protocol than the samples, which allows us to quantify contamination coming from contingencies during the dissolution protocol (vessel, user, acid); Durango solution (DUR) with a single fragment of Durango dissolved in a volume of acid and no spike added, which allows the natural isotopic ratio of uranium to be measured for checking, as it has to be in isotopic equilibrium with 238U 235U = 137.88 (or 235U 238U = 0.00725268).
2.5 U and Th (Sm and Ca) analysis by ICP-MS
The solutions obtained by chemical dissolution of the samples are then analyzed by ICP-MS to determine the U, Th, and Sm (Ca for apatite) signal intensities. Since 2016, we have mainly used a high-resolution inductively coupled plasma mass spectrometer (HR-ICP-MS – ELEMENT XR® from Thermo Scientific®) at the GEOPS laboratory that allows the U, Th, and Sm isotopes to be measured at low resolution (300), while Ca is measured at high resolution (10 000). In addition, we also use a quadrupole ICP-QMS series II CCT Thermo-Electron® at LSCE (Gif/Yvette; France) and an Agilent® 7900 quadrupole ICP-MS at IPGP (France) to measure the U, Th, and Sm contents.
The U, Th, Sm, and Ca abundances are then deduced from the measured 235U 238U, 230Th 232Th, 149Sm 147Sm, and 42Ca 43Ca isotopic ratios and equations derived from Evans et al. (2005) by means of a built-in-house Excel® workbook, which is available upon request to Alexis Derycke, based on the VBA automation software. Appendix B presents the equations used for the U, Th, Sm, and Ca content determination. The measurement of the Ca content and the deduced apatite crystal weight, combined with the measurements of U, Th, and Sm abundances, then allow the U, Th, and Sm concentrations of the Durango fragments to be determined. Determination of crystal weight is also useful to ensure that the criteria imposed for grain selection, i.e., (i) crystal size (L, W, T > 60 µm), (ii) geometry (well-shaped prisms), and (iii) purity (inclusion-free crystals), have been respected.
2.6 (U–Th) He age reduction
For a sample, the (U–Th) He age (Ma) is calculated assuming a linear production of 4He with time using the determined U, Th, and Sm abundances and the equations presented in Appendix C. The assumption that the 4He production is linear holds for ages lower than ∼ 150 Ma, since the half-lives of the U, Th, and Sm isotopes are ∼ 5 to ∼ 600 times longer than 150 Ma. When the age is older than 150 Ma, we use a trial-and-error code to calculate the age, which never changes by more than a few percent.
For an ICP-MS session, the (U–Th) He data reduction Excel® workbook can calculate the U–Th–Sm concentrations (ppm by mass) and their associated standard deviations for the different minerals analyzed, according to the chemical dissolution protocol followed, as well as the effective uranium content, eU (ppm), the Th U and Sm Th ratios, and the (U–Th) He ages.
3.1 Helium quadrupole analysis
One aspect of quadrupole mass spectrometry is the variable response in terms of the ionization and signal generation of such instruments. This behavior has also been observed on the quadrupole adopted here for analyses of rare gases and is illustrated in Fig. 3a. The signal of the 3He spike is reported as a function of the number of extracted pipettes over a period of 5 months of analysis. The 3He signal fluctuates significantly although the 3He amount in each pipette should decrease smoothly following a law that depends on the volume of the cylinder and the pipette volume (here ∼ 4000 and ∼ 0.5 cm3, respectively; see Eq. 2). The advantage of using a 3He spike for isotopic dilution is to thwart the impact of the nonlinear answer of the quadrupole mass spectrometer with time (Farley, 2002; House et al., 2000), but it also allows the total gas pressure to be buffered in the mass spectrometer if the introduced 3He signal is large enough compared to the other signals.
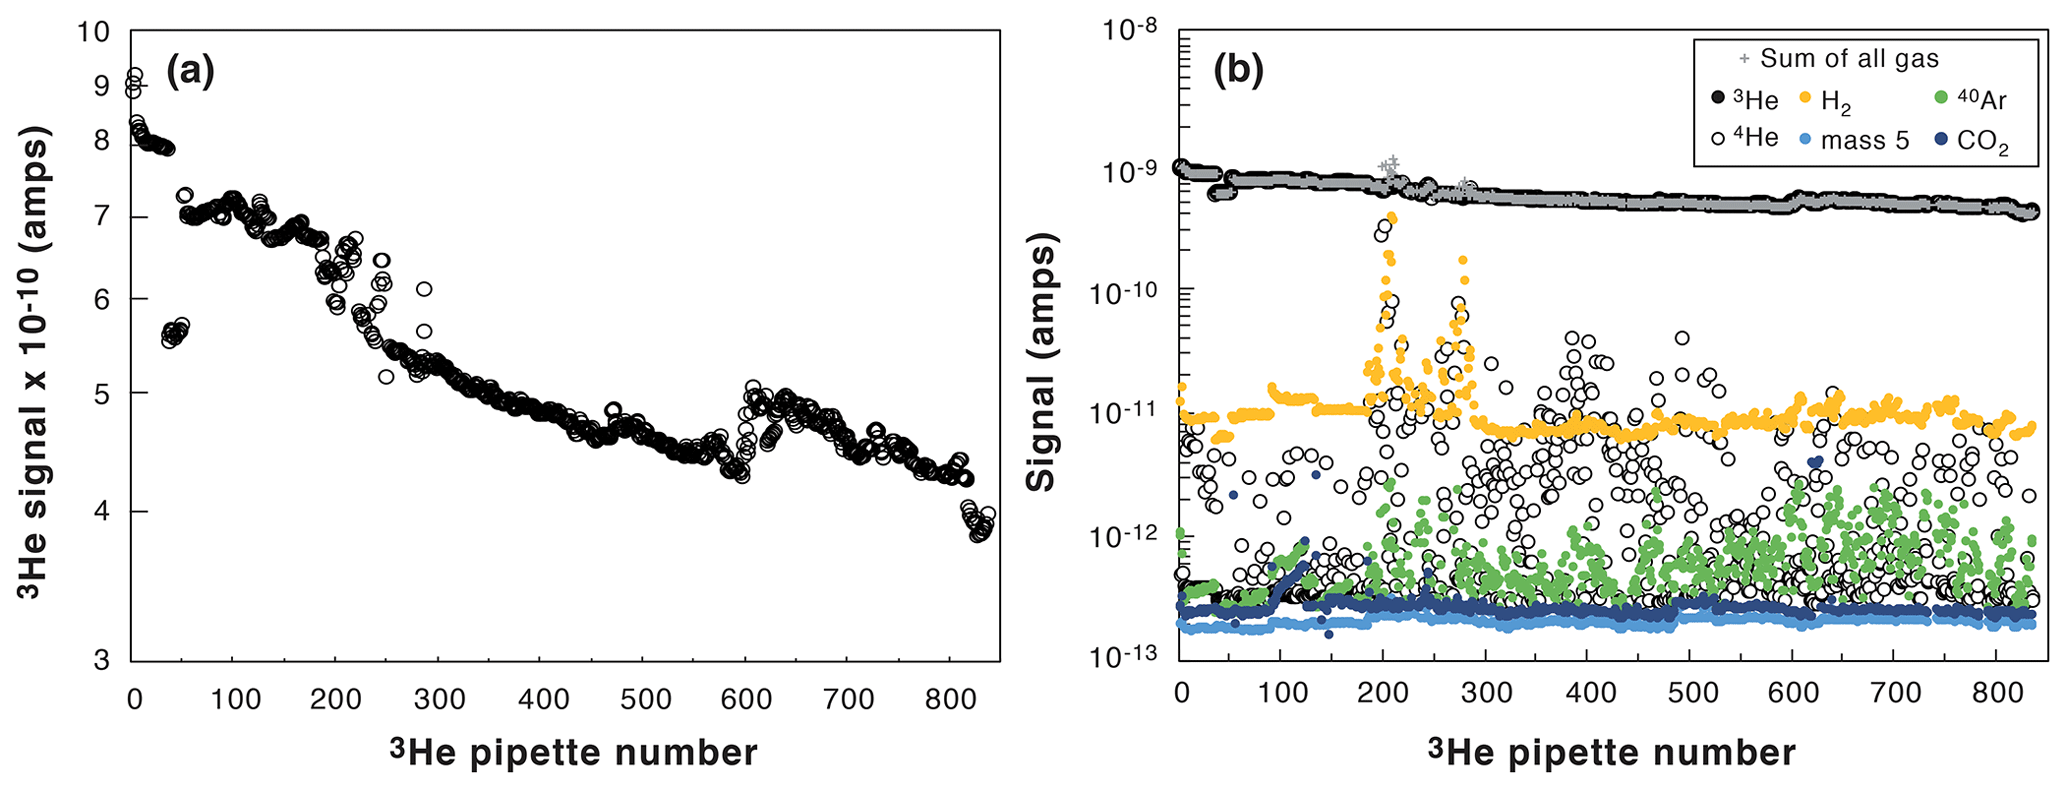
Figure 3Evolution of the measured 3He signal with pipette number (from January to June 2019). (a) Decrease in the spike 3He signal. (b) Evolution of all the measured signals (3He: black dots; 4He: open black dots; H2: orange dots; mass 5 (background noise): light blue dots; 40Ar: green dots, CO2: dark blue dots; crosses: summation of all the signals).
Figure 3b presents the various signals measured with the quadrupole mass spectrometer (H2, 3He, 4He, 40Ar, CO2, and mass 5 that represents the background noise) during the same 5 months of analyses (∼ 10 to 30 analyses per day, 5 d a week). The 3He clearly controls the total pressure inside the mass spectrometer during the analysis independently from the pressure of 4He gas released from the samples. The use of a spike rich in 3He allows us to achieve a stable and uniform total pressure in the mass spectrometer for any degassed sample analyzed. In addition, we follow the H2, CO2, and Ar signals to guard against any leak or gas purification problem. For example, in Fig. 3b, the H2 signal was higher than usual at a pipette number of 200 to 250, alerting us about a technical problem related to purification. It will then help to take the AHe ages with caution for low 4He samples, considering the H2 tail can influence the 4He signal (Sect. 2.3.1).

Figure 4Evolution of the Durango apatite age as a function of pipette number. (a) Evolution of the 3He signal over the period of analysis. (b) Evolution of the calculated 3He content of each pipette for two different D drift values (black dots or red dots) and 3Hec calibrated content using Eq. (2). (c, d) Calculated Durango AHe ages for the different D drift values and 3Hec calibrated content.
However, the quadrupole signals are variable and sometimes erratic within a few percent of the signal over weeks to months (Figs. 3a and 4a). To correct for this quadrupole drift, we introduce a correcting factor, denoted D, and a calibrated 3He value, denoted 3Hec, in the calculation of the 3He pipette content (Eq. 2), both of which we adjust using the deviation of the Durango ages obtained over a period of 1–2 months. Parameter D can be viewed as modifying the value of the pipette volume, V2 in Eq. (2), to counterbalance the variations of the quadrupole sensitivity. As we determine the U and Th (Sm and Ca for apatite) contents every 1 to 2 months, we also determine the D and 3Hec values for each batch of analyses (unknown samples and Durango standards) when we are calculating the (U–Th) He ages.
Figure 4c and d present the Durango apatite (U–Th) He ages obtained from measurements over a period of 2 months using two coupled values of the drift parameter, D, and the 3Hec calibrated content. We choose to present this example to explain how we perform the calibration and because of the presence of age outliers. Firstly, one can observe that the (U–Th) He ages obtained for the Durango apatite remain constant and are more reproducible using a D value of 99.937 × 10⁻² compared to 99.987 × 10⁻². In the present case, it just depletes the tank in 3He more quickly. We consider, over the analysis batch time (here pipette number 300 to 525), the variation of the 3He signal and the lowest standard deviation of Durango AHe ages to empirically determine the D and 3Hec values to be used (Fig.4a, b, c, and d). Each pair of values of the 3Hec and D parameters are recorded, allowing us to detect any problems during the measurements. Most of the time, the sensitivity does not evolve and the same D and 3Hec values are used. However, each time the filament or the voltage of the multiplier is changed, those values need to be tuned. This protocol allows us to achieve better reproducibility for ages of Durango and unknown samples by 1 % to 3 %. This is not significant in comparison to the dispersion of AHe and ZHe ages of most natural samples but allows us to obtain more reproducible ages. In addition, this way of determining the mass spectrometer sensitivity makes precise knowledge of the volumes of the pipette system (V1 and V2) not so important.
Secondly, we also check for any analytical issues with the apatite (U–Th) He ages, including Durango apatite, during the analysis batch. As observed in Fig. 4c–d, three Durango ages are lower or higher than the expected age of 31.02 ± 1.01 Ma from McDowell et al. (2005). Those outliers can indicate that the Pt tube was too closed, preventing the acid from penetrating the closed tube, or it can indicate an issue during acid digestion, an analytical issue during ICP-MS analysis, a heating temperature that is too high and has vaporized U and Th, or an issue during He quadrupole analysis. Because, in quadrupole gas analysis, we record the tube temperature during heating of the sample and backgrounds, the issue should be related to a digestion problem or the ICP-MS analysis. For the cases presented in Fig. 4c–d, the lower ages were associated with Th U ratios that are significantly different from other aliquots, tracing the incomplete recovery of U, Th, and Sm associated with non-total digestion or clogging of the solution during ICP-MS analysis. We thus check unknown samples for any digestion or ICP-MS issues.
In addition to the 3He pipette number associated with each measurement, we use a specific code name. As an example, for a Durango apatite, the code name D19P11A can be read as Durango, year 2019, planchette no. 11, aliquot A. This designation using the name of the sample and its analysis year allows us to better organize the He analysis database and data backup from a chronological point of view.
3.2 Helium magnetic sector analysis
In comparison to quadrupole mass spectrometers, magnetic sector mass spectrometers have a more stable and linear response of ionization and thus allow for better analysis. To test the response of the modified VG5400® mass spectrometer, determine the 4He sensitivity, and calibrate the 4He cylinder, we perform multiple analyses of fragments of Durango apatite having different sizes (dozens to hundreds of micrometers). After degassing, the U, Th, and Sm contents (and AHe ages) of the fragments are determined, and, assuming an age of 31.02 ± 1.01 (McDowell et al., 2005), the amount of 4He is calculated for each fragment. The calculated 4He contents are compared to the measured 4He signals in Fig. 5a, showing a correlation between the calculated 4He in ccSTP and the 4He signal in counts per second (cps), allowing the sensitivity to be determined. The ratio of the calculated 4He to the measured 4He normalized to the obtained sensitivity is plotted versus measured 4He in Fig. 5b. This operation was performed in 2016 and 2018, as the VG5400® was tuned with different source parameters and using different line conditions: since 2018, we have used a cryogenic trap, allowing us to concentrate the gas in a smaller volume and then increase sensitivity (Fig. 5a).

Figure 5VG5400® magnetic sector mass spectrometer sensitivity determined using fragments of Durango apatite. (a) Log–log diagram presenting the calculated 4He content (nccSTP) versus the measured 4He signal (cps: counts per second) for two determinations in 2016 and 2018. (b) Ratio of the calculated to measured 4He normalized to the obtained sensitivity (S) versus measured 4He for both datasets. In 2016, a He sensitivity of 1.1 × 10⁻¹² ccSTP He cps−1 (4.9 × 10⁻¹⁷ mol He cps−1) was obtained. In 2018, the addition of a cryogenic trap and modifications of source parameters allowed us to obtain a better sensitivity of 2.9 × 10⁻¹⁴ ccSTP He cps−1 (1.3 × 10⁻¹⁸ mol He cps−1). The variable n is the number of analyzed fragments.
For the two different conditions, the measured 4He signals and the 4He contents calculated from measured U–Th–Sm display a very good linear correlation (r2 > 0.99, Fig. 5a). Derived sensitivity values, S, were 1.1 × 10⁻¹² ccSTP He cps−1 (4.9 × 10⁻¹⁷ mol He cps−1) in 2016 and 2.9 × 10⁻¹⁴ ccSTP He cps−1 (1.3 × 10⁻¹⁸ mol He cps−1) in 2018, additionally showing that the use of the cryogenic trap increases the sensitivity by a factor of ∼ 40. Figure 5b also reveals the dispersion of the calculated 4He content. For the 2016 dataset, a large range of Durango apatite fragments were selected, including smaller fragments of < 50 µm in size, to get a large range of 4He signals. However, this may introduce difficulty associated with U, Th, and Sm content determination in very small grains. The dispersion of the normalized ratio of calculated content to the He signal observed for a low 4He signal (Fig. 5b) may reflect the difficulty of determining the U–Th content for very small Durango fragments. For the 2018 sensitivity calibration, we selected larger Durango fragments that reduce data dispersion (Fig. 5b).
Such analyses of Durango apatite fragments are also useful to test the electron multiplier and counting system responses, which turned out to be linear from thousands to hundreds of thousands of cps for He, without any impact of the dead counting time. However, we always try to select standard fragments yielding signals similar to unknown samples. Further, the use of both a 4He cylinder and Durango apatite fragments is important to follow the evolution of the filament and analyzer conditions through time. The 4He tank thus gets calibrated and is mainly used to check for signal reproducibility change and analyzer stability. In addition, Durango apatite fragments are analyzed regularly to follow the sensitivity evolution though time, particularly after each power failure, that cause slight modifications of the filament emission condition.
3.3 U, Th, and Sm chemistry and blanks
Acid blanks are regularly analyzed allowing the acid quality to be controlled. Low intensities are measured for 235U and 230Th, i.e., < 20 cps. Meanwhile, the intensities for 238U and 232Th are 100 times higher. Higher signal intensities for all the isotopes are measured in Blk-ch, indicating that the chemical dissolution method adds some contamination to the sample solutions. Such a contribution is nevertheless very negligible compared to the intensities of the signals observed for the apatite and zircon samples (100 000 cps).
For apatite, U, Th, and Sm in blanks are low in comparison with the U, Th, and Sm contents of the apatite, as already stated by Reiners and Nicolescu (2007). Figure 6 presents the evolution of the measured 235U 238U, 230Th 232Th, and 149Sm 147Sm isotopic ratios for spiked blank (BSP), spiked blank chemistry (BSP-ch), and Durango apatite sample (Sp) solutions. For a spiked sample (Sp), the 235U 238U, 230Th 232Th, and 149Sm 147Sm ratios range between the BSP-ch value and the natural value (i.e., 235U 238U = 0.00725268; 230Th 232Th = 0, with no natural 230Th atoms, and 149Sm 147Sm = 0.9), as can be observed in Fig. 6. The isotopic ratio values for the BSP and BSP-ch blanks do not vary by more than a few percent through the different analyses and are orders of magnitude higher than for the sample (Sp). The BSP-ch displays lower 235U 238U, 230Th 232Th, and 149Sm 147Sm values compared to the BSP (Fig. 6), showing that the chemistry protocol has an impact on the U, Th, and Sm isotopes in solution. However, this effect remains insignificant compared to the Durango apatite U, Th, and Sm contents and does not influence the (U–Th) He ages. Nevertheless, we always take care to have well-characterized blanks because for natural apatite crystals the U, Th, and Sm contents are usually lower than for Durango.
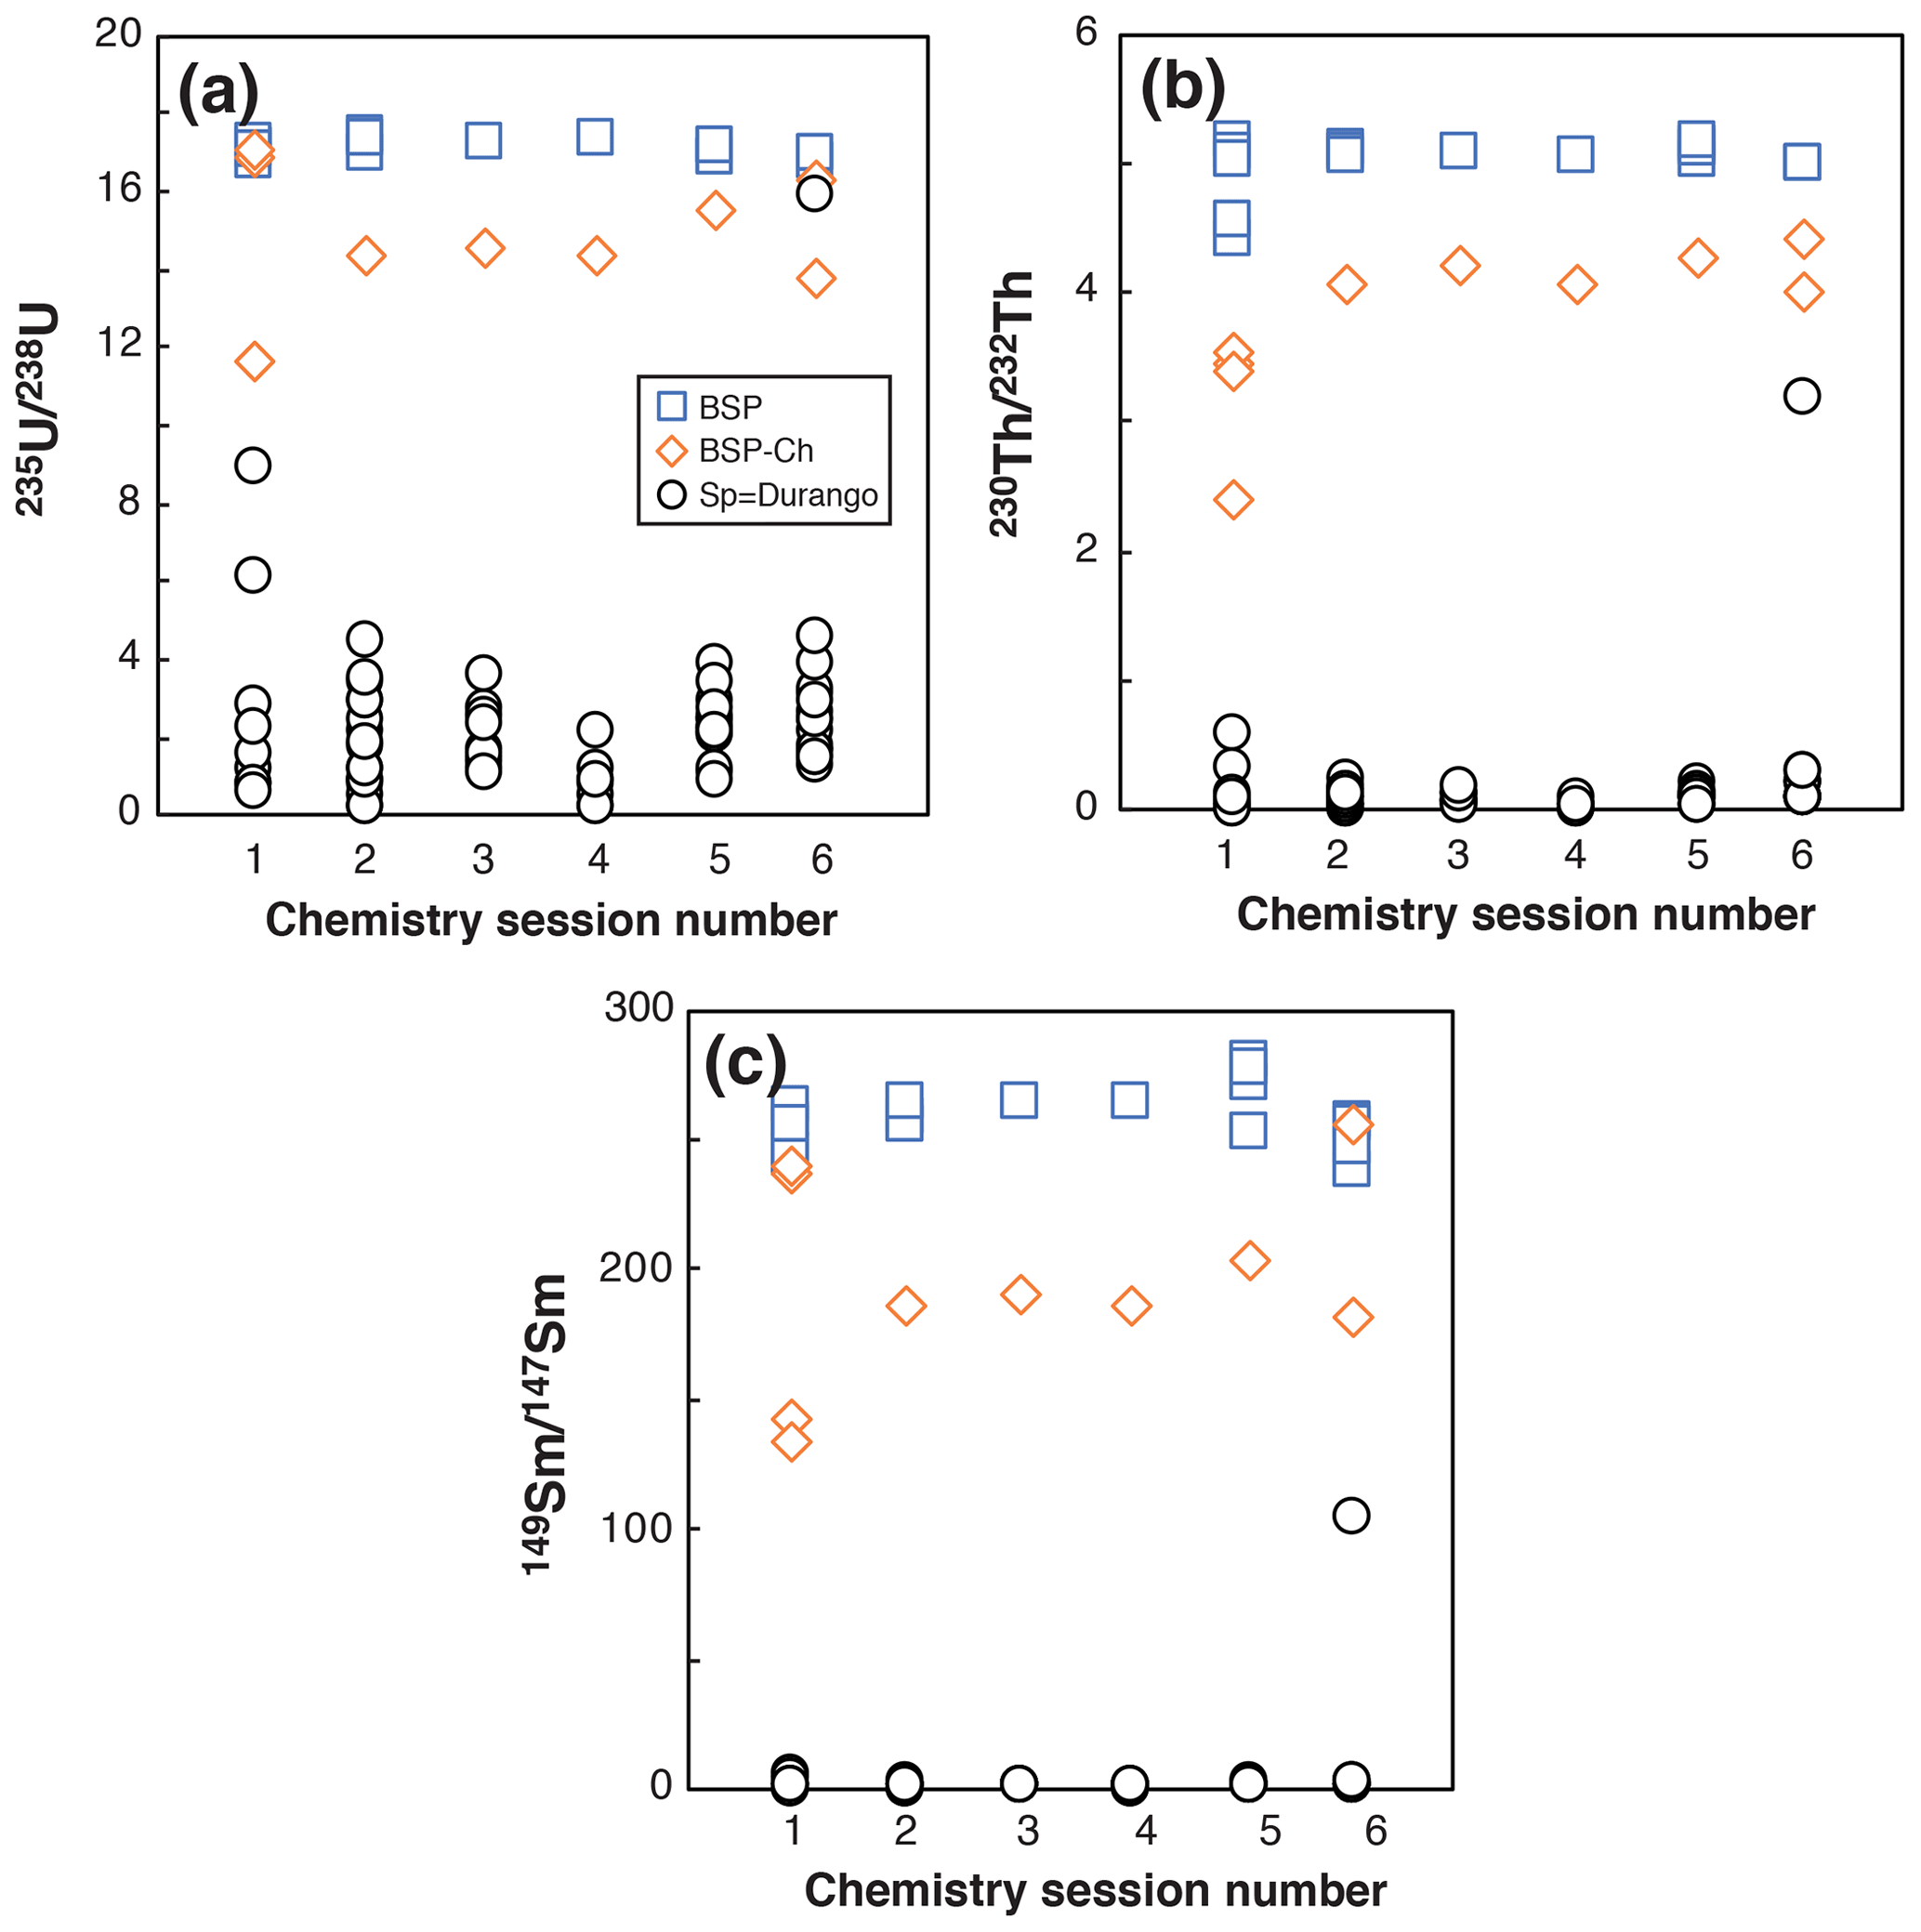
Figure 6Evolution of the 235U 238U, 230Th 232Th, and 149Sm 147Sm ratios obtained for BSP, BSP-ch, and Durango apatite Sp solutions in six different chemistry sessions.
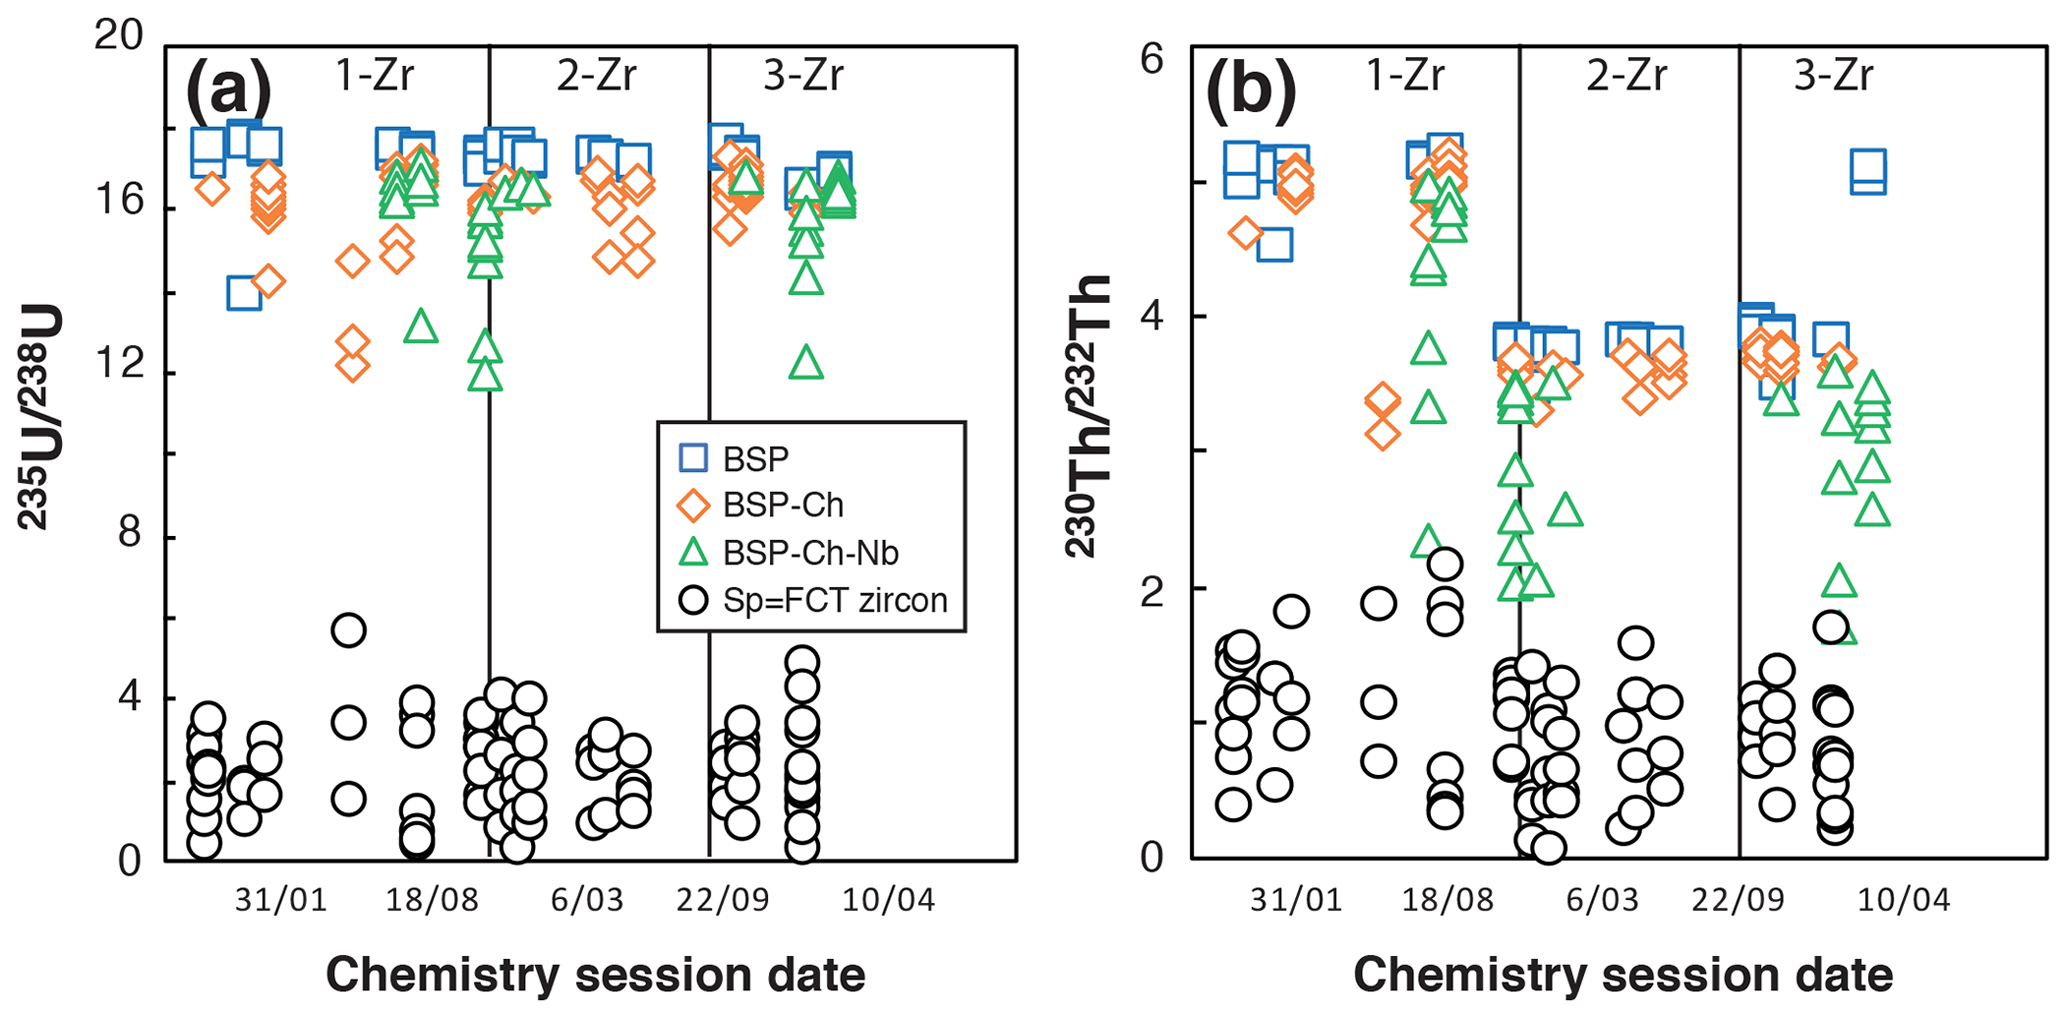
Figure 7Evolution of the 235U 238U and 230Th 232Th ratios obtained for BSP, BSP-ch, BSP-ch-Nb, and FCT zircon solutions in different chemistry sessions. 1-Zr, 2-Zr, and 3-Zr refer to the spike solution names used during the dissolution.
In opposition to apatite, the chemical dissolution for zircon requires the acquisition and maintenance of more complex laboratory material, such as PFA vials, a high-temperature, high-pressure Parr® bomb, and concentrated acids like HF. Tests on all types of blanks (BSP, BSP-ch, and BSPch-Nb) have been carried out over 18 series of sample analyses performed between March 2016 and February 2018. Under constant vessel cleaning protocol and acid quality conditions, comparison of the analyzed U and Th isotopes is presented in Fig. 7. Isotopic ratios measured in BSP-ch (235U 238U = 16.1 ± 0.3; 230Th 232Th = 4.8 ± 0.5) showed a slight reduction of their values compared to those found in BSP (235U 238U = 17.3 ± 1.0; 230Th 232Th = 5.1 ± 0.2), again indicating a small contamination during the chemical protocol (Fig. 7). The loss of elements and more specifically of Th when HF+HNO3 acids are used has already been well described (e.g., Révillon and Hureau-Mazaudier, 2009; Yokoyama et al., 1999), and the effect can be seen in Fig. 7, where the 235U 238U and 230Th 232Th ratios of BSP-ch are lower than for BSP. In addition, the use of Nb capsules (BSP-ch-Nb) also impacts the U and Th budgets and leads to a massive reduction of the ratios (maxima 235U 238U = 16.2 ± 1.0; 230Th 232Th = 4.1 ± 0.9 and recorded minima down to 235U 238U = 12.0; 230Th 232Th = 1.7; Fig. 7).
The impact of the niobium capsule on U and Th signals has already been noted by Reiners and Nicolescu (2007) and reported to be more significant for the Th content. The differences in 235U 238U and 230Th 232Th ratios between the different blanks (BSP, BSP-ch, BSP-Ch-Nb) are associated with some isotope fractionation, with a calculated decrease of 4 % to 6 % for the 235U 238U ratio and 10 to 20 % for the 230Th 232Th ratio compared to the expected ratios given by the spiked solutions without Nb. The shift for these ratios is systematic but variable from one solution to another, particularly for the 230Th 232Th ratio, showing values down to 60 % of the expected spiked solution ratio. A correction of the impact of the niobium capsule on the U and Th solutions is considered as this effect can result in a shift of the zircon (U–Th) He ages of up to ∼ 20 %.
3.4 Durango apatite and FCT zircon (U–Th) He age reproducibility
The Durango apatite is constantly analyzed in the laboratory to check for the He mass spectrometer sensitivity evolution though time as well as the evolution of (U–Th) He age and U, Th, and Sm contents. As the dissolution protocol for apatite has a very low impact on the U, Th, and Sm content determination by ICP-MS analysis, the regular measurement of Durango apatite acts as a sensor and allows us to detect any analytical problem. As an example, Fig. 8 presents the values of the (U–Th) He ages and Th U and Sm Th ratios acquired from March to December 2019 by both the quad and VG lines, and values are reported in Table S1 in the Supplement. The mean of the (U–Th) He age is 31.1 ± 1.4 Ma, in agreement with the age of 31.02 ± 1.01 Ma from McDowell et al. (2005).
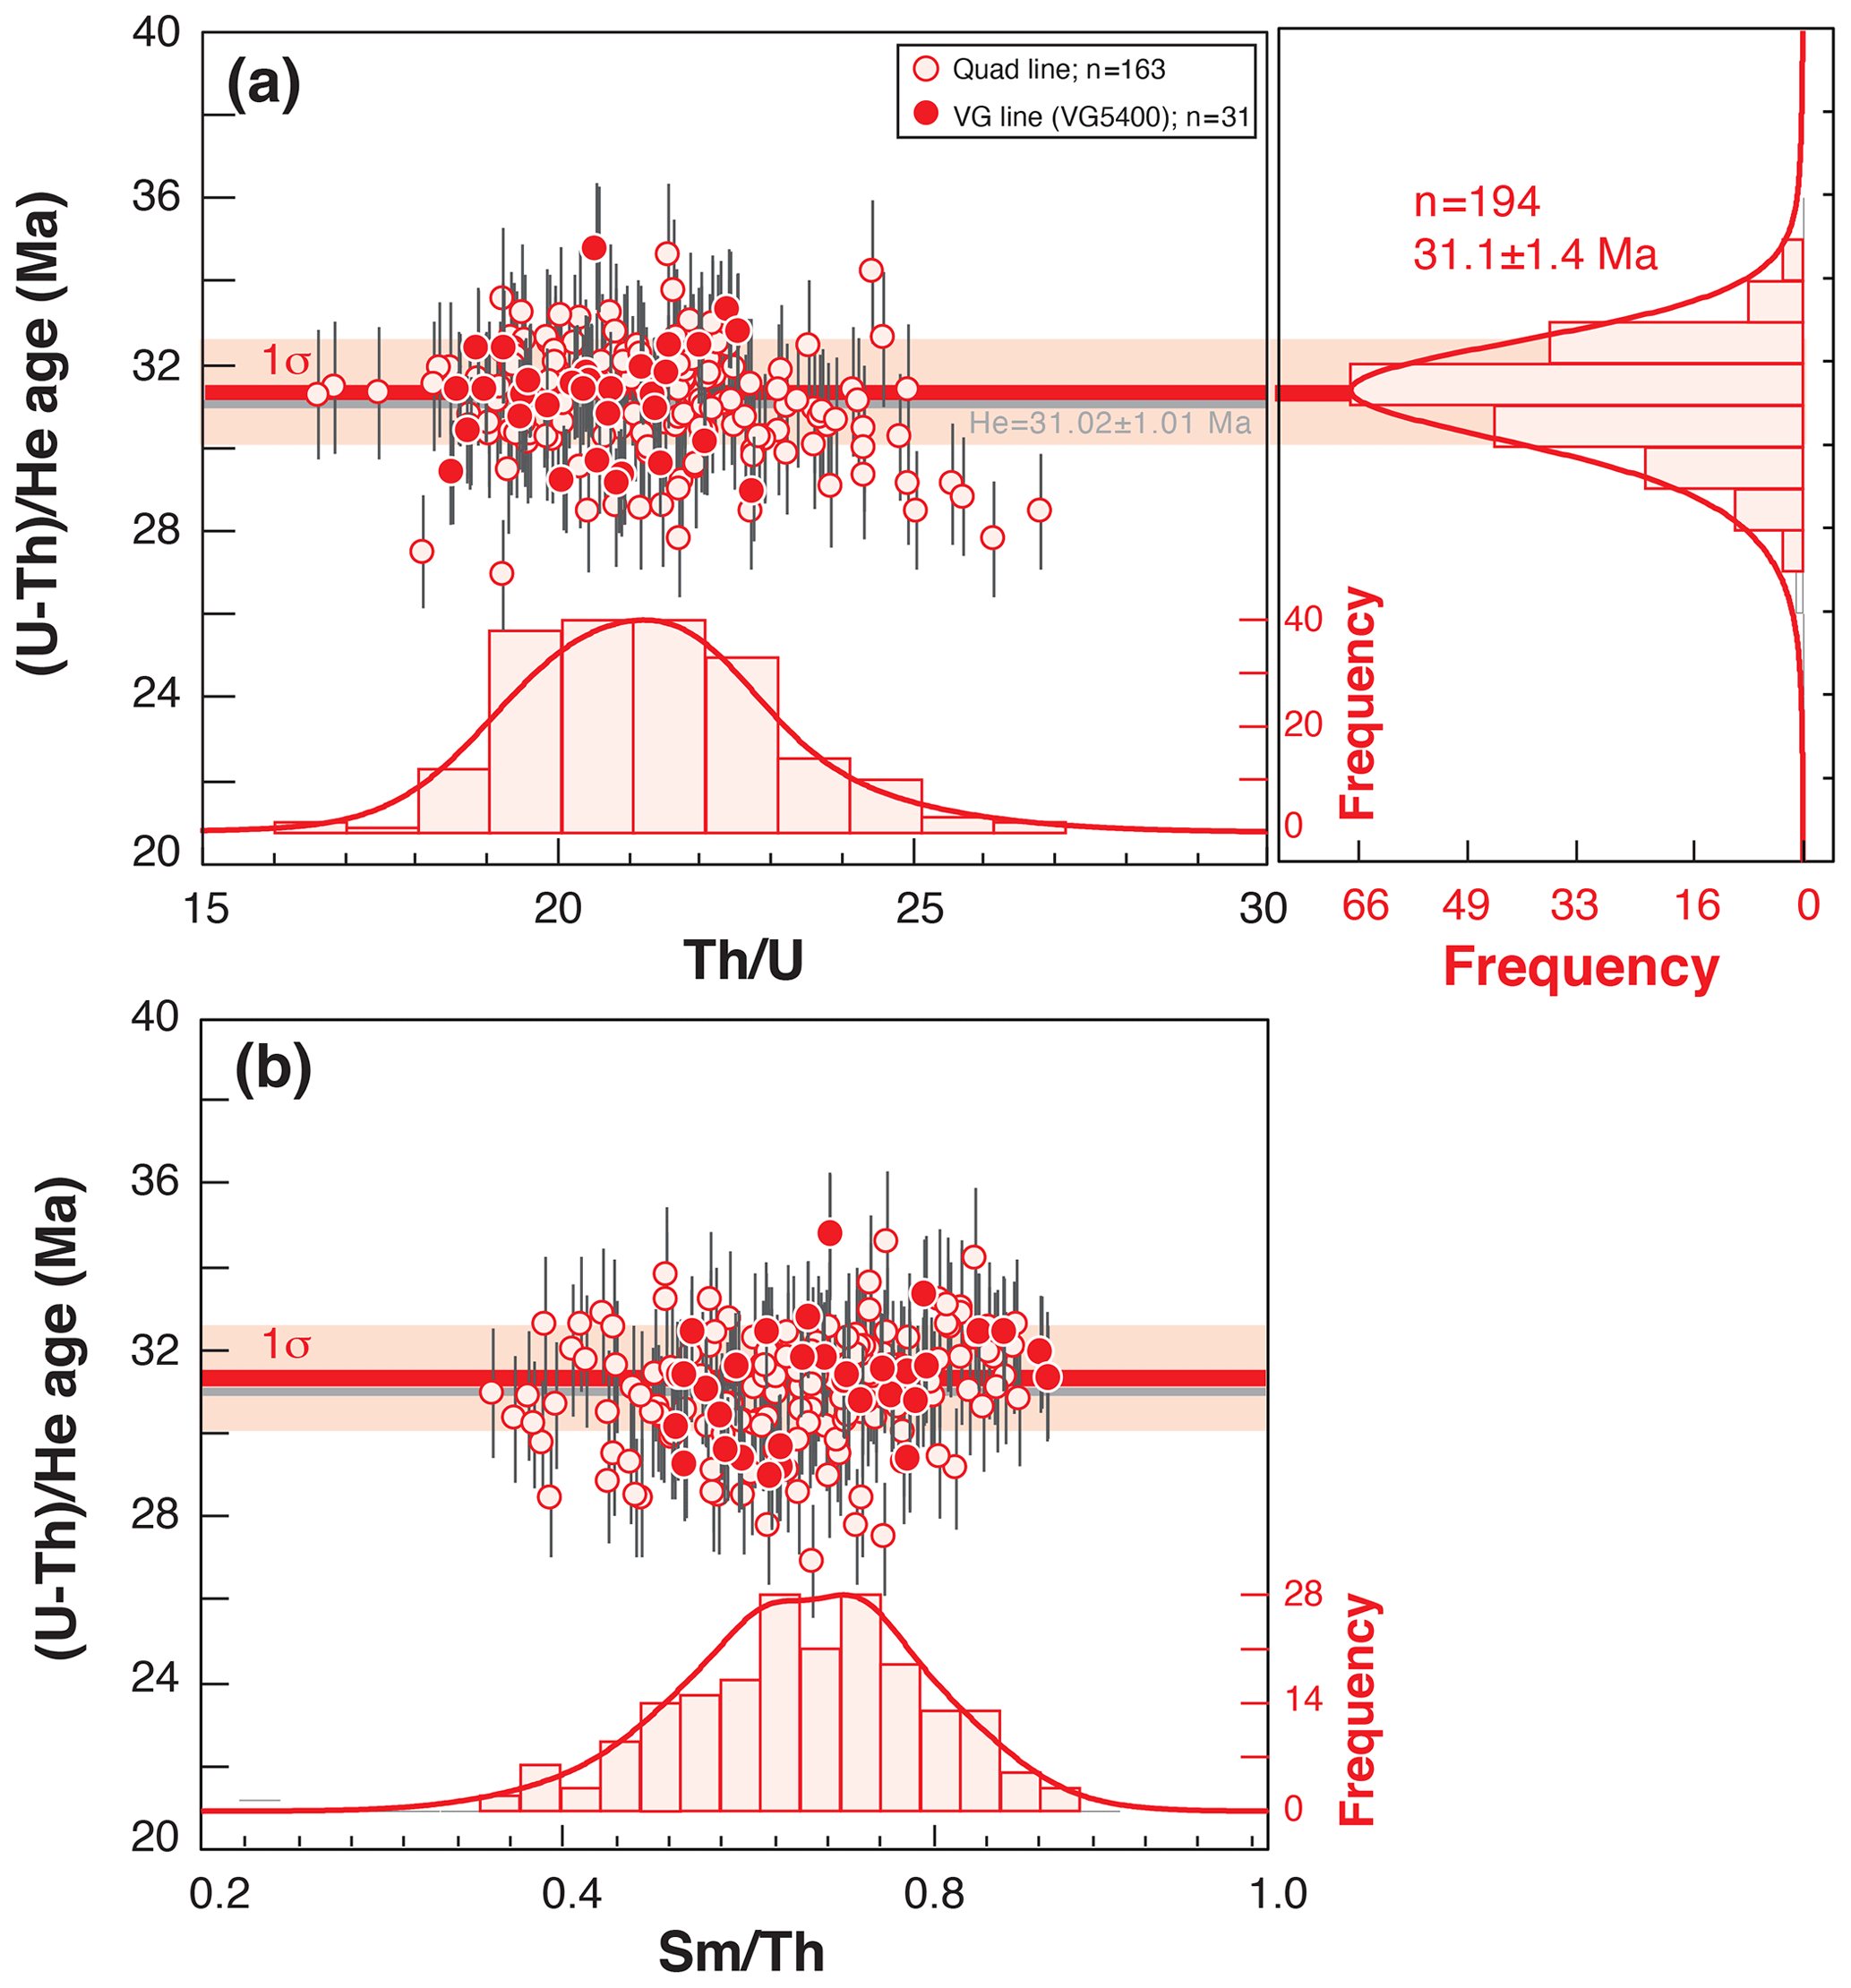
Figure 8Durango (U–Th) He age dispersion (1σ shown) as a function of Th U (a) or Sm Th ratios (b). Durango AHe ages and elemental ratios acquired from March to December 2019 using the quad line (open red circles) or the VG line (filled red circles). Histogram representation of the He ages; Th U and Sm Th ratios were constructed using RadialPlotter (Vermeesch, 2009). Th U and Sm Th ratios have no unit but are expressed by mass (ng ng−1).
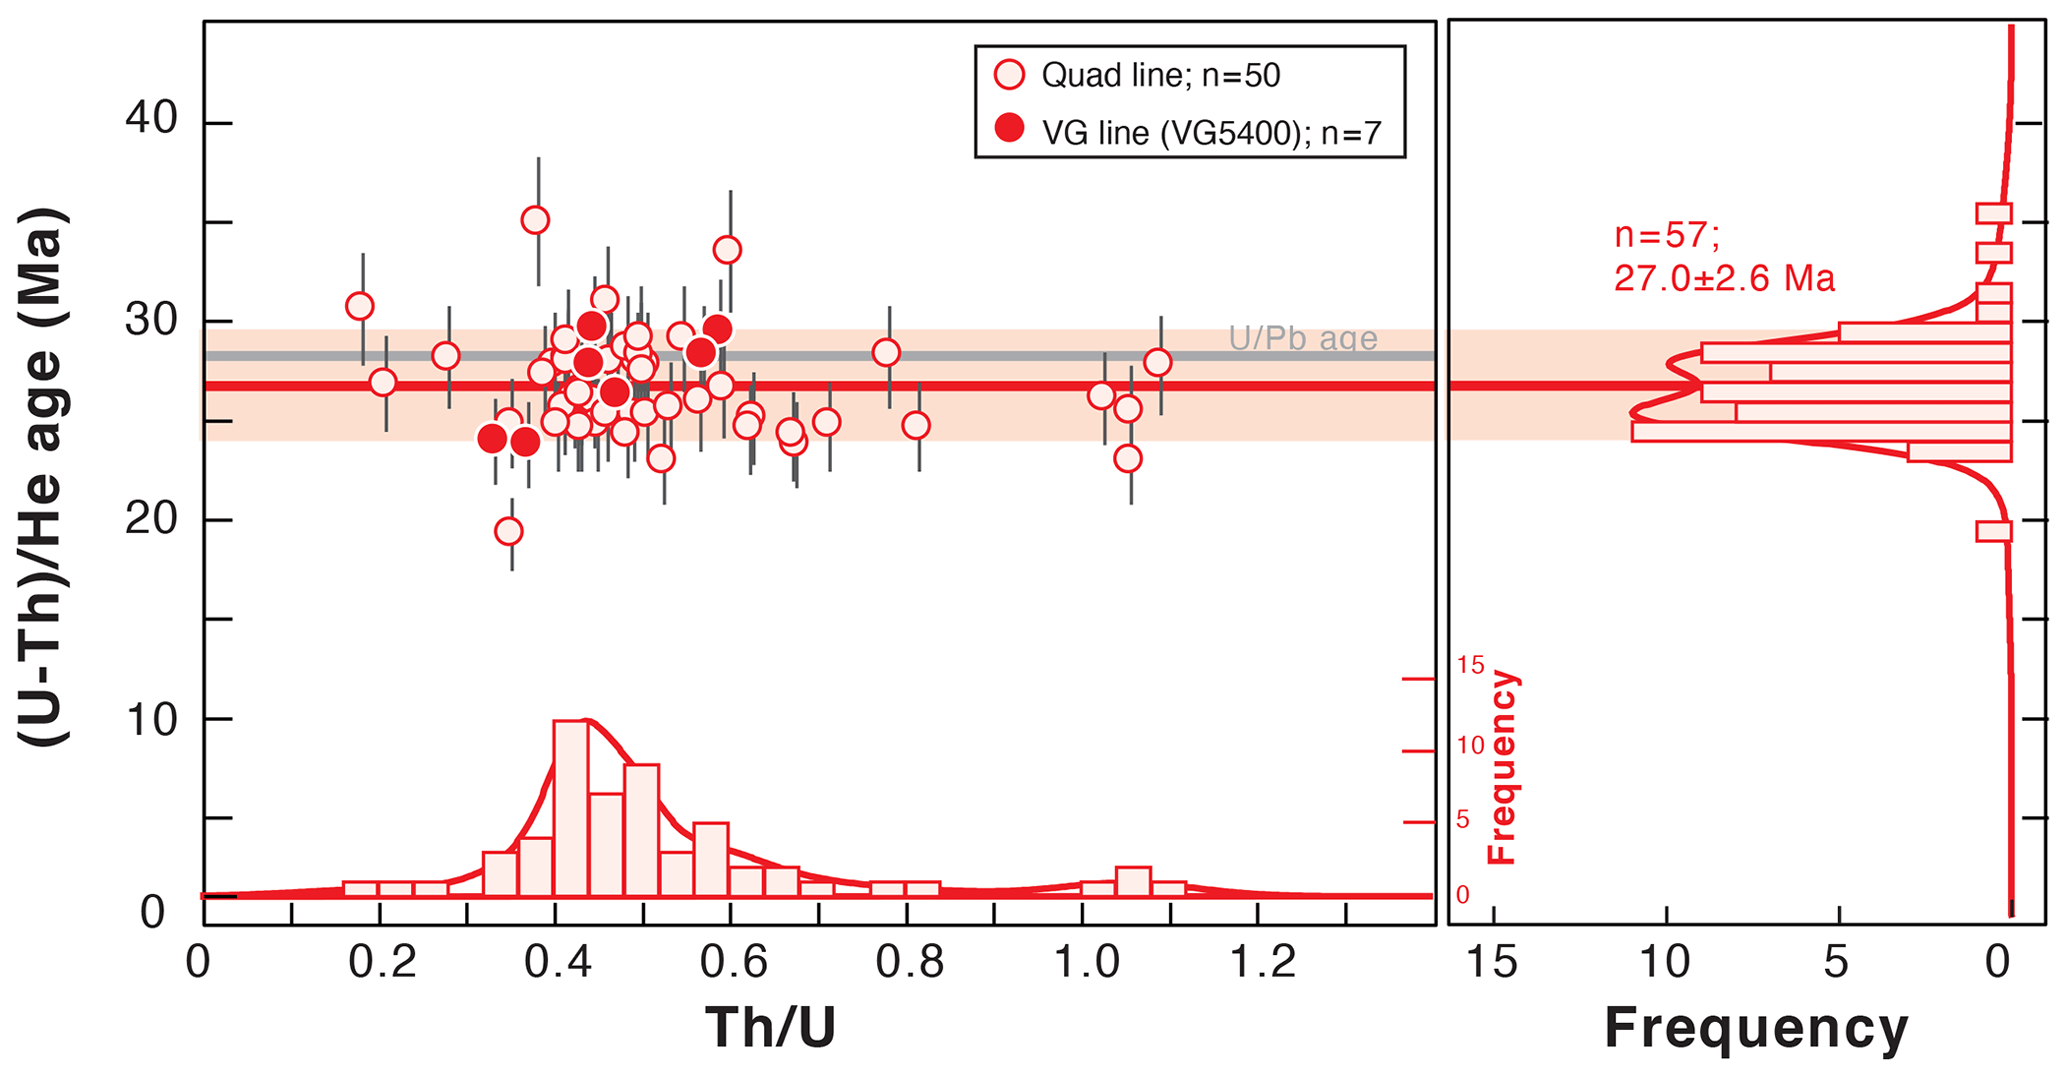
Figure 9Fish Canyon Tuff zircon (U–Th) He age dispersion (1σ shown) as a function of the Th U ratio for the data obtained in 2018 using the quad and VG lines. Histogram representations of the (U–Th) He ages and Th U ratios were constructed using RadialPlotter (Vermeesch, 2009). A U Pb age of 28.5 ± 0.06 Ma has been published by Schmitz and Bowring (2001). Th U is expressed by mass.
A typical mean error of < 5 % (1σ) is obtained for each AHe age by using either the quadrupole or magnetic sector mass spectrometers, without any evident difference over a large period of time. This error can be interpreted as the quadratic sum of the errors in the coupled analyses of the U–Th–Sm and He contents and is associated with the calibration. Our (U–Th) He ages for unknown apatites compare well within error with other laboratories (e.g., Ketcham et al., 2018). In addition, our strategy developed to determine the Ca concentration allows us to obtain the weight of the Durango fragment(s) and thus to calculate the U, Th, and Sm concentrations in parts per million (ppm; Table S1). Mean values of U = 19 ± 4 ppm, Th = 412 ± 68 ppm, and Sm = 38 ± 7 ppm have been obtained, and the U content is similar to that obtained by Schneider et al. (2015) and Yanga et al. (2014).
Fish Canyon Tuff zircon crystals have been analyzed at the GEOPS laboratory as standards for the ZHe method. The U and Th losses during dissolution due to niobium impact are corrected on the determination of the U and Th concentrations in zircons. (U–Th) He ages were obtained on 57 crystals of FCT zircons analyzed using the quad and VG lines and are reported in Fig. 9 as a function of the Th U ratio as well as in Table S2.
We obtain a mean age of 27.0 ± 2.6 Ma (1σ) and a mean Th U ratio of 0.4 on a zircon crystal from the C. W. Naeser collection (K Ar age of 27.9 ± 0.7 Ma; Naeser et al., 1981) (Fig. 9). The standard dispersion of the ZHe ages is ∼ 9 % and is comparable to the natural dispersion observed in the ZHe values given in the literature (e.g., Ault et al., 2019; Guenthner et al., 2014; Reiners, 2005). The Th U dispersion of 37 % also corresponds to the natural dispersion observed in the Th U ratio of the Fish Canyon zircon standard (e.g., Reiners et al., 2002). The (U–Th) He age results are comparable with (U–Th) He literature data that range from 27.3 ± 1.0 to 29.8 ± 2.7 Ma (Dobson et al., 2008; Gleadow et al., 2015; Reiners et al., 2002; Tagami et al., 2003; Tibari et al., 2016). Th U ratios vary between 0.42 ± 0.15 (Tagami et al., 2003) and 0.63 ± 0.14 Ma (Tibari et al., 2016) in the literature. The mean (U–Th) He age obtained in this study is slightly younger, by 5 %, than the U Pb age of 28.5 ± 0.06 Ma obtained by Schmitz and Bowring (2001), but it is still in good agreement within error bars (Fig. 9). The slight ZHe age difference could be explained by the variability of the measured Fish Canyon Tuff zircon ages as a function of sampling site (Gleadow et al., 2015). A second option is that, since similar ages are obtained by degassing either on the quad or VG line, the slight shift in the (U–Th) He age may be associated with the He content determination for only 1 % or 2 %, but it is mainly associated with the U and Th content determination and finally with the impact of the niobium precipitation during zircon dissolution. The loss of U, and more specifically of Th, associated with the use of HF + HNO3 (Révillon and Hureau-Mazaudier, 2009; Yokoyama et al., 1999) and of Nb capsules (Reiners and Nicolescu, 2007) has already been taken into account in the blank correction. However, the slightly lower ZHe ages obtained in this study could also be associated with the impact of the zirconium brought into solution that could cause an additional slight loss in Th, which is not considered yet in the blank correction. To estimate the magnitude of this under-correction, additional work should be carried out to fully understand the U and Th isotopic and elemental fractionation during this chemical protocol.
This contribution presents the (U–Th) He analysis protocols developed over the last 10 years at the GEOPS laboratory, Paris-Saclay University, and shares all the empirical and analytical aspects observed during the different steps of the protocol: sample preparation, mineral hand picking, He analysis, mineral dissolution, and U, Th, and Sm content determination. In the light of our experience, we propose the following:
-
a simple method to determine the temperature of the heated metallic (Pt and Nb) capsules that contain the apatite or zircon crystals during laser firing in the range 900–1200 ∘C using visible light emission wavelengths;
-
a method to calibrate He sensitivity using quadrupole and magnetic sector mass spectrometers;
-
the protocols to dissolve apatite and zircon crystals and to clean laboratory vessels after chemical digestion;
-
the protocol to calibrate the U, Th, and Sm spikes; and
-
the method used to track the U, Th, and Sm blank evolution and determine U, Th, and Sm contents.
We adopted the Durango apatite as a standard to perform He calibration and check for He and U–Th–Sm analytical problems; we can thus determine (U–Th) He ages with an error of less than 5 % (1σ). Our choice is also related to the fact that Durango is an easy-to-use mineral due to its high purity, its rapid dissolution protocol, and the strong reproducibility of its analyses. For the long-term quality control of the (U–Th) He data, attention needs to be paid to precisely evaluating the drift of blanks through time and that of the (U–Th) He ages and Th U ratios (with Sm Th when possible) obtained on standards (Durango apatite and Fish Canyon Tuff zircon), especially when using quadrupole mass spectrometry.
Table A1U, Th, Sm, and Ca spike calibration table (ppm and ppb: µg g−1 and ng g−1).
The U, Th, Sm, and Ca abundances are deduced from the measured 235U 238U, 230Th 232Th, 149Sm 147Sm, and 42Ca 43Ca isotopic ratios and the equations listed below (Eqs. B1–B5) derived from Evans et al. (2005).
The following abbreviations are applied: spk – spike, sp – sample, BSP – spiked blank, Nat – natural ratio, i.e., 235U 238U = 0.00725268, 149Sm 147Sm = 0.92 (147Sm = 14.99 % and 149Sm = 13.8 %), and 42Ca 43Ca = 4.79 (42Ca = 0.647 % and 43Ca = 0.135 %). We obtain abundances for each sample in nanograms (10−9 g), with spike concentrations in parts per billion (ppb). In addition, the same equations can be reversed to determine the concentration of the spike isotopes 235U, 230Th, 149Sm, and 42Ca.
Guenthner et al. (2016) have already performed complete work on determining apatite and zircon weights by measuring the Ca and Zr contents. Here, we obtain the weight of the apatite grain(s) from the measurement of 43Ca (ng) and the composition of a pure fluoroapatite (Ca5(PO4)3F) containing 40 wt % Ca in one apatite crystal. Thus, the apatite weight is given by Eq. (B5).
The factor 0.135 refers to the natural isotope abundance of 43Ca.
The (U–Th) He age (Ma) is calculated assuming a linear production of 4He with time using the determined U, Th, and Sm abundances and Eqs. (C1) and (C2).
P∗ is the instantaneous production of 4He, i.e., the amount of 4He produced in 1 year, and 4He is the measured 4He abundance (both in ccSTP). P∗ is calculated using the following equation.
Here, , , , and , where [238U], [232Th], and [147Sm] are the measured abundances in nanograms. The value of 137.88 is the 238U 235U natural isotopic ratio of uranium, and 1 mole occupies 22 414 cm3 at the standard pressure and temperature conditions of 273.15 K and 1 atm (ccSTP). While ccSTP is not the SI unit for amount of substance, it is historically used by the noble gas community, and conversion to moles is easy using the conversion factor of 1 mol = 22 414 ccSTP.
The Qt_LFT software and an Excel® file example are available in the Supplement, as are Tables S1 and S2 that present Durango and Fish Canyon Tuff zircon (U–Th) He data. The data reduction Excel® workbook is available upon request to Alexis Derycke (alexis.derycke@hotmail.com).
The supplement related to this article is available online at: https://doi.org/10.5194/gchron-3-351-2021-supplement.
CG, RPJ, PS, LTG, JM, and DB designed the experiments. CG, RPJ, FA, AD, CS, FH, GM, and GD participated in the data acquisition. LTG developed the Monte Carlo simulation Qt_LFT software and AD the Excel® workbook automatization software. CG prepared the paper with contributions from all co-authors.
The authors declare that they have a possible conflict of interest as Cécile Gautheron is a member of the editorial board of the journal.
The analytical work and the He and VG line building have been funded thanks to the INSU-Relief, FORPRO, and Tellus programs, as well as INSU mi-lourd, Division de la recherche of the Paris Sud University, and the ERM Paris Sud program under grants ANR-06-JCJC-0079 and ANR-12-NS06-0005-01 (HeDiff projects). Maurice Pagel is warmly thanked for his help in funding the cryogenic trap. IUT-Mesures-physiques internship trainees Pierre Marty, Stephane Lemaire, Etienne Cornier, Moussa Di Giacomo, Guillaume Ya, Pierre Boutteville, Maxime Form, Nathasha Etienne, Claire Morelière, Hugo Vicente, and Benoit Canguilhem are warmly thanked for their work in LabView programming of the different parts of the quad and VG lines. We thank Peter Reiners and Uttam Chowdhury for sharing zircon fractions and their knowledge of zircon dissolution protocols, and we thank James R. Metcalf for the location of the FCT outcrop and advice. We warmly thank Peter C. Hackspacher for the donation of gem-quality Durango apatite crystals and Charles W. Naeser for the donation of Fish Canyon Tuff zircon fractions. Manuel Moreira is thanked for his help in building the valve-controlling electronics and building the VG line. Jean Louis Birck is thanked for the loan of the external filament extinction pyrometer. Pierre Burckel, Eric Douville, and Louise Bordier are thanked for the U–Th–Sm analyses at IPGP and LSCE. The anonymous reviewers are thanked for their constructive reviews, and the associate editor Marissa Tremblay and editor Greg Balco are thanked for review handling.
This research has been supported by the Agence de la recherche (HeDiff project, grant nos. ANR-06-JCJC-0079 and ANR-12-NS06-0005-01), INSU-Relief, FORPRO, and Tellus programs, as well as INSU mi-lourd, Division de la recherche of the Paris Sud University, and the ERM Paris Sud program.
This paper was edited by Marissa Tremblay and reviewed by two anonymous referees.
Allard, T., Gautheron, C., Bressan-Riffel, S., Balan, E., Selo, M., Fernandes, B. S., Pinna-Jamme, R., Derycke, A., Morin, G., Taitson Bueno, G., and Do Nascimento, N. R.: Combined dating of goethites and kaolinites from ferruginous duricrusts. Deciphering the Late Neogene erosion history of Central Amazonia, Chem. Geol., 479, 136–150, https://doi.org/10.1016/j.chemgeo.2018.01.004, 2018.
Ault, A. K., Gautheron, C., and King, G. E.: Innovations in (U–Th) He, fission‐track, and trapped‐charge thermochronometry with applications to earthquakes, weathering, surface‐mantle connections, and the growth and decay of mountains, Tectonics, 38, 3705–3739, https://doi.org/10.1029/2018TC005312, 2019.
Brown, R. W., Beucher, R., Roper, S., Persano, C., Stuart, F., and Fitzgerald, P.: Natural age dispersion arising from the analysis of broken crystals, Part I. Theoretical basis and implications for the apatite (U-Th) He thermochronometer, Geochim. Cosmochim. Acta, 122, 478–497, https://doi.org/10.1016/j.gca.2013.05.041, 2013.
Burnard, P. G. and Farley, K. A.: Calibration of pressure-dependent sensitivity and discrimination in Nier-type noble gas ion sources, Geochem. Geophy. Geosy., 1, 1022, https://doi.org/10.1029/2000GC000038, 2000.
Cooperdock, E. H. G., Ketcham, R. A., and Stockli, D. F.: Resolving the effects of 2-D versus 3-D grain measurements on apatite (U–Th) He age data and reproducibility, Geochronology, 1, 17–41, https://doi.org/10.5194/gchron-1-17-2019, 2019.
Cros, A., Gautheron, C., Pagel, M., Berthet, P., Tassan-Got, L., Douville, E., Pinna-Jamme, R., and Sarda, P.: 4He behavior in calcite filling viewed by (U-Th) He dating, 4He diffusion and crystallographic studies, Geochim. Cosmochim. Acta, 125, 414–432, https://doi.org/10.1016/j.gca.2013.09.038, 2014.
Dobson, K. J., Stuart, F. M., and Dempster, T. J.: U and Th zonation in Fish Canyon Tuff zircons: Implications for a zircon (U-Th) He standard, Geochim. Cosmochim. Acta, 72, 4745–4755, https://doi.org/10.1016/j.gca.2008.07.015, 2008.
Evans, N. J., Byrne, J. P., Keegan, J. T., and Dotter, L. E.: Determination of uranium and thorium in zircon, apatite, and fluorite: Application to laser (U-Th) He thermochronology, J. Ana. Chem., 60, 1300–1307, 2005.
Farley, K. A.: Helium diffusion from apatite: general behavior as illustrated by Durango fluorapatite, J. Geophy. Res., 105, 2903–2914, 2000.
Farley, K. A.: (U-Th) He dating: Techniques, calibrations, and applications, in: geochemistry, edited by: Porcelli, D., Ballentine, C. J., and Wieler, R., Noble Gases in Geochemistry and Cosmochemistry, 819–844, https://doi.org/10.2138/rmg.2002.47.18, 2002.
Farley, K. A., Wolf, R. A., and Silver, L. T.: The effects of long alpha-stopping on (U-Th)/He ages, Geochim. Cosmochim. Acta, 21, 4223–4229, https://doi.org/10.1016/S0016-7037(96)00193-7, 1996.
Fechtig, H. and Kalbitzer, S.: Diffusion of argon in potassium-bearing solids, in: Potassium-Argon Dating, edited by: Zahringer, O. S. a. J., Springer, Berlin, Heidelberg, Germany, 68–106, 1966.
Flowers, R., Ketcham, R. A., Shuster, D., and Farley, K. A.: Apatite (U-Th) He thermochronology using a radiation damage accumulation and annealing model, Geochim. Cosmochim. Acta, 73, 2347–2365, https://doi.org/10.1016/j.gca.2009.01.015, 2009.
Foeken, J. P. T., Stuart, F. M., Dobson, K. J., Persano, C., and Vilbert, D.: A diode laser system for heating minerals for (U-Th) He chronometry, Geochem. Geophys., 7, 1–9, https://doi.org/10.1029/2005GC001190, 2006.
Gautheron, C. and Tassan-Got, L.: A Monte Carlo approach of diffusion applied to noble gas/ helium thermochronology, Chem. Geol., 273, 212–224, https://doi.org/10.1016/j.chemgeo.2010.02.023, 2010.
Gautheron, C. and Zeitler, P. K.: Noble Gases Deliver Cool Dates from Hot Rocks, Elements, 16, 303–309, https://doi.org/10.2138/gselements.16.5.303, 2020.
Gautheron, C., Tassan-Got, L., Ketcham, R. A., and Dobson, K. J.: Accounting for long alpha-particle stopping distances in (U-Th-Sm) He geochronology: 3D modeling of diffusion, zoning, implantation, and abrasion, Geochim. Cosmochim. Acta, 96, 44–56, https://doi.org/10.1016/j.gca.2012.08.016, 2012.
Gautheron, C., Djimbi, D. M., Roques, J., Balout, H., Ketcham, R. A., Simoni, E., Pik, R., Seydoux-Guillaume, A. M., and Tassan-Got, L.: A multi-method, multi-scale theoretical study of He and Ne diffusion in zircon, Geochim. Cosmoch. Acta, 268, 348–367, https://doi.org/10.1016/j.gca.2019.10.007, 2020.
Gautheron, C. E., Tassan-Got, L., Barbarand, J., and Pagel, M.: Effect of alpha-damage annealing on apatite (U-Th) He thermochronology, Chem. Geol., 266, 166–179, https://doi.org/10.1016/j.chemgeo.2009.06.001, 2009.
Gerin, C., Gautheron, C., Oliviero, E., Bachelet, C., Djimbi, D. M., Seydoux-Guillaume, A. M., Tassan-Got, L., Sarda, P., Roques, J., and Garrido, F.: Influence of vacancy damage on He diffusion in apatite investigated at atomic to mineralogical scales, Geochim. Cosmoch. Acta, 197, 87–103, https://doi.org/10.1016/j.gca.2016.10.018, 2017.
Gleadow, A., Harrisson, M., Kohn, B. P., Lugo-Zazuta, R., and Phillips, D.: The Fish Canyon Tuff: A new look at an old low-temperature thermochronology standard, Earth Planet. Sci. Lett., 424, 95–108, https://doi.org/10.1016/j.epsl.2015.05.003, 2015.
Glotzbach, C., Lang, K. A., Avdievitch, N. N., and Ehlers, T.: Increasing the accuracy of (U-Th(-Sm)) He dating with 3D grain modelling, Chem. Geol., 506, 113–125, https://doi.org/10.1016/j.chemgeo.2018.12.032, 2019.
Goldsmith, A. S., Ketcham, R. A., and Stockli, D.: Simulating effects of heterogeneous 4He concentration profiles and radiation damage annealing on whole-grain zircon diffusivity analyses, Geochim. Cosmochim. Acta, 284, 239–253, https://doi.org/10.1016/j.gca.2020.05.033, 2020.
Guenthner, W., Reiners, P. W., Ketcham, R., Nasdala, L., and Giester, G.: Helium diffusion in natural zircon: radiation damage, anisotropy, and the interpretation of zircon (U-Th) He thermochronology, Am. J. Sci., 313, 145–198, https://doi.org/10.2475/03.2013.01, 2013.
Guenthner, W. R., Reiners, P. W., DeCelles, P. G., and Kendall, J.: Sevier belt exhumation in central Utah constrained from complex zircon (U-Th) He data sets: Radiation damage and He inheritance effects on partially reset detrital zircons, GSA Bulletin, 1, B31032, https://doi.org/10.1130/B31032.1, 2014.
Guenthner, W. R., Reiners, P. W., and Chowdhury, U.: Isotope dilution analysis of Ca and Zr in apatite and zircon (U-Th) He chronometry, Geochem. Geophys., 17, 1623–1640, https://doi.org/10.2475/03.2013.01, 2016.
Herman, F., Braun, J., Senden, T. J., and Dunlap, W. J.: (U-Th) He chronometry: Mapping 3D geometry using micro-X-ray tomography and solving the associated production-diffusion equation, Chem. Geol., 242, 126–136, https://doi.org/10.1016/j.chemgeo.2007.03.009, 2007.
House, M. A., Farley, K. A., and Stockli, D.: Helium chronometry of apatite and titanite Nd-YAG laser heating, Earth Planet. Sci. Lett., 183, 365–368, 2000.
Ketcham, R. A., Gautheron, C., and Tassan-Got, L.: Accounting for long alpha-particle stopping distances in (U-Th-Sm) He geochronology: refinement of the baseline case, Geochim. Cosmochim. Acta, 75, 7779–7791, https://doi.org/10.1016/j.gca.2011.10.011, 2011.
Ketcham, R. A., van der Beek, P., Barbarand, J., Bernet, M., and Gautheron, C.: Reproducibility of Thermal History Reconstruction From Apatite Fission-Track and (U-Th) He Data, Geochem. Geophys., 19, 2411–2436, https://doi.org/10.1029/2018GC007555, 2018.
McDowell, F. W., McIntosh, W. C., and Farley, K. A.: A precise 40Ar-39Ar reference age for the Durango apatite (U-Th) He and fission-track dating standard, Chem. Geol., 214, 249–263, https://doi.org/10.1016/j.chemgeo.2004.10.002, 2005.
Naeser, C. W., Zimmermann, R. A., and Cebula, G. T.: Fission-track dating of apatite and zircon: An interlaboratory comparison, Nucl. Tracks, 5, 65–72, https://doi.org/10.1016/0191-278X(81)90027-5, 1981.
Reiners, P. W.: Zircon (U-Th) He thermochronometry, Reviews in Mineralogy and Geochemistry, 58, 151–179, https://doi.org/10.2138/rmg.2005.58.6, 2005.
Reiners, P. W. and Brandon, M. T.: Using thermochronology to understand orogenic erosion, Ann. Rev. Earth. Planet. Sci., 34, 419–466, https://doi.org/10.1146/annurev.earth.34.031405.125202, 2006.
Reiners, P. W. and Farley, K. A.: Influence of crystal size on apatite (U + Th) He thermochronology: an example from the Bighorn Mountains, Wyoming, Earth Planet. Sci. Lett., 188, 413–420, https://doi.org/10.1016/S0012-821X(01)00341-7, 2001.
Reiners, P. W. and Nicolescu, S.: Measurement of parent nuclides for (U–Th) He chronometry by solution sector ICP-MS, ARHDL Report 1, 1–33, available at: https://www.geo.arizona.edu/~reiners/arhdl/arhdl_reports.htm (last access: 31 May 2021), 2007.
Reiners, P. W., Farley, K. A., and Hiskes, H. J.: He diffusion and (U-Th) He thermochronology of zircon: initial results from Fish Canyon Tuff and Gold Butte, Tectonophysics, 349, 297–308, https://doi.org/10.1016/S0040-1951(02)00058-6, 2002.
Révillon, S. and Hureau-Mazaudier, D.: Improvements in Digestion Protocols for Trace Element and Isotope Determinations in Stream and Lake Sediment Reference Materials (JSd-1, JSd-2, JSd-3, JLk-1 and LKSD-1), Geostand. Geoanal. Res., 33, 397–413, https://doi.org/10.1111/j.1751-908X.2009.00008.x, 2009.
Schmitz, M. D. and Bowring, S. A.: U-Pb zircon and titanite systematics of the Fish Canyon Tuff: an assessment of high precision U-Pb geochronology and its application to young volcanic rocks, Geochim. Cosmochim. Acta, 65, 2571–2587, https://doi.org/10.1016/S0016-7037(01)00616-0, 2001.
Schneider, S., Hammerschmidt, K., Rosenberg, C. L., Gardes, A., Frei, D., and Bertrand, A.: U–Pb ages of apatite in the western Tauern Window (Eastern Alps): Tracing the onset of collision-related exhumation in the European plate, Earth Planet. Sci. Lett., 418, 53–65, https://doi.org/10.1016/j.epsl.2015.02.020, 2015.
Shuster, D., Flowers, R., and Farley, K. A.: The influence of natural radiation damage on helium diffusion kinetics in apatite, Earth Planet. Sci. Lett., 249, 148–161, https://doi.org/10.1016/j.epsl.2006.07.028, 2006.
Tagami, T., Farley, K. A., and Stockli, D. F.: (U + Th) He geochronology of single zircon grains of known Terciary eruption age, Earth Planet. Sci. Lett., 207, 57–67, https://doi.org/10.1016/S0012-821X(02)01144-5, 2003.
Tibari, B. Tibari, B., Vacherat, A., Stab, M., Pik, R., Yeghicheyan, D., and Hild, P.: An Alternative Protocol for Single Zircon Dissolution with Application to (U-Th-Sm) He Thermochronometry, Geostand. Geoanal. Res., 40, 365–375, https://doi.org/10.1111/j.1751-908X.2016.00375.x, 2016.
Vermeesch, P.: RadialPlotter: A Java application for fission track, luminescence and other radial plots, Radiat. Meas., 44, 409–410, 2009.
Yanga, Y.-H., Wua, F.-Y., Yanga, J.-H., Chew, D.M., Xie, L.-W., Chua, Z.-Y., Zhang, Y.-B., and Huang, C.: Sr and Nd isotopic compositions of apatite reference materials used inU–Th–Pb geochronology, Chem. Geol., 385, 35–55, https://doi.org/10.1016/j.chemgeo.2014.07.012, 2014.
Yokoyama, T., Makishima, A., and Nakamura, E.: Evaluation of the coprecipitation of incompatible trace elements with fluoride during silicate rock dissolution by acid digestion, Chem. Geol., 157, 175–187, https://doi.org/10.1016/S0009-2541(98)00206-X, 1999.
Ziegler, J. F.: SRIM-2008 The stopping range of ions in matter, United States Naval Academy, Annapolis, USA, 2008.
- Abstract
- Introduction
- Methods
- (U–Th) He results and discussion
- Conclusion
- Appendix A
- Appendix B: Equations used to determine the 238U, 232Th, 147Sm, and 43Ca contents
- Appendix C: Equations used for the (U–Th) He age reduction
- Code and data availability
- Author contributions
- Competing interests
- Acknowledgements
- Financial support
- Review statement
- References
- Supplement