the Creative Commons Attribution 4.0 License.
the Creative Commons Attribution 4.0 License.
 | 23 Jun 2021
Technical note: On the reliability of laboratory beta-source calibration for luminescence dating
Barbara Mauz
Loïc Martin
Michael Discher
Chantal Tribolo
Sebastian Kreutzer
Chiara Bahl
Andreas Lang
Nobert Mercier
The dose rate of the 90Sr 90Y beta source used in most luminescence readers is a laboratory key parameter. There is a well-established body of knowledge about parameters controlling accuracy and precision of the calibration value but some hard-to-explain inconsistencies still exist. Here, we have investigated the impact of grain size, aliquot size and irradiation geometry on the resulting calibration value through experiments and simulations. The resulting data indicate that the dose rate of an individual beta source results from the interplay of a number of parameters, most of which are well established by previous studies. Our study provides evidence for the impact of aliquot size on the absorbed dose in particular for grain sizes of 50–200 µm. For this grain-size fraction, the absorbed dose is enhanced by ∼ 10 %–20 % as aliquot size decreases due to the radial increase of dose rate towards the centre of the aliquot. The enhancement is most variable for 50–100 µm grains mounted as aliquots of < 8 mm size. The enhancement is reversed when large grains are mounted as small aliquots due to the edge effect by which the dose induced by backscattered electrons is reduced. While the build-up of charge dictates the increase of absorbed dose with the increase of grain size, this principle becomes more variable with changing irradiation geometry. We conclude that future calibration samples should consist of subsamples composed of small, medium, large and very large quartz grains, each obtaining several gamma doses. The calibration value measured with small, medium and large aliquots is then obtained from the inverse slope of the fitted line, not from a single data point. In this way, all possible irradiation geometries of an individual beta source are covered, and the precision of the calibration is improved.
- Article
(2262 KB) - Full-text XML
-
Supplement
(787 KB) - BibTeX
- EndNote


The dose rate of the 90Sr 90Y beta source used in most luminescence readers is a laboratory key parameter. If the source's calibration is incorrect, results for equivalent dose and age are also incorrect. The significance of beta-source calibration is therefore well known and has been subject to interlaboratory comparison studies (e.g. Pernicka and Wagner, 1979; Göksu et al., 1995).
Past studies have established that charge build-up, attenuation and backscatter constitute the physical mechanisms controlling the dose absorbed in the sample's mineral grain. The interplay of these mechanisms depends on mineral type (Aitken, 1985), on grain transparency (Bell and Mejdahl, 1981), beta-source-to-grain distance (Wintle and Aitken, 1977), grain size (Goedicke, 2007; Armitage and Bailey, 2005; Mauz and Lang, 2004) and the sample carrier's substrate (Greilich et al., 2008; Armitage and Bailey, 2005; Mauz and Lang, 2004; Wintle and Aitken, 1977). In addition, accuracy and/or precision of the calibration value depend on the measurement protocol (Guérin and Valladas, 2014; Kadereit and Kreutzer, 2013), the atomic numbers (Z) of mineral and sample carrier (Hansen et al., 2018) and the accuracy of the gamma dose to mineral calculation (Burbidge et al., 2016; Tribolo et al., 2019). Despite this well-established body of knowledge, Hansen et al. (2015) note an unexplained 3 % dispersion of their calibration data, subsequently investigated by Autzen et al. (2017). They show that overdispersed calibration data result from attenuation and backscattering, which change in response to changing grain shape and changing sample-carrier material (Autzen et al., 2017). As a consequence, the beta-dose rate should decrease for grain sizes > 100 µm (Wintle and Aitken, 1977) because with increasing grain size the contribution of low-energy backscatter decreases and the primary energy spectrum is more attenuated (Hansen et al., 2018; Greilich et al., 2008). While this has improved our understanding of calibration data significantly, some details are still not fully explained. Here, we test the hypothesis that, in addition to grain size and disc substrate, aliquot size and beta-source shape influence the dose rate. We carried out experiments using three quartz calibration samples characterised by three different grain-size fractions arranged in aliquots of different sizes and compared the experimental data with simulated data obtained from GEANT4 (Agostinelli et al., 2003) and MCNP6 (Werner, 2017; Werner et al., 2018). The results from experiments should allow identifying the impact of grain size, aliquot size and beta-source shape on the dose rate. The simulations should provide a more complete picture of the impact of individual parameters that is hard to achieve with experimental data due to experimental uncertainties being typically above 5 %. We show here that grain size and aliquot size impact on the absorbed dose in response to the irradiation geometry and that this interplay should be reflected in the design of calibration measurements.
2.1 Luminescence readers and beta sources
For all experiments 90Sr 90Y beta sources with MeV (Aitken, 1985) built in, three different lexsyg luminescence readers of Freiberg Instruments were used. One is the lexsyg RESEARCH reader (Richter et al., 2013) equipped with a beta source arranged in a ring of 17 sealed “mini-sources” with a nominal activity of 1.51 GBq. The other two readers are lexsyg SMART readers (Richter et al., 2015): one is equipped with a planar beta source and the other is equipped with a ring composed of 23 mini-sources, both with a nominal activity of 1.85 GBq. The SMART ring-shaped source is closed at the top (hereafter named “closed ring”), while it is open in the RESEARCH (hereafter named “open ring”) to allow for radio-fluorescence measurements.
The ring-shaped sources consist of mini-sources. For the open-ring source, these mini-sources were tested for homogeneous activity (< 5 % variation; Richter et al., 2012). As a result, the radiation field of this source varies by 2 %–8 % across an 8–10 mm cup diameter (Richter et al., 2012). The larger variation occurs towards the cup edge due to increasing backscatter from the cup rim, but the inner 6 mm of the cup are exposed to a very homogeneous radiation field (Richter et al., 2012). The sources of the SMART readers are not pre-selected for homogeneous activity and may deliver a less uniform radiation field. With a distance of 6.9 mm between source and sample-holder surface, the radiation field of all sources is expected to be curved. Veronese et al. (2007) show that the dose-rate reduction follows a power function which yields a parabolic curve of variable width. A very wide, and hence flat, parabolic curve is delivered by the open-ring source (Richter et al., 2012) due to its special design.
2.2 Calibration samples
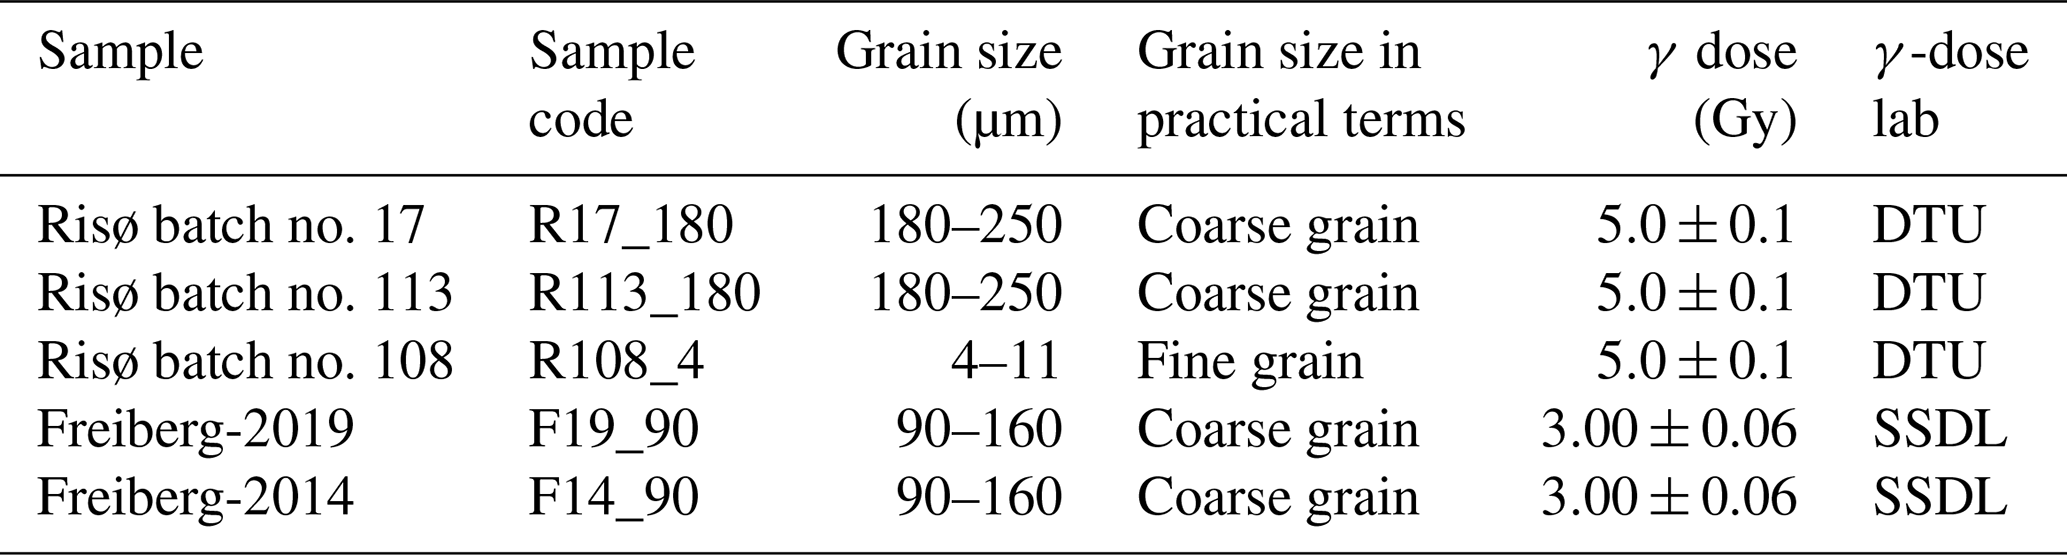
Samples used for the experiments are listed in Table 1. In terms of grain size, the samples fall in two categories: (1) fine-grain aliquots are composed of 4–11 µm grains and are always 7.95 mm in size; (2) coarse-grain aliquots are composed of 180–250 or 90–160 µm grains and can be of small (1 mm), medium (3 mm) and large (5–7.95 mm) aliquot size. The Risø fine-grain sample (batch no. 108) is described in Hansen et al. (2015). The Freiberg coarse-grain sample is described in Richter et al. (2020). Tribolo et al. (2019) report on gamma irradiation and calculation of absorbed gamma dose.
Table 1Samples and their codes used in the experiments. DTU Nutech: Center for Nuclear Technologies, Denmark; SSDL: Secondary Standard Dosimetry Laboratory, Munich. For SSDL calibration samples, the absorbed gamma dose and its uncertainty are derived from a Monte Carlo (MC) simulation. The uncertainty of the dose (2.1 %) is the quadrature of errors resulting from the MC simulation (1.4 %), from the air kerma (1 %) and from the geometry of the irradiation field (1.2 %); see also Table 2 in Tribolo et al. (2019). For DTU calibration samples, the calculation was revised (Martin Autzen, personal communication, December 2019).
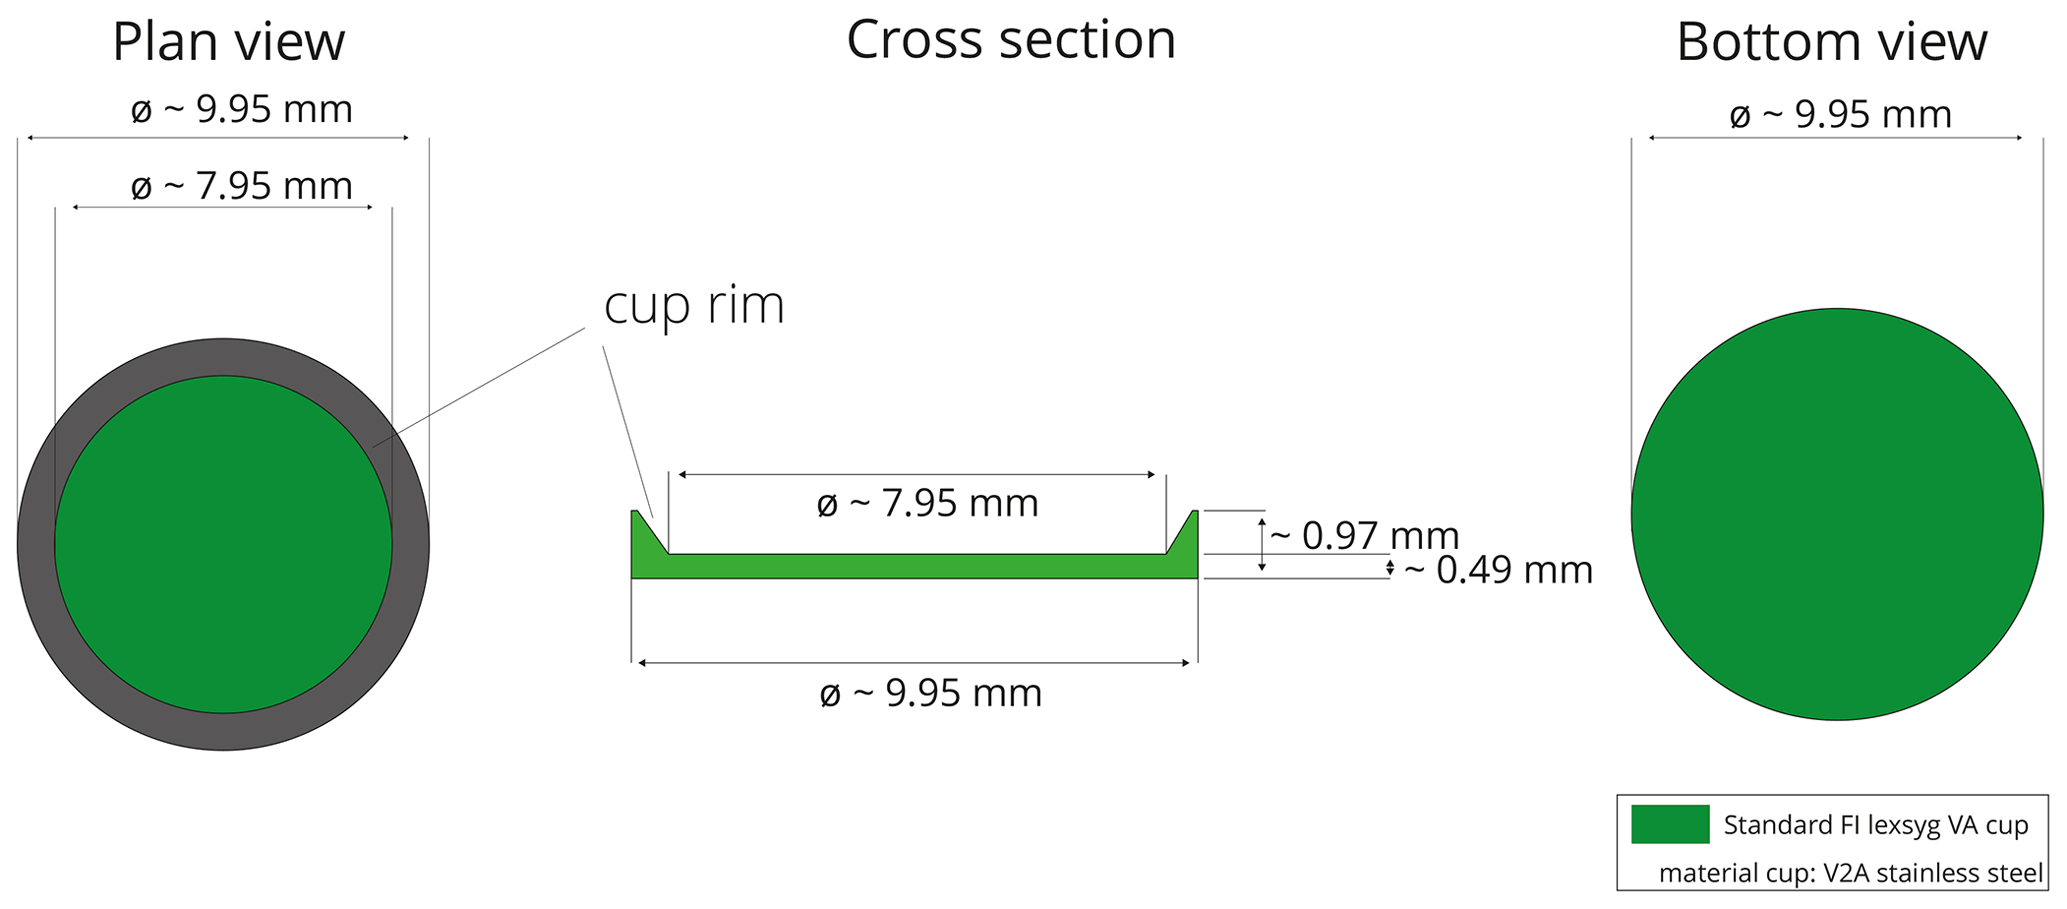
2.3 Sample carrier
To limit the complexity of the study, only one type of sample carrier was used in our experiments. The sample carrier is a cup (Fig. 1) with dimensions varying by up to 0.1 mm (our own measurements of 10 cups). The cup is made of standard stainless steel (“stainless steel 1.4841”; short name: X15CrNiSi25-21) with a chemical composition of C (≤ 0.20 %), Si (≤ 1.5 %–2.5 %), Mn (≤ 2.00 %), P (≤ 0.045 %), S (≤ 0.015 %), Cr (24.00 %–26.00 %), Ni (19.00 %–22.00 %), N (≤ 0.11 %) and Fe (> 50 %). The material is heat resistant up to approximately 1150 ∘C (e.g. https://www.thyssenkrupp-materials.co.uk/stainless-steel-314-14841.html, last access: 7 June 2021).
2.4 Measurement protocol
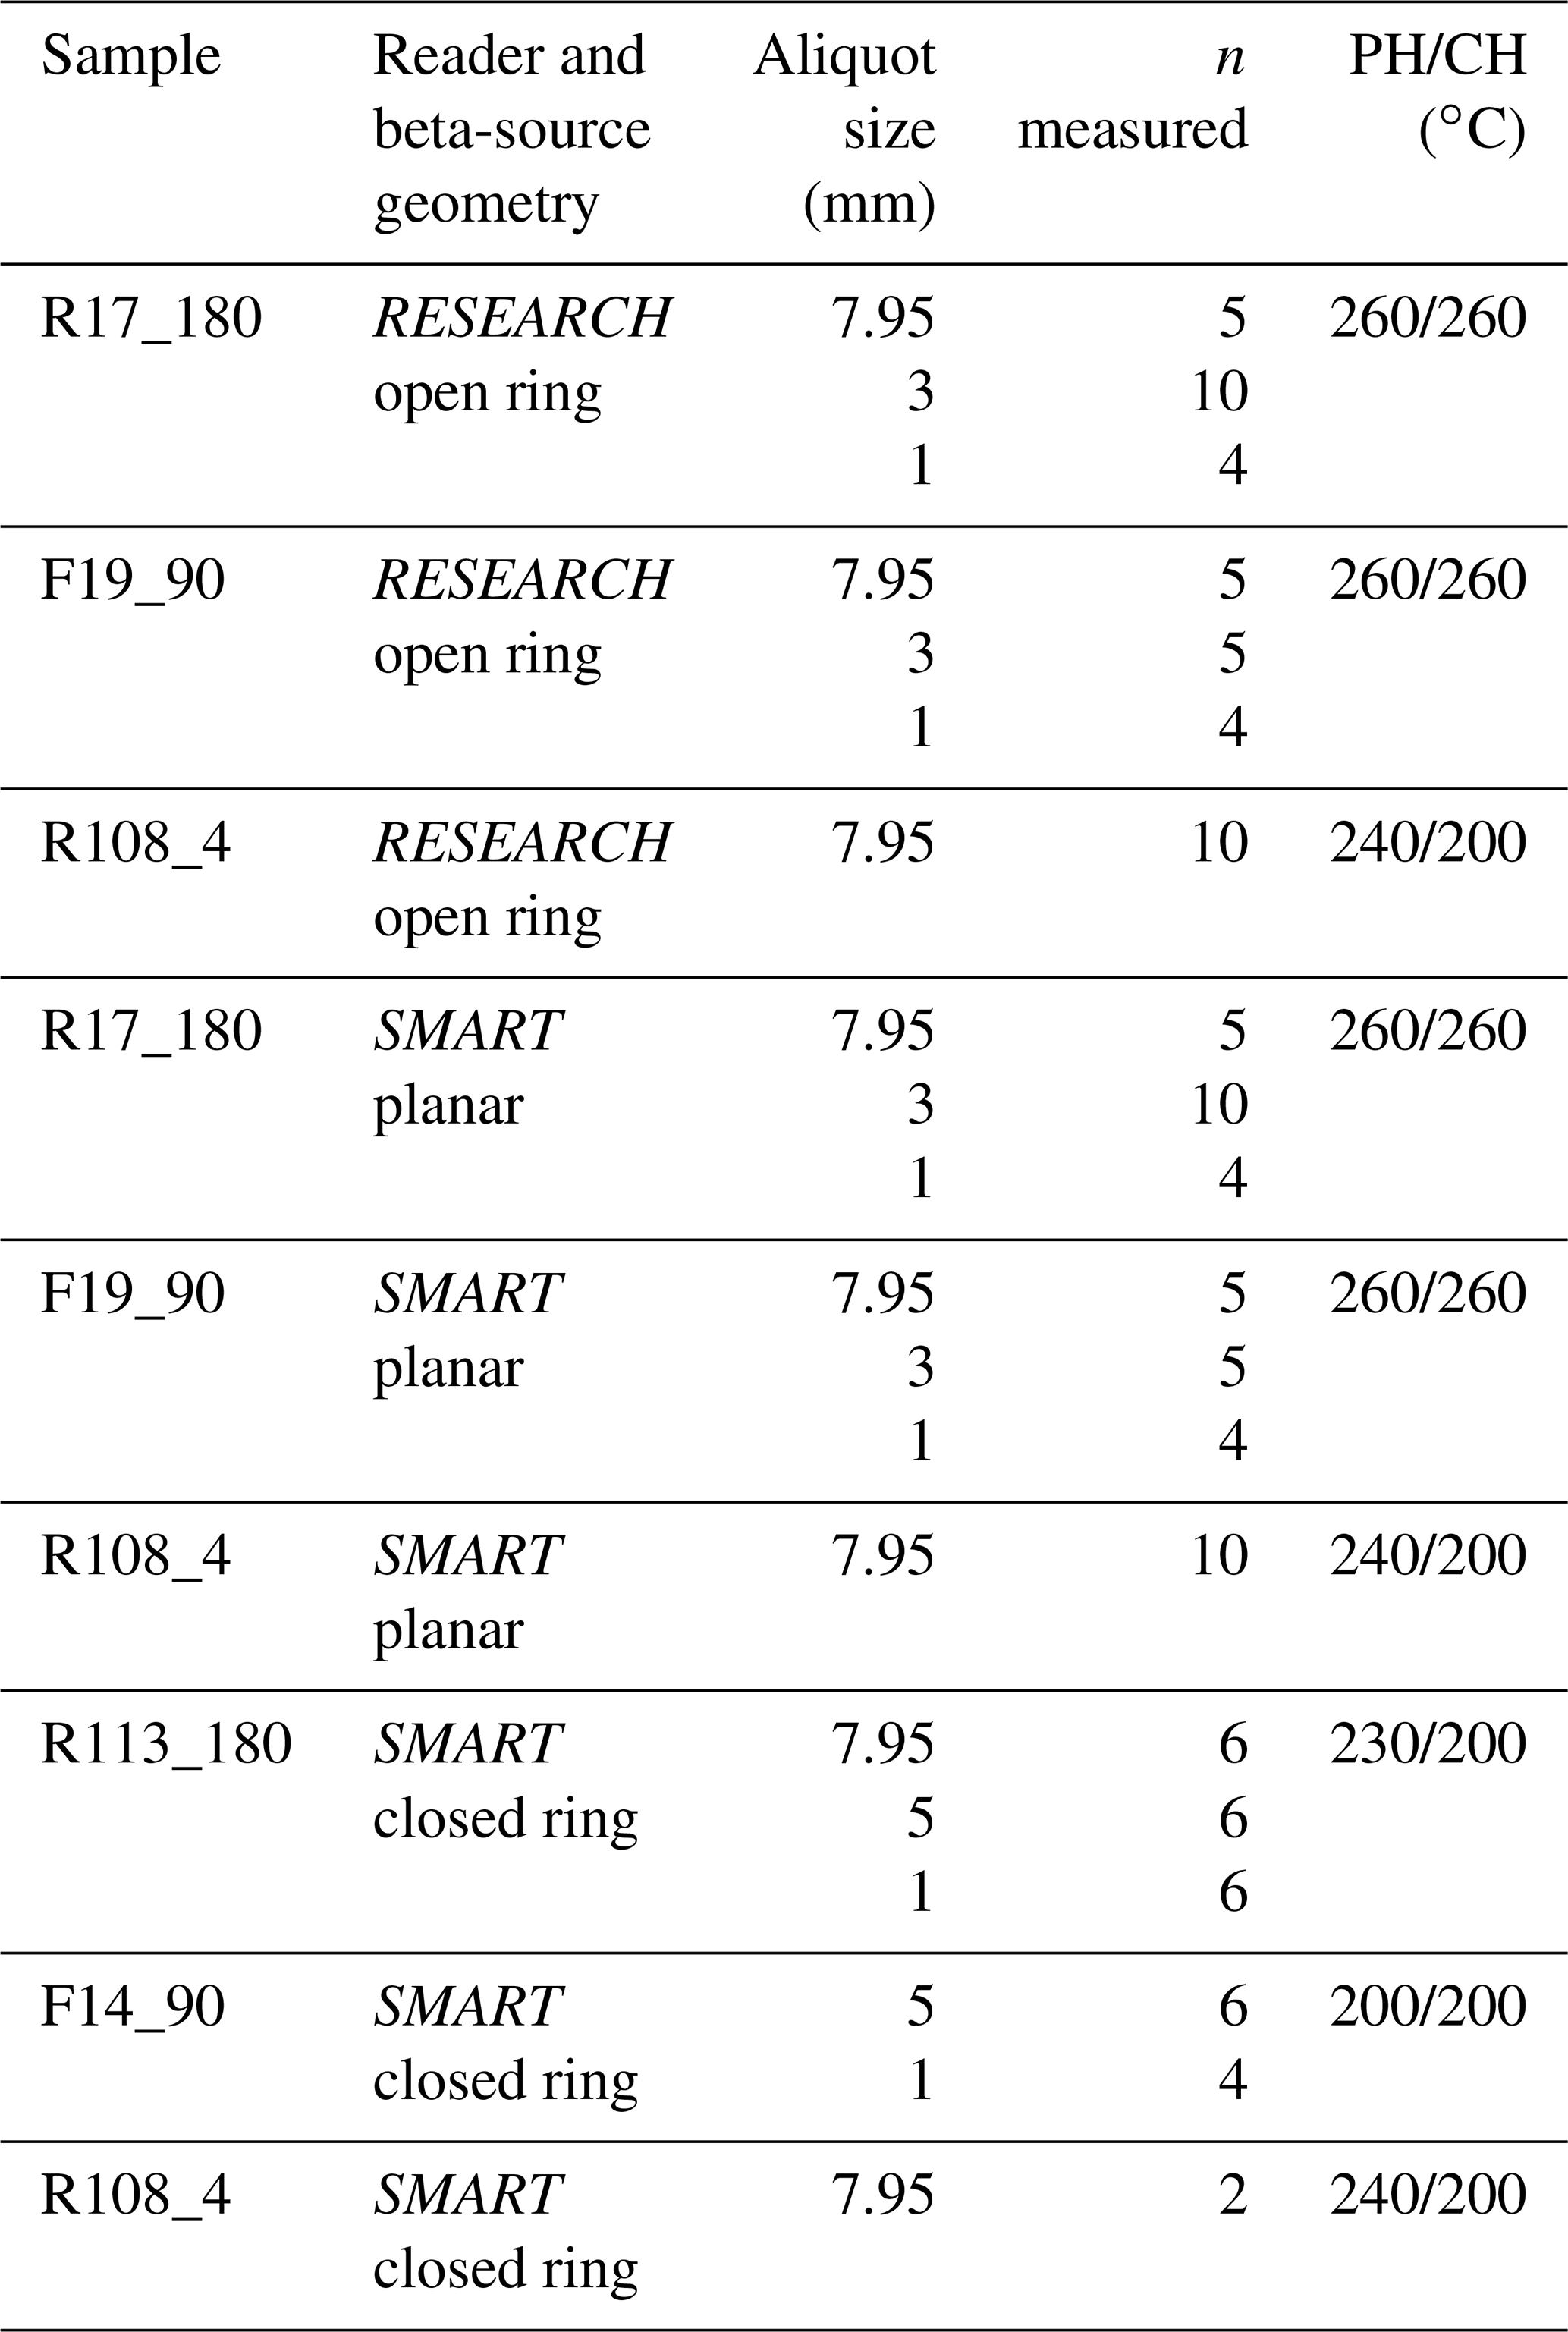
A standard single-aliquot regenerative (SAR) dose protocol was employed with irradiation doses adjusted to encompass the expected interpolation point on the dose-response curve and test doses typically around 10 % of the expected interpolation point (in seconds). The stimulation power of the blue LEDs (458Δ5 nm) was reduced as aliquot size increased to avoid overexposure of the photomultiplier. The efficiency of the protocol was tested using undosed subsamples (dose recovery better than 5 %; Tribolo et al., 2019). The measurement parameters are listed in Table 2.
Table 2Samples, luminescence readers and measurement parameters used in the experiments. To avoid overexposure of the photomultiplier, the stimulation power was 5, 10, 70 and 100 mW cm−2 of the blue LEDs (458Δ5 nm) depending on the size of the aliquot; PH/CH: preheat and cut heat temperatures for regeneration and test doses, respectively; preheat was for 10 s. For sample description, see also Table 1.
The simulation of the irradiation in the lexsyg SMART was performed using the GEANT4 and MCNP6.2 toolboxes. The irradiation geometry simulated (Fig. 2) was adopted from the technical description of the manufacturer and from the sample-carrier description (Fig. 1) with the sample placed in the centre of the cup. Source and housing including the fixing screws were represented as one stainless-steel cylinder surrounded by a stainless-steel shield. The quartz grains were not considered individually but represented as a cylinder, the size of which was modified according to the grain size (height) and aliquot diameter to be simulated. For simulating the dose rate as a function of depth in a given aliquot, the “sample cylinder” was subdivided into 5 or 10 µm thick layers depending on the grain size to be modelled. The material was SiO2 with a density of 1.8 g cm−3 which represents the packing of sand- and silt-sized spherical grains mounted as aliquots. A 5 µm layer of silicon oil was added between the sample and the sample carrier for the simulation of coarse-grain aliquots (grain sizes from 25 to 250 µm). The spectra of the 90Sr 90Y beta source were simulated using the GEANT4 radioactive decay function (Hauf et al., 2013). Then 108 disintegrations of 90Sr were simulated in each run, and three runs were carried out for each aliquot configuration. The Penetration and Energy Loss of Positrons and Electrons (PENELOPE) code for low-energy particle physics (Baró et al., 1995; Ivanchenko et al., 2011) was employed to calculate path and interaction of the beta particle with the structures presented in the model. The dose deposited in the SiO2 target was recorded in the whole sample cylinder, and a dose-rate profile was constructed as a function of depth in the sample. For simulating small aliquots, the MCNP6 code was used: the target was split into seven spherical cells (Fig. 2b) and the F6 tally was used to simulate the energy deposition averaged over the target cell for electrons and photons separately (see the Supplement for details). The output files produced by the MCNP6 code were used to quantify photon and electron production originating from the interaction mechanisms between beta particle and matter (for details, see the Supplement). The precision of the GEANT4-derived result was calculated for each aliquot configuration at the 95 % confidence level (0.95 CL), based on the standard deviation between the results of the three runs per simulation. The uncertainty of the MCNP6-derived result was obtained from the fractional standard deviation calculated by the Monte Carlo routine.

Figure 2The geometry of the 90Sr 90Y source in the lexsyg SMART as designed for the simulation. (a) The GEANT4 simulations (not to scale; ss indicates stainless steel). The active element is a ring of 17 small beta sources closed to the top, or it is a planar foil. The cylinder-shaped sample is represented by 5–10 µm thick layers resting on a 5 µm layer of silicon oil (blue colour). The aliquot size illustrated is 7.95 mm. The distance between bottom of cup and surface of source is 7 mm; (b) plan view on individual grains represented as spheres of SiO2 used in the MCNP6 simulations. Cell numbers 401–406 represent “edge grains”, and cell number 407 is the central grain.
4.1 The calibration material
The calibration samples provided by the manufacturers show high sensitivity to the dose and, consequently, excellent reproducibility. Small-to-large differences between samples are evident from the experimental data which are not systematic but seem to depend on measurement parameters (e.g. aliquot size) and, eventually, on the calculation of the gamma dose (Tribolo et al., 2019). In fact, Tribolo et al. (2019) identified an up-to-14 % difference of dose rate between samples when analysing single grains of the same calibration samples used here (F14_90; R113_180; Table 2). This was subsequently reduced as a result of one of the manufacturers changing their gamma-dose calculation which is still subject to ongoing research (Martin Autzen, personal communication, June 2021).
4.2 Uncertainty of data
The total uncertainty of the experimental data is derived from the optically stimulated luminescence (OSL) measurement statistics and the uncertainty of the gamma dose amounting to a standard error of the mean of 2 %–4 %. At the 95 % confidence level (t95), the uncertainty is around 4 %–7 % for n > 5 and 8 %–13 % for n < 5 (Table 3) due to the small number of aliquots measured. Therefore, we regard differences between individual dose-rate values of > 4 % as informative and differences > 8 % as significant. For the GEANT4-derived simulation data, the uncertainty is 0.15 %–3.00 %, where the majority of the data show an uncertainty of < 1 % due to the expected excellent reproducibility of the simulation runs. The MCNP uncertainty is the fractional standard deviation which is typically 0.1 %–1.1 % in our study.
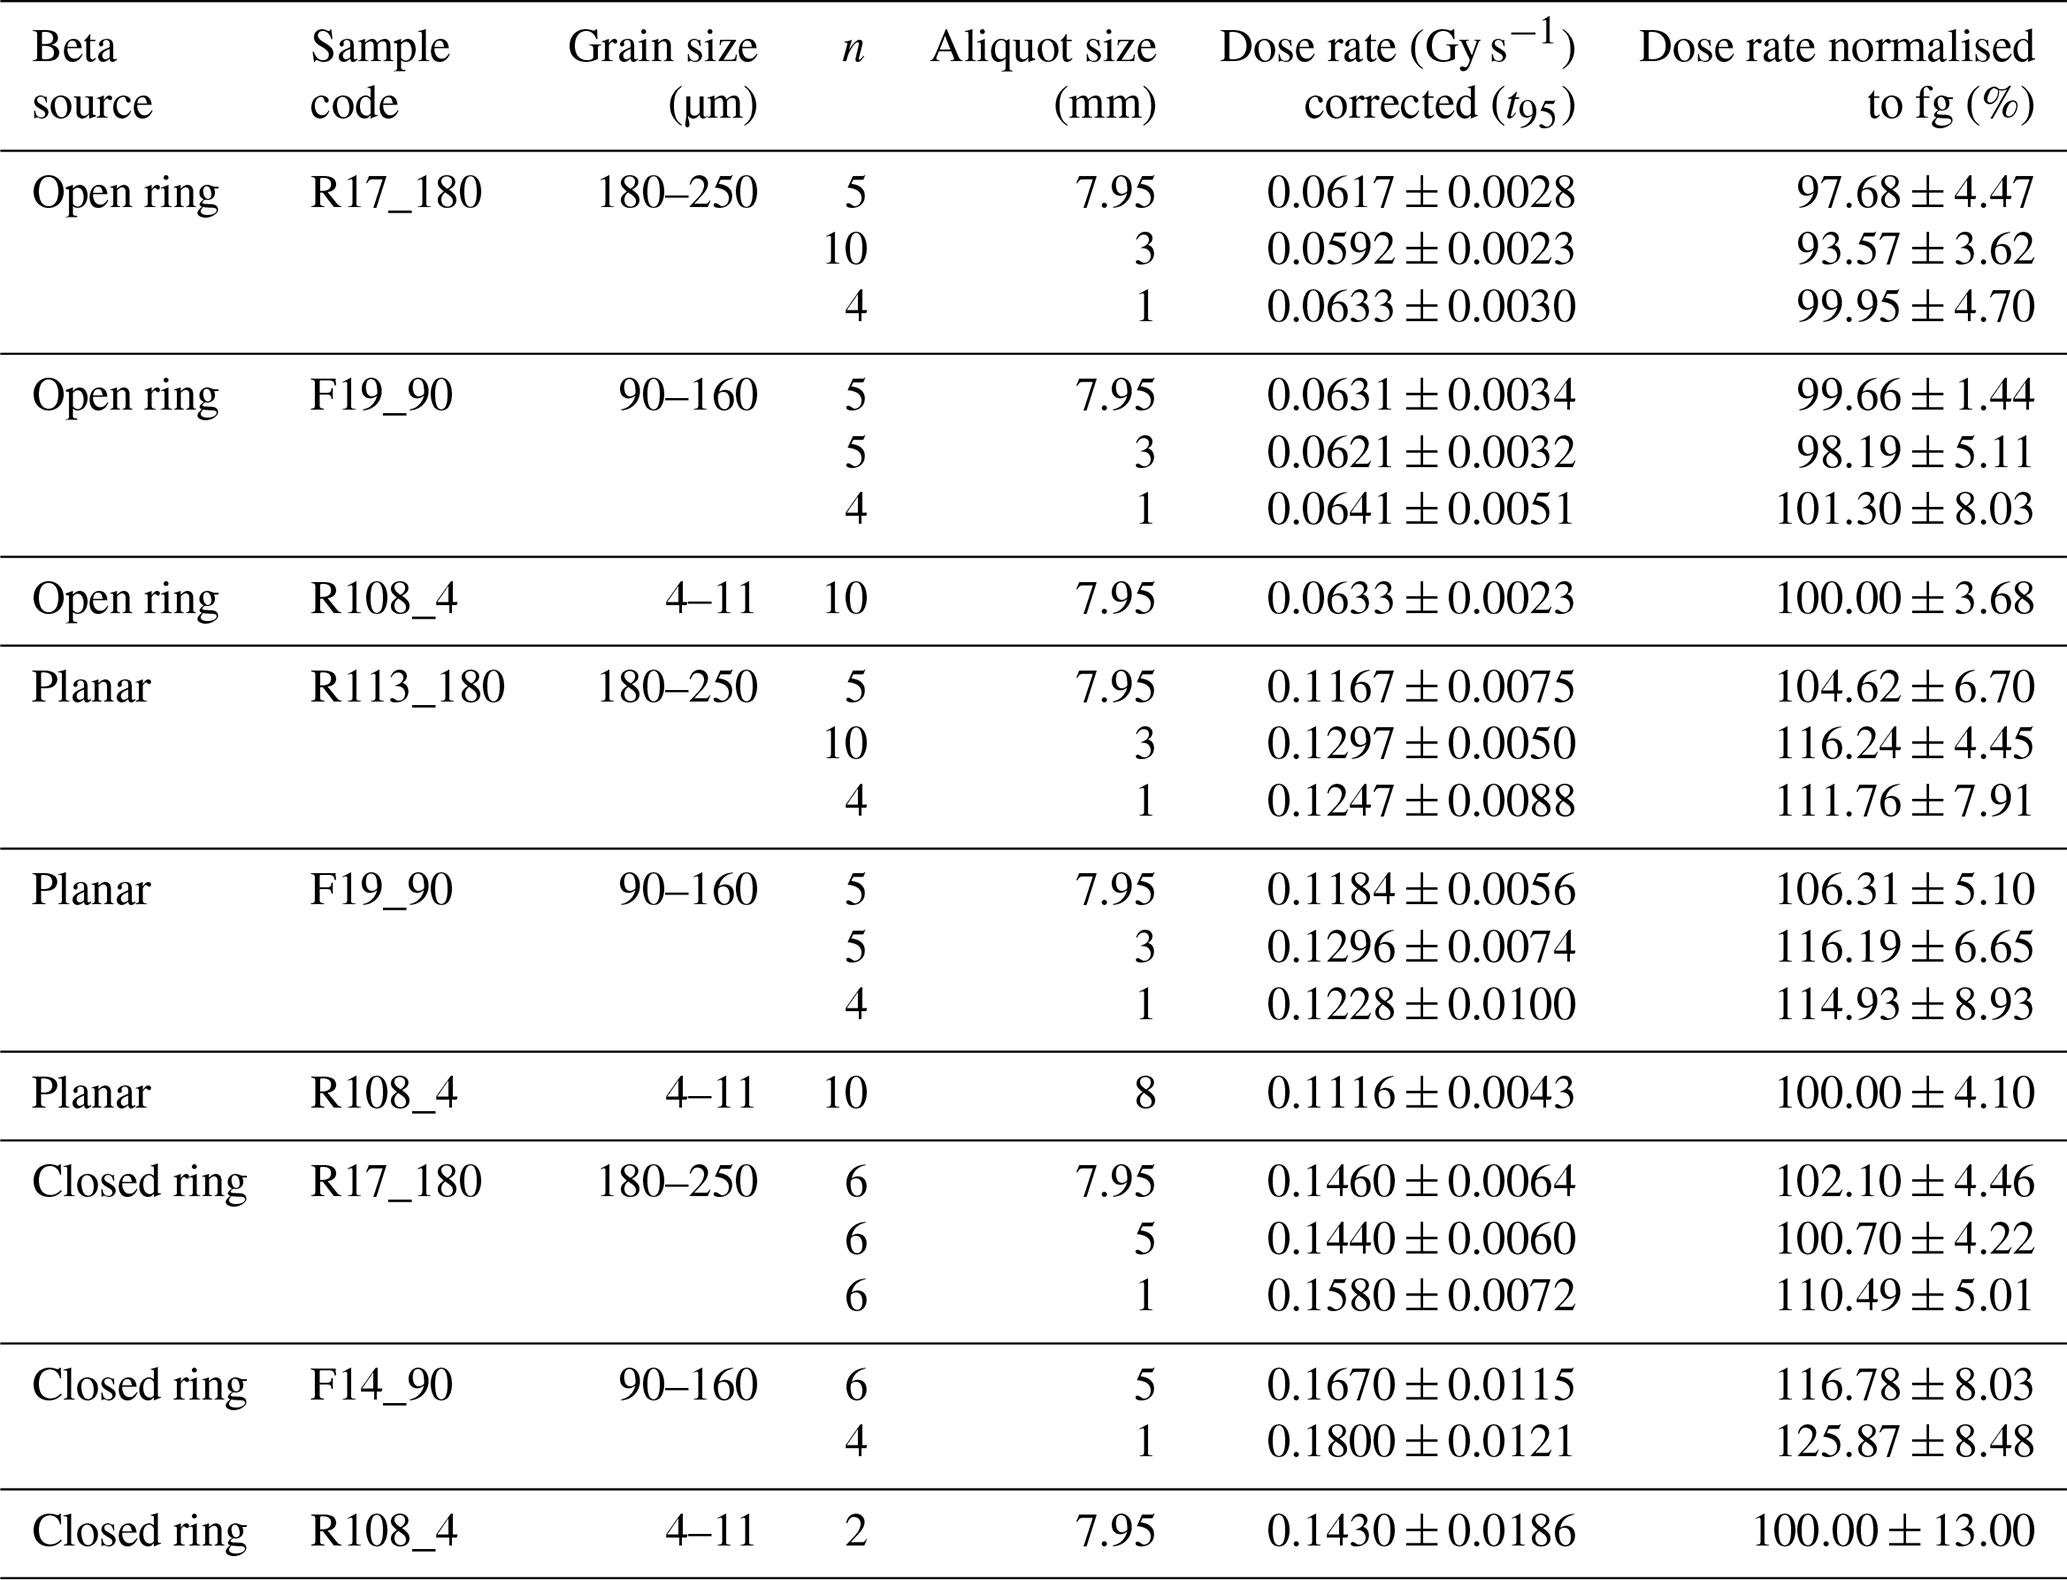
Table 3Beta-dose rates obtained from experiments. Open ring is the beta source of the lexsyg RESEARCH reader, planar is the one of the lexsyg SMART (built 2017) reader, and closed ring is the one of the other lexsyg SMART (built 2014) reader (Fig. 1). Dose rates listed are mean values with uncertainties quoted at 95 % confidence level (t95) derived from the t distribution for n−1. Mean dose rates were corrected for the decay of the 90Sr 90Y source using years and the time elapsed since reference datum (21 January 2020). Uncertainty of the normalised value is relative to the numerator which is aliquot size; fg indicates fine grain. For details, see the text.
4.3 Grain size and aliquot size
Our experimental data indicate a grain-size dependence that varies for the coarse-grained samples (90–160 and 180–250 µm) with aliquot size and beta-source geometry between 0 % and 26 % (Fig. S1 in the Supplement and Table 4). The data indicate that the impact of grain size on the dose rates is insignificant for large (7.95 mm) aliquots (Table 4). For aliquot sizes < 7.95 mm, the difference between the two coarse-grained samples is also negligible except for the closed-ring source (Fig. 3). In contrast, the difference between fine-grain and coarse-grain dose rates is 0.4 %–26 % for aliquot sizes < 7.95 mm and the magnitude of this difference is controlled by the individual source (Table 3) and by the distance between source and sample. This latter distance changes with changing grain size resulting in an absorbed dose that is about 3 %–4 % higher for large grains than for fine grains. With decreasing aliquot size, the dose rate increases by ∼ 4 %–8 % for both coarse-grain fractions (Fig. 4), but this increase is statistically not significant (Table 3).
Table 4Ratios between dose rates obtained from the three grain-size fractions and the three aliquot sizes used in the experiments. 180 : 90 is the ratio between the two coarse-grained samples; 4 : 90 and 4 : 180 are the ratios between the fine-grained and the coarse-grained samples. Errors are quoted at the 95 % confidence level resulting from the Student's t distribution.

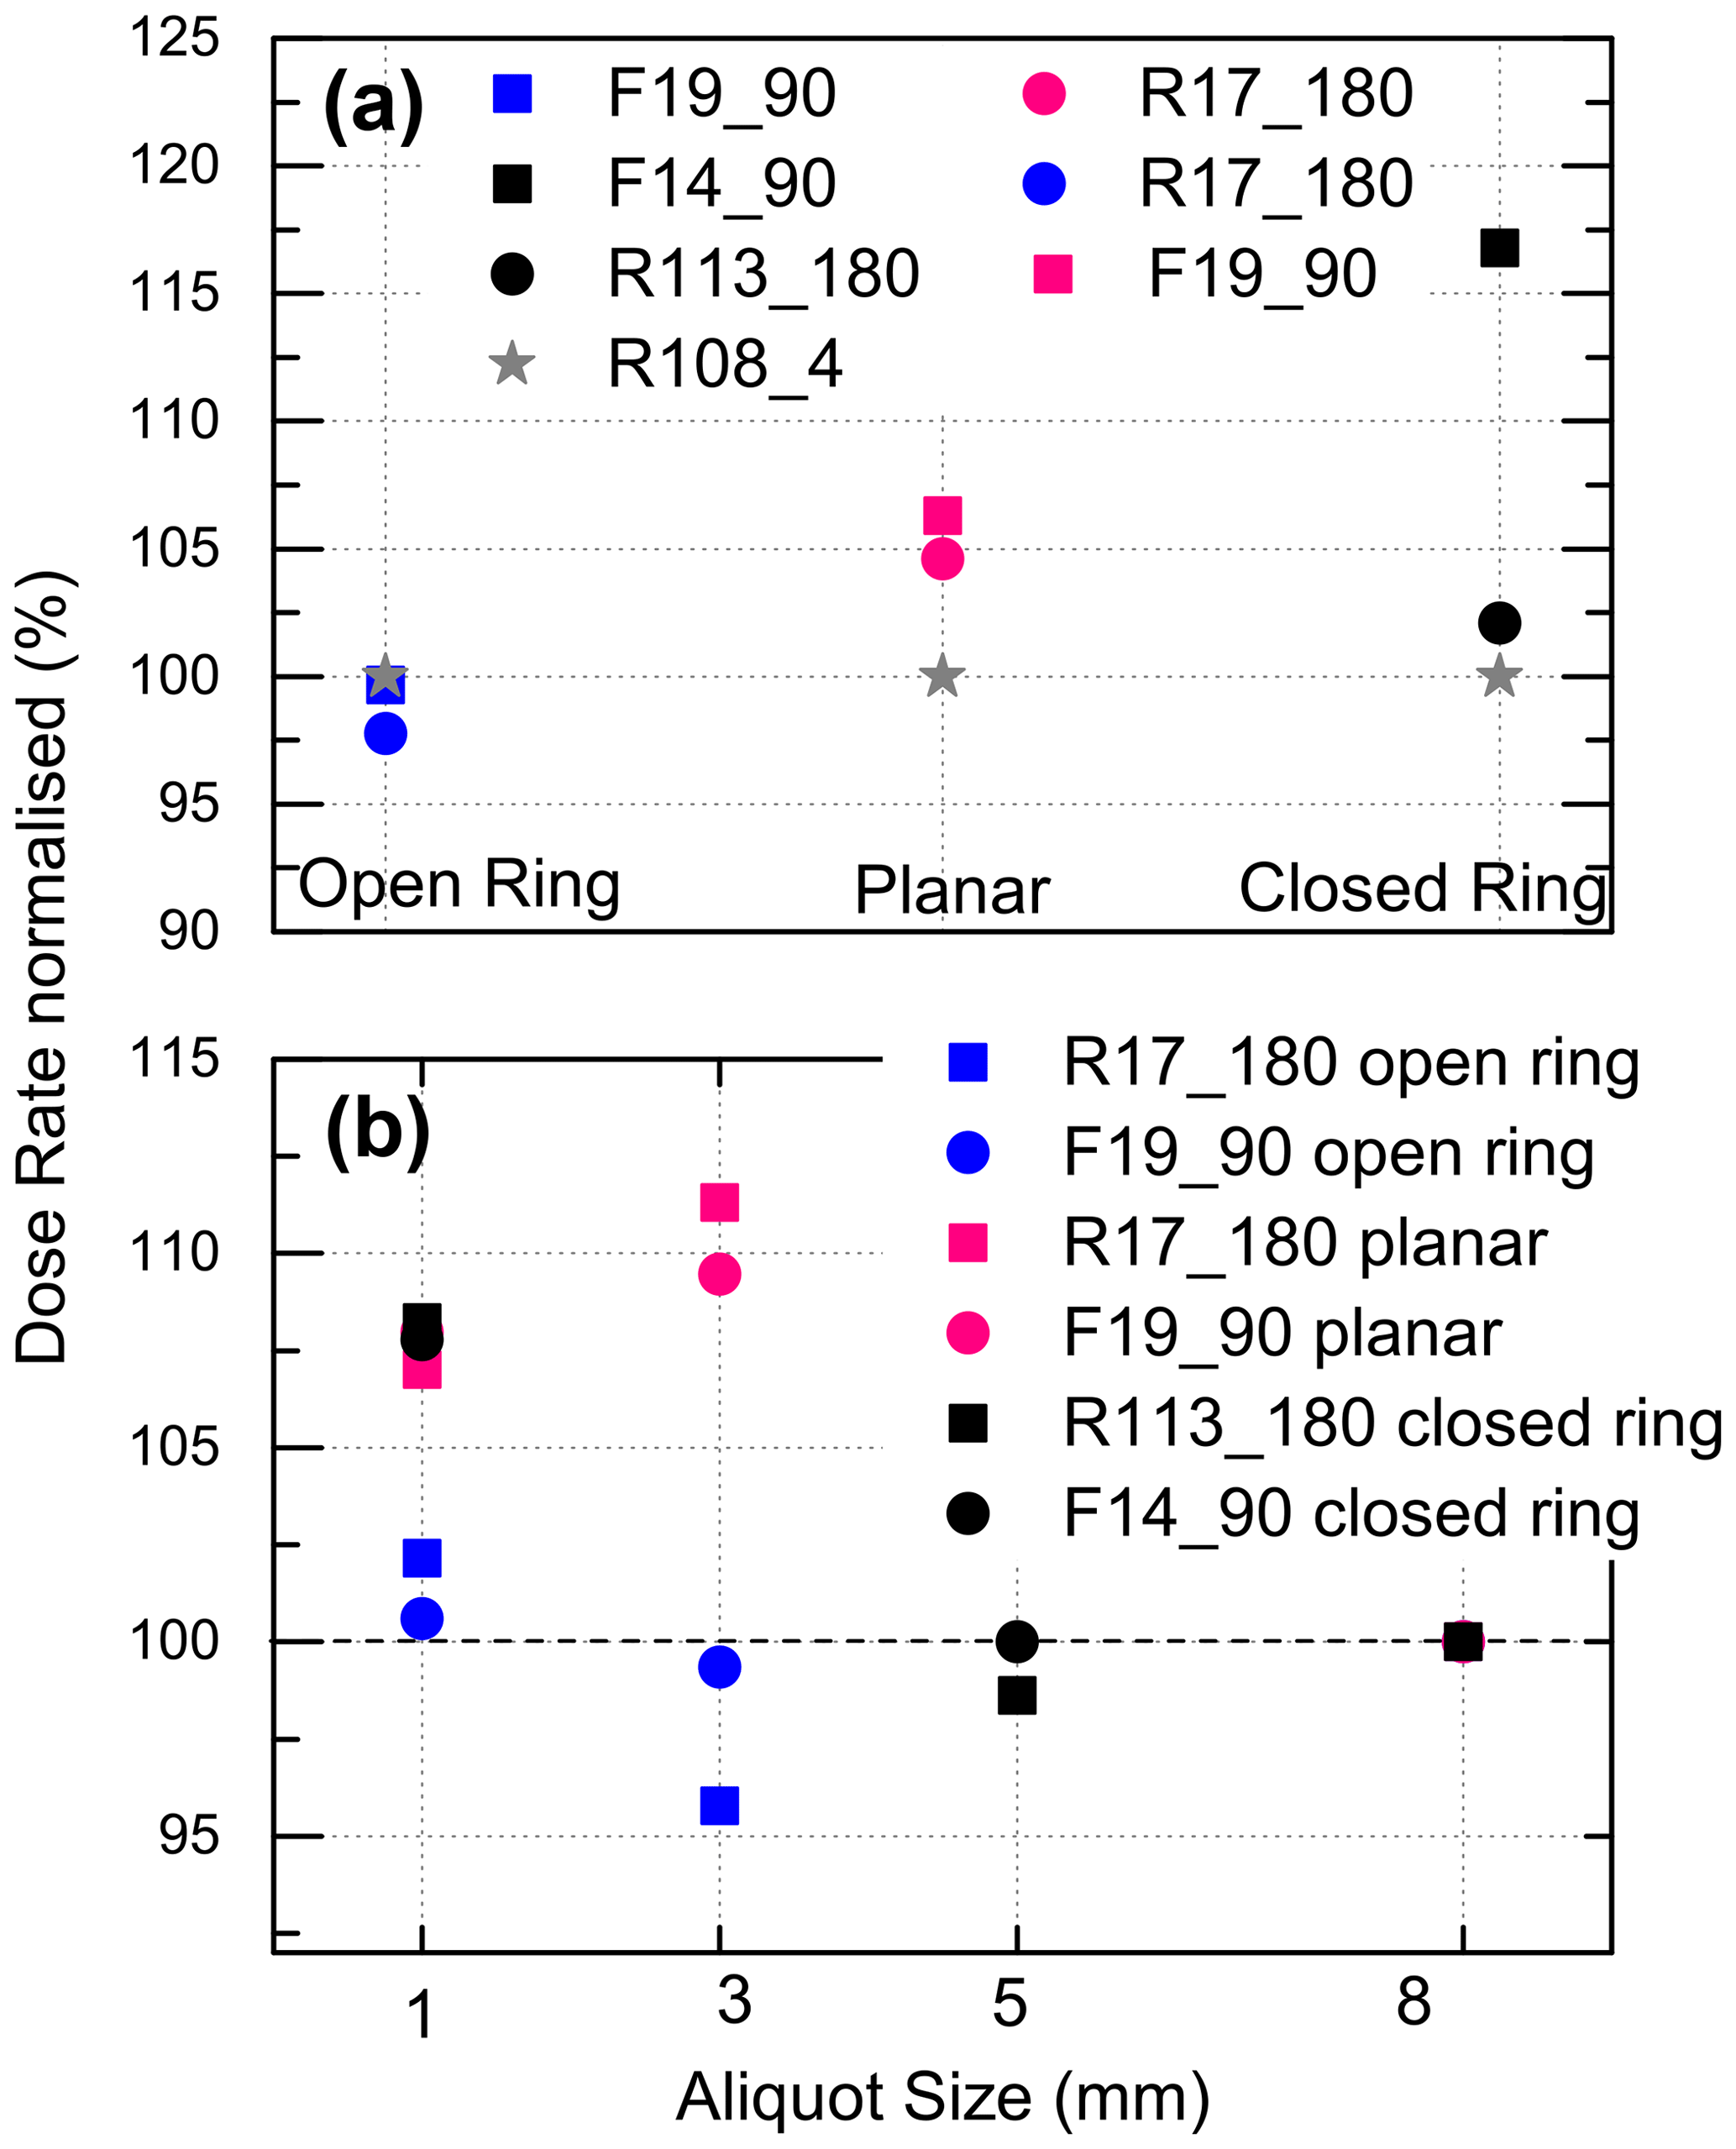
Figure 3Experimentally determined normalised beta-dose rates. (a) Dose rate normalised to the respective fg value (sample R108_4) versus beta-source shape; aliquot size is 7.95 mm (R17_180; F19_90) or 5 mm (F14_90). (b) Dose rate normalised to 7.95 or 5 mm aliquot size plotted versus aliquot size. For the sake of clarity, error bars are not plotted. For data and uncertainty, see Table 3.
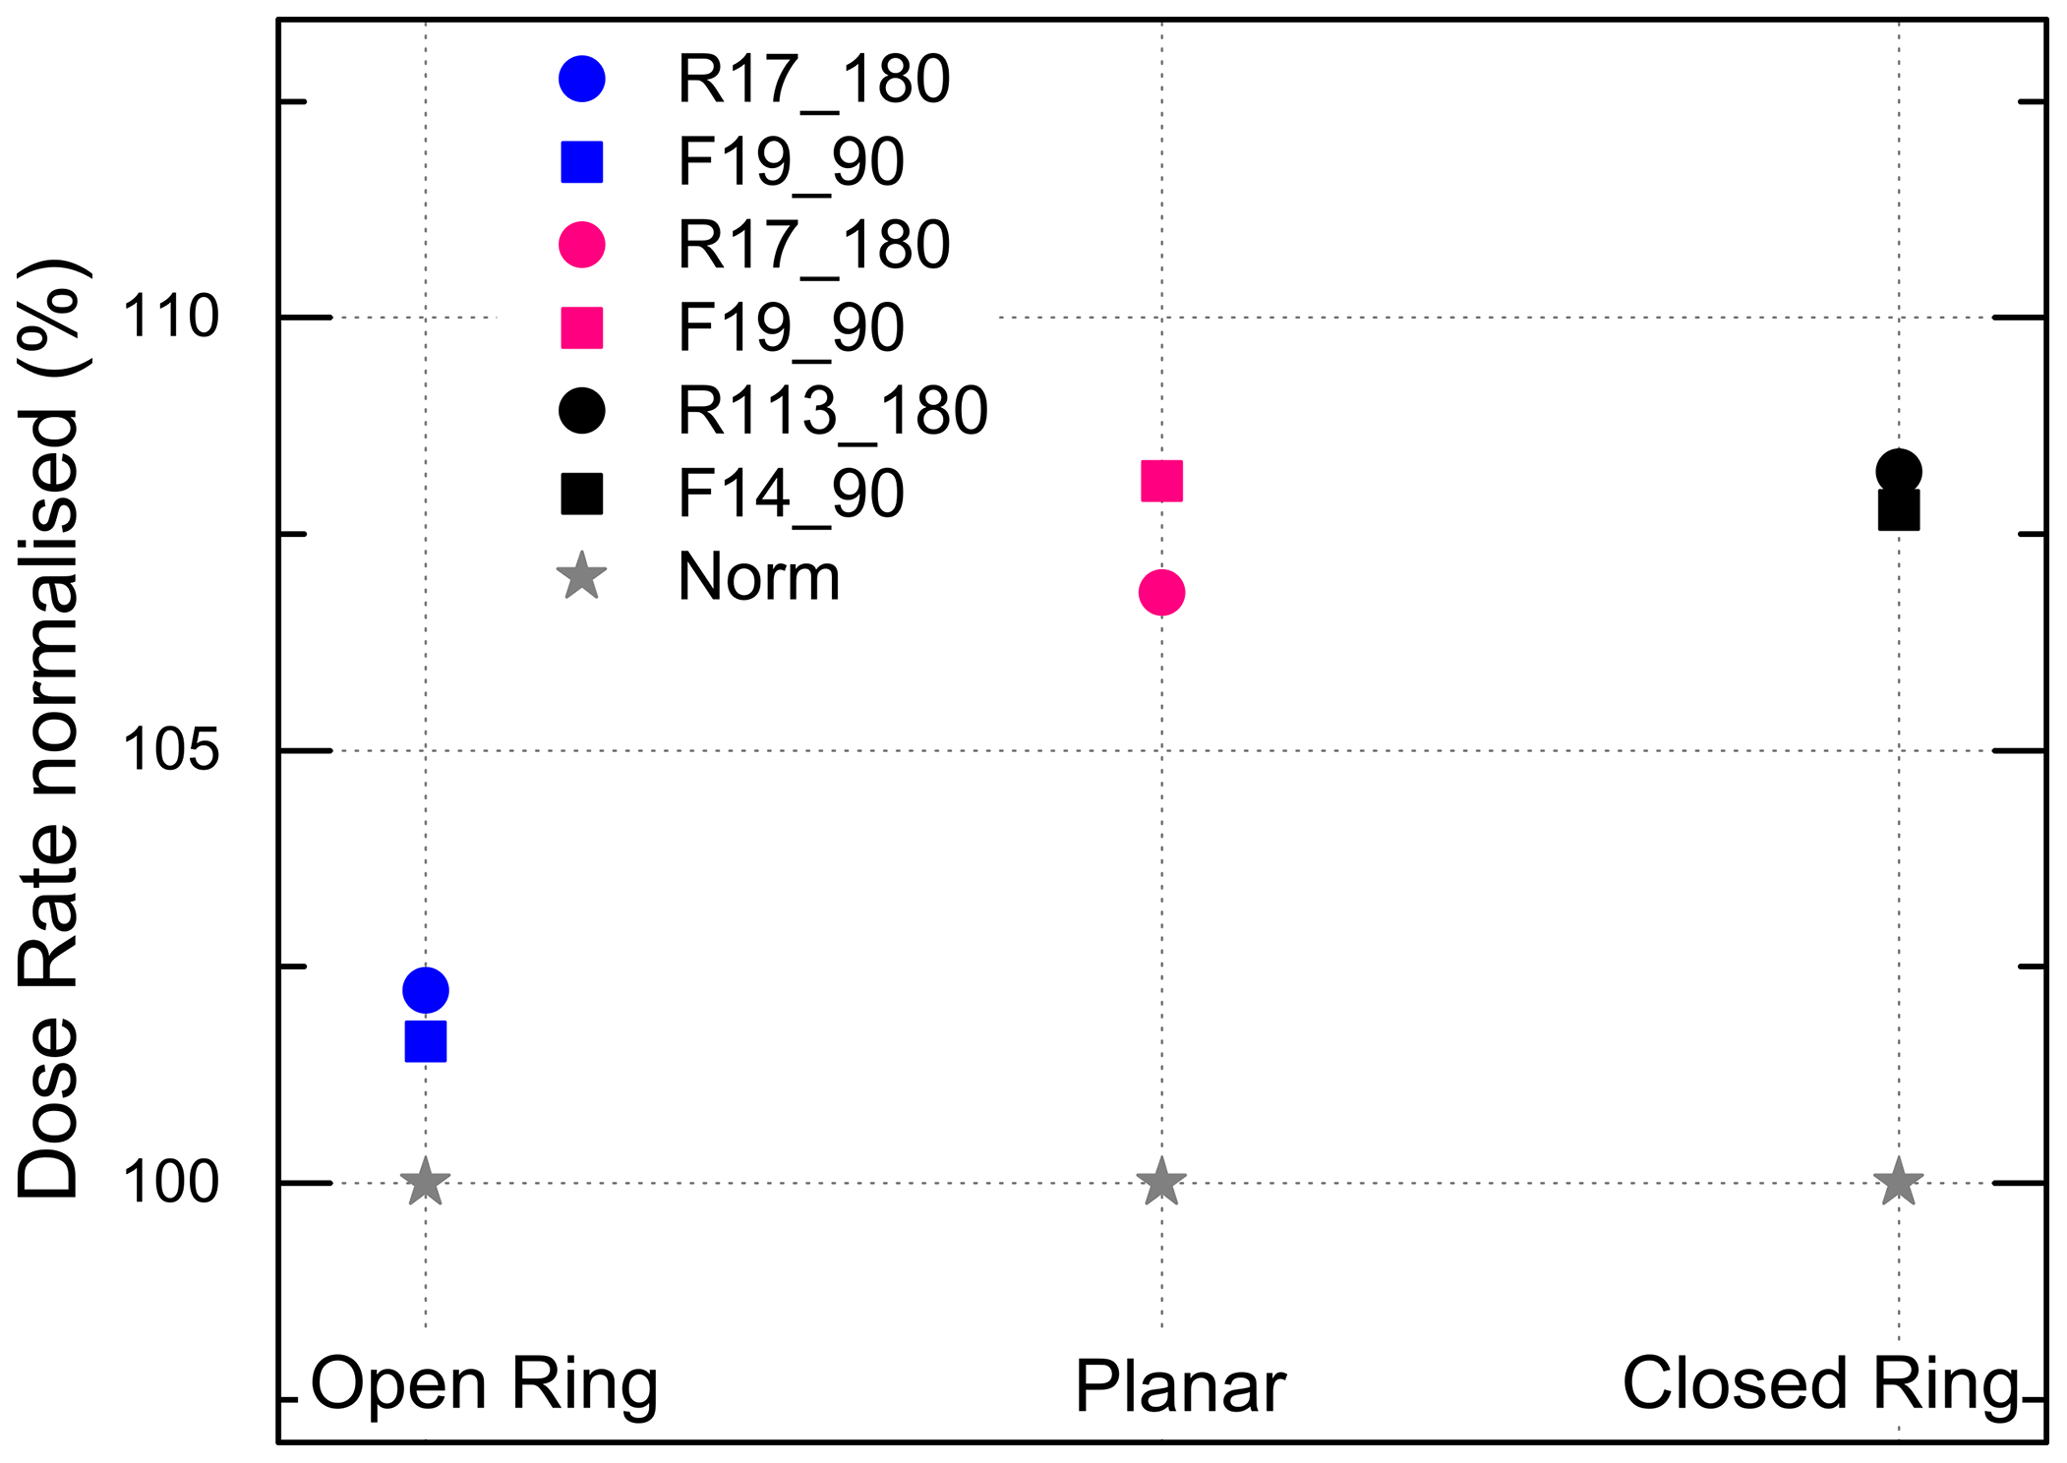
Figure 4Beta-dose rates of 1 mm aliquots normalised to the 7.95 or 5 mm aliquot size of the respective sample versus beta-source shape. For the sake of clarity, error bars are not plotted. For data and uncertainty, see Table 3.
The data obtained from the simulations indicate a rise of dose rate with increasing grain size (Fig. 5). There is a striking similarity between our simulated data and the experimental data adopted from Armitage and Bailey (2005). Indeed, the simulation shows a gradual change of the grain-size effect over the entire grain-size range which is confirmed by the experiment for grain sizes < 55 µm, but for grain sizes > 100 µm the experiment indicates rather no change than gradual increase of the dose rate (Fig. 5). Because source-to-sample distance is the same in simulation and experiment, charge build-up as a function of grain size should also be the same. We discuss this in Sect. 5. The simulations also indicate that decreasing aliquot size enhances the dose rate by ∼ 10 %–20 % (Fig. 6). This significant gain of absorbed dose is probably caused by the secondary electron field and is discussed in Sect. 5.
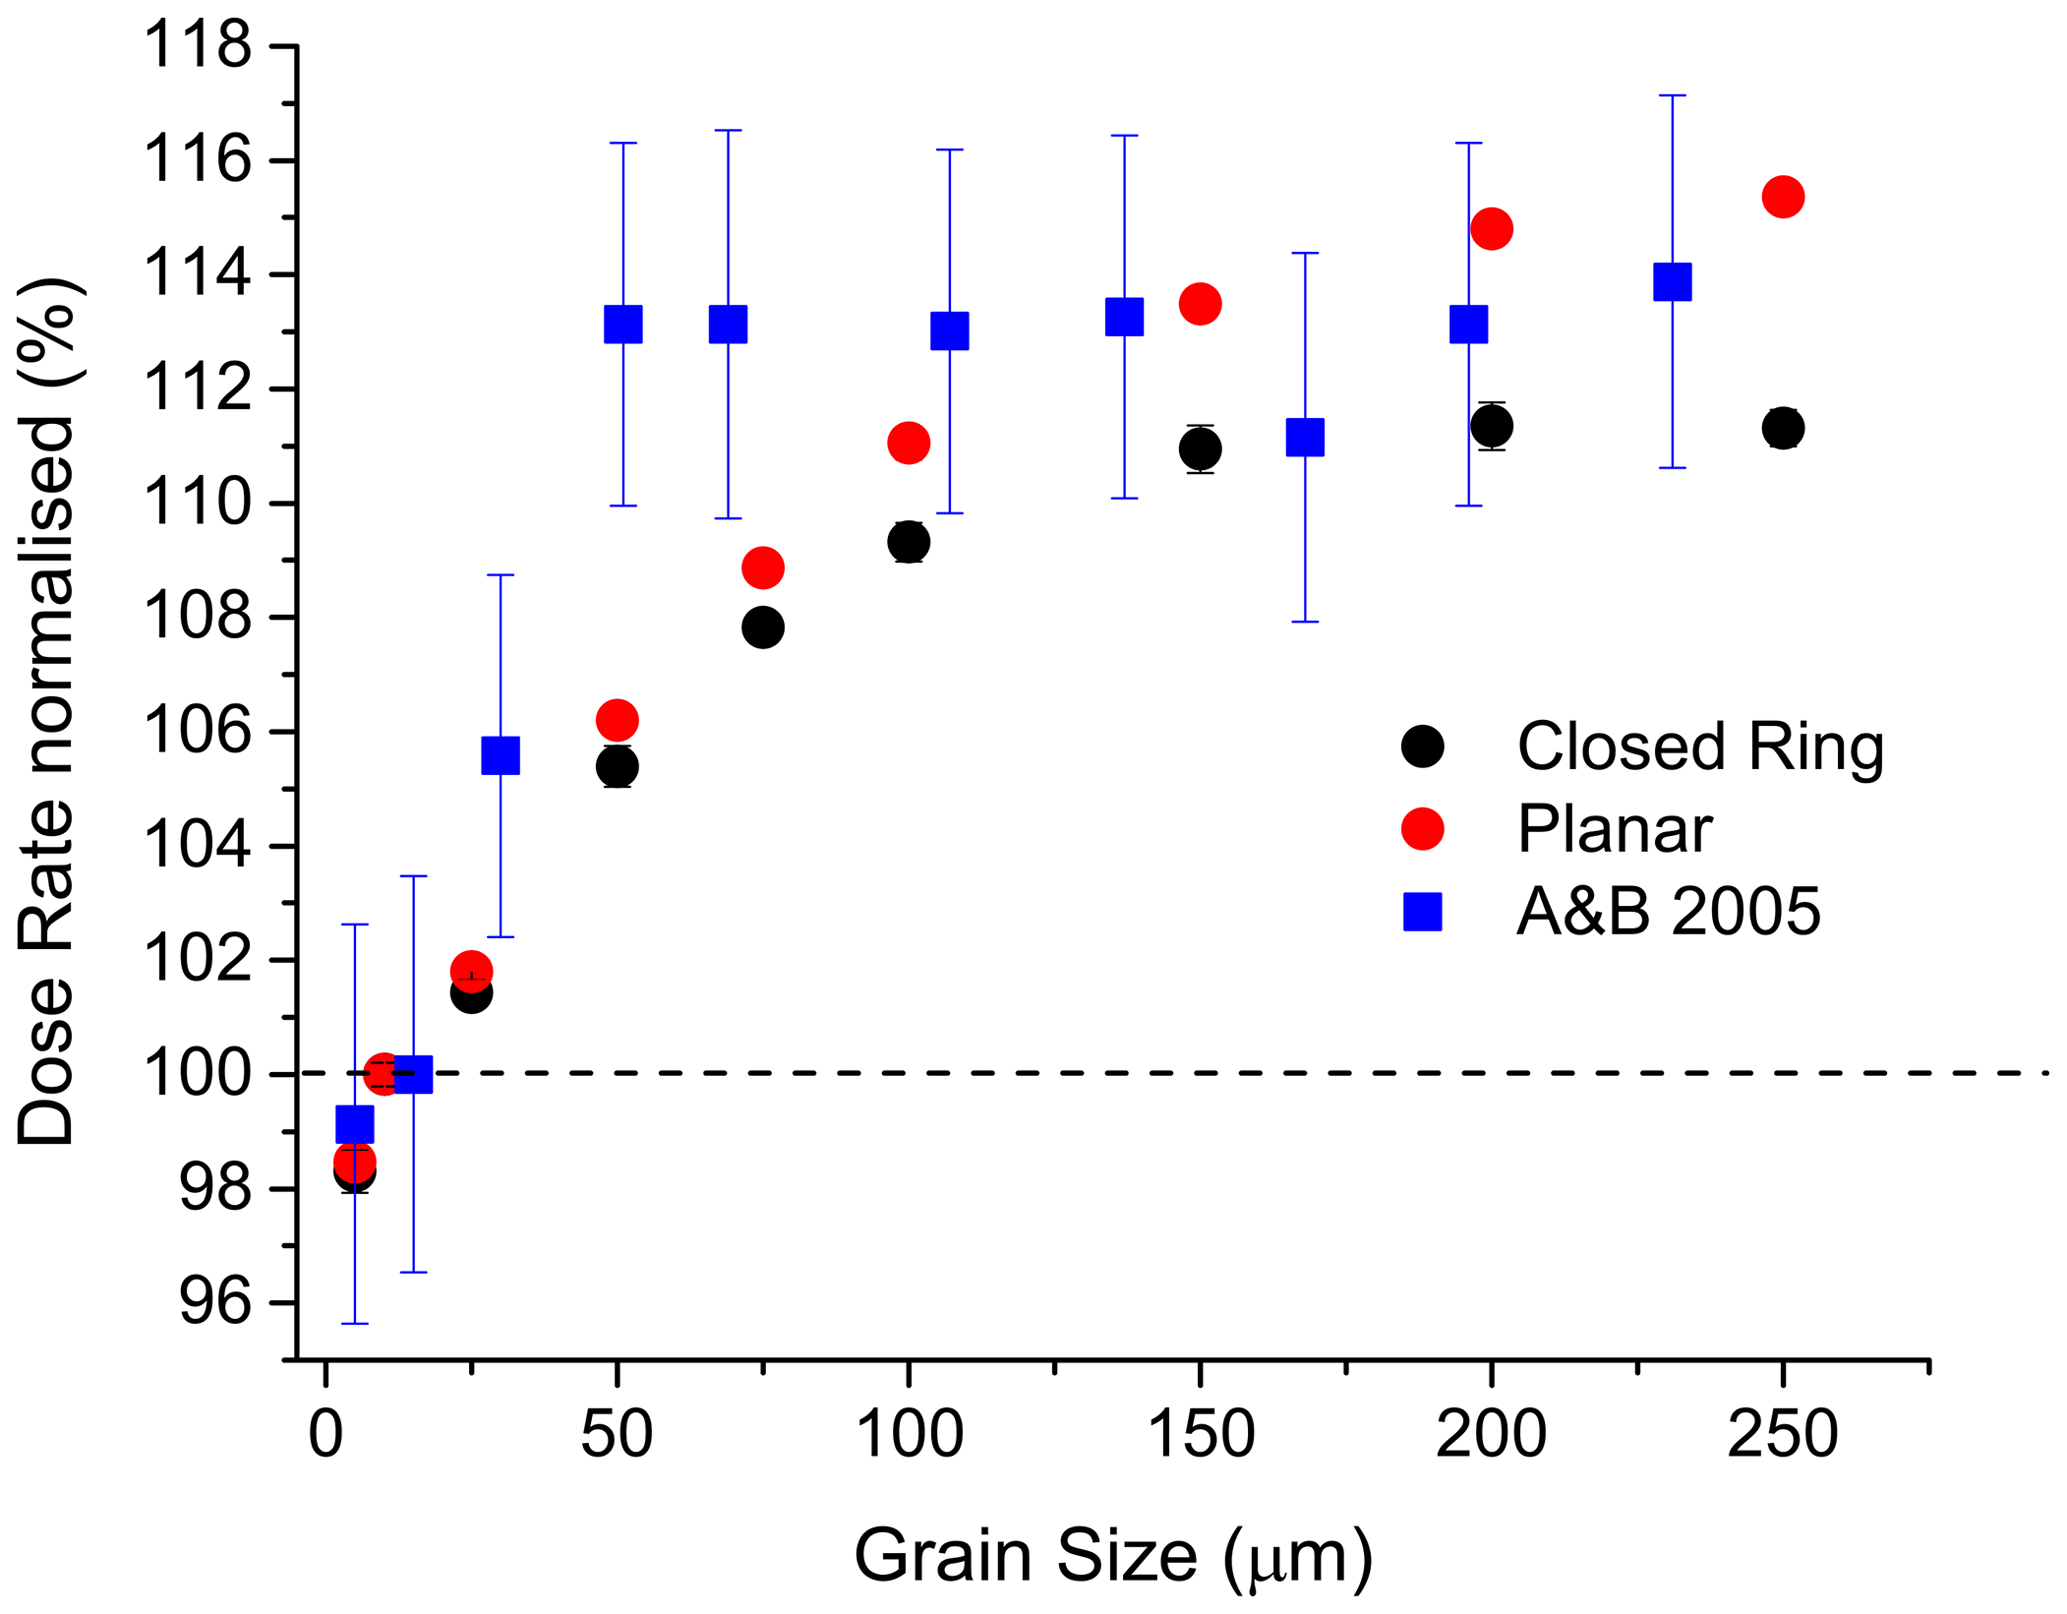
Figure 5Result from GEANT4 simulation compared to published experimental data. The dose rate is plotted as a function of grain size for the planar source and the closed-ring source and for experimental data (A&B 2005; Armitage and Bailey, 2005). Simulated data are normalised to the 10 µm grain size; aliquot size is 7.95 mm on stainless steel cup. Experimental data of A&B 2005 are normalised to the 15 µm grain size with aliquot size of 9 mm on aluminium disc.
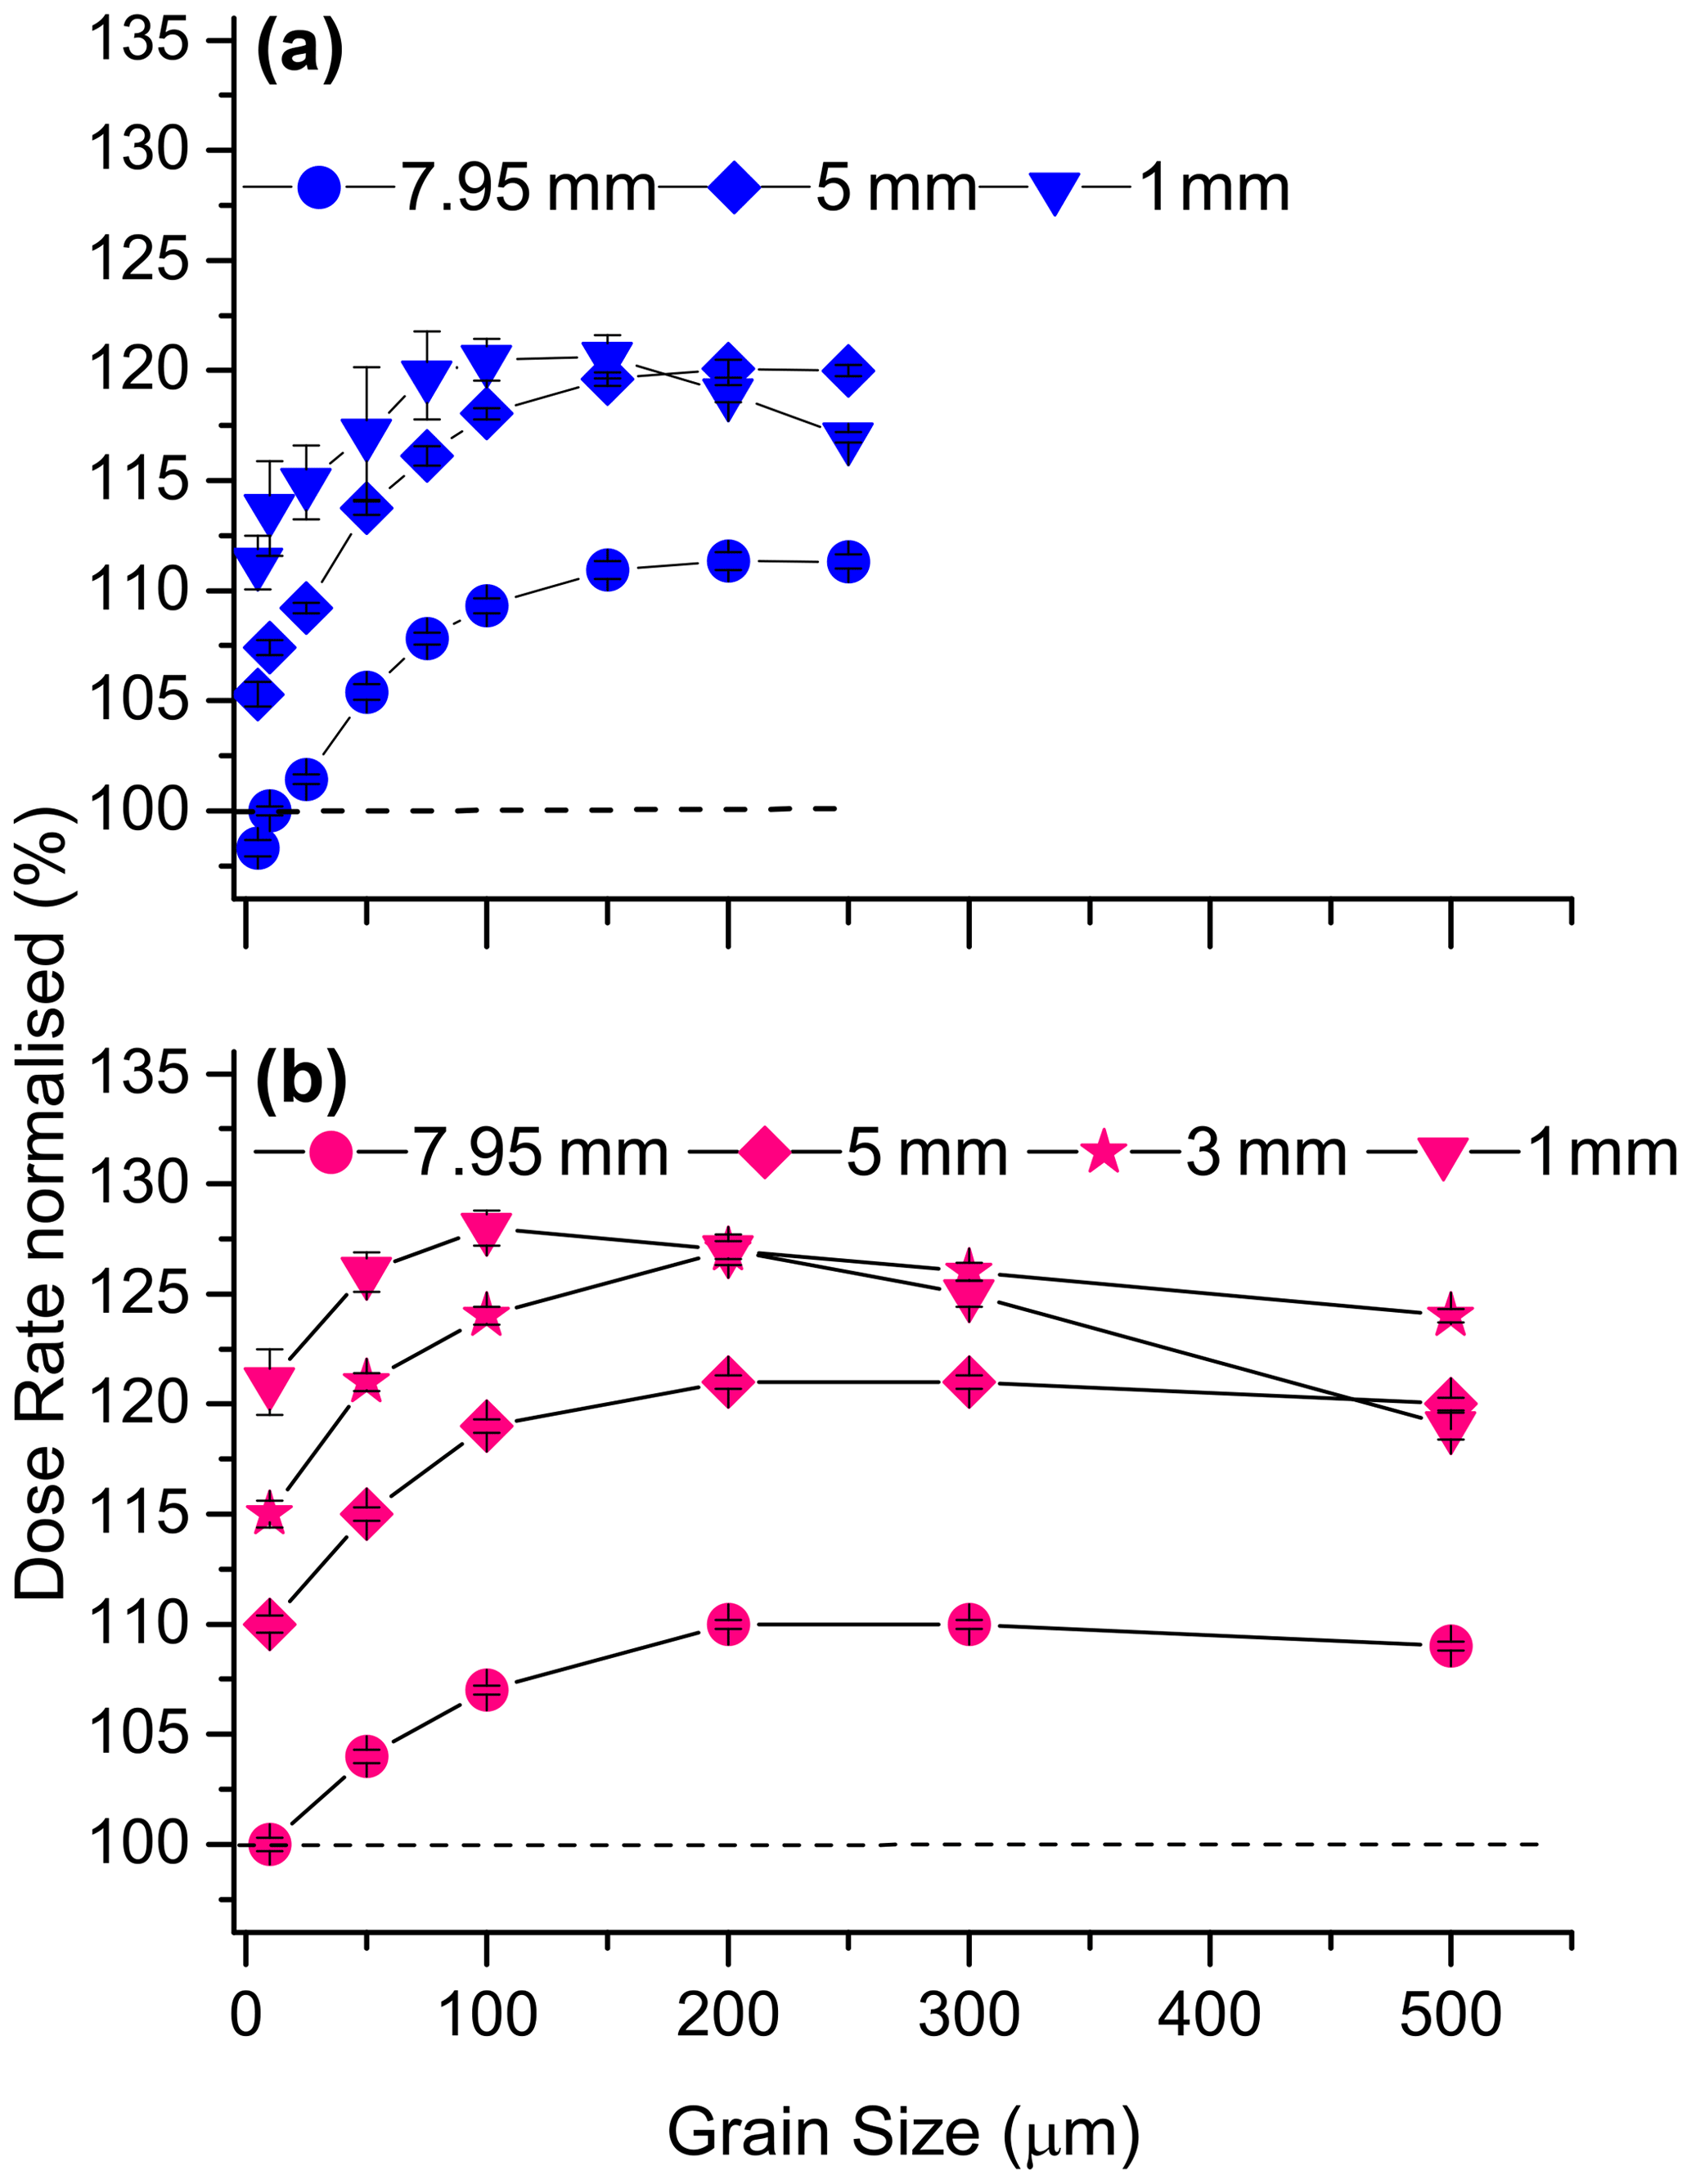
Figure 6Result from simulations for dose rate as a function of grain size and aliquot size. Dose rate is normalised to the 10 µm grain size and 7.95 mm aliquot size expressed in percent; (a) GEANT4 for the closed-ring beta source; (b) MCNP6 for the planar beta source and grain sizes up to 500 µm to assess the significance of the trend.
4.4 Beta-source shape
There is compelling evidence from the experimental data (Figs. 3 and 4) that geometry and homogeneity of the irradiation field influence the dose rate. The effect of grain and aliquot size is the smallest for the open-ring source due to its special design and is the biggest for the closed-ring source (Table 4). Because both sources simulated here (planar and closed ring) show the same response to aliquot size and grain size (Figs. 5, 6), we conclude that the shape of the source controls the magnitude of the dose rate. The generalised rule seems to be correct in particular for large- and medium-sized aliquots but not for aliquot sizes < 5 mm (see details in Sect. 4.5). This is confirmed when simulating charge build-up as a function of depth in aliquot (Fig. 7): beyond the depth of approximately 150 µm, the magnitude of the build-up depends on aliquot size and source shape: the increase of dose rate is small in large aliquots irradiated by the closed ring source and significant in medium-to-large aliquots irradiated by the planar source. It is negligible in small aliquots regardless the shape of the beta source. For shallower depths (< 150 µm), the magnitude of build-up is enhanced by the electron backscatter of the ss cup (Fig. 7).

Figure 7Result from GEANT4 simulation: charge build-up in quartz grains of 250 µm size resting on a 7.95 mm ss cup compared to no cup as a function of depth in the sample for the two beta-source geometries. The sample is composed of 10 µm thick cylinder-shaped layers (see Fig. 1). Dose rate is normalised to the 10 µm layer and 7.95 mm aliquot size and represented in percent.
4.5 Small aliquots
A drop of dose rate for grain sizes > 200 µm and aliquot sizes < 5 mm is evident from the dose deposition versus depth in grain (Fig. 7), from the comparison between grain and aliquot size (Fig. 6) and from the irradiation profile across the cup (Fig. 8). The experimental data show this drop only for the planar source, albeit indistinguishably within uncertainties.
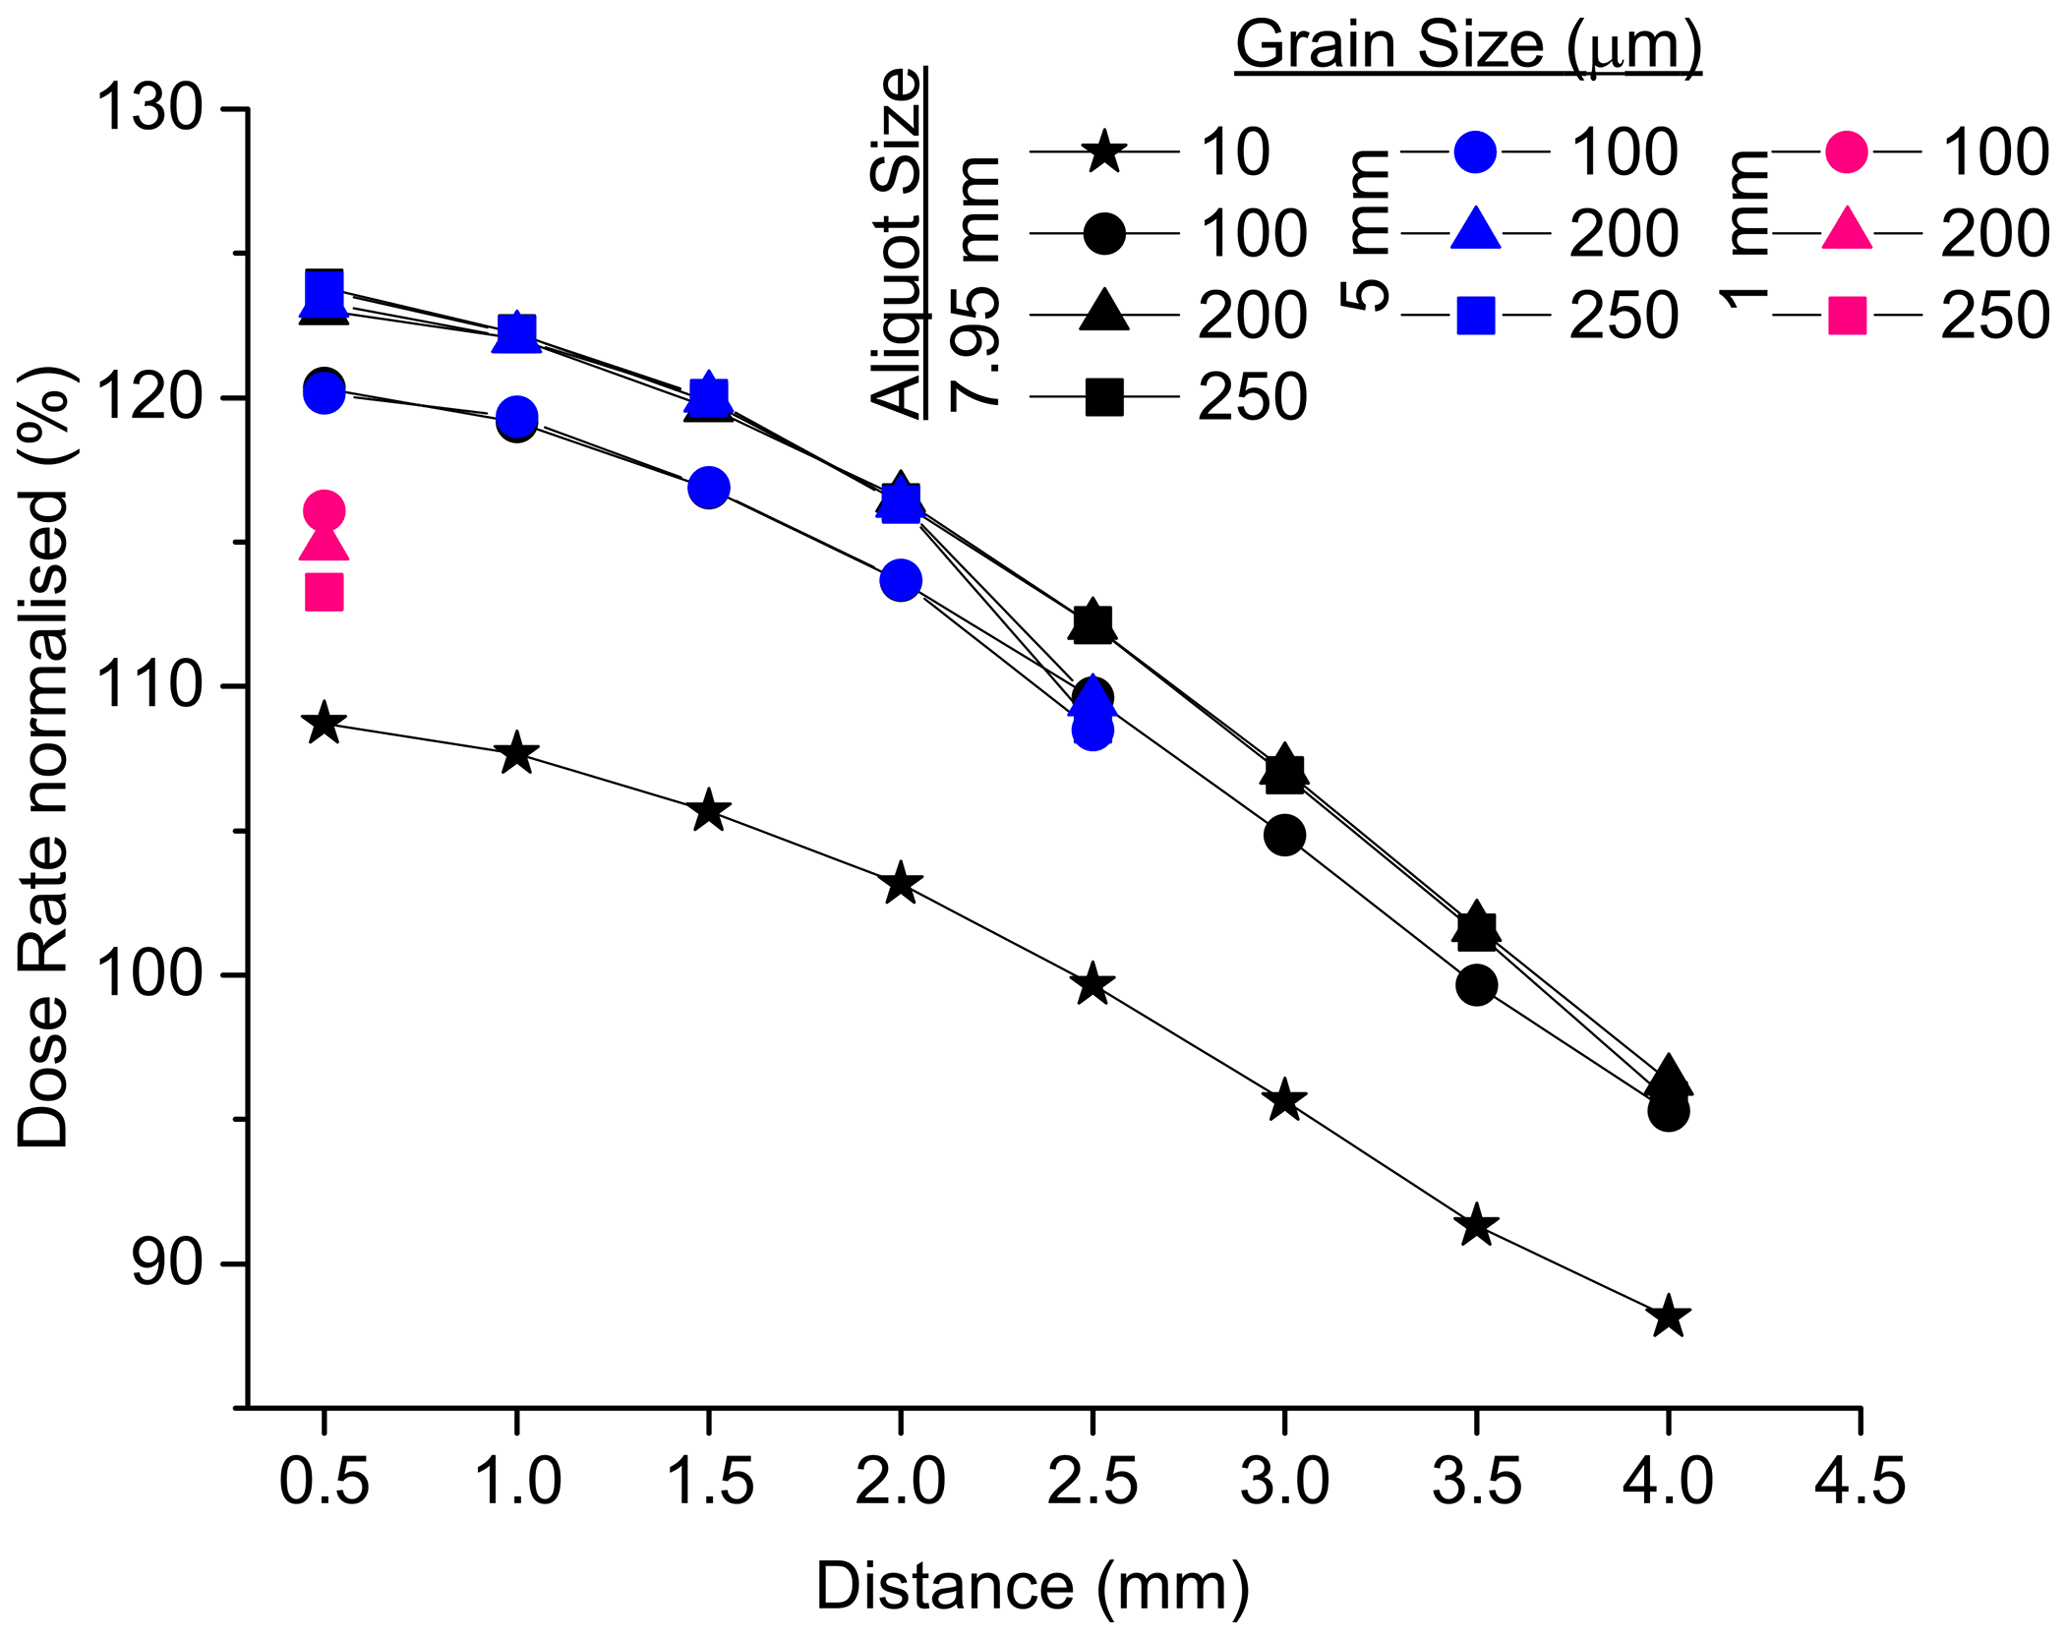
Figure 8Result from GEANT4 simulation: dose rate versus distance from centre of the stainless-steel cup for the closed-ring beta source. Data are for large (7.95 mm), medium (5 mm) and small (1 mm) aliquot sizes and for 10, 100, 200, and 250 µm grain sizes. Dose rate is normalised to 10 µm grain size, the average value of which is at 100 %.
Beta particles interact with the aliquot and create secondary electrons that scatter around the interaction point. In the central part of the aliquot, the secondary particles interact with neighbouring grains or escape through the surface of the aliquot. If, however, the primary interaction occurs near the aliquot edge, the scattered electrons can also escape through the edge of the aliquot, not only through the surface. Therefore, the smaller the aliquot, the larger the percentage of escaping secondary electrons. Furthermore, the thicker the aliquot, the smaller the percentage of secondary electrons escaping by the aliquot surface while the escape pathway via the edge remains the same. The edge effect is therefore governed by the ratio of grain size to aliquot size: the bigger the grain and the smaller the aliquot, the larger the reduction of the dose rate. In fact, the simulation shows that the number of scattered electrons decreases for the edge grains (Fig. 9). Thus, the edge effect counteracts the average increase of the beta-dose rate that occurs for decreasing aliquot sizes due to the radial increase of the dose rate towards the centre of the cup. It may even reverse if the ratio of grain size to aliquot size is appropriate, and the grains are located sufficiently far from the rim of the cup.
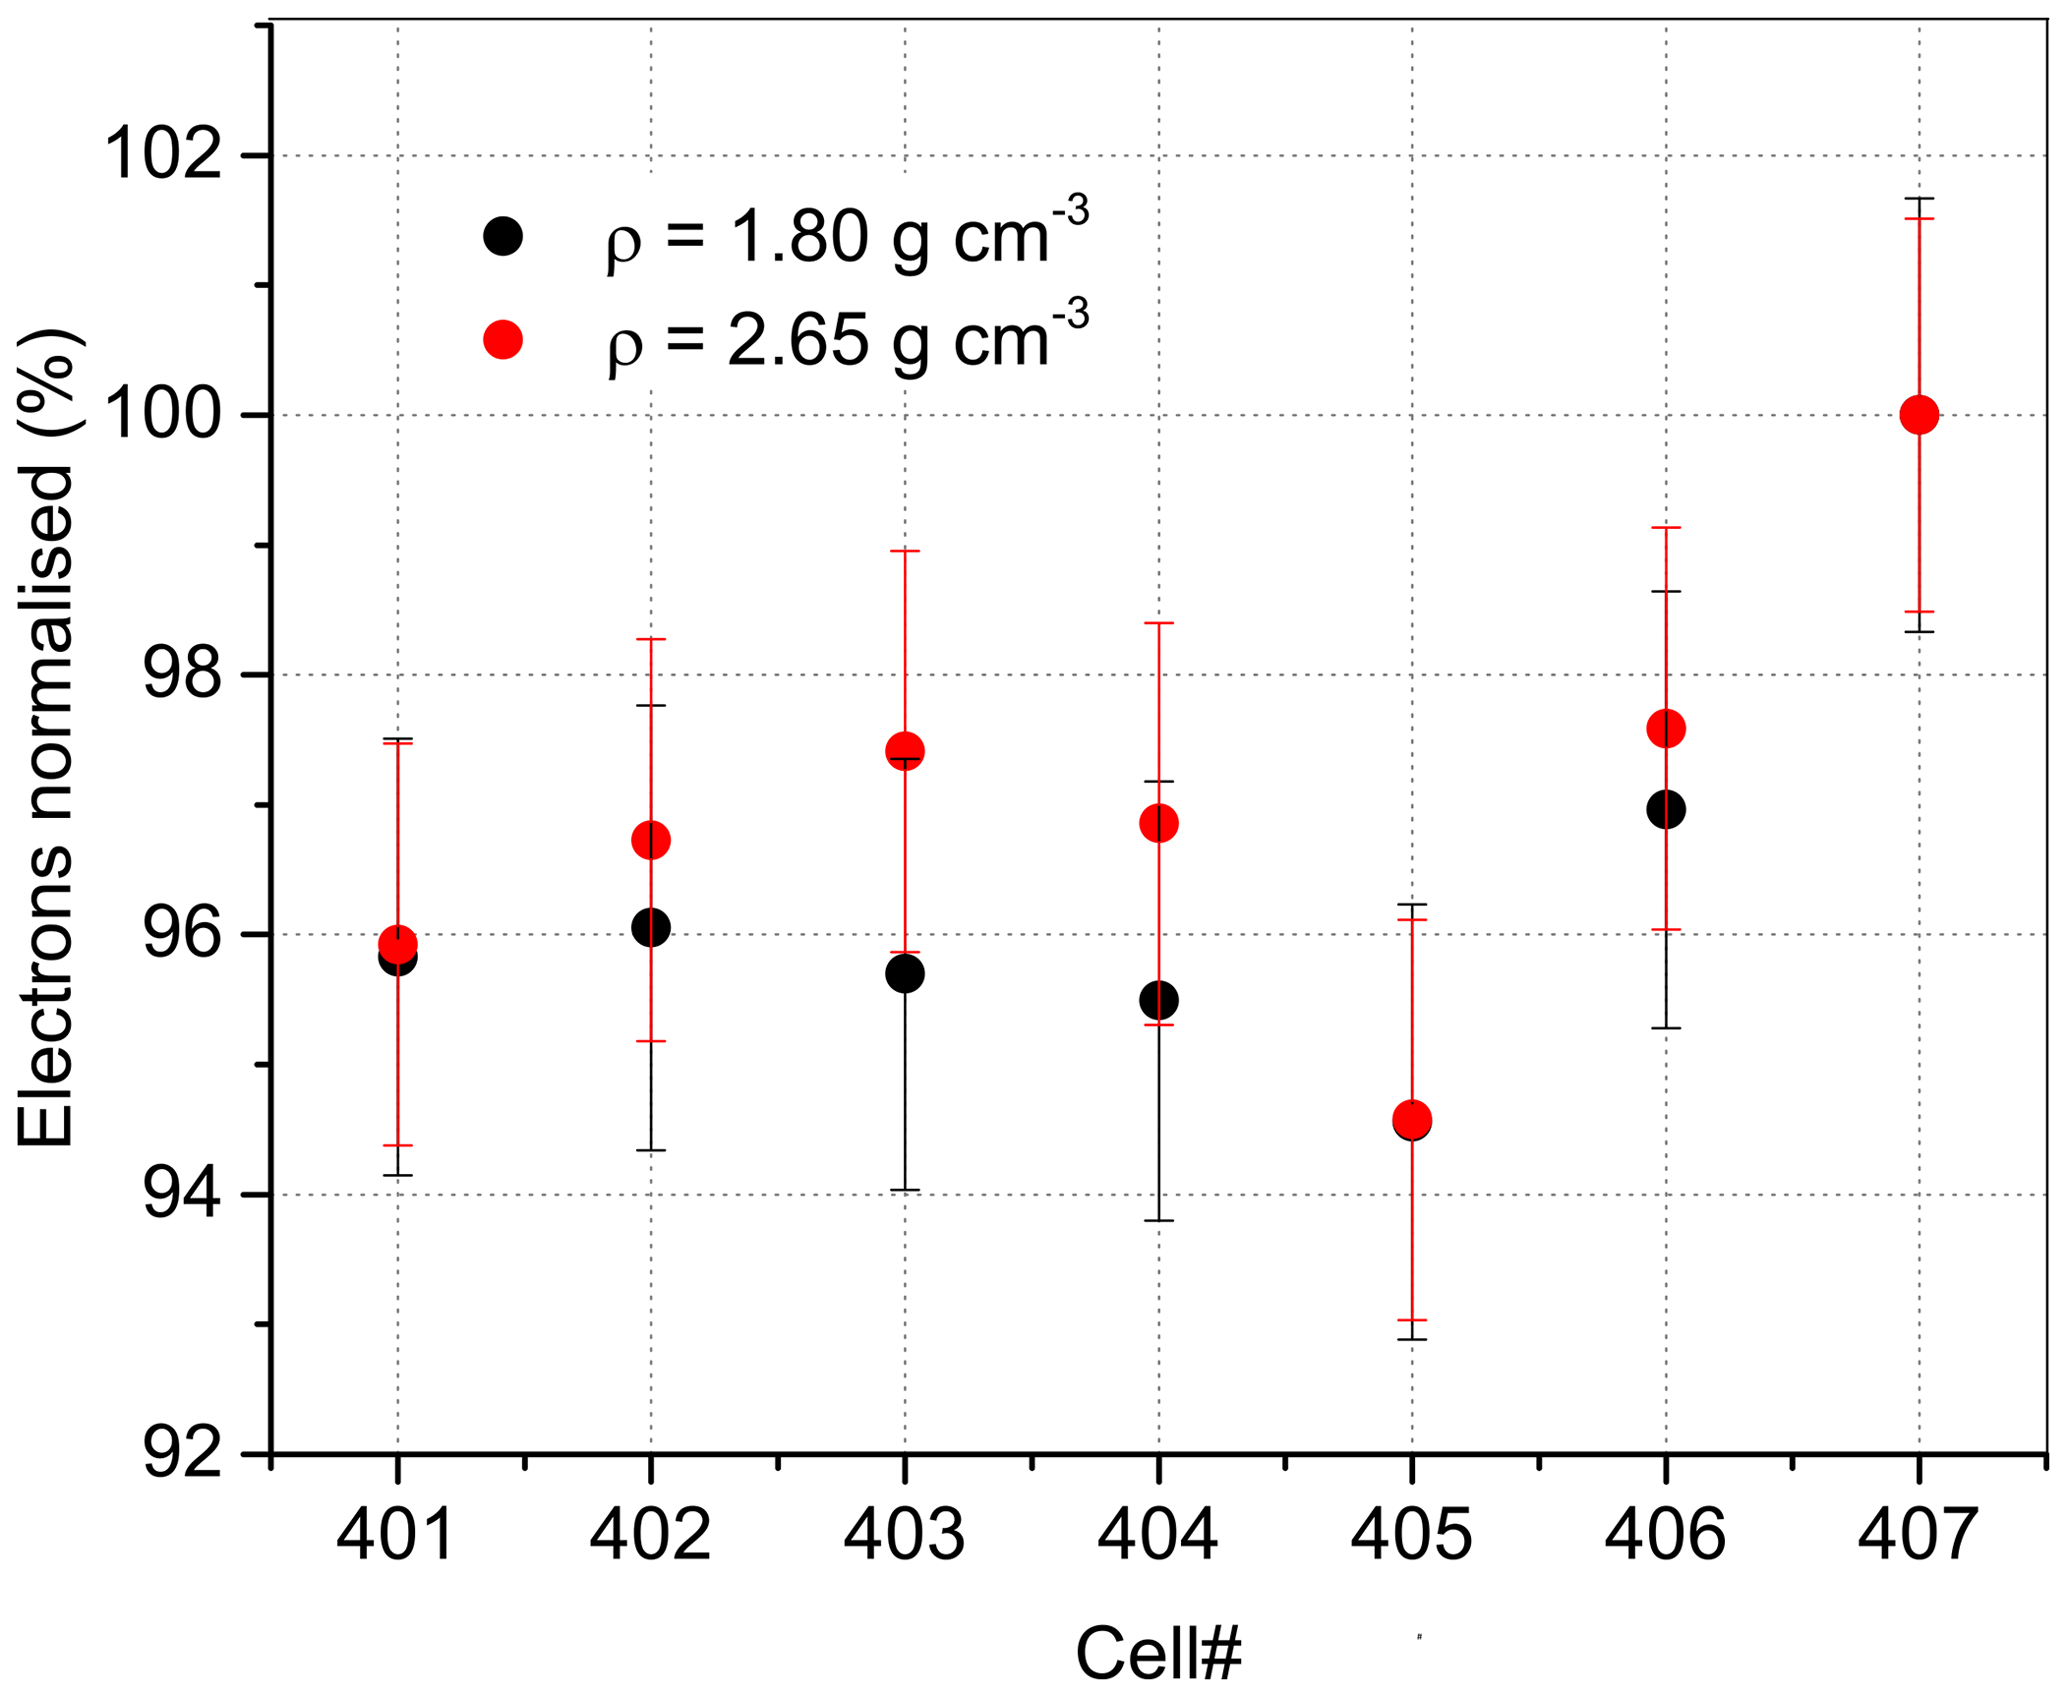
Figure 9Result from MCNP6 simulation: the number of electron-producing interactions plotted against cell number. The cell is a rounded SiO2 grain of 300 µm diameter of the two densities displayed. Data are normalised to cell no. 407, which is the grain surrounded by other grains (for spatial arrangement of cells, see Fig. 2b).
The data presented here indicate that the dose rate of an individual beta source results from the interplay of a number of parameters. Most of these were identified by previous studies including grain-size-dependent build-up and attenuation of charge (e.g. Wintle and Aitken, 1977; Goedicke, 2007; Autzen et al., 2017). During SAR-based measurements using a 90Sr 90Y beta source, incident beta particles penetrated the grain to a certain depth alongside backscattered electrons which had energies less than the initial source energy (Bell, 1980). Thus, the absorbed beta dose should decrease with increasing grain size (Wintle and Aitken, 1977; Goedicke, 2007; Hansen et al., 2018). That is why Hansen et al. (2018), building on findings of Greilich et al. (2008), attribute the undesirable overdispersion of their calibration value to variation of grain shape and volume because low-energy beta particles are increasingly attenuated in grains > 100 µm, as already described by Bell (1980). In our simulation, however, charge build-up overcompensates the effects of attenuation resulting in a sustained rise of absorbed beta dose in grains > 150 µm resting on material of relatively high Z (Fig. 8). As a consequence, the simulation shows a continued rise of dose for grains 10–300 µm (Fig. 7) with a flattening of the rise above ∼ 150 µm grain size. This is arguably different but not too dissimilar to datasets deduced from experiments: Geodicke (2007) show an initial rise of dose up to 25–50 µm grain size, followed by a dose plateau for grain sizes 40–130 µm and a decrease for grains > 200 µm and Armitage and Bailey (2005) show a rise to ∼ 40 µm followed by a “jump” to a dose plateau for 50–250 µm grains. Thus, the competing mechanisms of build-up and attenuation lead to divergent dose-rate results mainly for ∼ 50–200 µm grains, likely caused by the geometry of the irradiation field (Bell, 1980).
Large aliquots show the expected build-up of charge with increasing grain size towards secondary equilibrium and small aliquots show the expected larger absorbed dose (Figs. S3–S6) due to the radial increase of dose rate towards the centre of the sample carrier (e.g. Spooner and Allsop, 2000; Veronese et al., 2007). This aliquot-size effect was indeed already highlighted in earlier studies (e.g. Bailiff, 1980; Bell, 1980). Our study provides evidence for further differentiating the aliquot-size effect: the dose enhancement in small aliquots is not the same in the simulation and experiment and is not the same for all grain sizes. The differences are caused by different penetration depths in grains and by the changing effect of backscattered electrons. The interplay seems to have the most variable effect on 50–100 µm grains mounted as aliquots of < 8 mm size (Fig. S8). The dose enhancement is likely reversed when large grains (i.e. > 200 µm) are mounted as small aliquots because with this geometry the probability of backscattered beta particles hitting the edge grain is reduced. However, this edge effect remains to be investigated in greater detail because with changing sphericity of grains (e.g. Autzen et al., 2017) and with potentially changing density of grain packing when the ideal grain monolayer is not achieved, the probability of beta interaction changes as well.
We also show that the shape of the beta source controls the magnitude of the absorbed dose and hence the build-up of charge. The fact that the dose absorbed in small grains must be lower than the dose absorbed in large grains is masked by the ring sources for which fine and coarse grains may absorb the same dose depending on the size of the aliquot (Fig. 4a). The open-ring source shows differences that are statistically negligible for all geometries, suggesting that homogeneity of the source associated with special design reduces the effect of grain and aliquot size on the calibration value.
Autzen et al. (2017) recommend minimising shape and volume variation of sample grains used for calibration, but our data suggest using multiple grain-size fractions for calibration. We think that as long as the sample originates from a natural sedimentary deposit, either way it includes grains of various shape and form. We echo Goedicke (2007) in that the calibration procedure should employ small (4–20 µm), medium (20–80 µm), large (80–200 µm) and very large (200–300 µm) grain sizes. In addition, these grain-size fractions should be measured with small, medium and large aliquots. Calibrating all possible irradiation geometries of an individual beta source appears to be more important the more inhomogeneous a source is, and because source homogeneity is virtually unknown, the calibration procedure must take geometry into account. This will improve the accuracy of the calibration value with respect to the unknown natural sample.
Within the limits of the SAR protocol, the experimental uncertainty of the calibration value is usually reasonably low, thanks to the purpose-prepared sample material. However, with regard to beta-source calibration, a higher precision is desirable. Burbidge et al. (2016) show that parallel multiple-aliquot calibration transfer provides better accuracy and precision than single-aliquot measurements on single-dosed samples. Bos et al. (2006) show that the uncertainty can be reduced to 0.9 %. Their procedure envisages, first, a calculation of the administered gamma dose through Fricke solutions and, second, gamma irradiating several subsamples each with a different dose (e.g. 5, 10, ... 30 Gy). The determined beta De values (s) are then plotted versus the gamma doses (Gy) and the inverse slope of the fitted line gives the beta-dose rate (Bos et al., 2006). The total uncertainty is derived from the uncertainties of beta and gamma irradiation. We therefore say that the laboratory's key parameter can be improved in terms of accuracy and precision by including several grain sizes, several aliquot sizes and several gamma doses in the calibration experiments.
With the number of parameters in mind, it is clear that predicting the dose rate through a series of simulations is too laborious in comparison to a series of relatively simple SAR-based experiments. Here, indeed additional work is required to better estimate the impact of the edge effect on dose rate. If the experimental approach is the way forward, then effort should be made to improve accuracy and precision of the calibration value. Future work should therefore focus on gamma irradiating a calibration sample of several grain-size ranges with several gamma doses in order to determine the value from the regression line and not from a single data point.
The Geant4 code developed for simulating beta irradiation by the Lexsyg SMART planar source and the Lexsyg SMART ring source is based on Geant4 version 10.1.2 and available in the Supplement. It includes the 90Sr beta spectra used for the simulations. Geant4 version 10.1.2 is available under the Geant4 licence at http://cern.ch/geant4/license (last access: 14 June 2021). Please contact Loic Martin at loic.martin@glasgow.ac.uk for technical questions. The Monte Carlo radiation transport code (MCNP6.2) is commercial and licenced.
Data required to create input files for the MCNP6.2 code are available through references quoted in the text or in the Supplement. Data for the geometry of the beta sources of the Lexsyg luminescence readers of Freiberg Instruments are not publicly accessible and may be requested by the manufacturer.
The supplement related to this article is available online at: https://doi.org/10.5194/gchron-3-371-2021-supplement.
BM and MD designed the experiments, and CB and CT carried them out. LM and MD performed the simulations. BM, LM, MD, NM, SK and AL discussed details of results. BM prepared the manuscript with contributions from all co-authors.
Andreas Lang is an editor of Geochronology. All other authors declare that they have no conflict of interest.
We wish to thank Andreas Richter (Freiberg Instruments) for his helpful advice regarding the design of the beta sources of the Lexsyg instruments. Sebastian Kreutzer received funding from the European Union's Horizon 2020 research and innovation programme (see below). We would like to thank two anonymous reviewers for their constructive and helpful comments.
This research has been supported by the European Union's Horizon 2020 research and innovation programme under the Marie Skłodowska-Curie grant agreement no. 844457 (CREDit) and the Conseil Regional Nouvelle Aquitaine (project DAPRES_LA_FEM).
This paper was edited by Julie Durcan and reviewed by two anonymous referees.
Agostinelli, S., Allison, J., Amako, K., Apostolakis, J., Araujo, H., Arce, P., Asai, M., Axen, D., Banerjee, S., Barrand, G., Behner, F., Bellagamba, L., Boudreau, J., Broglia, L., Brunengo, A., Burkhardt, H., Chauvie, S., Chuma, J., Chytracek, R., Cooperman, G., Cosmo, G., Degtyarenko, P., Dell'Acqua, A., Depaola, G., Dietrich, D., Enami, R., Feliciello, A., Ferguson, C., Fesefeldt, H., Folger, G., Foppiano, F., Forti, A., Garelli, S., Giani, S., Giannitrapani, R., Gibin, D., Gómez Cadenas, J. J., González, I., Gracia Abril, G., Greeniaus, G., Greiner, W., Grichine, V., Grossheim, A., Guatelli, S., Gumplinger, P., Hamatsu, R., Hashimoto, K., Hasui, H., Heikkinen, A., Howard, A., Ivanchenko, V., Johnson, A., Jones, F. W., Kallenbach, J., Kanaya, N., Kawabata, M., Kawabata, Y., Kawaguti, M., Kelner, S., Kent, P., Kimura, A., Kodama, T., Kokoulin, R., Kossov, M., Kurashige, H., Lamanna, E., Lampén, T., Lara, V., Lefebure, V., Lei, F., Liendl, M., Lockman, W., Longo, F., Magni, S., Maire, M., Medernach, E., Minamimoto, K., Mora de Freitas, P., Morita, Y., Murakami, K., Nagamatu, M., Nartallo, R., Nieminen, P., Nishimura, T., Ohtsubo, K., Okamura, M., O'Neale, S., Oohata, Y., Paech, K., Perl, J., Pfeiffer, A., Pia, M. G., Ranjard, F., Rybin, A., Sadilov, S., Di Salvo, E., Santin, G., Sasaki, T., Savvas, N., Sawada, Y., Scherer, S., Sei, S., Sirotenko, V., Smith, D., Starkov, N., Stoecker, H., Sulkimo, J., Takahata, M., Tanaka, S., Tcherniaev, E., Safai Tehrani, E., Tropeano, M., Truscott, P., Uno, H., Urban, L., Urban, P., Verderi, M., Walkden, A., Wander, W., Weber, H., Wellisch, J. P., Wenaus, T., Williams, D. C., Wright, D., Yamada, T., Yoshida, H., and Zschiesche, D.: Geant4 – a simulation toolkit, Nucl. Instrum. Meth. A, 506, 250–303, https://doi.org/10.1016/S0168-9002(03)01368-8, 2003.
Aitken, M. J.: Thermoluminescence dating, Academic Press London, London, UK, 1985.
Armitage, S. J. and Bailey, R. M.: The measured dependence of laboratory beta dose rates on sample grain size, Radiat. Meas., 39, 123–127, https://doi.org/10.1016/j.radmeas.2004.06.008, 2005.
Autzen, M., Guerin, G., Murray, A. S., Thomsen, K. J., Buylaert, J.-P., and Jain, M.: The effect of backscattering on the beta dose absorbed by individual quartz grains, Radiat. Meas., 106, 491–497, https://doi.org/10.1016/j.radmeas.2017.05.004, 2017.
Bailiff, I.: A beta irradiator for use in TL dating, Ancient TL, 10, 12–14, 1980.
Baró, J., Sempau, J., Fernández-Varea, J. M., and Salvat, M.: “PENELOPE”: an algorithm for Monte Carlo simulation of the penetration and energy loss of electrons and positrons in matter, Nucl. Instrum. Meth. B, 100, 31–46, 1995.
Bell, W. T.: Beta source calibration: Some problems associated with the utilisation of the gamma irradiation of quartz and other phosphors, Part I, Ancient TL, 10, 3–9; Part II, Ancient TL, 11, 2–6, 1980.
Bell, W. T. and Mejdahl, V.: Beta Source Calibration and Its Dependency on Grain Transparency, Archaeometry, 23, 231–240, https://doi.org/10.1111/j.1475-4754.1981.tb00310.x, 1981.
Bos, A. J. J., Wallinga, J., Johns, C., Abellon, R. D., Brouwer, J. C., Schaart, D. R., and Murray, A. S.: Accurate calibration of a laboratory beta particle dose rate for dating purposes, Radiat. Meas., 41, 1020–1025, https://doi.org/10.1016/j.radmeas.2006.04.003, 2006.
Burbidge, C. I., Cardoso, J., Cardoso, G. O., Franco, J., Santos, L., and Caldeira, M.: Parallel calibration transfer and systematic effects in retrospective absorbed dose estimation using OSL, Quat. Geochronol., 34, 92–101, https://doi.org/10.1016/j.quageo.2016.04.001, 2016.
Goedicke, C.: Calibration of a 90Sr 90Y-source for luminescence dating using OSL, Radiat. Meas., 42, 1427–1431, https://doi.org/10.1016/j.radmeas.2007.09.014, 2007.
Göksu, H. Y., Bailiff, I. K., Bøtter-Jensen, L., Brodski, L., Hütt, G., and Stoneham, D.: Interlaboratory beta source calibration using TL and OSL on natural quartz, Radiat. Meas., 24, 479–483, https://doi.org/10.1016/1350-4487(95)00258-G, 1995.
Greilich, S., Murray, A. S., and Bøtter-Jensen, L.: Simulation of electron transport during beta irradiation, Radiat. Meas., 43, 748–751, https://doi.org/10.1016/j.radmeas.2008.01.017, 2008.
Guérin, G. and Valladas, H.: Cross-calibration between beta and gamma sources using quartz OSL: Consequences of the use of the SAR protocol in optical dating, Radiat. Meas., 68, 31–37, https://doi.org/10.1016/j.radmeas.2014.06.010, 2014.
Hansen, V., Murray, A., Buylaert, J.-P., Yeo, E.-Y., and Thomsen, K.: A new irradiated quartz for beta source calibration, Radiat. Meas., 81, 123–127, https://doi.org/10.1016/j.radmeas.2015.02.017, 2015.
Hansen, V., Murray, A., Thomsen, K., Jain, M., Autzen, M., and Buylaert, J.-P.: Towards the origins of over-dispersion in beta source calibration, Radiat. Meas., 120, 1–6, https://doi.org/10.1016/j.radmeas.2018.05.014, 2018.
Hauf, S., Kuster, M., Batic, M., Bell, Z. W., Hoffmann, D. H. H., Lang, P. M., Neff, S., Pia, M. G., Weidenspointner, G., and Zoglauer, A.: Radioactive Decays in Geant4, IEEE T. Nucl. Sci., 60, 2966–2983, https://doi.org/10.1109/TNS.2013.2270894, 2013.
Ivanchenko, V., Apostolakis, J., Bagulya, A., Abdelouahed, H. B., Black, R., Bogdanov, A., Burkhard, H., Chauvie, S., Cirrone, P., Cuttone, G., Depaola, G., Di Rosa, F., Elles, S., Francis, Z., Grichine, V., Gumplinger, P., Gueye, P., Incerti, S., Ivanchenko, A., Jacquemier, J., Lechner, A., Longo, F., Kadr, O., Karakatsanis, N., Karamitros, M., Kokoulin, R., Kurashige, H., Maire, M., Mantero, A., Mascialino, B., Moscicki, J., Pandola, L., Perl, J., Petrovic, I., Ristic-Fira, A., Romano, F., Russo, G., Santin, G., Schaelicke, A., Toshito, T., Tran, H., Urban, L., Yamashit, T., and Zacharatou, C.: Recent improvements in Geant4 electromagnetic physics models and interfaces, Prog. Nucl. Sci. Technol., 2, 898–903, 2011.
Kadereit, A. and Kreutzer, S.: Risø calibration quartz – a challenge for β-source calibration, An applied study with relevance for luminescence dating, Measurement, 46, 2238–2250, https://doi.org/10.1016/j.measurement.2013.03.005, 2013.
Mauz, B. and Lang, A.: The dose rate of beta sources for optical dating applications: A comparison between fine silt and fine sand quartz, Ancient TL, 22, 45–48, 2004.
Pernicka, E. and Wagner, G. A.: Primary and interlaboratory calibration of beta sources using quartz as thermoluminescent phosphor, Ancient TL, 6, 2–6, 1979.
Richter, D., Pintaske, R., Dornich, K., and Krbetschek, M.: A novel beta source design for uniform irradiation in dosimetric applications, Ancient TL, 30, 57–63, 2012.
Richter, D., Richter, A., and Dornich, K.: Lexsyg – a new system for luminescence research, Geochronometria, 40, 220–228, https://doi.org/10.2478/s13386-013-0110-0, 2013.
Richter, D., Richter, A., and Dornich, K.: Lexsyg smart – a luminescence detection system for dosimetry, material research and dating application, Geochronometria, 42, 202–209, https://doi.org/10.1515/geochr-2015-0022, 2015.
Richter, D., Woda, C., and Dornich, K.: A new quartz for γ-transfer calibration of radiation sources, Geochronometria, 47, 23–34, 2020.
Spooner, N. A. and Allsop, A.: The spatial variation of dose-rate from 90S 90Y beta sources for use in luminescence dating, Radiat. Meas., 32, 49–55, 2000.
Tribolo, C., Kreutzer, S., and Mercier, N.: How reliable are our beta-source calibrations?, Ancient TL, 37, 1–10, 2019.
Veronese, I., Shved, V., Shishkina, E. A., Giussani, A., and Göksu, H. Y.: Study of dose rate profile at sample discs in a Risø OSL single-grain attachment system, Radiat. Meas., 42, 138–143, 2007.
Werner, C. J.: MCNP Users Manual – Code Version 6.2, Los Alamos National Laboratory, Los Alamos, USA, LA-UR-17-29981, 2017.
Werner, C. J., Bull, J. S., Solomon, C. J., Brown, F. B., McKinney, G. W., Rising, M. E., Dixon, D. A., Martz, R. L., Hughes, H. G., Cox, L. J., Zukaitis, A. J., Armstrong, J. C., Forster, R. A., and Casswell, L.: MCNP6.2 Release Notes, LA-UR-18-20808, available at: https://permalink.lanl.gov/object/tr?what=info:lanl-repo/lareport/LA-UR-18-20808 (last access: 9 June 2021), 2018.
Wintle, A. G. and Aitken, M. J.: Absorbed Dose from a Beta Source as Shown by Thermoluminescence Dosimetry, Int. J. Appl. Radiat. Is., 28, 625–628, 1977.