the Creative Commons Attribution 4.0 License.
the Creative Commons Attribution 4.0 License.
 | 15 Jul 2021
Exposure dating of detrital magnetite using 3He enabled by microCT and calibration of the cosmogenic 3He production rate in magnetite
Emily H. G. Cooperdock
A. Joshua West
Dominic Hildebrandt
Kathrin Strößner
Kenneth A. Farley
We test whether X-ray micro-computed tomography (microCT) imaging can be used as a tool for screening magnetite grains to improve the accuracy and precision of cosmogenic 3He exposure dating. We extracted detrital magnetite from a soil developed on a fanglomerate at Whitewater, California, which was offset by the Banning strand of the San Andreas Fault. This study shows that microCT screening can distinguish between inclusion-free magnetite and magnetite with fluid or common solid inclusions. Such inclusions can produce bulk 3He concentrations that are significantly in excess of the expected spallation production. We present Li concentrations, major and trace element analyses, and estimated magnetite (U–Th) He cooling ages of samples in order to model the contribution from fissiogenic, nucleogenic, and cosmogenic thermal neutron production of 3He. We show that mineral inclusions in magnetite can produce 3He concentrations of up to 4 times that of the spallation component, leading to erroneous exposure ages. Therefore, grains with inclusions must be avoided in order to facilitate accurate and precise magnetite 3He exposure dating. Around 30 % of all grains were found to be without inclusions, as detectable by microCT, with the largest proportion of suitable grains in the grain size range of 400–800 µm. While grains with inclusions have 3He concentrations far in excess of the values expected from existing 10Be and 26Al data in quartz at the Whitewater site, magnetite grains without inclusions have concentrations close to the predicted depth profile. We measured 3He concentrations in aliquots without inclusions and corrected them for Li-produced components. By comparing these data to the known exposure age of 53.5 ± 2.2 ka, we calibrate a production rate for magnetite 3He at sea level and high latitude (SLHL) of 116 ± 13 at g−1 a−1. We suggest that this microCT screening approach can be used to improve the quality of cosmogenic 3He measurements of magnetite and other opaque mineral phases for exposure age and detrital studies.
- Article
(12989 KB) - Full-text XML
- BibTeX
- EndNote


Cosmogenic nuclide studies are limited by the minerals present in the available lithology; they therefore benefit from a wide array of potential target phases. The most widely used phase for cosmogenic nuclide dating is quartz using the well-established 10Be and 26Al systems (e.g., Granger et al., 2013a). Sample preparation, quartz purification, dissolution, and chemical separation of Be and Al are laborious and time-consuming tasks involving the use of hydrofluoric acid. Measurement by accelerator mass spectrometry (AMS) is expensive compared to conventional mass spectrometry. Radioactive cosmogenic nuclides, such as 10Be, 26Al, and 36Cl, require at least gram quantities and often hundreds of grams of a pure target phase, which have to be extracted from typically several kilograms of bulk material. In contrast, the relatively higher production rate of 3He and the low detection limit using conventional noble gas mass spectrometry allow for measurements on milligram quantities of sample without the use of harsh chemicals.
We investigate the use of magnetite (Fe3O4) for 3He exposure dating in order to widen the array of potential target phases for cosmogenic nuclide studies. Magnetite is very retentive to helium, with a nominal closure temperature around 250 ∘C (using 10 ∘C Ma−1 and 500 µm grain size; Blackburn et al., 2007), which prevents thermal resetting at surface and near-surface conditions. It can be easily isolated by magnetic separation with a hand magnet, either directly in the field or from crushed bulk rock or soil samples in the lab. Magnetite forms in a wide range of geologic settings and petrologic conditions and is a common phase in mafic and felsic igneous rocks (Buddington and Lindsley, 1964), as well as an accessory mineral in many types of metamorphic rocks (e.g., Nadoll et al., 2012). Magnetite is also produced by hydrothermal alteration, which represents an important ore-forming process (e.g., Nadoll et al., 2014). Magnetite is therefore likely to be present in many lithologies and depositional environments, making it a promising target phase for in situ cosmogenic nuclide exposure dating.
Magnetite is resistant to weathering and can also be used for detrital studies. After a recent calibration of the 36Cl production rate (Moore and Granger, 2019a), detrital magnetite was successfully used as a target phase for deriving watershed-averaged denudation rates (Moore and Granger, 2019b). Magnetite has also been developed as a target phase for cosmogenic 10Be dating (Granger et al., 2013b; Rogers et al., 2013; Moore, 2017).
The use of magnetite for cosmogenic 3He exposure dating was first proposed by Bryce and Farley (2002). Kober et al. (2005) measured 3He concentrations in Fe–Ti oxide minerals (mainly magnetite and ilmenite) from an ignimbrite in Chile and found good agreement with other cosmogenic nuclide systems. They also found that the chemical composition, mainly Ti substitution for Fe and associated phase changes, had no effect on the cosmogenic 3He production rate. Matsumura et al. (2014) measured concordant 10Be, 36Cl, and 3He exposure ages in magnetite, but reported high 26Al and 21Ne concentrations due to silicate inclusions. This observation highlights the contribution of frequently present inclusions within the magnetite, which can potentially increase the measured concentration of cosmogenic nuclides. We will show that solid inclusions in magnetite can have a significant effect on the bulk 3He concentrations, which can lead to an overestimation of the exposure age. Mineral inclusions must therefore be avoided in order to enable a robust application of this technique.
Since magnetite is an opaque phase, light microscopy cannot be used to detect inclusions, as is commonly done for transparent phases, such as olivine (e.g., Trull et al., 1991). We propose that the solution to the problem of inherited 3He from inclusions is to screen magnetite grains using X-ray micro-computed tomography (microCT) and only select inclusion-free grains for analysis. This approach was successfully used by Cooperdock and Stockli (2016), Cooperdock et al. (2020), and Schwartz et al. (2020) for selecting magnetite crystals for (U–Th) He thermochronology to avoid the interference from 4He produced by U- and Th–bearing mineral inclusions.
Here, we present measurements of 3He concentrations in magnetite aliquots with and without inclusions from a depth profile of a soil at Whitewater (Southern California). We compare these data to existing 10Be and 26Al concentrations measured in quartz taken from the same soil samples (Hofmann, 2019). We show that using microCT scanning as a tool to select only grains without inclusions leads to 3He data that conform well to the expected depth profile. We use Li and bulk element concentrations to correct measured 3He concentrations for the fissiogenic, nucleogenic, and cosmogenic thermal neutron components of 3He production. These data are also used to calibrate the cosmogenic 3He production rate in magnetite, enabling the future use of the magnetite 3He system for cosmic-ray exposure studies.
2.1 Production of 3He in magnetite
The concentration of 3He measured in a sample can be attributed to production by several different processes (e.g., Farley et al., 2006; Amidon et al., 2008, 2009; Dunai et al., 2007), which have to be taken into account to calculate an exposure age (Eq. 1). The spallogenic (spall), muogenic (muon), nucleogenic (nucl), cosmogenic thermal neutron (CTN), and fissiogenic (fission) components accumulate as functions of mainly the exposure age texp, the cooling age tc, the Li concentration [Li], and the concentrations of the radioactive elements U, Th, and Sm.
In terrestrial materials, 3He is primarily produced due to spallation induced by high-energy cosmic-ray neutrons (Kurz, 1986; Lal, 1987), which is generally termed the “cosmogenic” component. Both 3He and 3H are produced by this process, the latter of which decays to 3He with a half-life of around 12 a (Lal, 1987). Cosmic-ray exposure studies primarily use the temporally constant or varying production rate of this component to calculate an exposure age. Cosmic-ray muons also contribute to the production of 3He by inducing spallation or through μ− capture reactions (Nesterenok and Yakubovich, 2016). However, due to the short exposure (< 100 ka) and the shallow depths (< 2 m) of the samples we have studied, the muogenic component of spallogenic production is negligible and will not be considered here.
There are several estimates for the cosmogenic nuclide production rate scaled to sea level and high latitude (SLHL) for magnetite. Theoretical predictions of Masarik and Reedy (1996) for element-specific production rates of 40 at g−1 a−1 for Fe and 135 at g−1 a−1 for O lead to a combined SLHL 3He production rate by high-energy cosmogenic neutrons in magnetite (Fe3O4) of 66 at g−1 a−1. Bryce and Farley (2002) suggest a cosmogenic nuclide production rate of 69–77 at g−1 a−1, which was calibrated relative to that of pyroxene, but did not provide details of the measurements. Kober et al. (2005) modeled a 3He production rate of 122 at g−1 a−1 using updated element-specific rates and measured a production rate in Fe–Ti oxides of 120 ± 12 at g−1 a−1 based on comparison with other cosmogenic nuclide systems.
The energy spectra of 3H and 3He produced by high-energy neutron-induced spallation are broad (Nesterenok and Yakubovich, 2016), leading to a wide redistribution of 3He. The ejection distance distribution of 3H has a mode at 56 µm in magnetite and 120 µm in a matrix which was assumed to have the average composition and density of the soil. The same parameters lead to an ejection distance of 20 and 43 µm for 3He. Stopping distances were determined using the Stopping Ranges in Matter (SRIM-2013) model (Ziegler et al., 2010).
Production of 3He can also occur by thermal neutron capture via the pathway (Andrews and Kay, 1982). Thermal neutron capture can also occur on 10B, although to a lesser extent. One source of thermal neutrons is decelerated cosmic-ray neutrons, called “cosmogenic thermal neutrons” (CTNs). Another source of thermal neutrons are α particles from α decay as well as spontaneous fission of U and Th (Halpern, 1971), which can induce (α,n) reactions with matrix elements, mainly Si, O, Al, Mg, and Fe (Andrews and Kay, 1982). This component is termed “radiogenic thermal neutrons” (RTNs), which produce nucleogenic 3He through reactions with 6Li. Moderation by matrix elements (mainly B, Sm, Gd, Li, and Cl) also controls the neutron flux at any depth below the surface (Andrews and Kay, 1982; Farley et al., 2006; Dunai et al., 2007; Amidon et al., 2009).
The energy of tritium nuclei produced by thermal neutron capture is 2.738 MeV (Biersack et al., 1986), which equals a stopping range of 22 µm in magnetite and 47 µm in the matrix. Li concentrations of magnetite have previously been reported as 0.2–4 ppm in an ignimbrite (Kober et al., 2005) and 19–22 ppm in a rhyolite (Amidon et al., 2009), the former being negligible and the latter leading to a significant production of non-cosmogenic 3He. Characterization of the major and trace element content as well as the Li concentration is therefore critical in assessing the magnitude of the 3He production by thermal neutrons.
Another possible source of 3He in minerals is 3H produced as a result of ternary fission of U (Vorobiev et al., 1969; Halpern, 1971). This component is generally negligible for U concentrations < 10 ppm (Farley et al., 2006), but can be an important component when inclusions with high effective uranium concentrations ([eU] = [U] + 0.235 ⋅ [Th]; Shuster et al., 2006), such as apatite and zircon, are present. The kinetic energy of fissiogenic 3H of 8.1 ± 0.2 MeV (Vorobiev et al., 1969) leads to an average ejection distance of 121 µm within magnetite and 264 µm in the soil.
Cosmogenic and CTN-produced 3He accumulates during exposure to cosmic rays, whereas fissiogenic 3He and nucleogenic 3He start accumulating at the time when the material is below the magnetite He closure temperature. Knowledge of the cooling age is therefore necessary to assess the latter components.
Magnetite has been observed to host fluid inclusions (e.g., Guzmics et al., 2011), which could potentially contribute amounts of helium with high 3He 4He ratios. However, plutonic rocks spend a sufficiently long time at high temperatures that helium in fluid inclusions is likely to be lost by diffusion (Farley et al., 2006). In this study, we will show through crushing experiments that there is no measurable amount of 3He due to fluid inclusions in the present samples.
Since the material studied here is detrital, production of 3He can have occurred before the deposition of the fanglomerate, either during in situ exposure before erosion or during transport. This production will be by the cosmogenic and CTN pathways described above. There is no rigid a priori way of estimating this component. Inherited concentrations in clastic sediments, however, are likely to be constant with depth (e.g., Gärtner et al., 2020). We therefore attribute any remaining depth-constant component to this mechanism after accounting for 3He production by all other pathways.
2.2 Study site and sampling
We sampled material on a well-studied offset alluvial fan at Whitewater Hill on San Gorgonio Pass, California, USA (Fig. 1a). The deposits represent the surface of an incised alluvial fan, the apex of which has been laterally and vertically offset by the Banning strand of the San Andreas Fault from its initial position at the mouth of Whitewater Canyon (Owen et al., 2014; Kendrick et al., 2015; Gold et al., 2015). With an established total offset (Huerta, 2017), an exposure age of the alluvial fan surface can be used to constrain the offset rate of the Banning strand of the San Andreas Fault. For the same surface we have studied, Owen et al. (2014) previously measured an exposure age of ka for a depth profile, with an associated constant steady-state erosion rate of 0.42 cm ka−1, and ages of 5.6–61.0 ka for surface boulders using 10Be in quartz.
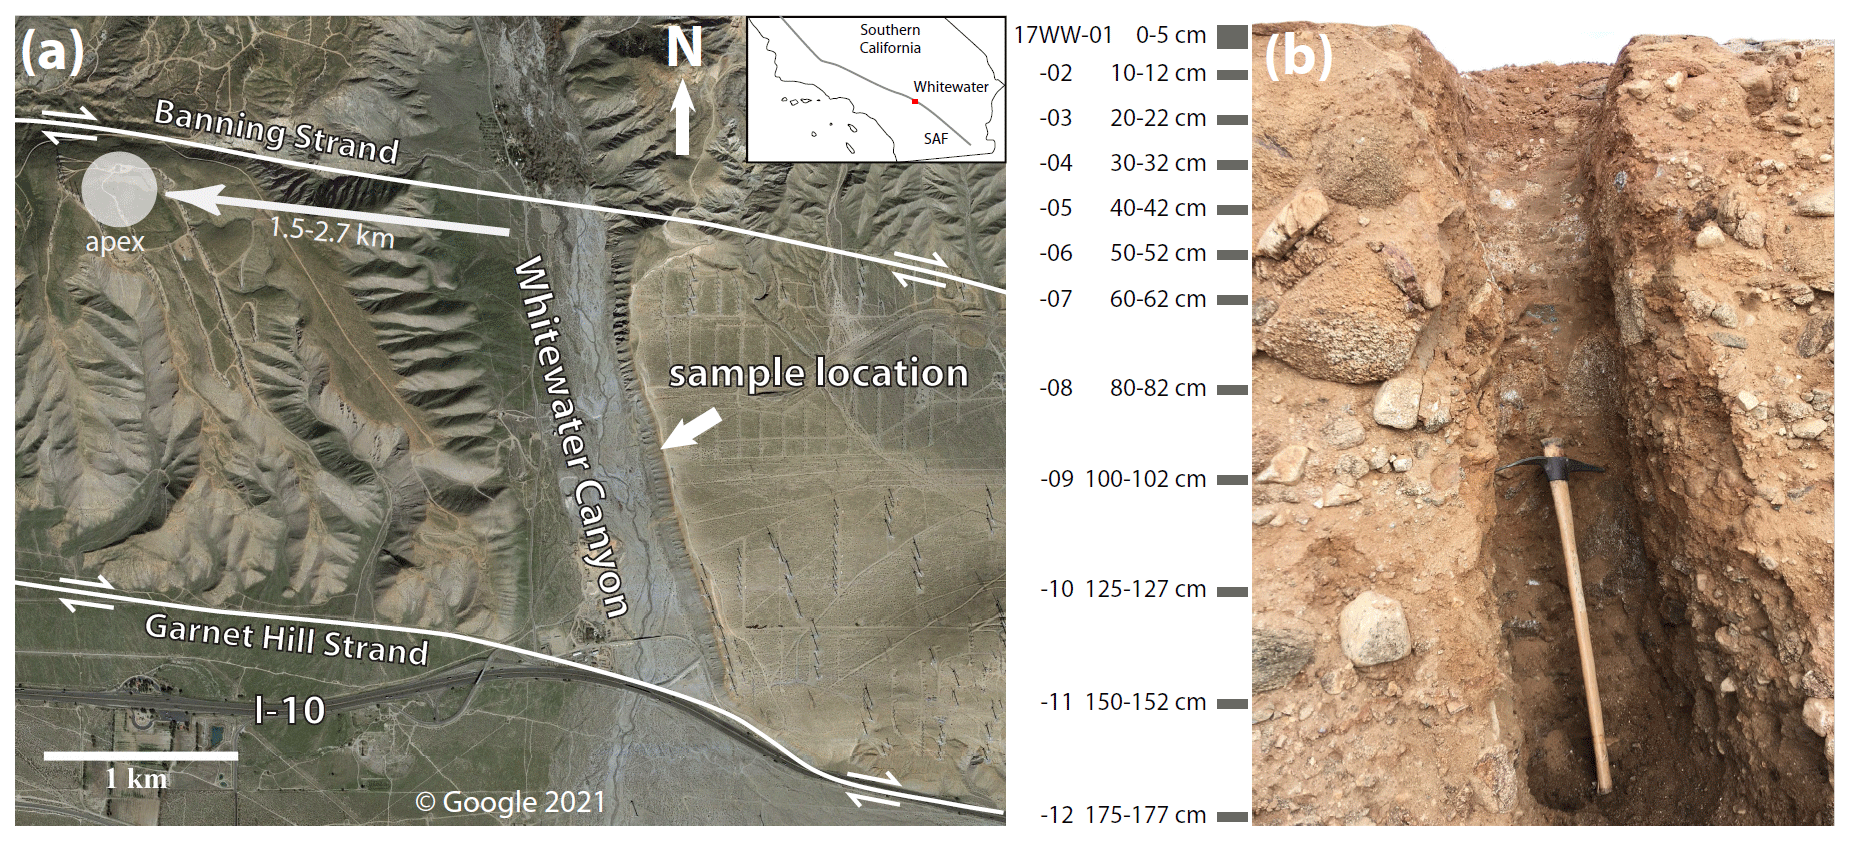
Figure 1(a) Map of the offset alluvial fan complex at Whitewater, California, USA, which was offset from the mouth of the Whitewater River by the Banning strand of the San Andreas fault. The current location of the fan apex (Huerta, 2017) and the offset from the mouth of Whitewater Canyon are shown. (b) The relict soil capping the terrace was sampled from the surface to 1.77 m of depth. Sample IDs are shown next to depth intervals. Magnetite was separated from these samples for microCT scanning and 3He measurement. Aerial imagery taken from © Google Earth. Fault traces after Kendrick et al. (2015). Offset alluvial fan apex from Huerta (2017).
The Cabezon fanglomerate deposits at Whitewater are poorly sorted and are composed of grain sizes from clay to boulder size. The lithic clasts are composed mainly of granite, granodiorite, monzonite, and biotite gneiss (Fosdick and Blisniuk, 2018), with grain sizes between 1 cm and 1 m. We sampled the reddish soil developed in the uppermost 2–3 m of the alluvial fan terrace (Fig. 1b). The A horizon and part of the B horizon of the soil have been eroded, most likely by deflation. The fanglomerate is highly grusified, and even large clasts disaggregate with minimal force.
We obtained 12 samples on a vertical profile from the surface to 177 cm of depth (Fig. 1) at coordinates 33.9340∘ N, 116.6347∘ W and an elevation of 520 m. About 1 m of material was removed from the vertical face of the outcrop before sampling to reduce the effect of lateral cosmic-ray exposure. All samples were taken over a depth interval of 2 cm, except for the surface sample, which was taken from 0 to 5 cm of depth. A sample of the unweathered fanglomerate (17WW-B1) was taken below the zone of soil formation at around 5 m of depth below the surface. These samples integrate material from many clasts of varying sizes and lithologies. In a previous study (Hofmann, 2019), quartz was extracted from these samples to measure 10Be and 26Al in quartz, so these data can be directly compared to the measurements of 3He in magnetite presented here.
2.3 Sample processing and microCT scanning
Bulk soil samples (3–5 kg) were dried at room temperature and spread out over the surface of a table. The strongly magnetic fraction was collected with a neodymium hand magnet held about 5 cm above the surface, which yielded several grams of magnetic material for each sample. This magnetic fraction (see Fig. 2) was sonicated for 10 min, washed several times, dried at 50 ∘C for 24 h, and sieved to > 250 µm. From this separate, individual magnetite grains without obvious intergrowth with other minerals were picked under a light microscope. The resulting separate was again sonicated in water and dried to remove remaining smaller surface impurities and dust. The clay fraction of one sample was also extracted by sieving bulk material to < 2 µm.
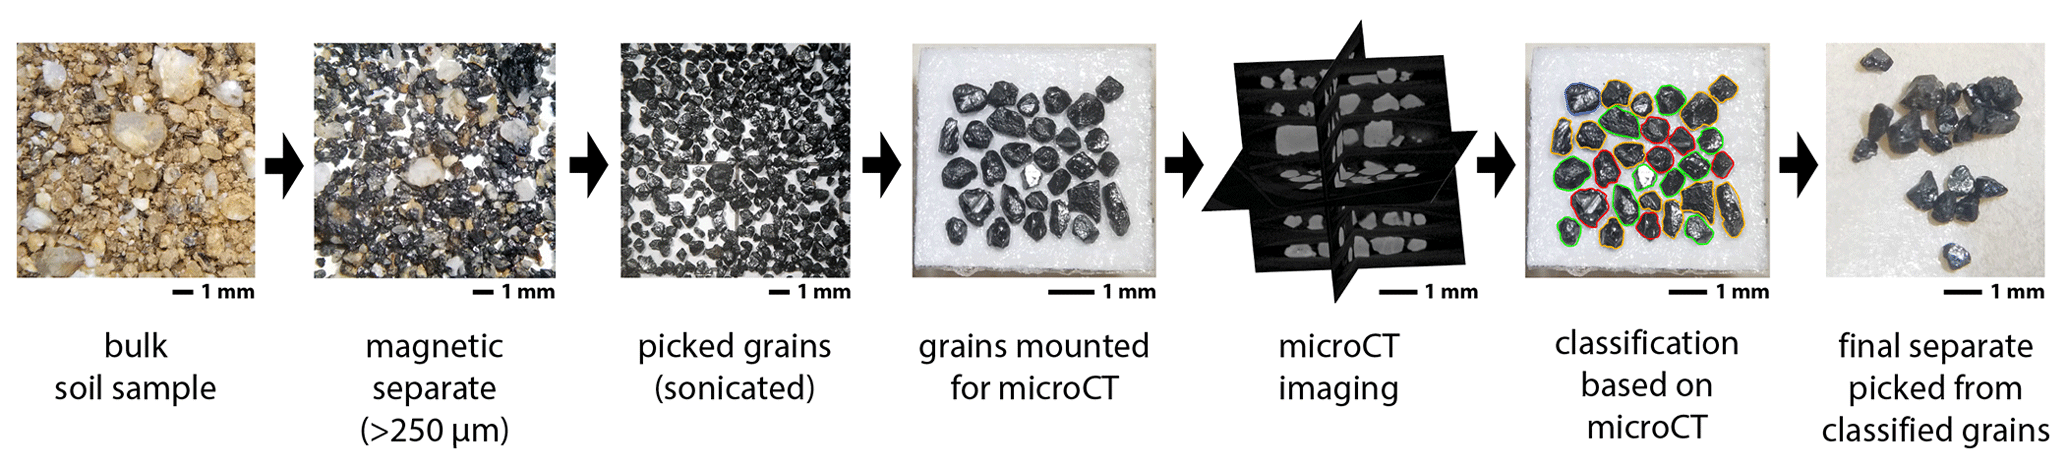
Figure 2Sample processing workflow from bulk soil samples to final separates picked from microCT-analyzed grains. The microCT mounts of paper with double-sided tape are approximately 5 mm in width and contain 20–50 grains each. Individual grains were classified as having no inclusions or containing bright, dark, or bright and dark inclusions according to microCT analysis (see Fig. 4), and grains for the final separates were picked from the mounts based on this classification. Scale bars are 1 mm.
The mineral phase of this separate was confirmed as magnetite using attenuated total reflection Fourier-transform infrared (ATR-FTIR) spectroscopy. Subsets of aliquots of several milligrams were powdered using a mortar and pestle. ATR-FTIR spectra were obtained from these powdered samples, which were compared to spectra of synthetic magnetite pigments acquired under the same conditions (Fig. 3). The location and height of characteristic peaks were used to confirm the phase as magnetite and to detect possible contribution from other phases.
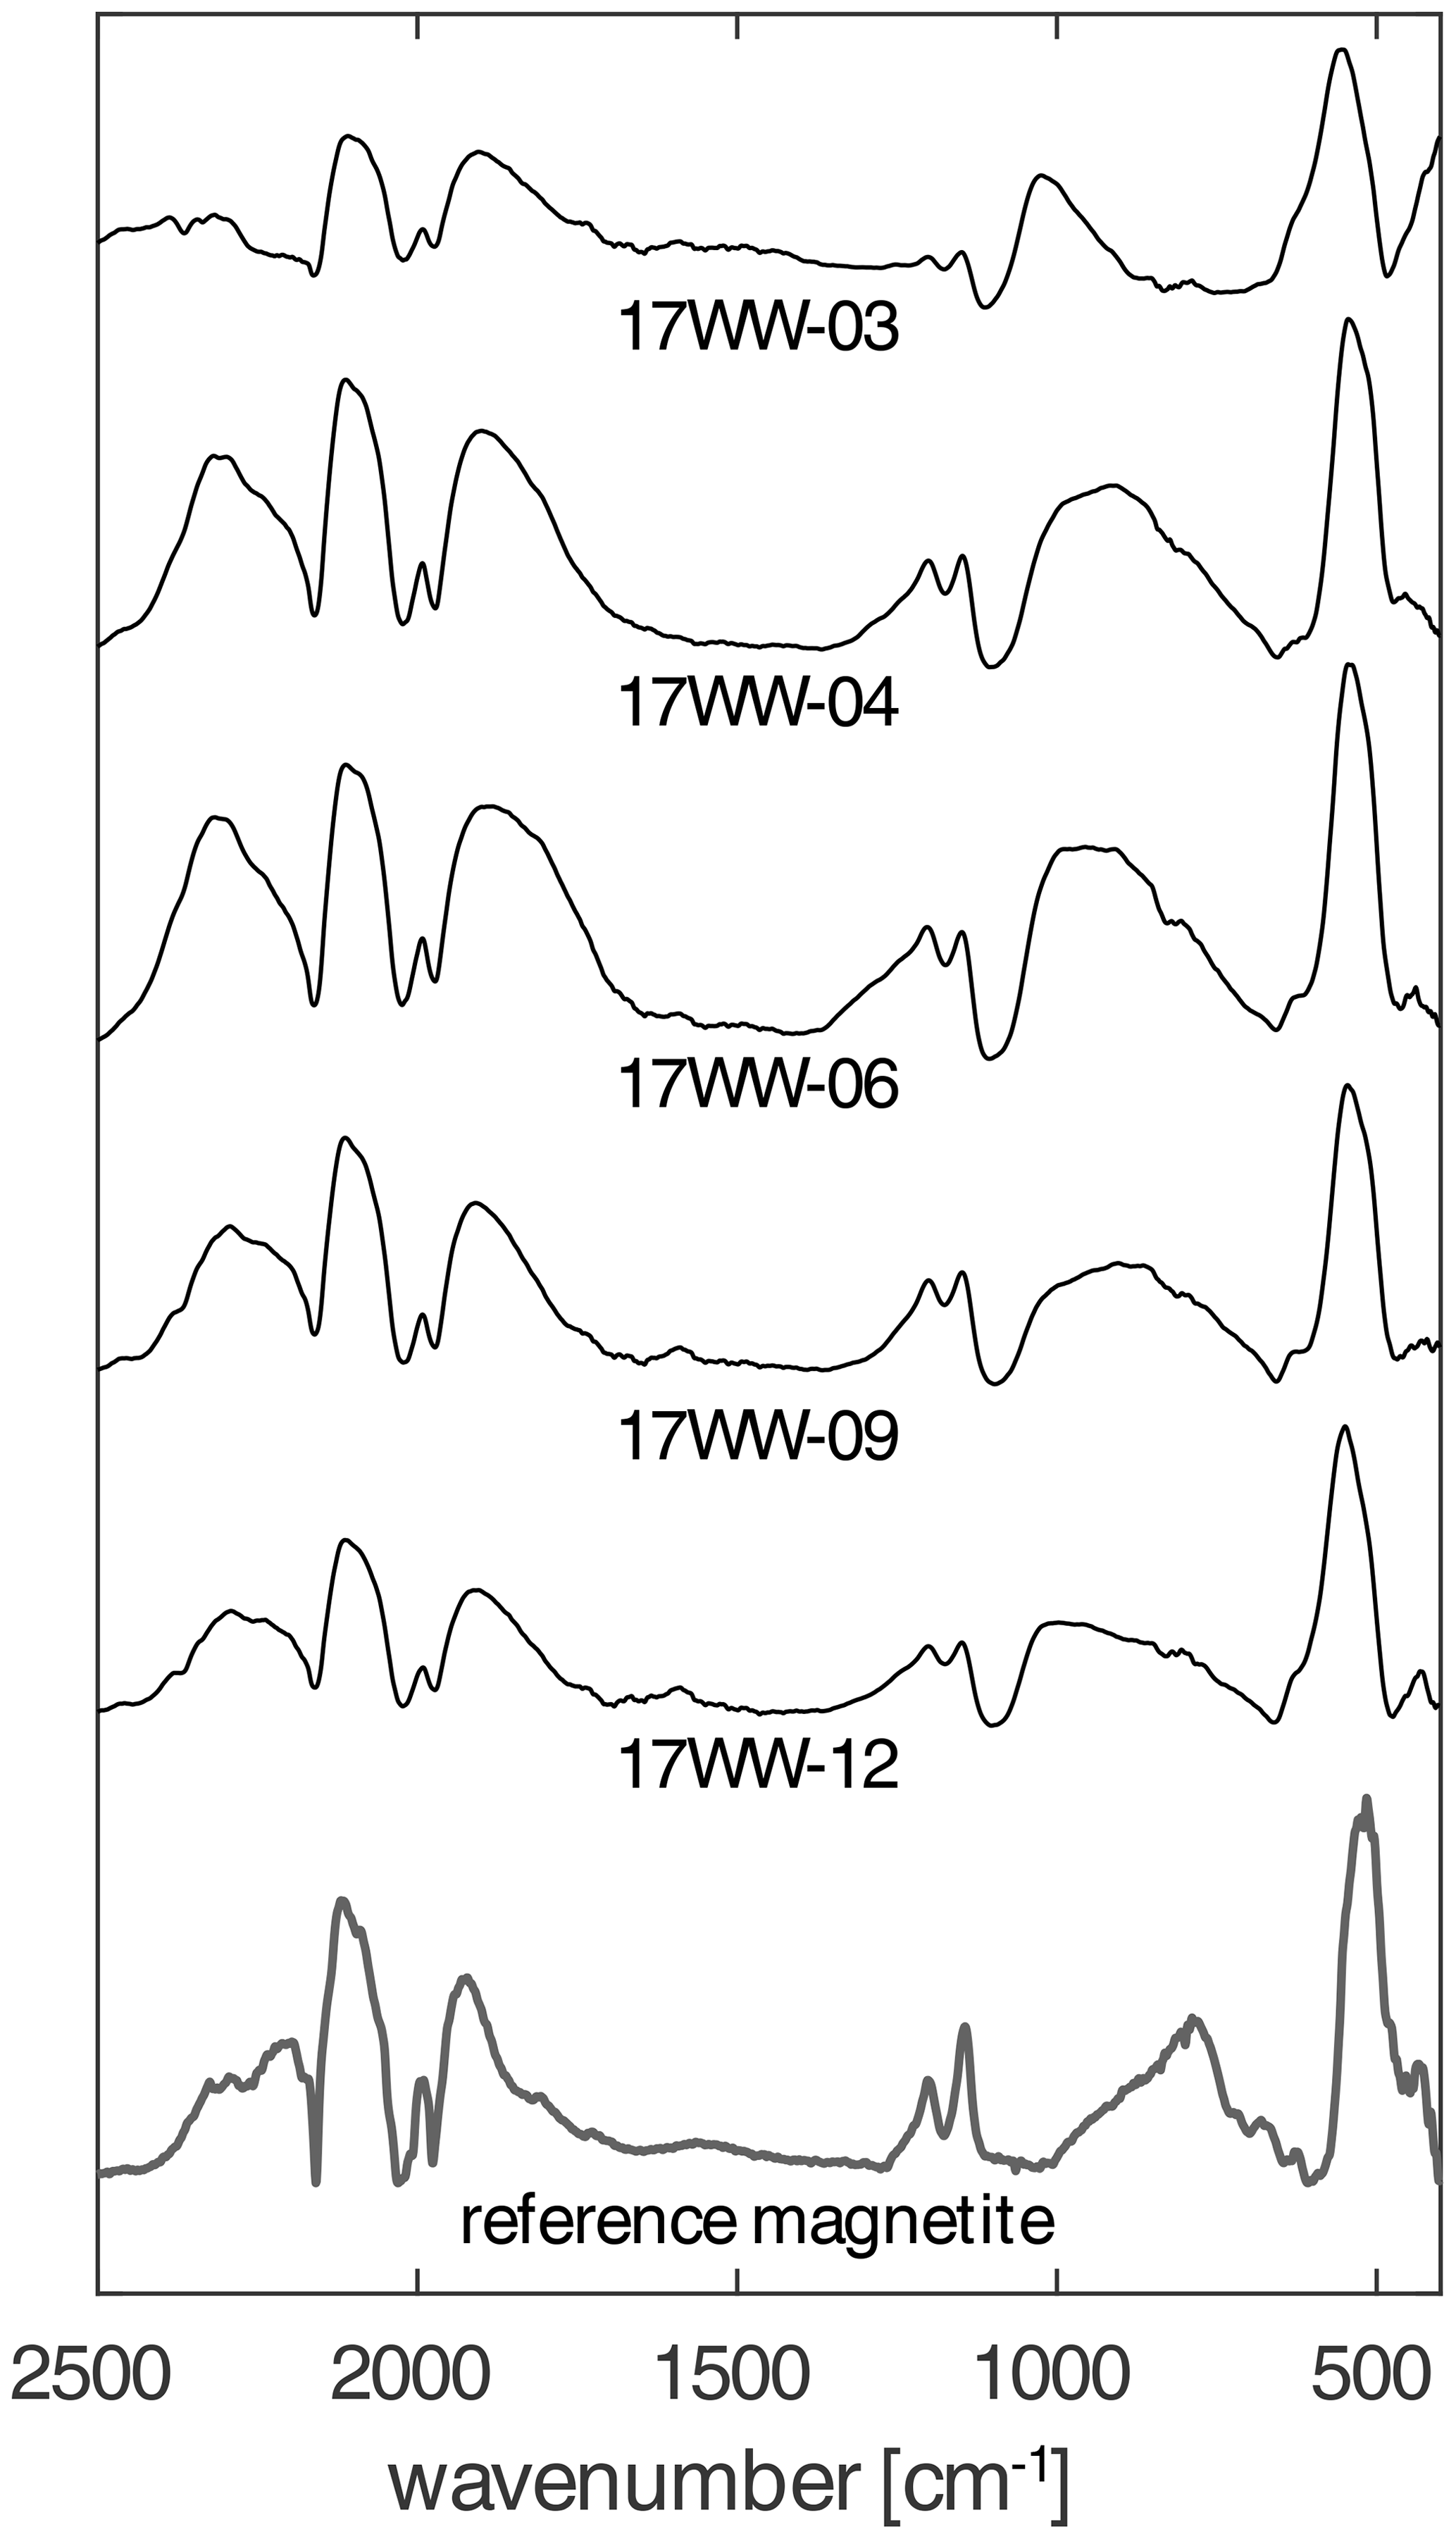
Figure 3Baseline-corrected attenuated total reflection Fourier-transform infrared (ATR-FTIR) spectra of powdered samples, showing a known magnetite sample (bottom) and unscreened magnetic separates from five different depths. These spectra demonstrate that the sample material is composed of magnetite (Fe2O3) without any detectable contribution from other phases. This method is not sensitive to substitution of Fe by other elements.
A fraction of the picked magnetic separate was directly analyzed for 3He without microCT screening, and grains from the remaining separate were arrayed on 5 mm × 5 mm sheets of paper coated with double-sided adhesive tape (see Fig. 2). An opposing piece of paper without adhesive was placed on top of the mineral grains, and up to eight layers were stacked (see Cooperdock et al., 2020) into an oriented paper box of 5.2 mm × 5.2 mm × 5.2 mm.
These boxes were scanned at the University of Southern California Molecular Imaging Center using a Scanco µCT50 (120 kV, 100 µA, 3.3 µm resolution). The resulting volumes were analyzed and segmented using 3D Slicer (Fedorov et al., 2012). Inclusions within magnetite grains were identified via intensity on the reconstructed images. Each magnetite grain was classified into one of four categories: (A) no identifiable inclusions, (B) bright inclusions only, (C) dark inclusions only, or (D) bright and dark inclusions. After microCT scanning, grains for 3He measurement and Li analysis were picked from the mounts according to this classification. The volume of certain magnetite grains and their respective inclusions was determined in 3D Slicer by segmenting these structures by contrast with manual adjustments in all successive slices and then interpolating between the segments to form volume models.
2.4 Bulk chemistry and Li measurements
Bulk elemental compositions, Li concentrations, and concentrations of α-producing elements (U, Th, Sm) were measured for bulk soil samples, magnetite, and quartz in order to constrain the cosmogenic and radiogenic neutron flux as well as the resulting production of 3He via the pathway and the production of 3He from ternary fission. Sample processing and measurement of elemental composition for bulk samples were performed by Activation Laboratories Ltd. (Ancaster, Ontario, Canada), according to their standard protocols UT-6M and UT-7. Around 10 g of bulk soil samples was pulverized in a ring-and-puck mill. The resulting powder was fused with sodium peroxide in a zirconium crucible and dissolved with concentrated HNO3 and HCl. Samples of magnetite and quartz–feldspar of around 0.25 g were pulverized using a mortar and pestle and then dissolved using HF, HClO4, HNO3, and HCl. Extremely resistant phases, such as zircon, might not have been completely dissolved by this procedure. A list of 50 elements (including Fe, Ti, P, Li, B, Gd, U, Th, and Sm) was measured on these solutions by ICP-MS using an Agilent 7900. The results were verified by interspersed analyses of certified reference materials (PTM-1a, NIST 696, DTS-2b, OREAS 74a/101a/124/139/247/621/629/680/922, CZN-4, NCS DC73520/86315/86303/86314, CCU-1e, AMIS 0368, DMMAS123) processed in the same way as the samples.
2.5 Helium measurements
Aliquots for 3He measurement were composed of between 5 and 131 grains of magnetite of 250–1200 µm diameter. Most aliquots were analyzed as is, but some were ground under ethanol using a mortar and pestle prior to analysis to investigate the effect of fluid inclusions on 3He concentrations. Grinding samples prior to thermal degassing to separate the contributions from fluid inclusions and bulk helium is a standard procedure for 3He measurements for phases such as olivine (e.g., Kurz, 1986). In order to prevent the potential adsorption of helium during crushing (Protin et al., 2016), samples were ground in a mortar and pestle under ethanol (see Cox et al., 2017).
Magnetite aliquots of between 4 and 58 mg were weighed and wrapped in tinfoil. These samples were degassed at 1300 ∘C in a double-walled vacuum furnace. The evolved gas was purified by adsorbing certain components on activated charcoal at liquid nitrogen temperatures and by reacting it with two SAES NP10 getters. The remaining gas was then cryo-focused at 13 K and helium was released into the Helix SFT mass spectrometer at 32 K. Measurements of 3He and 4He were performed by pulse counting and on a Faraday detector, respectively.
Sensitivity was calibrated against frequently interspersed standards with known amounts of 3He and 4He. The reproducibility of standard measurements was 0.7 % (1σ) over the course of a measurement block of 2 d. Blanks and re-extracts at 1350 ∘C were performed before and after sample measurements to ensure full helium extraction and to monitor background levels. Sample measurements were blank-corrected using full procedural blank analyses, which accounted for between 1 % and 23 % of the total signal, with an average of 6 %. Blank corrections and standard repeatability were taken into account when calculating the reported analytical uncertainties of 3He concentrations. Measured 3He concentrations are given in millions of atoms per gram (Mat g−1). All measured 3He 4He ratios were normalized to an atmospheric ratio of 1.38 × 10⁻⁶ and are given in atmospheric units (Ra).
3.1 MicroCT
The internal structure of 3385 mineral grains with a total mass of 1.7 g was investigated through microCT scanning of 20 boxes containing a combined 120 layers of grains. These analyses took a total of 9 h to complete. Magnetite displayed a uniform microCT contrast (Fig. 4), while other phases appeared brighter or darker according to their density and composition relative to magnetite (e.g., Ketcham and Carlson, 2001). Fractures within grains were also detected but not used for classification since diffusion of helium in magnetite at earth-surface conditions is likely not important (see above). Based on the contrast in the microCT images, 52 scanned grains (1.5 %) were discovered to not be magnetite and were classified as “misidentified”. Comparisons with known phases (Fig. 4) show that very bright inclusions have the same contrast as zircon, and inclusions with a brightness between those and magnetite are close to that of apatite. Inclusions that are darker than magnetite have a microCT contrast close to that of quartz and other silicates.
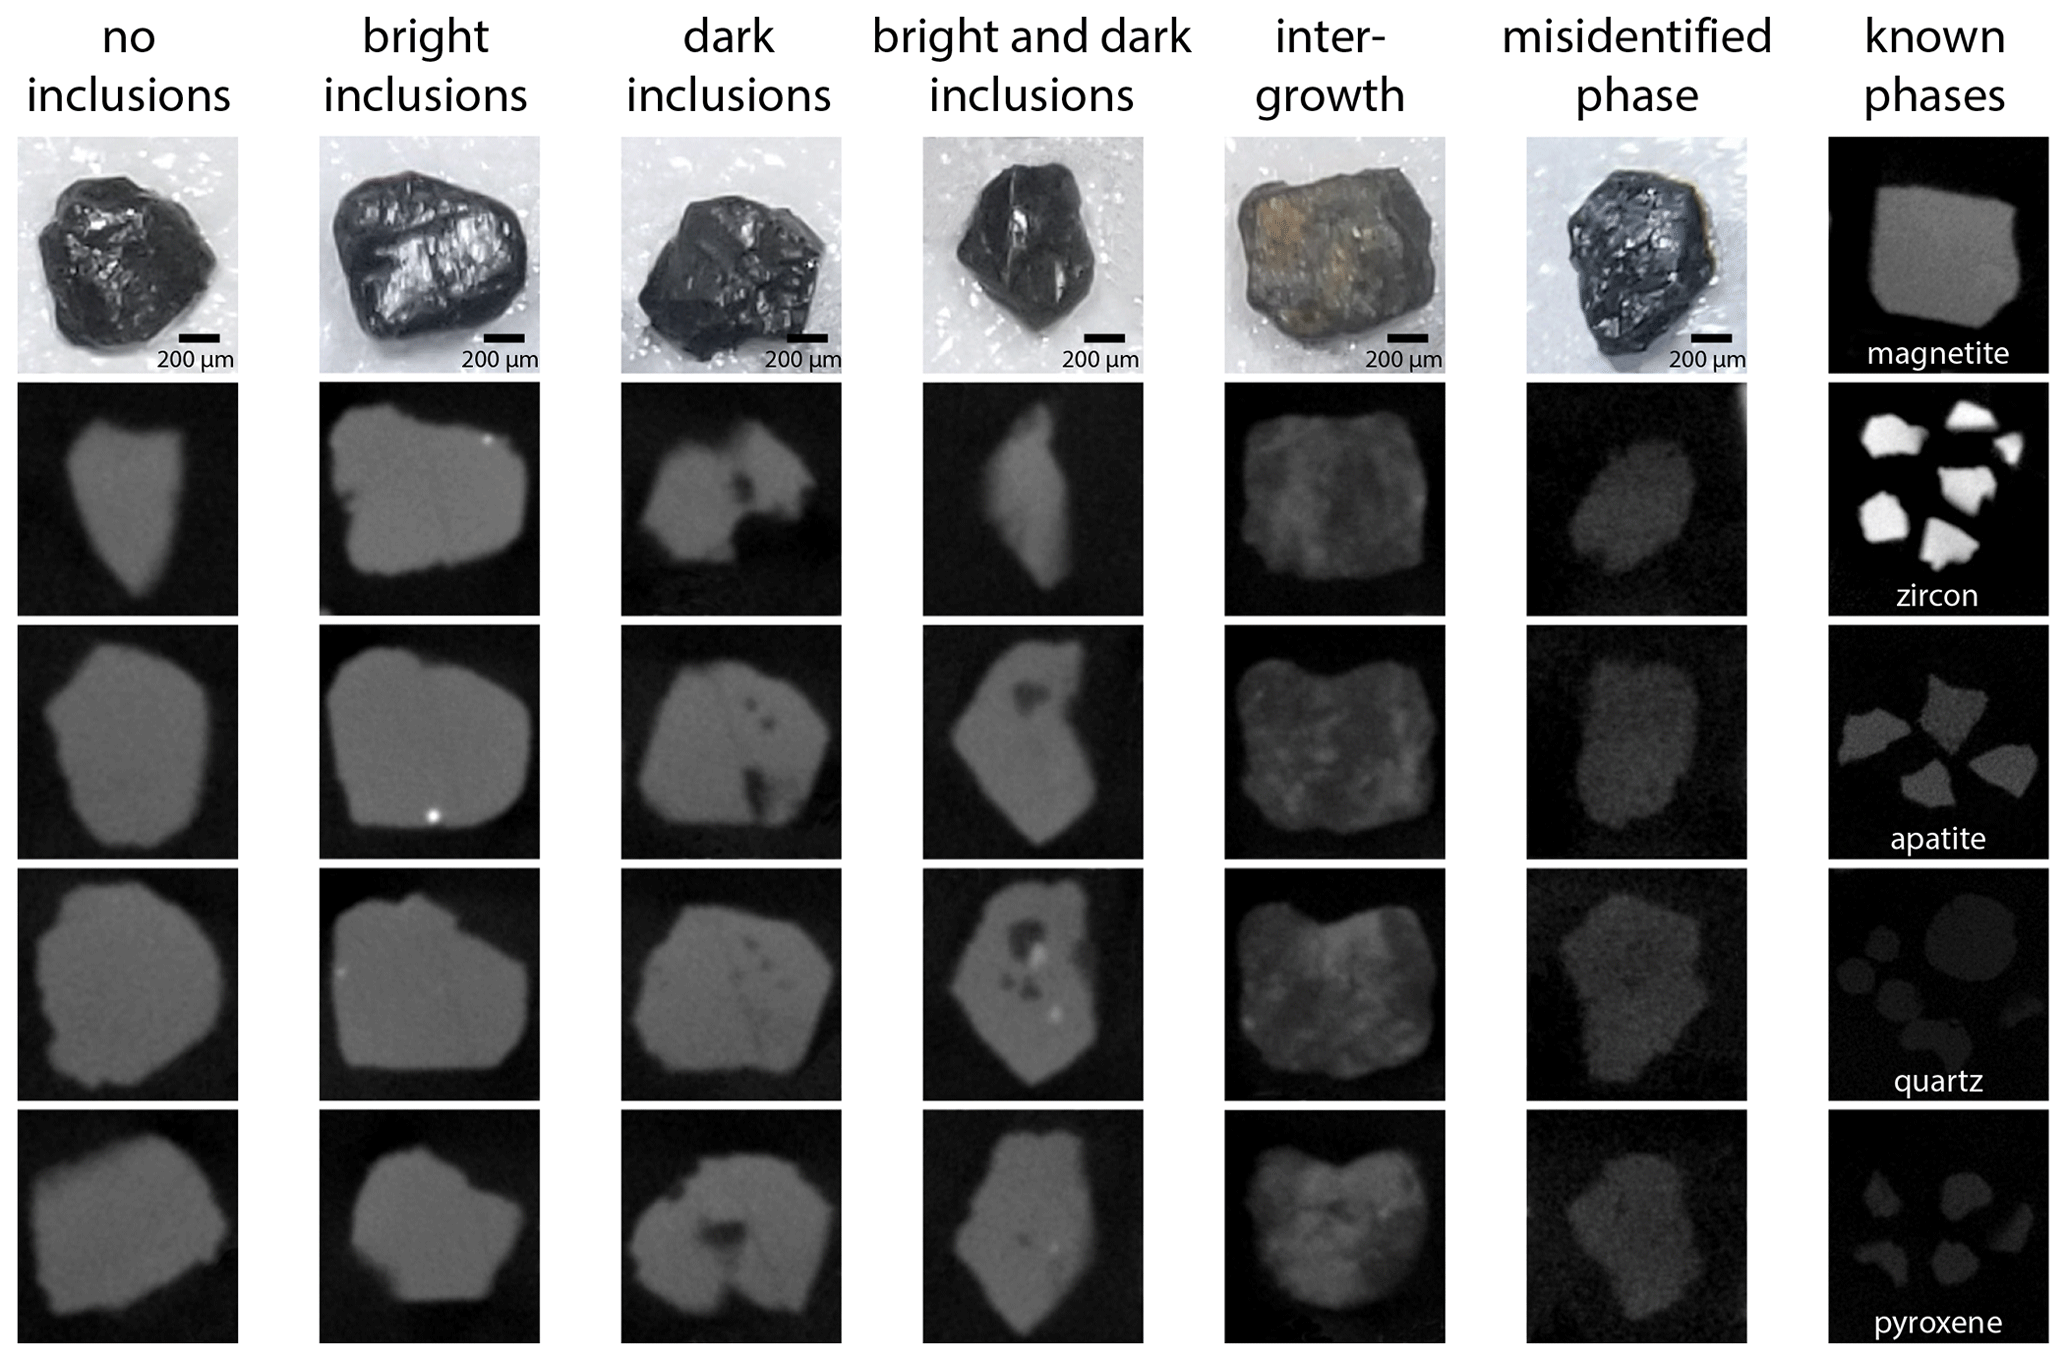
Figure 4Examples of textures and inclusions in magnetite grains detected with microCT. Light micrographs and four horizontal microCT slices through the same grain are given in each column. All microCT scans were acquired with the same scan parameters, and images are given at the same contrast. Reference microCT images for known phases are given for comparison (magnetite as confirmed by FTIR, SLI 3 zircon, Durango apatite, and CRONUS quartz and pyroxene standards). Bright inclusions represent zircon and apatite, whereas inclusions darker than magnetite are most likely silicates. Intergrowth and substitution structures as well as other phases mistakenly identified as magnetite during sample picking under a light microscope were also detected.

Figure 5Results of the classification of grains according to inclusions identified by microCT imaging, showing that the most useful (inclusion-free) grain size range for analysis was 400–800 µm. All plots are histograms with grain size bins of 100 µm width. (a) The total number of grains that were scanned, presented by grain size. (b) The percentage of grains for each grain size bin that was found to be suitable (i.e., without inclusions). (c) Classification of grains into those with no inclusions, bright inclusions, dark inclusions, and bright and dark inclusions. (d) The percentage of the total mass of grains used for analysis in each grain size bin. Mass was estimated based on the grain diameter and the mean density of magnetite.
The 3333 scanned magnetite grains had diameters between 250 and 1500 µm, with most grains being between 300 and 800 µm (Fig. 5a). Overall, 1115 grains (33.5 %) were classified as having no inclusions within the resolution of the scan and being suitable for cosmogenic 3He dating. There were 417 grains (12.5 %) with bright inclusions, 1046 grains (31.4 %) with dark inclusions, and 755 grains (22.6 %) with bright and dark inclusions.
Smaller grain size fractions yielded a greater number of grains without inclusions, and the largest fraction of useful grains (around 50 %) was observed for grain diameters of 200–400 µm (Fig. 5b, c), with a linear decrease for larger grain diameters to < 20 % over 800 µm. This relationship was observed for the overall data as well as for each individual sample. This trend is consistent with inclusions being spatially distributed at random. Grains with diameters between 400 and 800 µm contributed 77 % of the total mass of usable magnetite grains (Fig. 5d).
For several aliquots (17WW-02-Incl1 through 17WW-02-Incl6), bright and dark inclusions were segmented in the microCT imagery. The surface area of materials with equal CT contrast (i.e., equal density or composition) was visualized as surfaces and volumes using isosurface renderings for all grains and inclusions (Figs. 6–8). Size and volume determination for 96 individual magnetite grains and their inclusions from these segmented models showed that bright inclusions are on average smaller than dark inclusions. Most bright inclusions are elongated in one axis (Figs. 7, 8), which is between 20 and 300 µm in length. Dark inclusions are generally more equant (Figs. 6–8) with diameters mainly between 50 and 400 µm. Bright inclusions take up between 0.003 % and 12.6 % of the grain volume, with an average of 0.5 %. Dark inclusions take up 0.03 % to 14.4 % of the grain volume, with an average of 1.9 %. Dark inclusions are therefore both larger and more numerous than bright inclusions.
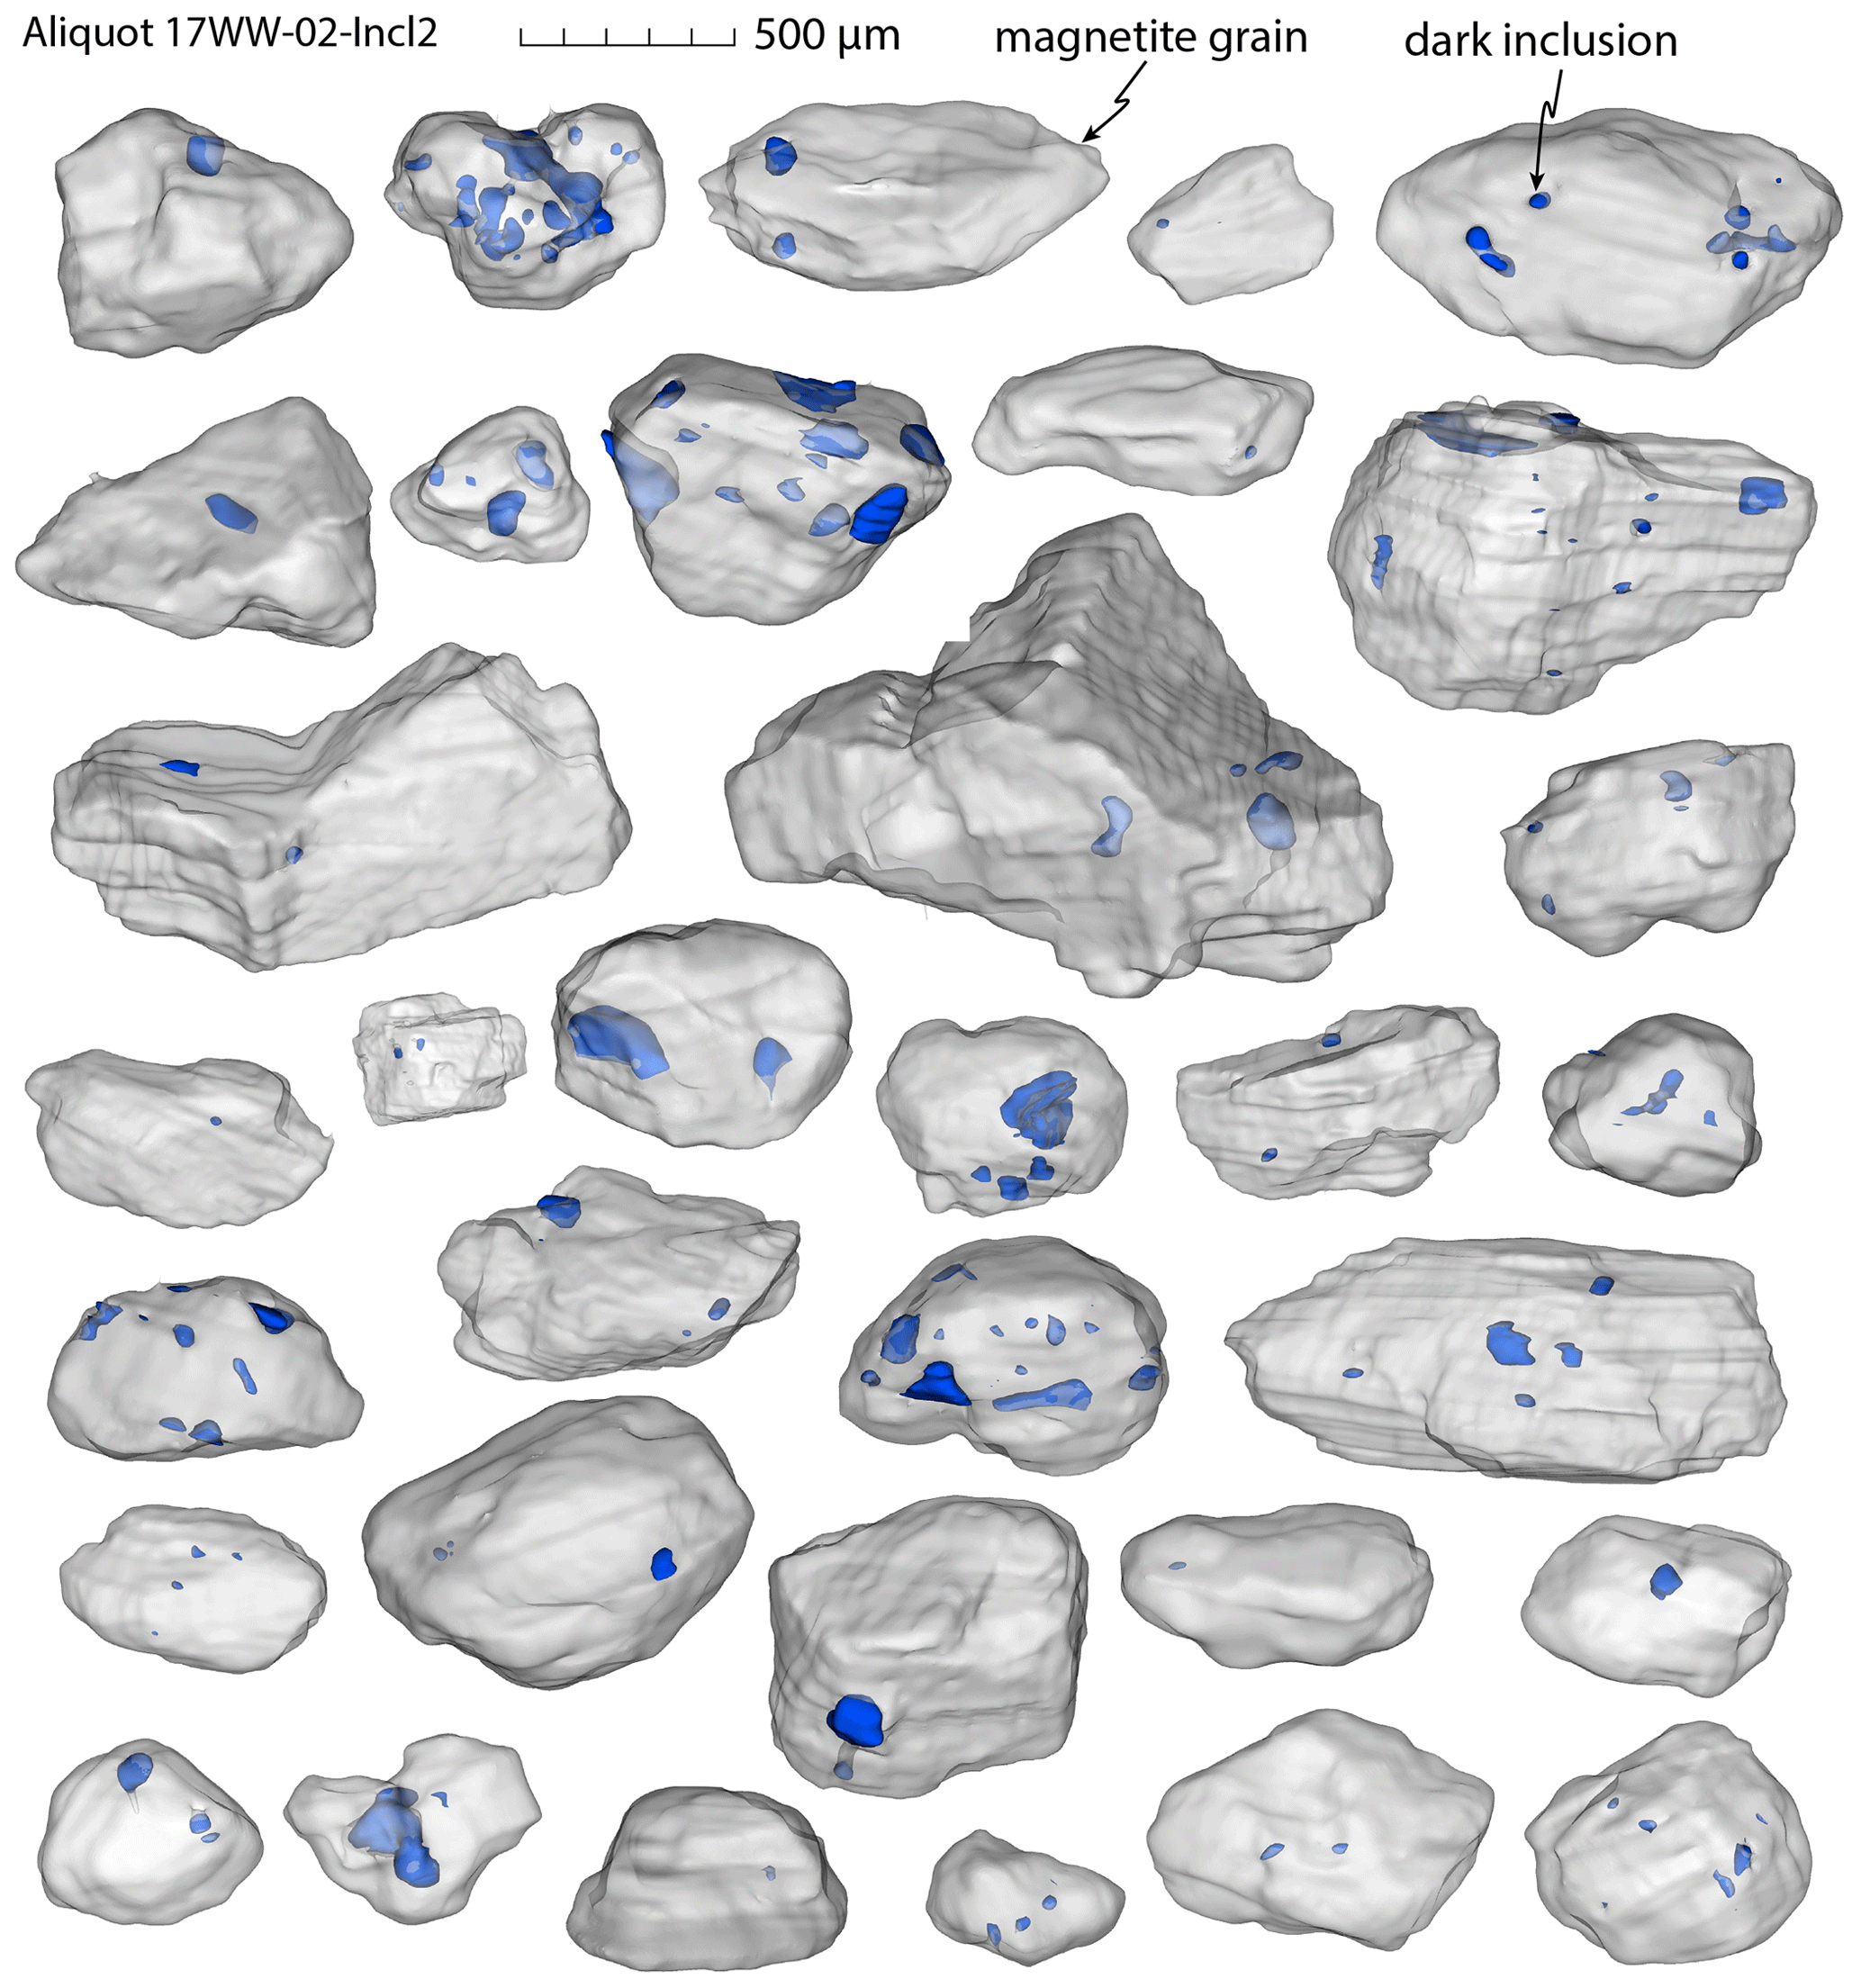
Figure 6Segmented volume renderings of magnetite grains with dark inclusions (dark blue) constructed from microCT data. These are all of the grains from aliquot 17WW-02-Incl2 (only dark inclusions); for helium data see Table 3.
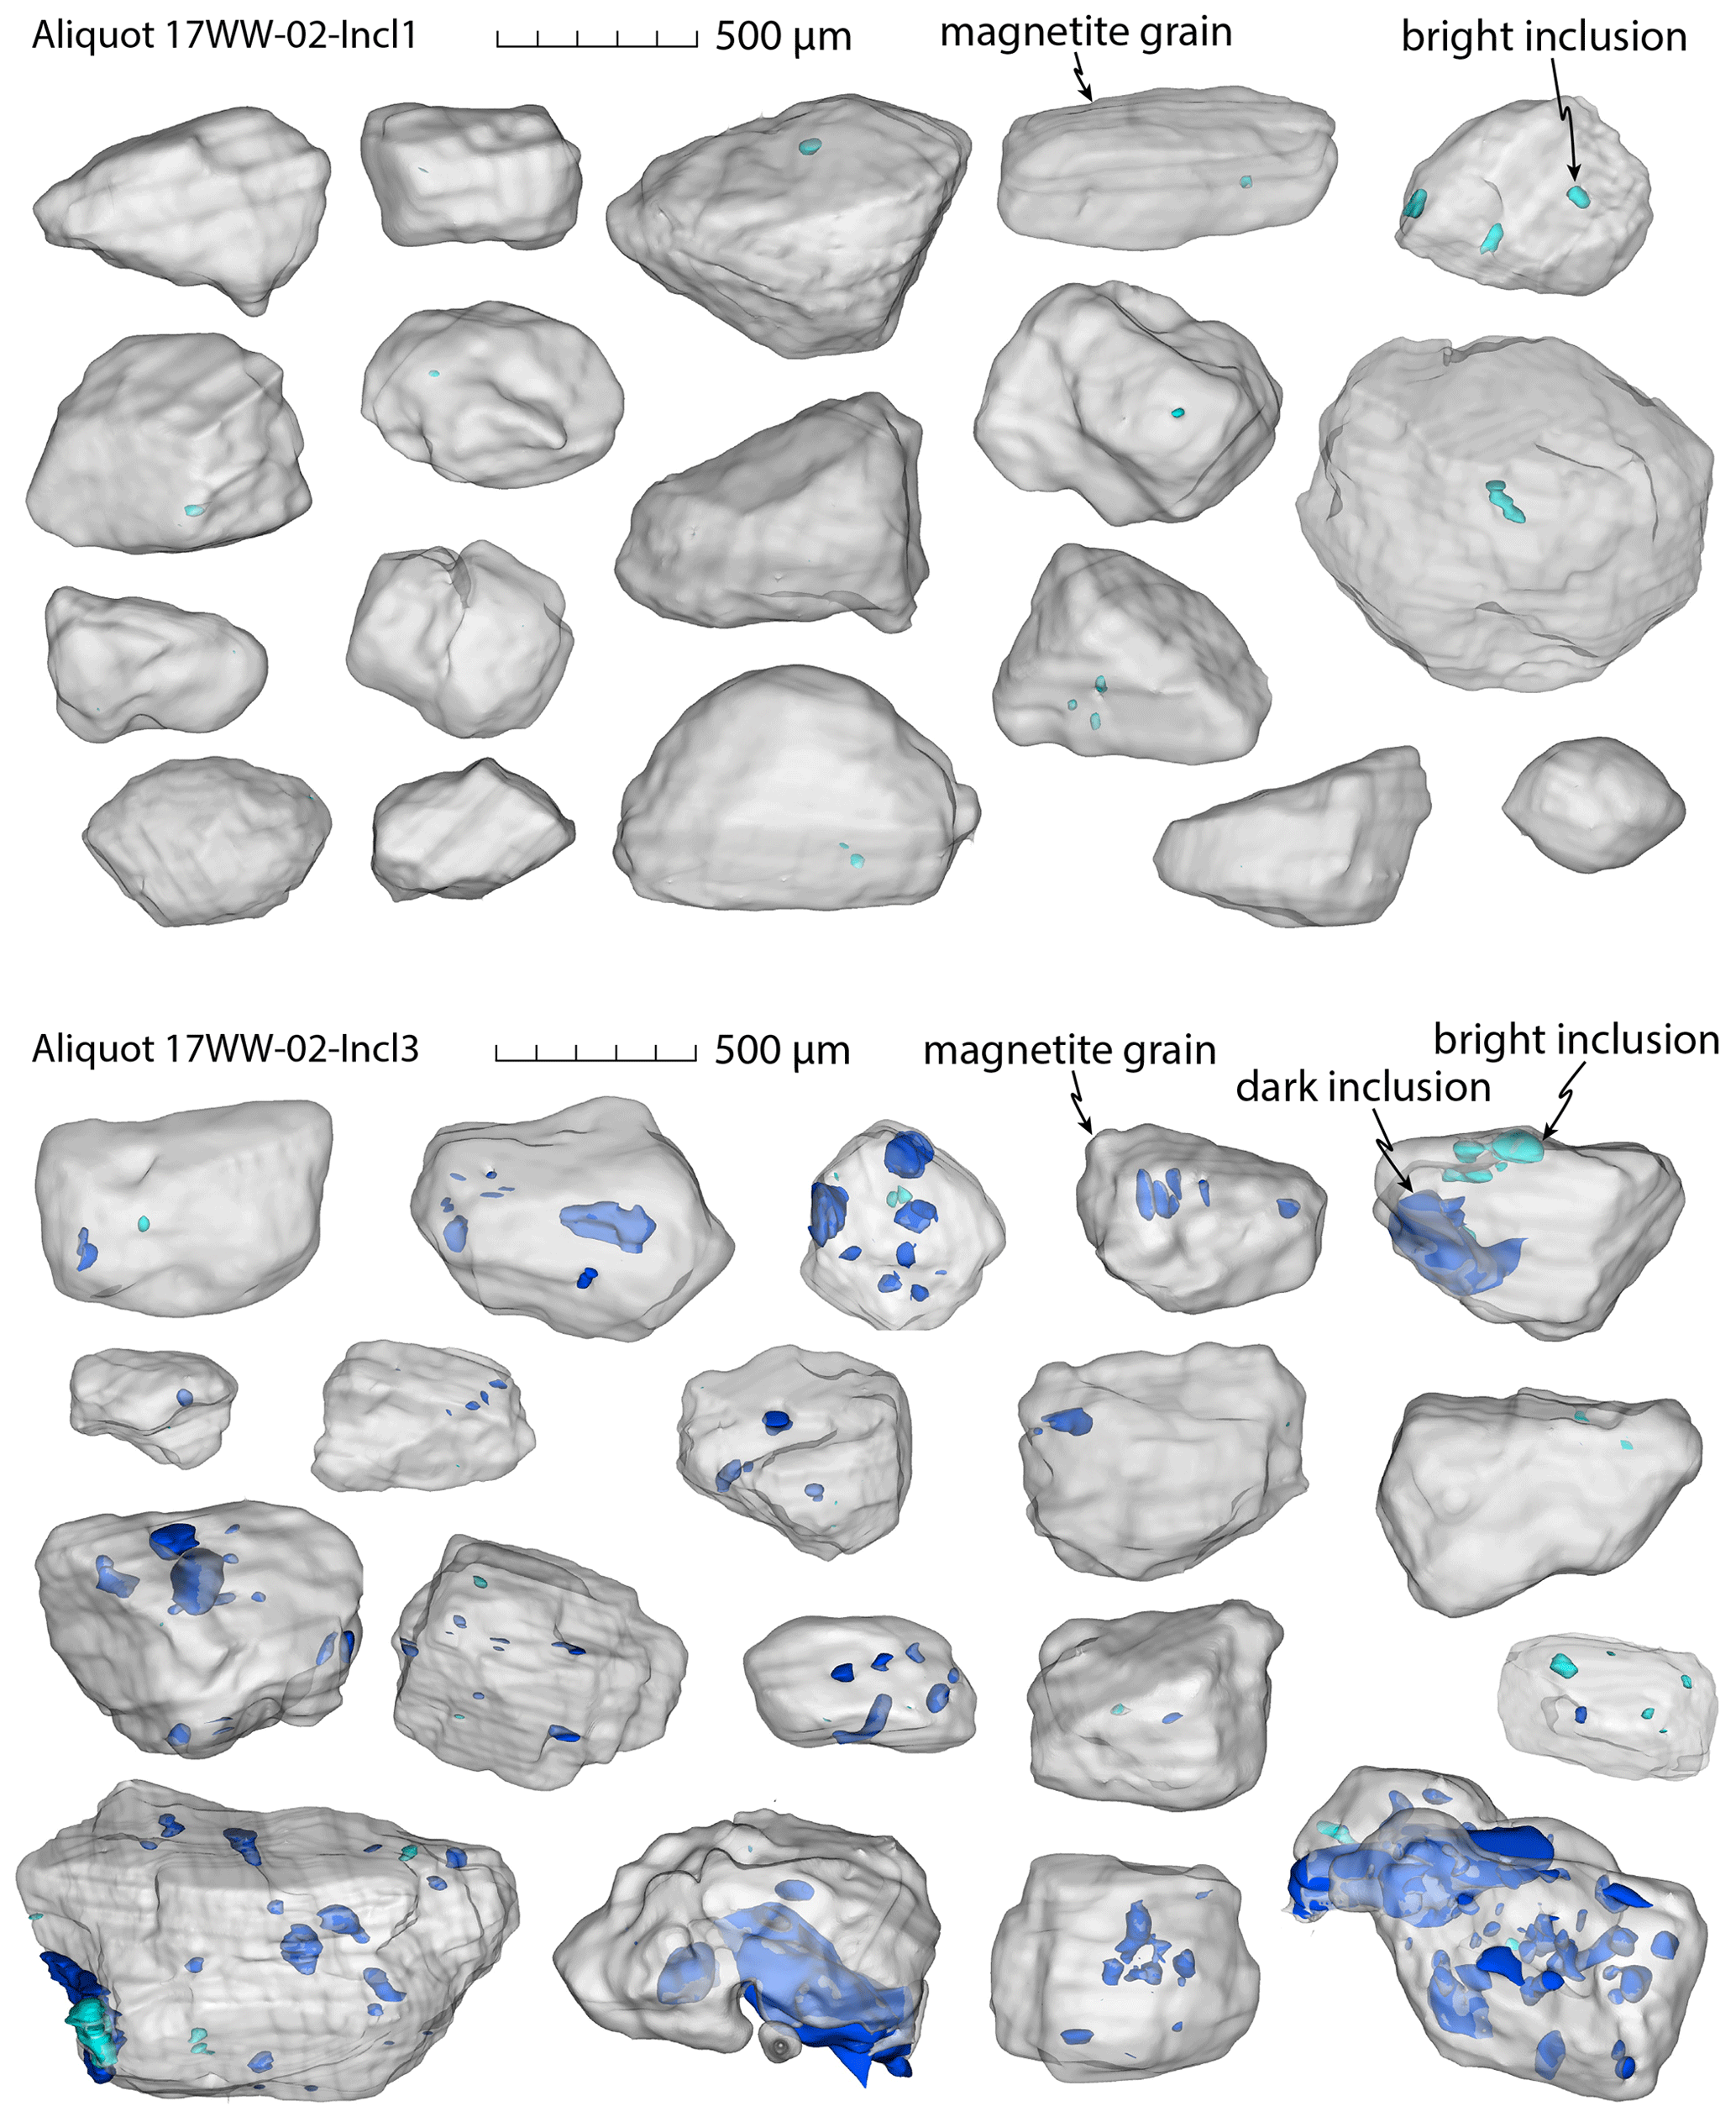
Figure 7Segmented volume renderings of magnetite grains with bright (turquoise) and dark inclusions (dark blue) constructed from microCT data. These are all of the grains from aliquots 17WW-02-Incl1 (only bright inclusions) and 17WW-02-Incl3 (bright and dark inclusion); for helium data see Table 3.
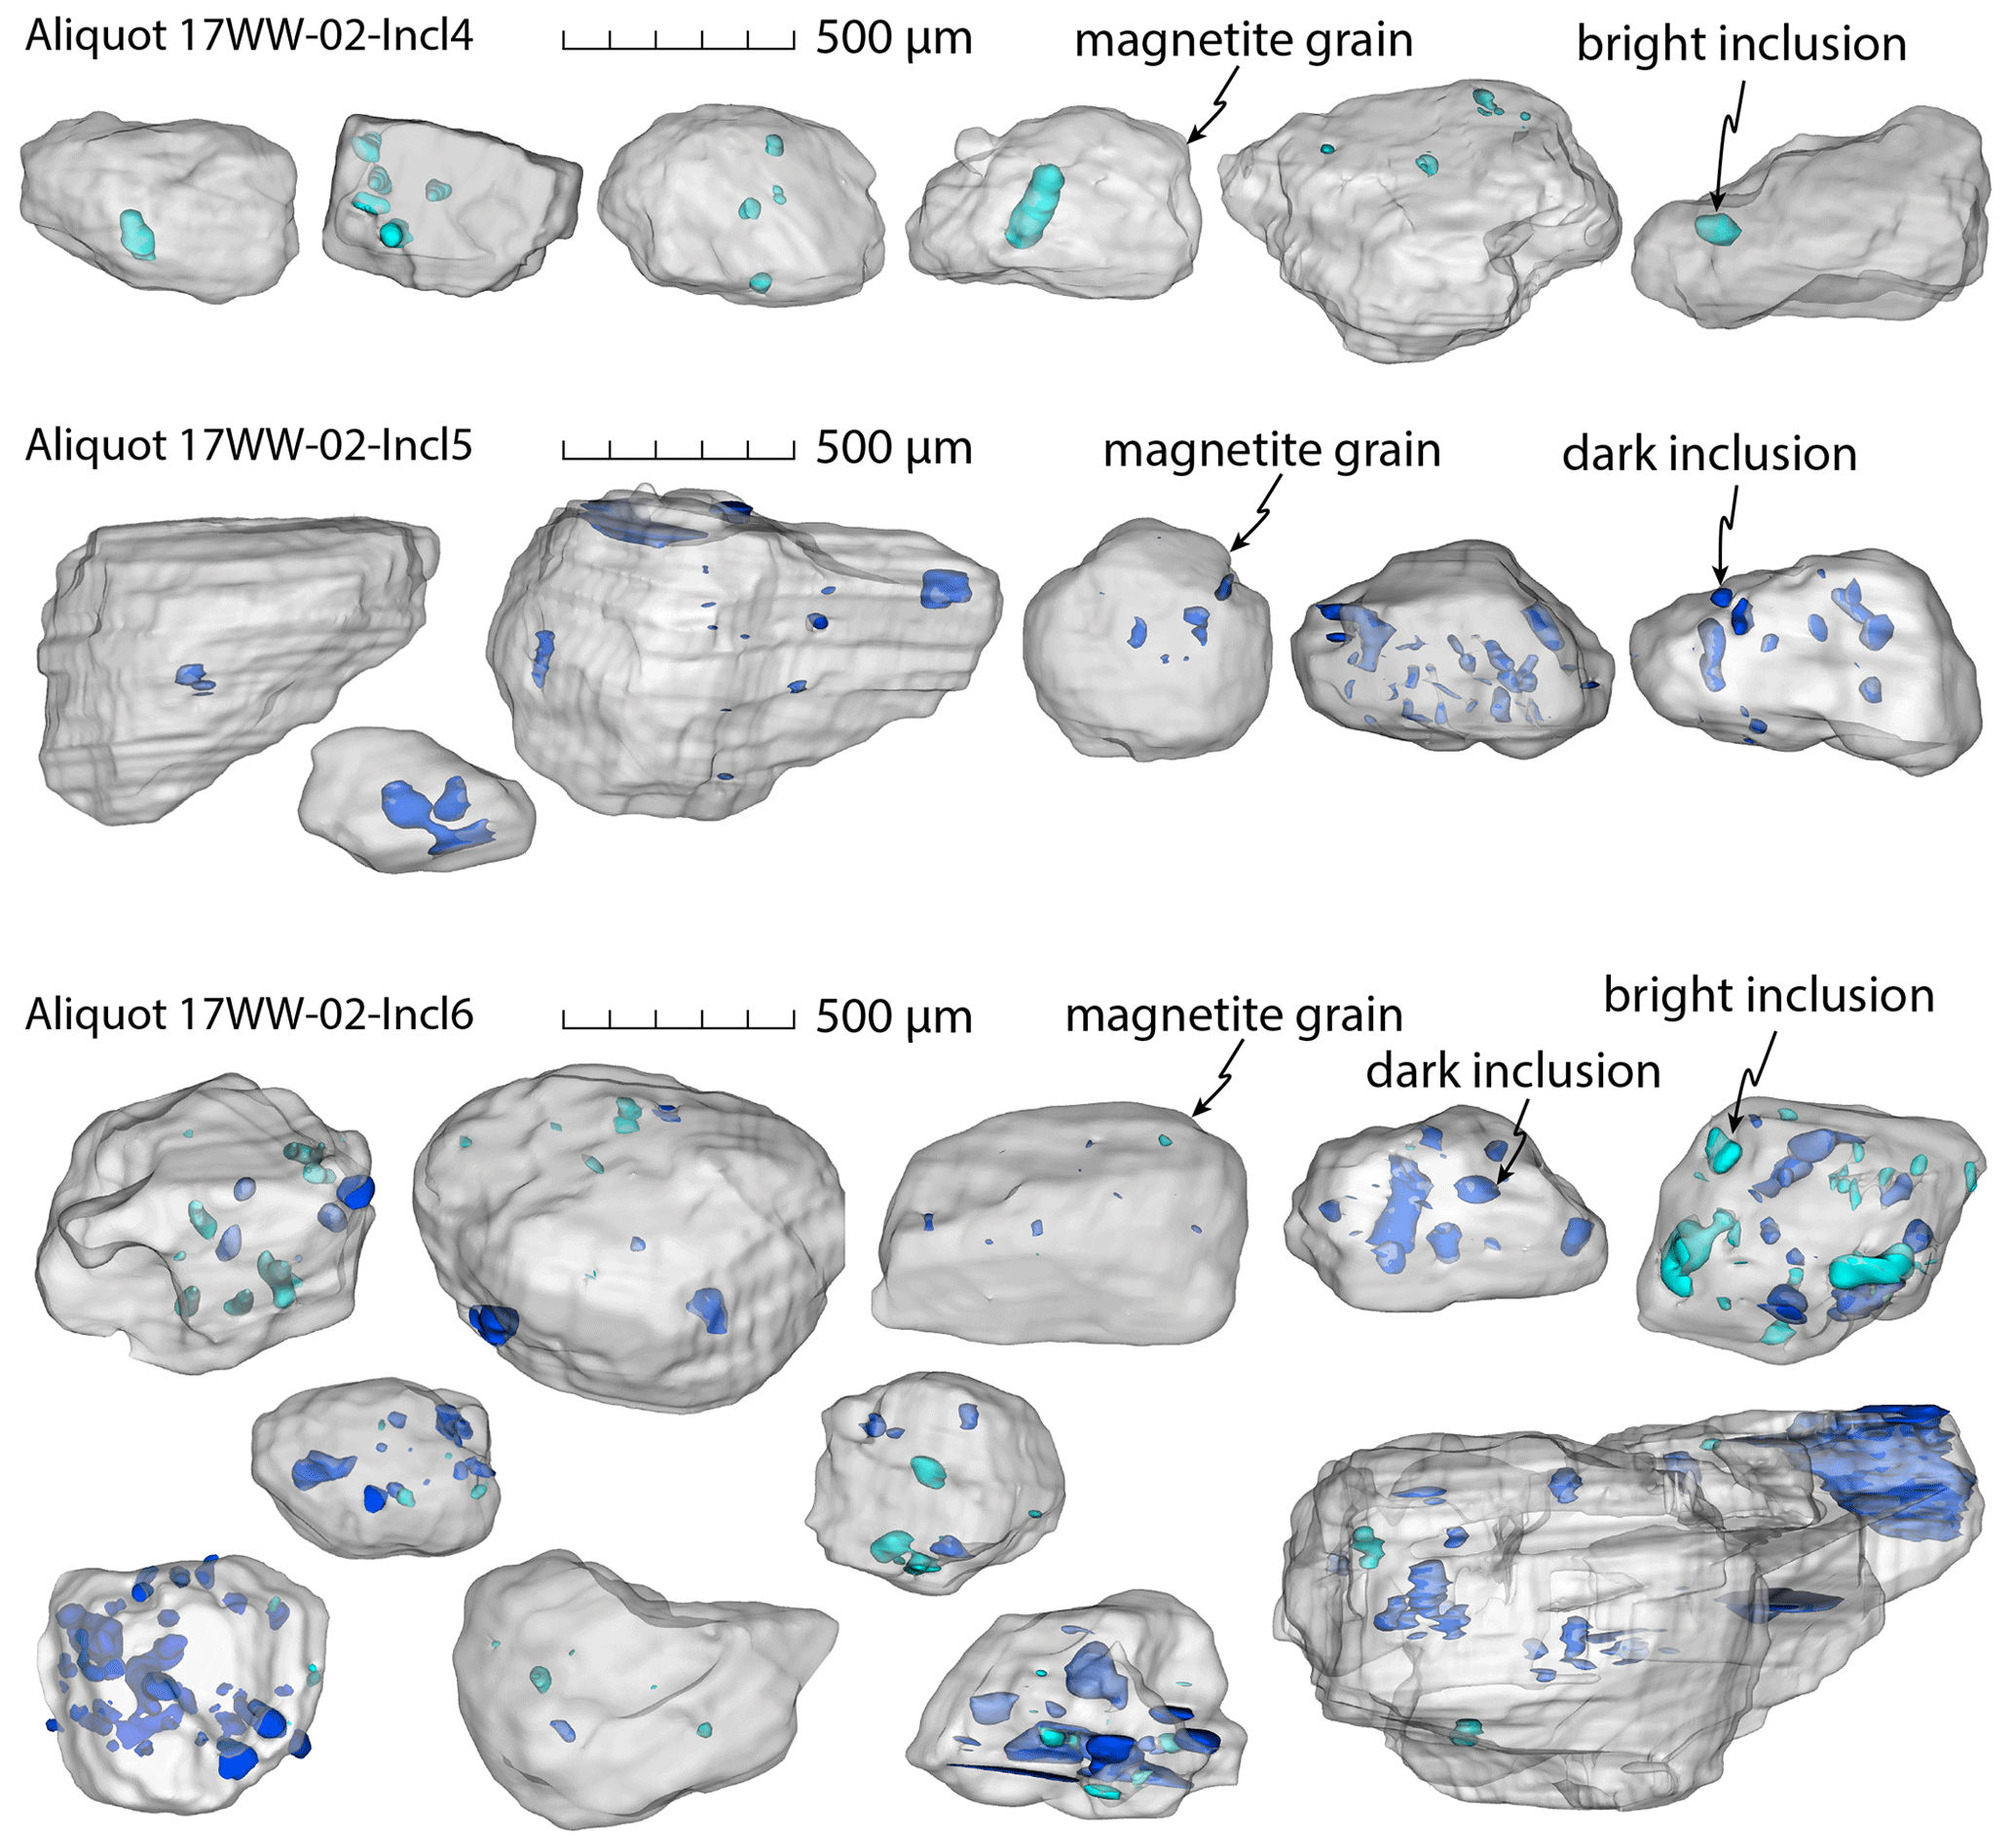
Figure 8Segmented volume renderings of magnetite grains with many bright (turquoise) and dark inclusions (dark blue) constructed from microCT data. These are all of the grains from aliquots 17WW-02-Incl4 (many bright inclusions), 17WW-02-Incl5 (many dark inclusions), and 17WW-02-Incl6 (many bright and dark inclusion); for helium data see Table 3.
3.2 Elemental composition
Elemental analysis of ∼ 10 g of bulk soil material yielded Li concentrations of 10–14 ppm; these concentrations are constant with depth (see Table 1). Lithium is present at a higher concentration (66 ppm) in the clay fraction. Boron is below the detection limit (< 10 ppm) in the bulk soil and around 20 ppm in the clay fraction. Iron is present at ∼ 3 % in the bulk soil and 6 % in the clay fraction, indicating the presence of detrital iron oxides, such as magnetite, and pedogenic iron oxides, which are more concentrated in the clay fraction. Radioactive elements (U, Th, Sm) were measured at averages around 3, 36, and 10 ppm, respectively, in the bulk soil. Major and trace element compositions of the bulk soil do not significantly differ from that of the unweathered fanglomerate (sample 17WW-B1), which represents the parent material of the soil.
Table 1Elemental analyses of bulk soil samples and mineral separates by ICP-MS. Only the most relevant parameters for determining neutron fluxes and 3He production rates are shown; full results can be found in the EarthChem database.
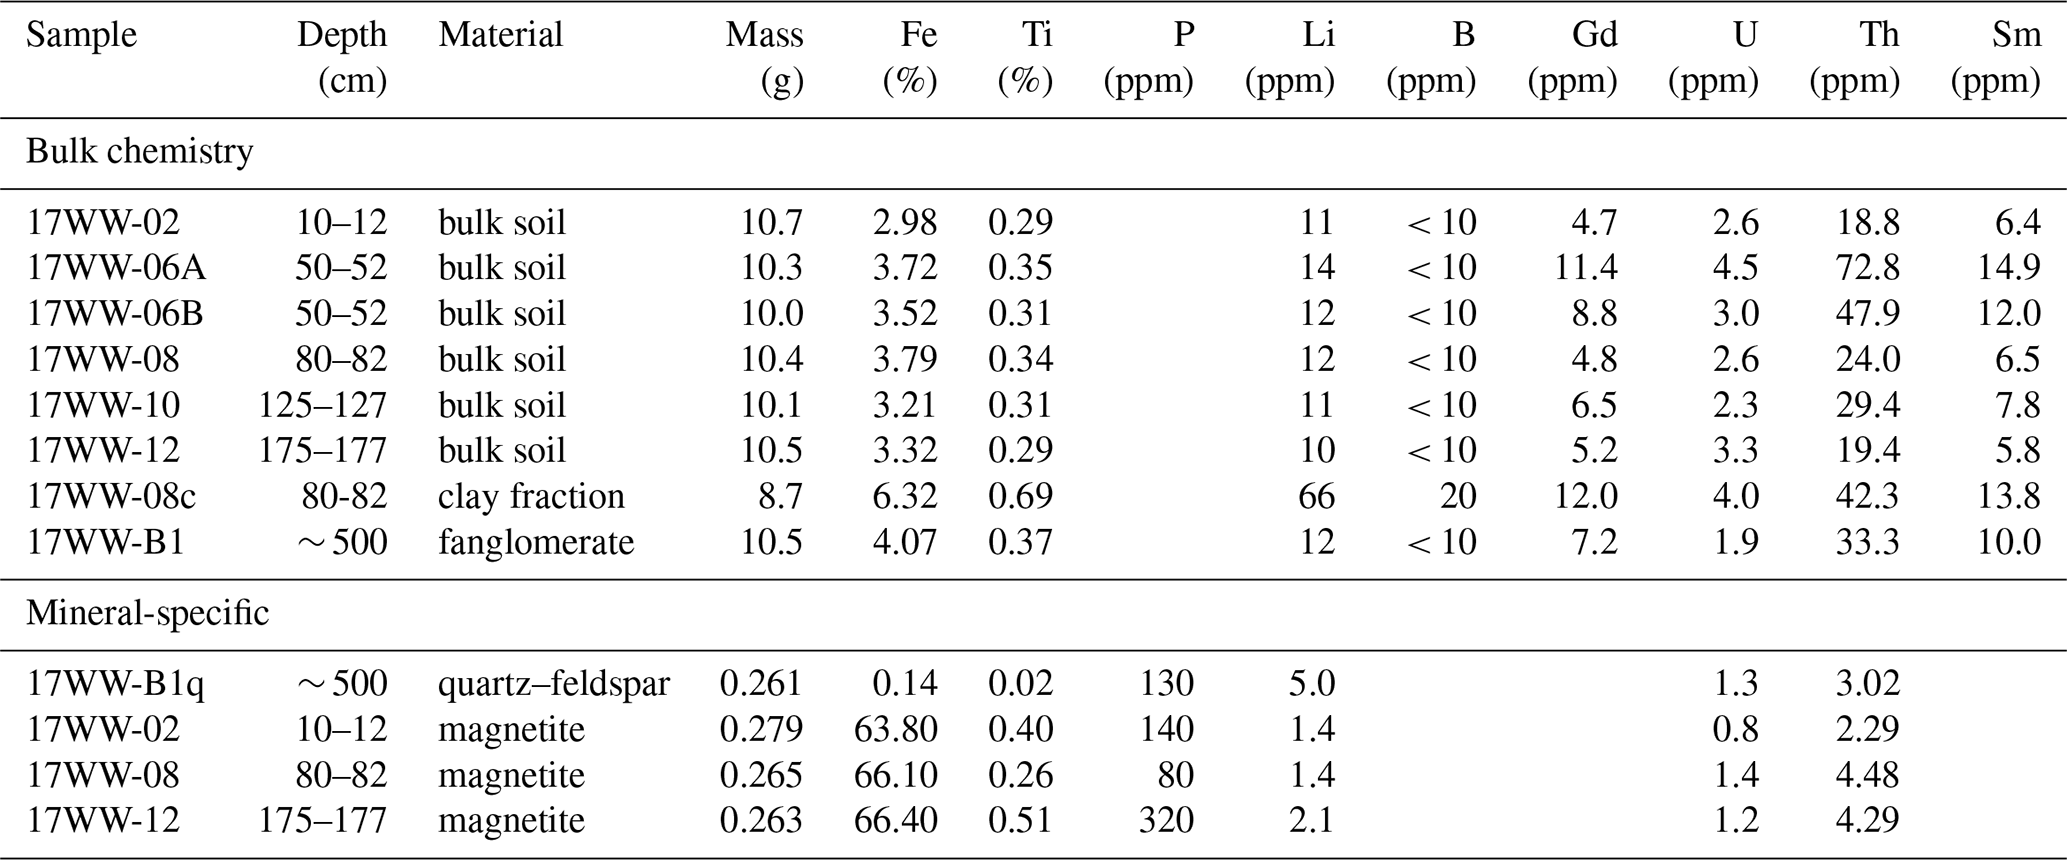
The elemental analysis of ∼ 0.25 g of magnetite picked from the magnetic fraction revealed Ti concentrations of 0.26–0.51 mass percent, which allow for a maximum substitution of Ti for Fe of 0.3–0.7 molar percent. Combined with the ATR-FTIR spectra (see Fig. 3), these data show that the extracted phase is relatively pure magnetite without major intergrowth or contribution from other solid-solution end-members. Trace elements are generally present at lower levels in magnetite than in the bulk soil. Li concentrations in magnetite are 1.4–2.0 ppm, while U and Th concentrations have averages of 1 and 4 ppm. The P concentrations measured in magnetite allow for the presence of apatite of up to 0.2 % by mass or 0.35 % by volume. An analysis of quartz and feldspar from the unweathered protolith yielded an Li concentration of 5 ppm. The full results of ICP-MS measurements are reported in the EarthChem database (see Data availability).
3.3 Helium concentrations
3.3.1 Unscreened magnetite samples
Grains picked at random from the magnetic separate without information about inclusions yielded 3He concentrations of 5–39 Mat g−1 (Fig. 9) and 4He concentrations of 0.4–4.4 nmol g−1, with an average of 1.6 nmol g−1 (Table 2). Since, on average, around two-thirds of scanned grains were found to contain inclusions, it is likely that this unscanned material contains many bright and dark mineral inclusions. The 3He concentrations at every depth interval (Fig. 9) show large scatter and are up to a factor of 4 in excess of the expected value based on the known exposure age from 10Be in quartz (Owen et al., 2014; Hofmann, 2019), as well as the production rate of 3He in magnetite and the inherited concentrations calibrated here (see discussion below). The 3He depth profile reaches a maximum value of 40 Mat g−1 at 20–30 cm and then declines with increasing depth to < 10 Mat g−1 at 175 cm.
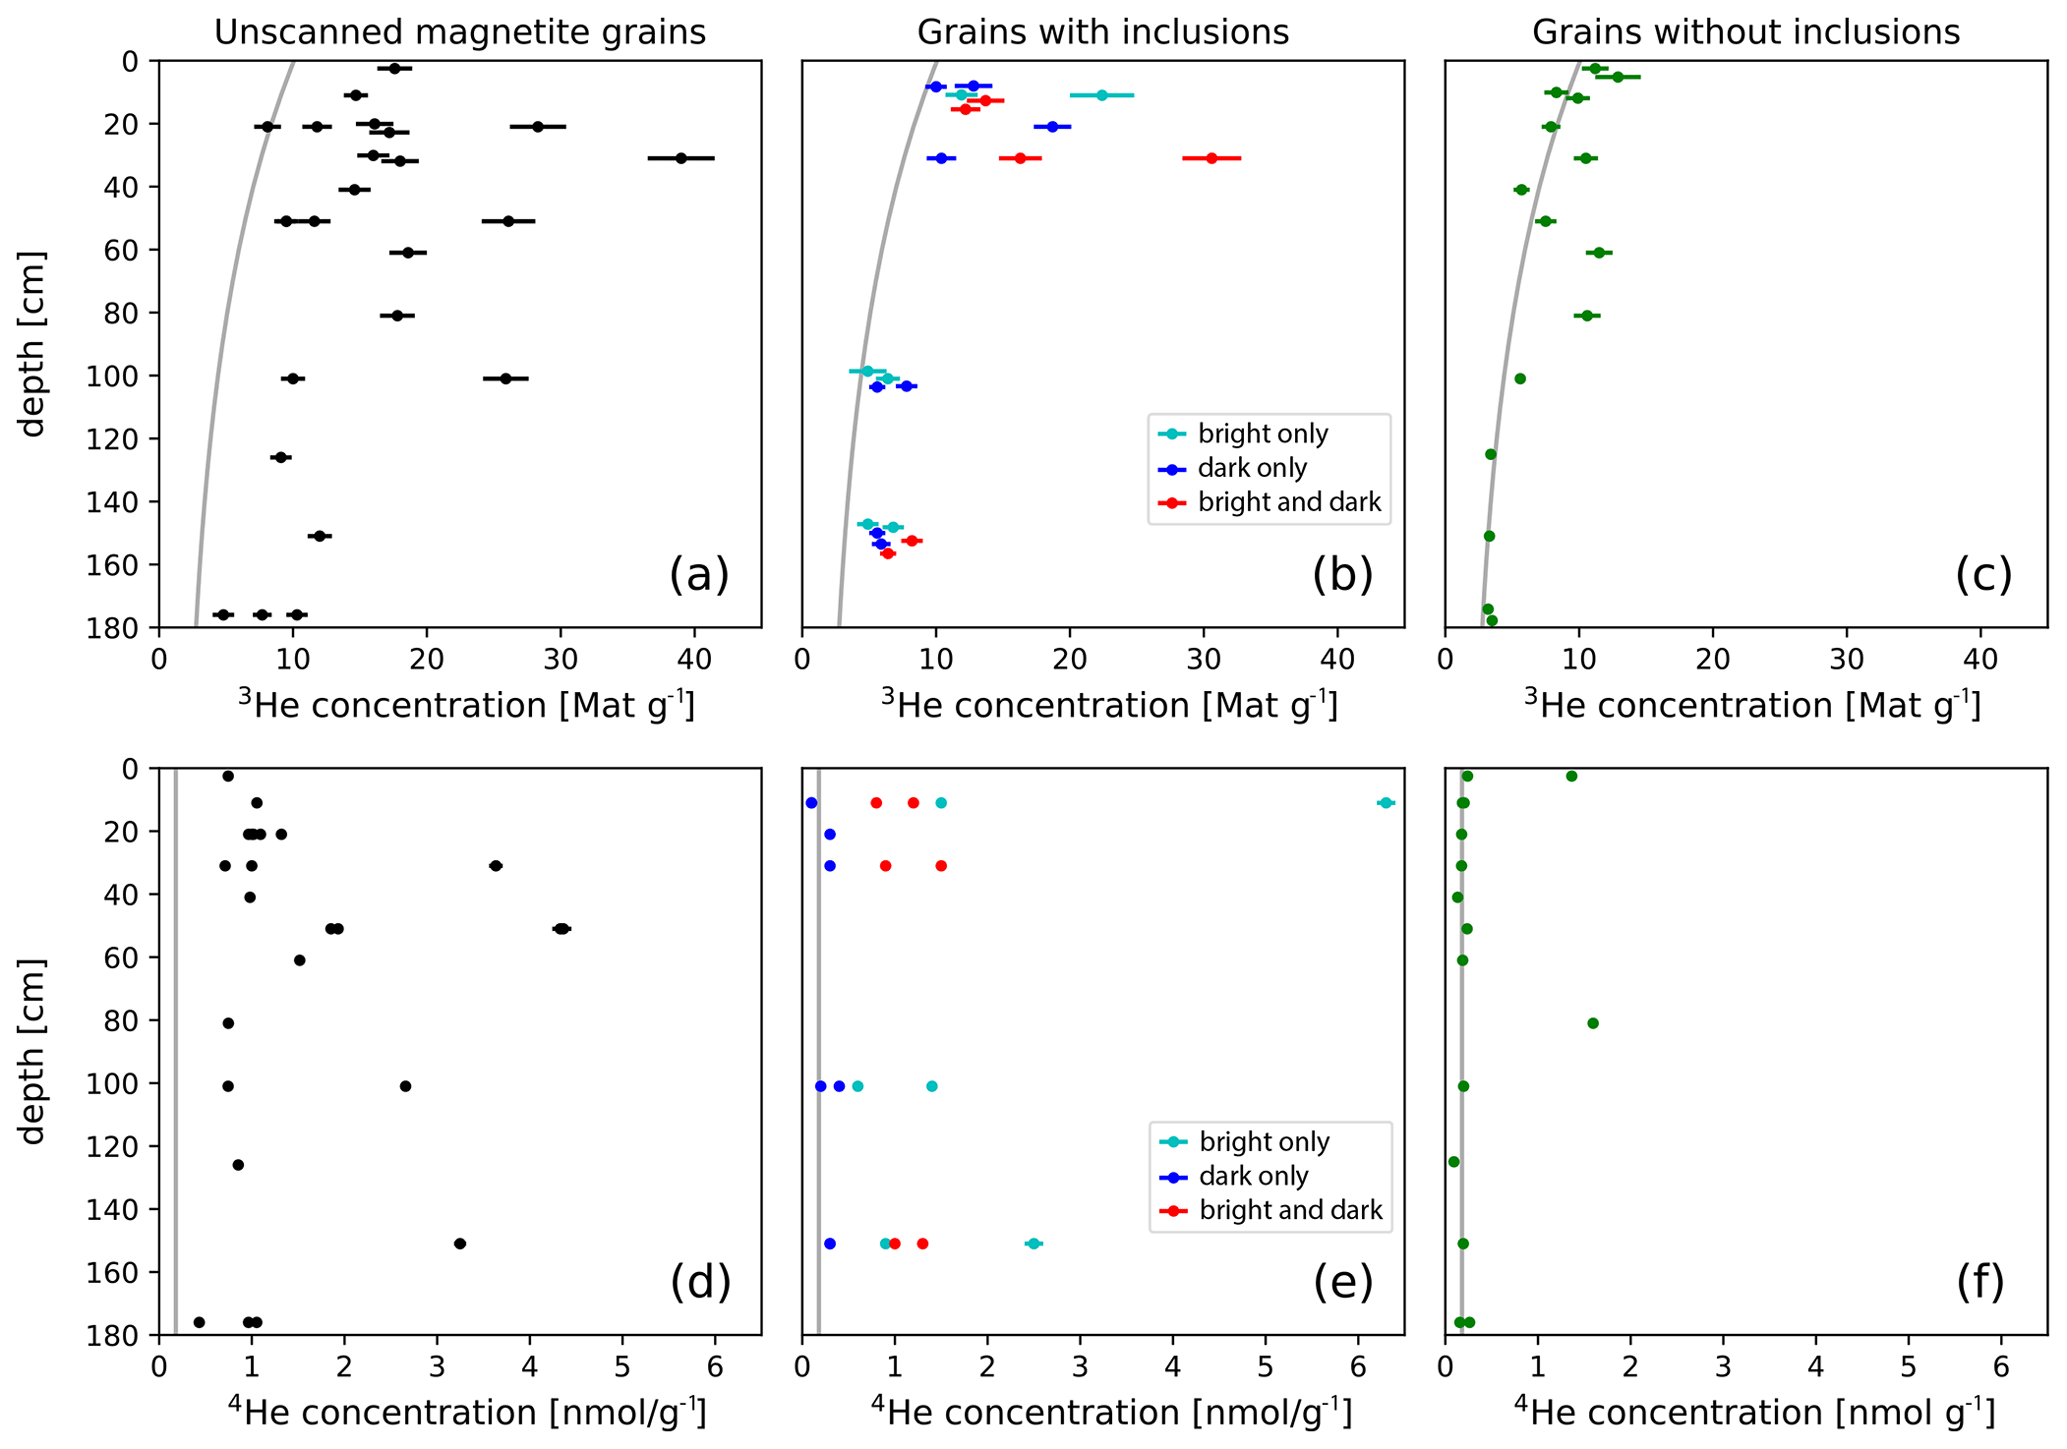
Figure 9Depth profiles of measured 3He (a–c) and 4He (d–f) concentrations from unscanned magnetite grains without information about inclusions (black); samples with bright (turquoise), dark (blue), and bright and dark inclusions (red); and samples without inclusions (green). All uncertainties shown are at the 1σ level, and overlapping data points have been slightly vertically offset for clarity. The expected cosmogenic 3He depth profile based on the known exposure age and the average 4He concentration of aliquots without inclusions are shown as gray lines. Samples without inclusions have 3He concentrations close to the predicted depth profile and all but two have low, nearly constant 4He concentrations (around 0.18 nmol g−1). Grains with inclusions have significantly higher 3He and 4He concentrations, showing the effects of fissiogenic and thermal-neutron-produced 3He added by these inclusions. The 3He concentration decreases with depth even in grains with inclusions, indicating a cosmogenic thermal neutron component to nucleogenic production.
Table 2Measurements of 3He and 4He concentrations in bulk magnetite aliquots, which were not scanned using microCT. They likely contain many grains with inclusions.

3.3.2 Grains with inclusions
Magnetite grains with inclusions, as classified using microCT, also show 3He concentrations significantly in excess of the expected values and the same depth trend as the unscreened magnetite samples (Table 3). The 3He concentrations of these samples are 4.9–30.6 Mat g−1. 4He concentrations are 0.1–6.3 nmol g−1 with an average of 1.1 nmol g−1. Combined with measurements of the volume of inclusions by microCT (see Figs. 6–8), these data show that bright inclusions, such as zircon and apatite, contribute significantly to the 3He and 4He concentration (Fig. 10) compared to aliquots without inclusions. The contribution of these inclusions increases roughly linearly with the inclusion volume. Dark inclusions, which are most likely silicates such as quartz, feldspar, and pyroxene, moderately contribute to the 3He concentrations and do not increase the 4He concentration.
Table 33He and 4He concentrations of magnetite aliquots with inclusions, as confirmed by microCT.

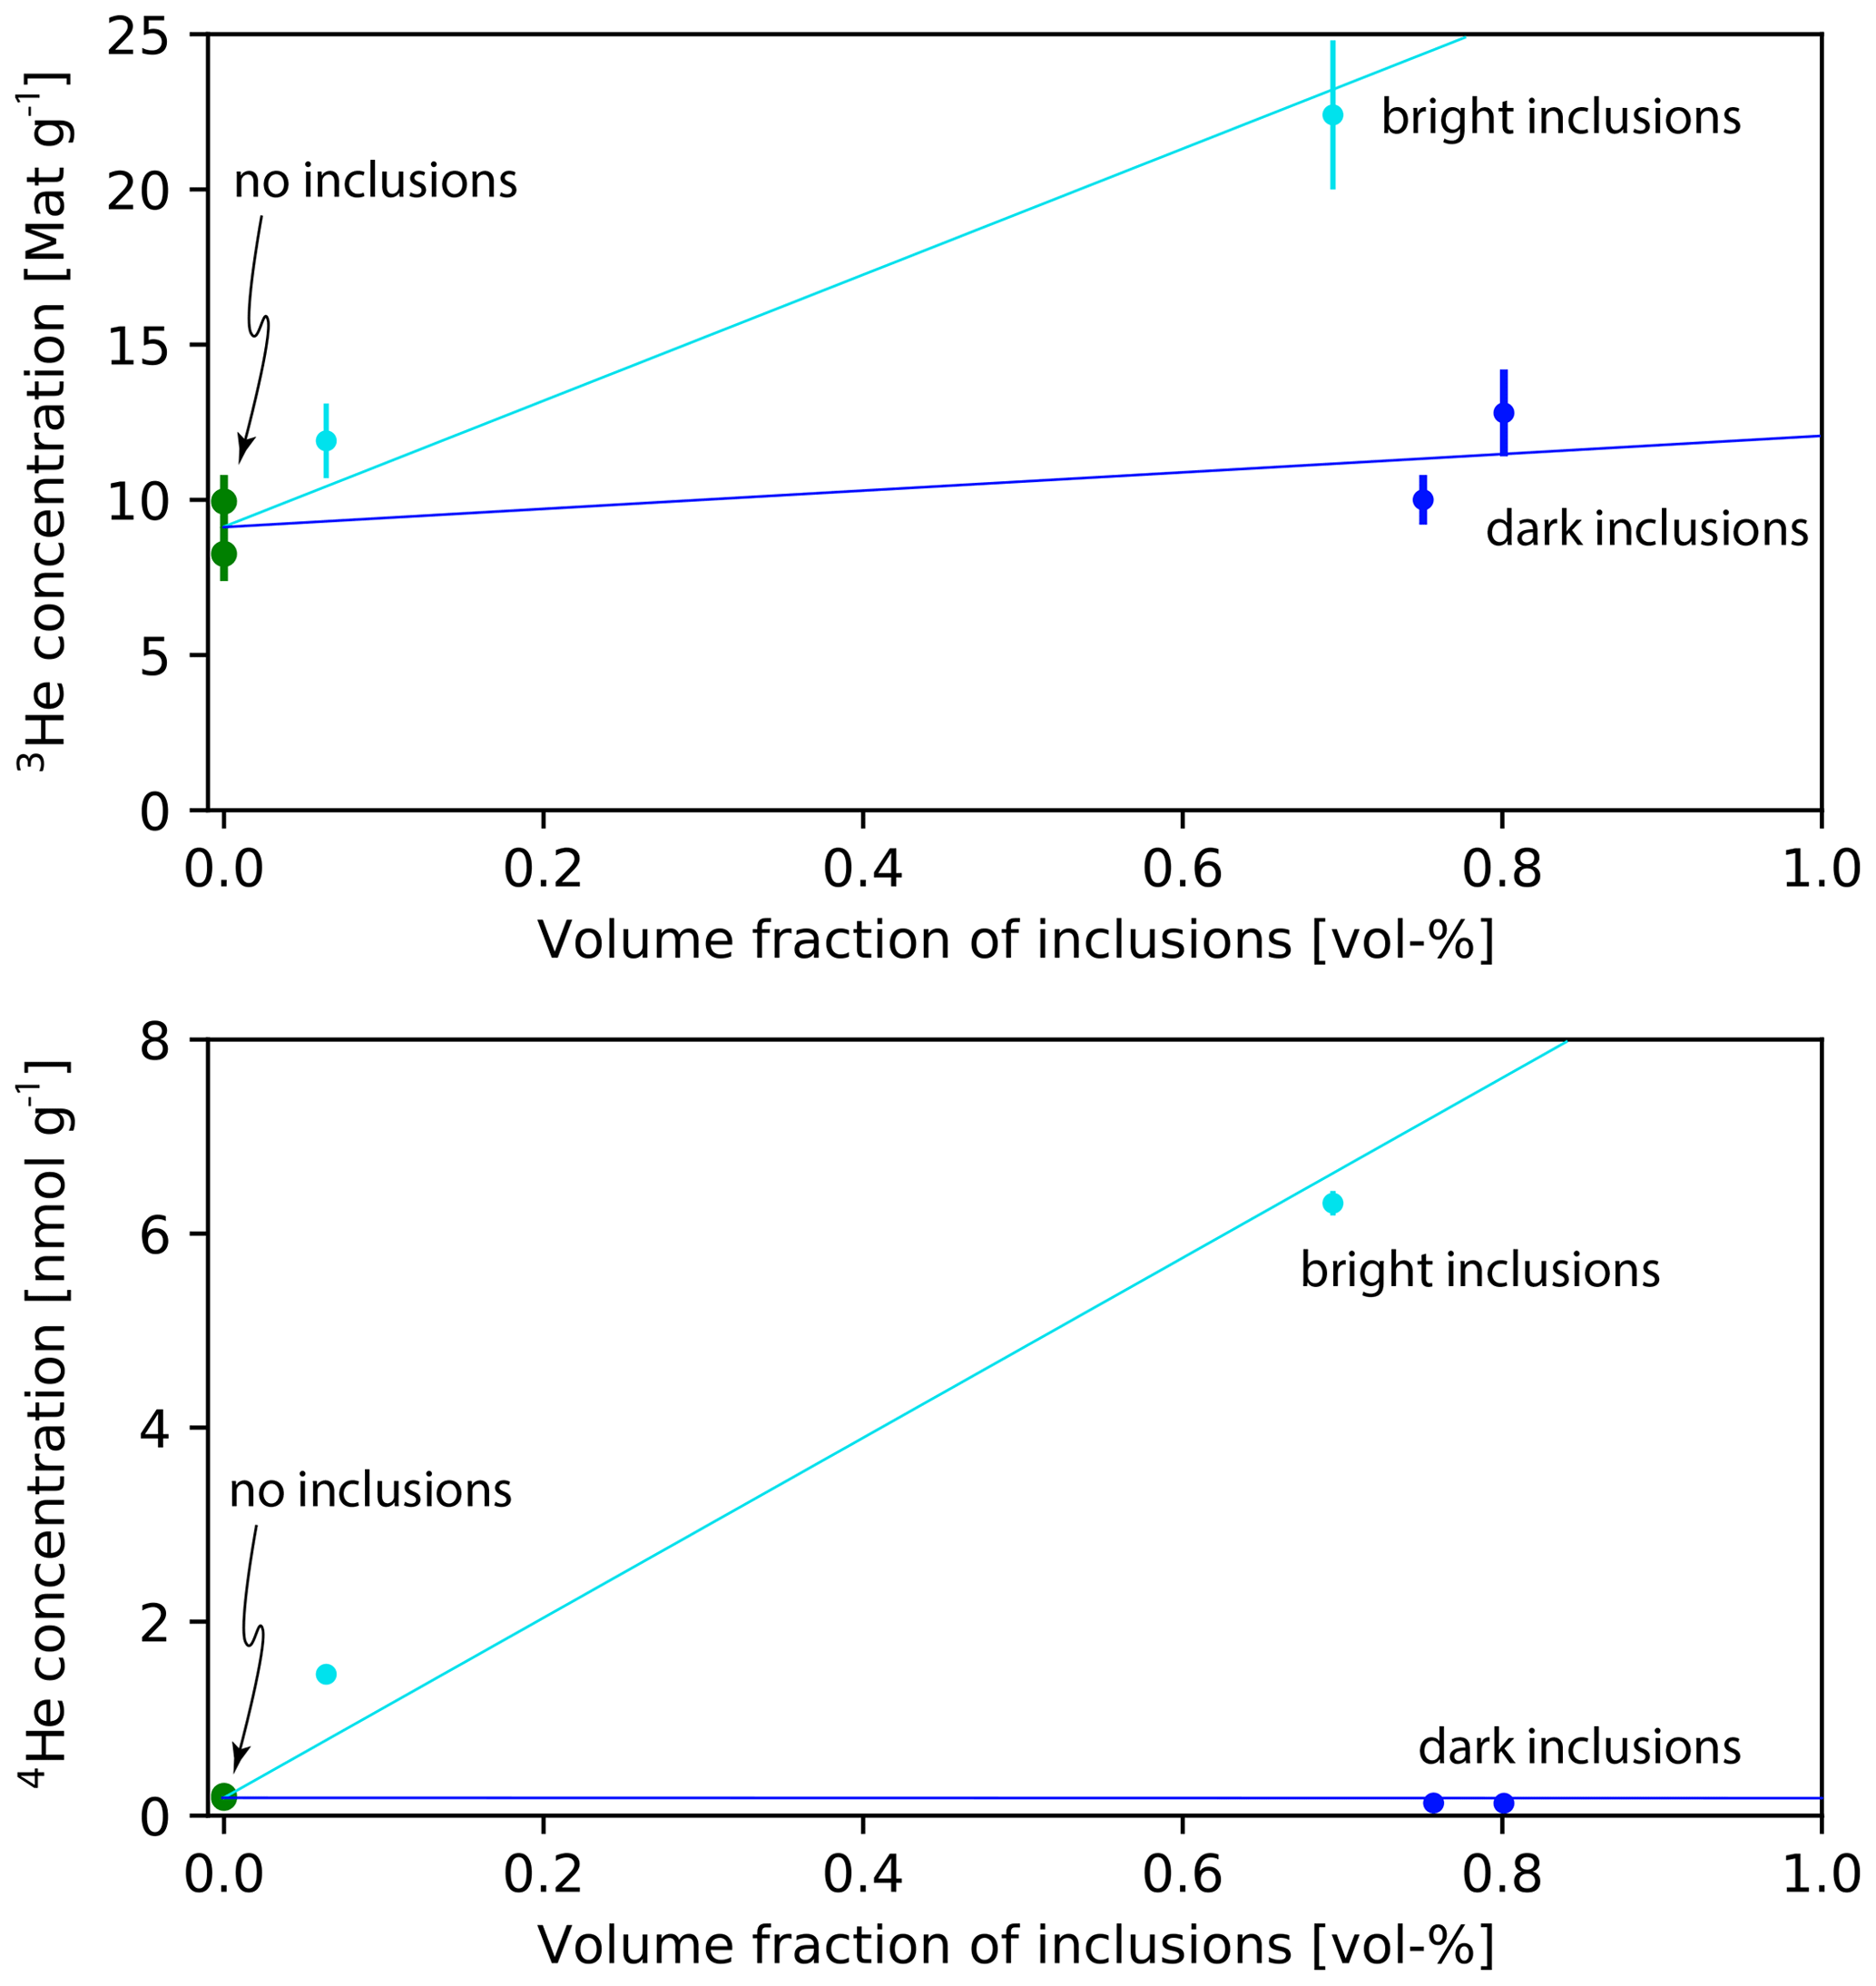
Figure 10The effect of bright (turquoise) and dark (dark blue) inclusions on the 3He and 4He concentration of magnetite grains compared to aliquots without inclusions (green). Bright inclusions (apatite, zircon) contribute large amounts of 3He and 4He, whereas dark inclusions (silicates) contribute little 4He and moderate amounts of 3He. Lines show general trends and are not quantitative.
3.3.3 Grains without inclusions
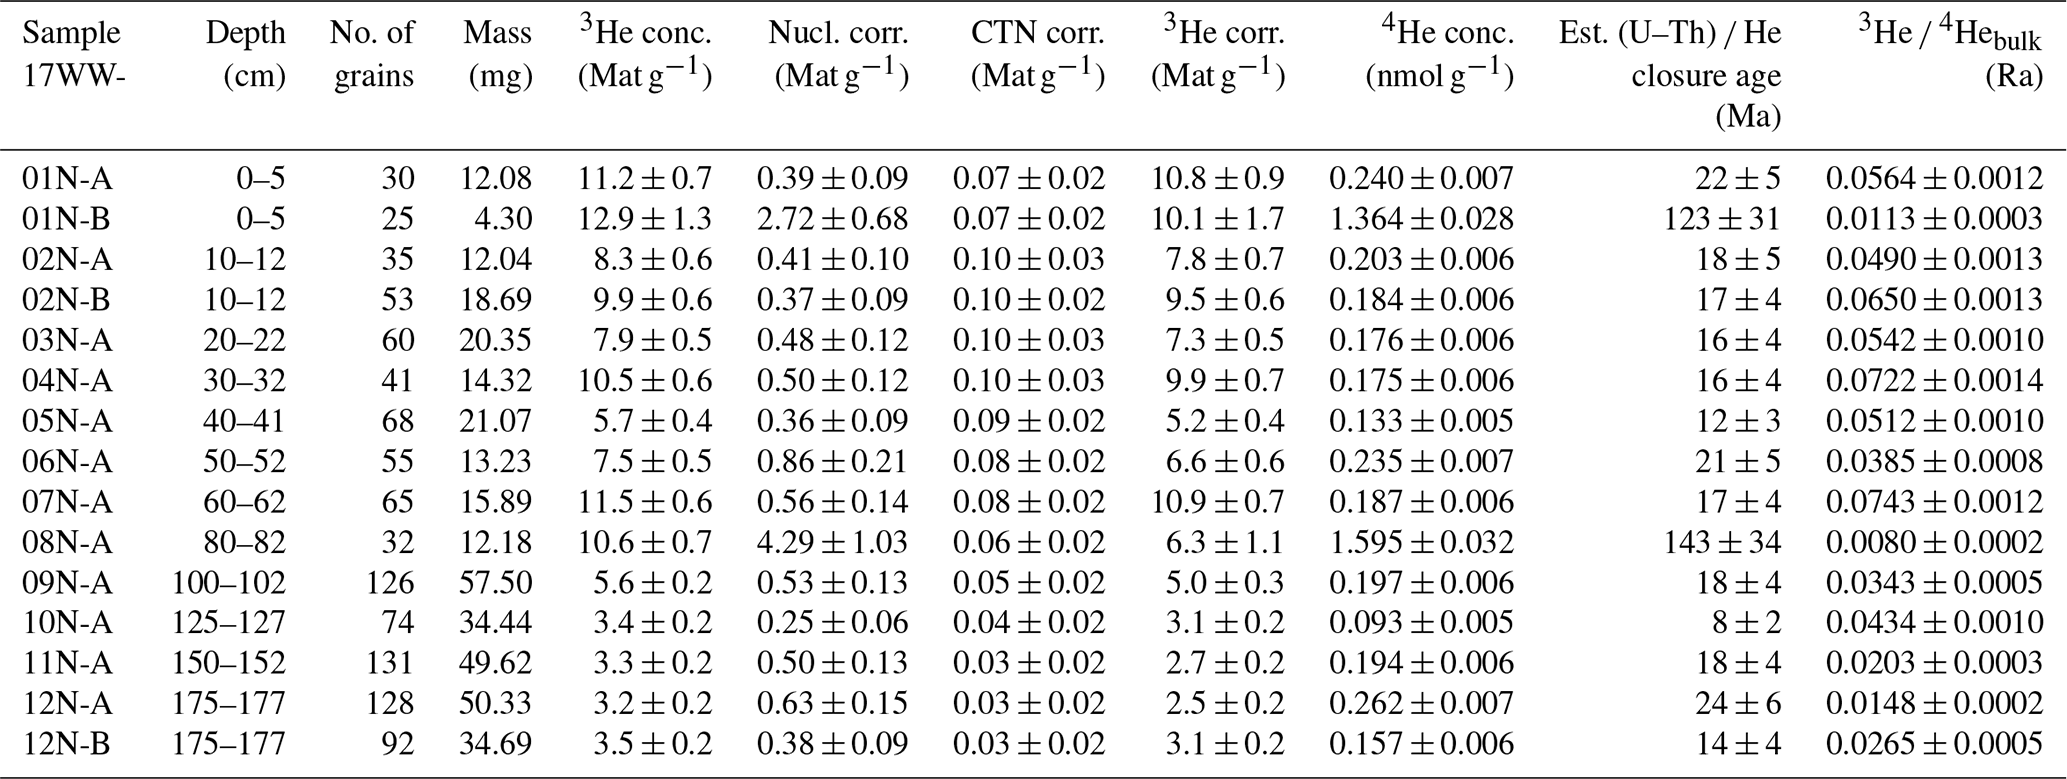
Grains without inclusions, as confirmed by microCT, have 3He and 4He concentrations that are significantly lower than those with inclusions and unscreened magnetite grains (Table 4). The 3He concentrations of these samples are close to the expected depth profile (Fig. 9) based on the production rate and calibrated inherited concentration (see discussion below). Repeated measurements overlapped within uncertainty. These samples also yielded 4He concentrations which are ∼ 0.18 nmol g−1 for 12 aliquots, with two aliquots around 1.5 nmol g−1.
Table 43He and 4He concentrations (conc.) in magnetite aliquots without inclusions, as confirmed by microCT. Corrections for nucleogenic (nucl.) and CTN-produced 3He were subtracted from the bulk concentrations to yield corrected (corr.) 3He concentrations. These corrections are based on the U, Th, and Li concentrations of the magnetite and matrix (see Table 1) and take into account ejection into and implantation from the matrix. The (U–Th) He closure ages were estimated based on average U and Th concentrations and are used to calculate the individual nucleogenic 3He corrections for each sample. All uncertainties are given as 1σ.
3.3.4 Ground vs. unground aliquots
Grinding grains prior to measurement should release any helium in fluid inclusions (Kurz, 1986). We did not find any significant systematic differences between ground and whole-grain 3He concentrations of aliquots with and without inclusions (Fig. 11). Aliquots with dark inclusions show no difference in the 4He concentrations between ground and whole grains. Ground aliquots with bright inclusions have both higher and lower 4He concentrations than unground aliquots.
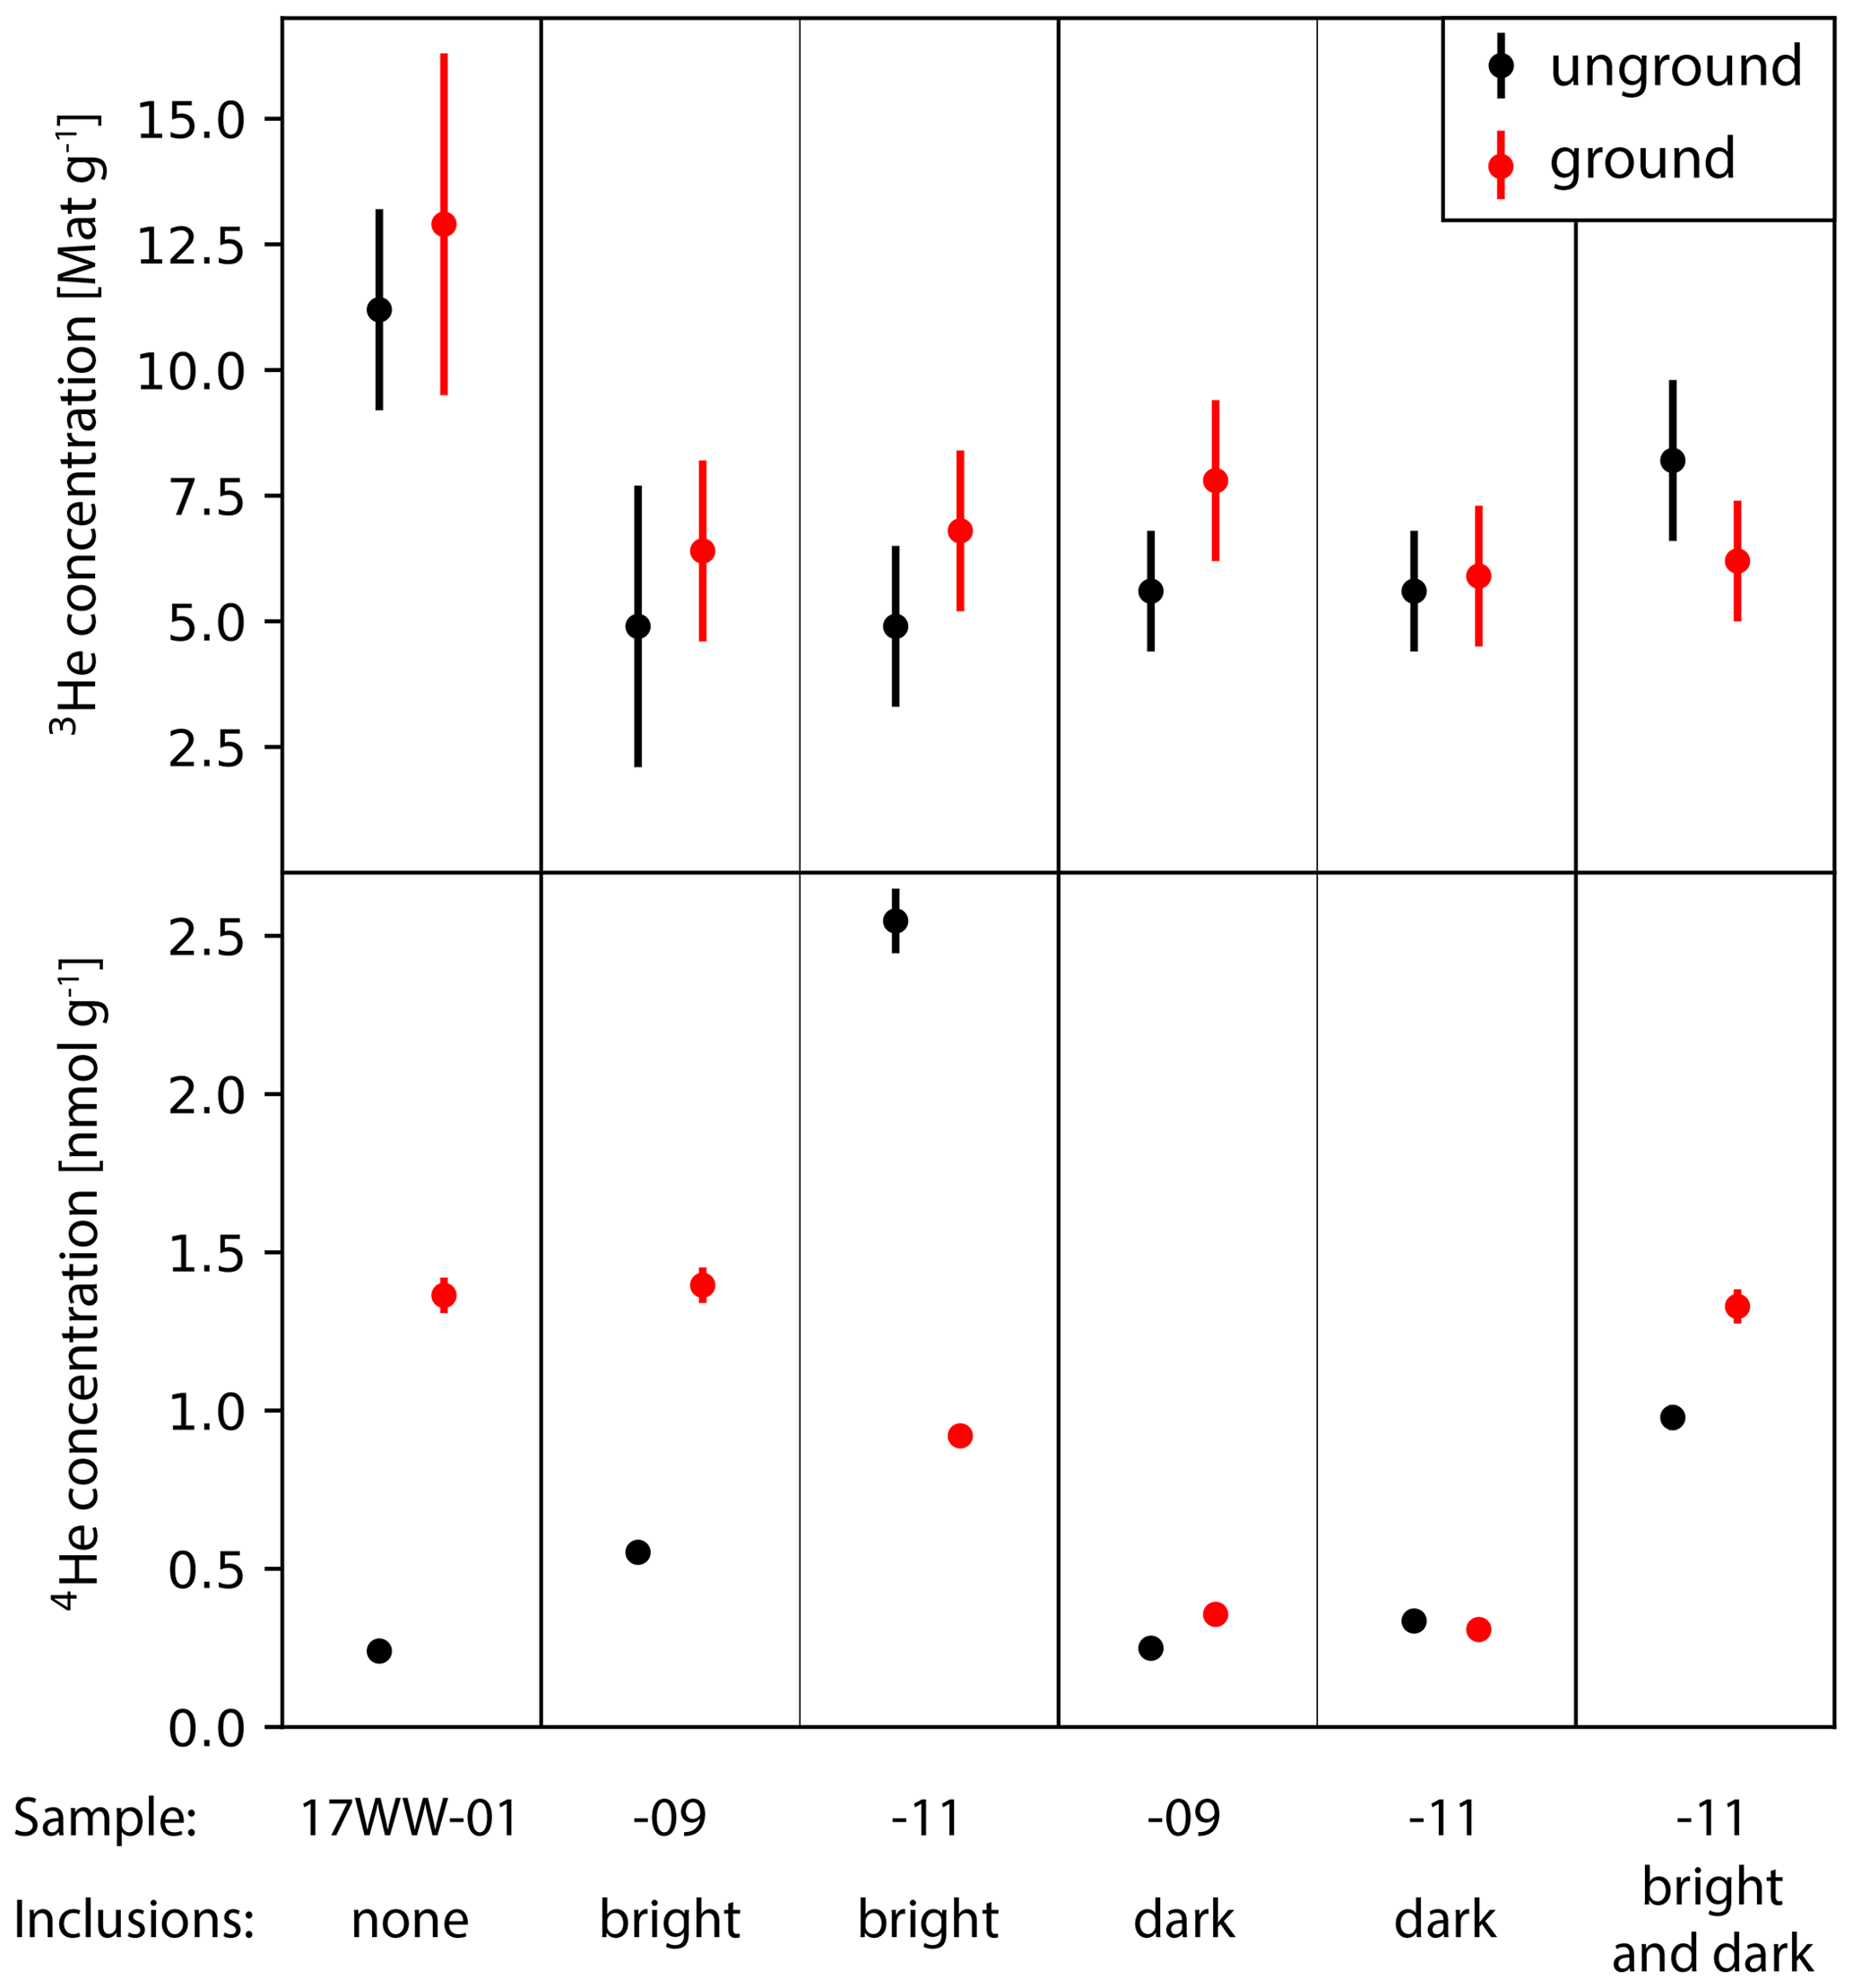
Figure 11Comparison of aliquots of unground (black) and ground (red) magnetite aliquots with 2σ uncertainties. The 3He concentrations of unground and ground aliquots are identical within the 95 % uncertainty bounds. Sample 17WW-01 was taken at the surface, and 17WW-09 and 17WW-11 were taken at 1 and 1.5 m of depth.
4.1 MicroCT imaging as a screening tool
Data presented here demonstrate that inclusions in magnetite significantly influence the 3He and 4He concentrations. This presents an analytical challenge that must be addressed since magnetite frequently hosts mineral inclusions (Nadoll et al., 2014). For example, magnetite and apatite are often closely associated, especially in a hydrothermal setting, such as those producing iron oxide–apatite ores (e.g., Nadoll et al., 2014). Our microCT scans reveal that most magnetite grains in this study have mineral inclusions, including zircon, apatite, quartz, and other silicates. Previous studies have successfully used microCT screening to avoid 4He contributions from high-eU inclusions in magnetite for use in (U–Th) He dating (Cooperdock and Stockli, 2016; Cooperdock et al., 2020; Schwartz et al., 2020). We demonstrate that microCT scanning can also be used to assess the suitability of magnetite grains for cosmogenic nuclide studies.
We classified inclusions as bright or dark based on the microCT contrast relative to magnetite (Fig. 4). In order to assign mineral phases to these inclusion types, we compared them to microCT images of known phases (see Fig. 4) and analyzed the helium content of magnetite grains with different inclusions. There are several shades of bright inclusions, which likely correspond to apatite and zircon based on comparison of the microCT contrast of these inclusions with known phases. Magnetite grains with bright inclusions have significantly elevated 4He concentrations compared to inclusion-free grains (see Fig. 10). This implies that bright inclusions have high effective uranium (eU) concentrations, through which they have accumulated radiogenic 4He since the closure of the system. This is consistent with apatite and zircon crystals, which typically have hundreds to thousands of parts per million of eU (e.g., Farley, 2002). In addition, the size (50–300 µm) and prismatic habit of bright inclusions are similar to those of apatite and zircon.
Dark inclusions, by comparison, contribute much less to the 4He concentration than bright inclusions (see Figs. 9, 10), which is evidence for a relatively lower eU content. This is consistent with the typically low U, Th, and Sm concentrations of quartz and feldspar (e.g., Vandenberghe et al., 2008). The microCT contrast of quartz, feldspar, and other silicates is also similar to that of dark inclusions observed in magnetite. The typical diameter (100–400 µm) and mostly equant habit of these dark inclusions are also consistent with them being quartz and feldspar.
Dark (less dense) inclusions might also be fluid inclusions. However, the 3He concentrations of ground and unground aliquots were found to be the same within uncertainty, while 4He concentrations were found to be both higher and lower in the ground aliquots (Fig. 11). The material was ground to an average particle size of around 30 µm, which is in the range for which Protin et al. (2016) found significant adsorption of atmospheric helium in olivine. Adsorption of helium is one possible explanation for the increase in 4He seen in some aliquots. However, since these aliquots were ground under ethanol to prevent such adsorption (see Cox et al., 2017), the variability in 4He concentrations is most likely not an effect of the grinding. The variability of the 4He concentrations between ground and unground aliquots mirrors that of the aliquots with bright inclusions and of unscanned magnetite (see Fig. 9). We therefore interpret the variability in 4He concentrations to be due to the stochastic nature of the number of inclusions in any given magnetite grain. Since grinding does not release any measurable amounts of helium, we conclude that fluid inclusions are not a significant contributor to the overall 3He concentration in these samples, and thus the dark inclusions seen on microCT imaging in these samples are likely not fluid inclusions.
Since both bright and dark inclusions contribute significant 3He (and 4He) compared to inclusion-free magnetite (see Fig. 9), for further analysis and interpretation we selected aliquots consisting only of grains without inclusions, as detectable by microCT. Measured 3He in these aliquots is likely the result of mainly cosmogenic nuclide production in magnetite, with some production of 3He from Li and ejection into or implantation from neighboring phases (see discussion below).
4.2 Production of 3He in magnetite
In order to translate measured 3He concentrations into an exposure age and calibrate the production rate in magnetite, the production of 3He from various sources needs to be considered. Production of 3He by cosmogenic high-energy neutrons is likely the main pathway for most of the production of 3He measured in magnetite grains without inclusions. Determining this component allows the calibration of the cosmogenic 3He production rate in magnetite. Due to low (< 10 ppm) B concentrations, production of nucleogenic 3He from 10B is negligible (Lal, 1987). Relatively low U concentrations in the magnetite (∼ 1 ppm) and the matrix (∼ 3 ppm) lead to a negligible contribution of 3He from fission (Farley et al., 2006).
We correct the measured 3He concentrations in magnetite aliquots without inclusions for 3He produced via the pathway (Andrews and Kay, 1982) in order to yield solely the cosmic-ray spallation component. Since the mean free path length of thermal neutrons is around 50 cm in granite (Lal, 1987), the thermal neutron flux is independent of the mineral-scale U and Th concentrations (Farley et al., 2006; Amidon et al., 2008) and is dependent on the U and Th concentrations of the bulk soil. Production of 3He from 6Li is therefore mainly controlled by the local Li concentration within the magnetite grain as well as in an area around it from which 3H could be implanted into the magnetite grain.
To determine the contribution of nucleogenic 3He, which has accumulated since the He closure of the magnetite system, we estimated cooling ages from measured parameters for each aliquot. Since these are detrital magnetite grains, it is unclear whether all grains within an aliquot share the same source and should have the same cooling age or whether they represent multiple sources. We combined the measured 4He concentrations of 0.1–1.6 nmol g−1 in individual unscanned magnetite aliquots with average magnetite U and Th concentrations of 1.2 ± 0.3 and 3.7 ± 1.2 ppm (n=3) to calculate (U–Th) He ages of 9–143 Ma, with most ages being 15 ± 5 Ma and two ages at 122 and 143 Ma (Table 4). Since chemically resistant high-eU phases likely were not dissolved during the sample dissolution process of the aliquots for which U and Th were measured, we interpret the concentrations as those of inclusion-free magnetite. We interpret the (U–Th) He ages calculated with these mean U and Th concentrations as the average cooling ages of each aliquot, which were calculated solely to enable the nucleogenic 3He correction. We note that the (U–Th) He cooling ages are sensitive to the average U and Th concentrations, which were based on an analysis of three bulk aliquots. Large inter-sample variability might affect the accuracy of the derived nucleogenic corrections, and a future methodological approach would be to recover each sample after He measurement for analysis of U, Th, Sm, and Li on the same material. Nonetheless, we view the analysis of paired aliquots as sufficient for interpretation here.
For comparison, apatite (U–Th) He cooling ages (AHe) of basement rocks in the source region of the Whitewater fan deposits (Fosdick and Blisniuk, 2018) are 5–13 Ma in the southern part and 53–56 Ma in the northern part (Spotila et al., 2001). Since the magnetite (U–Th) He system has a much higher closure temperature (∼ 250 ∘C; Blackburn et al., 2007) than apatite (∼ 70 ∘C; Farley, 2002), these ages are likely a lower bound for the cooling ages of magnetite from the same source rocks. Detrital U–Pb zircon ages (closure temperature ∼ 900 ∘C) of the Whitewater River show major contributions from rocks of the 72–80 Ma Sierra Nevada batholith, with smaller contributions from 155–180 Ma batholithic rocks, a 215 Ma mega porphyry, a 1.4 Ga leucogranite, and a 1.7 Ga augen gneiss (Fosdick and Blisniuk, 2018). Our estimated magnetite (U–Th) He ages are consistent with magnetite cooling through its He closure temperature between the AHe cooling ages and the zircon U–Pb ages for the possible sediment source regions. Younger cooling ages likely represent a contribution from the southern part of the source region of the Whitewater fan deposits, whereas older cooling ages are attributable to the northern part.
The average radiogenic thermal neutron rate produced by 3 ppm U and 36 ppm Th (as measured in the fanglomerate) was estimated to be 1.9 and 27 n g−1 a−1 (see Andrews and Kay, 1982). The combined RTN production rate of 29 n g−1 a−1 gives rise to a neutron flux of around 1800 n cm−2 a−1, which leads to a specific 3He production rate of 0.011 at g−1 a−1 per 1 ppm Li according to the methodology of Lal (1987). If the distribution of α-producing elements is not homogeneous, this is likely to be a maximum estimate (Farley et al., 2006). For 1.6 ppm Li in magnetite and 12 ppm in the matrix, this yields nucleogenic 3He production rates of 0.018 and 0.13 at g−1 a−1. Given the estimated cooling ages, nucleogenic 3He concentrations are around 0.4 Mat g−1 for ∼ 15 Ma and 3 Mat g−1 for ∼ 130 Ma, taking into account production of nucleogenic 3He within the magnetite grains as well as ejection into and implantation from the matrix with an ejection factor of 0.93 for the average size of analyzed grains. This nucleogenic contribution was calculated for every sample based on the individual estimated closure temperature and U, Th, and Li concentrations of the magnetite and matrix. The bulk 3He concentrations were corrected by subtracting this nucleogenic contribution.
The second contribution of 3He produced from 6Li is derived from reactions with cosmogenic thermal neutrons accrued over the exposure duration of the magnetite grains (Dunai et al., 2007). Assuming a typical granitic composition (e.g., Amidon et al., 2008) with 2 % water content and a density of 1.9 g cm−3 combined with measured values for Li, B, Na, Mg, Al, P, Fe, Ti, Si, K, and Gd (Table 1 and the EarthChem database; see the “Data availability” section) we calculated a combined thermal and epithermal cosmogenic neutron flux of 72 100 n g−1 a−1 using CHLOE (Phillips and Plummer, 1996; Phillips et al., 2001). This is the neutron flux at the surface scaled for latitude, longitude, and elevation. This CTN flux yields a surficial 3He production rate of 0.442 at g−1 a−1 per 1 ppm Li. Average Li concentrations in Whitewater magnetite and the bulk soil of 1.6 and 12 ppm, respectively, yield surficial 3He production rates of 0.71 and 5.3 at g−1 a−1. The depth profile of CTN production was modeled using CHLOE, with the above parameters and a fast-neutron attenuation length of 160 g cm−2. The maximum CTN production rates are 1.2 and 9.0 at g−1 a−1 at a depth of 22 cm. Over the exposure age of 53.5 ± 2.2 ka, as derived from 10Be and 26Al depth profiles, the CTN contribution to the 3He concentration is between 0.07 and 0.09 Mat g−1, depending on the depth. This component was also subtracted from the measured bulk 3He concentrations to yield a corrected 3He value for all samples without inclusions (Table 4). Analytical uncertainties and the uncertainties associated with the corrections were propagated to the corrected 3He concentrations.
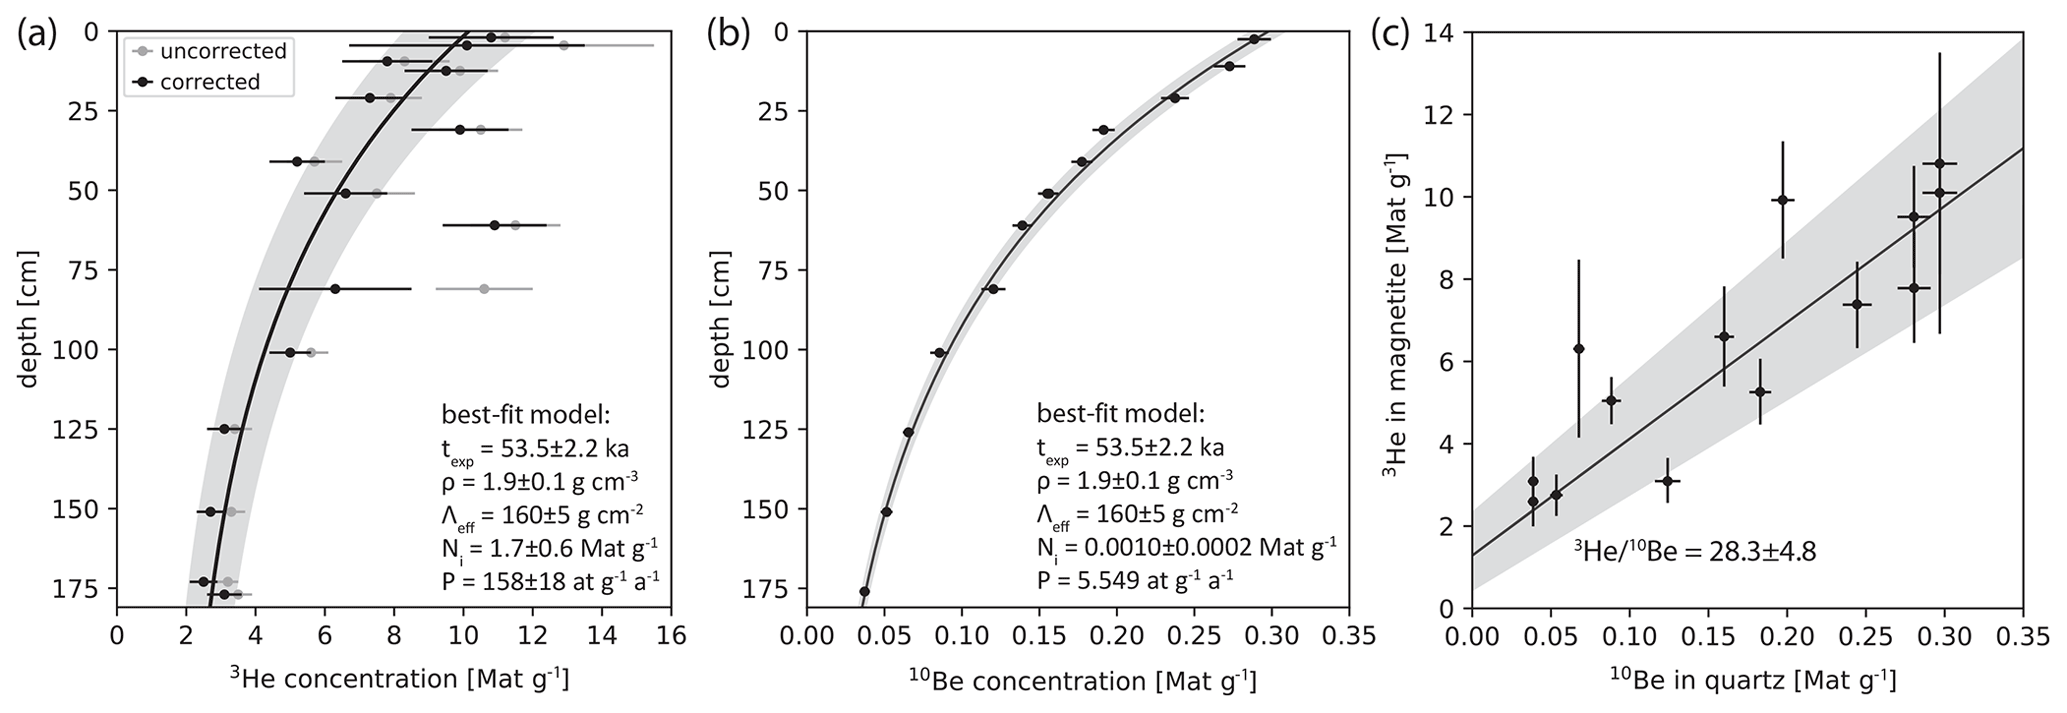
Figure 12(a) Depth profile of measured 3He concentrations in magnetite without inclusions corrected for nucleogenic and CTN-produced 3He with 2σ uncertainties. Uncorrected data are shown in gray. The solid line and shaded area show the best-fit model with 2σ uncertainty using a known exposure age texp, bulk density ρ, and effective attenuation length Λeff. The model was optimized for the inherited concentration Ni and the local surface production rate P. Replicate analyses at the same depth are shown with a slight vertical offset for clarity. (b) Depth profile of 10Be measured in quartz (Hofmann, 2019) extracted from the same samples as the magnetite studied here. The best-fit model uses the same parameters as in (a), but was optimized for the exposure age and inherited concentration, with a scaled surface 10Be production rate from the CRONUS-Earth online calculator (Balco et al., 2008). This measurement establishes the surface exposure age used to calibrate the production rate in magnetite. (c) Determination of the 3He 10Be production ratio using data from the depth profiles. 10Be concentrations were corrected for decay according to Blard et al. (2013).
Accounting for Li-produced 3He decreased the overall scatter of the depth profile (Fig. 12). Replicate measurements of samples from the same depth have 3He concentrations that overlap within uncertainty. Remaining deviations of measured 3He concentrations from an exponential depth profile can be explained by either an inhomogeneity in Li concentration between magnetite aliquots, inclusions that were not detected by microCT, or exposure prior to the deposition of the fanglomerate.
4.3 Calibration of the 3He production rate in magnetite
The magnetite 3He production rate was calibrated by comparing the depth profile of grains without inclusions (Fig. 12) to a known exposure age of 53.5 ± 2.2 ka from a depth profile of 10Be and 26Al in quartz (Hofmann, 2019) extracted from the same sample material. While this 10Be–26Al exposure age was calculated assuming a zero erosion rate, we observed evidence for surface erosion, predominately by deflation, which suggests that the measured exposure age is likely a minimum estimate of the true exposure age. However, since both the quartz and magnetite grains come from the same grusified clasts, which were still coherent when sampled, they share a common thermal and exposure history. The coarse-grained texture of the protolith, which is still readily apparent, also implies no vertical movement of these clasts after the deposition of the fanglomerate. The concentrations and production rates of 10Be in quartz and 3He in magnetite are therefore directly comparable.
Magnetite 3He concentrations were corrected for their nucleogenic and CTN-produced components using the procedure outlined above. These corrected concentrations represent the spallation-produced component of 3He but might also contain a minor component produced by muon interactions (see Nesterenok and Yakubovich, 2016). The corrected 3He concentrations are close to an exponential trend with depth (Fig. 12). One obvious outlier at 60 cm of depth was excluded for the production rate calibration. We used a Monte Carlo forward model to compute a best-fit exponential depth profile assuming a bulk soil density of ρ = 1.9 ± 0.1 g cm−3 and an effective attenuation length Λeff = 160 ± 5 g cm−2 (estimate for latitude; see Dunai, 2000). The depth-constant inherited concentration Ni and the cosmogenic nuclide production rate P were optimized simultaneously, and the 95 % uncertainties of these parameters were calculated. This model yielded an inherited concentration of 1.7 ± 0.6 Mat g−1 (2σ) and an apparent local surface production rate of 158 ± 18 at g−1 a−1 (2σ). This local production rate was scaled to sea level and high latitude (SLHL) using a time-constant scaling factor of 1.358 (Lal, 1991). The SLHL 3He production rate determined on this basis for the Whitewater site is 116 ± 13 at g−1 a−1 (2σ).
This production rate is within uncertainty of the measurement of the Fe–Ti oxide 3He production rate at SLHL of 120 ± 12 at g−1 a−1 by Kober et al. (2005). The relatively pure magnetite used in this study is very similar in elemental composition and density to the Fe–Ti oxides used by Kober et al. (2005), which makes it possible to directly compare our results to these production rate estimates. Kober et al. (2005) also modeled the cosmogenic 3He production rate in Fe–Ti oxides as 122 at g−1 a−1, which is in agreement with both their measured production rate and the one presented here.
Our magnetite SLHL production rate is higher than a previous estimate from element-specific production rates of 66 at g−1 a−1 derived from the model of Masarik and Reedy (1996). However, this model assumed element-specific 3He 3H production rate ratios of 1 for most elements, which led to an underestimation of the derived element-specific 3He production rates. A calibration of element-specific 3He 3H production rate ratios (Leya et al., 2004) led to higher element-specific production rates of 3He on Fe and O (Kober et al., 2005) compared to the lower production rate ratios assumed by Masarik and Reedy (1996). These updated parameters were taken into account in the model of Kober et al. (2005).
Another calibration of the magnetite 3He production rate from the Ferrar dolerite based on comparison with co-existing pyroxene and the pyroxene production rate of Schäfer et al. (1999) yielded 69–77 at g−1 a−1 (Bryce and Farley, 2002), which is closer to the previous modeled production rate of Masarik and Reedy (1996). Bryce and Farley (2002) analyzed the magnetic fraction without further sample characterization. The analyzed material might therefore not have been pure magnetite and could have contained other phases with a lower production rate. Also, the fine-grained nature of the magnetite in the Ferrar dolerite might cause ejection of 3H or 3He produced within magnetite grains (see Larsen et al., 2019), which would lead to an underestimation of the 3He concentration and subsequently of the cosmogenic 3He production rate when compared to pyroxene grains, which are generally larger than the magnetite grains (Gunn, 1962). Finally, Bryce and Farley (2002) measured the 3He production rate in magnetite relative to that of pyroxene (110 at g−1 a−1; Schäfer et al., 1999), for which higher values have since been reported (129 ± 10 at g−1 a−1; Amidon and Farley, 2011). These factors and uncertainties might have contributed to a lower production rate of Bryce and Farley (2002), which differs from newer modeled and measured production rates. Our results are consistent with other estimates of cosmogenic nuclide production rates. The magnetite 3He production rate reported here and in Kober et al. (2005) is within uncertainty of the globally averaged SLHL production rate in silicates of 122 ± 12 a g−1 (Martin et al., 2017). Moreover, with the above SLHL 3He production rate in magnetite and a 10Be production rate at SLHL of 4.11 ± 0.19 at g−1 a−1 (Martin et al., 2017), the 3He 10Be production ratio is 28.2 ± 4.4 (2σ). A direct comparison of the 3He and 10Be concentrations, which were corrected for decay according to Blard et al. (2013), from the same depths (Fig. 13) leads to a 3Hemag 10Beqtz production ratio of 28.3 ± 4.8 (2σ). These estimates are within uncertainty of previously measured ratios (Kober et al., 2005) and are in the same range as those of most common mineral phases at 500 m of elevation (Blard et al., 2013).
4.4 Source of excess 3He from inclusions
We observed higher 3He concentrations in magnetite aliquots with inclusions compared to those without inclusions. The cosmogenic 3He production rates of most silicates are between 100 and 120 at g−1 a−1 (e.g., Goehring et al., 2010), which are similar to the magnetite 3He production rate determined here. This similarity in production rates suggests that inclusions such as those observed here should not significantly increase the cosmogenic 3He concentration within the grain by increasing the spallation production. Further, we have observed no 3He contribution from fluid inclusions. Hence, the increase in 3He concentration is likely attributable to non-spallation production of 3He in mineral inclusions within the magnetite grains. These inclusions have been present within the magnetite since the growth of the grains and have consequently experienced the same temperature conditions and exposure to cosmic rays since their formation. These observations provide constraints on the mechanisms responsible for the increase in 3He concentration in aliquots with many inclusions.
One possible source of non-spallation 3He is the production due to ternary fission of U (Vorobiev et al., 1969; Halpern, 1971), with a known production rate of 2 × 10⁻⁵ at g−1 a−1 per part per million of U (Farley et al., 2006). Zircons typically have hundreds of parts per million of U, and in some cases > 1000 ppm (e.g., Reiners, 2005). A significant part of this fissiogenic 3He might be ejected from the inclusion and implanted into the magnetite grain due to the large kinetic energy of this process (Farley et al., 2006) since most inclusions are much smaller than the average ejection distance of 121 µm in magnetite and magnetite grains are a factor of a few larger than the ejection distance.
The highest 4He concentration measured here is around 35 times higher than the average 4He concentration in magnetite without inclusions. Assuming that this is radiogenic 4He contributed by zircons and that the (U–Th) He cooling age of the inclusions is the same as that of the magnetite grain, the apparent eU of these zircon inclusions would be around 10 000 ppm. If such zircons are present at 2 % of the total volume of the aliquot, which is similar to what was observed by microCT for bright inclusions, these inclusions would contribute around 18 Mat g−1 to the total 3He concentration of 22.4 Mat g−1 for this aliquot. This shows that over sufficiently large cooling ages a significant amount of fissiogenic 3He can be contributed by high-eU inclusions.
Another possible contribution of 3He is nucleogenic production on 6Li. Magnetite has been observed in this study to have relatively low Li concentrations (∼ 1.6 ppm). While zircons are typically low in Li, many other common mineral phases have Li concentrations of tens or hundreds of parts per million (Amidon et al., 2008, 2009). Quartz, feldspar, and apatite can have tens, pyroxene and amphibole hundreds, and mica thousands or tens of thousands of parts per million of Li (Amidon et al., 2009). Using the radiogenic neutron fluxes computed above, silicate inclusions comprising 5 % of the total volume with 100 ppm Li can contribute 8 Mat g−1 of nucleogenic 3He over a 140 Ma cooling age. This component is independent of depth.
Additional production of 3He from thermal neutron capture reactions on 6Li is dependent on the cosmogenic thermal neutron flux, which is depth-dependent. The unscreened magnetite aliquots and aliquots with known inclusions display considerable scatter, but there is a general decrease in 3He concentration with depth (see Fig. 9b, c). This decrease is greater than the expected variation in cosmogenic nuclide production, so part of this trend can be attributed to a decrease in CTN production with depth. The cosmogenic neutron flux is highest around 22 cm of depth below the surface. At this depth, the CTN production from a quartz inclusion of 5 % by volume and 100 ppm of Li would be around 5 % of the cosmogenic nuclide production rate in magnetite. Pyroxene, amphibole, or mica inclusions with Li concentrations conceivably ≫ 100 ppm might contribute an even greater amount of nucleogenic and CTN 3He, although most silicates have lower Li concentrations on average.
Any randomly chosen aliquot of magnetite is likely to have inclusions of various minerals of several percent by volume. These inclusions contribute 3He from combined fissiogenic, nucleogenic, and CTN production due to their increased U and Li content relative to magnetite, which leads to 3He concentrations that are in excess of the expected cosmogenic nuclide production, as observed in this study (up to a factor of 4). The effect of mineral inclusions might be even greater at other sites where rocks have older cooling ages. This highlights the importance of avoiding mineral inclusions in the target phase when determining 3He concentrations for cosmic-ray exposure studies.
Some types of mineral inclusions which have U and Li concentrations comparable to or below those of the host phase might not present a problem for determining 3He concentrations. Gayer et al. (2004), for instance, found no difference in the 3He concentration between garnet aliquots with many ilmenite inclusions and those with fewer inclusions. Ilmenite has neither high U nor Li concentrations; therefore, it would not significantly contribute to the overall 3He concentration. However, without sufficient characterization, any mineral inclusion can be a potential concern and should be avoided.
4.5 Applicability to opaque phases
We show that microCT scanning of magnetite grains significantly improves the quality and reproducibility of 3He measurements, making the use of magnetite as a target phase for in situ exposure dating more robust and reliable. The utility of magnetite for deriving watershed-averaged erosion rates due to its resistance to erosion has already been demonstrated using 36Cl (Moore and Granger, 2019b). The microCT screening approach makes it feasible to also use 3He in magnetite for the same purpose. Due to its relatively high helium retentivity, magnetite is resistant to thermal resetting of cosmogenic 3He (Blackburn et al., 2007) and could therefore also be employed for paleo-exposure studies similar to those using goethite (Hofmann et al., 2017) and olivine (Balbas and Farley, 2020).
The screening approach using microCT presented in this study might also be applied to other opaque helium-retentive phases, such as pyroxene, biotite, and hornblende, which are already used as target phases for 3He analysis (e.g., Amidon and Farley, 2011, 2012). This method is likely impractical for routine use with radioactive cosmogenic nuclides due to the large mass requirements but might be utilized for studies using magnetite and other opaque phases with > 1 Ma exposure ages for which a few grams of material are sufficient (e.g., Matsumura et al., 2014).
We find that mineral inclusions including quartz, feldspar, apatite, and zircon contribute significant amounts of 3He to magnetite grains, which, in the case of samples from the Whitewater site, can lead to an excess of a factor of 4 above the cosmogenically produced amount of 3He. These elevated concentrations are likely caused mainly by fissiogenic 3He from high-eU inclusions such as apatite and zircon, as well as implantation of 3He from inclusions with a higher Li concentration than magnetite, such as quartz and other silicates, which contribute nucleogenic 3He and 3He from thermal neutron capture. We did not find any significant amount of 3He derived from fluid inclusions.
Contribution of 3He from mineral inclusions can be prevented by screening magnetic separates using microCT and selecting only those grains without inclusions for analysis. The largest contribution of grains deemed to be suitable in this study was derived from grain diameters of 400–800 µm through a combination of a large mass and few inclusions. Knowledge of the U and Li concentrations of the magnetite grains is important to assess the nucleogenic, CTN, and fissiogenic components of the 3He in the sample. Correcting the measured 3He concentrations for non-cosmogenic nuclide production of 3He improved the scatter of the depth profile.
We calibrated the production rate of 3He in magnetite by comparing corrected 3He concentrations to an existing depth profile of 10Be and 26Al in quartz. This yielded a 3He production rate in magnetite of 116 ± 13 at g−1 a−1 (2σ) at sea level and high latitude, which is within uncertainty of previous calibrations of magnetite (Kober et al., 2005) and the average cosmogenic 3He production rate in silicates (Martin et al., 2017).
By screening magnetite separates using microCT to select only inclusion-free grains and accounting for non-spallation production, 3He in magnetite can be used as a robust tool for in situ and detrital cosmic-ray exposure studies. The microCT screening technique might also help to improve the quality of cosmogenic 3He measurements of other opaque phases.
All elemental analyses and helium isotope data are available at the EarthChem data repository at https://doi.org/10.26022/IEDA/112019 (Hofmann et al., 2021a). MicroCT scans can be accessed at the Digital Rocks Portal at https://doi.org/10.17612/hehj-w597 (Hofmann et al., 2021b).
FH, EHGC, AJW, and KAF conceptualized the study and acquired funding. FH, DH, and KS carried out mineral separation, sample processing, and data analysis. FH, EHGC, AJW, and KAF contributed to the interpretation of the data. The paper and figures were prepared by FH and edited and reviewed by all co-authors.
The authors declare that they have no conflict of interest.
Publisher's note: Copernicus Publications remains neutral with regard to jurisdictional claims in published maps and institutional affiliations.
We thank Tautis Skorka at the Molecular Imaging Center at the University of Southern California for microCT scanning and Jonathan Treffkorn for helium mass spectrometry at Caltech. Reviews by Samuel Niedermann and Pierre-Henri Blard as well as editorial handling by Hella Wittmann-Oelze and Greg Balco helped to improve the paper.
Funding was provided by Southern California Earthquake Center 2020 award no. 20146 to Kenneth A. Farley, Emily H. G. Cooperdock, A. Joshua West, and Florian Hofmann. Student contributions at Ludwig-Maximilians-Universität München were funded by Studi_forscht@GEO grant S20-F17 awarded to Florian Hofmann.
This research has been supported by the Southern California Earthquake Center (grant no. 20146) and the Ludwig-Maximilians-Universität München (Studi_forscht@GEO, grant no. S20-F17).
This paper was edited by Hella Wittmann-Oelze and reviewed by Samuel Niedermann and Pierre-Henri Blard.
Amidon, W. H. and Farley, K. A.: Cosmogenic 3He production rates in apatite, zircon and pyroxene inferred from Bonneville flood erosional surfaces, Quat. Geochronol., 6, 10–21, https://doi.org/10.1016/j.quageo.2010.03.005, 2011.
Amidon, W. H. and Farley, K. A.: Cosmogenic 3He and 21Ne dating of biotite and hornblende, Earth Planet. Sc. Lett., 313, 86–94, https://doi.org/10.1016/j.epsl.2011.11.005, 2012.
Amidon, W. H., Farley, K. A., Burbank, D. W., and Pratt-Sitaula, B.: Anomalous cosmogenic 3He production and elevation scaling in the high Himalaya, Earth Planet. Sc. Lett., 265, 287–301, https://doi.org/10.1016/j.epsl.2007.10.022, 2008.
Amidon, W. H., Rood, D. H., and Farley, K. A.: Cosmogenic 3He and 21Ne production rates calibrated against 10Be in minerals from the Coso volcanic field, Earth Planet. Sc. Lett., 280, 194–204, https://doi.org/10.1016/j.epsl.2009.01.031, 2009.
Andrews, J. N. and Kay, R. L. F.: Natural production of tritium in permeable rocks, Nature, 298, 361–363, https://doi.org/10.1038/298361a0, 1982.
Balbas, A. M. and Farley, K. A.: Constraining in situ cosmogenic nuclide paleo-production rates using sequential lava flows during a paleomagnetic field strength low, Chem. Geol., 532, 119355, https://doi.org/10.1016/j.chemgeo.2019.119355, 2020.
Balco, G., Stone, J. O., Lifton, N. A., and Dunai, T. J.: A complete and easily accessible means of calculating surface exposure ages or erosion rates from 10Be and 26Al measurements, Quat. Geochronol., 3, 174–195, https://doi.org/10.1016/j.quageo.2007.12.001, 2008.
Biersack, J. P., Fink D., Miekeley W., and Tjan K.: 1–3 MeV alpha and triton stopping powers in LiF and Li alloys, Nucl. Instrum. Meth., B15, 96–100, https://doi.org/10.1016/0168-583x(86)90261-2, 1986.
Blackburn, T. J., Stockli, D. F., and Walker, J. D.: Magnetite (U–Th) He dating and its application to the geochronology of intermediate to mafic volcanic rocks, Earth Planet. Sc. Lett., 259, 360–371, https://doi.org/10.1016/j.epsl.2007.04.044, 2007.
Blard, P. H., Braucher, R., Lavé, J., and Bourlès, D.: Cosmogenic 10Be production rate calibrated against 3He in the high Tropical Andes (3800–4900 m, 20–22∘ S), Earth Planet. Sc. Lett. 382, 140–149, https://doi.org/10.1016/j.epsl.2013.09.010, 2013.
Bryce, J. G. and Farley, K. A.: 3He exposure dating of magnetite, in: Goldschmidt Conference Abstracts 2002, Goldschmidt, 18–23 August 2002, Davos, Switzerland, edited by: Podosek, F. A., A108, 2002.
Buddington, A. F. and Lindsley, D. H.: Iron-titanium oxide minerals and synthetic equivalents, J. Petrol., 5, 310–357, https://doi.org/10.1093/petrology/5.2.310, 1964.
Cooperdock, E. H. and Stockli, D. F.: Unraveling alteration histories in serpentinites and associated ultramafic rocks with magnetite (U–Th) He geochronology, Geology, 44, 967–970, https://doi.org/10.1130/g38587.1, 2016.
Cooperdock, E. H. G., Stockli, D. F., Kelemen, P. B., and de Obeso, J. C.: Timing of magnetite growth associated with peridotite-hosted carbonate veins in the SE Samail ophiolite, Wadi Fins, Oman, J. Geophys. Res.-Sol. Ea., 125, e2019JB018632, https://doi.org/10.1029/2019JB018632, 2020.
Cox, S. E., Miller, H., Farley, K. A., and Hofmann, F.: Anomalous trapping of noble gases during sample crushing, American Geophysical Union 2017 Abstract V43B-0526, American Geophysical Union, New Orleans, USA, 2017.
Dunai, T. J.: Scaling factors for production rates of in situ produced cosmogenic nuclides: a critical reevaluation, Earth Planet. Sc. Lett., 176, 157–169, https://doi.org/10.1016/s0012-821x(99)00310-6, 2000.
Dunai, T. J., Stuart, F. M., Pik, R., Burnard, P., and Gayer, E.: Production of 3He in crustal rocks by cosmogenic thermal neutrons, Earth Planet. Sc. Lett., 258, 228–236, https://doi.org/10.1016/j.epsl.2007.03.031, 2007.
Farley, K. A.: (U–Th) He dating: Techniques, calibrations, and applications, Rev. Mineral. Geochem., 47, 819–844, https://doi.org/10.2138/rmg.2002.47.18, 2002.
Farley, K. A., Libarkin, J., Mukhopadhyay, S., and Amidon, W.: Cosmogenic and nucleogenic 3He in apatite, titanite, and zircon, Earth Planet. Sc. Lett., 248, 451–461, https://doi.org/10.1016/j.epsl.2006.06.008, 2006.
Fedorov, A., Beichel, R., Kalpathy-Cramer, J., Finet, J., Fillion-Robin, J-C., Pujol, S., Bauer, C., Jennings, D., Fennessy F. M., Sonka, M., Buatti, J., Aylward, S. R., Miller, J. V., Pieper, S., and Kikinis, R.: 3D Slicer as an Image Computing Platform for the Quantitative Imaging Network, Magn. Reson. Imaging, 30, 1323–1341, https://doi.org/10.1016/j.mri.2012.05.001, 2012.
Fosdick, J. C. and Blisniuk, K.: Sedimentary signals of recent faulting along an old strand of the San Andreas Fault, USA, Sci. Rep., 8, 1–10, 2018.
Gärtner, A., Merchel, S., Niedermann, S., Braucher, R., ASTER Team, Steier, P., Rugel, G., Scharf, A., Le Bras, L., and Linnemann, U.: Nature Does the Averaging – In-Situ Produced 10Be, 21Ne, and 26Al in a Very Young River Terrace, Geosciences, 10, 237, https://doi.org/10.3390/geosciences10060237, 2020.
Gayer, E., Pik, R., Lavé, J., France-Lanord, C., Bourles, D., and Marty, B.: Cosmogenic 3He in Himalayan garnets indicating an altitude dependence of the 3He 10Be production ratio, Earth Planet. Sc. Lett., 229, 91–104, https://doi.org/10.1016/j.epsl.2004.10.009, 2004.
Goehring, B. M., Kurz, M. D., Balco, G., Schaefer, J. M., Licciardi, J., and Lifton, N.: A reevaluation of in situ cosmogenic 3He production rates, Quat. Geochronol., 5, 410–418, https://doi.org/10.1016/j.quageo.2010.03.001, 2010.
Gold, P. O., Behr, W. M., Rood, D., Sharp, W. D., Rockwell, T. K., Kendrick, K., and Salin, A.: Holocene geologic slip rate for the Banning strand of the southern San Andreas Fault, southern California, J. Geophys. Res.-Sol. Ea., 120, 5639–5663, https://doi.org/10.1002/2015jb012004, 2015.
Granger, D. E., Lifton, N. A., and Willenbring, J. K.: A cosmic trip: 25 years of cosmogenic nuclides in geology, Geol. Soc. Am. Bull., 125, 1379–1402, https://doi.org/10.1130/b30774.1, 2013a.
Granger, D. E., Rogers, H. E., Riebe, C. S., and Lifton, N. A.: Production Rate of Cosmogenic 10Be in Magnetite, American Geophysical Union Fall Meeting, 9–13 December 2013, San Francisco, CA, USA, Abstract EP53A-0736, 2013b.
Gunn, B. M.: Differentiation in Ferrar dolerites, Antarctica, New Zeal. J. Geol. Geop., 5, 820–863, https://doi.org/10.1080/00288306.1962.10417641, 1962.
Guzmics, T., Mitchell, R. H., Szabó, C., Berkesi, M., Milke, R., and Abart, R.: Carbonatite melt inclusions in coexisting magnetite, apatite and monticellite in Kerimasi calciocarbonatite, Tanzania: melt evolution and petrogenesis, Contrib. Mineral. Petr., 161, 177–196, https://doi.org/10.1007/s00410-010-0525-z, 2011.
Halpern, I.: Three fragment fission, Ann. Rev. Nucl. Sci., 21, 245–294, https://doi.org/10.1146/annurev.ns.21.120171.001333, 1971.
Hofmann, F.: Iron-oxide geochronology to constrain the formation of soils and paleosols, Doctoral dissertation, California Institute of Technology, Pasadena, CA, USA, available at: https://resolver.caltech.edu/CaltechTHESIS:05312019-131059095 (last access: 20 March 2021), 2019.
Hofmann, F., Reichenbacher, B., and Farley, K. A.: Evidence for > 5 Ma paleo-exposure of an Eocene–Miocene paleosol of the Bohnerz Formation, Switzerland, Earth Planet. Sc. Lett. 465, 168–175, https://doi.org/10.1016/j.epsl.2017.02.042, 2017.
Hofmann, F., Cooperdock, E. H., West, A. J., Hildebrandt, D., Strößner, K., Farley, K. A.: Elemental analyses and cosmogenic 3He measurements of bulk soil and detrital minerals from a soil near Whitewater, California, USA, Version 1.0. Interdisciplinary Earth Data Alliance (IEDA) [data set], https://doi.org/10.26022/IEDA/112019, 2021a.
Hofmann, F., Cooperdock, E. H., West, A. J., Hildebrandt, D., Strößner, K., Farley, K. A.: Detrital magnetite grains scanned to detect inclusions for cosmogenic 3He exposure dating, Digital Rocks Portal [data set], https://doi.org/10.17612/hehj-w597, 2021b.
Huerta, B.: Structure and Geomorphology of West Whitewater Hill, a Compressive Stepover between the Banning and Garnet Hill Strands of the San Andreas Fault, Whitewater, CA, California State University, Northridge, available at: http://scholarworks.csun.edu/bitstream/handle/10211.3/193801/Huerta-Brittany-thesis-2017.pdf (last access: 20 March 2021), 2017.
Kendrick, K. J., Matti, J. C., and Mahan, S. A.: Late Quaternary slip history of the Mill Creek strand of the San Andreas fault in San Gorgonio Pass, southern California: The role of a subsidiary left-lateral fault in strand switching, Geol. Soc. Am. Bull., 127, 825–849, https://doi.org/10.1130/b31101.1, 2015.
Ketcham, R. A. and Carlson, W. D.: Acquisition, optimization and interpretation of X-ray computed tomographic imagery: applications to the geosciences, Comput. Geosci., 27, 381–400, https://doi.org/10.1016/s0098-3004(00)00116-3, 2001.
Kober, F., Ivy-Ochs, S., Leya, I., Baur, H., Magna, T., Wieler, R., and Kubik, P. W.: In situ cosmogenic 10Be and 21Ne in sanidine and in situ cosmogenic 3He in Fe-Ti-oxide minerals, Earth Planet. Sc. Lett., 236, 404–418, https://doi.org/10.1016/j.epsl.2005.05.020, 2005.
Kurz, M. D.: Cosmogenic helium in a terrestrial igneous rock, Nature, 320, 435–439, https://doi.org/10.1038/320435a0, 1986.
Lal, D.: Production of 3He in terrestrial rocks, Chem. Geol., 66, 89–98, https://doi.org/10.1016/0168-9622(87)90031-5, 1987.
Lal, D.: Cosmic ray labeling of erosion surfaces: in situ nuclide production rates and erosion models, Earth Planet. Sc. Lett., 104, 424–439, https://doi.org/10.1016/0012-821x(91)90220-c, 1991.
Larsen, I. J., Farley, K. A., and Lamb, M. P.: Cosmogenic 3He production rate in ilmenite and the redistribution of spallation 3He in fine-grained minerals, Geochim. Cosmochim. Ac., 265, 19–31, https://doi.org/10.1016/j.gca.2019.08.025, 2019.
Leya, I., Begemann, F., Weber, H. W., Wieler, R., and Michel, R.: Simulation of the interaction of galactic cosmic ray protons with meteoroids: On the production of 3H and light noble gas isotopes in isotropically irradiated thick gabbro and iron targets, Meteorit. Planet. Sci., 39, 367–386, https://doi.org/10.1111/j.1945-5100.2004.tb00099.x, 2004.
Martin, L. C. P., Blard, P. H., Balco, G., Lavé, J., Delunel, R., Lifton, N., and Laurent, V.: The CREp program and the ICE-D production rate calibration database: A fully parameterizable and updated online tool to compute cosmic-ray exposure ages, Quat. Geochron., 38, 25–49, https://doi.org/10.1016/j.quageo.2016.11.006, 2017.
Masarik, J. and Reedy, R. C.: Monte Carlo simulation of in-situ-produced cosmogenic nuclides, Radiocarbon, 38, 163–164, 1996.
Matsumura, H., Caffee, M. W., Nagao, K., and Nishiizumi, K.: Initial Test Determination of Cosmogenic Nuclides in Magnetite, American Geophysical Fall Meeting, 15–19 December 2014, San Francisco, CA, USA, Abstract EP53A-3641, 2014.
Moore, A.: Cosmogenic Beryllium-10 And Chlorine-36 In Magnetite, MS thesis, Purdue University, West Lafayette, IN, USA, 2017.
Moore, A. K. and Granger, D. E.: Calibration of the production rate of cosmogenic 36Cl from Fe, Quat. Geochronol., 51, 87–98, https://doi.org/10.1016/j.quageo.2019.02.002, 2019a.
Moore, A. K. and Granger, D. E.: Watershed-averaged denudation rates from cosmogenic 36Cl in detrital magnetite, Earth Planet. Sc. Lett., 527, 115761, https://doi.org/10.1016/j.epsl.2019.115761, 2019b.
Nadoll, P., Mauk, J. L., Hayes, T. S., Koenig, A. E., and Box, S. E.: Geochemistry of magnetite from hydrothermal ore deposits and host rocks of the Mesoproterozoic Belt Supergroup, United States, Econ. Geol., 107, 1275–1292, https://doi.org/10.2113/econgeo.107.6.1275, 2012.
Nadoll, P., Angerer, T., Mauk, J. L., French, D., and Walshe, J.: The chemistry of hydrothermal magnetite: a review, Ore. Geol. Rev., 61, 1–32, https://doi.org/10.1016/j.oregeorev.2013.12.013, 2014.
Nesterenok, A. V. and Yakubovich, O. V.: Production of 3He in rocks by reactions induced by particles of the nuclear-active and muon components of cosmic rays: Geological and petrological implications, Petrology, 24, 21–34, https://doi.org/10.1134/S0869591116010057, 2016.
Owen, L. A., Clemmens, S. J., Finkel, R. C., and Gray, H.: Late Quaternary alluvial fans at the eastern end of the San Bernardino Mountains, Southern California, Quaternary Sci. Rev., 87, 114–134, https://doi.org/10.1016/j.quascirev.2014.01.003, 2014.
Phillips, F. M. and Plummer, M. A.: CHLOE; a program for interpreting in-situ cosmogenic nuclide data for surface exposure dating and erosion studies, Radiocarbon, 38, 98–99, 1996.
Phillips, F. M., Stone, W. D., and Fabryka-Martin, J. T.: An improved approach to calculating low-energy cosmic-ray neutron fluxes near the land/atmosphere interface, Chem. Geol., 175, 689–701, https://doi.org/10.1016/S0009-2541(00)00329-6, 2001.
Protin, M., Blard, P. H., Marrocchi, Y., and Mathon, F.: Irreversible adsorption of atmospheric helium on olivine: A lobster pot analogy, Geochim. Cosmochim. Ac., 179, 76–88, https://doi.org/10.1016/j.gca.2016.01.032, 2016.
Reiners, P. W.: Zircon (U–Th) He thermochronometry, Rev. Mineral. Geochem., 58, 151–179, https://doi.org/10.2138/rmg.2005.58.6, 2005.
Rogers, H. E., Riebe, C. S., and Granger D. E.: Cosmogenic 10Be in quartz and magnetite: Using the same nuclide in multiple minerals to quantify differential weathering, American Geophysical Union Fall Meeting, 9–13 December 2013, San Francisco, CA, USA, Abstract H51B-1188, 2013.
Schäfer, J. M., Ivy-Ochs, S., Wieler, R., Leya, I., Baur, H., Denton, G. H., and Schlüchter, C.: Cosmogenic noble gas studies in the oldest landscape on earth: surface exposure ages of the Dry Valleys, Antarctica, Earth Planet. Sc. Lett., 167, 215–226, https://doi.org/10.1016/S0012-821X(99)00029-1, 1999.
Schwartz, S., Gautheron, C., Ketcham, R. A., Brunet, F., Corre, M., Agranier, A., Pinna-Jamme, R., Haurine, F., Monvoin, F., and Riel, N.: Unraveling the exhumation history of high-pressure ophiolites using magnetite (U-Th-Sm)/He thermochronometry, Earth Planet. Sc. Lett., 543, 116359, https://doi.org/10.1016/j.epsl.2020.116359, 2020.
Shuster, D. L., Flowers, R. M., and Farley, K. A.: The influence of natural radiation damage on helium diffusion kinetics in apatite, Earth Planet. Sc. Lett., 249, 148–161, https://doi.org/10.1016/j.epsl.2006.07.028, 2006.
Spotila, J. A., Farley, K. A., Yule, J. D., and Reiners, P. W.: Near-field transpressive deformation along the San Andreas fault zone in southern California, based on exhumation constrained by (U–Th) He dating, J. Geophys. Res.-Sol. Ea., 106, 30909–30922, https://doi.org/10.1029/2001jb000348, 2001.
Trull, T. W., Kurz, M. D., and Jenkins, W. J.: Diffusion of cosmogenic 3He in olivine and quartz: implications for surface exposure dating, Earth Planet. Sc. Lett., 103, 241–256, https://doi.org/10.1016/0012-821x(91)90164-d, 1991.
Vandenberghe, D., De Corte, F., Buylaert, J. P., and Kučera, J.: On the internal radioactivity in quartz, Radiat. Meas., 43, 771–775, https://doi.org/10.1016/j.radmeas.2008.01.016, 2008.
Vorobiev, A. A., Grachev, V. T., Komar, A. P., Kondurov, I. A., Nikitin, A. M., and Seliverstov, D. M.: Yield of light nuclei formed in the fission of U235 by thermal neutrons, Sov. Atom. Energy, 27, 713–717, https://doi.org/10.1007/bf01816909, 1969.
Ziegler, J. F., Ziegler, M. D., and Biersack, J. P.: SRIM–The stopping and range of ions in matter (2010), Nucl. Instrum. Meth. B, 268, 1818–1823, https://doi.org/10.1016/j.nimb.2010.02.091, 2010.