the Creative Commons Attribution 4.0 License.
the Creative Commons Attribution 4.0 License.
 | 03 Feb 2021
Direct U–Pb dating of carbonates from micron-scale femtosecond laser ablation inductively coupled plasma mass spectrometry images using robust regression
Guilhem Hoareau
Fanny Claverie
Christophe Pecheyran
Christian Paroissin
Pierre-Alexandre Grignard
Geoffrey Motte
Olivier Chailan
Jean-Pierre Girard
Uranium–lead (U–Pb) dating of carbonates by laser ablation inductively coupled plasma mass spectrometry (LA-ICP-MS) spot analysis is an increasingly used method in the field of geosciences, as it brings very strong constraints over the geological history of basins, faults or reservoirs. Most ages currently published are based on the measurement of U and Pb ratios on spot ablations, using nanosecond lasers coupled to sector field or multi-collector ICP-MS. Here, we test a new strategy for the U–Pb dating of carbonates from 2D isotopic ratio maps, based on the use of a robust regression approach in the data reduction workflow. The isotopic maps, with a minimum area of 0.65 mm2 (∼ 1000 pixels of 13×25 µm resolution), are obtained using a 257 nm femtosecond laser ablation system at a high repetition rate (500 Hz) coupled to a high-resolution ICP-MS. The maps commonly show significant variations in isotope ratios at the pixel scale, allowing the plotting of pixel U–Pb ratios in concordia or isochron diagrams and the calculation of U–Pb ages. Due to the absence of individual ratio uncertainties, the ages are calculated using MM-robust linear regression rather than the more commonly used York-type regression. The goodness of fit to the data is assessed by the calculation of the residual standard error (RSE) of the regression and by the calculation of a mean square of weight deviates (MSWD) on discretised data. Several examples are provided that compare the ages calculated by robust regression with those obtained by other techniques (e.g. isotope dilution, LA-ICP-MS spot analyses and the pixel-pooling approach). For most samples, characterised by high U concentrations (> 1 ppm), robust regression allows for the calculation of ages and uncertainties similar to those obtained with the other approaches. However, for samples with lower U concentrations (< 0.5 ppm), the ages obtained are up to 10 % too young due to pixels with high U ∕ Pb acting as leverage points for the regression. We conclude that the U–Pb ages calculated by the regression method tested here, although statistically robust, should be critically analysed before validation, especially for samples with low U concentrations.
- Article
(8806 KB) - Full-text XML
-
Supplement
(25136 KB) - BibTeX
- EndNote


Since the seminal publication of Li et al. (2014), the uranium–lead (U–Pb) dating of carbonates by laser ablation inductively coupled plasma mass spectrometry (LA-ICP-MS) has progressed significantly with applications as varied as the dating of tectonic fractures and veins (e.g. Roberts and Walker, 2016; Beaudoin et al., 2018; Parrish et al., 2018; Nuriel et al., 2019), carbonate deposition (Drost et al., 2018), speleothems (Woodhead et al., 2019) or cements filling the porosity of reservoirs (e.g. Li et al., 2014; Godeau et al., 2018). This is due, among other benefits, to the very good spatial resolution of the method, which allows one to detect and exploit sub-millimetre-scale heterogeneities in U and the initial Pb concentration; to date several samples per day; and, due to the recent availability of carbonate standards, to correct matrix-related offsets of U ∕ Pb ratios (Roberts et al., 2020). Given the ubiquitous nature of carbonates, the technique is likely to be associated with a growing number of studies in the future (Roberts et al., 2020).
Most carbonate dating LA-ICP-MS studies are based on spot ablations of sizes ranging from 80 to 235 µm (e.g. Roberts and Walker, 2016; Parrish et al., 2018; Ring and Gerdes, 2016), where isochrons can be constructed from the combination of several tens of ablation craters made on the same crystal or, by default, on adjacent crystals when their size is too small (e.g. micrite). There is now enough hindsight on the applicability of the method to show that this approach allows precise ages to be obtained (< 3 % in the most favourable cases) (Roberts et al., 2020). In addition, the fact that most ablation cells can accommodate multiple samples simultaneously makes it possible to automatically analyse multiple samples per session, including primary and validation reference materials (RMs). However, as recently recalled by Roberts et al. (2020), the heterogeneous nature of carbonates requires prior petrographic and preferably geochemical characterisation of the samples to maximise the chances of successful dating. An initial screening of samples by LA-ICP-MS to produce images of diagnostic trace element concentrations is particularly adapted to localise U-rich and unaltered zones, in which precise and meaningful ages can be obtained (Roberts et al., 2020).
An alternative carbonate dating method based on age extraction from LA-ICP-MS maps was recently presented by Drost et al. (2018). As before, the simultaneous analysis of many trace elements (including, of course, U and Pb isotopes) allows for the visualisation of the most favourable areas for dating. However, in this case, the concentrations of elements characteristic of detrital contamination (e.g. Zr and Rb) or those that allow one to define alteration zones or distinct calcite cement generations (e.g. U, Pb, Fe and Mn) are used to define pixel exclusion thresholds. These are used to filter out the values corresponding to microscopic inclusions of other minerals (e.g. clays) and to altered zones, and/or to isolate the cement generation targeted for dating. The isotopic U and Pb values of the remaining pixels are used to build isotopic ratio maps, from which a U–Pb age can be calculated. The methodology of age determination proposed by these authors is based on the sorting of pixel ratio values used in dating (238U ∕ 206Pb–207Pb ∕ 206Pb for a Tera-Wasserburg, TW, diagram) based on 238U ∕ 208Pb and 235U ∕ 207Pb pixel ratios and their pooling (i.e. discretisation) to subsets (“pseudo-analyses”) of a similar number of pixels for which the mean values and associated standard errors (i.e. standard deviations of the mean) are calculated. These values are then plotted in TW, 86TW (208Pbcommon ∕ 206Pb versus 238U ∕ 206Pb; Parrish et al., 2018) and isochron diagrams (206Pb ∕ 208Pbcommon versus 238U ∕ 208Pbcommon) to calculate the age using York-type regressions as implemented in Isoplot (Ludwig, 2012) or IsoplotR (Vermeesch, 2018).
In this contribution, we test the pros and cons of an alternative approach for the calculation of U–Pb carbonate ages from isotopic maps. Rather than the pooling of pixel values proposed by Drost et al. (2018), the pixel isotopic ratios of interest are directly plotted in the concordia or isochron diagrams, and a statistically robust linear regression that is extremely robust to outliers is processed through the pixels to obtain the age. The visualisation of all pixel ratio values in the TW or isochron diagrams allows the user to visually assess the quality of data, guided by a more common statistical parameter such as the residual standard error (RSE). Discretisation is also used to calculate pseudo-MSWD (MSWD refers to the mean square of weight deviates) values that permit the assessment of the linearity of pixel data. The robust regression method appears to be ideally suited to isotopic maps obtained after pixel filtering based on trace element concentrations, as proposed by Drost et al. (2018), or if this is not feasible, using pixel co-localisation, as proposed here.
2.1 Choice of samples
Six samples of already dated lacustrine and reefal carbonates, and of tectonic veins, have been chosen to test the usefulness of the robust regression approach. Among these, four samples were analysed by the LA-ICP-MS isotope mapping approach as part of this study. These samples are as follows:
- i.
a lacustrine limestone (Long Point; Duff Brown Tank locality in the Colorado Plateau, USA), precisely dated by Hill et al. (2016) at 64.0 ± 0.7 Ma (2 s) by U–Pb methods using isotope dilution (ID) multi-collector inductively coupled plasma mass spectrometry (MC-ICP-MS), and labelled Duff Brown in the following. This sample serves as a validation RM in the analytical procedure and has also been demonstrated to be suitable for U–Pb dating using image maps by Drost et al. (2018);
- ii.
a tectonic calcite vein (BH14) from the Bighorn Basin (Wyoming, USA) dated by U–Pb LA-ICP-MS spot analyses (i.e. range of spot ablations) at 63.0 ± 2.2 Ma (MSWD = 1.6) by Beaudoin et al. (2018) and at 61.2 ± 2.9 Ma (MSWD = 4.1) in our laboratory (the detailed methodology is presented in Fig. S1 in the Supplement), with the same calcite RMs as the present study (WC1 and Duff Brown);
- iii.
a reefal limestone sample from the southern Pyrenees (PXG20-1), located in the upper part of the Pamplona marls in the Atarés anticline. This sample has been dated at 40.5 ± 2.3 Ma (MSWD = 0.9) in our laboratory by LA-ICP-MS spot analysis. A micropaleontologic study from Canudo and Molina (1988) performed close to the sampling area suggests an upper Bartonian to Priabonian age for the deposits (∼ 38.5–36.0 Ma), whereas the paleomagnetic study of Oms et al. (2003) is more consistent with a Bartonian age (∼ 40.0–38.5 Ma);
- iv.
a lacustrine carbonate from the southern Pyrenees (PXG32-2), which is part of the first continental deposits of the Campodarbe Formation flanking the western limb of the Boltaña anticline (eastern Jaca Basin). Previous magnetostratigraphic and tectono-sedimentary studies point to a Bartonian–Priabonian age of deposition (Mochales et al., 2016). A similar age was obtained by U–Pb LA-ICP-MS spot analysis in our laboratory, although with poor statistics (37.0 ± 3.0 Ma; MSWD = 6.3).
The two remaining samples were previously analysed by Drost et al. (2018) and Roberts et al. (2020). The raw pixel isotopic ratios retrieved from their LA-ICP-MS isotopic maps (Kerstin Drost, personal communication, 2020) were processed with the robust regression approach. These are
- v.
a calcite spar from a Carboniferous–Permian lacustrine limestone (sample JS4, run JS4-1), dated by Drost et al. (2018) at 300.8 ± 3.7, 299.6 ± 4.0 and 298.9 ± 5.6 Ma with their pixel-pooling approach (TW, 86TW and isochron diagrams respectively). This age agrees with several depositional age constraints (see Drost et al., 2018 for details).
- vi.
a tectonic vein from the Bighorn Basin (Wyoming, USA) dated by U–Pb LA-ICP-MS spot analyses at 59.5 ± 2.7 Ma (MSWD = 2.5) by Beaudoin et al. (2018). Roberts et al. (2020) obtained a similar age of 61.0 ± 1.7 Ma with the pixel-pooling approach of Drost et al. (2018).
Finally, three additional, undated samples of calcite cements found in tectonic breccias and veins affecting Tithonian limestones of the northern Pyrenees (France) are also presented (ETC2, ARB and C6-265-D5). They provide examples of the application of the technique to the resolution of the diagenetic evolution of areas with complex tectonic evolution.
2.2 Analytical strategy
2.2.1 LA-ICP-MS instrumentation
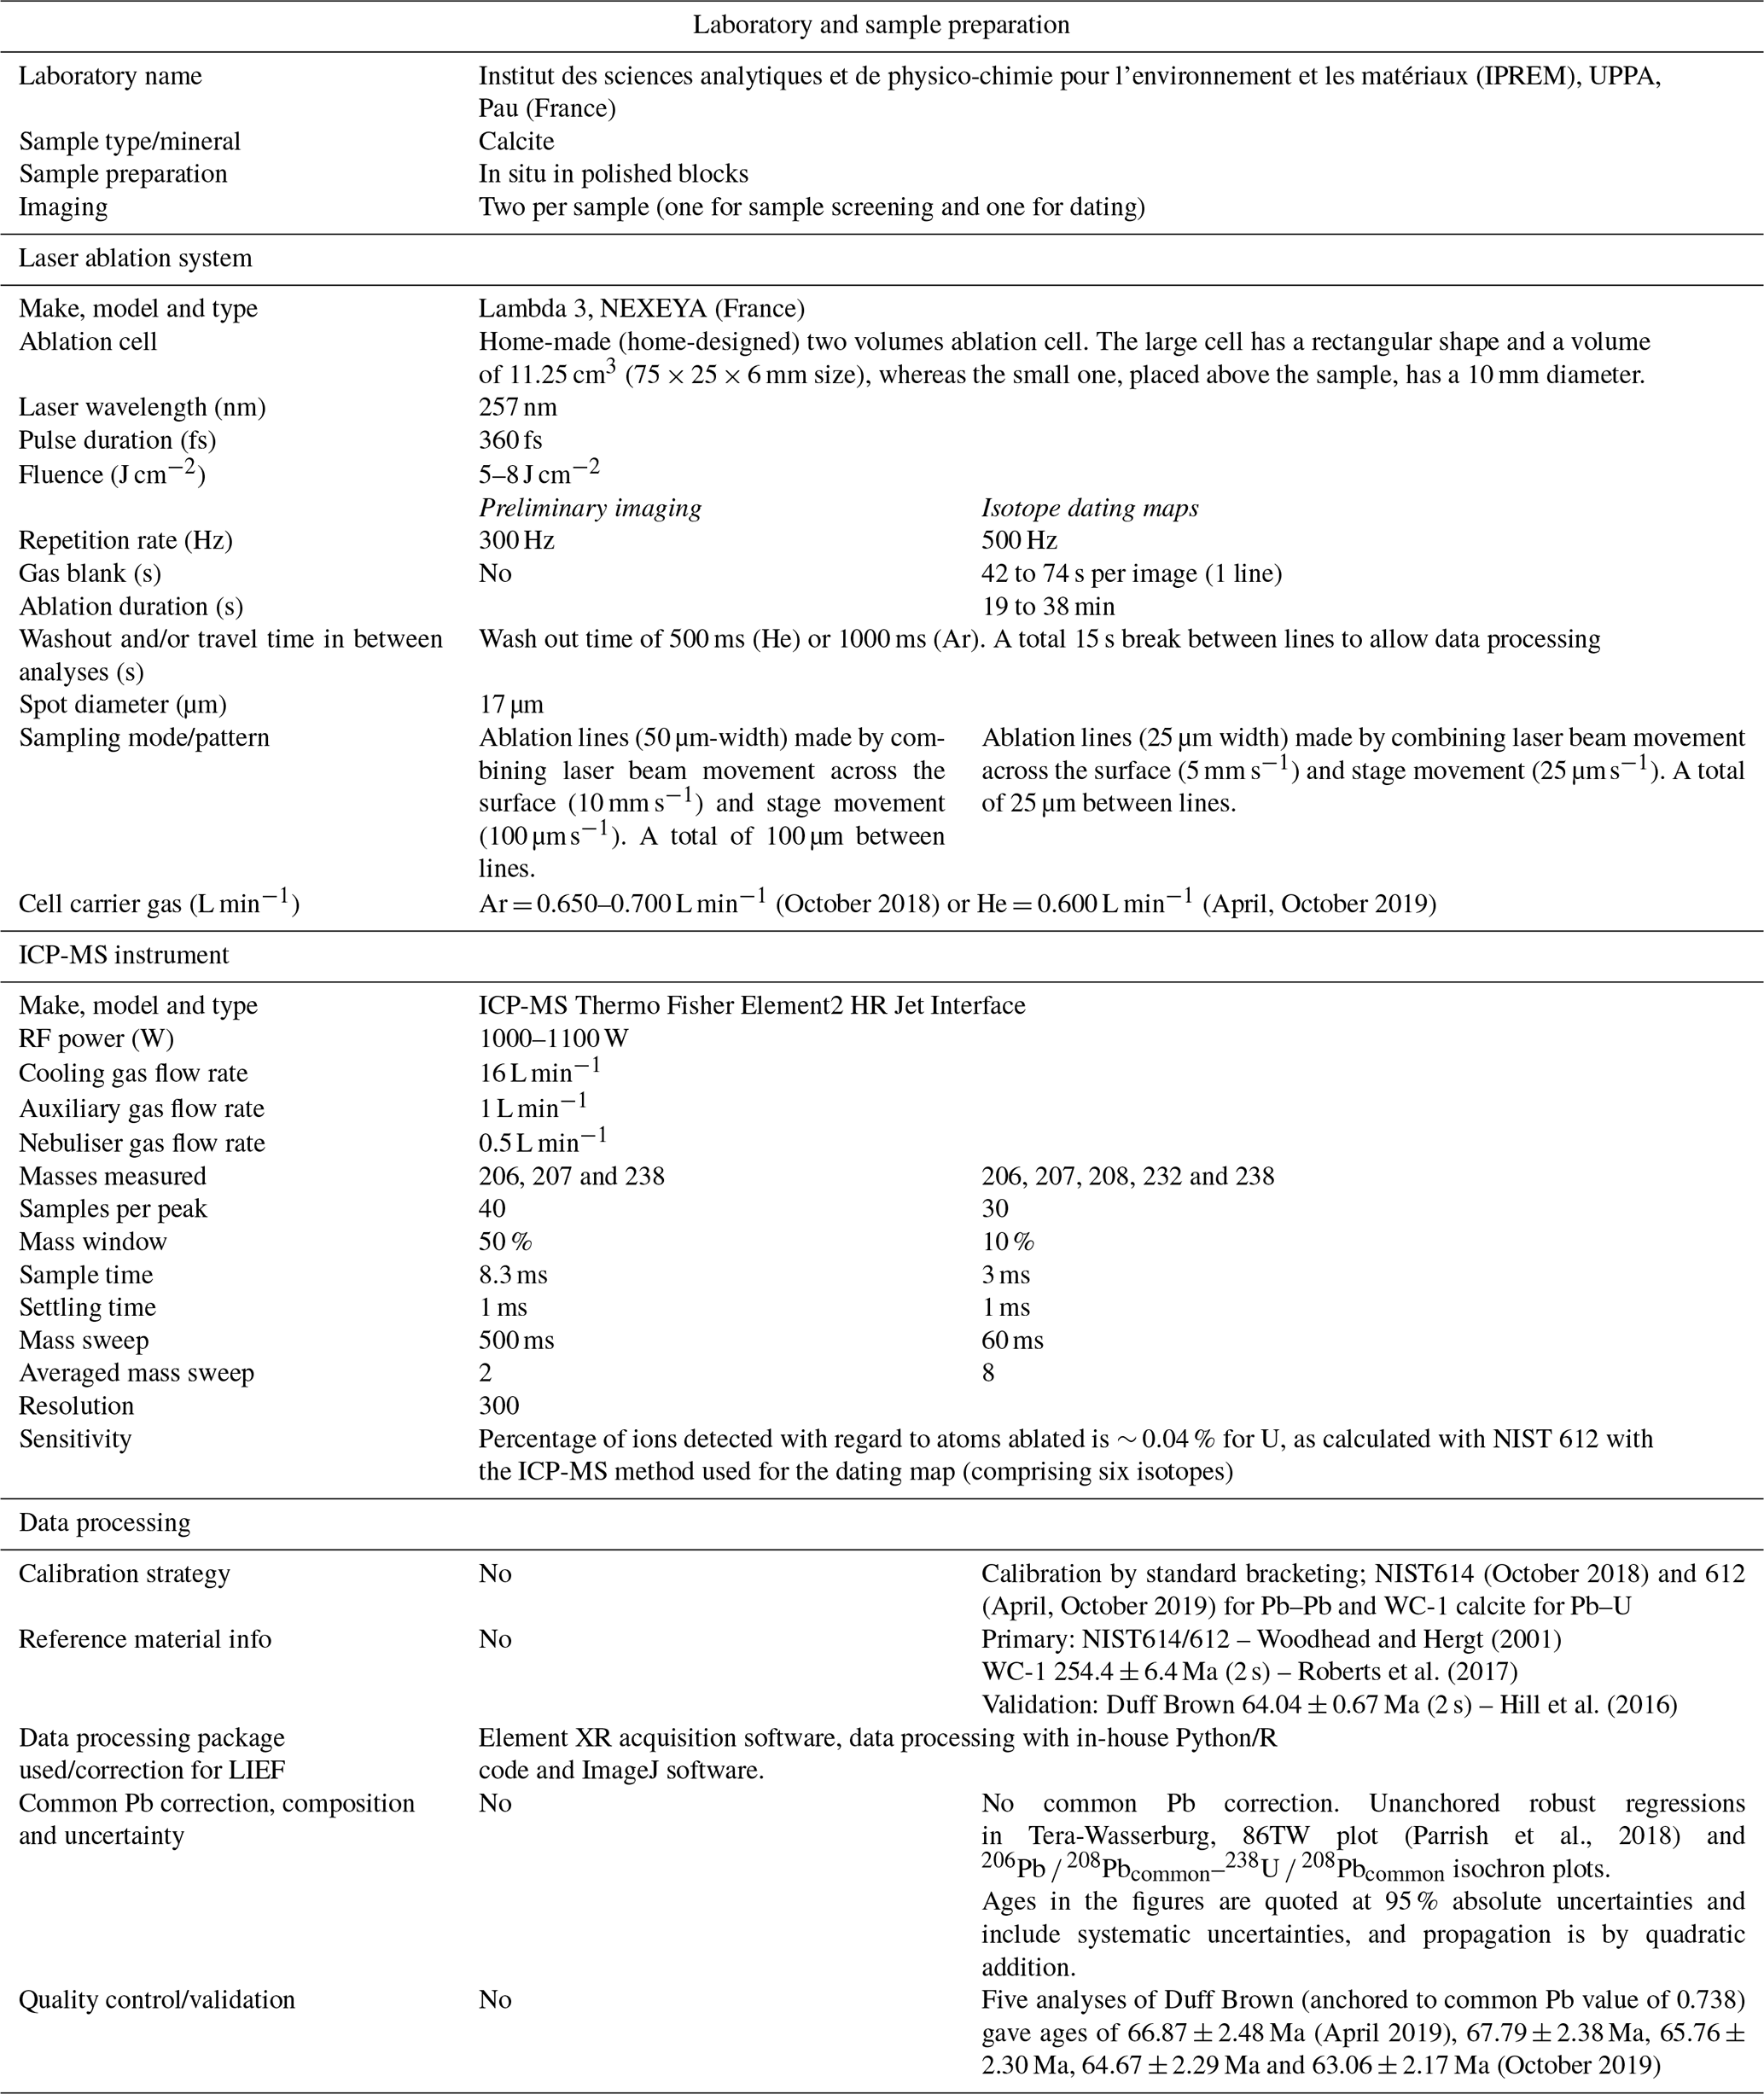
All the samples were analysed with a femtosecond laser ablation system (Lambda3, NEXEYA, Bordeaux, France) coupled to a sector field inductively coupled plasma mass spectrometer (SF-ICP-MS) Element XR (Thermo Fisher Scientific, Bremen, Germany) fitted with the Jet Interface. The laser is fitted with a diode-pumped Yb:KGW (potassium gadolinium tungstate) crystal laser source (HP2, Amplitude Systèmes, Pessac, France). The pulse duration is less than 400 fs at 257 nm. The laser source can operate within a wide range of repetition rates (1 Hz to 100 kHz) and energy ranging from 200 µJ per pulse below 1 kHz to 1 µJ at 100 kHz at 257 nm. Complex trajectories can be realised by moving the laser beam (15 µm diameter at full energy) across the surface of the sample using the rapid movement of galvanometric scanners combined with a high repetition rate (Fig. 1a; Ballihaut et al., 2007, Aramendia et al., 2015).
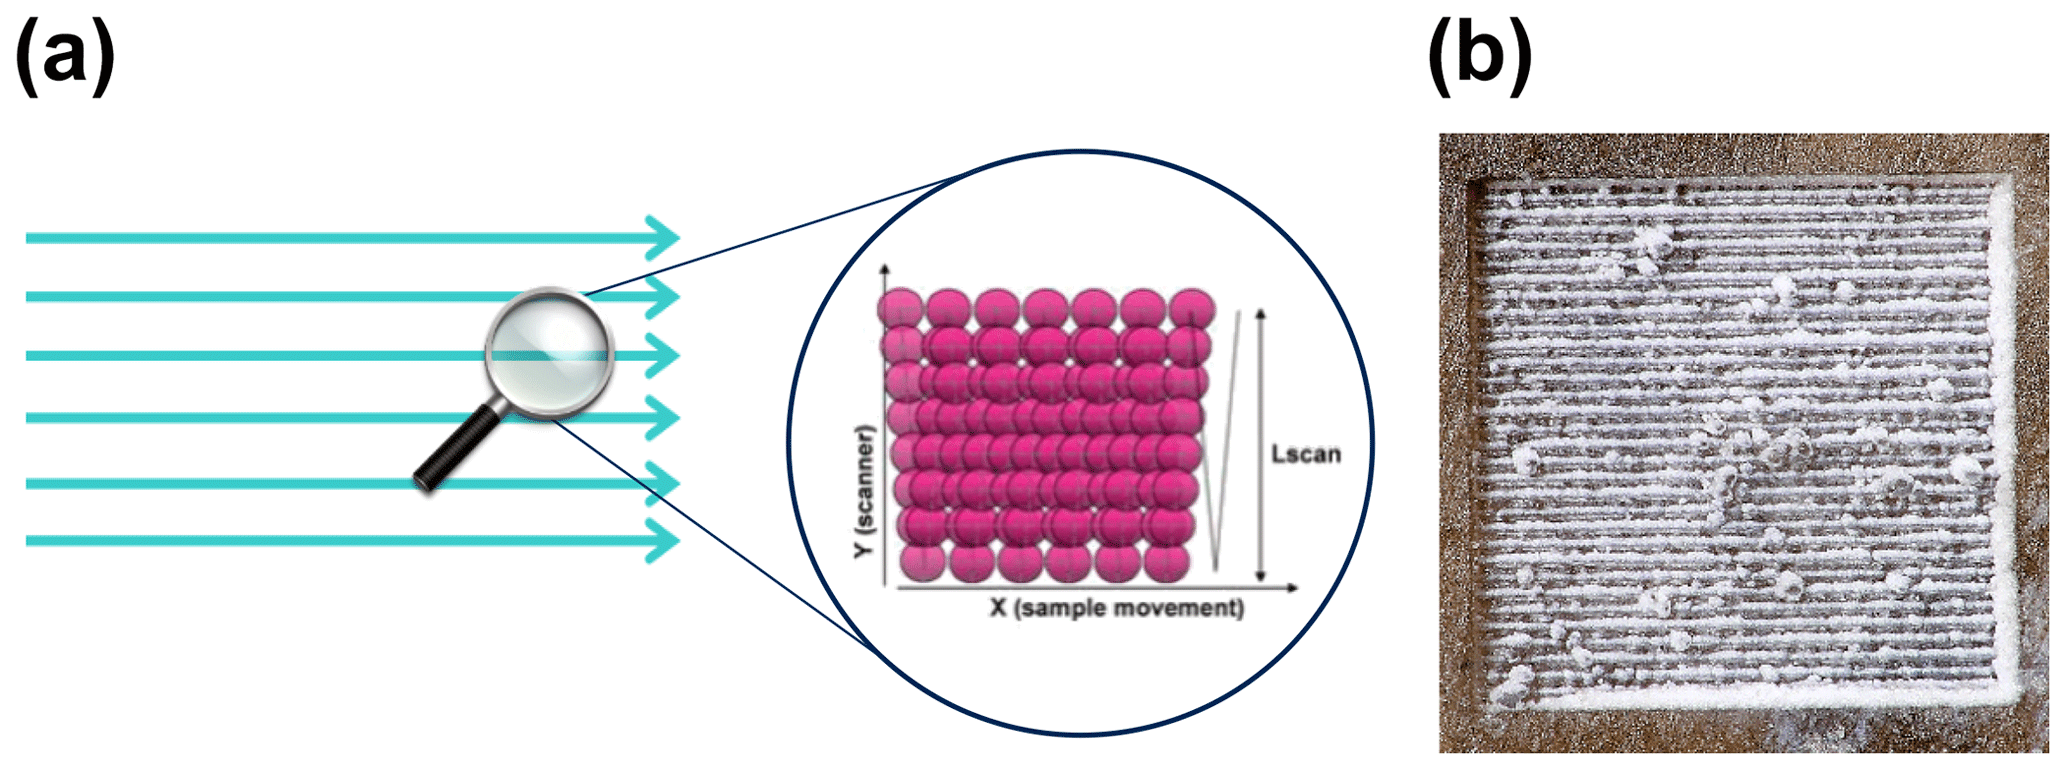
Figure 1(a) Principle of the construction of the ablation lines with the femtosecond laser used in the study. Lscan corresponds to the width of the line – here 50 or 25 µm. (b) Example of ablation produced by the rasters used for constructing an isotopic map (dimensions: 800 µm × 800 µm).
The aerosol produced by the ablation was carried to the ICP-MS by a tube ( internal diameter) using a helium stream (600 mL min−1), with the exception of the first session in October 2018 where argon (Ar) was used (650–700 mL min−1). Measured wash out time of the ablation cell was ∼ 500 ms for helium gas and ∼ 1 s for Ar gas considering the 99 % criterion. To improve sensitivity, 10 mL min−1 of nitrogen was added to the twister spray chamber of the ICP-MS via a tangential inlet while helium flow was introduced via another tangential inlet located at the very top of the spray chamber. Measurements were performed under dry plasma conditions. The femtosecond laser ablation inductively coupled plasma mass spectrometry (fs-LA-ICP-MS) coupling was tuned on a daily basis in order to achieve the best compromise in terms of sensitivity, accuracy, particle atomisation efficiency and stability. The additional Ar carrier gas flow rate, torch position and power were adjusted so that the U∕Th ratio was close to 1±0.05 when ablating the NIST SRM 612 glass. Detector cross-calibration and mass bias calibration were checked daily using the appropriate sequence of the Element software. The laser and ICP-MS parameters used for U–Pb dating are detailed in Appendix A. For sample screening (first type of isotopic map, see Sect. 2.2.2), only 238U, 207Pb and 206Pb were selected, reaching a total mass sweep time of about ∼ 500 ms. For the maps used for dating, 238U, 232Th, 208Pb, 207Pb and 206Pb were selected, reaching a total mass sweep time of about ∼ 60 ms. The analysis of trace elements with lower atomic masses, for the purpose of pixel selection as done by Drost et al. (2018), was not attempted due to the inability of the SF-ICP-MS to achieve reasonable total mass sweep times (due to magnet mass change). Based on NIST612, the limit of detection as of October 2019 was ∼ 1.3 ppb and ∼ 0.2 ppb for 206Pb and 238U respectively. The limit of quantification was ∼ 4.3 and ∼ 0.8 ppb for 206Pb and 238U respectively.
2.2.2 Analytical workflow
Two types of isotopic maps were produced:
- i.
The first one (screening map) was designed to identify the most favourable areas for dating (high U ∕ Pb), over a large surface of the sample. In this configuration, samples were first ablated along lines of 6.5 to 8.1 mm width at a repetition rate of 300 Hz, without pre-cleaning. The lines of 50 µm height were obtained using a back and forth movement of the laser (at 10 mm s−1) combined with a stage movement rate of 100 µm s−1 (Fig. 1a), corresponding to 64.5 to 81 s of analysis per line, followed by a 15 s break between the lines (to allow for ICP-MS data processing). The lines were separated by a distance of 100 µm, leaving a gap of 50 µm between them. The number of lines was 40 to 56, resulting in a duration of 53 to 78 min for a complete map of a surface of between 26 and 38.1 mm2. The maps produced (238U ∕ 206Pb) are presented in Fig. S2.
- ii.
The second one (dating map) was designed to date the samples. Therefore, they were performed in a selected area (from screening map and after being repolished) and consisted of linear scans of 0.8 to 1.6 mm width at a repetition rate of 500 Hz. These lines of 25 µm height, separated by a distance of 25 µm so that they are immediately adjacent to each other, were obtained using a back and forth movement of the laser (at 5 mm s−1) combined with a stage movement rate of 25 µm s−1, corresponding to 32 to 64 s of analysis per linear scan, followed by a 15 s break. The number of lines was 25 to 27, resulting in a total analysis time ranging from 19 to 38 min for a complete map of a surface of between 0.5 and 1.1 mm2 (Fig. 1b). Before analysis, the samples were pre-cleaned with the laser using a stage movement rate of 200 µm s−1. The unknowns were bracketed with the NIST SRM 612 for lead ratios and by the commonly used WC1 calcite RM (age 254.4 ± 6.4 Ma; Roberts et al., 2017) for the Pb ∕ U ratio, using the standardisation method of Roberts et al. (2017). Two unknowns could be analysed in a row between the RMs. The primary and validation RMs were analysed under conditions similar to the unknowns, except that the isotopic maps were of a smaller surface (∼ 0.2 mm2), corresponding to an analysis time of ∼ 5 min. The ablation depth was between ∼ 25 and ∼ 35 µm.
2.3 Data processing and uncertainty propagation workflow
2.3.1 Construction of isotopic maps and blank correction
For each map, the first line corresponds to the ICP-MS signal recorded without laser ablation in order to calculate average blank values for the different masses. The matrices of raw isotopic values (in counts per seconds) were then built using a home-made Python code including blank correction (subtraction of average blank for each data point). Visualisation as maps were processed with the Fiji freeware. All isotopic maps are imported as an image stack and appropriately cropped. To consider the wash out time, the number of pixels was averaged by eight along each linear scan in order to reach a value of one pixel per 500 and 1000 ms for He and Ar respectively. The isotopic ratio matrices were then calculated.
2.3.2 Normalisation of the Pb ∕ Pb ratios and drift correction of the U ∕ Pb isotopic ratios
For the NIST SRM 612 glass, Pb and U isotopic ratios were calculated as the robust mean of the ratios over the entire image, using the “Huber” function of the “Statsmodels” Python library. The robust mean is obtained through an iterative process that uses a Huber loss function to strongly reduce the weight of any outlier (i.e. spike) onto the final result, without any manual outlier rejection. The standard error (i.e. standard deviation of the mean) for each ratio of the NIST SRM 612 glass was also calculated from the standard deviation which is an output of the function. For pixel Pb ∕ Pb ratios of the unknown and WC1, normalisation (correction of mass bias) was based on a standard bracketing approach, using the NIST SRM 612 analysed immediately before and after the unknown. The reference values were taken from Woodhead and Hergt (2001). For U ∕ Pb ratios, correction for drift was based on a similar approach (standard bracketing using NIST SRM 612 glass). For WC1 calcite, an age was calculated from the combination of both isotopic maps that bracket the unknown sample. The age, obtained with the robust regression method described in detail below, was used to calculate the correction factors for the U ∕ Pb ratios, following the approach of Roberts et al. (2017). The correction factor was calculated for a TW regression, with the 207Pb ∕ 206Pb anchored to a value of 0.85 as determined from isotope dilution methods (Roberts et al., 2017). The U ∕ Pb isotopic ratios of all pixels of the unknown sample isotopic maps were corrected by the obtained correction factor.
2.3.3 Age calculation of the unknown
All regressions were performed using a statistically robust linear regression approach based on a Tukey biweight loss function. All of the pixel isotopic values were first plotted in the appropriate plot (TW, 86TW and isochron plots). For the 86TW and isochron plots, the amount of common 208Pb (208Pbc) must be known to calculate the 208Pbc ∕ 206Pb, 206Pb ∕ 208Pbc and 238U ∕ 208Pbc ratios. For each pixel, the 208Pbc was calculated from the amount of radiogenic 208Pb obtained from measured 232Th and the age of precipitation given by the TW plot. This heuristic approach is similar to that proposed by Parrish et al. (2018). The regression was then made using the “lmrob” package in R (Maechler et al., 2019). In the chosen setting (KS2014) the package allows one to automatically perform an MM-robust regression, which has a high breakdown efficiency and is demonstrated to be highly efficient against outliers (Koller and Stahel, 2011, 2017). Based on an iterative process, the method automatically attributes a weight to each point, with the lowest weights corresponding to the outliers. The final regression is then a weighted linear fit through the points. Finally, the age calculation used the classical geochronological equations, corresponding to the lower intercept of the regression line with the concordia in the TW space (with the x axis in the TW86 space) and to the slope of the regression line in the isochron diagram.
2.3.4 Uncertainties
In the commonly used York-type weighted linear regressions, the weight of each point is inversely proportional to its uncertainty (i.e. size of the ellipse), where the latter commonly corresponds to the quadratic addition of analytical uncertainties (Horstwood et al., 2016). In contrast, the pixel isotopic ratios used for the robust regression have no uncertainty, as they are directly calculated from the number of counts of the relevant masses. Therefore, all uncertainties (analytical or systematic) were added quadratically to the age uncertainty obtained from the confidence interval of the robust regression. Following the recommendations of Horstwood et al. (2016), these uncertainties were added to the U ∕ Pb ratio uncertainty corresponding to the age, rather than to the age uncertainty itself. The analytical uncertainties considered are those calculated for the homogeneous primary reference material (NIST SRM 612 glass). Due to the standard bracketing approach used (see above), no excess variance could be calculated. The systematic uncertainties are the decay constant uncertainty of 238U (0.1 %, 2 s) and the 238U ∕ 206Pb ratio uncertainty of WC1, as estimated by Roberts et al. (2017) (2.7 %, 2 s), and a long-term excess variance taken as 2.0 % (2 s). Due to the low number of sessions carried out with this approach, the long-term variance could not be reliably calculated. This value was therefore chosen by analogy with other studies (e.g. Horstwood et al., 2016; Beaudoin et al., 2018; Guillong et al., 2020), but it is likely to change in the future.
2.3.5 Estimation of the goodness of fit
In geochronology, the parameter usually most used in the estimation of goodness of fit is the mean square of weight deviates (MSWD), or reduced chi-square, whose value close to one is interpreted as a strong indication of the quality of the regression. The calculation of the MSWD can, by definition, only be performed from values associated with uncertainties, which is not the case for the points used for the robust regression. Two steps have been adopted in this work to quickly assess the goodness of fit of the robust regressions from statistical parameters. The first one is the calculation of the F test of overall significance. If the F test is higher than the significance level (chosen at 0.05), the regression is rejected and the dating is considered unsuccessful. If this first step is successful, the second step considers several parameters that help with assessing the quality of the regression. One parameter is the residual standard error (RSE) of the robust regression, an output of the lmrob method, which provides an estimate of the mean dispersion of the points around the regression in absolute value of the y axis. The smaller the RSE, the smaller the dispersion. Based on our experiments with analysed carbonate samples, successful samples have an RSE lower than ∼ 12 % of the y intercept (Pb0) value (i.e. < 0.10 for a common Pb value of 0.85 in TW plots). The second step is the calculation of a MSWD from a discretisation of the points used for regression, which we call MSWD-d. For each type of plot, the points are discretised into sets along the regression line obtained with the robust regression. For each set, the number of points always corresponds to the equivalent of 30 s of analysis (i.e. 60 pixels for He and 30 pixels for Ar), which is the most common duration of laser ablations in spot LA-ICP-MS studies. The weighted mean and standard error of the sets are calculated (i.e. ellipses). A MSWD-d value close to one is expected for sets well aligned along the regression. Based on our experiments, the ages obtained with MSWD-d values above ∼ 2.5 should be questioned. This approach is close to the one used by Drost et al. (2018) for their age calculations, except that (i) discretisation is not performed using the 235U ∕ 207Pb or 238U ∕ 208Pb ratios, (ii) the MSWD is not based on the use of York-type regression and (iii) the number of pixels per ellipse is not adjusted opportunely for each sample to tend toward a better MSWD value. In parallel with the calculation of the MSWD-d, a TW plot with the corresponding ellipses, as well as a representation of the running mean with 60 and 30 pixels for He and Ar respectively, is also systematically produced to assist in the user's assessment of the quality of the point alignment and, thus, the validity of the linear regression.
Two additional checks are performed to ensure the validity of the results. First, the ages obtained according to the three types of diagrams (TW, 86TW and isochron) must be identical within uncertainty. Second, an age is calculated from the subdivision of the isotope maps into squares that we call “pseudo-spots” and that mimic conventional LA-ICP-MS spot analyses. In detail, they have dimensions of 7×6 pixels, equivalent to 175 µm × 150 µm and 21 s of analysis, except for sample BH14 (October 2018) where they have a dimension of 4×6 pixels (100 µm × 150 µm; corresponding to 24 s). The mean and standard error of the 238U ∕ 206Pb and 207Pb ∕ 206Pb ratios are calculated from the pixels of each pseudo-spot, and the age is obtained in the TW space using IsoplotR. The age calculated with the robust regression must be, within the uncertainties, identical to that obtained from the pseudo-spots.
2.3.6 Co-localisation study
The lack of trace element concentration data prevents the adoption of a pixel selection approach as presented by Drost et al. (2018). In order to select the most favourable areas of the isotope maps to obtain precise ages, a pixel value co-localisation approach using the ImageJ plugin ScatterJn (Zeitvogel and Obst, 2016) was used. The pixel values of the 207Pb ∕ 206Pb and 238U ∕ 206Pb isotopic maps were plotted in a TW scatter plot, and areas selected in the spatial domain (maps) were highlighted in the plot (and vice versa). For all samples analysed, the spatial location of (i) outliers highlighted by the robust regression approach and (ii) visually aligned high 238U ∕ 206Pb ratio points in the TW plot were identified. In either case (or both), if the identified pixels are located in close spatial proximity on the map, a subset of the map can be selected and the age can be calculated from the pixels in that subset. It should be noted, however, that due to the small number of pixels selected, the age obtained is not necessarily more precise than using the entire map (as also highlighted by Drost et al., 2018, regarding their approach).
2.3.7 Comparison with the method of Drost et al. (2018)
In order to compare the efficiency of the robust regression method with that of Drost et al. (2018), we also carried out a processing of isotope ratio data directly inspired by these authors. It consists of sorting the pixel ratio values using the 207Pb ∕ 235U ratio for pre-Cenozoic samples or the 238U ∕ 208Pb ratio for Cenozoic samples, clustering the data in discrete steps of a given number of pixels (here 60 pixels, or 30 pixels for sample BH14, corresponding to 30 s of signal), before calculating the mean and its uncertainty for each cluster. The age is then calculated in TW, 86TW and isochron diagrams using IsoplotR. The stated age uncertainties include the same systematic uncertainties as for the robust regression.
For all samples considered in this study, the three types of diagrams used for age calculations by the robust regression (TW, 86TW and isochron), the TW plots resulting from the use of the pixel-pooling approach Drost et al. (2018) method and the plots produced from image discretisation (pseudo-spots), are presented in the Supplement (Fig. S3). The ages calculated by the different approaches are also listed in Table 1. Finally, the pixel values of the isotopic images for the masses 238, 232, 208, 207 and 206 are presented in Table S1.
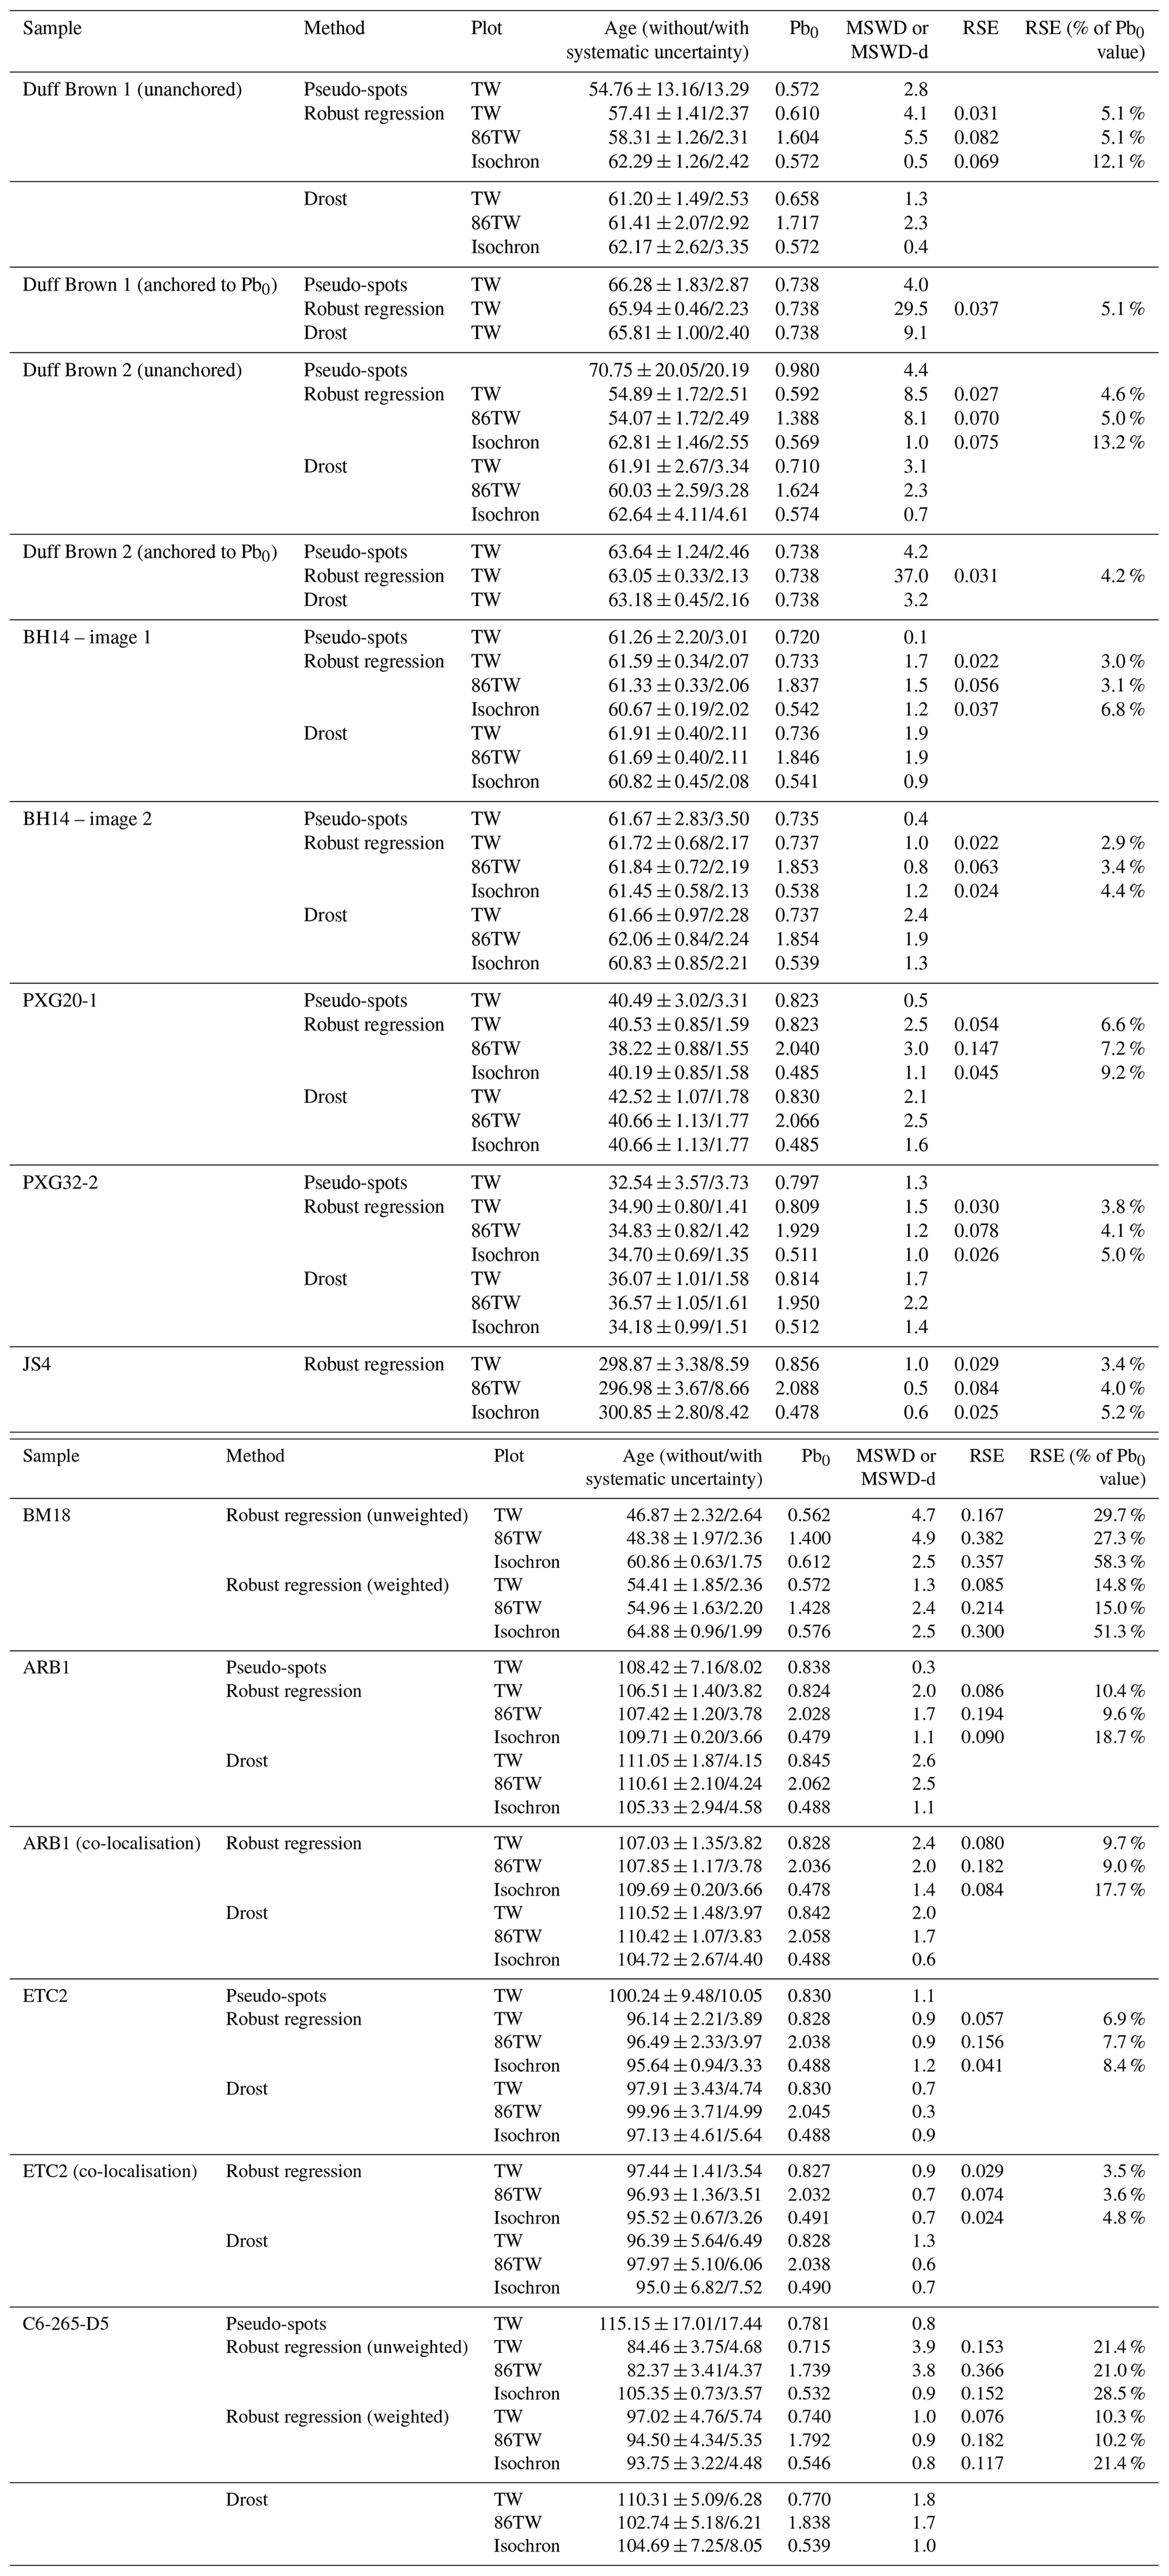
Table 1Ages calculated from the robust regression, from the pseudo-spots and from the approach of Drost et al. (2018), for all samples.
3.1 Age determination on previously dated samples
3.1.1 Duff Brown
The ages were obtained on two images chosen as an example. The ages calculated from pseudo-spots in the TW space are imprecise, with values of 70.7 ± 20.2 Ma and 54.8 ± 13.3 Ma (MSWD of 4.4 and 2.8 respectively; Fig. S3; Table 1). This is due to the lack of spread of the data points (i.e. ellipses) along a linear array, which results in poorly defined slope and intercepts of the regression line. Indeed, anchoring the Pb0 to the value calculated from the data of Hill et al. (2016) (0.738 ± 0.020, 2 s) leads to more precise ages of 63.6 ± 2.5 Ma (MSWD = 4.2) and 66.3 ± 2.9 Ma (MSWD = 4.0), similar to the reference value within uncertainties (Fig. S3). The same observations can be proposed for the robust regression method. The ages found without anchoring the common lead value are 54.9 ± 2.5 Ma (Fig. 2b, d) and 57.4 ± 2.4 Ma (Fig. S3) (MSWD-d of 8.5 and 4.1 respectively), whereas using the fixed Pb0 value leads to ages of 63.1 ± 2.1 Ma (Fig. 2c) and 65.9 ± 2.2 Ma (Fig. S3), similar to the reference value within uncertainties. Note that the maps used for age calculation (Fig. 2a) are smaller (0.21 mm2, ∼ 630 pixels) than those made for other samples, as Duff Brown was used as a validation RM during the tests. In this case, the very high MSWD-d values (39.1 and 29.5) are due to the low 207Pb ∕ 206Pb values of the pixels the closest to the y axis (i.e. with lower 238U ∕ 206Pb value) compared with those expected from the anchored regression. Finally, the ages obtained with the method of Drost et al. (2018) are identical to those from the robust regression, within the limits of uncertainties. The ages obtained without anchoring the Pb0 value are 61.9 ± 3.4 Ma (MSWD = 3.1; Fig. 2e) and 61.2 ± 2.5 Ma (MSWD = 1.3; Fig. S3), which are close to the expected value. By anchoring the Pb0 value, the ages are of 63.9 ± 2.2 Ma (MSWD = 4.5) and 65.8 ± 1.0 Ma (MSWD = 9.1) (Fig. S3).
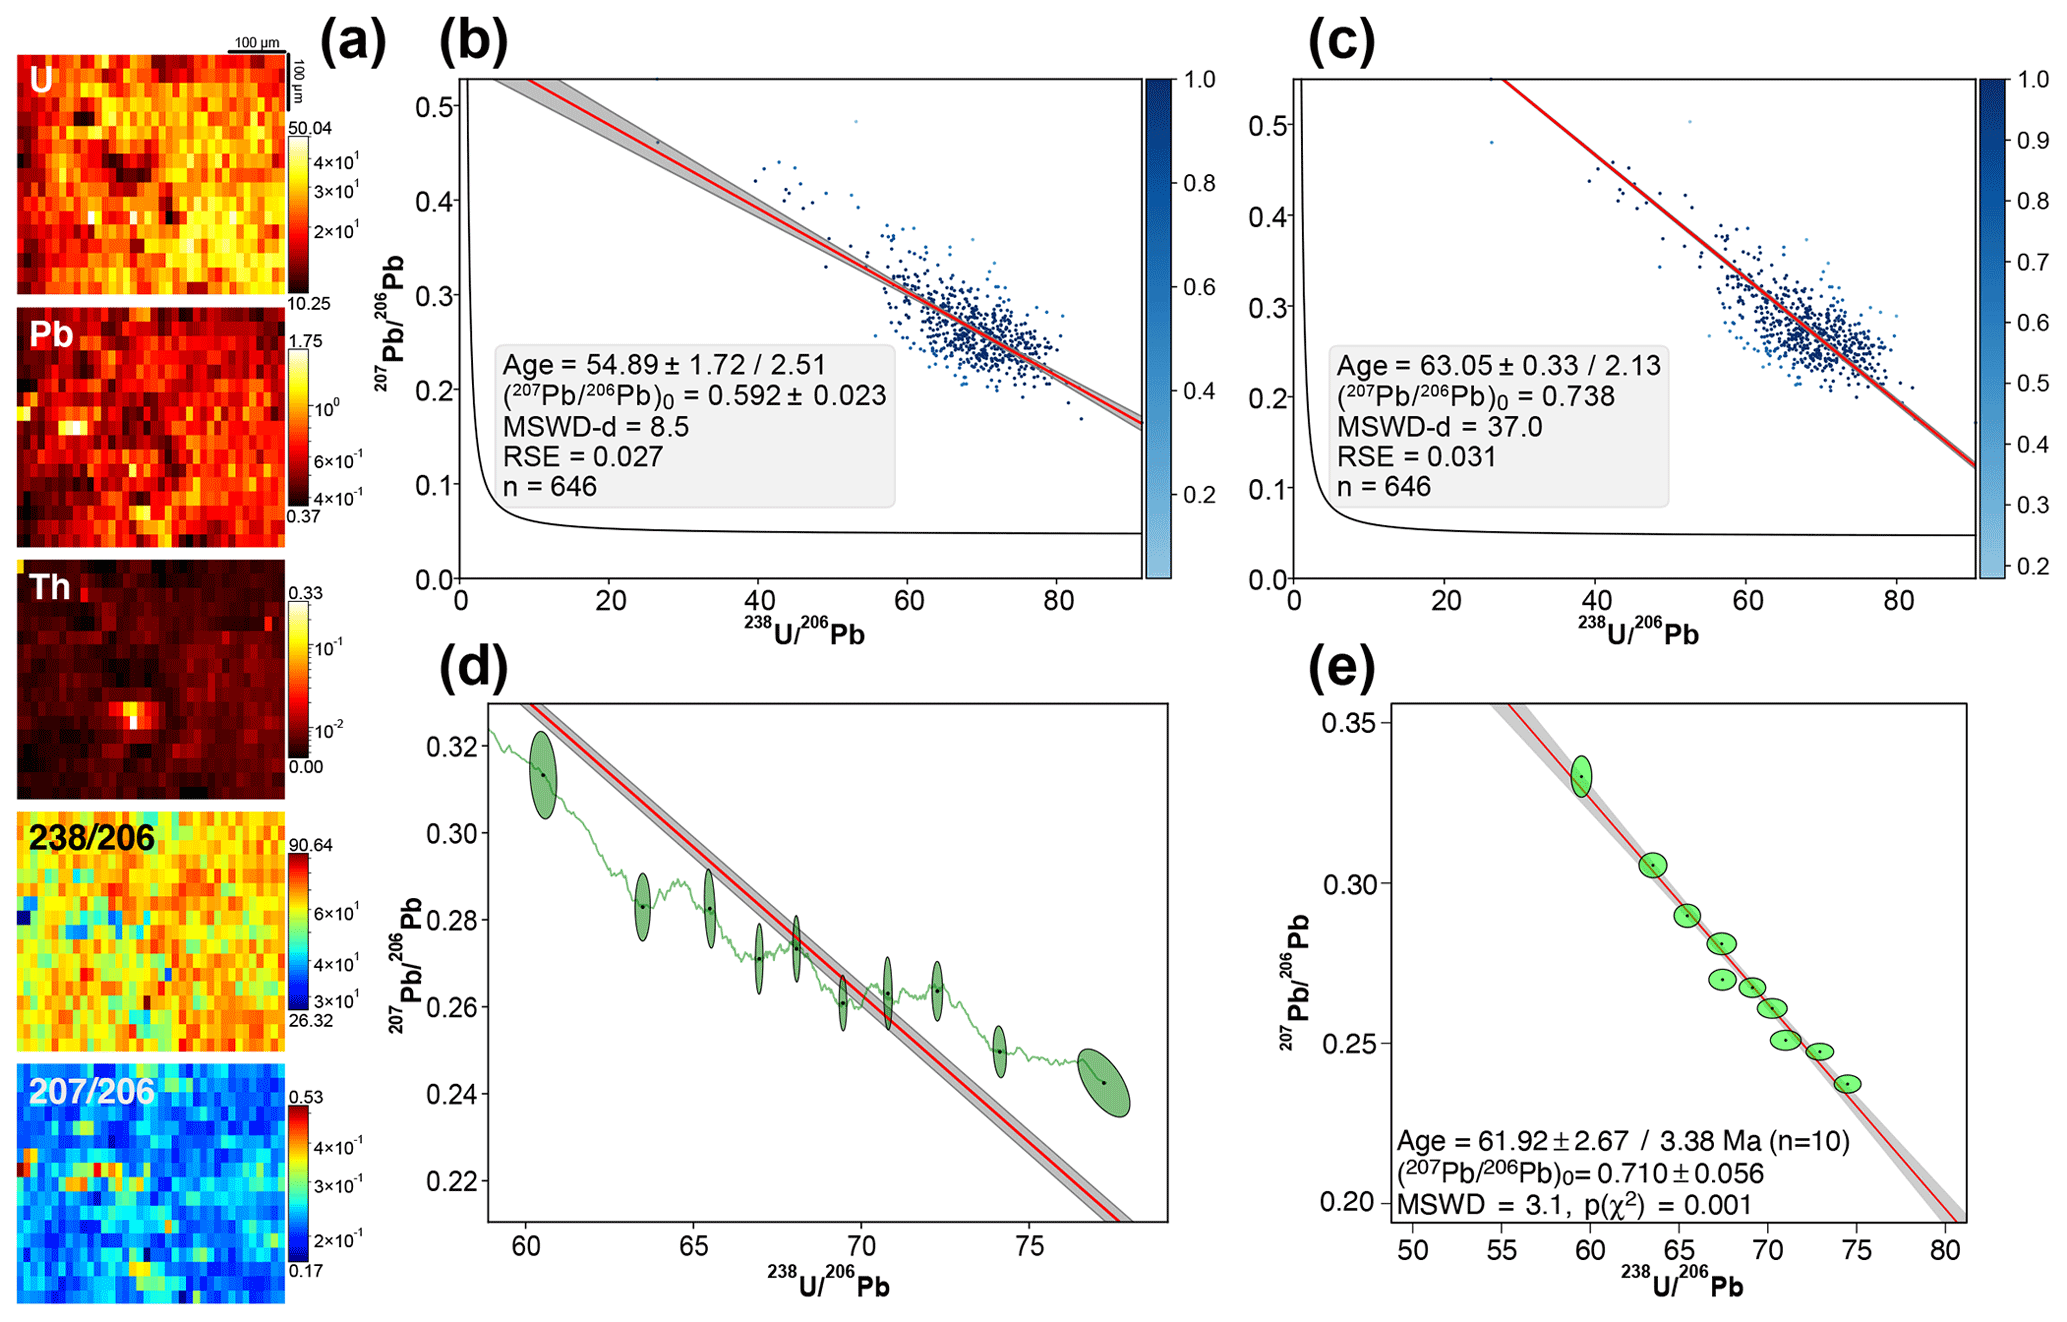
Figure 2(a) Element concentrations in parts per million (U, Pb and Th) and 238U ∕ 206Pb–207Pb ∕ 206Pb isotopic maps obtained for one analysis of Duff Brown sample. Note that the concentrations are normalised to the mean number of counts measured in the NIST reference material for the considered masses and should, thus, be regarded only as semi-quantitative. (b) TW concordia plot with age calculated by robust regression, without anchoring the common Pb value ((207Pb ∕ 206Pb)0). The age uncertainties (1.96σ level) are without (left) and with (right) uncertainty propagation. The blue colour scale refers to the weight attributed to each pixel by the robust regression. Panel (c) is the same as panel (b) but with common Pb anchored to a value of 0.738 as calculated from Hill et al. (2016). (d) TW concordia plot with ellipses calculated from the sets obtained by the discretisation of the pixel ratio values used for regression and those used for the calculation of the MSWD-d (see text for details). The regression and associated confidence interval are those obtained by the robust regression. In this example, the (207Pb ∕ 206Pb)0 value is anchored. (e) TW concordia plot of the same sample obtained with the method of Drost et al. (2018), without anchoring the common Pb value. The age and associated uncertainties were obtained from York-type regression using IsoplotR; age uncertainties (1.96σ level) are without (left) and with (right) systematic uncertainty.
3.1.2 BH14
Two images taken at two distinct locations in the same vein of this sample show a large amount of U (mean of 4 to 11 ppm depending on the image) (Fig. 3a, b) and a very good spread of the pixel U ∕ Pb and Pb ∕ Pb ratios along a linear trend (∼ 2 to 96 for 238U ∕ 206Pb; Fig. 3c, d). Such variation in isotope ratios (and U concentrations) is clearly related to crystal growth zoning (Fig. 3a, b). This composition allows precise dating, as shown by Beaudoin et al. (2018). Indeed, splitting the isotopic maps in pseudo-spots allows for the calculation of ages of 61.3 ± 3.0 Ma (Fig. 3e) and 61.7 ± 3.0 Ma (Fig. S3), with a MSWD of 0.1 and 0.4 respectively, which are values that are fully consistent with the ages obtained with the robust regressions from the entire maps (Table 1). The latter vary between 60.7 ± 2.0 Ma and 61.8 ± 2.2 Ma according to the diagrams considered (Fig. 3c, d; only TW concordia plots shown). They are identical within the limits of uncertainty to the values obtained with LA-ICP-MS spot analysis, both by Beaudoin et al. (2018) and in our laboratory (63.2 ± 2.2 and 61.2 ± 2.9 Ma respectively; Fig. 3f). They are also similar to the ages calculated by using the approach of Drost et al. (2018) (60.8 ± 2.1 to 61.4 ± 2.1 Ma according to the diagrams considered; Fig. 3g and S3). The age uncertainties calculated by the robust regression are generally less than 1 Ma (without considering systematic uncertainties), which is similar to values obtained by spot analysis and with the method of Drost et al. (2018). This high precision can be related to the very good visual and statistical parameters calculated for this regression (good point alignment, an RSE < 7 % of the Pb0 value and a MSWD-d < 1.7; Fig. 3c, d, e, f). The co-localisation study shows that the points furthest from the trend line of the robust regression are not located in a same area on the isotopic map. Any selection of a part of the map to possibly improve the age calculations is not justified.
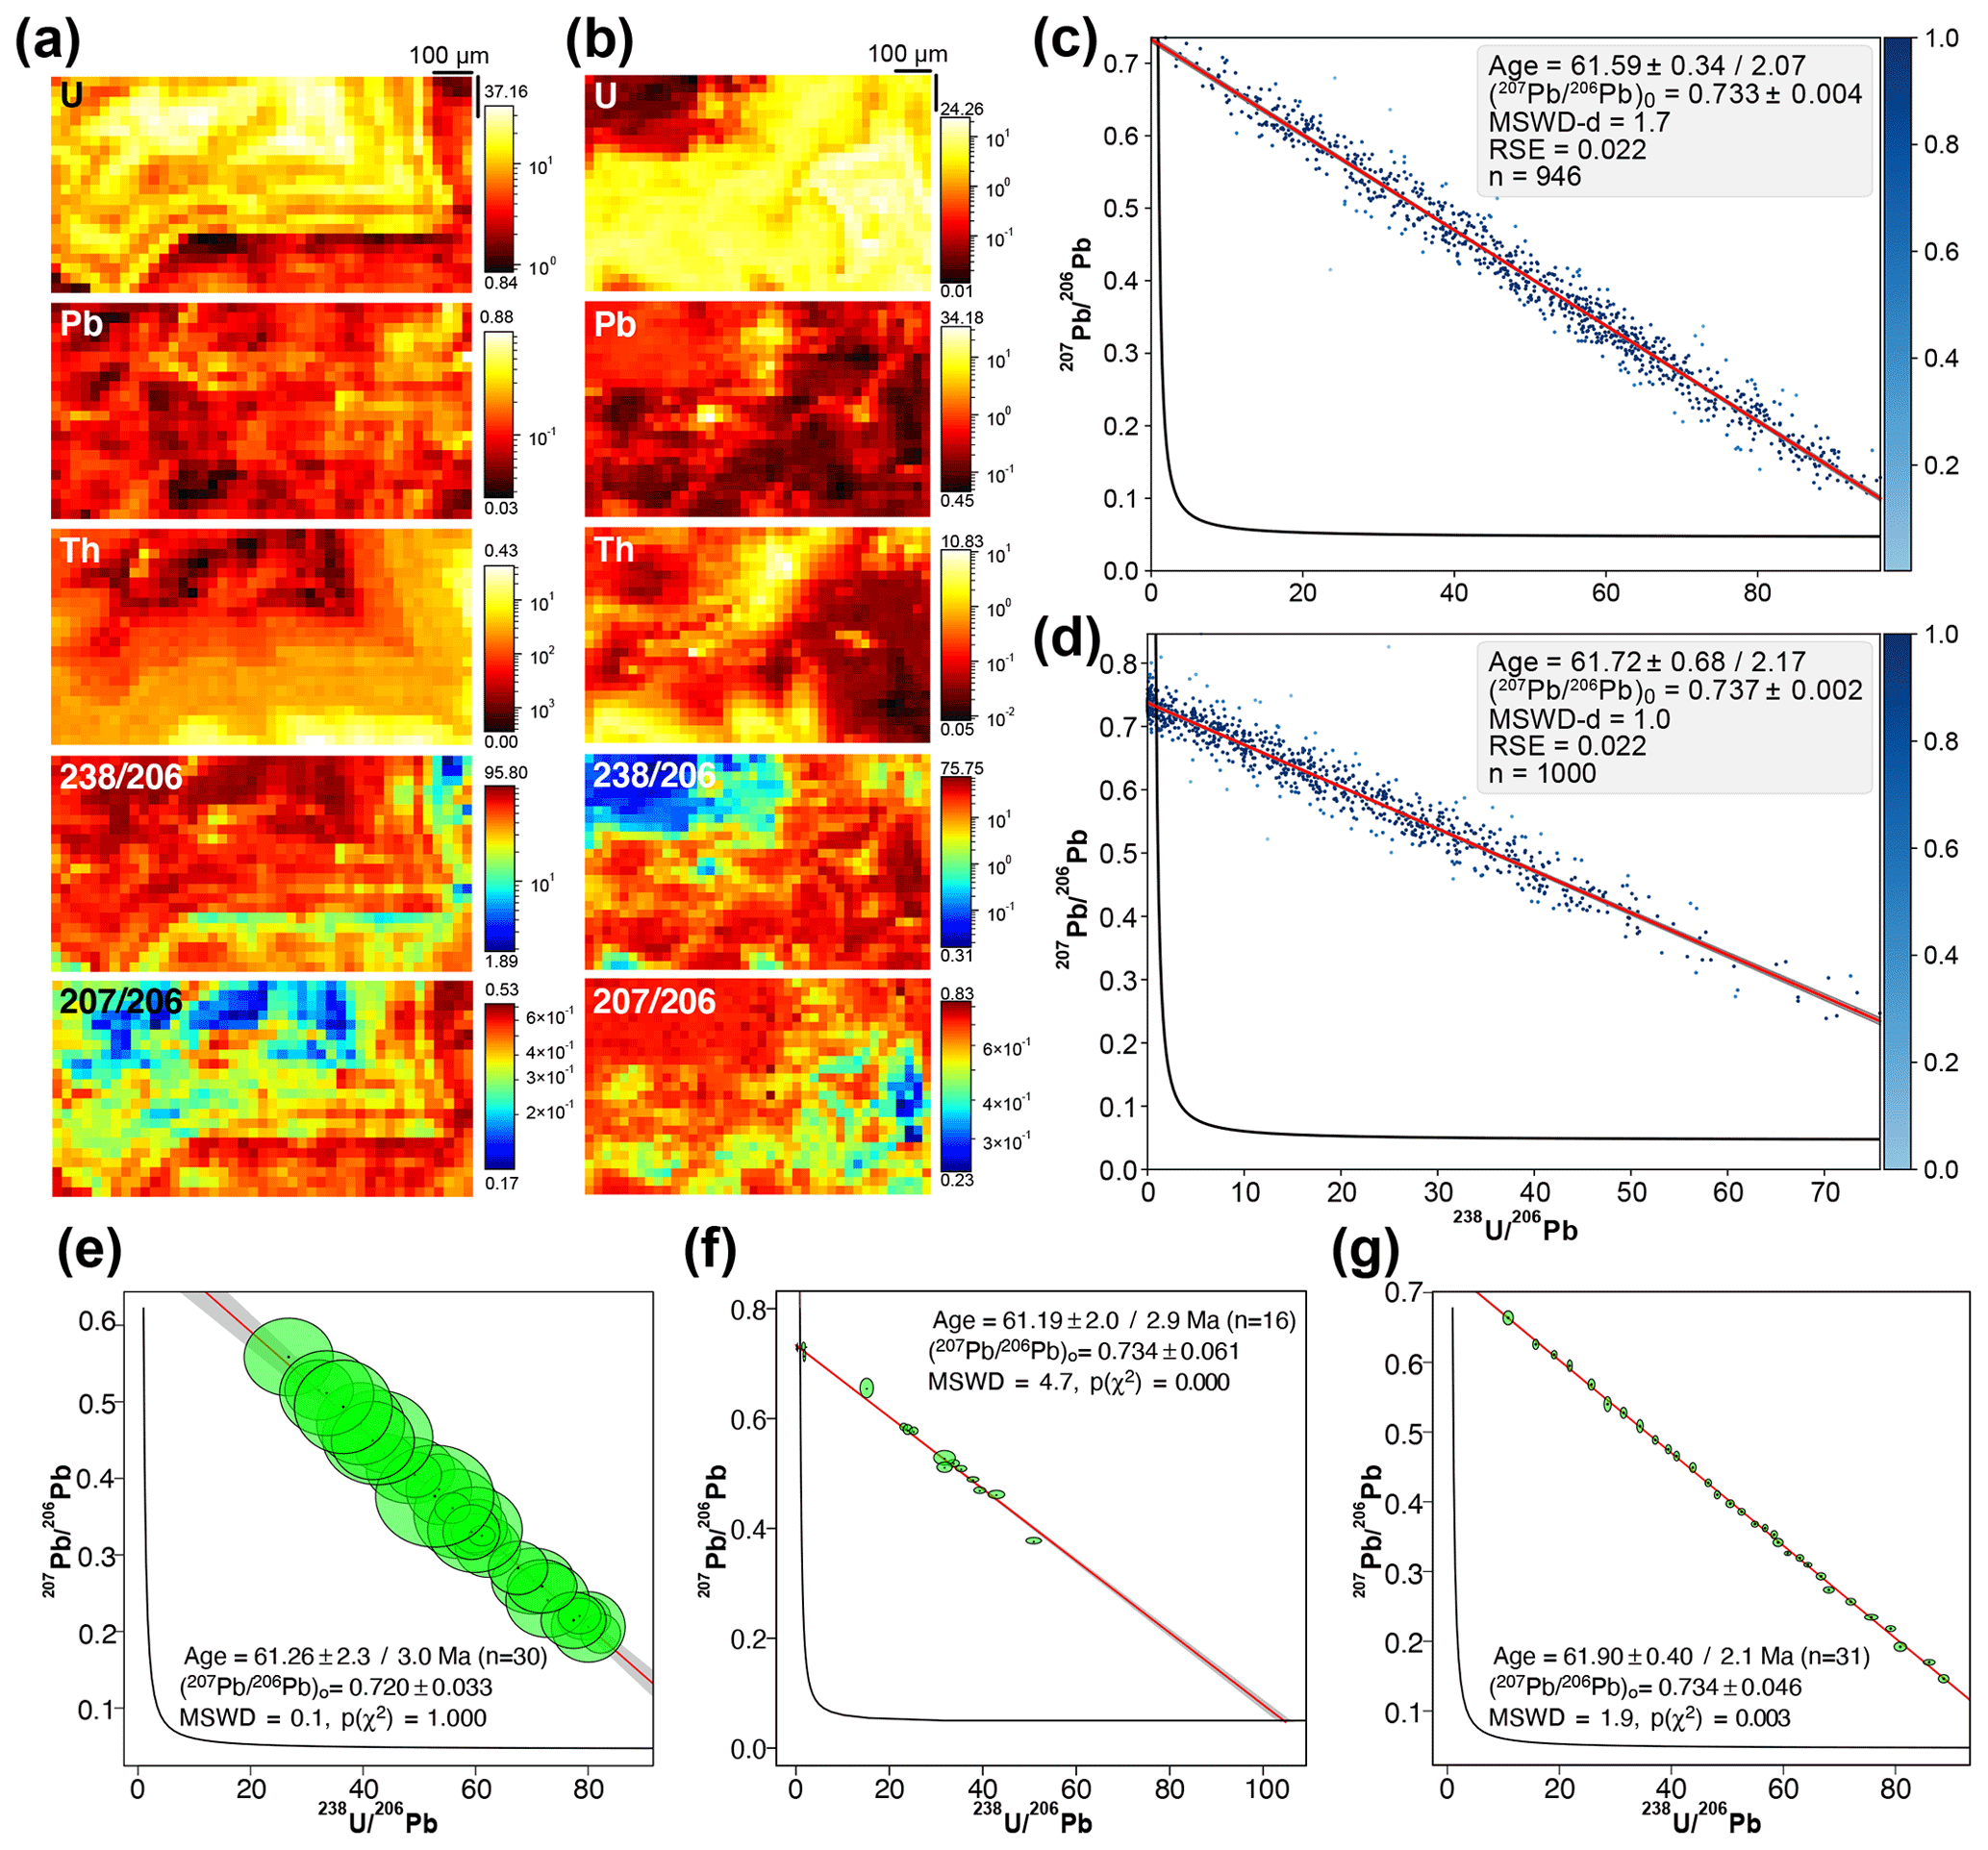
Figure 3Results obtained for two isotopic maps of sample BH14: (a, c, e, g) first map; (b, d) second map. (a, b) Semi-quantitative element concentrations in parts per million (U, Pb and Th) and 238U ∕ 206Pb–207Pb ∕ 206Pb isotopic maps. (c, d) TW concordia plots with ages and their uncertainty calculated by robust regression. (e) TW concordia plot with age and its uncertainty calculated from discretisation of the isotopic map (pseudo-spots). (f) TW concordia plot obtained from LA-ICP-MS spot analyses. (g) TW concordia plot obtained with the approach of Drost et al. (2018). For panels (e), (f), (g) and similar plots in the next figures, the ages and associated uncertainties were obtained from York-type regression using IsoplotR; age uncertainties (1.96σ level) are without (left) and with (right) systematic uncertainty.
3.1.3 PXG20-1
This sample is characterised by a moderately high mean U content of 2.5 ppm (Fig. 4a) and by a large spread of the pixel U ∕ Pb and Pb ∕ Pb ratios along a linear trend (∼ 0.5 to 93 for 238U ∕ 206Pb) (Fig. 4b). This favourable composition explains that the ages obtained by the robust regression are comparable within the uncertainties between the TW concordia plot (40.5 ± 1.6 Ma; Fig. 4b), the 86TW plot (38.2 ± 1.6 Ma; Fig. S3) and the isochron plot (40.2 ± 1.6 Ma; Fig. S3) (Table 1). They are also consistent with the age obtained by LA-ICP-MS spot analysis (40.5 ± 2.3 Ma), both in terms of absolute value and of precision (Fig. 4d), and with the age calculated from the pseudo-spots (40.5 ± 3.3 Ma; Fig. 4c). The slight variations in the central age depending on the diagram used (38.2 to 40.5 Ma) can be related to the statistical parameters of the regression, which are not as good as those obtained for BH14 (MSWD-d values from 1.1 to 3, and RSE values between 7 % and 9 % of the Pb0 value). This possibly shows some heterogeneity in the isotopic composition – for example, inclusions of detrital material. The co-localisation study shows a globally homogeneous spatial distribution of the values most distant from the regression line in a TW concordia plot. Any inclusions or cement alteration would certainly be better highlighted using a thresholding approach based on trace element contents, as proposed by Drost et al. (2018). The ages calculated with the method of Drost et al. (2018) for the entire map are within uncertainty of the previous values: 42.5 ± 1.8 Ma for the TW concordia plot (Fig. 4e), 40.6 ± 1.7 Ma for the 86TW plot (not shown) and 40.7 ± 1.1 Ma for the isochron plot (not shown). Finally, the ages obtained with both the isotope mapping approaches and LA-ICP-MS spot analysis are centred around ∼ 40 Ma. Such ages are similar to that suggested by the paleomagnetic study of Oms et al. (2003), which pointed to a Bartonian age (∼ 40.0–38.5 Ma). However, they are slightly older (including the limits of uncertainty) than the age proposed by Canudo and Molina (1988) on the basis of the presence of Globigerinatheka semiinvoluta in the sediments containing the sample. This microfauna rather indicates an age between 38.5 and 36.0 Ma according to Premoli-Silva et al. (2016) and Wade et al. (2011) and considering the Geologic Time Scale 2012 (GTS2012; Gradstein et al., 2012). The origin of this discrepancy is not yet identified. Nevertheless, the ages obtained are consistent, along with the other proxies, with the transition between marine and continental deposits in the studied area being Bartonian–Priabonian in age.
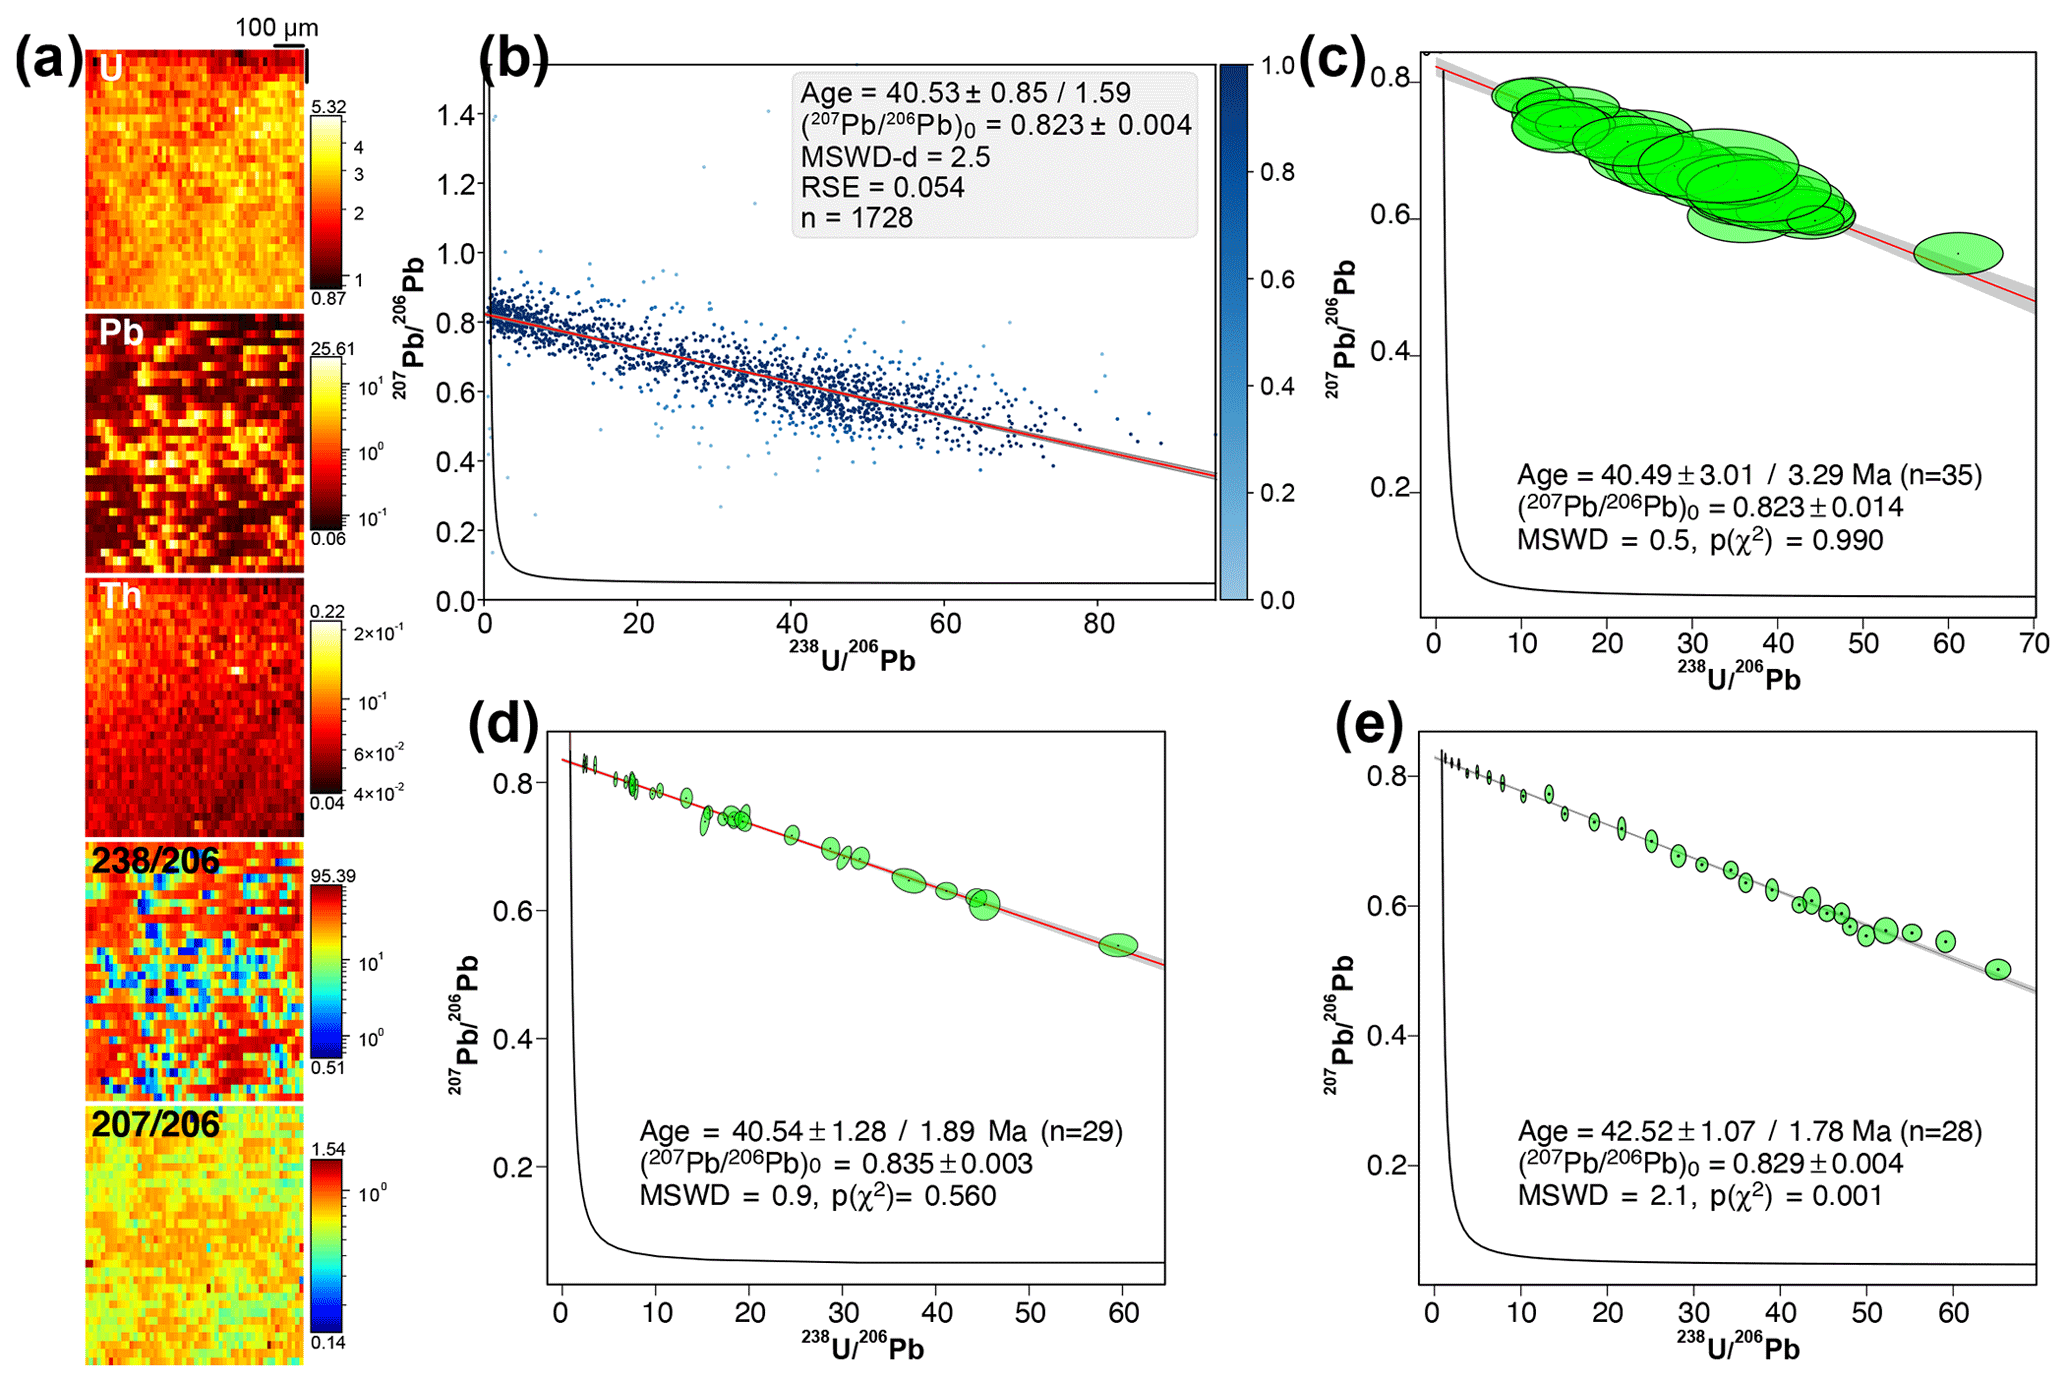
Figure 4Results obtained for sample PXG20-1. (a) Semi-quantitative element concentrations in parts per million (U, Pb and Th) and 238U ∕ 206Pb–207Pb ∕ 206Pb isotopic maps. (b) TW concordia plot with age and its uncertainty calculated by robust regression. (c) TW concordia plot calculated from discretisation of the isotopic map (pseudo-spots). (d) TW concordia plot obtained from LA-ICP-MS spot analyses. (e) TW concordia plot obtained with the approach of Drost et al. (2018).
3.1.4 PXG32-2
This lake carbonate sample has a very high U content (mean of 17.5 ppm) (Fig. 5a). However, the distribution of the pixel U ∕ Pb and Pb ∕ Pb ratios is more restricted than for the PXG-20-1 sample (Fig. 5b). Accordingly, the age calculated from the pseudo-spots is less precise than for the previous sample (32.5 ± 3.7 Ma) (Fig. 5c). Conversely, regarding the robust regression, the ages obtained are all comparable and of greater precision (∼ 35.0 ± 2.0 Ma, MSWD-d < 1.3 and RSE values lower than 5 % of the Pb0 value) (Fig. 5b and S3; Table 1). The ages obtained with the method of Drost et al. (2018) are slightly variable, although they are similar within the limits of the uncertainties (34.2 ± 1.0 Ma to 36.6 ± 1.6, MSWD ∼ 1; only the TW concordia plot is shown in Fig. 5e). Nevertheless, all of the previous ages are in agreement with the age obtained by LA-ICP-MS spot analysis (37.0 ± 3.0 Ma; Fig. 5d) and by the paleomagnetic study of Mochales et al. (2016). The age obtained with the robust regression approach is of higher precision than the age found with LA-ICP-MS spot analysis. However, the age calculated with spot analysis is associated with unsatisfactory statistics (MSWD = 6.3) and could, therefore, be considered as an errorchron. Such a high MSWD is clearly linked with sample heterogeneity as seen from the scatter of error ellipses around the regression line (Fig. 5d). Compositional heterogeneities are also clearly visible with U and Pb elemental maps (Fig. 5a). This is consistent with the heterogenous nature of the sample, composed of pellets and microbial oncoids (Fig. S2). The co-localisation study indicates that there are no obvious links between such heterogeneities and the location of outlier pixel values, which are evenly distributed on the maps and do not justify any sub-selection of the isotopic map. The age obtained confirms the Bartonian age of the first continental deposits in the eastern part of the Jaca Basin in the southern Pyrenees, bringing an absolute constraint on the end of the non-deposition period above the Boltaña anticline.
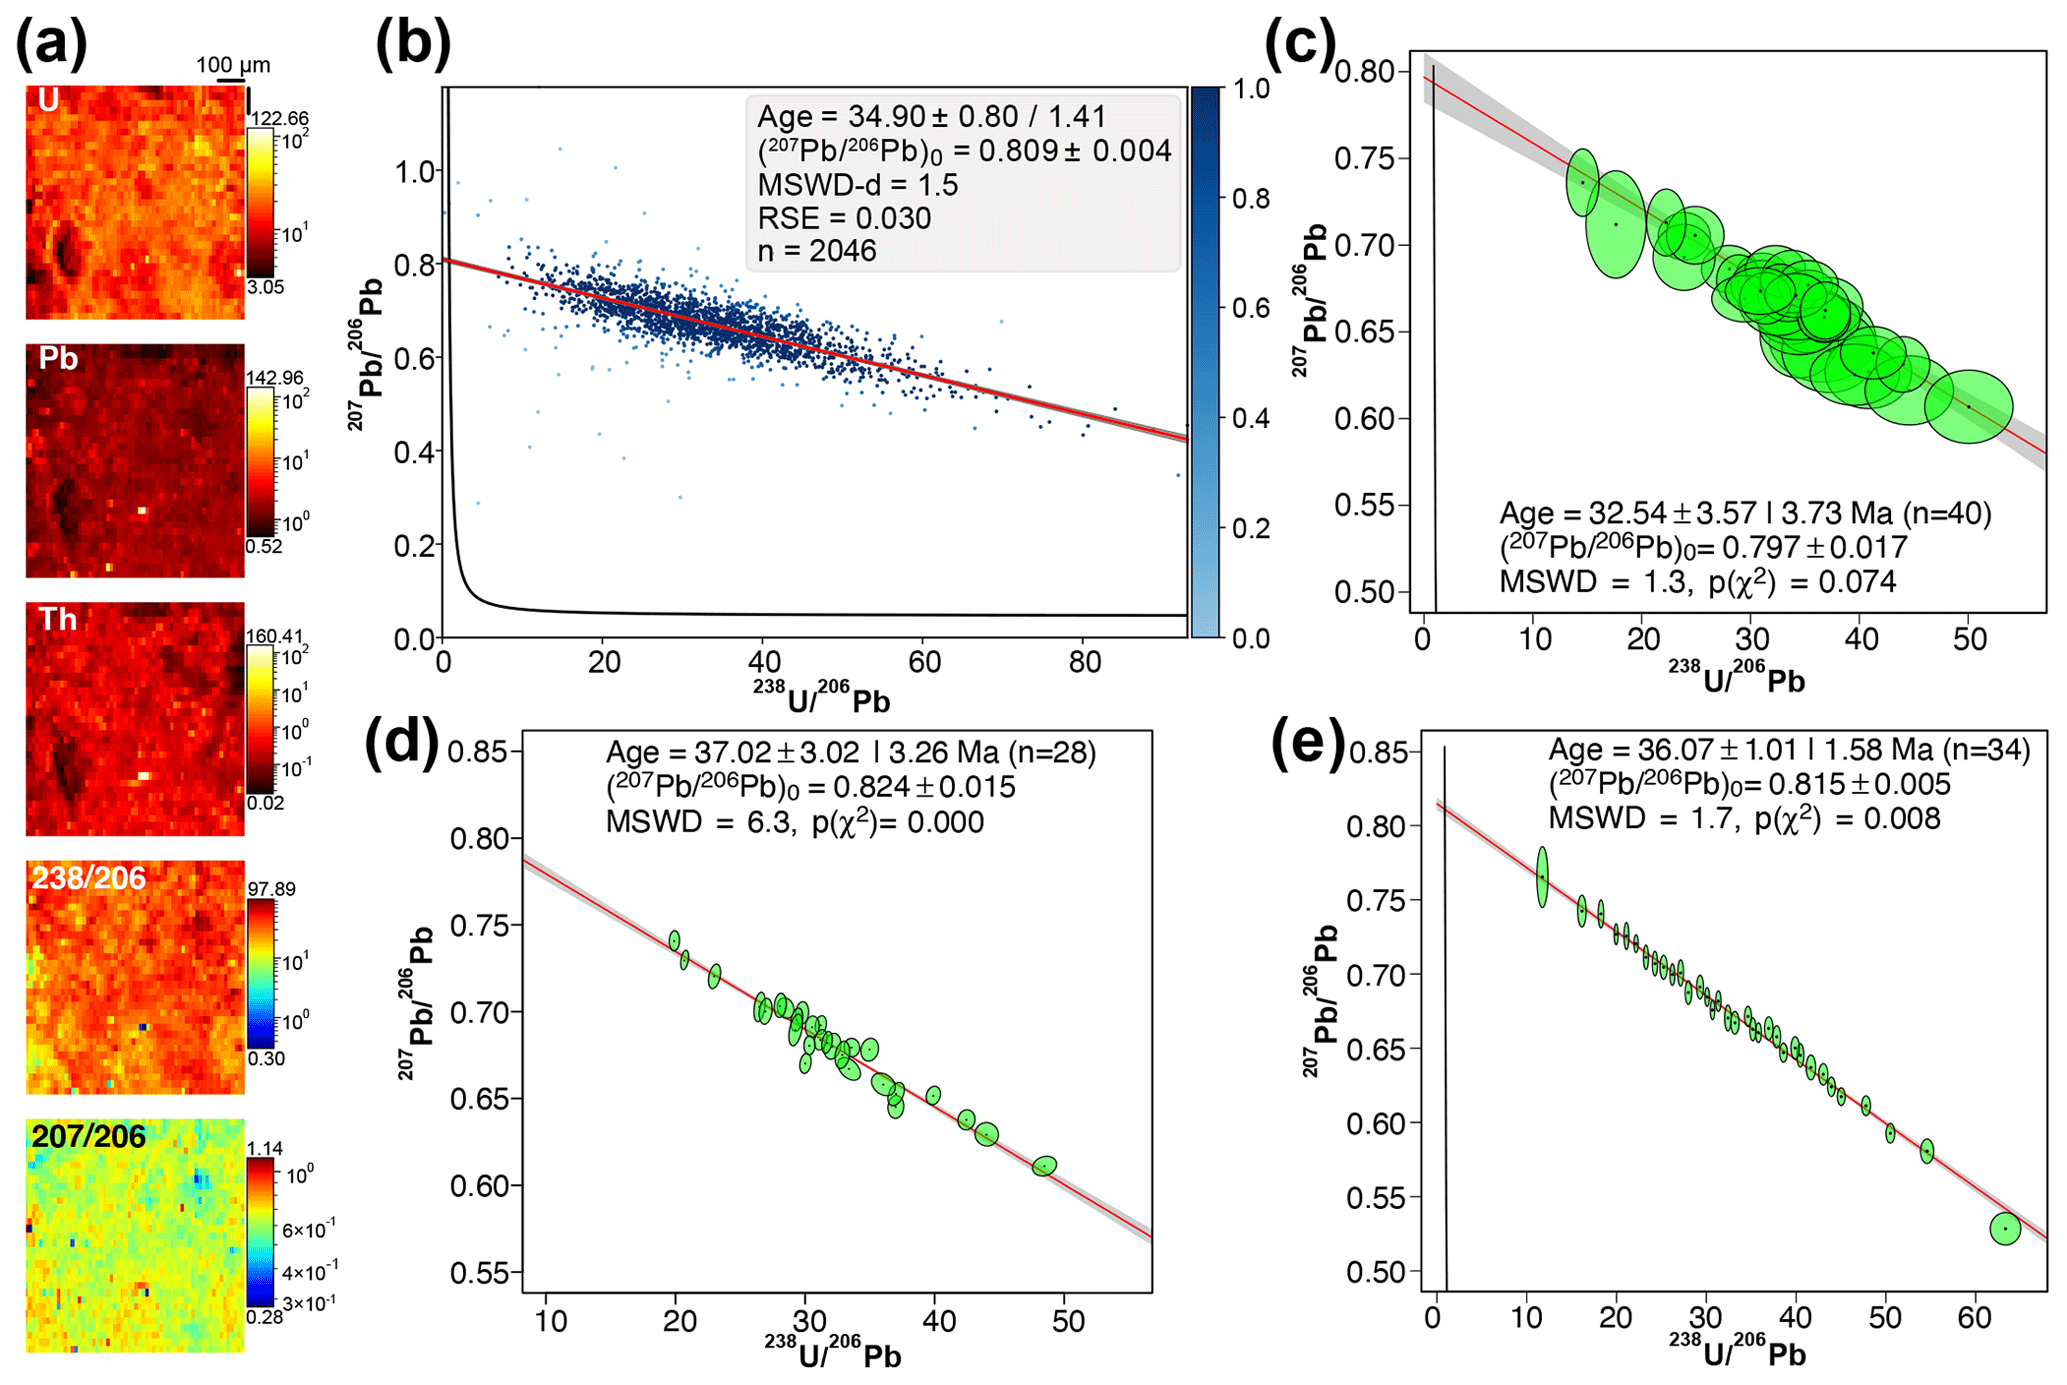
Figure 5Results obtained for sample PGX32-2. (a) Semi-quantitative element concentrations in parts per million (U, Pb and Th) and 238U ∕ 206Pb–207Pb ∕ 206Pb isotopic maps. (b) TW concordia plot calculated by robust regression. (c) TW concordia plot calculated from discretisation of the isotopic map (pseudo-spots). (d) TW concordia plot obtained from LA-ICP-MS spot analyses. (e) TW concordia plot obtained with the approach of Drost et al. (2018).
3.1.5 JS4 (run 1)
This Carboniferous–Permian lacustrine limestone sample, characterised by high U concentrations (mean ∼ 10 ppm), was previously dated by Drost et al. (2018). These authors obtained precise ages of at 300.8 ± 3.7, 299.6 ± 4.0 and 298.9 ± 5.6 Ma for the TW, 86TW and isochron diagrams respectively. The ages calculated with the robust regression from pixel U ∕ Pb and Pb ∕ Pb ratios (Kerstin Drost, personal communication, 2020) are similar to the previous ages (298.9 ± 3.4, 297.0 ± 3.4 and 300.8 ± 2.8 Ma for the TW, 86TW and isochron diagrams respectively; only the TW concordia plot is shown in Fig. 6a) (Table 1). The very good statistics of the regressions (MSWD-d ≤ 1.0, RSE < 5.5 % of the Pb0 value) is explained by the large spread of the ratios, defining a clear linear trend in the different plots. Note that to concur with the results given by Drost et al. (2018), these ages are without systematic uncertainties. Adding them leads to final age uncertainties above 8.0 Ma (Fig. 6a).
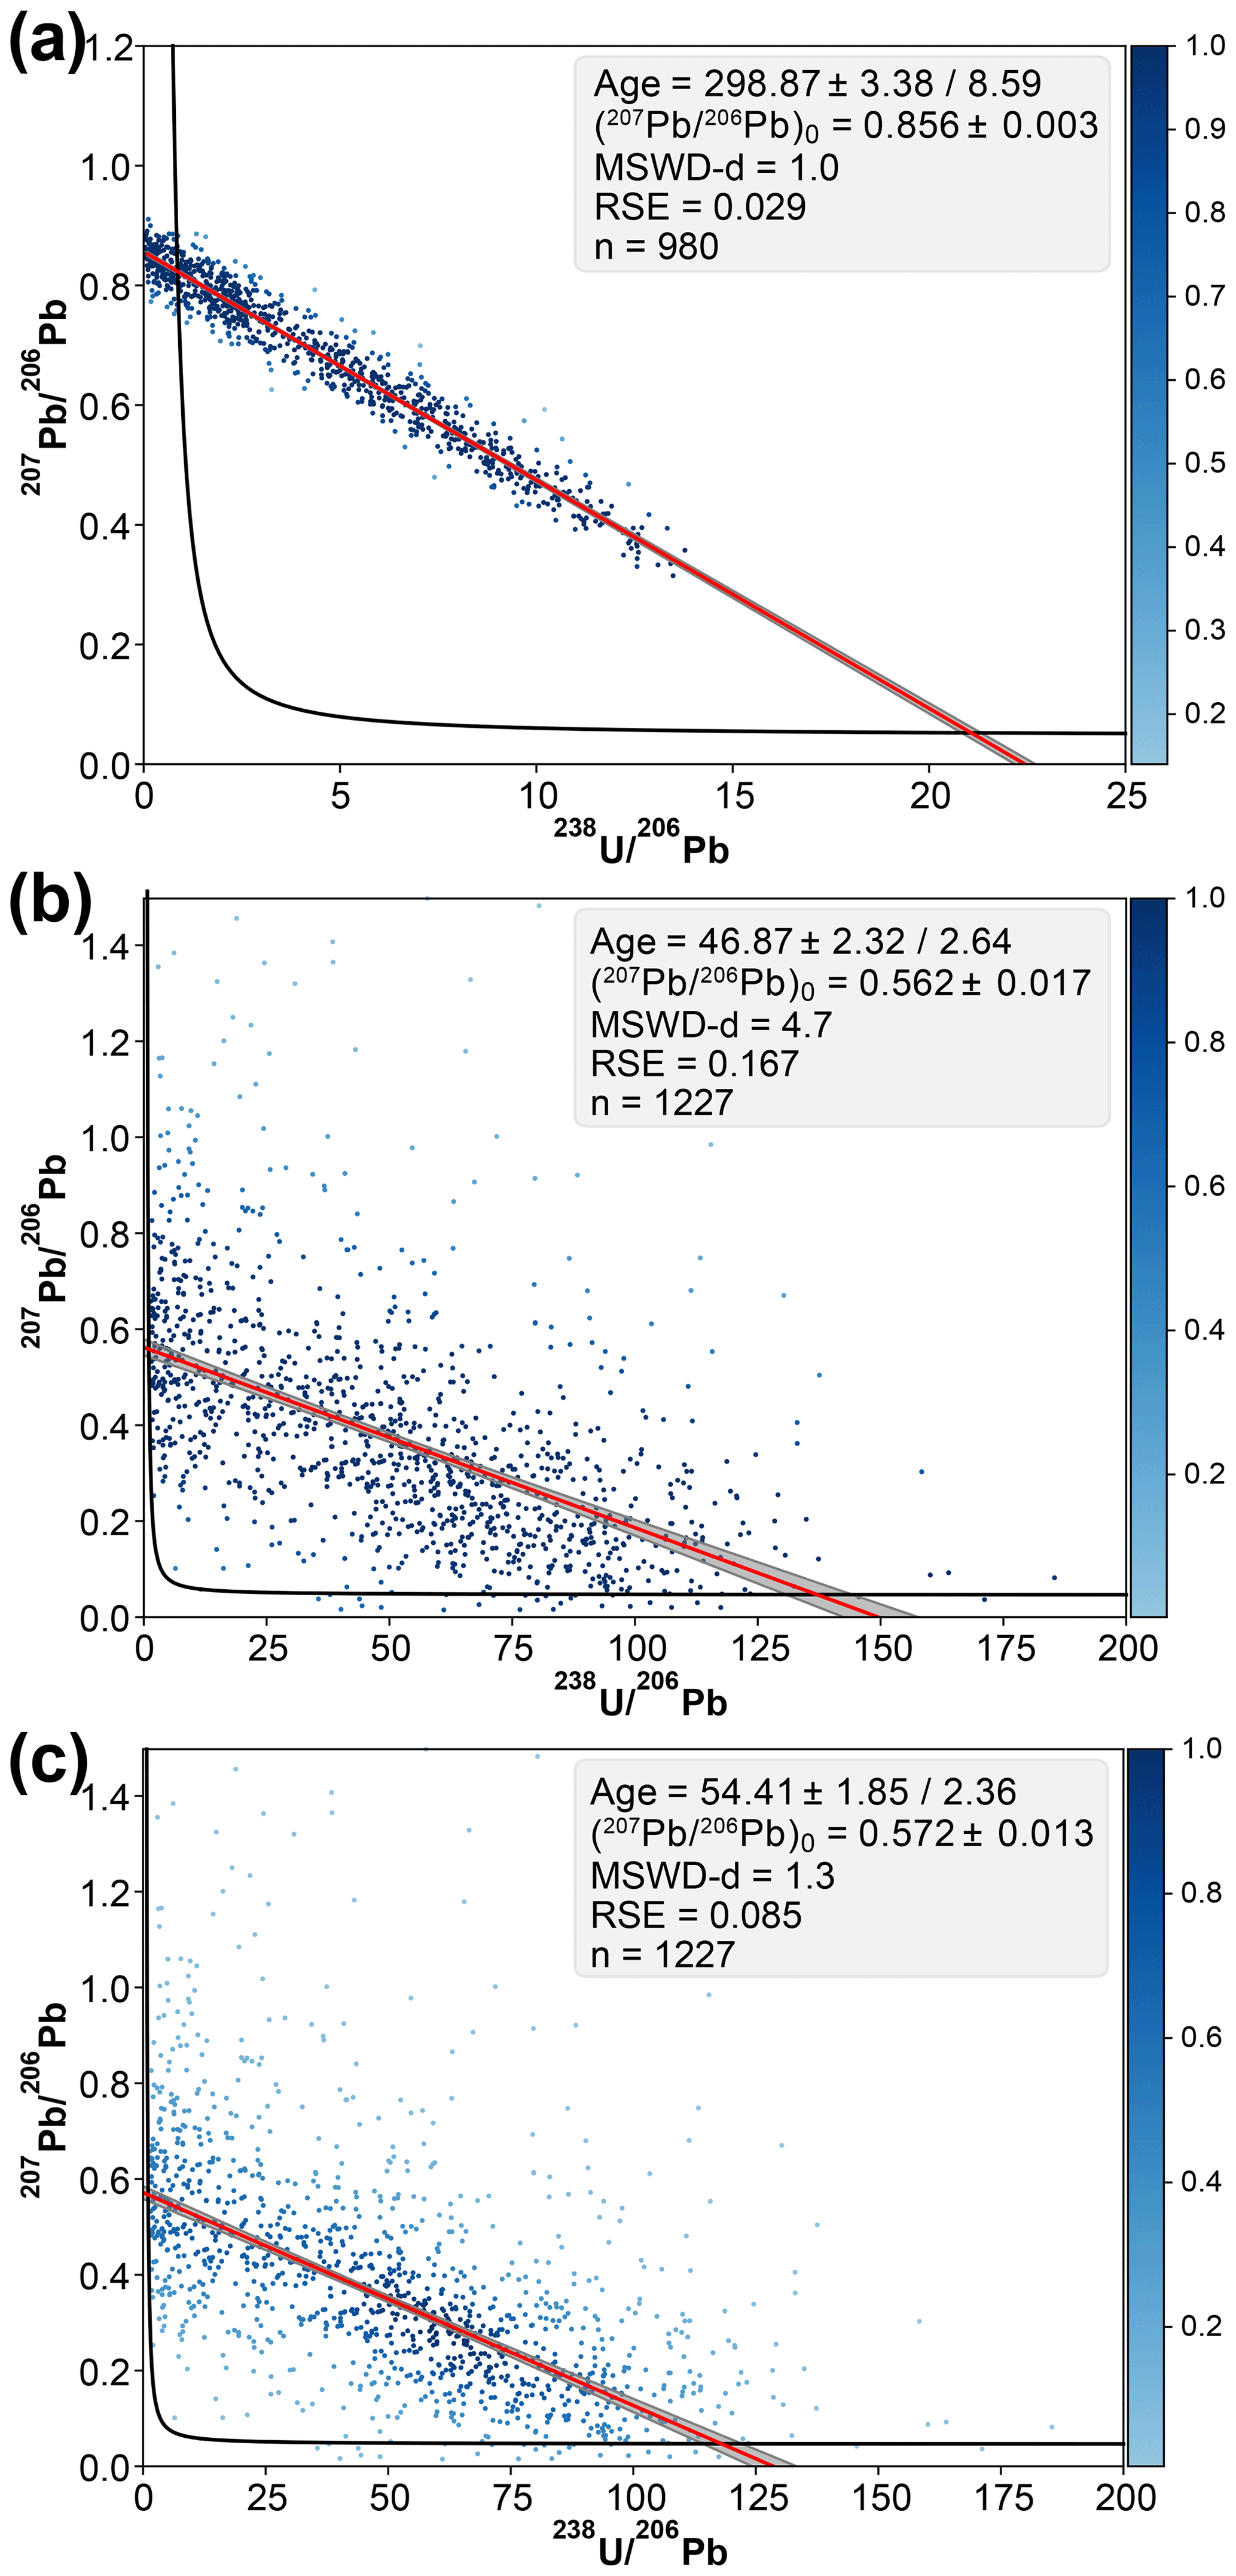
Figure 6Results obtained for samples JS4 (a) and BM18 (b, c). (a) TW concordia plot calculated by robust regression for sample JS4. (b, c) TW concordia plots calculated by robust regression for sample BM18. Pixels with 238U ∕ 206Pb values higher than 200 are not shown (n = 4). In panel (c), the robust regression is weighted, with pixel weights calculated from a 2D kernel density estimate (see text for details).
3.1.6 BM18
Unlike JS4, the BM18 sample, a tectonic calcite vein, is characterised by low U and Pb concentrations (mean of ∼ 200 ppb and ∼ 7 ppb respectively). It was dated precisely to 59.5 ± 2.7 Ma (MSWD = 2.5) by LA-ICP-MS spot analysis, owing to a large, linear spread of the individual ellipses in the TW space (Beaudoin et al., 2018). A similar age (61.0 ± 1.7 Ma in the TW space, MSWD = 1.1) was obtained by Roberts et al. (2020) with the pixel-pooling approach of Drost et al. (2018), despite a large scatter of the pixel U ∕ Pb and Pb ∕ Pb isotopic ratios (Fig. 6b). Applying robust regression to these data does not allow the expected age to be reproduced. When systematic uncertainties similar to those of Beaudoin et al. (2018) are considered, the ages obtained are 46.9 ± 2.8 and 48.4 ± 2.5 Ma for the TW (Fig. 6b) and 86TW diagrams (not shown) respectively, which is more than 10 Ma younger than the expected age (Table 1). In contrast, for the isochron diagram, the age of 60.9 ± 2.1 Ma (not shown) is in line with expectations. Added to high RSE values (> 10 % of the Pb0 value), as well as MSWD-d values ranging from 2.5 to 4.9, these variable ages would lead us to consider the ages as unreliable. The discrepancy between the ages is due to the presence of pixels with high U ∕ Pb ratios, acting as leverage points for the robust regression in the TW and 86TW diagrams.
In order to get closer to the expected age, we added weights to the pixel values used in the robust regression, as is possible with the lmrob library. The weights are based on the density of pixels in each plot, as estimated by a Gaussian kernel density estimate (KDE), the bandwidth of which is estimated by Scott's rule (Scott, 1992). In the case of a large dispersion of the data (in particular linked to the counting statistics, even for a sample of homogeneous age), it is expected that the majority of the points will be grouped along the isochron (i.e. higher density). The use of this approach for the TW and 86TW diagrams gives values similar in uncertainties to that of Beaudoin et al. (2018) but still centred on younger ages (54.4 ± 2.6 and 55.0 ± 2.5 Ma for the TW and 86TW diagrams respectively; Fig. 6c). However, the ages obtained with the three diagrams are not similar within uncertainties, which would again lead to the rejection of the analysis or, as the ages are close to each other, to the consideration that the real age is probably between ∼ 52 and ∼ 63 Ma. Using the approach of Drost et al. (2018), an age of 60.0 ± 2.8 Ma (MSWD = 0.95) is obtained for the TW diagram (Fig. S3), i.e. slightly younger than the value presented in Roberts et al. (2020). Doing the same calculation for the TW86 and isochron diagrams (not presented in Roberts et al., 2020) gives values of 55.6 ± 2.9 Ma (MSWD = 1.0) and 60.1 ± 6.4 Ma (MSWD = 0.5) respectively (not shown). The three ages are centred between 55 and 60 Ma; therefore, they are identical to those obtained with the robust regression, but they are also similar to each other within uncertainties. Thus, for this sample of low U and Pb concentrations, the ages calculated with the approach of Drost et al. (2018) are more reliable than with the robust regression (weighted or not), despite a Pb0 value (∼ 0.700) higher than that expected on the basis of spot analyses (∼ 0.590; Beaudoin et al., 2018).
3.2 Unknown samples
3.2.1 ETC2
The isotopic map of this sample (Fig. 7a), taken from a tectonic breccia in the Basque Country (France), was made through several calcite cements as clearly shown in the cathodoluminescence (CL) images (Fig. 7b). The latter are characterised by variable U contents (below the detection limit to > 200 ppm; Fig. 7a). Most pixels have a low U ∕ Pb ratio (< 10), and some dispersion in the 207Pb ∕ 206Pb values for the weakly radiogenic pixels can be noticed (Fig. 7c). However, the U ∕ Pb and Pb ∕ Pb ratios of several pixels define a clear linear trend (Fig. 7c), allowing age calculation. The age obtained from the pseudo-spots is 100.2 ± 10.1 Ma (Fig. 7d, Table 1). Those obtained with the robust regression are identical, within the limits of uncertainty: 96.1 ± 3.9 Ma and 96.5 ± 4.0 for the respective TW (Fig. 7c) and 86TW plots (Fig. S3) and an age of 95.6 ± 3.3 Ma for the isochron plot (Fig. S3). These similar ages are consistent with the good statistical parameters obtained from the robust regression (MSWD-d < 1.2, RSE lower than 8.5 % of the Pb0 value). However, both the maps of pixel concentration values and the co-localisation analysis of image data demonstrate that the overdispersion of 207Pb ∕ 206Pb values are located in a restricted area of the map corresponding to one cement (cement C1 on the CL image, Fig. 7b), whereas the highest 238U ∕ 206Pb (i.e. most radiogenic values) that drive the age are located in another restricted area corresponding to another cement (cement C2 on the CL image) (Fig. 7e). Lead by the co-localisation study, the selection of a small area of the map corresponding to cement C2 results in similar but more accurate age calculations than considering the entire map (97.4 ± 3.5 Ma for the TW plot, Fig. 7f; 96.9 ± 3.5 Ma for the 86TW plot, Fig. S3; and 95.5 ± 3.3 Ma for the isochron plot, Fig. S3). The statistical parameters are also better, despite a number of pixels divided by 3 (MSWD-d < 0.9, RSE lower than 5 % of the Pb0 value). This demonstrates the relevance of the co-localisation approach for age calculation with the robust regression approach, especially when the analytical conditions do not allow trace elements to be analysed at the same time as U and Pb. In contrast, regarding the approach of Drost et al. (2018), the ages obtained from the selected area of the map are less precise than those calculated from the entire map (96.4 ± 6.5 versus 97.9 ± 4.7 Ma for the TW plot, Figs. 7g and S3; 98.0 ± 6.1 versus 100.0 ± 5.0 Ma for the TW86 plot, not shown; and 95.0 ± 7.5 versus 97.1 ± 5.6 Ma for the TW plot, not shown). This is explained by the lower number of ellipses governing the regression.

Figure 7Results obtained for sample ETC2. (a) Semi-quantitative element concentrations in parts per million (U, Pb and Th) and 238U ∕ 206Pb–207Pb ∕ 206Pb isotopic maps. Black frames correspond to the image subset selected by co-localisation. (b) Cathodoluminescence image of an area close to that of the image map. Three distinct cements are distinguished (C1 to C3). (c) TW concordia plot with ages and their uncertainty calculated by robust regression for the entire map. (d) TW concordia plot calculated from discretisation of the entire isotopic map (pseudo-spots). (e) 207Pb ∕ 206Pb–238U ∕ 206Pb scatter plot obtained with the ScatterJn plugin from the isotopic maps. Red dots correspond to the pixels of the image subset (black frame in panel a and on the uranium concentration map where the approximate location of distinct cement is given). (f) TW concordia plot with ages and their uncertainty calculated by robust regression for the image subset. (g) TW concordia plot obtained with the approach of Drost et al. (2018) for the entire isotopic map.
Finally, in the case of the isotopic image made on the ETC2 sample, the robust regression approach appears to be the most precise. The age obtained indicates cement precipitation during the rifting event that affected the area before the Iberian–Eurasian convergence, which led to the formation of the Pyrenees from the Campanian (Mouthereau et al., 2014).
3.2.2 ARB
ARB sample is a single, homogenous calcite cement partially filling a tectonic breccia. It has a mean U content of ∼ 1.9 ppm (Fig. 8a) and a large spread of the pixel U ∕ Pb and Pb ∕ Pb ratios (∼ 0.2 to ∼ 106.0 for 238U ∕ 206Pb), defining a linear trend (Fig. 8b). Using the robust regression, the calculated ages for this sample are 106.5 ± 3.8 Ma for the TW concordia plot (Fig. 8b), 107.4 ± 3.8 Ma for the 86TW plot (Fig. S3) and 109.7 ± 3.7 Ma for the isochron if the entire image is considered (Table 1; Fig. S3). Again, these values are similar within uncertainties and similar to the age obtained from the pseudo-spots (108.4 ± 8.1 Ma; Fig. 8d). The slight differences in age between the types of plots (< 3 %) may be related to the high RSE (9 % to 18 % of the Pb0 value), which indicates some dispersion around the regression line, despite MSWD-d values lower than two. Likewise, the ages obtained by the method of Drost et al. (2018) are slightly variable, although consistent with previous ages within the limits of uncertainties (111.0 ± 4.2 Ma for the TW plot, Fig. 8e; 110.6 ± 3.9 for the 86TW plot, not shown; and 105.3 ± 4.6 Ma for the isochron plot, not shown; with MSWDs of 2.6, 2.5 and 1.1 respectively). For the robust regression, the co-localisation study indicates that among the more distant points from the regression line in the concordia TW plot, almost all correspond to pixels located in the left quarter of the isotope map, where the U and Pb concentrations are the lowest (Fig. 8a). The age uncertainties obtained without considering these pixels are slightly better than those obtained with the entire map: 107.0 ± 3.8 Ma for the TW concordia plot (Fig. 8c), 107.8 ± 3.8 Ma for the 86TW plot (Fig. S3) and 109.7 ± 3.7 Ma for the isochron plot (Fig. S3). However, contrary to ETC2, the statistical parameters are not better (MSWD-d between 1.4 and 2.4, and RSE between 9.5 and 18.0 % of the Pb0 value) due to the disappearance of several pixels located close to the robust regression line. In contrast, applying the method of Drost et al. (2018) to the map subset results in better age uncertainties and MSWD values compared with the entire isotopic map, with values of 110.5 ± 4.0 Ma for the TW concordia plot (MSWD = 2.0; Fig. S3), 110.4 ± 3.8 Ma for the 86TW plot (MSWD = 1.1; not shown) and 104.7 ± 4.4 Ma for the isochron plot (MSWD = 0.6; not shown).
Taken together, the ETC2 and ARB samples suggest that the emplacement of tectonic breccia in the western Pyrenees was related to extensive syn-rift fault development, rather than to the subsequent tectonic inversion.

Figure 8Results obtained for sample ARB. (a) Semi-quantitative element concentrations in parts per million (U, Pb and Th) and 238U ∕ 206Pb–207Pb ∕ 206Pb isotopic maps. (b) TW concordia plot with ages and their uncertainty calculated by robust regression. Pixels with 238U ∕ 206Pb and 207Pb ∕ 206Pb values above 80 and 1.4 respectively are not shown (n = 11). Panel (c) is the same as panel (b), except that the pixels outside the black frames on the isotopic maps in panel (a) were not considered in the age calculation, based on the co-localisation study. (d) TW concordia plot calculated from discretisation of the entire isotopic map (pseudo-spots). (g) TW concordia plot obtained with the approach of Drost et al. (2018) for the entire isotopic map.
3.2.3 C6-265-D5
This sample is a dolomite vein from the northern Pyrenees, presumably formed in a tectonic context identical to ETC2 and ARB samples. Its mean U and Pb contents are low (230 and 60 ppb respectively; Fig. 9a), and a large scatter of the U ∕ Pb and Pb ∕ Pb pixel isotope ratios can be evidenced (Fig. 9b). As a result, the age calculated from the pseudo-spots has large uncertainties (115.2 ± 17.4 Ma; Fig. 9c; Table 1), and the use of robust regression does not make it possible to obtain consistent ages between the three types of plots (84.5 ± 4.7, 82.4 ± 4.4 and 105.3 ± 3.6 Ma for the TW, 86TW and isochron plots respectively; Figs. 8b and S3). These ages are associated with MSWD-d values close to unity but very high RSE values (21 % to 28 % of the Pb0 value). Weighting the regression by KDE for the three plots (according to the method presented for sample BM18) allows one to resolve these inconsistencies (97.0 ± 5.7, 94.5 ± 5.3 and 93.7 ± 4.5 Ma for the TW, 86TW and isochron plots respectively) and to get better statistical parameters (MSWD-d = 0.8 to 1, and RSE = 10 % to 21 % of the Pb0 value) (Figs. 9d, S3). However, the new ages are outside the uncertainty of those obtained from the pseudo-spots (i.e. younger), which calls their reliability into question. On the other hand, the ages calculated by the method of Drost et al. (2018) are also comparable to those calculated from the pseudo-spots, with values of 110.3 ± 6.2, 102.7 ± 6.2 and 104.7 ± 7.8 for the TW (Fig. 8e), 86TW and isochron plots respectively and with MSWD values lower than 1.8. It therefore seems that, in a manner analogous to BM18, the results obtained by robust regression for C6-265-D5 are less reliable than those obtained by the pixel-pooling approach of Drost et al. (2018), except for the isochron plots. Nevertheless, although they are obtained on dolomite and therefore possibly biased by a matrix effect (Elisha et al., 2020), these ages are consistent with those obtained for samples ETC2 and ARB, which once again suggests a link with the rifting event recorded in the Pyrenees during the Cretaceous.
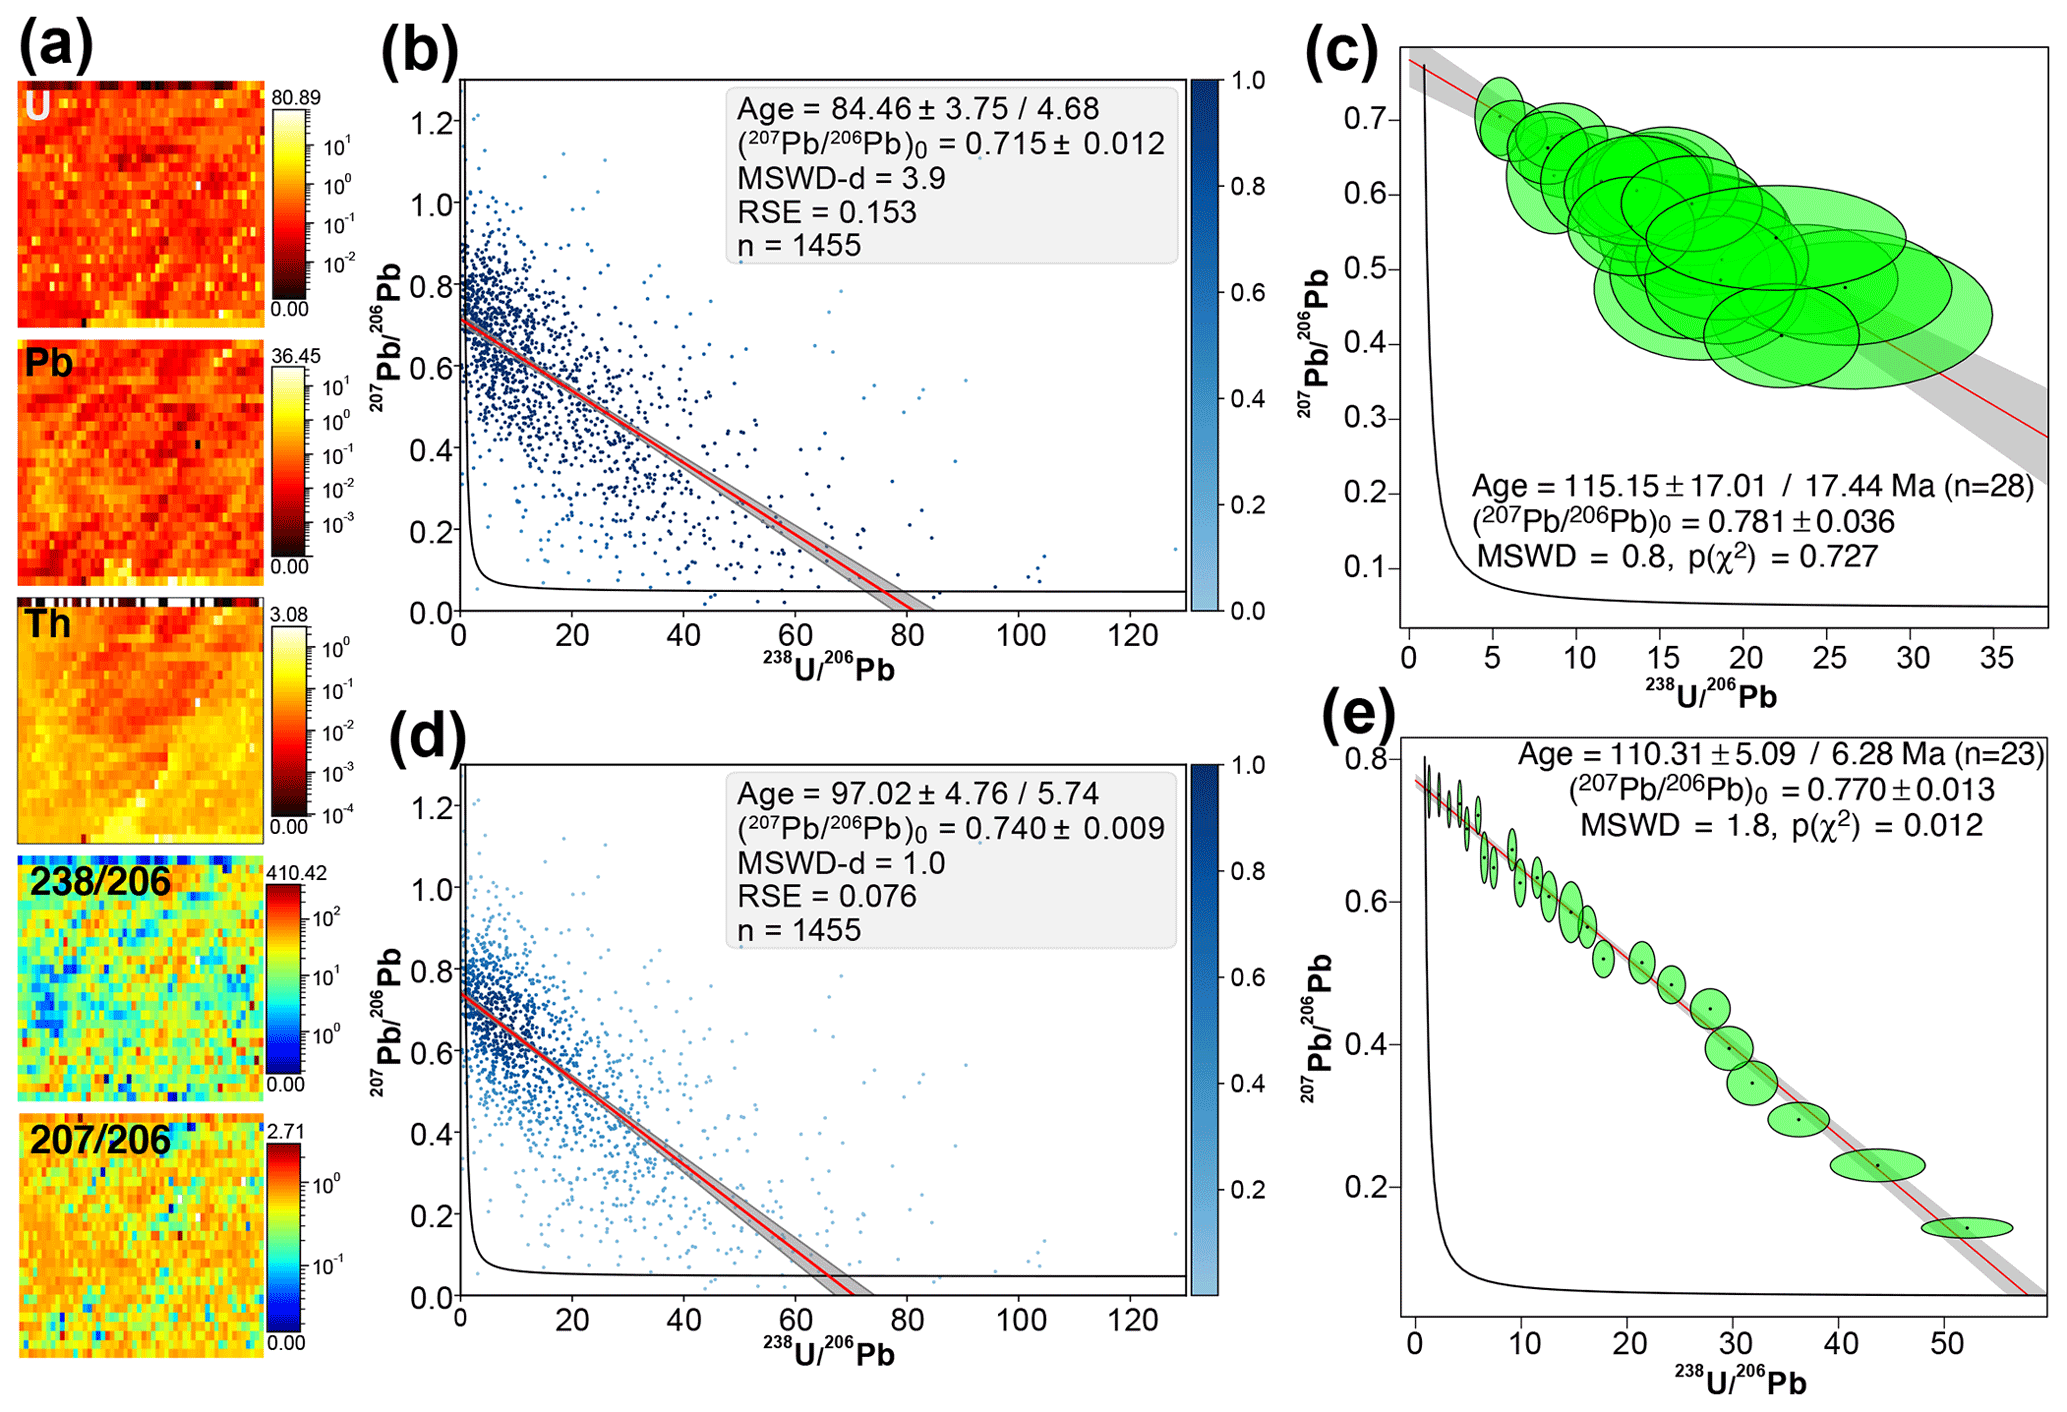
Figure 9Results obtained for sample C6-265-D5. (a) Semi-quantitative element concentrations in parts per million (U, Pb and Th) and 238U ∕ 206Pb–207Pb ∕ 206Pb isotopic maps. (b) TW concordia plot with ages and their uncertainty calculated by robust regression. Pixels with 238U ∕ 206Pb and 207Pb ∕ 206Pb values above 130 and 1.3 respectively are not shown (n = 13). (c) TW concordia plot calculated from discretisation of the isotopic map (pseudo-spots). (d) TW concordia plots calculated by weighted robust regression, with pixel weights calculated from a 2D kernel density estimate. (e) TW concordia plot obtained with the approach of Drost et al. (2018).
4.1 Interest of dating from isotope maps
The pioneering work of Drost et al. (2018) has shown the obvious value of the isotope map dating approach, where data on minor and trace element concentrations are used to select the most suitable pixels for age determination. This initial step seems essential and should be followed up systematically if the analytical conditions allow for it (e.g. use of an ICP-MS with a fast mass scan such as a quadrupole or time of flight). If not, the operator must remain attentive to the quality of the data by checking the scattering of the pixels around the regression lines and the possible presence of phase mixtures. The use of a co-localisation approach as presented in our study can be an alternative way, although less efficient, of carrying out this careful study of the spatial distribution of the furthest pixel values from the regression line. However, the examples presented above, in particular that of the ETC2 sample, show that co-localisation is more suited to the robust regression approach than to that of pixel pooling. In any case, it is fundamental to carry out an initial petrographic characterisation of the samples as recalled by Roberts et al. (2020). Taking these precautions into account, our results and those of Drost et al. (2018) and Roberts et al. (2020) show that the ages obtained from the image-mapping approach are perfectly comparable, both in value and uncertainty, with those obtained from more common methods (LA-ICP-MS spot analysis and isotope dilution). Additionally, it should be pointed out that this approach has several advantages in comparison with the more common ones. First, the image-mapping approach is particularly suitable for easily dating multiple generations of cements filling porosities or fractures. Such an approach is fast and simple to set up, as it is sufficient to map a large portion of the sample while covering several generations of cements with a number of pixels high enough for age calculation; the user can then select the pixels (preferentially by a geochemical approach) corresponding to the different cements to calculate the ages. This methodology has been carried out successfully on sample ARB with co-localisation. Second, contrary to spot analyses, the simultaneous mapping of trace elements useful for both geochemical characterisation and for dating makes it possible to gather all of the necessary information in a single analysis, without changing the analytical parameters of the LA-ICP-MS, which may save a considerable amount of time. Third, a complete isotope map can be acquired very quickly (less than 30 min, without the reference materials). This allows one to consider the analysis of many samples over a limited number of analytical sessions. Therefore, it is likely that this method of U–Pb dating of carbonates will develop rapidly in the geochronology community, alongside the now well-established LA-ICP-MS spot analysis approach.
4.2 Benefits and limitations of the robust regression to U–Pb image dating
The data processing method presented here, namely robust regression through the isotope ratio values of the pixels represented in TW or isochron diagrams, is simple and allows a fast age determination including its uncertainty. We recall, as previously mentioned, the importance of a preliminary selection of these pixels on the basis of the concentrations of trace elements of the carbonates analysed. As an alternative to the data-pooling approach presented by Drost et al. (2018), it has the advantage of not involving the operator in the choice of the number of pixels in each pseudo-analysis, as all pixels are considered for a single regression. Their representation in the appropriate diagrams gives a quick idea of the quality of the data, assisted by statistical parameters such as the RSE or MSWD-d. Note that the interest in using robust regression for U–Pb dating was already underlined by Powell et al. (2002) and very recently by Powell et al. (2020). It is also implemented in the famous Isoplot software (Ludwig, 2012). Ludwig (2012) stressed the precautions to be taken when using robust regression to construct isochrons, as the absence of uncertainties on each point makes it impossible to distinguish the share of scatter around the regression due to “geological/geochemical complications” from the scatter due to analytical errors alone. In conventional spot analyses, the MSWD calculation is an efficient way to determine the share of each source of uncertainty. Its use in the context of dating from isotopic images, whether with the approach of Drost et al. (2018) or our own, does not solve this problem as the MSWD is calculated from an “artificial” grouping of pixels whose associated ellipses do not represent analytical uncertainties. At most, the MSWD (or MSWD-d) is here a means of verifying the correct alignment of values in the TW and isochron diagrams, with values close to one indicating good alignment, information that can be complemented by the moving average calculation as we propose, among other possibilities. For example, the very recent approach proposed by Powell et al. (2020), with calculation of a normalised (robust) median of the absolute values of the residuals, could provide a suitable means to distinguish isochrons from errorchrons. This still has to be implemented in our data reduction scheme.
Among the negative points of the robust regression, the example of samples BM18 and C6-265-D5 shows the sensitivity of the method to the dispersion of the U ∕ Pb and Pb ∕ Pb ratios. For this type of low-U sample, where noisy data are linked to low counting statistics, the ages calculated without weighting are too young for the TW and 86TW plots. They are also inconsistent between the TW, 86TW and isochron plots. This would lead to rejecting samples which, with the method proposed by Drost et al. (2018), are validated by obtaining consistent ages not only between the different diagrams but also with those obtained by spot or by pseudo-spot analyses. Weighting the robust regression by KDE improves the results by giving consistent ages between the diagrams. However, the comparison with the expected ages shows that the ages calculated in this way are too young by around 5 % to 10 % (55–60 Ma instead of 60 Ma for BM18, and 94–97 Ma instead of 118 Ma for C6-265-D5). For such samples, the tests carried out show the greatest reliability of the method of Drost et al. (2018) for image-based dating. However, as this latter approach might give erroneous Pb0 values (example of BM18), we argue that LA-ICP-MS spot analyses should be preferred when U concentrations are far below parts per million.
U–Pb LA-ICP-MS carbonate dating from isotope images is an extremely recent approach that, compared with more common dating methods such as LA-ICP-MS spot analyses, has the great advantage of allowing the use of images for both sample screening and dating. In this contribution, U–Pb ages of several carbonate samples were obtained from micron-scale LA-ICP-MS isotopic maps, using a new, alternative data processing method based on robust regression. The method, which is very simple to set up, consists of extracting the U ∕ Pb and Pb ∕ Pb pixel values from the image, plotting them in a diagram used for dating (such as a concordia diagram) and performing robust regression to calculate the age. Prior to dating, we also conducted a co-localisation study of the sample isotope ratios that was used to locate the most suitable areas for age determination. For most samples that had already been dated by U–Pb geochronology using conventional LA-ICP-MS spot analysis or isotope dilution, the robust regression approach method provided similar ages and sometimes better uncertainties compared with both others methods, with an ablation duration of less than 40 min. For low-U samples with noisy U ∕ Pb and Pb ∕ Pb pixel values, however, the ages were biased towards overly young values by 5 % to 10 %. In this case, the existing image-based dating approach of Drost et al. (2018) gave better results. Thus, the robust regression processing of LA-ICP-MS isotope map data appears to be a simple means to proceed to carbonate U–Pb geochronology, provided that a careful examination of the pixel ratio data is performed beforehand.
The methodology for LA-ICP-MS spot analyses, the screening maps and the plots used for age calculations are presented in the Supplement. The pixel values of the isotopic images for the masses 238, 232, 208, 207 and 206 are presented in Table S1 in the Supplement.
The supplement related to this article is available online at: https://doi.org/10.5194/gchron-3-67-2021-supplement.
GH, FC and CPe designed the experiments. GH, FC, CPe, PAG and GM carried them out. GH and CPa developed the model code and performed the simulations. OC and JPG supervised the project and provided the financial support for most experiments. GH prepared the paper with contributions from all co-authors.
The authors declare that they have no conflict of interest.
This article is part of the special issue “In situ carbonate U–Pb geochronology”. It is a result of the Goldschmidt conference, Barcelona, Spain, 18–23 August 2019.
The authors are grateful to Gaëlle Barbotin for help during the analytical sessions. Jose Ignacio Canudo is warmly thanked for a discussion on the comparison of U–Pb and biostratigraphic ages in the Jaca Basin. The initial paper was greatly improved by comments from the two anonymous reviewers.
This work benefited from funding from the Universite de Pau et des Pays de l'Adour (AAP Incitatif Recherche) and from Total SA (project DAC).
This paper was edited by Axel Gerdes and reviewed by two anonymous referees.
Aramendía, M., Rello, L., Bérail, S., Donard, A., Pécheyran, C., and Resano, M.: Direct analysis of dried blood spots by femtosecond-laser ablation-inductively coupled plasma-mass spectrometry. Feasibility of split-flow laser ablation for simultaneous trace element and isotopic analysis, J. Anal. Atom. Spectrom., 30, 296–309, 2015.
Ballihaut, G., Claverie, F., Pécheyran, C., Mounicou, S., Grimaud, R., and Lobinski, R.: Sensitive Detection of Selenoproteins in Gel Electrophoresis by High Repetition Rate Femtosecond Laser Ablation-Inductively Coupled Plasma Mass Spectrometry, Anal. Chem., 79, 6874–6880, 2007.
Beaudoin, N., Lacombe, O., Roberts, N. M. W., and Koehn, D.: U-Pb dating of calcite veins reveals complex stress evolution and thrust sequence in the Bighorn Basin, Wyoming, USA, Geology, 46, 1015–1018, https://doi.org/10.1130/G45379.1, 2018.
Canudo, J. I. and Molina, E.: Biocronología de foraminíferos planctónicos de la secuencia deposicional de Jaca (Pirineo Aragonés): Eoceno medio y superior, in: Proceedings of the II Congreso Geológico de España, Granada, Spain, 273–276, 1988 (in Spanish).
Drost, K., Chew, D., Petrus, J. A., Scholze, F., Woodhead, J. D., Schneider, J. W., and Harper, D. A. T: An image mapping approach to U-Pb LA-ICP-MS carbonate dating and applications to direct dating of carbonate sedimentation, Geochem., Geophy., Geosy., 19, 46314648, https://doi.org/10.1029/2018GC007850, 2018.
Elisha, B., Nuriel, P., Kylander-Clark, A., and Weinberger, R.: Towards in-situ U–Pb dating of dolomites, Geochronology Discuss. [preprint], https://doi.org/10.5194/gchron-2020-19, in review, 2020.
Godeau, N., Deschamps, P., Guihou, A., Leonide, P., Tendil, A., Gerdes, A., Hamelin, B., and Girard, J.-P.: U-Pb dating of calcite cement and diagenetic history in microporous carbonate reservoirs: Case of the Urgonian Limestone, France, Geology, 46, 247–250, https://doi.org/10.1130/G39905.1, 2018.
Gradstein, F. M, Ogg, J. G., Schmitz, M. D., Ogg, G. M., Agterberg, F. P., Anthonissen, D. E., Becker, T. R., Catt, J. A., Cooper, R. A., Davydov, V. I., Gradstein, S. R., Henderson, C. M., Hilgen, F. J., Hinnov, L. A., McArthur, J. M., Melchin, M. J., Narbonne, G. M., Paytan, A., Peng, S., Peucker-Ehrenbrink, B., Pillans, B., Saltzman, M. R., Simmons, M. D., Shields, G. A., Tanaka, K. L.,Vandenberghe, N., Van Kranendonk, M. J., Zalasiewicz, J., Altermann, W., Babcock, L. E., Beard, B. L., Beu, A. G., Boyes, A. F., Cramer, B. D., Crutzen, P. J., van Dam, J. A., Gehling, J. G., Gibbard, P. L., Gray, E. T., Hammer, O., Hartmann, W. K., Hill, A. C., Paul F. Hoffman, P. F., Hollis, C. J., Hooker, J. J., Howarth, R. J., Huang, C., Johnson, C. M., Kasting, J. F., Kerp, H., Korn, D., Krijgsman, W., Lourens, L. J., MacGabhann, B. A., Maslin, M. A., Melezhik, V. A., Nutman, A. P., Papineau, D., Piller, W. E., Pirajno, F., Ravizza, G. E., Sadler, P. M., Speijer, R. P., Steffen, W., Thomas, E., Wardlaw, B. R., Wilson, D. S., and Xiao, S.: he Geologic Time Scale 2012, Elsevier, Boston, USA, 1129 pp., 2012.
Guillong, M., Wotzlaw, J.-F., Looser, N., and Laurent, O.: Evaluating the reliability of U–Pb laser ablation inductively coupled plasma mass spectrometry (LA-ICP-MS) carbonate geochronology: matrix issues and a potential calcite validation reference material, Geochronology, 2, 155–167, https://doi.org/10.5194/gchron-2-155-2020, 2020.
Hill, C. A., Polyak, V. J., Asmerom, Y., and Provencio, P. P.: Constraints on a Late Cretaceous uplift, denudation, and incision of the Grand Canyon region, southwestern Colorado Plateau, USA, from U-Pb dating of lacustrine limestone, Tectonics, 35, 896–906, https://doi.org/10.1002/2016TC004166, 2016.
Horstwood, M. S. A., Košler, J., Gehrels, G., Jackson, S. E., Mclean, N. M., Paton, C., Pearson, N. J., Sircombe, K., Sylvester, P., Vermeesch, P., Bowring, J. F., Condon, D. J., and Schoene, B.: CommunityDerived Standards for LA-ICP-MS U-(Th-)Pb Geochronology – Uncertainty Propagation, Age Interpretation and Data Reporting, Geostand. Geoanal. Res., 40, 311332, https://doi.org/10.1111/j.1751-908X.2016.00379.x, 2016.
Koller, M. and Stahel, W. A.: Sharpening Wald-type inference in robust regression for small samples, Comput. Stat. Data An., 55, 2504–2515, 2011.
Koller, M. and Stahel, W. A.: Nonsingular subsampling for regression S-estimators with categorical predictors, Computation. Stat., 32, 631–646, https://doi.org/10.1007/s00180-016-0679-x, 2017.
Li, Q., Parrish, R. R., Horstwood, M. S. A., and McArthur, J. M.: U-Pb dating of cements in Mesozoic ammonites, Chem. Geol., 376, 76–83, 2014.
Ludwig, K. R.: User's manual for Isoplot version 3.75–4.15: a geochronological toolkit for Microsoft Excel, Berkeley Geochronological Center Special Publication, Berkeley, CA, USA, 2012.
Maechler, M., Rousseeuw, P., Croux, C., Todorov, V., Ruckstuhl, A., Salibian-Barrera, M., Verbeke, T., Koller, M., Conceicao, E. L. T., and Anna di Palma, M.: robustbase: Basic Robust Statistics R package version 0.93-5, available at: http://CRAN.R-project.org/package=robustbase (last access: 1 April 2020), 2019.
Mochales, T., Pueyo, E. L., Casas, A. M., and Barnolas, A.: Restoring paleomagnetic data in complex superposed folding settings: the Boltaña anticline (Southern Pyrenees), Tectonophysics, 671, 281–298, 2016.
Mouthereau, F., Filleaudeau, P. Y., Vacherat, A., Pik, R., Lacombe, O., Fellin, M. G., Castelltort, S., Christophoul, F., and Masini, E.: Placing limits to shortening evolution in the Pyrenees: role of margin architecture and implications for the Iberia/Europe convergence, Tectonics, 33, 2283–2314, https://doi.org/10.1002/2014TC003663, 2014.
Nuriel, P., Craddock, J., Kylander-Clark, A. R., Uysal, T., Karabacak, V., Dirik, R. K., Hacker, B. R., and Weinberger, R.: Reactivation history of the North Anatolian fault zone based on calcite age-strain analyses, Geology, 47, 465–469, 2019.
Oms, O., Dinarès-Turell, J., and Remacha, E.: Magnetic stratigraphy from deep clastic turbidites: An example from the Eocene Hecho Group (southern Pyrenees), Studia Geophysica et Geodetica, 47, 275–288, 2003.
Parrish, R. R., Parrish, C. M., and Lasalle, S.: Vein calcite dating reveals Pyrenean orogen as cause of Paleogene deformation in southern England, J. Geol. Soc. London, 175, 425–442, https://doi.org/10.1144/jgs2017-107, 2018.
Powell, R., Woodhead, J., and Hergt, J.: Improving isochron calculations with robust statistics and the bootstrap, Chem. Geol., 185, 91–204, 2002.
Powell, R., Green, E. C. R., Marillo Sialer, E., and Woodhead, J.: Robust isochron calculation, Geochronology, 2, 325–342, https://doi.org/10.5194/gchron-2-325-2020, 2020.
Premoli Silva, I., Wade, B. S., and Pearson, P. N.: Taxonomy, biostratigraphy, and phylogeny of Globigerinatheka and Orbulinoides, in: Atlas of Eocene Planktonic Foraminifera, edited by: Pearson, P. N., Olsson, R. K., Hemleben, C., Huber, B. T., and Berggren, W. A., Cushman Foundation for Foraminiferal Research, Fredericksburg, USA, Special Publication, 41, 169–212, 2016.
Ring, U. and Gerdes, A.: Kinematics of the Alpenrhein-Bodensee graben system in the Central Alps: Oligocene/Miocene transtension due to formation of the Western Alps arc, Tectonics, 35, 1367–1391, https://doi.org/10.1002/2015TC004085, 2016.
Roberts, N. M. W. and Walker, R. J.: U-Pb geochronology of calcite-mineralized faults: Absolute timing of rift-related fault events on the northeast Atlantic margin, Geology, 44, 531–534, 2016.
Roberts, N. M. W., Rasbury, E. T., Parrish, R. R., Smith, C. J., Horstwood, M. S. A., and Condon, D. J.: A calcite reference material for LA-ICP-MS U-Pb geochronology, Geochem., Geophy., Geosy., 18, 2807–2814, https://doi.org/10.1002/2016GC006784, 2017.
Roberts, N. M. W., Drost, K., Horstwood, M. S. A., Condon, D. J., Chew, D., Drake, H., Milodowski, A. E., McLean, N. M., Smye, A. J., Walker, R. J., Haslam, R., Hodson, K., Imber, J., Beaudoin, N., and Lee, J. K.: Laser ablation inductively coupled plasma mass spectrometry (LA-ICP-MS) U–Pb carbonate geochronology: strategies, progress, and limitations, Geochronology, 2, 33–61, https://doi.org/10.5194/gchron-2-33-2020, 2020.
Scott, D. W.: Multivariate Density Estimation: Theory, Practice, and Visualization, John Wiley and Sons, New York and Chicester, USA, 1992.
Vermeesch, P.: IsoplotR: A free and open toolbox for geochronology, Geosci. Front., 9, 1479–1493, https://doi.org/10.1016/j.gsf.2018.04.001, 2018.
Wade, B. S., Pearson, P. N., Berggren, W. A., and Pälike, H.: Review and revision of Cenozoic tropical planktonic foraminiferal biostratigraphy and calibration to the geomagnetic polarity and astronomical time scale, Earth-Sci. Rev., 104, 111–142, 2011.
Woodhead, J. D. and Hergt, J. M.: Strontium, neodymium and lead isotope analyses of NIST glass certi?ed reference materials: SRM 610, 612, 614, Geostandard. Newslett., 25, 261–266, https://doi.org/10.1111/j.1751-908X.2001.tb00601.x, 2001.
Zeitvogel, F. and Obst, M.: ScatterJn: An ImageJ Plugin for Scatterplot-Matrix Analysis and Classification of Spatially Resolved Analytical Microscopy Data, J. Open Res. Softw., 4, e5, https://doi.org/10.5334/jors.89, 2016.