the Creative Commons Attribution 4.0 License.
the Creative Commons Attribution 4.0 License.
 | 16 Feb 2021
Thermal annealing of implanted 252Cf fission tracks in monazite
Andrew Gleadow
Barry Kohn
A series of isochronal heating experiments were performed to constrain monazite fission track thermal annealing properties. The 252Cf fission tracks were implanted into monazite crystals from the Devonian Harcourt granodiorite (Victoria, Australia) on polished surfaces oriented parallel to (100) pinacoidal faces and perpendicular to the crystallographic c axis. Tracks were annealed over 1, 10, 100 and 1000 h schedules at temperatures between 30 and 400 ∘C. Track lengths were measured on captured digital image stacks and then converted to calculated mean lengths of equivalent confined fission tracks that progressively decreased with increasing temperature and time. Annealing is anisotropic, with tracks on surfaces perpendicular to the crystallographic c axis consistently annealing faster than those parallel to the (100) face. To investigate how the mean track lengths decreased as a function of annealing time and temperature, one parallel and two fanning models were fitted to the empirical dataset. The temperature limits of the monazite partial annealing zone (MPAZ) were defined as length reductions to 0.95 (lowest) and 0.5 (highest) for this study. Extrapolation of the laboratory experiments to geological timescales indicates that for a heating duration of 107 years, estimated temperature ranges of the MPAZ are −44 to 101 ∘C for the parallel model and −71 to 143 ∘C (both ±6–21 ∘C, 2 standard errors) for the best-fitting linear fanning model (T0=∞). If a monazite fission track closure temperature is approximated as the midpoint of the MPAZ, these results, for tracks with similar mass and energy distributions to those involved in spontaneous fission of 238U, are consistent with previously estimated closure temperatures (calculated from substantially higher energy particles) of < 50 ∘C and perhaps not much higher than ambient surface temperatures. Based on our findings we estimate that this closure temperature (Tc) for fission tracks in monazite ranges between ∼ 45 and 25 ∘C over geological timescales of 106–107 years, making this system potentially useful as an ultra-low-temperature thermochronometer.
- Article
(5018 KB) - Full-text XML
-
Supplement
(174 KB) - BibTeX
- EndNote


Fission track thermochronology is an analytical technique used to reconstruct the low-temperature thermal history of rocks over geological time. Fission tracks form from the spontaneous nuclear fission of 238U, resulting in the accumulation of narrow damage trails in uranium-bearing minerals such as apatite and zircon. The time since the fission tracks began to accumulate may be calculated by measuring the spontaneous track density and uranium concentration. If the host rock experienced elevated temperatures, the fission tracks that have formed up to that point will progressively anneal and eventually disappear. Thermal diffusion drives the annealing process, with the reduction in fission track density and confined track length being a function of heating time and temperature in the host rock. From the apparent age and track length distribution, a quantitative analysis of the thermal history of the host rock can be achieved. For fundamentals of the fission track technique, including methodology and applications, see Wagner and Van den Haute (1992) and Malusa and Fitzgerald (2019).
The occurrence of monazite as an accessory mineral, along with the presence of significant uranium (U) and thorium (Th) incorporated in its crystal lattice, make it a useful mineral for isotopic and chemical dating (e.g., Badr et al., 2010; Cenki-Tok et al., 2016; Tickyj et al., 2004). In monazite, studies have mostly focused on the U-Th-Pb and (U-Th)/He systems, but only limited research has been carried out into the potential of the fission track system, mainly due to technological limitations. Conventional fission track dating relies on thermal neutron irradiation of samples to obtain an estimate of 238U content via the formation of 235U fission tracks, usually captured in an adjacent external solid-state track detector such as mica. This approach, however, has hindered the development of monazite fission track dating for a number of reasons. Monazite is highly unsuitable for irradiation due to massive self-shielding by thermal neutron capture from gadolinium (Gd), which may reach abundances in excess of 2 wt %. Gd has an extremely high thermal neutron capture cross section of 48 890 barns, averaged over its constituent isotopes, compared to 580 barns for 235U fission (Gleadow et al., 2004; Weise et al., 2009). An even more serious issue is that neutron capture by Gd induces substantial nuclear heating in monazite during irradiation, which may be sufficient to melt the grains and would certainly anneal any fission tracks produced.
These factors have also ruled out conventional annealing studies dependent on neutron-induced 235U fission tracks to assess the geological stability of fission tracks in this mineral. Alternative thermal annealing experiments have been developed using implanted heavy ion tracks (e.g., Weise et al., 2009; Ure, 2010) in place of 235U induced fission tracks. These methods, in combination with the use of laser ablation inductively coupled plasma mass spectrometry (LA-ICPMS) or electron probe microanalysis (EPMA) for determining U concentrations on individual grains, provide alternatives to the traditional neutron-irradiation approach, thus allowing the potential of monazite fission track dating to be assessed.
The first published study of fission track dating in monazite was by Shukoljukov and Komarov (1970), who reported very young ages for two monazite samples from Kazakhstan. The unexpectedly young results obtained were the first to suggest that fission tracks in monazite anneal at relatively low temperatures (Shukoljukov and Komarov, 1970). Since this study, the majority of reported monazite fission track studies have been in conference abstracts (e.g., Fayon, 2011, Gleadow et al., 2004, and Shipley and Fayon, 2006). Gleadow et al. (2004) reported preliminary results on several monazite samples revealing fission track ages considerably younger than corresponding apatite fission track ages, further suggesting that monazite fission tracks anneal at lower temperatures. This finding was later confirmed by Shipley and Fayon (2006), who also suggested that annealing rates may vary as a function of uranium concentration.
A comprehensive annealing study using 300 MeV 86Kr heavy ion tracks in monazite was published by Weise et al. (2009). Three isochronal annealing sequences were carried out over schedules of 1, 20 and 100 h on crystals cut parallel to the (100) face. Adapting simplified apatite annealing models and extrapolating the results to geological timescales, Weise et al. (2009) estimated a closure temperature that “is in all likelihood < 50 ∘C and perhaps not much above ambient”.
Ure (2010) carried out further thermal annealing experiments on monazite based on implanted 252Cf fission tracks. These were carried out on grains mounted parallel to (100) pinacoidal faces and perpendicular to the crystallographic c axis, with each orientation annealed for 20 min and 1 h at various temperatures. The results showed that on these short laboratory timescales, 252Cf tracks in monazite annealed at lower temperatures when compared to parallel experiments on Durango apatite. Further, it was concluded that monazite exhibits similar anisotropic annealing properties to apatite in that tracks anneal faster perpendicular to the c axis compared to the c axis parallel direction. All of these studies have suggested that fission tracks in monazite have significant potential as a new ultra-low-temperature thermochronometer but that further work is required to quantify the annealing kinetics.
Several studies have used heavy ion tracks as proxies for fission track annealing studies in other minerals. Green et al. (1986) annealed 220 MeV Ni ion tracks in apatite to further confirm that gaps in the etchability of highly annealed tracks delay the progress of the etchant along the track length. Sandhu et al. (1990) implanted heavy ion tracks of various energies (1.67 GeV Nb, 3.54 GeV Pb and 2.38 GeV U) in mica, apatite and zircon and concluded that the activation energies for annealing the different energy ion tracks were identical in the same mineral. Furthermore, they found that in the same mineral, the activation energies for annealing of tracks formed by 252Cf fission fragments were also identical to those from the heavy ion tracks. These studies have shown that the minimum energy required to initiate annealing is largely independent of the nature and energy of the ion source and is instead a property of the detector mineral (Sandhu et al., 1990). Because the mass and energy distributions of both light and heavy fission fragments from 252Cf are similar to those produced by spontaneous fission of 238U, the annealing properties of fission tracks from either source in monazite should be similar (Fleischer et al., 1975).
In this study, implanted 252Cf fission tracks are used to constrain the thermal annealing properties of monazite using a modified etching protocol (Jones et al., 2019). The new annealing experiments cover a wider time–temperature range than previously reported. Three alternative kinetic models are then developed that describe the reduction of fission track lengths as functions of time and temperature. Extrapolation of these models then allows estimates to be made of the temperature range over which fission track annealing occurs on geological timescales.
Monazite crystals used in the thermal annealing experiments were separated from the Late Devonian Harcourt granodiorite (Victoria, Australia). This is a high-K, calc-alkaline granite dated by zircon U-Pb and geochronology to ∼ 370 Ma (Clemens, 2018). Euhedral monazite crystals range from ∼ 100–250 µm in length and are classified as Ce dominant (see Table 1).
Table 1Average electron microprobe analyses of Harcourt granodiorite monazite grains.
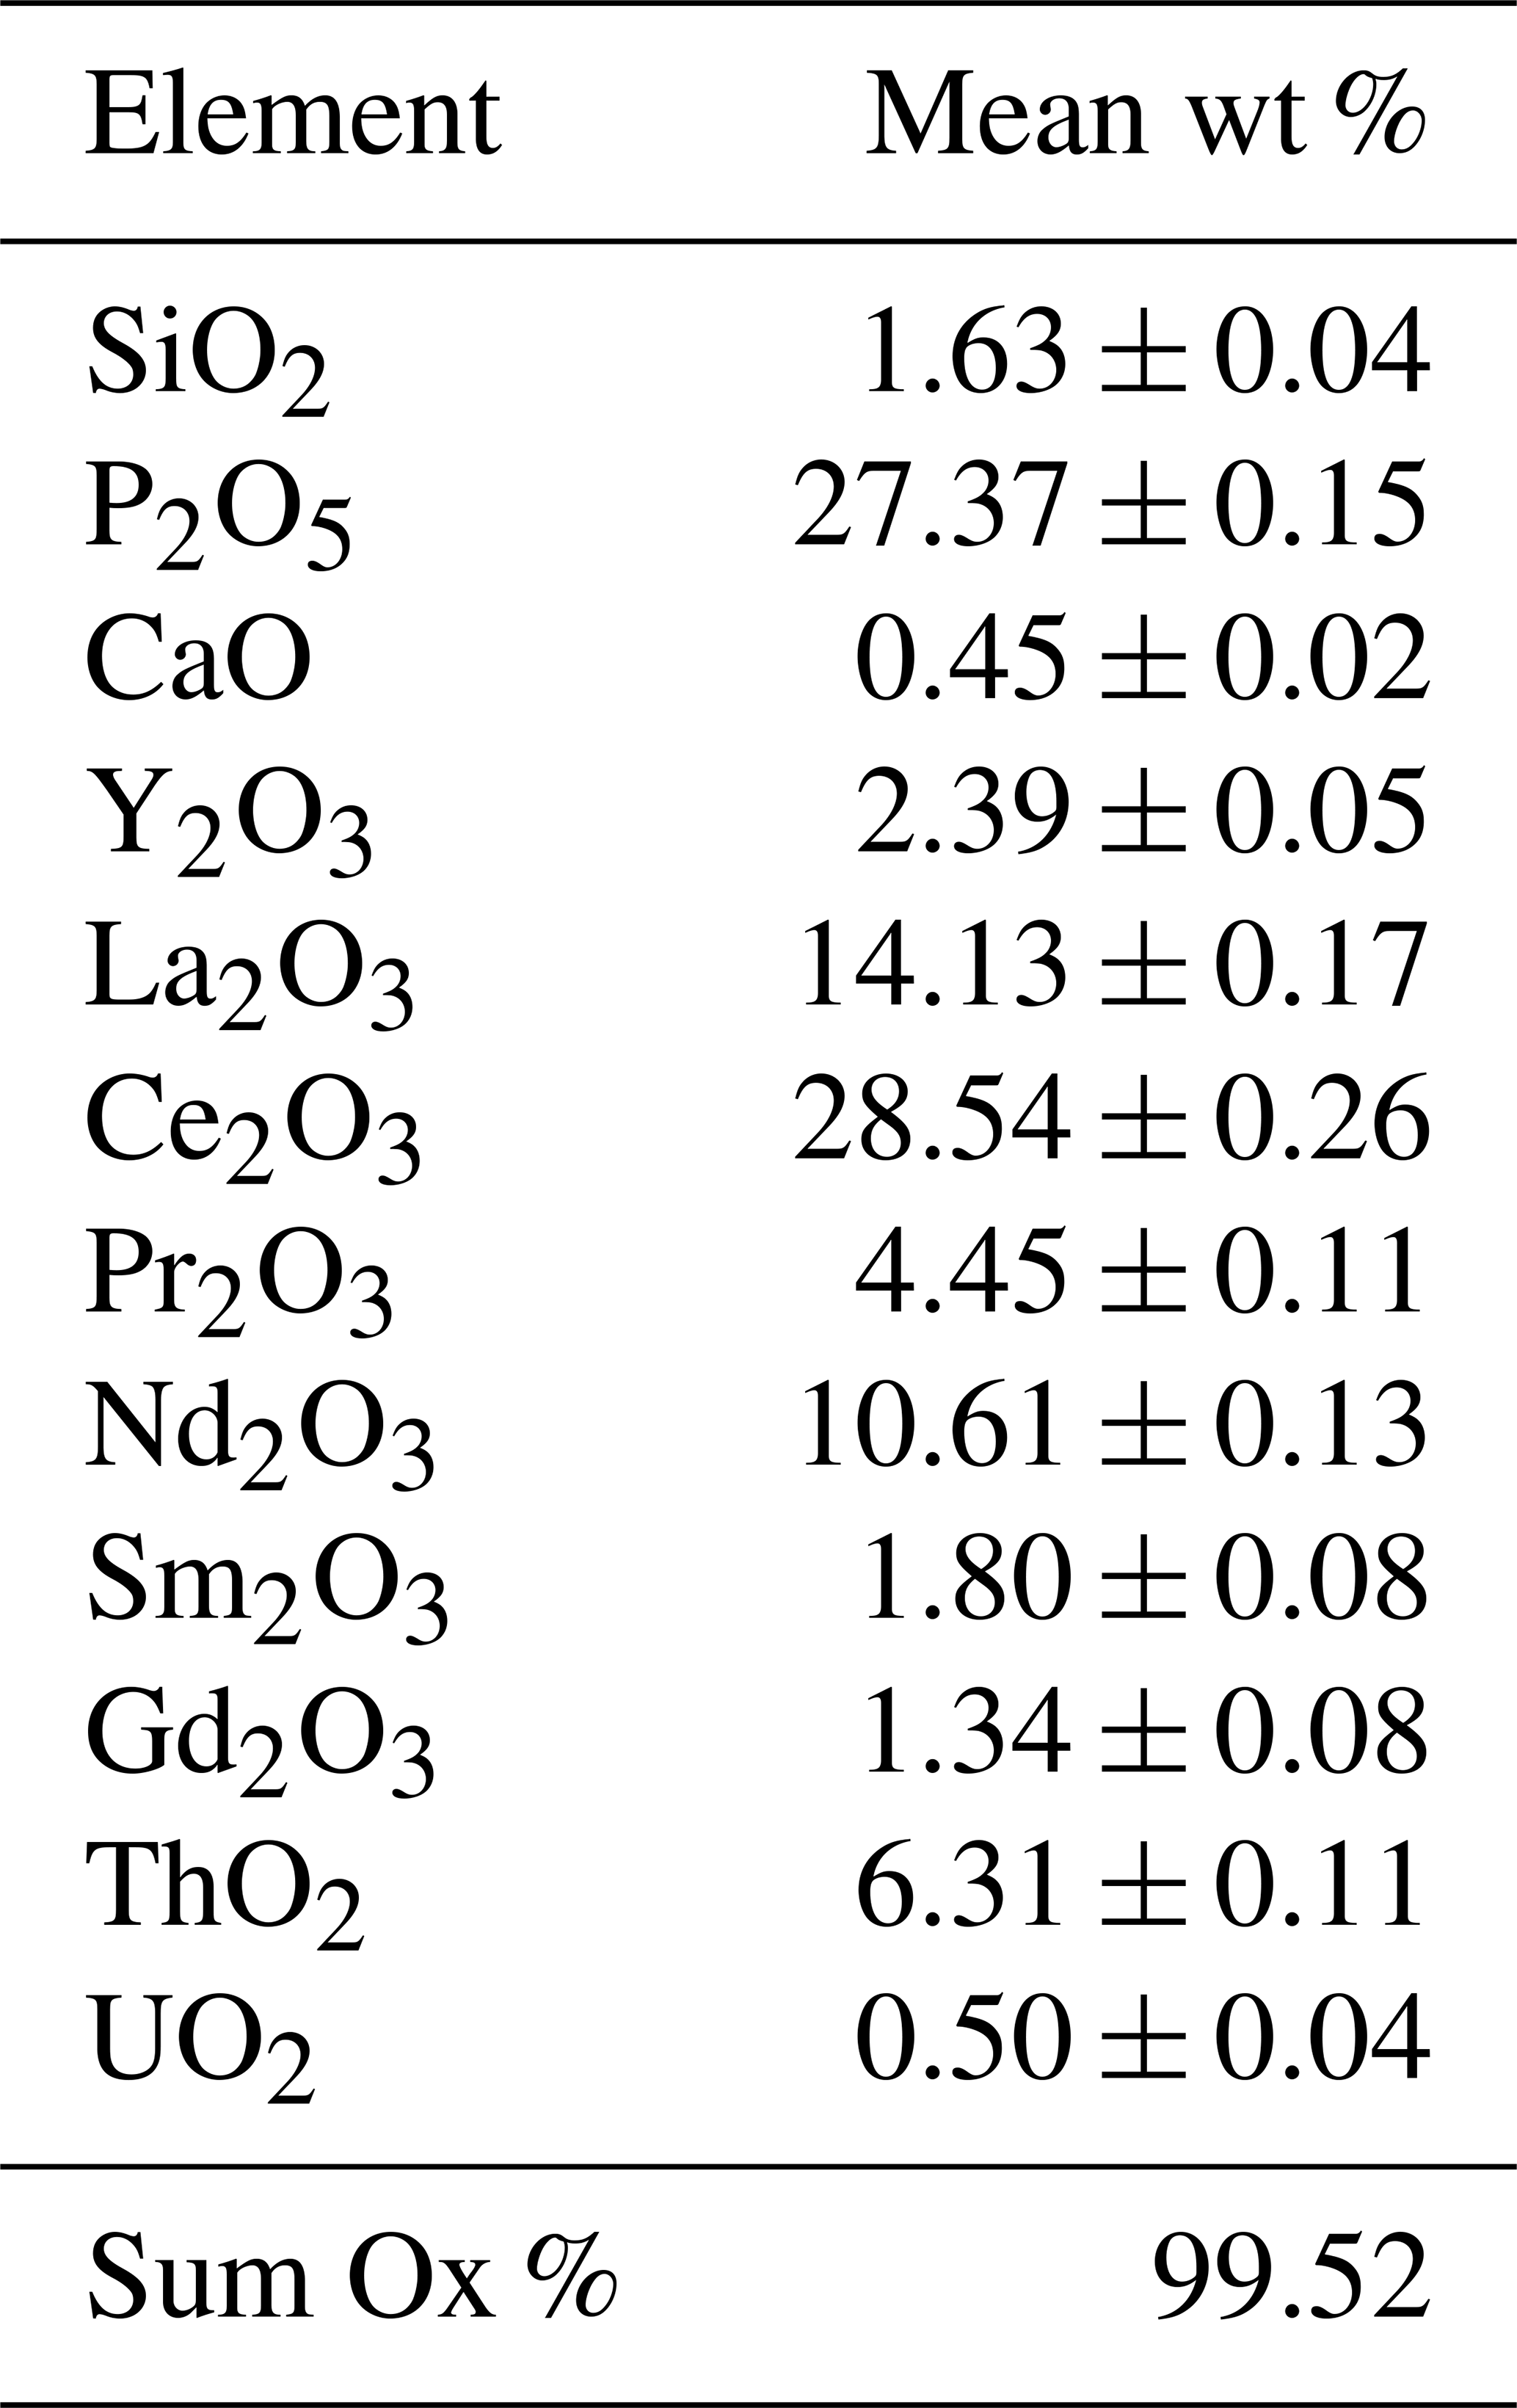
Measurements (±2 s error) of 81 grains made with a Cameca SX50 electron microprobe using a 10 mm beam width, 50 keV beam current, 25 kV accelerating voltage and a take-off angle of 40∘.
The 252Cf fission track implantation, measurements and equivalent confined fission track calculations in this study essentially followed the procedure of Ure (2010). A total of 55 monazite crystals per sample were pre-annealed (400 ∘C for 8 h) and attached to double-sided tape on a Teflon block. Following this, using tweezers under a stereoscopic microscope, grains were carefully oriented parallel (//) to (100) pinacoidal faces and perpendicular (⊥) to the crystallographic c axis (Fig. 1), which was followed by mounting in cold-setting Struers Epofix epoxy. For each annealing experiment, two sample mounts were made, one with grains oriented parallel to the (100) face and another where they were oriented parallel to the c axis. Each sample mount was then pre-ground using a Struers MD-Piano 1200 grinding disc, with a final polishing using 6, 3, 1 and 0.25 µm diamond pastes. Polished grain mounts were then exposed to collimated fission fragments approximately 2 cm from a thin 4 mm diameter 252Cf source under vacuum for 7 h to implant a density of ∼ 5×10⁶ tracks/cm2. Tracks were implanted at an angle of approximately 30∘ to the polished surface, which had been shown to be optimal for measurement in previous experiments (Ure, 2010). Although the grains were mounted in precise orientations, both surfaces had limited control on the precise azimuth of the collimated tracks.
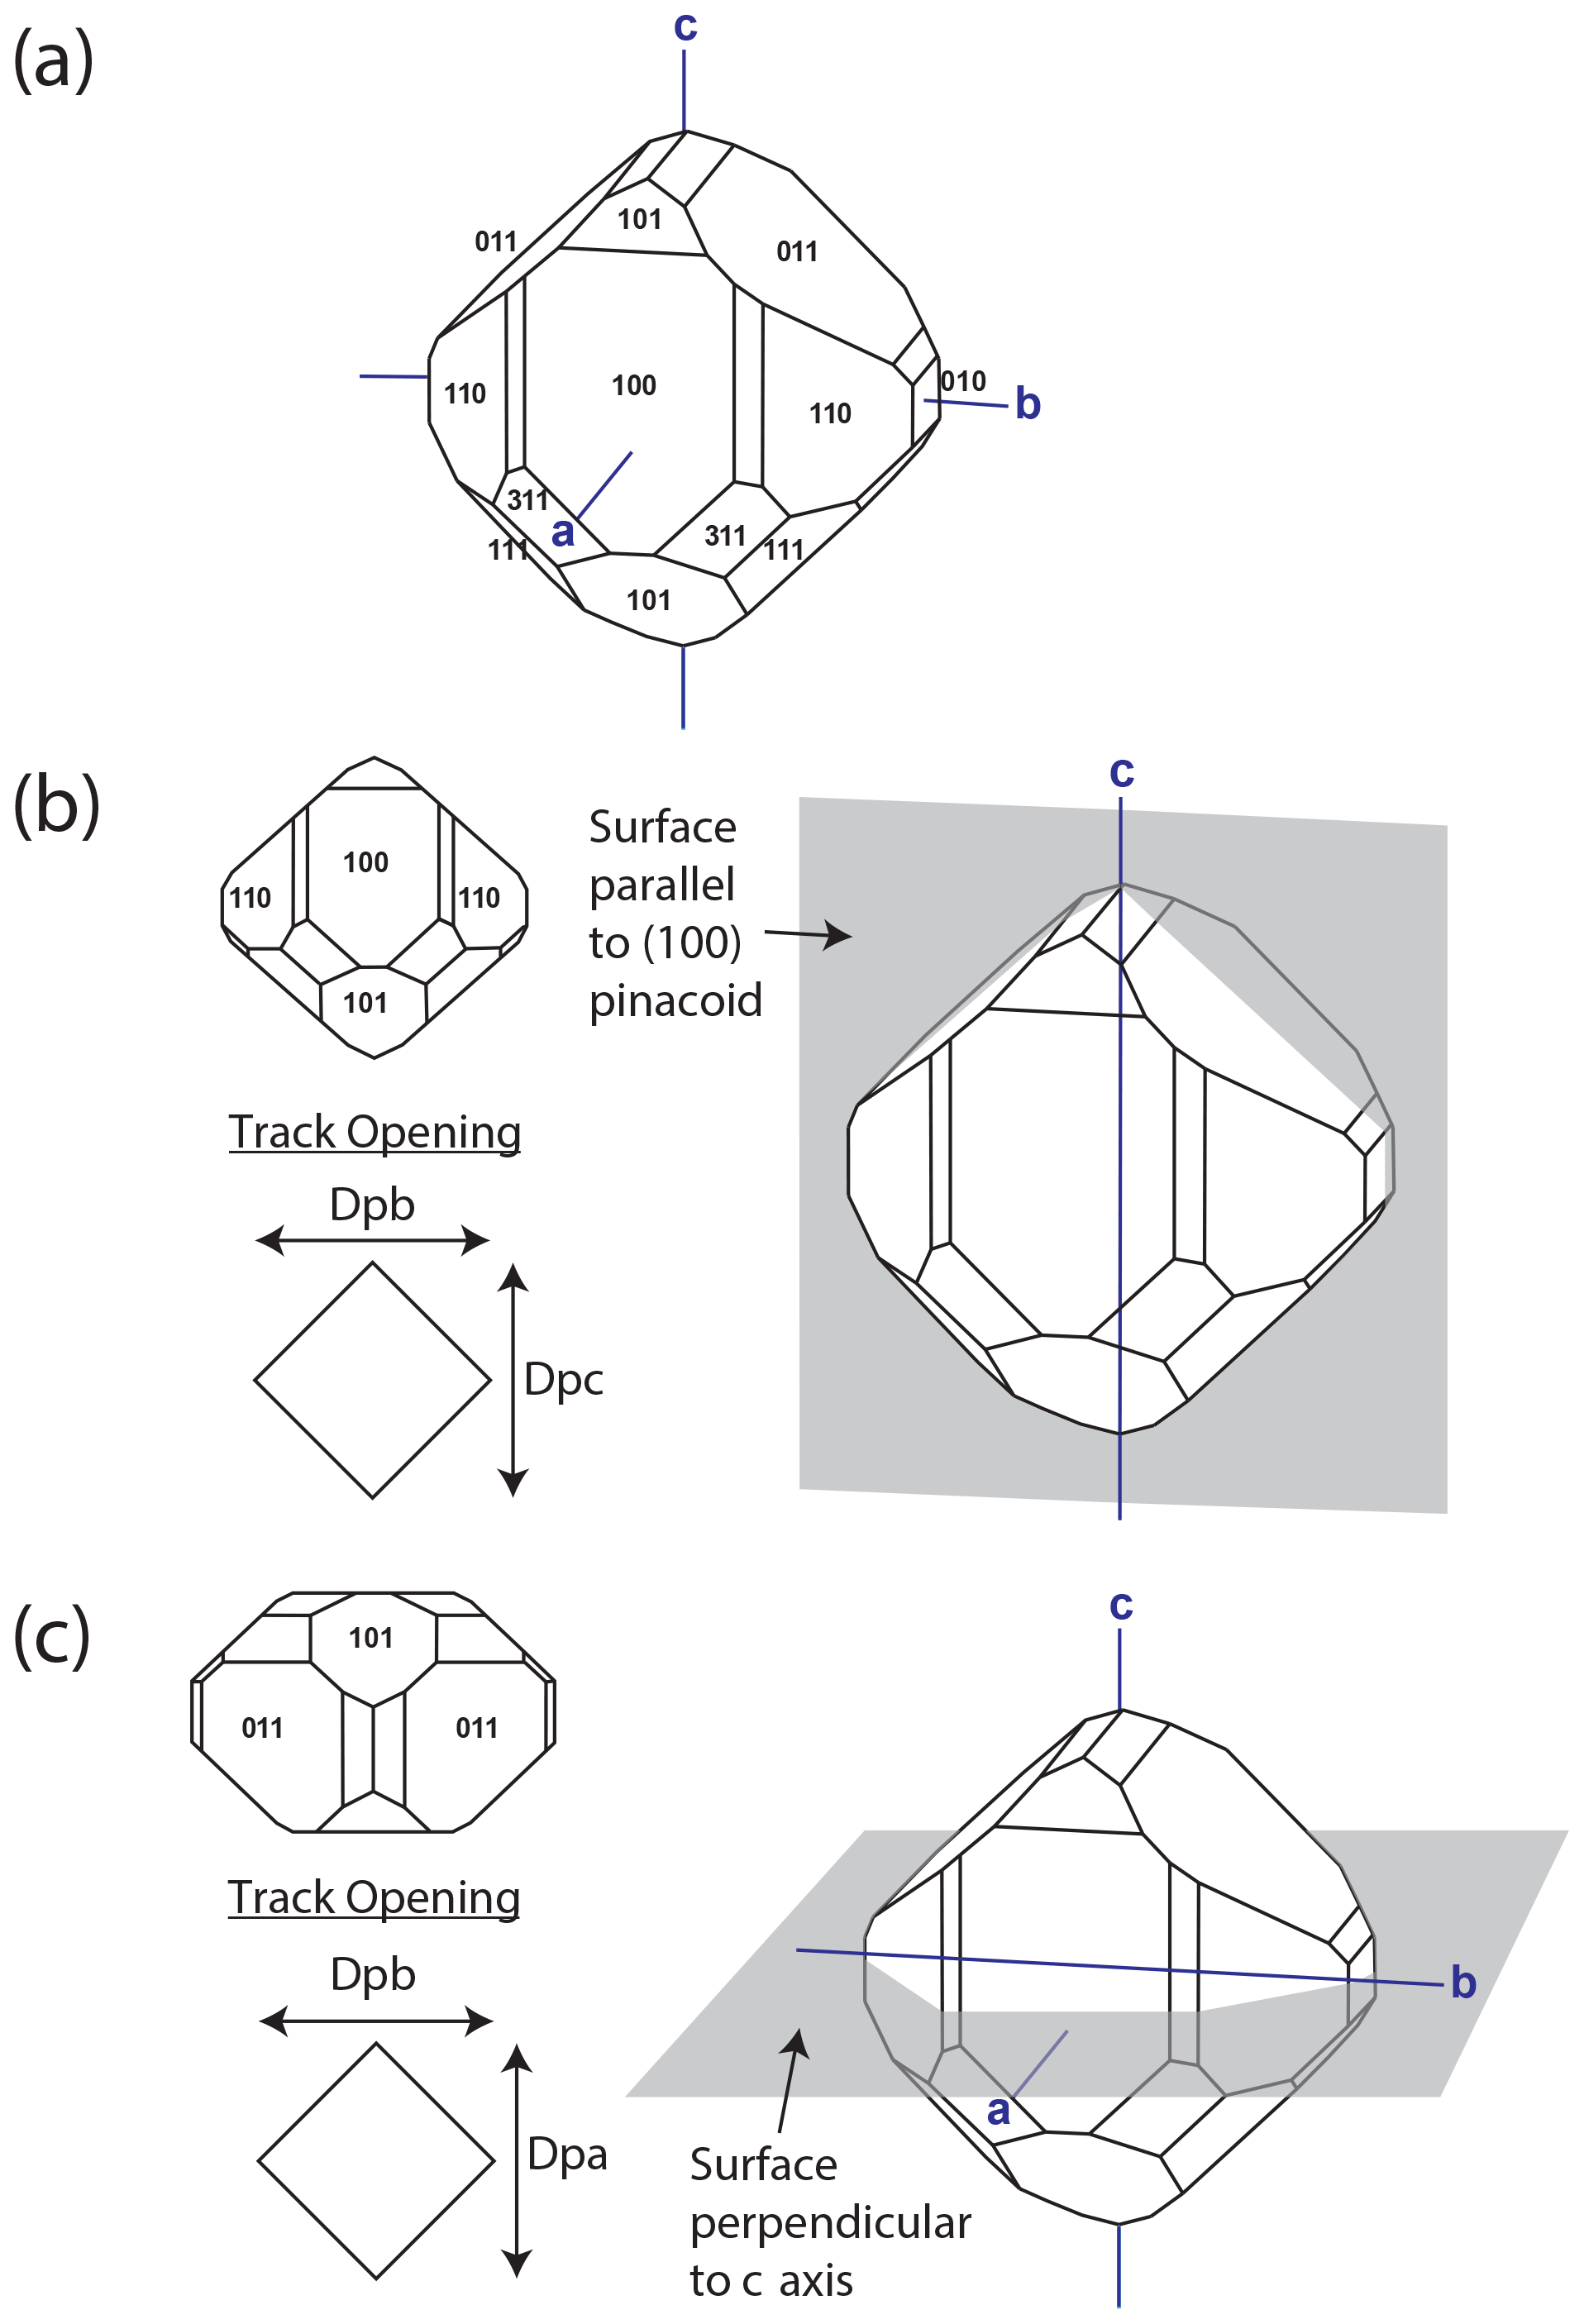
Figure 1(a) Typical monazite crystal with Miller indices and crystallographic axes. (b) Crystal plane for tracks implanted on surfaces parallel to the (100) pinacoid face (i.e., parallel to the b and c axes). The shape of the track opening on the etched surface is a rhombus. Dpb represents diameter of etch pit parallel to b axis, and Dpc is defined as the diameter of etch pit parallel to c axis, equivalent to the parameters Dper and Dpar, respectively, in uniaxial minerals such as apatite. (c) Crystal plane for tracks implanted perpendicular to c axis. Track etch pits also tend to be diamond in shape. Dpa represents diameter of track opening parallel to a axis. Models from https://Mindat.org (last access: 12 February 2021).
Following track implantation, grains were removed from the mount by dissolving the epoxy mount in commercial paint stripper. The loose grains were then annealed in aluminum tubes in a Ratek Digital Dry Block Heater over 1, 10, 100 and 1000 h schedules at temperatures between 30 and 400 ∘C. The block heater was covered by a ceramic foam block for insulation, through which a probe could be inserted to monitor temperatures. Temperature uncertainty is estimated to be ±2 ∘C. Once each annealing experiment was completed, the grains were removed from the block heater and remounted and polished face down on double-sided tape before re-embedding in cold-setting Epofix epoxy. Etching of each sample mount was then performed using 6M HCl for 75 min at 90 ∘C (Jones et al., 2019). An example of well-etched 252Cf fission tracks in this monazite is shown in Fig. 2.
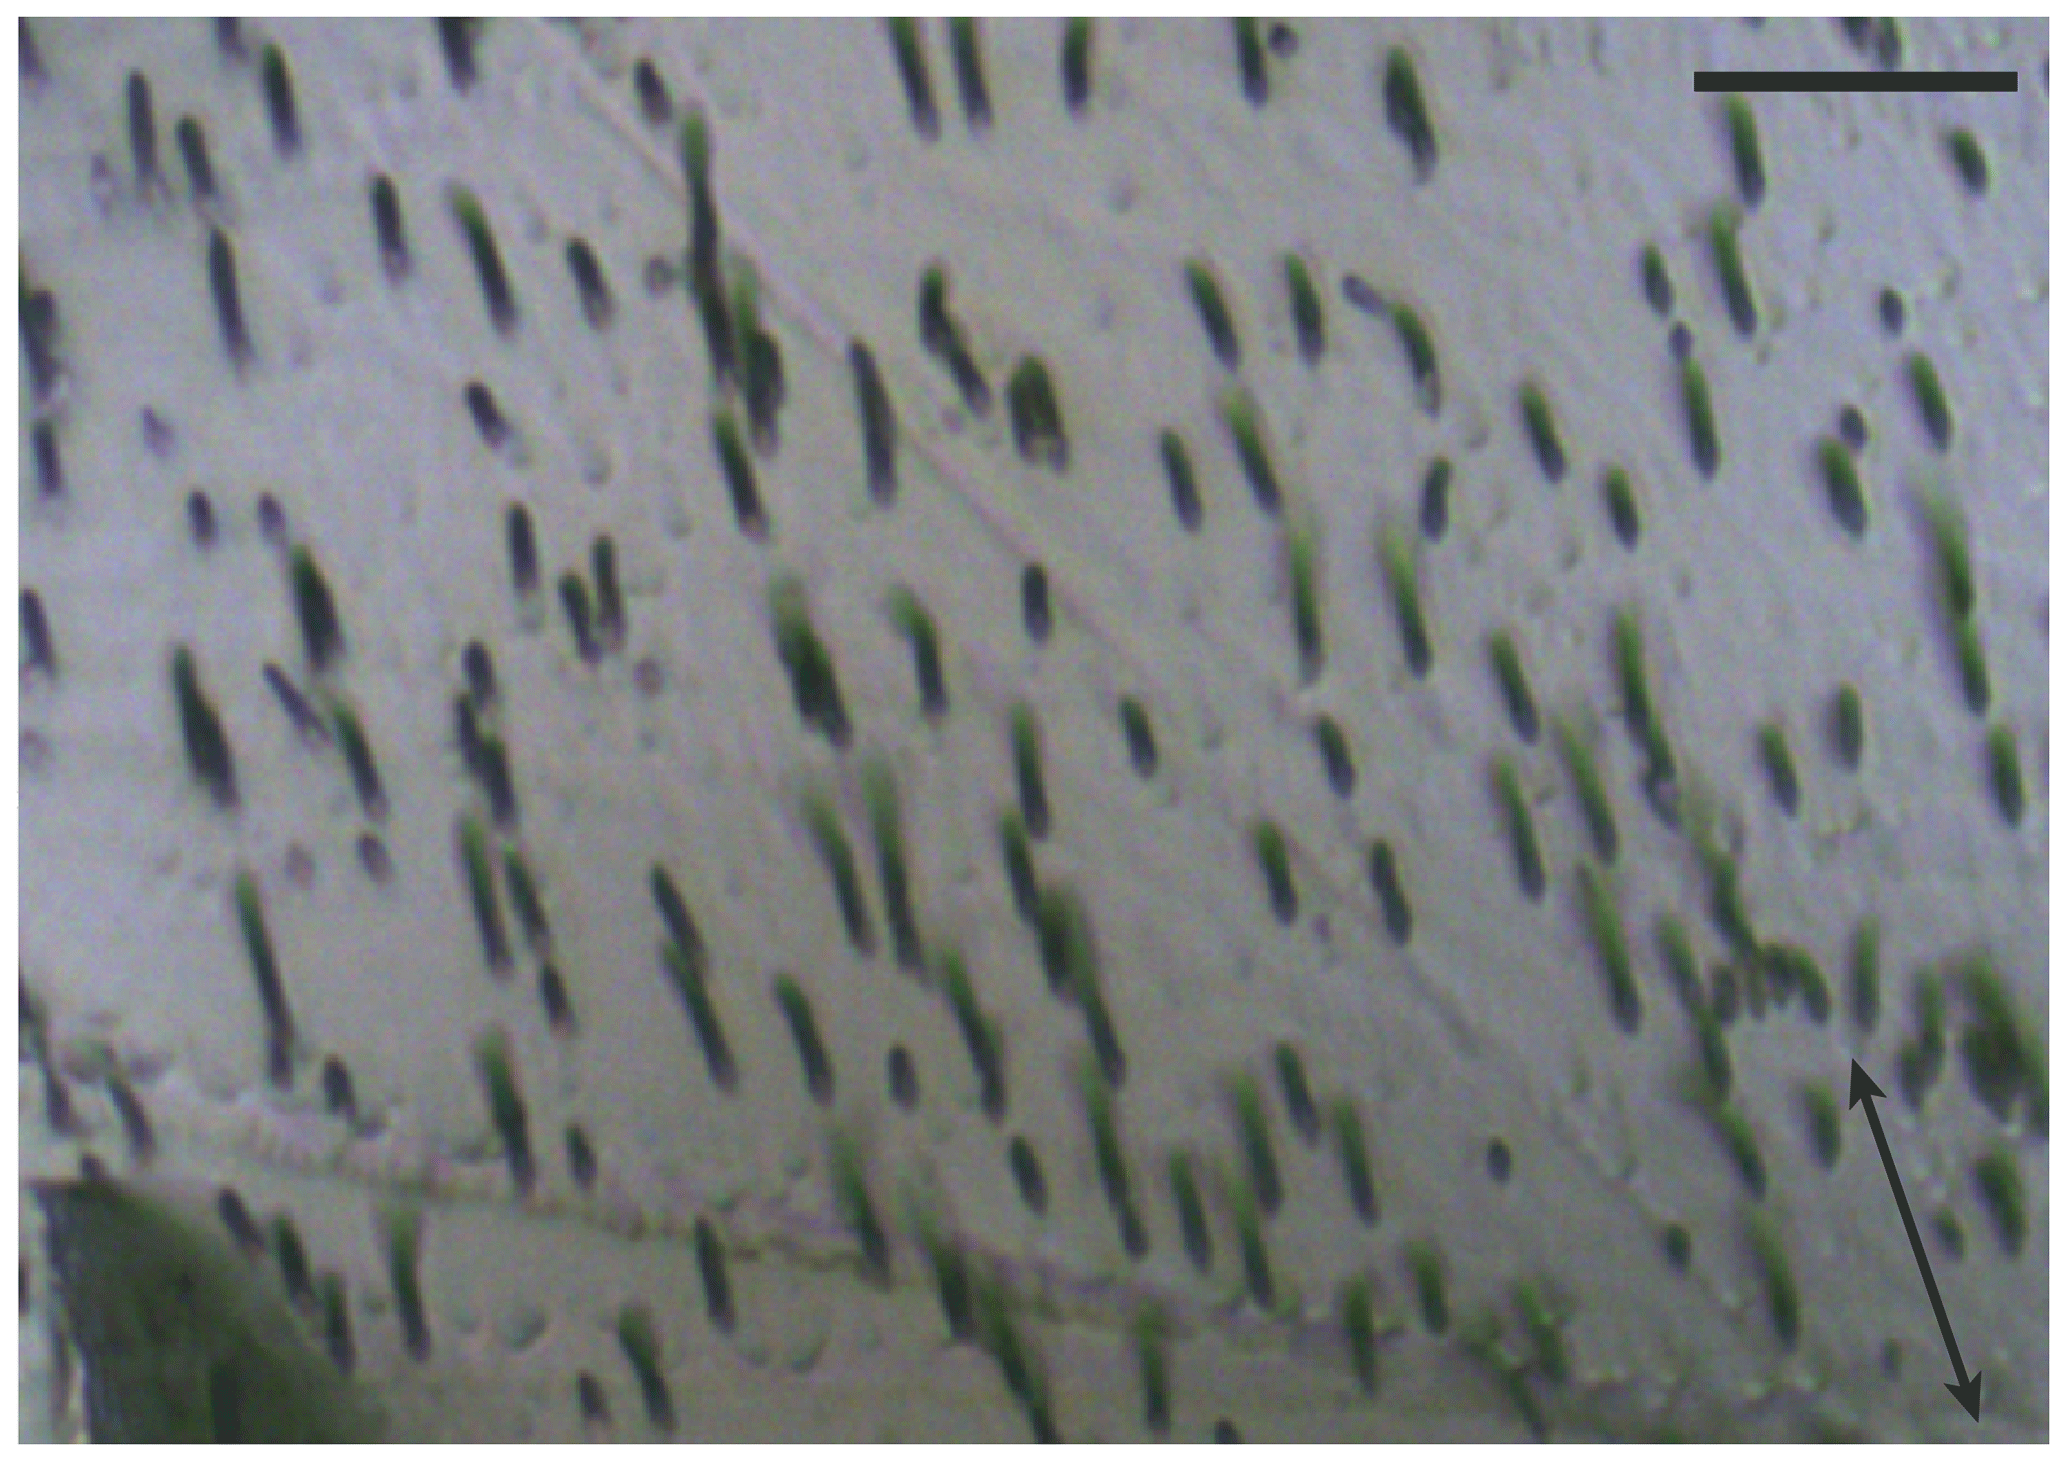
Figure 2Implanted and well-etched 252Cf fission tracks in Harcourt granodiorite monazite. Tracks are implanted on surfaces parallel to the (100) pinacoid. The arrow indicates the direction of the c axis. The enlarged image was taken with a 100× dry objective; the scale bar is 10 µm.
Digital images of all monazite grains in each mount were captured in reflected and transmitted light using a 100× dry objective on a Zeiss Axio Imager M1m motorized microscope fitted with a PI piezo-motor scanning stage and an IDS µEye 4 Megapixel USB 3 CMOS digital camera. This was interfaced to a control PC using Trackworks software (Gleadow et al., 2009, 2019). The true 3D lengths of the etched 252Cf semi-tracks were then measured from the captured image stacks on a separate computer using FastTracks software (Gleadow et al., 2009, 2019) until a maximum of 500 tracks per sample mount were attained, thus totaling 1000 tracks per annealing experiment (500 on surfaces parallel to (100) and 500 on the c axis perpendicular surfaces). Track length measurements were made using both reflected and transmitted light images and typically measured over ∼ 30 grains. The surface-reflected-light image was used to manually determine the center of the implanted 252Cf semi-track etch pit and the transmitted light stack for determining the position of the track termination by scrolling down through the image stack to the last image plane where it appeared clearly in focus. FastTracks automatically calculates true track lengths, correcting the vertical focus depth for the refractive index of monazite, taken to be 1.794.
The equivalent confined track length (l) was then calculated based on a correction for the small amount of surface lowering during track etching. This surface lowering during etching on different planes was estimated from diameters of the track etch pits in different directions. In uniaxial minerals, such as apatite and zircon, the dimensions of track etch pits are satisfactorily described by the parameters Dpar and Dper (track diameters parallel and perpendicular to the c axis, respectively, Donelick et al., 2005). However, for monoclinic minerals, such as monazite, the situation is more complex, and we extend this terminology as shown in Fig. 1 with three track diameter measurements, Dpa (diameter parallel to the a axis), Dpb (parallel to b) and Dpc (parallel to c), the latter being equivalent to Dpar in apatite and zircon. The track etch pits in monazite are rhombic in shape, and in practice these three diameter measurements are very similar to each other and thus the differences are not critical (Table 2).
Table 2Average diameters of implanted 252Cf fission track openings on both parallel and perpendicular surfaces for each annealing schedule.
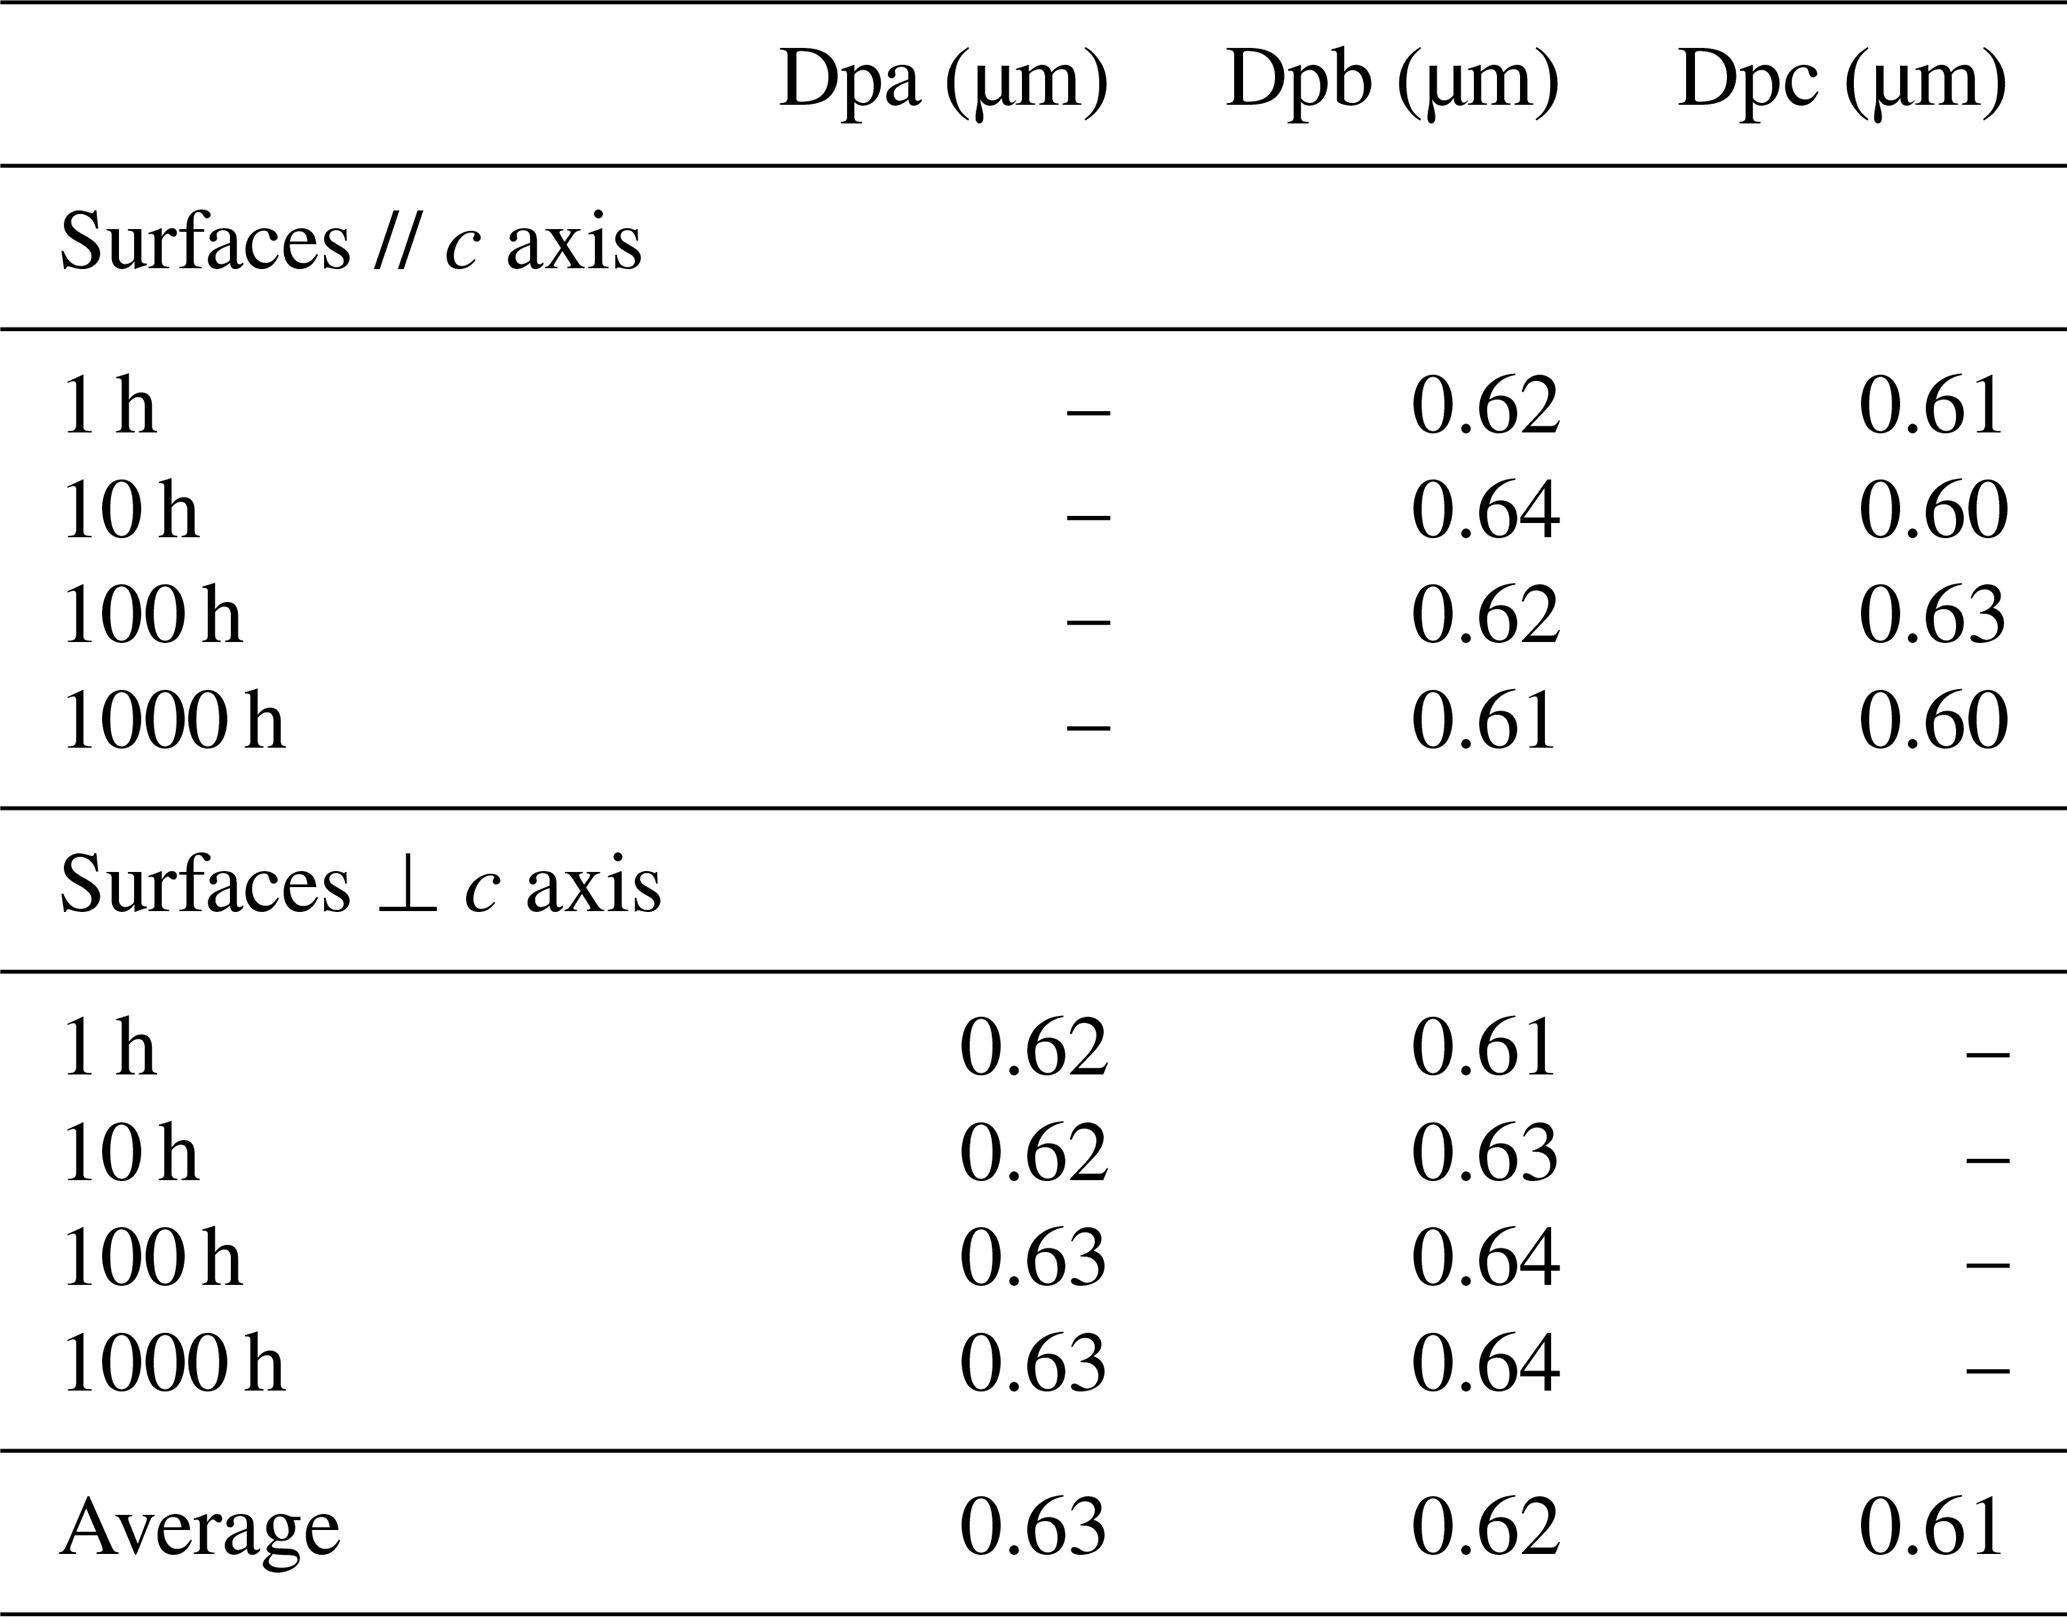
The track diameter measurements, representing the rate of etching from a point source in different crystallographic orientations, may be used to estimate the rate of surface lowering on different surfaces. For (100) surfaces (i.e., parallel to both b and c axes), the amount of surface etching was estimated using measurements of the track width parameter Dpa, measured on the surface normal to the c axis (approximately parallel to the a and b axes). Diameter measurements were made for approximately 250 tracks for both surface orientations in each sample. The amount of surface etching on (100) was approximated by half the mean Dpa measurement for each sample (Ure, 2010). Knowing the track implantation angle (30∘) allows for the length of the lost portion of the implanted semi-tracks to be calculated and added to the total track length (Ure, 2010) as illustrated in Fig. 3. The equivalent confined fission track length is then obtained by doubling the corrected mean semi-track length. For surfaces cut perpendicular to the c axis (approximately (001)), the relevant measurement for the surface lowering correction is the half the mean Dpc measured on the (100) surfaces.

Figure 3Illustration of the measurements and calculations required to correct semi-track lengths for surface etching on a (100) face (i.e., parallel to b and c). Bulk etching removes the original surface by approximately half the width of the etch pit diameter parallel to the a axis (Dpa) measured on the ∼ (001) face (modified from Ure 2010).
Table 3 and Fig. 4 present the track length measurements from the isochronal annealing experiments in Harcourt granodiorite monazite. All length measurements are presented as mean lengths of equivalent confined fission tracks calculated according to the geometry in Fig. 3 and duplicated on surfaces oriented parallel to (100) and perpendicular to the crystallographic c axis. The annealing schedules are presented as 1, 10, 100 and 1000 h between temperatures from 30 to 400 ∘C.
Table 3Isochronal laboratory annealing data for 252Cf tracks in the Harcourt granodiorite monazite (1σ errors).
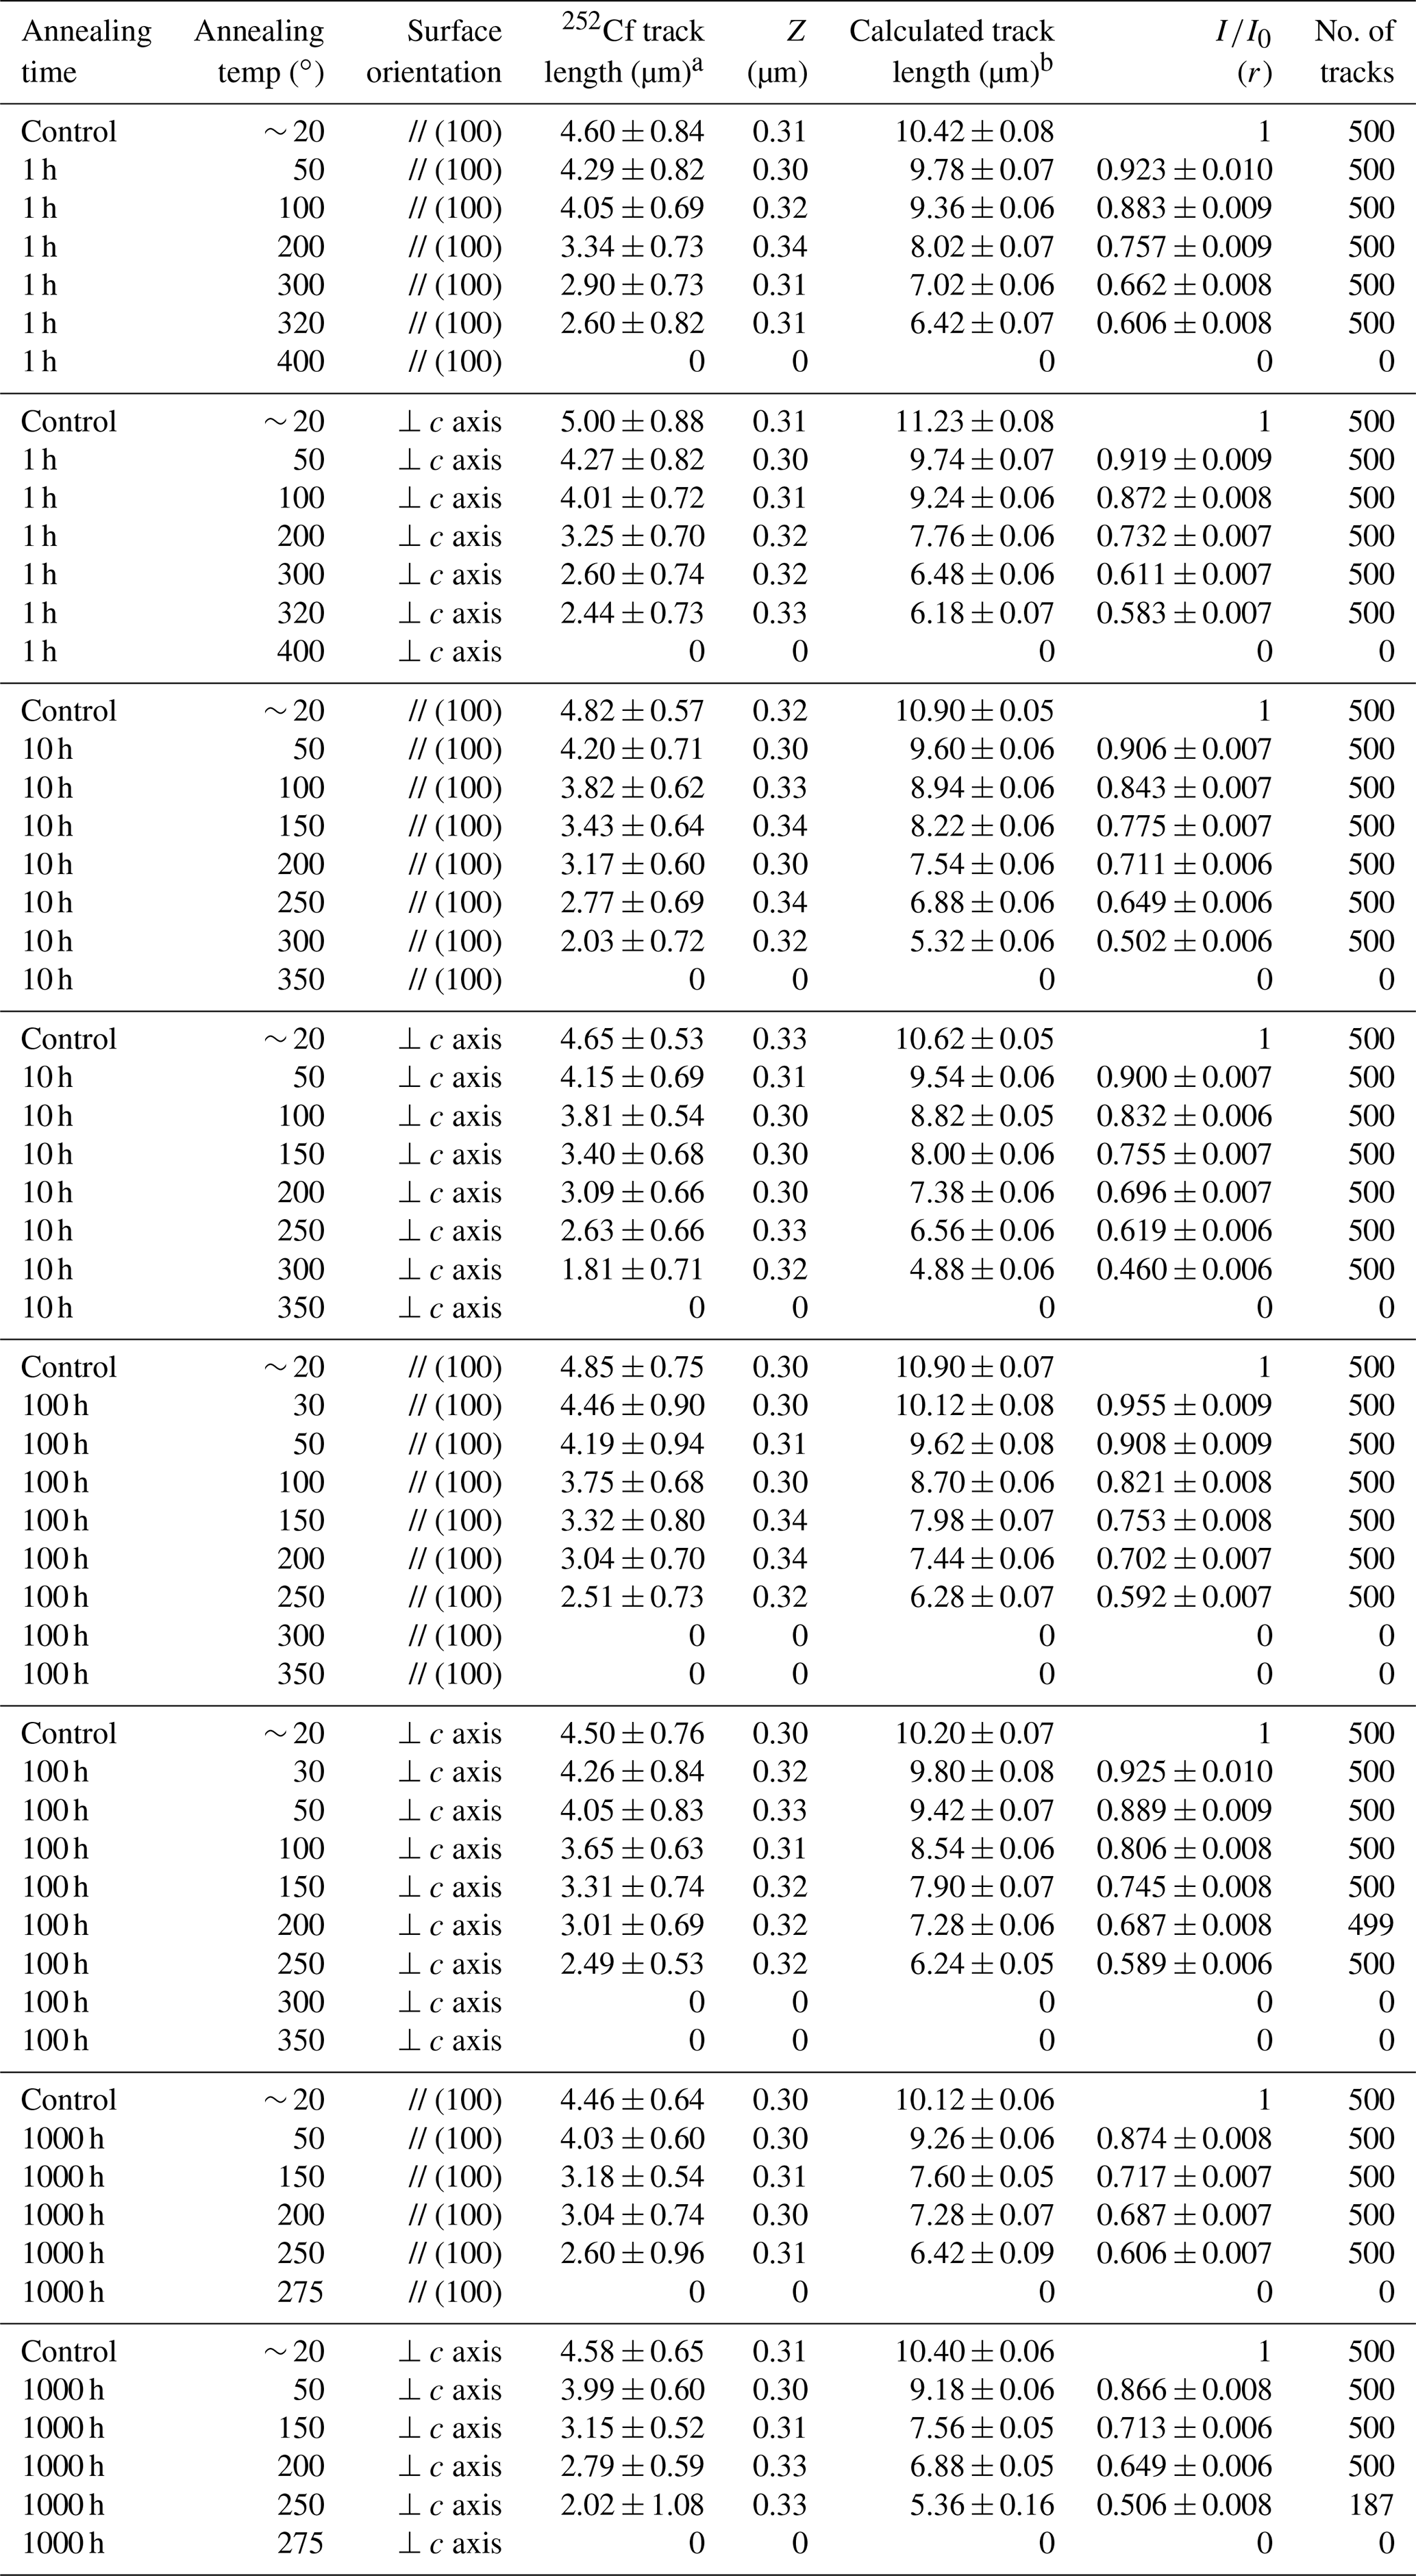
a ±SD. b ±SE. Z is the amount of surface lowering due to bulk etching; (r) has been normalized to an average control sample of 10.60 µm.
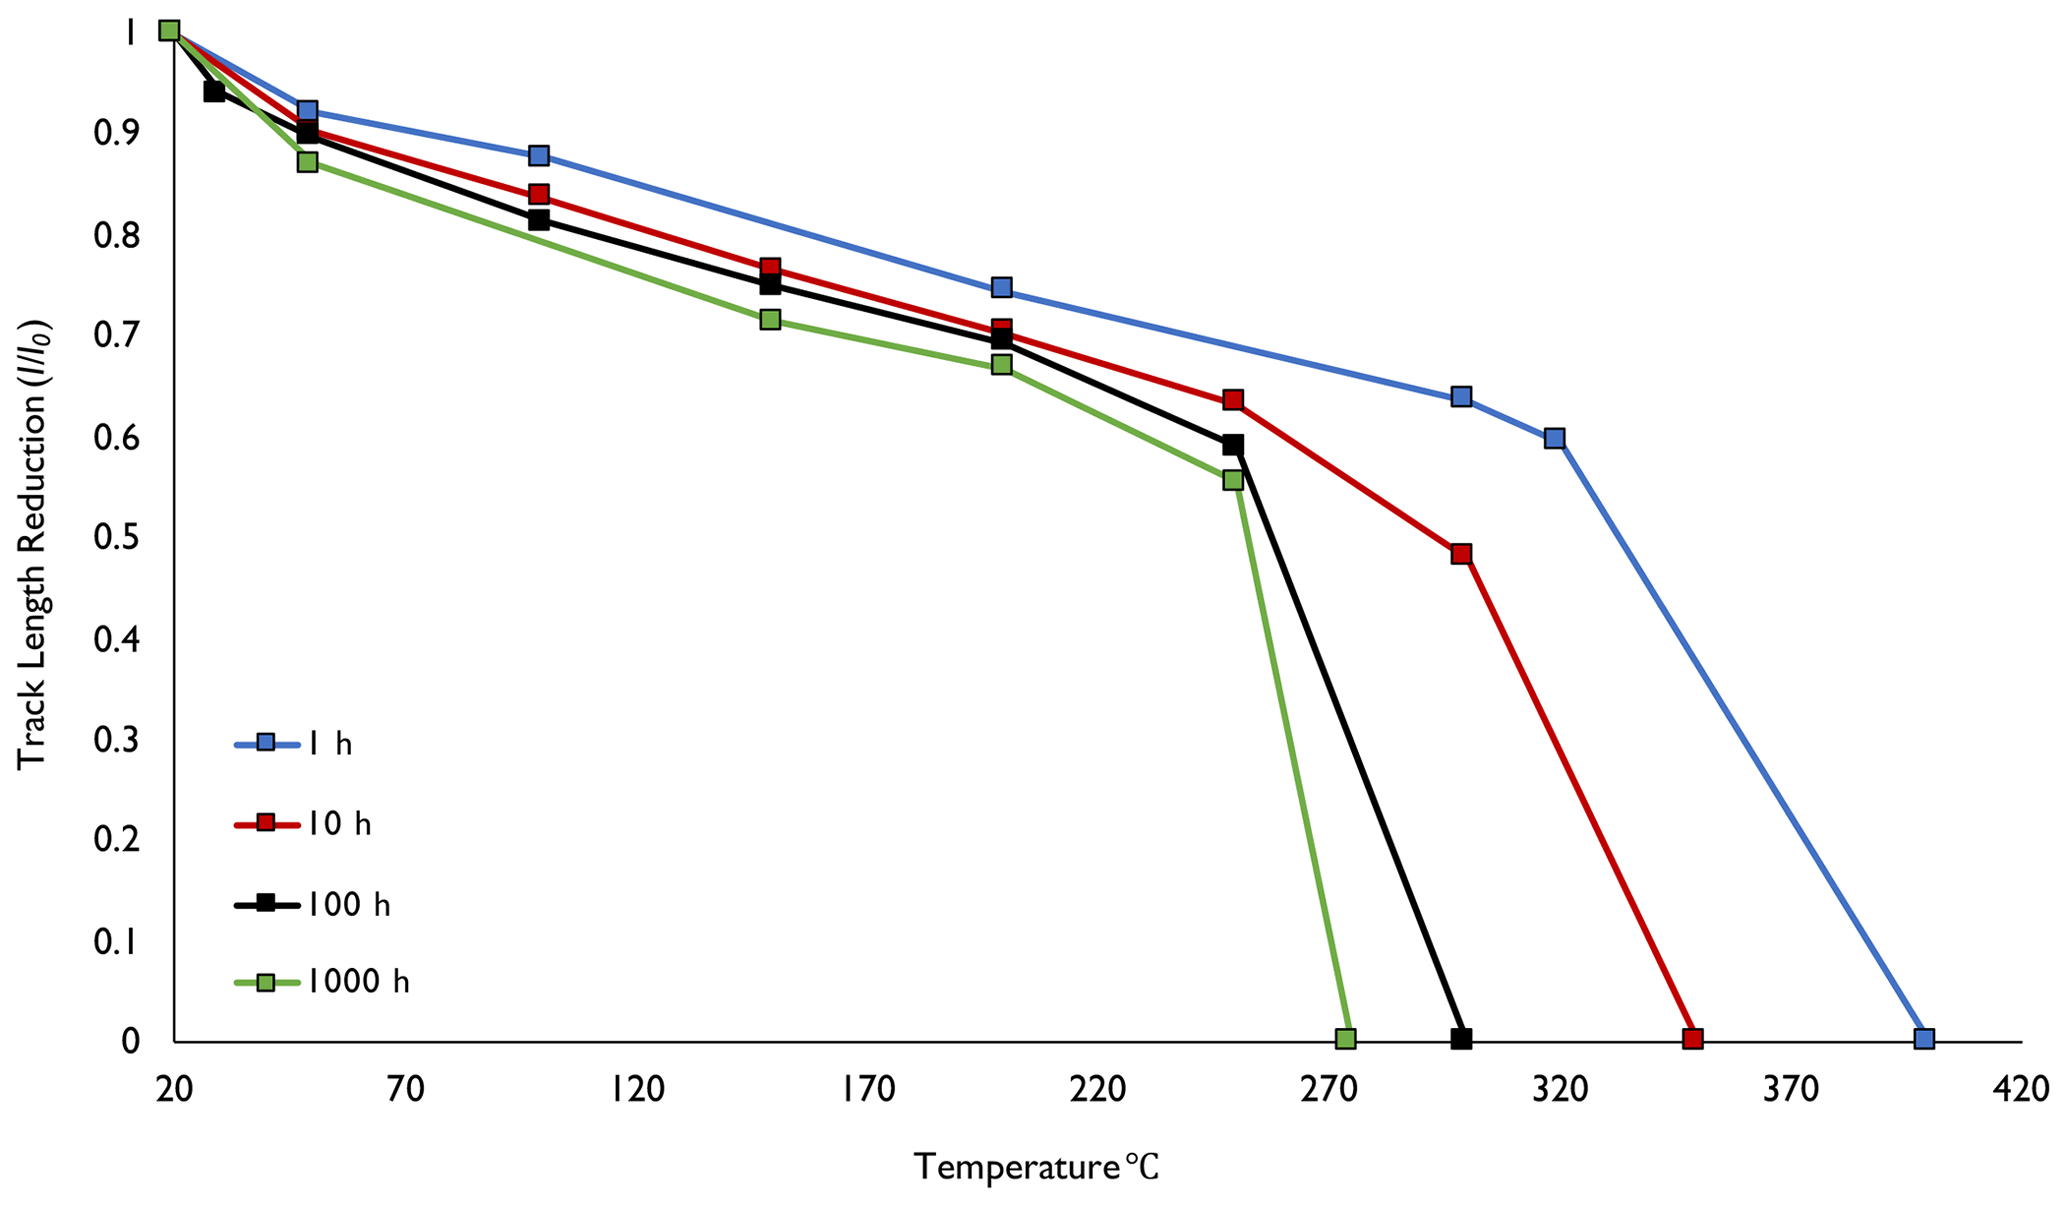
Figure 4Normalized track length reduction () against temperature for calculated equivalent confined fission tracks in Harcourt granodiorite monazite. The track length reduction values are averaged across both sets of surfaces (// to (100) and ⊥ to the c axis) with the normalized track length () values being calculated from the average length of the unannealed control samples (10.60 µm).
Unannealed fission track lengths for all control samples range from 10.12 ± 0.06 to 11.23 ± 0.08 µm, averaging 10.60 ± 0.19 µm. These vary by considerably more than the analytical uncertainty, and possible reasons for this are considered below. Across all annealing experiments, mean lengths become progressively shorter, down to a minimum measured length of 4.88 µm (10 h, 300 ∘C, perpendicular c axis). Note that for all the annealed samples the average lengths of tracks etched on surfaces perpendicular to the crystallographic c axis are always shorter than those on surfaces parallel to (100). However, the same is not true for all of the control measurements on unannealed samples.
Track length reduction normalized to the mean length for the unannealed control samples (10.60 µm) are also presented in Table 3. Normalized lengths start at 1 (control sample), reducing to ∼ 0.5 before dropping abruptly to zero by the next heating step. The shortest mean track lengths were seen in the 10 h experiments, where decreased to values of 0.502 and 0.460 (300 ∘C, parallel and perpendicular surfaces, respectively).
The average track length for the unannealed control samples across all analyses is 10.60 ± 0.19 µm, which is slightly shorter but within error of the 11.30 ± 0.36 µm mean length reported by Ure (2010) for a smaller number of tracks in a different monazite of unknown composition. Weise et al. (2009) calculated a mean range 8.30 ± 0.62 µm for a heavy fission fragment and 10.80 ± 0.52 µm for a light fission fragment for 235U fission in monazite. This combines to give a total latent track length of ∼ 19 µm. However, it has long been known (e.g., Fleischer et al., 1975) that the lengths of etched fission tracks are significantly shorter than the total range of the fission fragments due to a “length deficit” of unetchable radiation damage towards the end of the track. Weise et al. (2009) calculated the length deficit for an unannealed confined fission track in monazite to be 6–7 µm, making the etchable length for induced 235U fission tracks ∼ 12–13 µm. Our measurements for the unannealed control samples are on average ∼ 1–2 µm shorter than these estimates, suggesting that the length deficit may be closer to 8 µm (∼ 4 µm at each end) at least for the 252Cf tracks used here. The mean track lengths reported here are also broadly consistent with measured lengths of spontaneous 238U confined tracks, reported to be ∼ 10 µm (Weise et al., 2009).
There is a difference of 1.11 µm between the longest and shortest mean track lengths in control samples across the experiments. This is substantial and significantly greater than the measurement uncertainty. It is known that newly produced fission tracks in apatite undergo rapid annealing at ambient temperatures (Donelick et al., 1990) from the moment the track is formed in the crystal lattice until the track is etched. It was not clear whether this was due to short-term thermal annealing or some non-thermal annealing mechanism. Belton (2006) and Tamer and Ketcham (2020) also found similar effects in a series of ambient temperature annealing experiments on freshly induced 235U fission tracks in various apatites. The results showed the tracks reduced in length by 0.32–0.70 µm between 39 s and 1.88 d after irradiation and continued to shorten measurably over decades. While the exact amount of time between 252Cf track implantation and etching for each individual control sample was not recorded in this study, the considerable length differences in the control samples suggest that ambient temperature annealing may also occur in monazite, and probably to an even greater degree than in apatite.
Table 4Results of the Arrhenius model-fitting calculations, including estimated temperatures (∘C ± 2σ error) for the monazite partial annealing zone (MPAZ). Note the T0≠∞ estimated MPAZ has no error listed as it is not possible to reliably calculate the confidence intervals.

Differing degrees of ambient temperature annealing may also be the reason why mean track lengths in monazite control samples cut perpendicular to the c axis were not always shorter than in those parallel to the (100) face, as was invariably the case for all experiments at higher temperatures. Further, Fig. 4 shows that for all the isochronal experiments, the annealing curves exhibit an initial length reduction of ∼ 5 %–10 % before the 50 ∘C annealing step, which is a feature not observed in annealing experiments in other minerals. This may be due to the mean track length for the control samples not having reached a stable value at ambient temperature prior to the thermal annealing experiments.
Importantly, over the temperature range studied, no conditions have been identified where the tracks are totally stable (Fig. 4), even for experiments conducted at 30 ∘C. Figure 4 also shows that there is a gradual reduction in with temperature, followed by accelerated reduction from ∼ 0.580 to zero. For this reason, values of 0.5 are rarely encountered, with only two slightly lower values (0.460 and 0.488) being observed amongst all 52 experiments. This is a similar behavior to that seen in apatite and zircon (e.g., Green et al., 1986; Yamada et al., 1995). Relatively little difference was observed between the averaged track length reduction of the 100 and 1000 h schedules compared to the shorter annealing times.
In all annealed samples, the mean equivalent confined track length was always less than that for the unannealed control samples. As annealing progresses, the mean track lengths are reduced and become consistently anisotropic with crystallographic orientation, although the differences are small and within error. Tracks implanted at 30∘ dip to polished surfaces oriented perpendicular to the crystallographic c axis and always have shorter mean track lengths than those at 30∘ to the (100) surfaces (as is the case for apatite, e.g., Green et al., 1986). On both of these surface orientations the dips were constant, but there was limited control on the azimuth orientations of the collimated tracks, and thus the exact relationship to crystallographic orientation is not clear. However, the distribution of track orientations will cover a different range on the two surfaces so that anisotropy of annealing can clearly be detected. As annealing progresses, the amount of anisotropy generally increases across all annealing schedules for the two surface orientations, with the exception of 100 h. In other words, tracks on surfaces oriented perpendicular to the crystallographic c axis anneal faster with increasing temperature. Anisotropy is still present in the 100 h schedule, but no clear increase in the difference between calculated confined track lengths is apparent for the two differently oriented surface planes. Anisotropy is greatest in the 1000 h, 250 ∘C experiments, where there is a ∼ 1.06 µm difference between the two surface orientations (Fig. 5). This is possibly due to only 187 semi-track lengths being measured in the c axis perpendicular aliquot (as most were completely annealed) compared to 500 in the parallel aliquot.
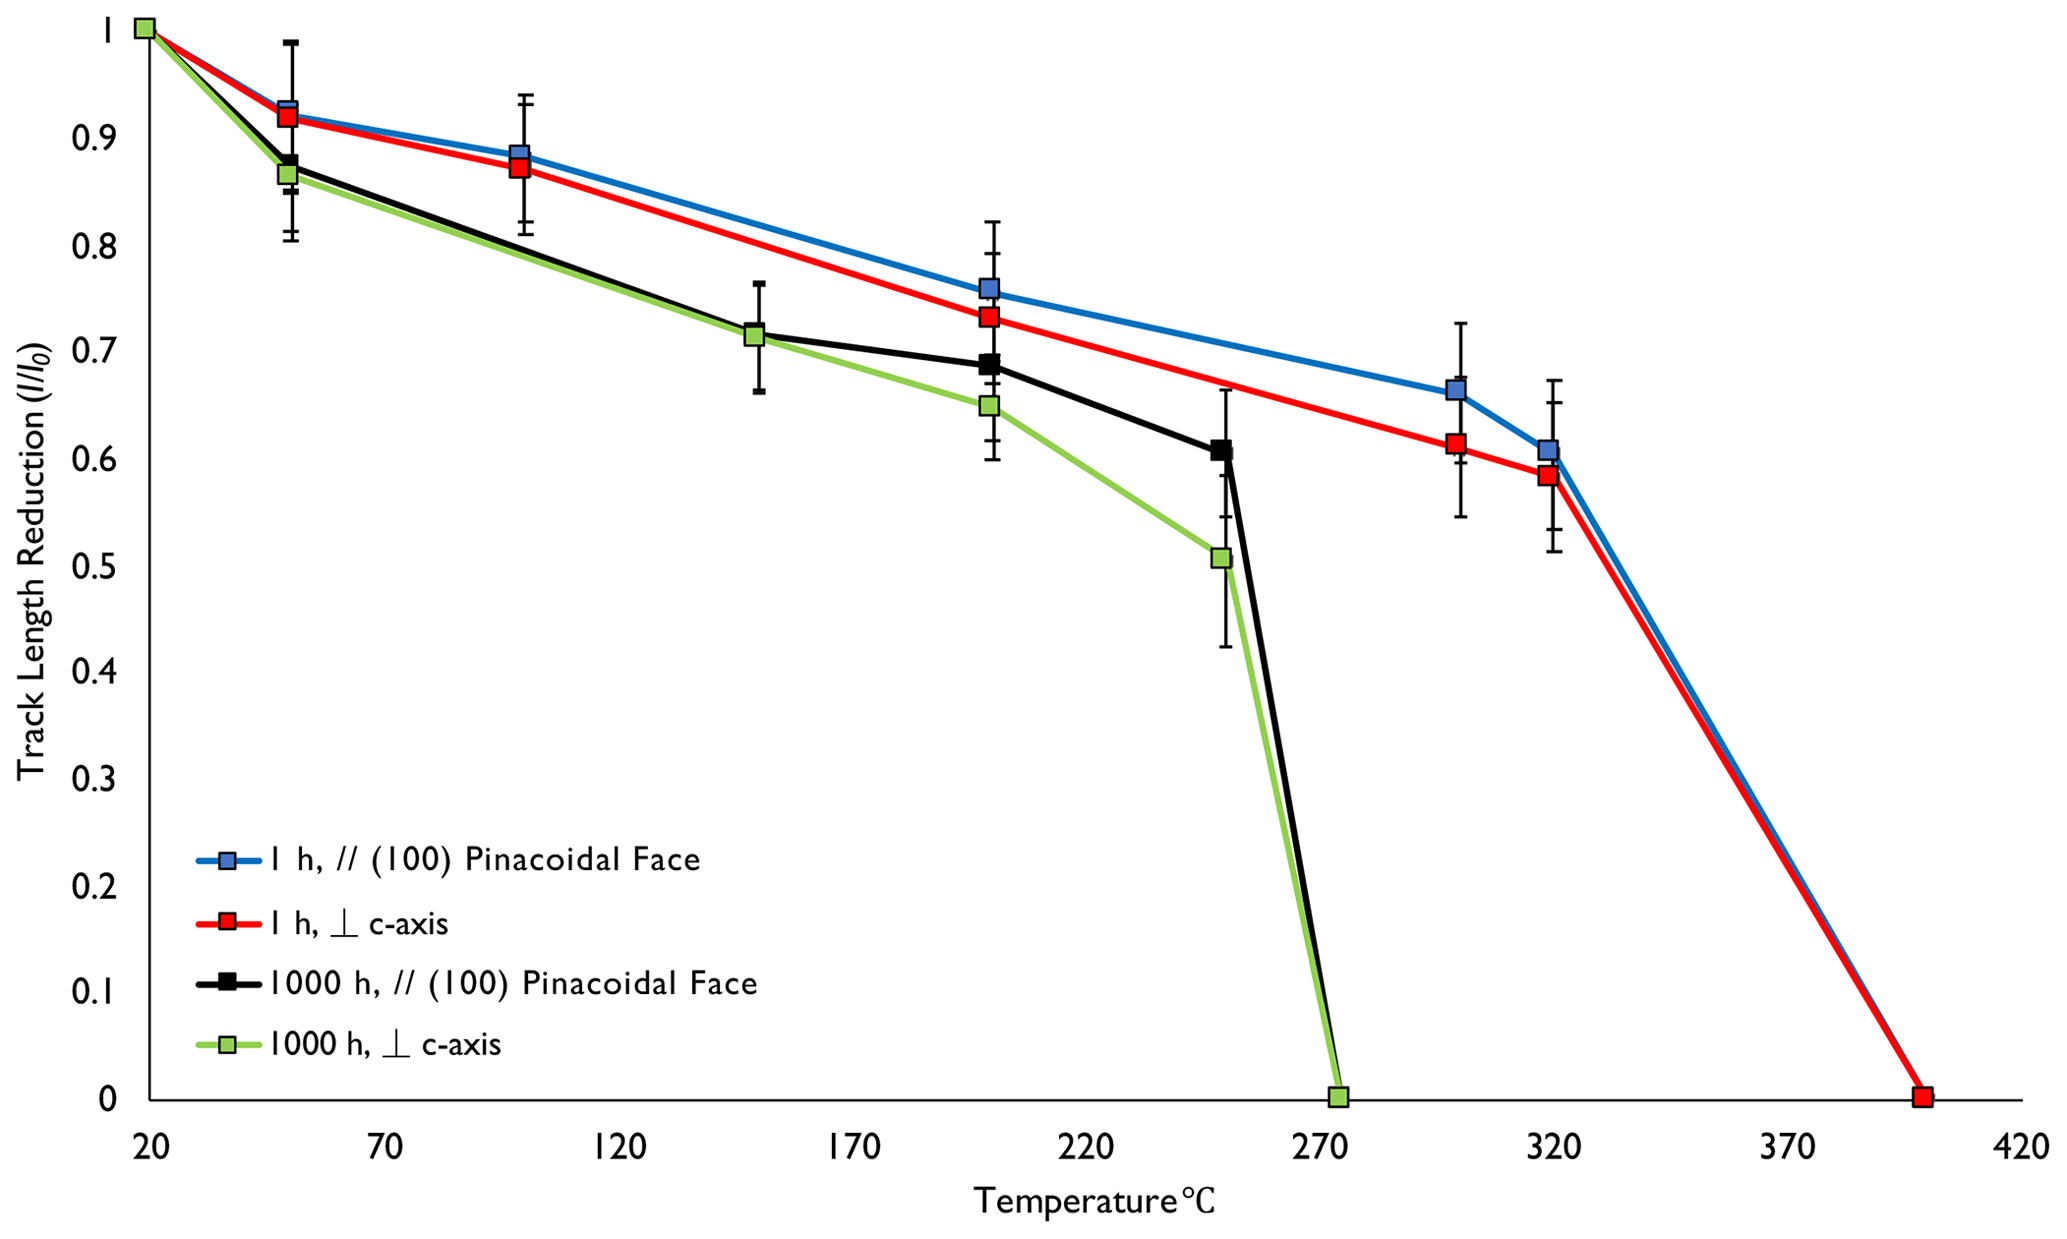
Figure 5Normalized track length reduction () against temperature for calculated equivalent confined fission tracks for 1 and 1000 h experiments for both surface orientations (// and ⊥ surfaces, as in Fig. 4). The normalized track length () values are calculated from the average length of the control samples (10.60 µm). Error bars refers to 1σ errors.
Figure 6 shows the relationship between the standard deviation and mean track length for the length distributions of single fission fragment 252Cf tracks. The results vary between 0.52 and 1.08 µm and are mostly consistent with a mean of 0.71 µm but with considerable scatter. The results suggest an increase in standard deviation at short mean lengths, as is observed for confined track length measurements in apatite during annealing (e.g., Green et al., 1986, Fig. 3) because of increasing anisotropy. For monazite, the amount of anisotropy also appears to increase as the mean track length decreases, giving an increase in dispersion of individual track lengths and hence standard deviation. The most extreme annealing observed is for the 1000 h, 250 ∘C experiment, with a standard deviation of 1.08 µm, which shows the greatest degree of anisotropy. Although the results are highly scattered, it appears that there is a slight increase in standard deviation towards the longer mean track lengths. No explanation for such a trend is apparent, but we note that no similar effect has been observed in annealing experiments of confined track lengths in apatite (e.g., Green et al., 1986).
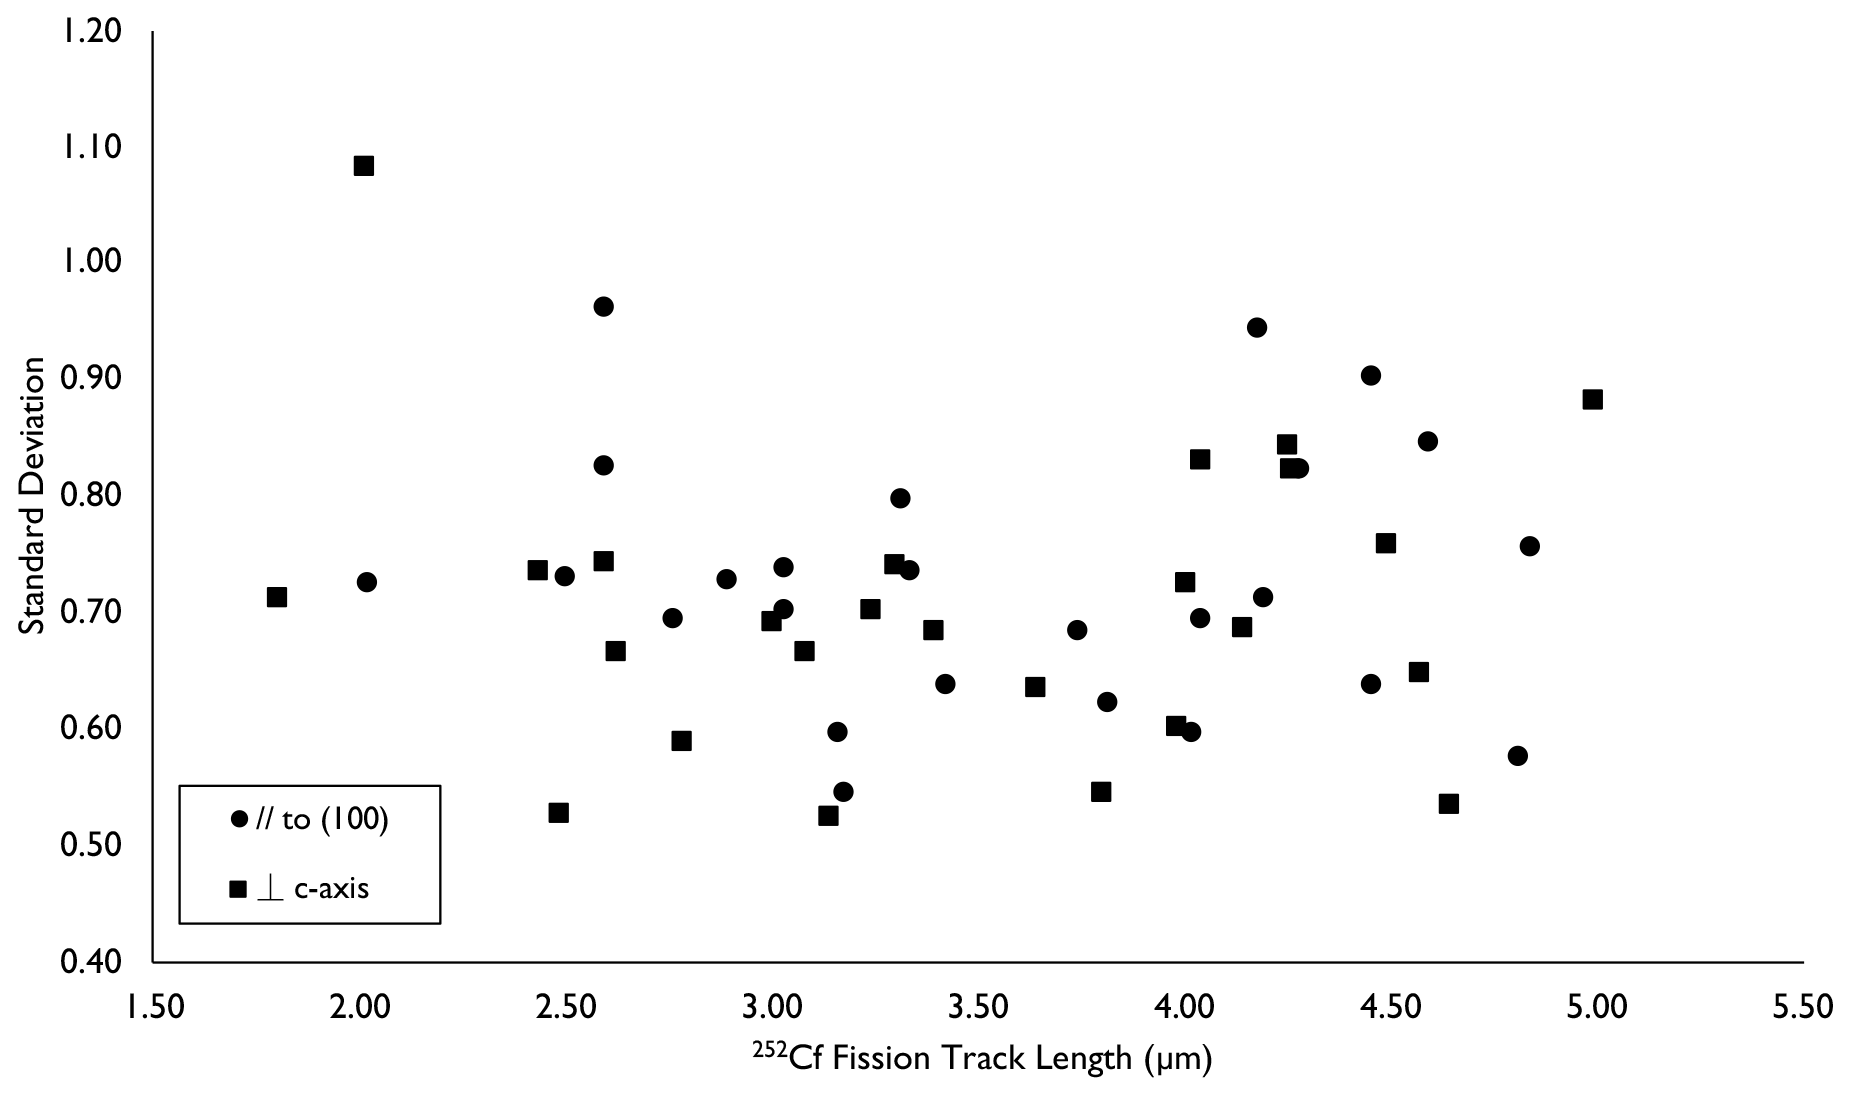
Figure 6Standard deviation of 252Cf fission track length distributions plotted against their average track lengths for both parallel and perpendicular surfaces across all experiments.
Results of the Harcourt granodiorite monazite annealing experiments are shown on an Arrhenius plot of log time versus inverse absolute temperature in Fig. 7. Results are averaged across both surface orientations, and the normalized track length () values are calculated relative to the average length of the unannealed control samples (l0=10.60 µm). In the plot, normalized track length values in a particular range are represented by the same symbol and exhibit linear trends with positive correlation. To extrapolate laboratory annealing results in Arrhenius plots to geological timescales, three types of model fitting have traditionally been used to determine a functional form of the fission track annealing kinetics, i.e., the “parallel model” and two variations of the “fanning model” (Laslett et al., 1987).
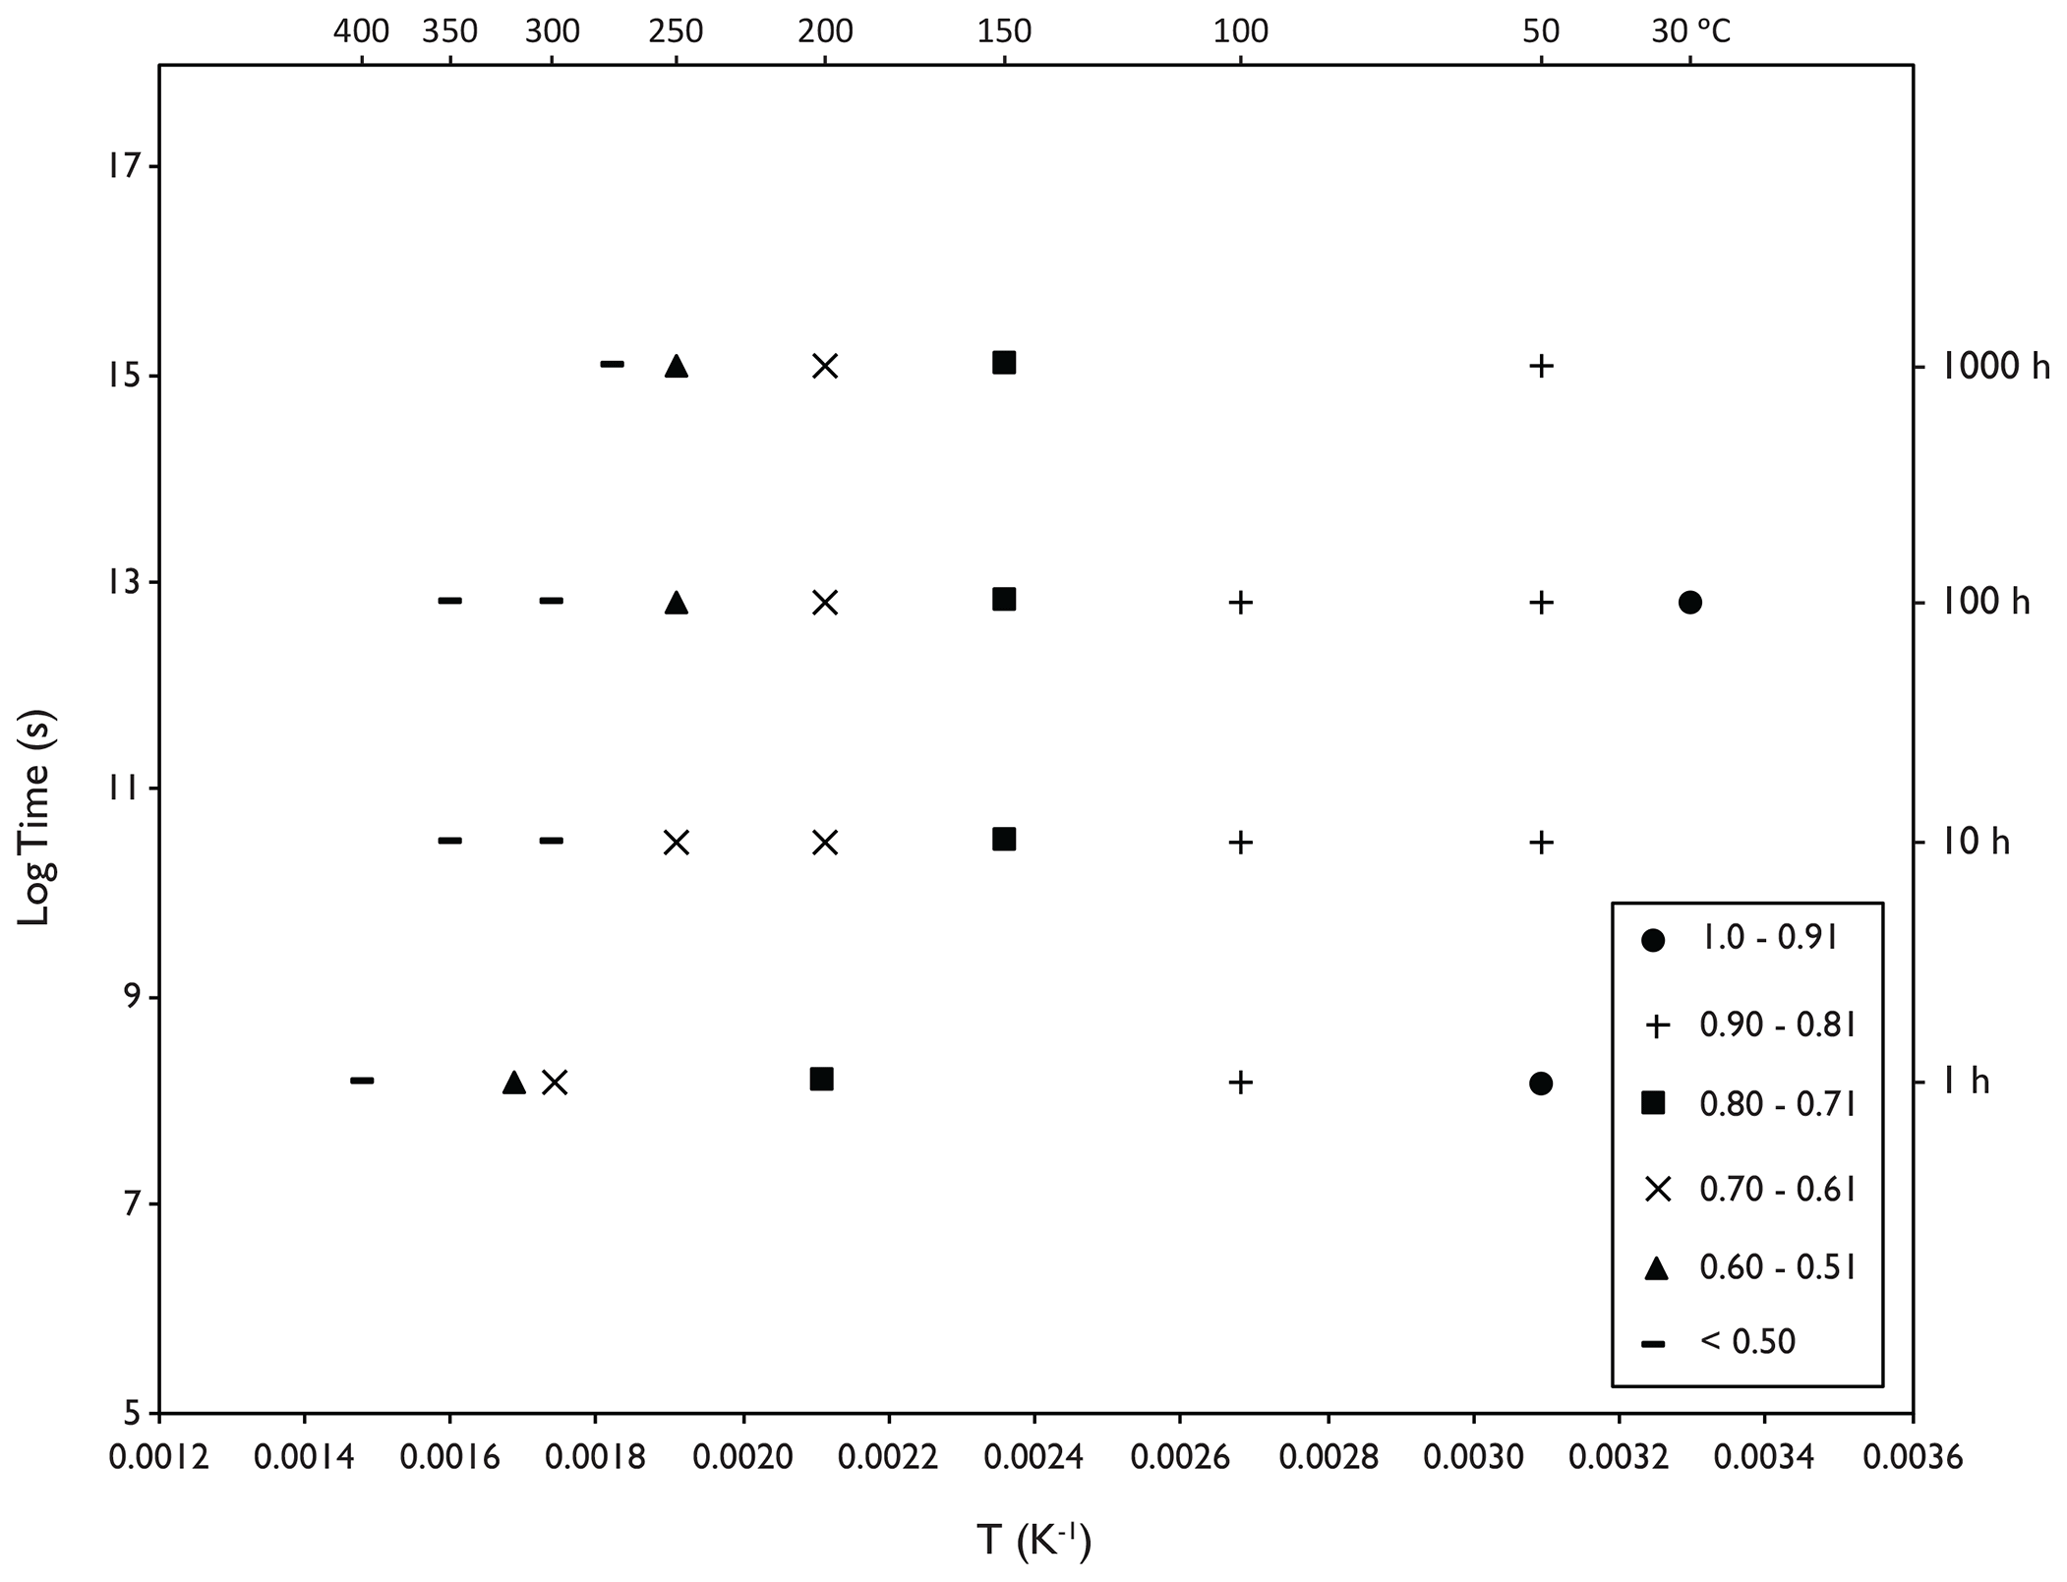
Figure 7Arrhenius plot of experimental data using calculated equivalent confined fission track lengths in Harcourt granodiorite monazite. Each point represents two annealing experiments that have been averaged across both orientations (// and ⊥ surfaces, as in Fig. 4). Different degrees of track length reduction (r) are shown by different symbols. Inverse absolute temperature in Kelvin is shown on the x axis, and the corresponding temperatures in ∘C are shown along the top.
5.1 Parallel linear model
As a starting point, the annealing data of this study will be tested with the “parallel model” that has straight line contours (Laslett et al., 1987):
where t is annealing time; T is annealing temperature (K); A(r) is the intercept of the lines (at ), which is a function of the most reliable values of normalized mean length r; and B is the slope, which is a constant for all degrees of annealing. The intercept A (r) is subject to the following constraints: (1) A (r) decreases monotonically with increasing r, and (2) A (r=1) when t→0, T→0. It should be noted that r=0 for finite values of t and T provided they are large enough in practice.
The fully parameterized parallel model has the following form:
or
where C0=c1; C1=c2; ; is a transform containing r and the two parameters a and b; and ε represents errors or residuals. ε is assumed to be normally distributed with mean μ=0 and constant variance σ2. This assumption can be checked by a residual plot for the model in Fig. 9. A single Box–Cox transformation was adopted and was found to be better suited to the data than the double Box–Cox (Box and Cox, 1964):
In the model of Eq. (3), parameters and uncertainties (standard error) were evaluated for the datasets in Table 4 as follows:
and
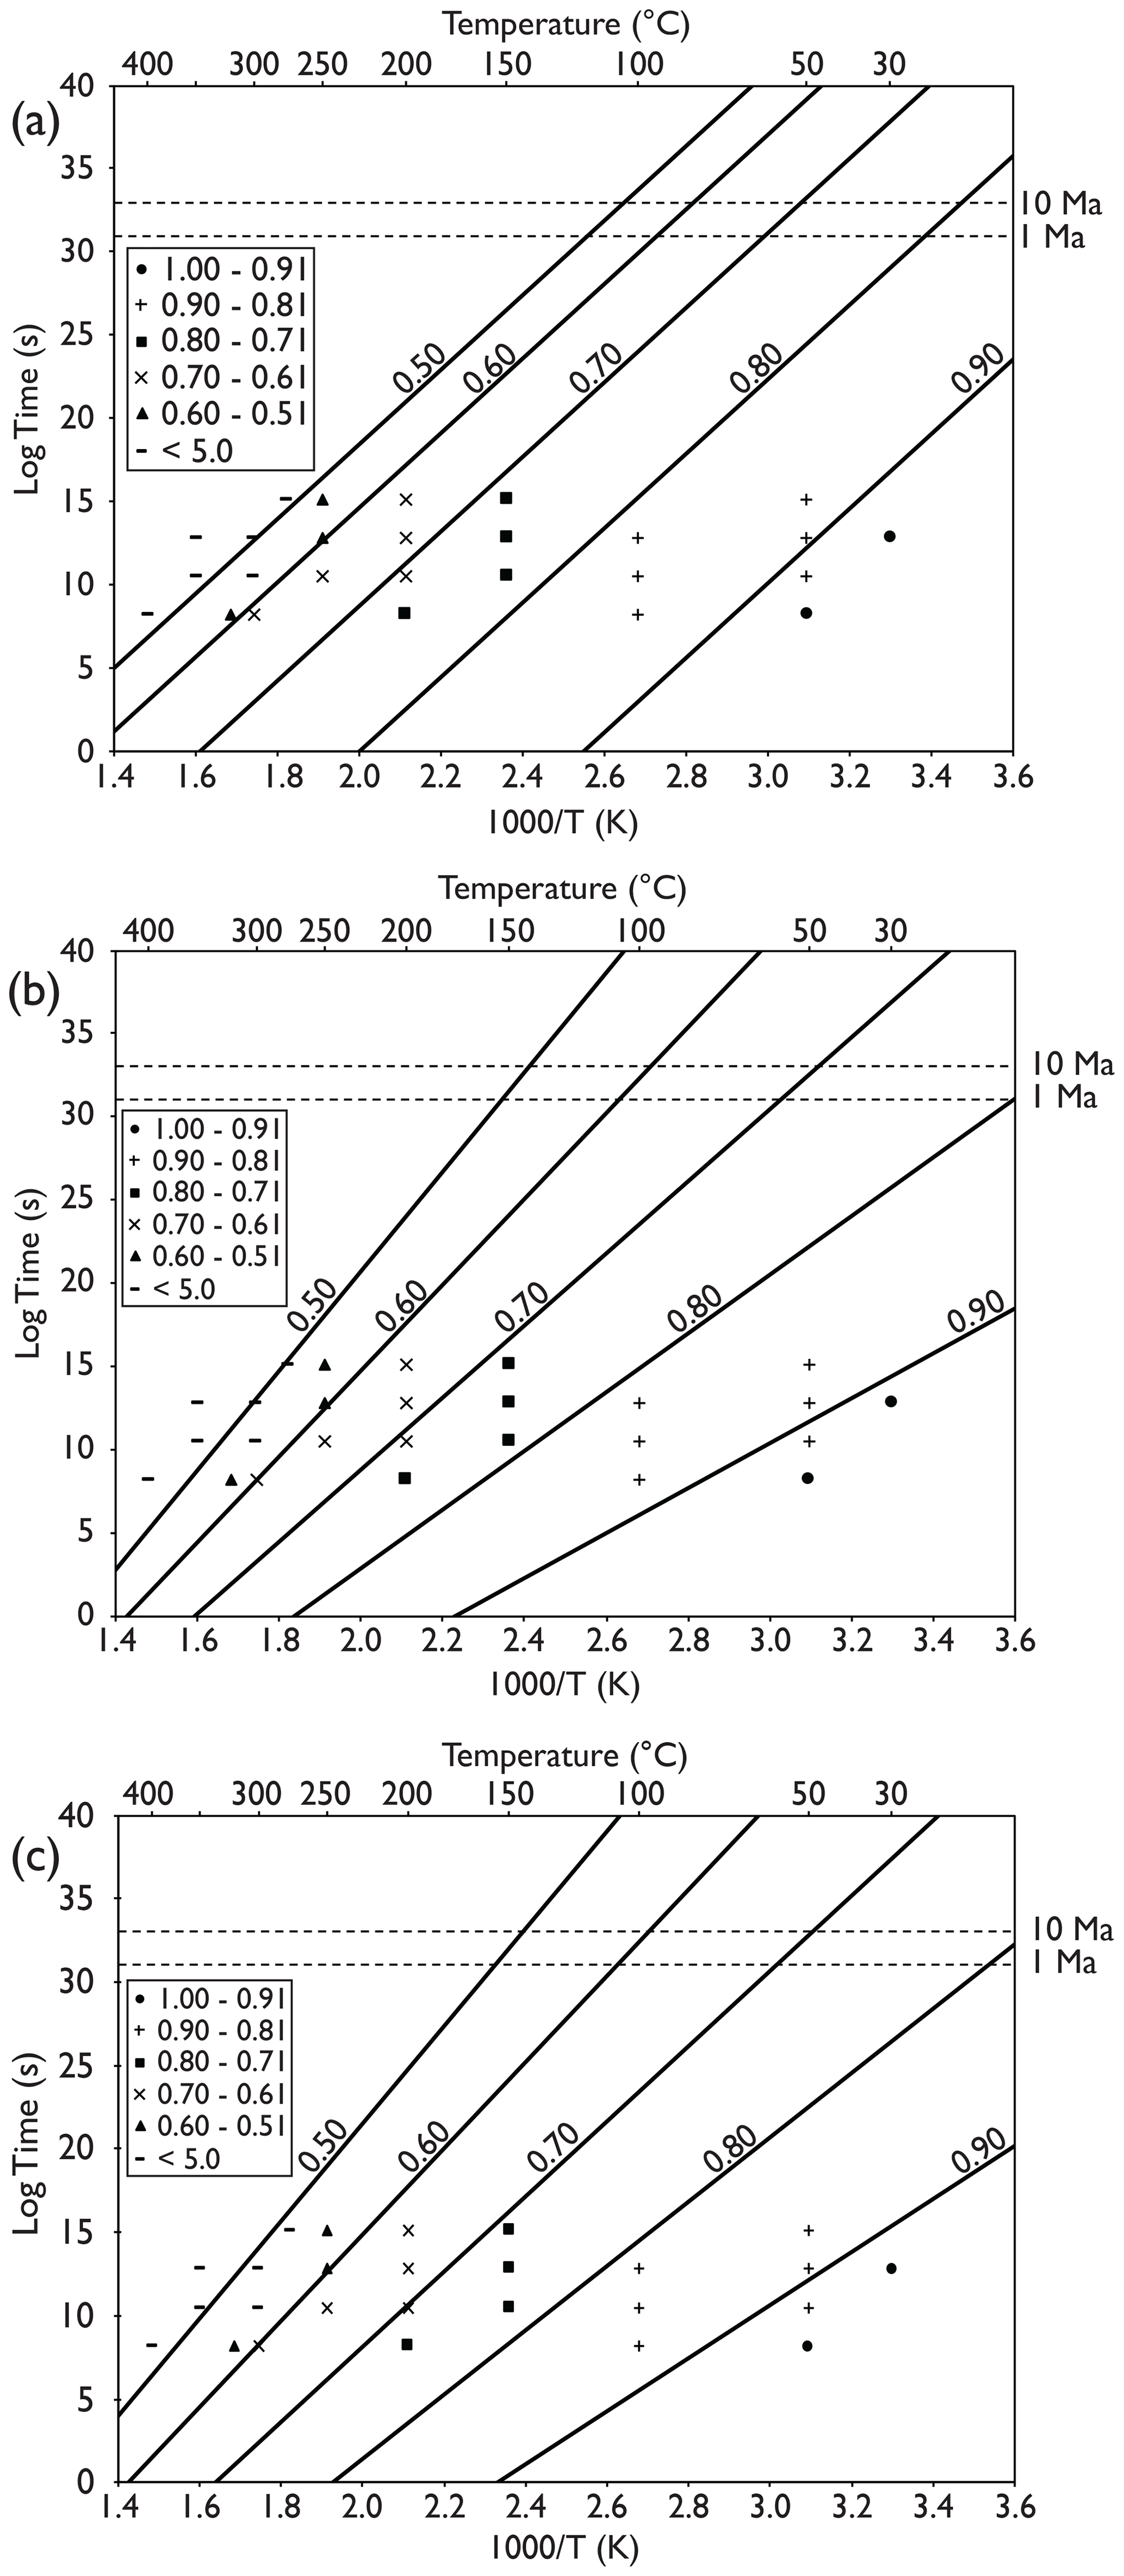
Figure 8Arrhenius plots with fitted lines extrapolated to geological timescales: (a) parallel model, (b) fanning model (T0≠∞) and (c) fanning model (T0=∞). Each plot was obtained by adopting specific equations, i.e., (a) Eq. (3), (b) Eq. (10) and (c) Eq. (11) (see text), and parameters as in Table 4. Values of normalized mean length (r) for each contour are indicated on the plots, ranging from 0.90 to 0.50. Symbols are the same as for Fig. 5.

Figure 9Residual plots for the best-fitting calculations for each model (ε in Eqs. 3, 10 and 11). Each point represents one annealing experiment.
5.2 Fanning linear model
The fanning Arrhenius plot of Laslett et al. (1987) has slopes of contour lines that change with a variation of activation energy E with the degree of annealing. In this case, Eq. (1) becomes
where both slope B(r) and intercept A(r) are a function of r. A first-order assumption of this equation is that A(r) is a negative linear function of B(r):
where c3 and c4 are constants by analogy with the “compensation law” for diffusion (e.g., Hart, 1981). This causes the contours to fade and meet at a single point on the Arrhenius plot. Combining Eqs. (4) and (5) gives
where and . T0 is known as the “critical temperature”, which is the temperature of the “cross-over point” of the fading contours (e.g., Crowley et al., 1991). Solving Eq. (6) for B(r) gives
Constraints for slope B(r) are that (1) B(r) decreases monotonically with increasing r and that (2) B(r=1) → 0 when ln, T→0. The fully parameterized model is given as follows:
or
where C0=c1, C1=c2, , and C3= 1/T0. When C3=0, this assumes an infinite critical temperature (i.e., T0=∞). The equation can be rearranged to
The number of parameters is reduced from four to three, simplifying the equation. The parameters and uncertainties (standard error) for the models in Eq. (10) were calculated as follows:
and
In the case where T0≠∞, Eq. (9) was adopted for the fitting calculation. The parameters and uncertainties were evaluated as follows:
and
Both single and double Box–Cox transforms were applied to Eqs. (10) and (11). A single Box–Cox transformation was better suited to fit the data; however, it did not statistically improve the models. A t test found that Eq. (11) with a single Box–Cox transformation had a p value of 0.096. Generally, a p value < 0.05 provides strong evidence against the null hypothesis and suggests that it should be rejected. Whereas a ρ value > 0.05 indicates weak evidence against the null hypothesis and fails to reject it. In the case of Eq. (11), the null hypothesis is the equation without a transformation, and the alternative is to include the single Box–Cox transformation. Using a similar form of test for Eq. (10) found that the C3 constant produced a ρ value of 0.123. This high p value suggests that the constant is not preferred and that the model from Eq. (11) is more parsimonious. For these reasons, the final fanning models are presented with no transformation (Eqs. 10 and 11) and their assumptions can be checked in Fig. 9.
5.3 Comparison of Arrhenius models
Table 4 and Fig. 8 present the results of the model-fitting calculations and their associated Arrhenius plots. The models show the full dataset with contours of equal length reduction extrapolated to geological timescales. The parallel model, which has a constant activation energy with decreasing r, statistically describes the data marginally better than the two fanning models (coefficient of determination of 0.99 compared to 0.97 for both fanning models). Nevertheless, the two fanning models, which have an increasing activation energy with decreasing r, still describe the data very well. Although the coefficient of determination of the two fanning models are equal, the p value of 0.128 for constant C3 in Eq. (10) suggests that the simpler model is the more favorable one. Residual plots for each model (Fig. 9) show no clear structure, suggesting that the residuals do not contradict the linear assumption of the models. In previous studies (e.g., Crowley et al., 1991; Laslett et al., 1987; Yamada et al., 1995), both fanning models have a Box and Cox (1964) or similar type of transformation on the left-hand side of the equation, but because they did not statistically improve them, they were abandoned in this study. The fanning models, as they stand, explain the data very well, and in general, when constructing empirical models to be used as the basis of prediction, simple models with less fitted parameters are generally preferable (Laslett et al., 1987). Regardless whether a model uses a transformation or not, all models presented in this study give a statistically satisfactory description of the available data.
When comparing the models over laboratory timescales, little difference is observed between them, particularly at length reductions < 0.80. The 0.90 track reduction contour shows the largest difference over laboratory timescales, where both fanning models splay out to lower temperatures. This suggests that fission tracks in monazite are even more sensitive to low-temperature annealing in the fanning models than the parallel model. As with all such annealing studies, differences in annealing are magnified when the data are extrapolated to geological timescales. The assumption underlying such extrapolations is that track annealing results from the same physical mechanism under both laboratory and geological conditions. All models show that significant reduction in the etchable lengths of fission tracks takes place at ambient and lower temperatures (< 20 ∘C) over geological timescales and that monazite is particularly sensitive to low-temperature thermal annealing. Considerably more track shortening would occur in the shallow upper crust between temperatures of ∼ 50 and 160 ∘C over geological timescales of 1–10 Myr. Complete annealing of fission tracks occurred very rapidly when the equivalent confined track length reduction decreased below ∼ 0.5.
Weise et al. (2009) presented a linear fanning model that used contours representing the amount of track length reduction of implanted Kr tracks in monazite rather than the normalized reduction () as used here. However, similarities can be seen between the different approaches. Both models show considerable track annealing at ambient surface temperatures or below over geological timescales. Therefore, they are in agreement that a total fission track stability zone is absent for monazite.
As highlighted in Laslett et al. (1987), there is no good reason why the contours in the fanning Arrhenius plot need to be straight, and an alternative fanning curvilinear model has been proposed in the case of apatite by Ketcham et al. (2007, 1999). It is not possible to evaluate such a fanning curvilinear model for monazite from the available data, and many more data points, especially for even longer heating schedules, would be required.
Geological temperature ranges for the monazite partial annealing zone (MPAZ) were calculated by extrapolating model equations to the geological timescale with parameters derived from the annealing experiments (Table 4). The temperature limits of the MPAZ are here approximated to be .95 and 0.50 because measurements are difficult and imprecise outside this range (cf. Green et al., 1986, for apatite and Yamada et al., 1995, for zircon). Track length reductions below this threshold are rarely observed (see Fig. 4). The parallel model (Fig. 8a) shows estimates of the MPAZ for a heating duration of 107 years of ∼ −44 to 101 ∘C. Both fanning models estimate a wider temperature range for the same heating duration: −89 to 140 ∘C () and −71 to 143 ∘C (). The uncertainties of estimated temperatures are ca. ±6–21 ∘C for Eqs. (3) and (11) (2 standard errors). The bootstrapping method for calculating the uncertainties of the estimated MPAZ temperatures could not be confidently calculated for Eq. (10), and therefore error estimates have not been included for this model. The inability to confidently calculate the uncertainties of Eq. (10) further supports the choice of Eq. (11) () as the preferred fanning model. Of the two remaining estimates for the MPAZ range (Eqs. 3 and 11), based on the coefficients of determination, the parallel model is slightly preferable. However, the fanning model of Eq. (11) also describes the data almost as well and should not be ruled out. In fact, annealing studies of other minerals such as zircon and apatite have shown a fanning model to best fit their respective datasets (e.g., Ketcham et al., 1999; Laslett et al., 1987; Yamada et al., 1995).
Taking the fission track closure temperature (Tc) to be approximately the middle of the MPAZ, predicted closure temperatures for the monazite fission track system range between ∼ 45 and 25 ∘C over geological timescales of 106–107 years. These results are consistent with the findings of Weise et al. (2009), the only other study to estimate a Tc for the monazite fission track system, who estimated Tc to be < 50 ∘C and perhaps not much above ambient.
Using implanted 252Cf semi-tracks, isochronal annealing experiments were performed on monazite crystals from the Harcourt granodiorite in central Victoria, Australia. Semi-track lengths were measured and combined with an estimate of the degree of surface etching to give calculated equivalent confined fission track lengths. The unannealed equivalent confined fission track lengths (control samples) have a mean length of 10.60 ± 0.19 µm, which is broadly consistent with the measured lengths of spontaneous 238U confined tracks reported by Weise et al. (2009). As annealing progresses, the mean calculated confined track length decreases anisotropically to a small degree. Tracks on surfaces parallel to (100) and perpendicular to the c axis anneal at slightly different rates, but the differences are much smaller than observed in apatite.
Using the equations of Laslett et al. (1987), three empirical models describe the data very well, with the parallel Arrhenius plot fitting the data slightly better than two alternative fanning models. The differences between these models are negligible, however, and for consistency with annealing behavior in other minerals (e.g., Green et al., 1986; Yamada et al., 1995) the simpler fanning model (Eq. 11, ) is preferred. Extrapolation of the data to geological timescales suggests that fission tracks in monazite are very sensitive to low-temperature annealing and that significant shortening of tracks occurs even at ambient surface temperatures (∼ 20 ∘C) and below. Continued shortening of tracks occurs at temperatures between ∼ 50 and 160 ∘C when extrapolated to geological timescales, with few tracks being recorded at lengths of 0.5. Closure temperatures for fission track retention in monazite are estimated to be only 46–25 ∘C over geological timescales of 106–107 years, consistent with the < 50 ∘C estimate of Weise et al. (2009).
There are a range of factors that have not been considered in this study that could possibly influence annealing kinetics. These include compositional variations, a known factor influencing the rate of fission track annealing in apatite (e.g., Green et al., 1985), which can only be evaluated by further work on a much wider range of monazite compositions. A second factor is the possibility of radiation-enhanced annealing (e.g., McDannell et al. 2019). The extremely high actinide content might suggest that monazite should show any such effect to a greater degree than other minerals studied to date. Establishing the purely thermal annealing properties (this study and Weise et al., 2009) is an essential first step for evaluating any such effect in monazite. Our results suggest that thermal annealing alone may be sufficient to explain the relatively young fission track ages previously reported in monazite.
Further confirmation of our preferred annealing model will require detailed comparison of our observations with natural field examples and borehole studies. Nevertheless, it is clear that fission tracks in monazite have the lowest thermal stability of any mineral studied so far and that this system has potential for use as an ultra-low-temperature thermochronometer.
All data used in this study is presented in Sects. 2 and 3.
The supplement related to this article is available online at: https://doi.org/10.5194/gchron-3-89-2021-supplement.
SJ is a PhD student who obtained and analyzed the presented data and prepared the original manuscript. AG and BK provided supervision and contributed to several drafts of the original manuscript. Sample material was provided by AG and BK.
The authors declare that they have no conflict of interest.
We thank Ling Chung for assistance and advice on sample preparation methods and Cameron Patrick from The University of Melbourne Statistical Consulting Centre for assistance with statistical analysis. We thank Ewald Hejl and Dale Issler for their constructive reviews that have substantially improved the manuscript and Cornelia Spiegel for editorial oversight.
Sean Jones received funding from the Australian Government through the Research Training Program (RTP) Scholarship. The Melbourne thermochronology laboratory is supported by the AuScope Program funded under the National Collaborative Research Infrastructure Strategy (NCRIS).
This paper was edited by Cornelia Spiegel and reviewed by Ewald Hejl and Dale Issler.
Badr, M. J., Masoudi, F., Collins, A. S., and Cox, G.: Dating of Precambrian Metasedimentary Rocks and Timing of their Metamorphism in the Soursat Metamorphic Complex (NW IRAN): Using LA–CP-MS, U – Pb Dating of Zircon and Monazite, J. Sci., 21, 311–319, 2010.
Belton, D. X.: The low-temperature thermochronology of cratonic terranes, PhD thesis, School of Earth Sciences, The University of Melbourne, 2006.
Box, G. E. P. and Cox, D. R.: An Analysis of Transformations, J. Roy. Stat. Soc. B Met., 26, 211–252, 1964.
Cenki-Tok, B., Berger, A., and Gueydan, F.: Formation and preservation of biotite – rich microdomains in high – temperature rocks from the Antananarivo Block, Madagascar, Int. J. Earth Sci., 105, 1471–1483, https://doi.org/10.1007/s00531-015-1265-0, 2016.
Clemens, J. D.: Granitic magmas with I-type affinities, from mainly metasedimentary sources: the Harcourt batholith of southeastern Australia, Contrib. Mineral. Petr., 173, 1–20, https://doi.org/10.1007/s00410-018-1520-z, 2018.
Crowley, K. D., Cameron, M., and Schaefer, R. L.: Experimental studies of annealing of etched fission tracks in fluorapatite, Geochim. Cosmochim. Ac., 55, 1449–1465, https://doi.org/10.1016/0016-7037(91)90320-5, 1991.
Donelick, R. A., Roden, M. K., Mooers, J. D., Carpenter, B. S., and Miller, D. S.: Etchable length reduction of induced fission tracks in apatite at room temperature (∼ 23 ∘C): Crystallographic orientation effects and “initial” mean lengths, International Journal of Radiation Applications and Instrumentation, 17, 261–265, https://doi.org/10.1016/1359-0189(90)90044-X, 1990.
Donelick, R. A., O'Sullivan, P. B., and Ketcham, R. A.: Apatite Fission-Track Analysis, Rev Mineral Geochem., 58, 49–94, https://doi.org/10.2138/rmg.2005.58.3, 2005.
Fayon, A. K.: Fission Track Dating of Monazite: Etching Efficiencies as a Function of U Content, in: GSA Annual Meeting, Geological Society of America, Minneapolis, p. 331, 2011.
Fleischer, R. L., Price, P. B., and Walker, R. M.: Nuclear Tracks in Solids, Berkeley, University of California Press, Berkeley, United States of America, 1975.
Gleadow, A., Kohn, B., and Seiler, C.: The Future of Fission-Track Thermochronology, in: Fission-Track Thermochronology and its Application to Geology, edited by: Malusà, M. and Fitzgerald, P., Springer, Gewerbestrasse, Switzerland, 77–92, 2019.
Gleadow, A. J. W., Raza, A., Kohn, B. P., and Spencer, S. A. S.: The potential of monazite as a new low-temperature fission-track thermochronomter, 10th International Conference on Fission Track Dating, Amsterdam, 2004.
Gleadow, A. J. W., Gleadow, S. J., Frei, S., Kohlmann, F., and Kohn, B. P.: Automated analytical techniques for fission track thermochronology, Geochim. Cosmochim. Ac., 73, p. 441, 2009.
Green, P. F., Duddy, I. R., Gleadow, A. J. W., Tingate, P. R., and Laslett, G. M.: Fission-track annealing in apatite: Track length measurements and the form of the Arrhenius plot, Nucl. Tracks Rad. Meas., 10, 323–328, https://doi.org/10.1016/0735-245X(85)90121-8, 1985.
Green, P. F., Duddy, I. R., Gleadow, A. J. W., Tingate, P. R., and Laslett, G. M.: Thermal annealing of fission tracks in apatite 1. Variable temperature behaviour, Chem. Geol., 59, 237–253, https://doi.org/10.1016/0168-9622(88)90019-X, 1986.
Hart, S. R.: Diffusion compensation in natural silicates, Geochim. Cosmochim. Ac., 45, 279–291, 1981.
Jones, S., Gleadow, A., Kohn, B., and Reddy, S. M.: Etching of fission tracks in monazite: An experimental study, Terra Nova, 1–10, 179–188, https://doi.org/10.1111/ter.12382, 2019.
Ketcham, R. A., Donelick, R. A., and Carlson, W. D.: Variability of apatite fission-track annealing kinetics: III. Extrapolation to geological time scales, Am. Mineral., 84, 1213–1223, 1999.
Ketcham, R. A., Carter, A., Donelick, R. A., Barbarand, J. B., and Hurford, A. J.: Improved modeling of fission-track annealing in apatite, Am. Mineral., 92, 799–810, https://doi.org/10.2138/am.2007.2281, 2007.
Laslett, G. M., Green, P. F., Duddy, I. R., and Gleadow, A. J. W.: Thermal annealing of fission tracks in apatite 2. A quantitative analysis, Chem. Geol., 65, 1–13, https://doi.org/10.1016/0168-9622(87)90057-1, 1987.
Malusa, M. G. and Fitzgerald, P. G. (Eds.): Fission-Track Thermochronology and its Application to Geology, Springer Textbooks in Earth Sciences, Geography and Environment, Gewerbestrasse, Switzerland, 2019.
Mcdannell, K. T., Issler, D. R., and Sullivan, P. B. O.: Radiation-enhanced fission track annealing revisited and consequences for apatite thermochronometry, Geochim. Cosmochim. Ac., 252, 213–239, https://doi.org/10.1016/j.gca.2019.03.006, 2019.
Sandhu, A. S., Singh, L., Ramola, R. C., Singh, S., and Virk, H. S.: Annealing Kinetics of Heavy Ion Radiation Damage in Crystalline Minerals, Nucl. Instrum. Methods, 46, 122–124, 1990.
Shipley, N. K., and Fayon, A. K. Vanishing Act: Experiments on Fission Track Annealing in Monazite, AGU Fall Meeting Abstracts, T11D-0471, 2006.
Shukoljukov, J. A. and Komarov, A. N.: Tracks of uranium fission in monazite (in Russian), Bulletin of the Commission for the Determination of the Absolute Age of Geological Formations, Moscow, Akad. Nau, USSR, 20–26, 1970.
Tamer, M. and Ketcham, R.: Is Low-Temperature Fission-Track Annealing in Apatite a Thermally Controlled Process?, Geochem. Geophy. Geosy., 21, 110, https://doi.org/10.1029/2019GC008877, 2020.
Tickyj, H., Hartmann, L. A., Vasconcellos, M. A. Z., Philipp, R. P., and Remus, M. V. D.: Electron microprobe dating of monazite substantiates ages of major geological events in the southern Brazilian shield, J. S. Am. Earth Sci., 16, 699–713, https://doi.org/10.1016/j.jsames.2004.01.001, 2004.
Ure, A.: Annealing characteristics of fission tracks in monazite: Application of a new method for performing thermal annealing experiments using implanted 252Cf fission fragment semi-tracks, BSc (Hons) thesis, School of Earth Sciences, The University of Melbourne, 2010.
Wagner, G. A. and Van den Haute, P.: Fission-Track Dating (2nd Edn.), Kluwer Academic Publishers, Stuttgart, Germany, 1992.
Weise, C., van den Boogaart, K. G., Jonckheere, R., and Ratschbacher, L.: Annealing kinetics of Kr-tracks in monazite: Implications for fission-track modelling, Chem. Geol., 260, 129–137, https://doi.org/10.1016/j.chemgeo.2008.12.014, 2009.
Yamada, R., Tagami, T., Nishimura, S., and Ito, H.: Annealing kinetics of fission tracks in zircon: an experimental study, Chem. Geol., 122, 249–258, https://doi.org/10.1016/0009-2541(95)00006-8, 1995.