the Creative Commons Attribution 4.0 License.
the Creative Commons Attribution 4.0 License.
 | 23 Feb 2022
Short communication: Experimental factors affecting fission-track counts in apatite
Carolin Aslanian
Raymond Jonckheere
Bastian Wauschkuhn
Lothar Ratschbacher
The tools for interpreting fission-track data are evolving apace, but, even so, the outcomes cannot be better than the data. Recent studies showed that track etching and observation affect confined-track length measurements. We investigated the effects of grain orientation, polishing, etching and observation on fission-track counts in apatite. Our findings throw light on the phenomena that affect the track counts and hence the sample ages, whilst raising the question: what counts as an etched surface track? This is pertinent to manual and automatic track counts and to designing training strategies for neural networks. Counting prism faces and using the ζ calibration for age calculation are assumed to deal with most etching- and counting-related factors. However, prism faces are not unproblematic for counting, and other surface orientations are not unusable. Our results suggest that a reinvestigation of the etching properties of different apatite faces could increase the range useful for dating and lift a significant restriction for provenance studies.
- Article
(8199 KB) - Full-text XML
-
Supplement
(2626 KB) - BibTeX
- EndNote


Fission-track dating and temperature–time path modeling are much used thermochronological tools for geological research. The fission-track method rests on counting and measuring the lattice damage trails caused by uranium fission. Latent fission tracks in apatite are ∼20 µm long (Bhandari et al., 1971; Jonckheere, 2003) and ∼10 nm wide (Paul and Fitzgerald, 1992; Paul, 1993; Li et al., 2011, 2012, 2014), too thin to observe with an optical microscope. The polished grain mounts are therefore etched to make them visible. It is often taken for granted that factors related to etching and counting are inconsequential, e.g., that counting losses are negligible in slow-etching surfaces such as apatite prism faces. It is also assumed that systematic errors on the track counts cancel out if the sought ages are calibrated against the reference ages of standards (ζ calibration; Hurford, 1990). We believe that, from lack of investigation, there persist certain misconceptions concerning these issues, which lead researchers to overestimate the accuracy of fission-track ages but also to impose undue practical restrictions, such as excluding apatite grains not polished parallel to their c axes from track counts and confined-track length measurements. We report two experiments aimed at a better understanding of fission-track counts and measurements in apatite. Because there is a subjective aspect to the counts (Enkelmann et al., 2005; Jonckheere et al., 2015) and measurements (Ketcham et al., 2015; Tamer et al., 2019), our numerical results must not be generalized. They nevertheless reveal significant trends, which we interpret in the context of a recent etching model and relate to practical dating issues.
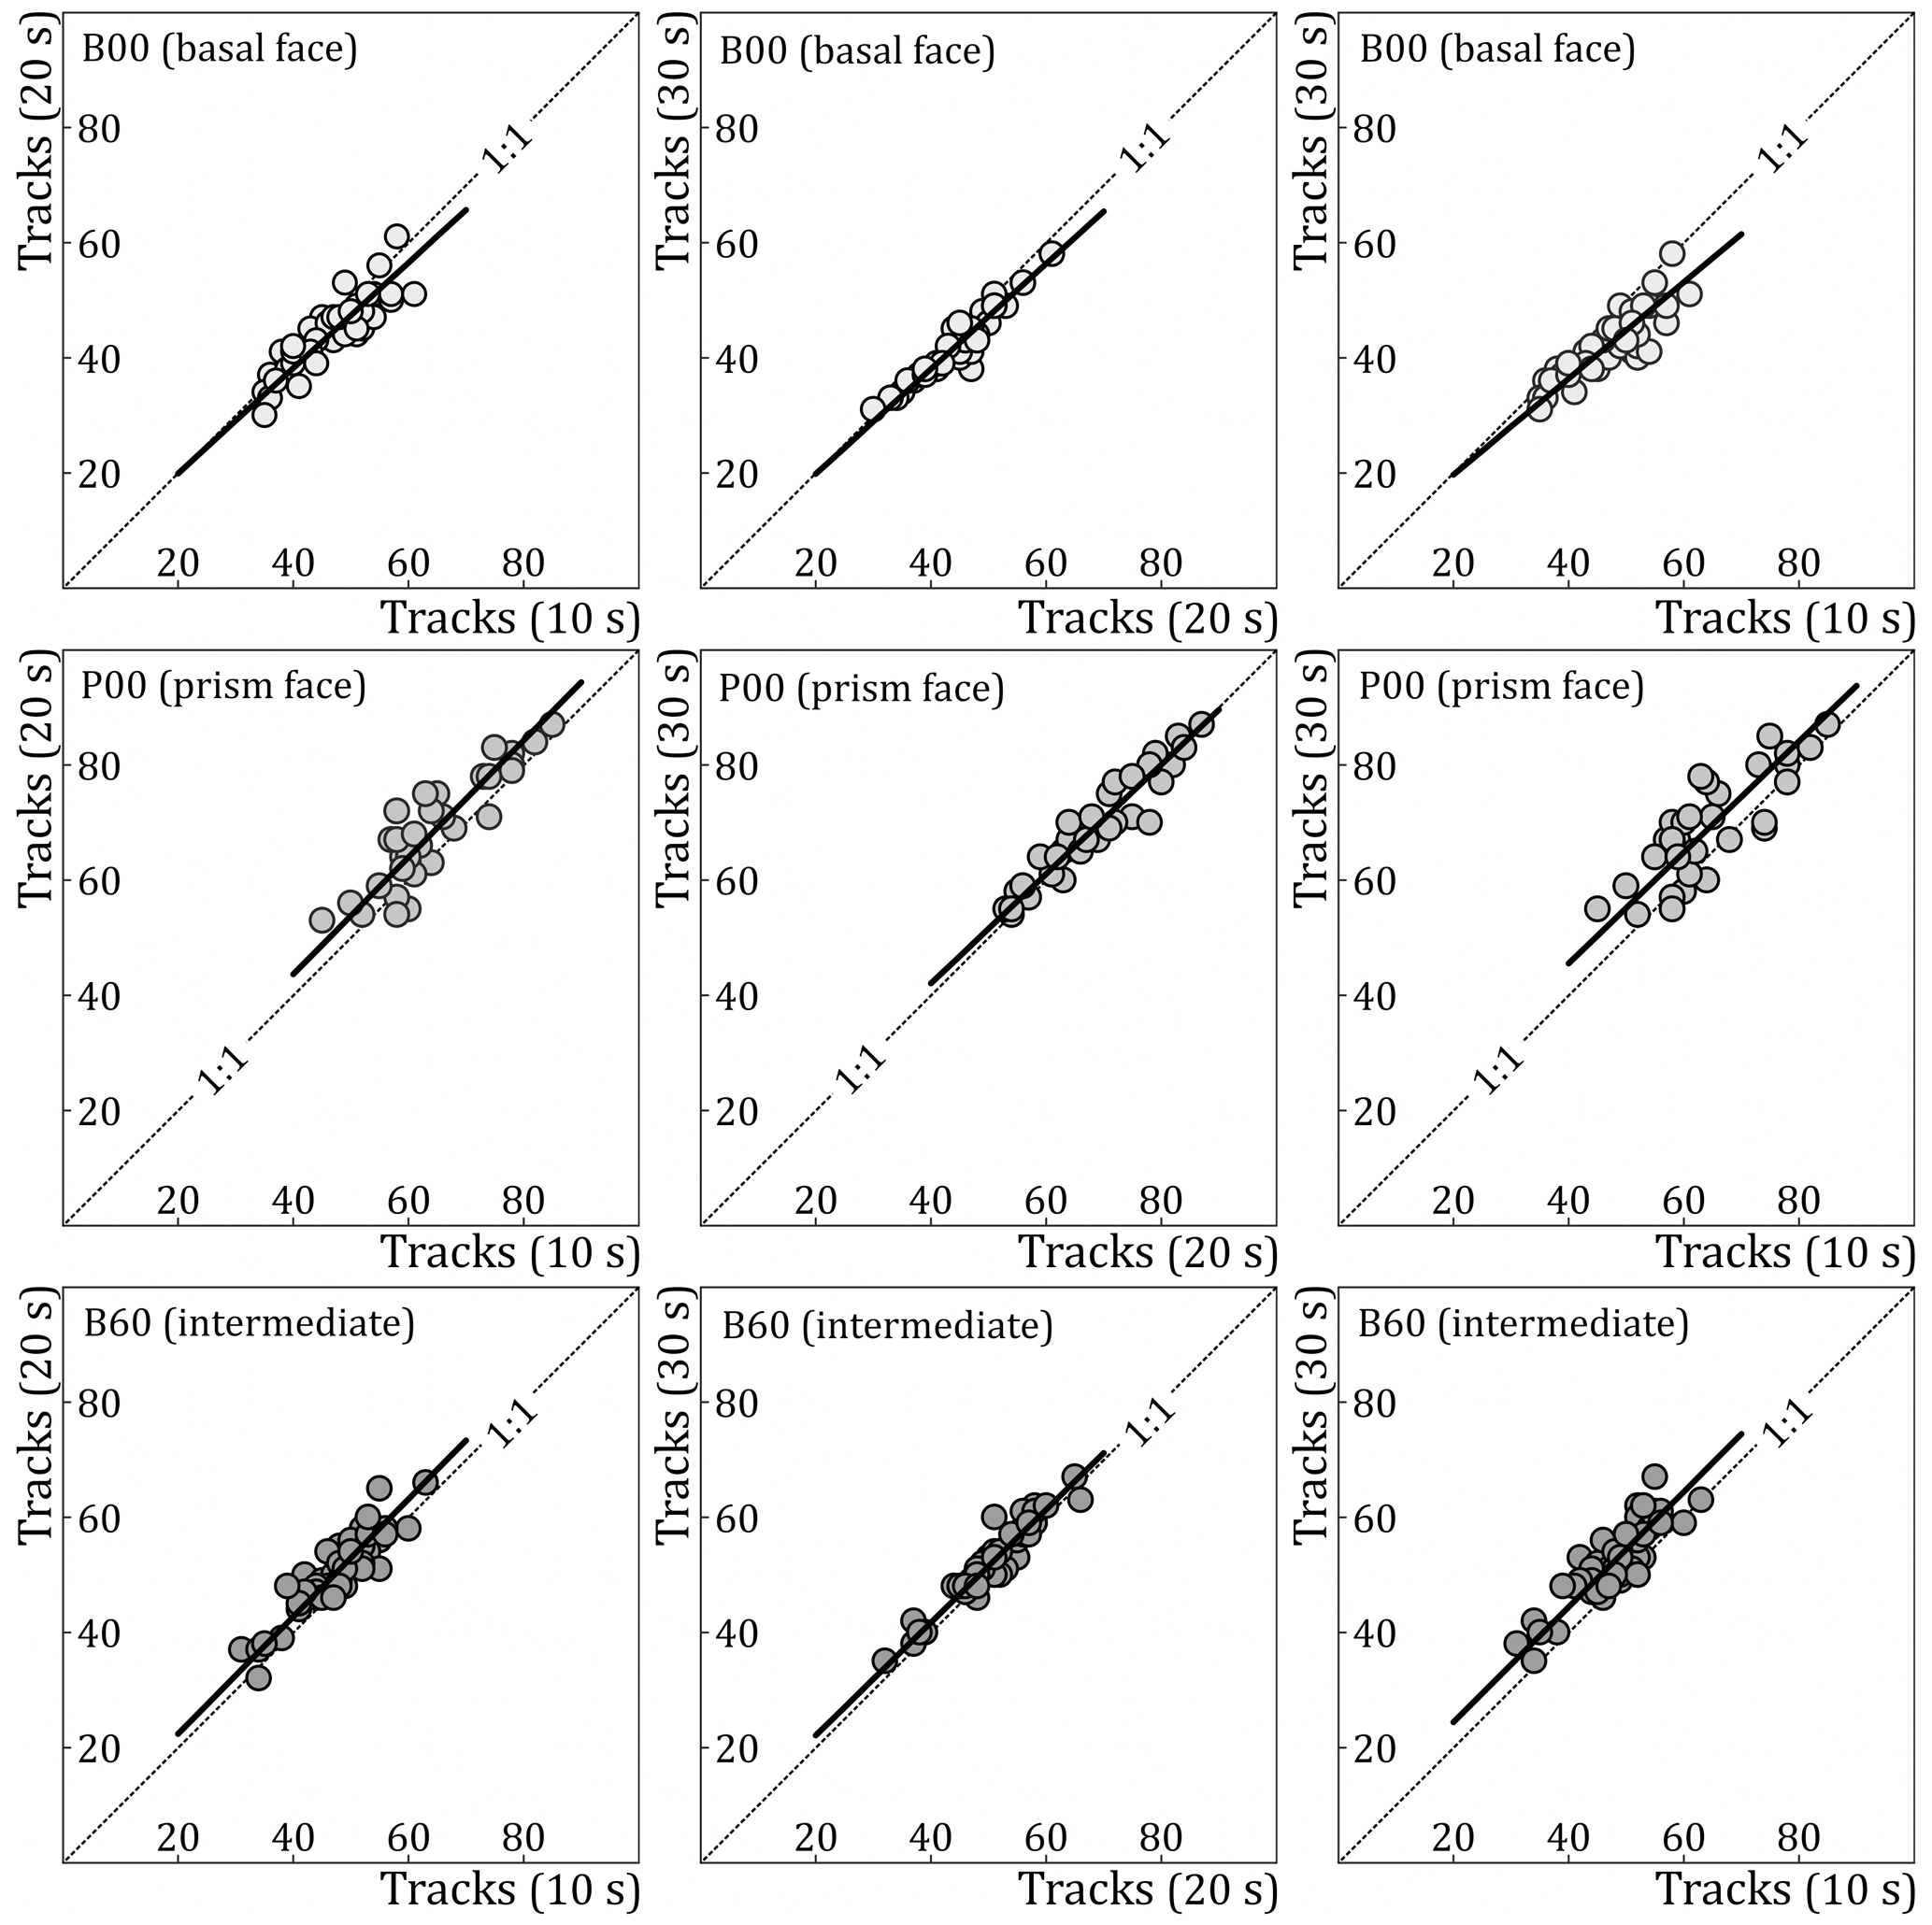
Figure 1Comparison of repeat track counts after 10, 20 and 30 s etching (5.5 M HNO3 at 21 ∘C) in a basal face, prism face and intermediate face of Durango apatite. The solid lines are geometric mean regression lines; their intercepts, slopes and correlation coefficients are listed in Table 1.
We cut plane sections from an unannealed and unirradiated Durango apatite at 0∘ (prism face; sample P00), 30∘ (B60) and 90∘ (basal face; B00) to their c axes and mounted them in resin. We ground and polished the sections with 6, 3 and 1 µm diamond suspensions and a 0.04 µm silica suspension and etched them in 10 s steps for 10, 20 and 30 s in 5.5 M HNO3 at 21 ∘C to reveal the fossil tracks. Reference points on the mounts allowed us to record the position of each investigated area and return to it after each step. At each step, we counted the tracks in transmitted light and measured the track openings in reflected light with a Zeiss Z2m motorized microscope and Märzhäuser stage controlled from a desktop computer running the Autoscan program. Supplement file S1 shows representative images of the different sections at different etch times.
Figure 1 and Table 1 compare the track counts at different etch times. Because the same areas were recounted after each step, deviations from the 1:1 line reflect actual loss or gain of tracks. The individual deviations are random: a track is lost in one area while one is added in a different area of the same sample. In general, track loss dominates in the basal face (B00), while tracks are gained in P00 and B60. The differences between 10 and 30 s amount to ∼10 % of the initial counts. They are smaller from 20 to 30 s etching than from 10 to 20 s but consistent with the initial trend. We interpret this as an indication of a diminishing surface etch rate, linked to decreasing polishing damage with increasing depth below the surface (Kumar et al., 2013; Hicks et al., 2019). The corresponding track counts at 10, 20 and 30 s are little affected by random variation and thus robust; the surface etch rate is therefore a factor meriting further attention.
Table 1Repeat track counts and measured track openings in a basal face (B00), prism face (P00) and an intermediate face (B60) of a Durango apatite after 10, 20 and 30 s etching. Intercepts and slopes and correlation coefficients of geometric mean regression lines in Fig. 1. Detailed data in the Supplement file S2.
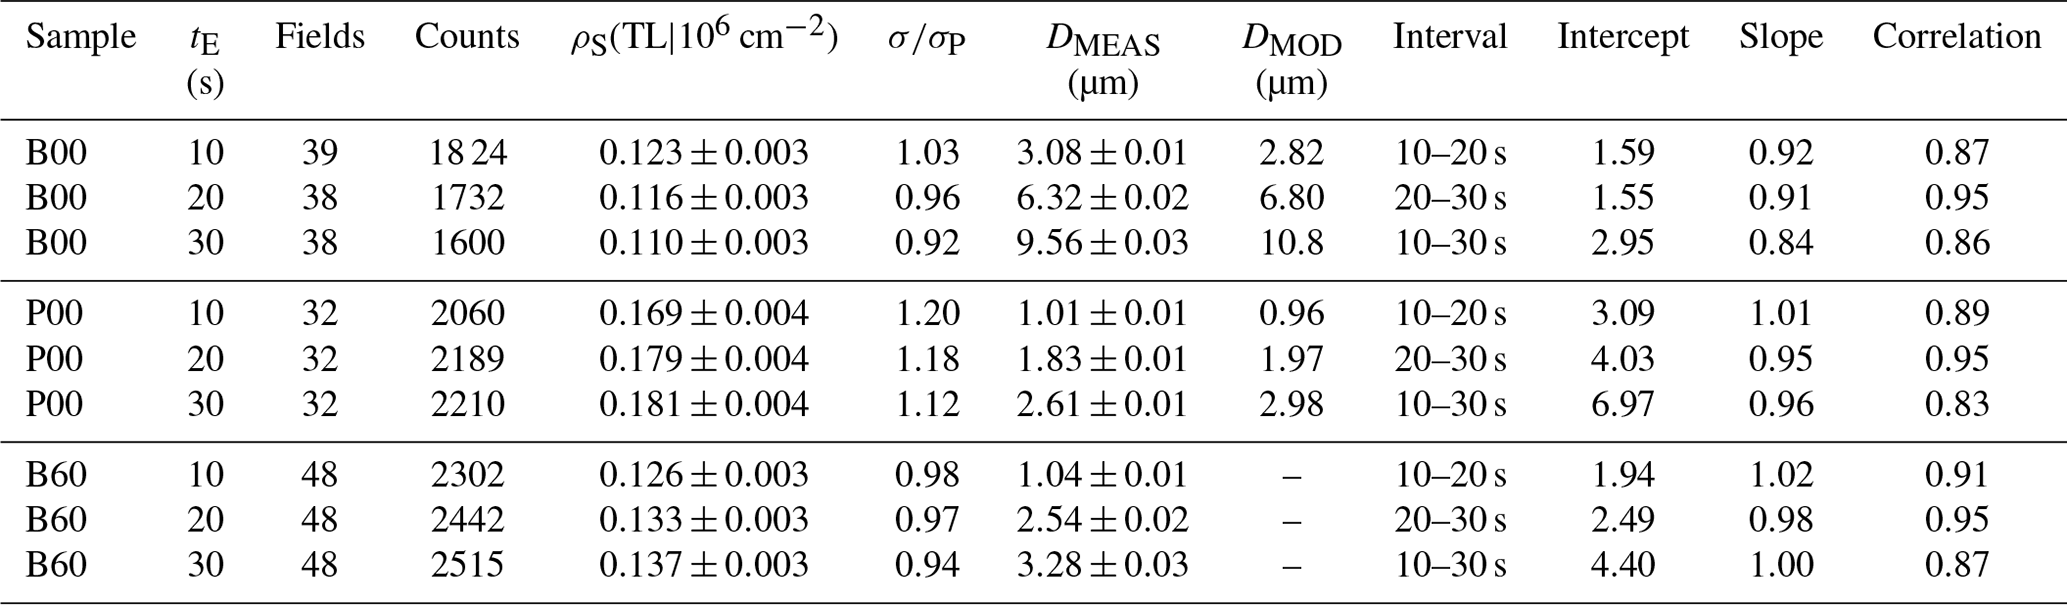
tE: etch time in seconds (5.5 M HNO3 at 21 ∘C). Fields: microscope fields counted ( cm2). Counts: total tracks counted. ρS: track density. : ratio of the standard deviation of the track density distribution to that of a Poisson distribution. DMEAS: average size of the track openings. DMOD: predicted modal sizes based on the etch rate data of Aslanian et al. (2021) and an initial accelerated average surface etch rate of 0.15 µm per 10 s (Fig. 4). No predicted values have been calculated for B60.
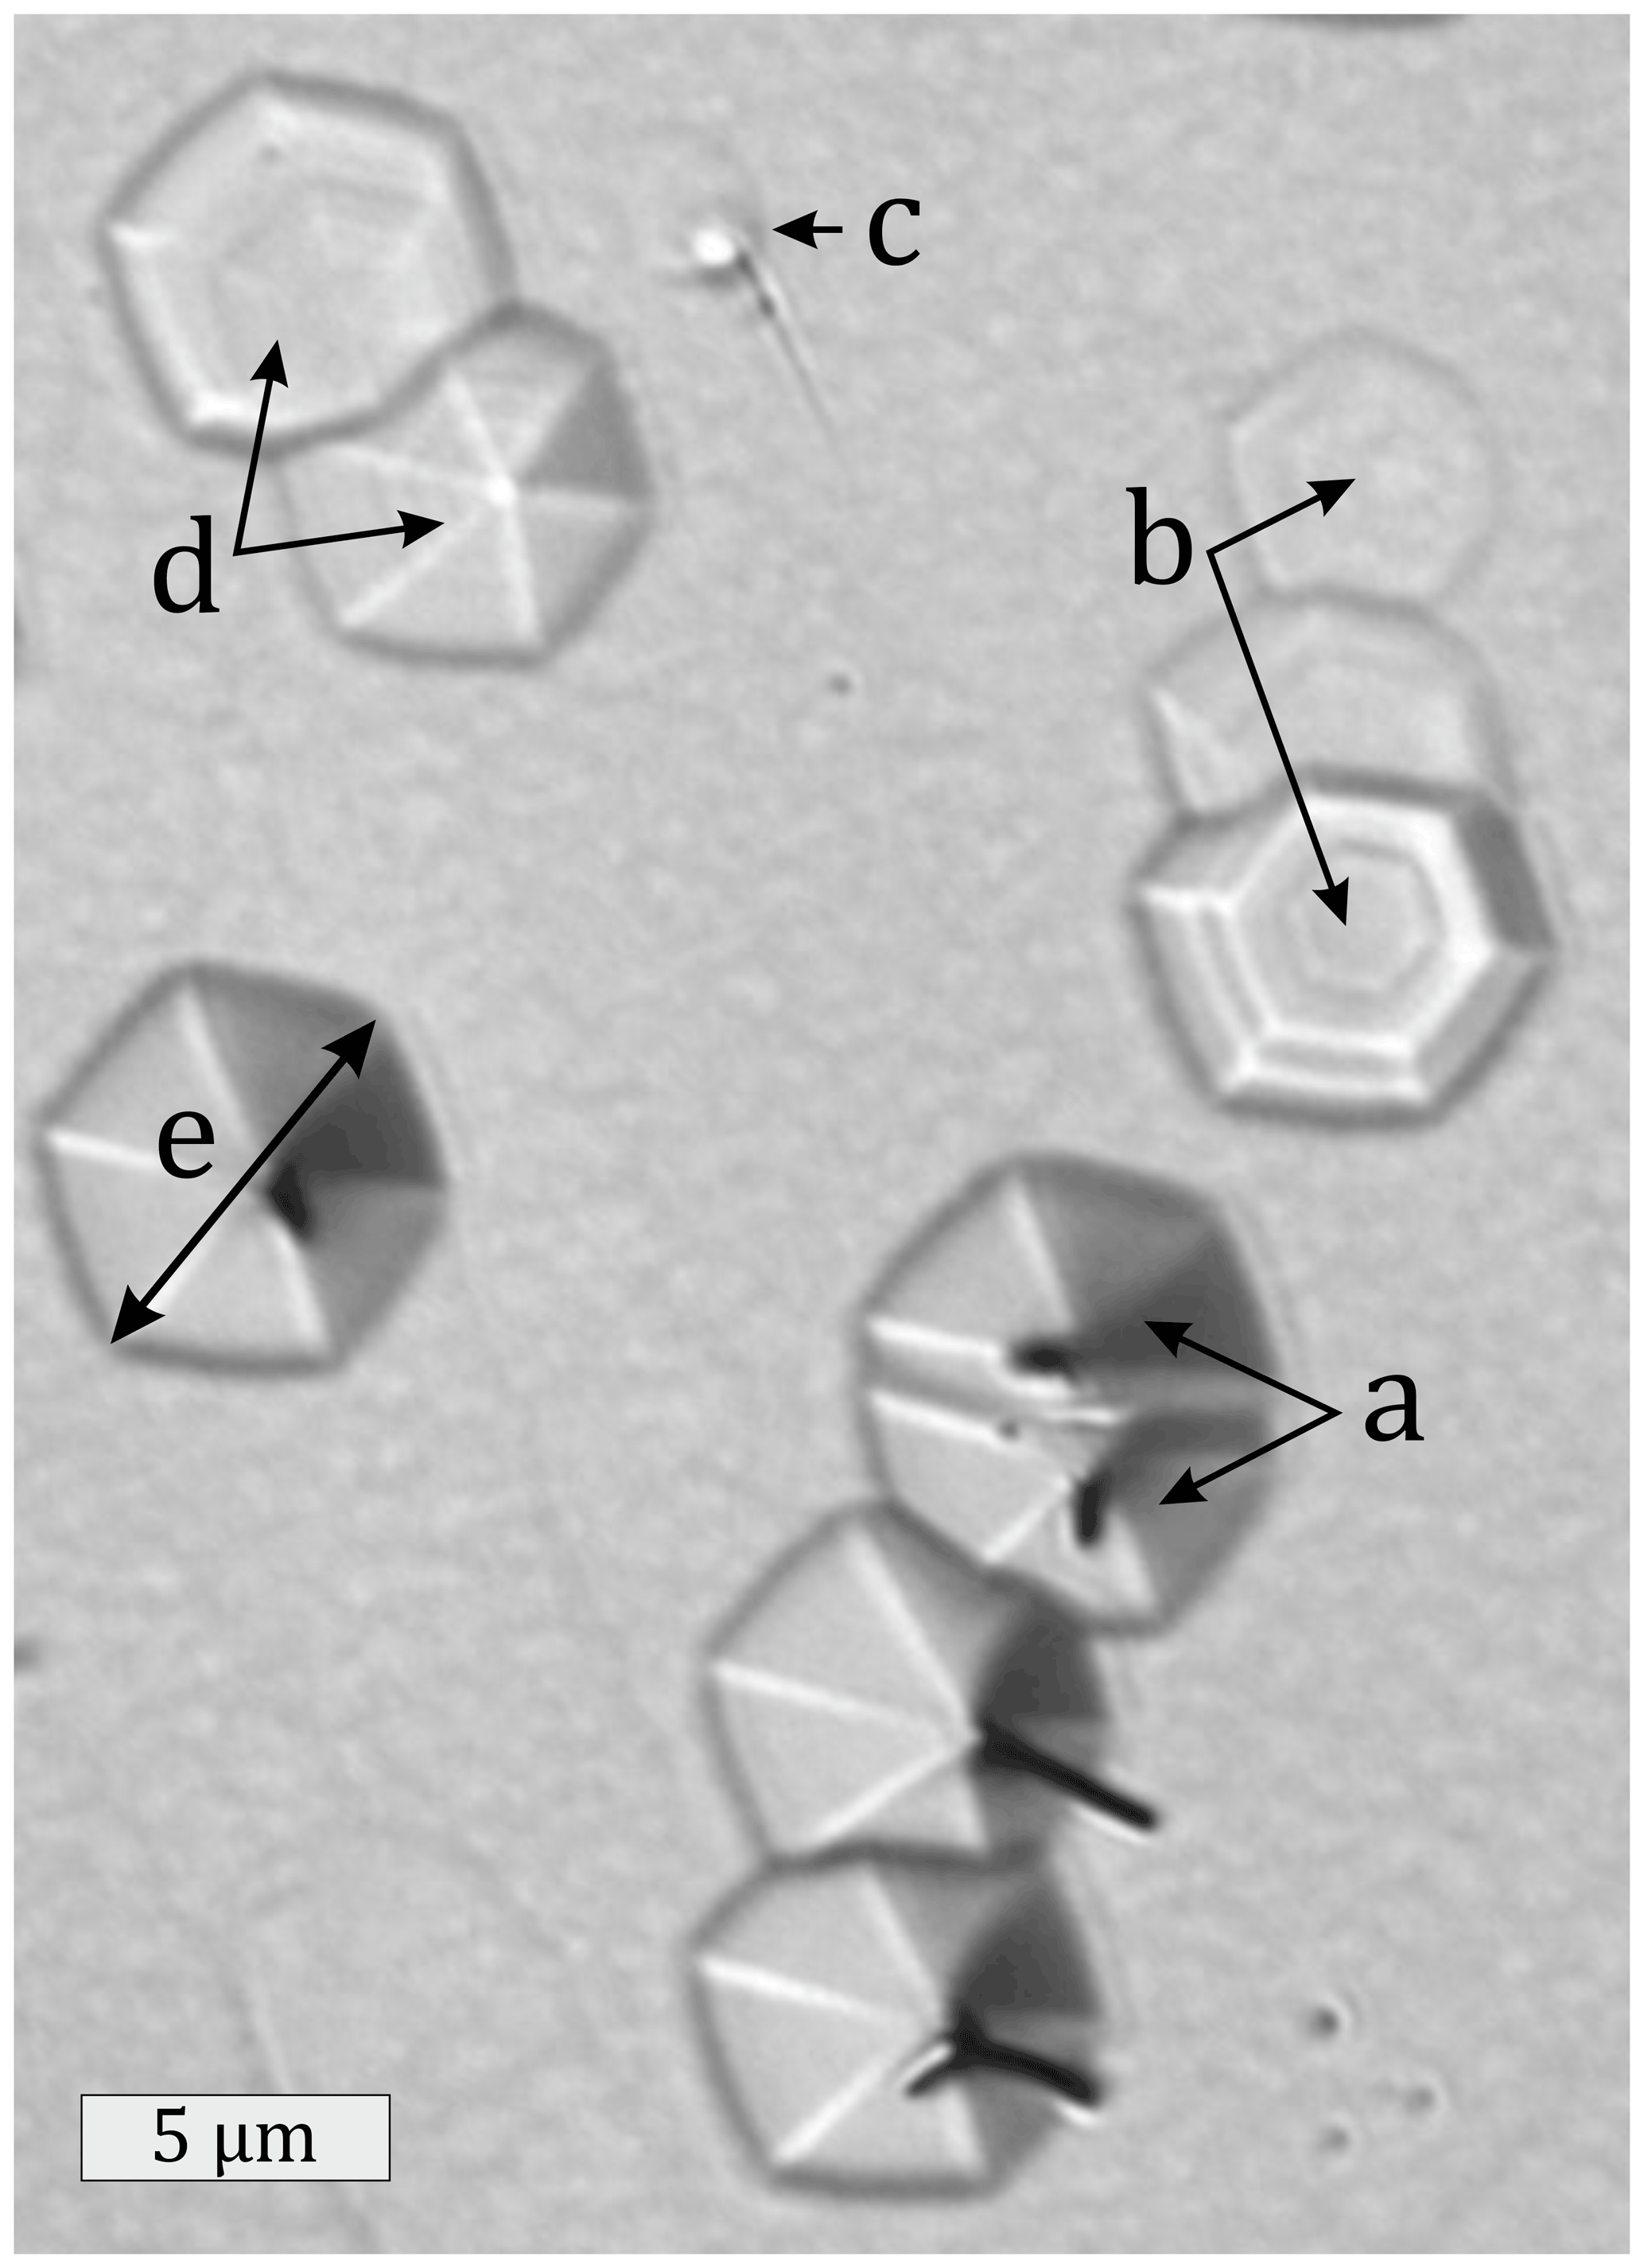
Figure 2Loss and gain of tracks in an apatite basal face (B00) etched 20 s in 5.5 M HNO3 at 21 ∘C. (a) Merging tracks; their growing etch pits and shrinking channels will later prevent distinguishing the separate tracks. (b) Shallow tracks; with decreasing depth the dish-shaped etch pits shrink (Stübner et al., 2008), losing contrast until their images dissolve or are no longer recognizable. (c) Track added due to surface etching, characterized by a long, thin etch channel and an undersized etch pit. (d) Two etch pits formed at shallow tracks with a stepped appearance due to intermittent etching at the track extremities (Wauschkuhn et al., 2015b). (e) Measurement of etch pit size.
Table 1 lists the intercepts and slopes of geometric mean regression lines fitted to the graphs in Fig. 1. For B00, the intercepts remain low while the slopes decrease with etch time. The implication that the track loss is proportional to the track count is not obvious because higher track counts are not associated with higher uranium concentrations but are due to random Poisson variation. We propose that the track loss is due to the growth and fusion of surface etch pits, which consume the shorter track channels causing losses proportional to the initial number of tracks in each field. Figure 2 illustrates track gain and track loss in a basal face of the Durango apatite. For P00 and B60, the slopes of the regression lines remain constant at ∼1 while the intercepts increase with etch time. A uniform increase, independent of the initial track count, suggests that on average tracks are added due to surface etching. Jonckheere et al. (2019) compared the conventional etch model (e.g., Tagami and O'Sullivan, 2005) with a competing one (Jonckheere and Van den haute, 1999) concerning their implications for the track counts. The first predicts increasing track counts, whereas the latter predicts constant counts. Despite its correct prediction, the first model was deemed inapplicable because it failed on other counts (Jonckheere et al., 2019, 2022). In contrast to that model, in which no etched track is ever lost, the second model implies constant track counts because the rate at which tracks are added from surface etching equals that at which others are lost from the same cause. Tracks are added when the advancing surface reaches their upper ends and lost when it overtakes their lower ends. However, before the surface gets to the lower end of a latent track (t; Fig. 3), its etch channel has increased in length. Around that time, the slow-etching faces (cd and de) terminating the channel come to intersect the surface, making the intersections a–c–d and d–e–g convex. This modifies their etching behavior and increases their etch rates, allowing them to stay ahead of the advancing surface for a time (Fig. 3). A residual etch figure can thus persist after the surface has overtaken the latent track. This phenomenon is more pronounced at low etchant concentrations (Jonckheere and van den Haute, 1996). This reconciles our current observations with the latter etch model. It also accounts for the observation that the net rate of addition is not much greater for B60 than for P00 despite its etch rate being more than twice as high (Aslanian et al., 2021).
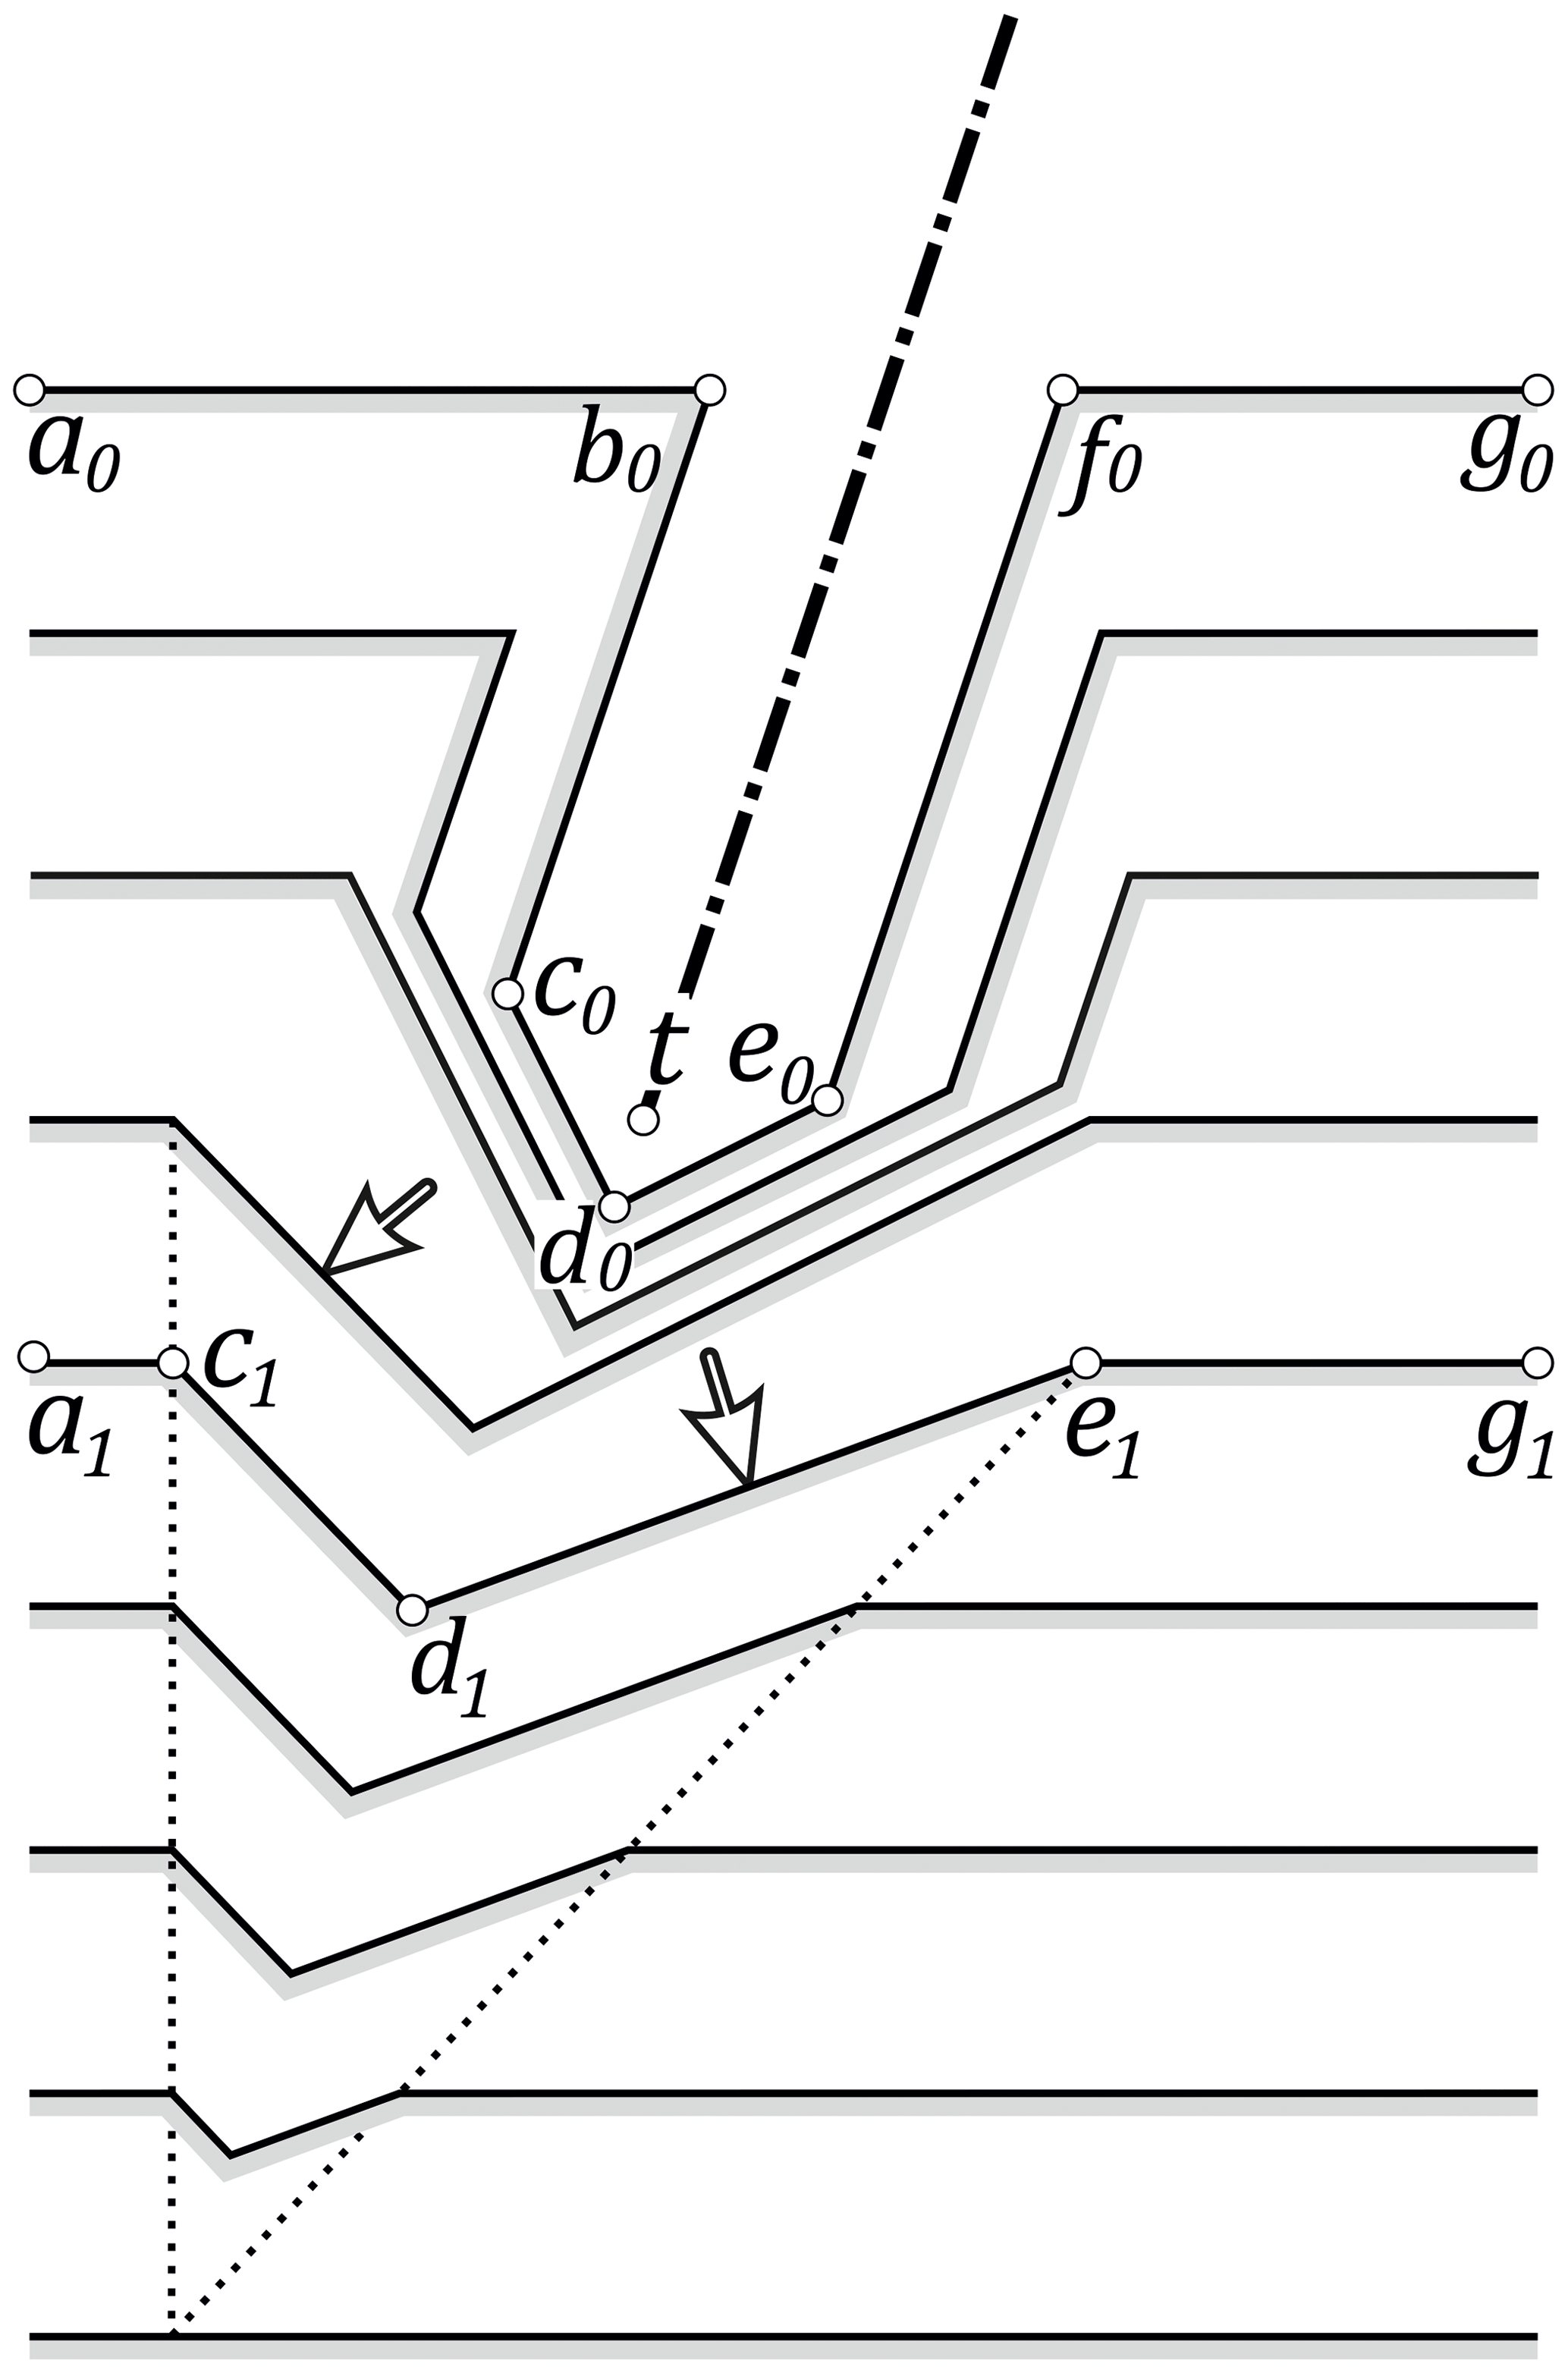
Figure 3Mechanism of the continuation of an etch pit past the termination of a latent track. Before the advancing surface (a–b–f–g) overtakes the latent track at t, the faces (c–d–e) terminating the track channel have moved ahead, creating a feature that, depending on the etch rates of c–d–e and a–b–f–g, can persist for a time. The duration is extended when, upon intersecting the surface, the intersections a–c–d and d–e–g become convex allowing faster etching orientations to develop (white arrows). This mechanism accounts for the observed increases in the track counts in P00 and B60 within the etch model of Jonckheere et al. (2019, 2022) and Aslanian et al. (2021).
Figure 4a–c compares the sizes (long axes) of the track openings in B00, B60 and P00 at 10, 20 and 30 s. Those in the basal (B00) and prism face (P00) have a uniform size, reflected in a narrow distribution. With increasing etch time, the distributions shift to greater values and become left-skewed. We interpret the latter as being due to tracks added by surface etching. Insofar as the distributions are diagnostic, tracks are added at a decreasing rate, suggesting a declining surface etch rate. The track openings in the intermediate face (B60) have a limited size range at 10 s but broader distributions at longer etch times. In contrast to basal and prism faces, the track openings in B60 do not have uniform shapes or orientations (Supplement file S1; Jonckheere et al., 2020). Their long axes therefore increase at different, orientation-dependent rates, stretching their size distribution.

Figure 4Histograms and cumulative frequencies (g spectra, Jonckheere et al., 2020) of the sizes (long axes) of the track openings in (a) a basal face, (b) a prism face and (c) a face at 30∘ to a prism face of Durango apatite after 10, 20 and 30 s etching (5.5 M HNO3 at 21 ∘C); (d) the mean sizes plotted against etch time show a constant rate of increase in the three surfaces; the dashed lines are predicted trends assuming an initial accelerated etching of 0.15 µm in 10 s.
Figure 5 shows the envelopes of the etch rate vectors (Aslanian et al., 2021), scaled to show the displacement of a plane surface perpendicular to each vector after 10, 20 and 30 s etching. The vectors radiate from the intersection of a prism plane P–P and a basal plane B–B, both perpendicular to the drawing plane. The elongate diamond shapes are the etch figures formed by the fastest etching faces after 10, 20 and 30 s etching, constructed using the model of Jonckheere et al. (2019, 2022). The intersections of the elongate diamond shapes with the etched prism planes and basal planes give the sizes of the track openings in these surfaces. It thus follows that there exists a definite relationship between the etch pit sizes in a basal plane (DBAS) and the track openings (DPAR) in a prism plane. The predicted ratio at 10 s etching is (Fig. 5; solid line); the measured ratio, in contrast, is (Table 1). The difference is attributed to an initial stage during which polishing damage is etched at a greater rate. Assuming that this stage lasts <10 s and removes an equal thickness from the basal and prism surfaces, resulting in , then a calculation shows that the thickness removed after 10 s amounts to ∼0.15 µm. On this assumption, the predicted ratio is (Fig. 5; dotted line). The theoretical values of DPAR and DBAS for 20 and 30 s etching, calculated from this point on, are also listed in Table 1, for comparison with the measurements. The predicted DPAR and DBAS at 10 s, and not just their ratio, are in reasonable agreement with the measured values. At longer etch times, the latter fall behind the predicted values (Fig. 4d) because they include a growing fraction of tracks added after the start of etching (Fig. 4a–b). This has less influence on the ratios because both surfaces are affected. For 20 and 30 s etching, the predicted and measured ratios are 0.290 (predicted) vs. 0.290 (measured) at 20 s and 0.276 (predicted) vs. 0.273 (measured) at 30 s. The decreasing ratios with increasing etch time are a singular consequence of the accelerated etching of the damaged surface. The result is measurable at practical etch times and useful for investigating the effects of polishing on fission-track etching.
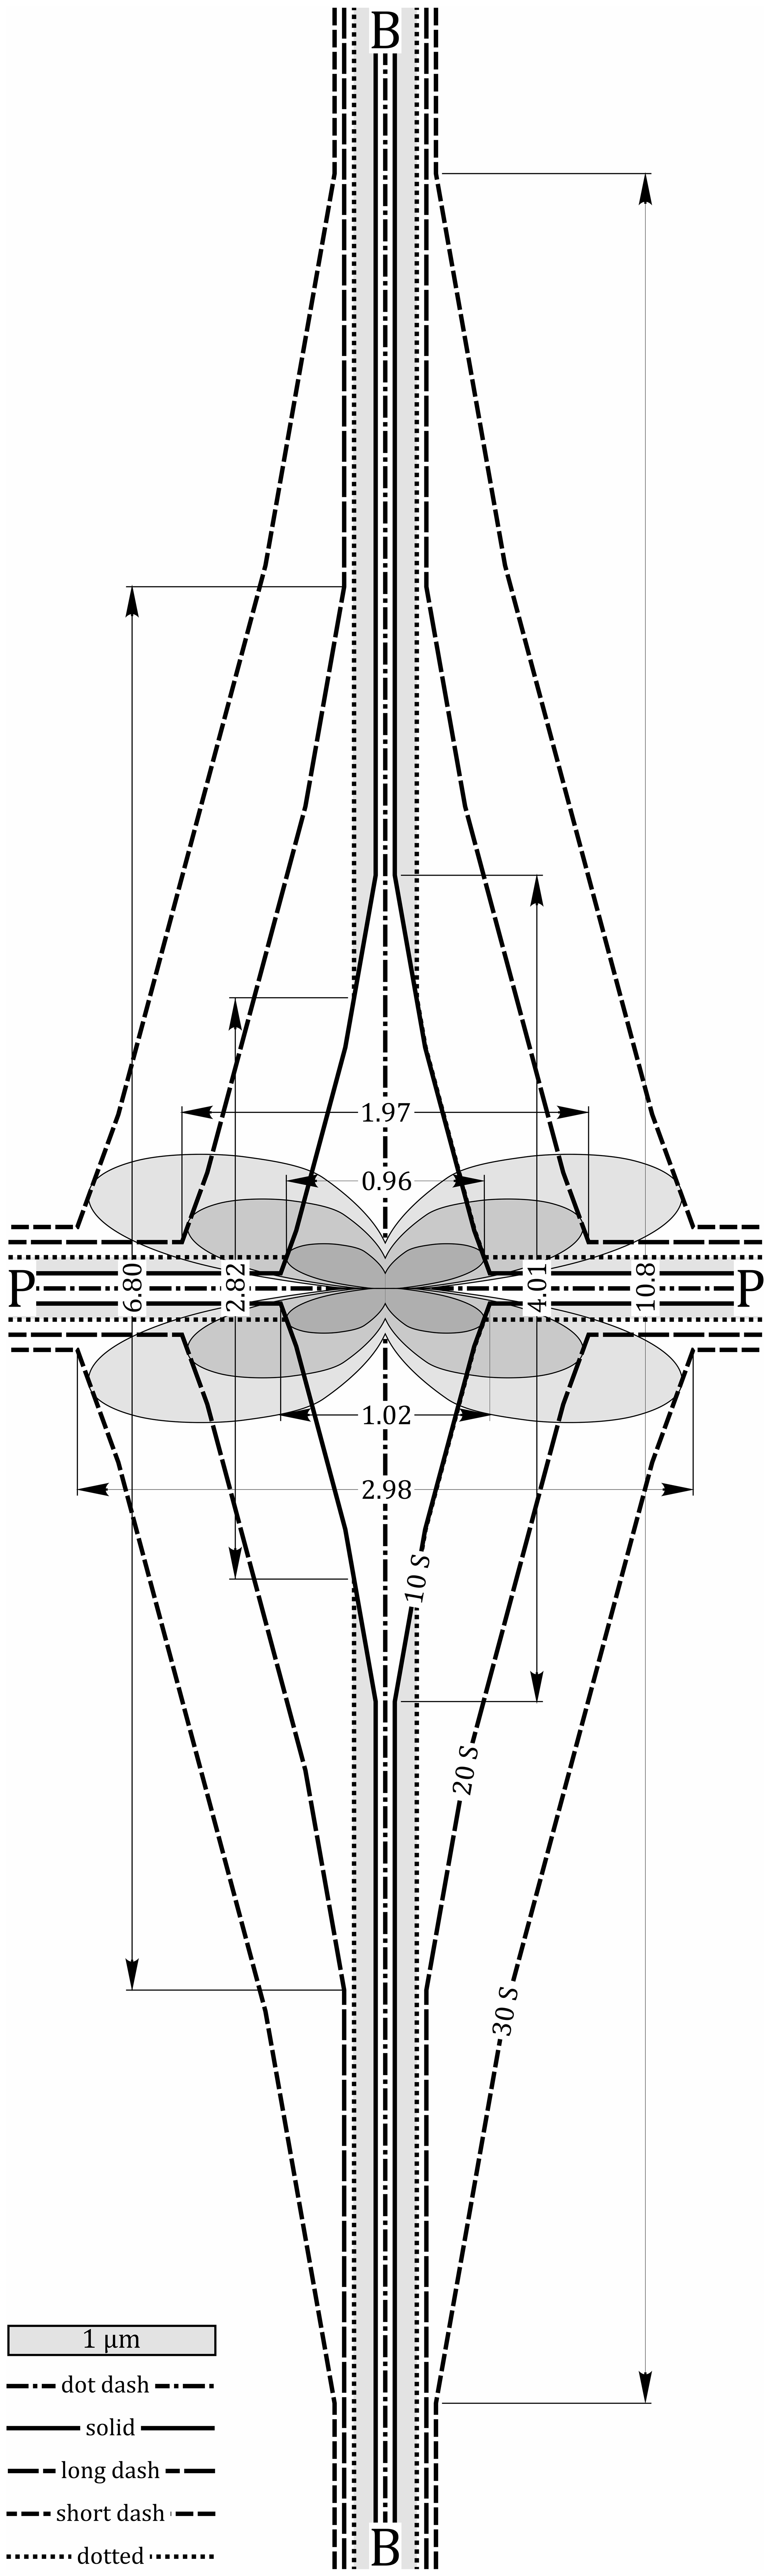
Figure 5Calculation of the track openings in a basal and a prism face of Durango apatite etched in 5.5 M HNO3 at 21 ∘C for 10, 20 and 30 s. The shaded four-leaf clovers in the center are the envelopes of the etch rate vectors (Aslanian et al., 2021), scaled to represent the displacement of lattice planes after 10 (dark gray), 20 (middle gray) and 30 s etching (light gray). The drawing plane is a prism face with the c axis running from left to right through the center. The basal face is perpendicular to the c axis and to the drawing plane, intersecting it along the line B–B (dot dash) running from top to bottom. A prism face perpendicular to the drawing plane intersects it along the line P–P running from left to right (dot dash). The diamond shapes are the etch figures formed by the fastest etching planes after 10 (solid), 20 (long dash) and 30 s etching (short dash; Jonckheere et al., 2019, 2022). Their intersections with the etched basal surface (B–B) and prism surface (P–P) determine the sizes of the track openings (DBAS, DPAR) in these surfaces. The track openings in the prism face are measured in the horizontal direction. The sizes of the etch pits in the basal face are measured in the vertical direction. The numerical values (DMOD in µm) are summarized in Table 1. As discussed in the text, their calculation involves a correction for an initial stage of accelerated surface etching due to polishing damage. We assume that in both faces a total thickness of 0.15 µm was removed after the first 10 s etch step, which is 2–3 times the etch rate of the undamaged surfaces. The additional thickness removed during this step is shown by the elongated shaded areas bordered by the dotted lines. The reason for this correction is discussed in the text.
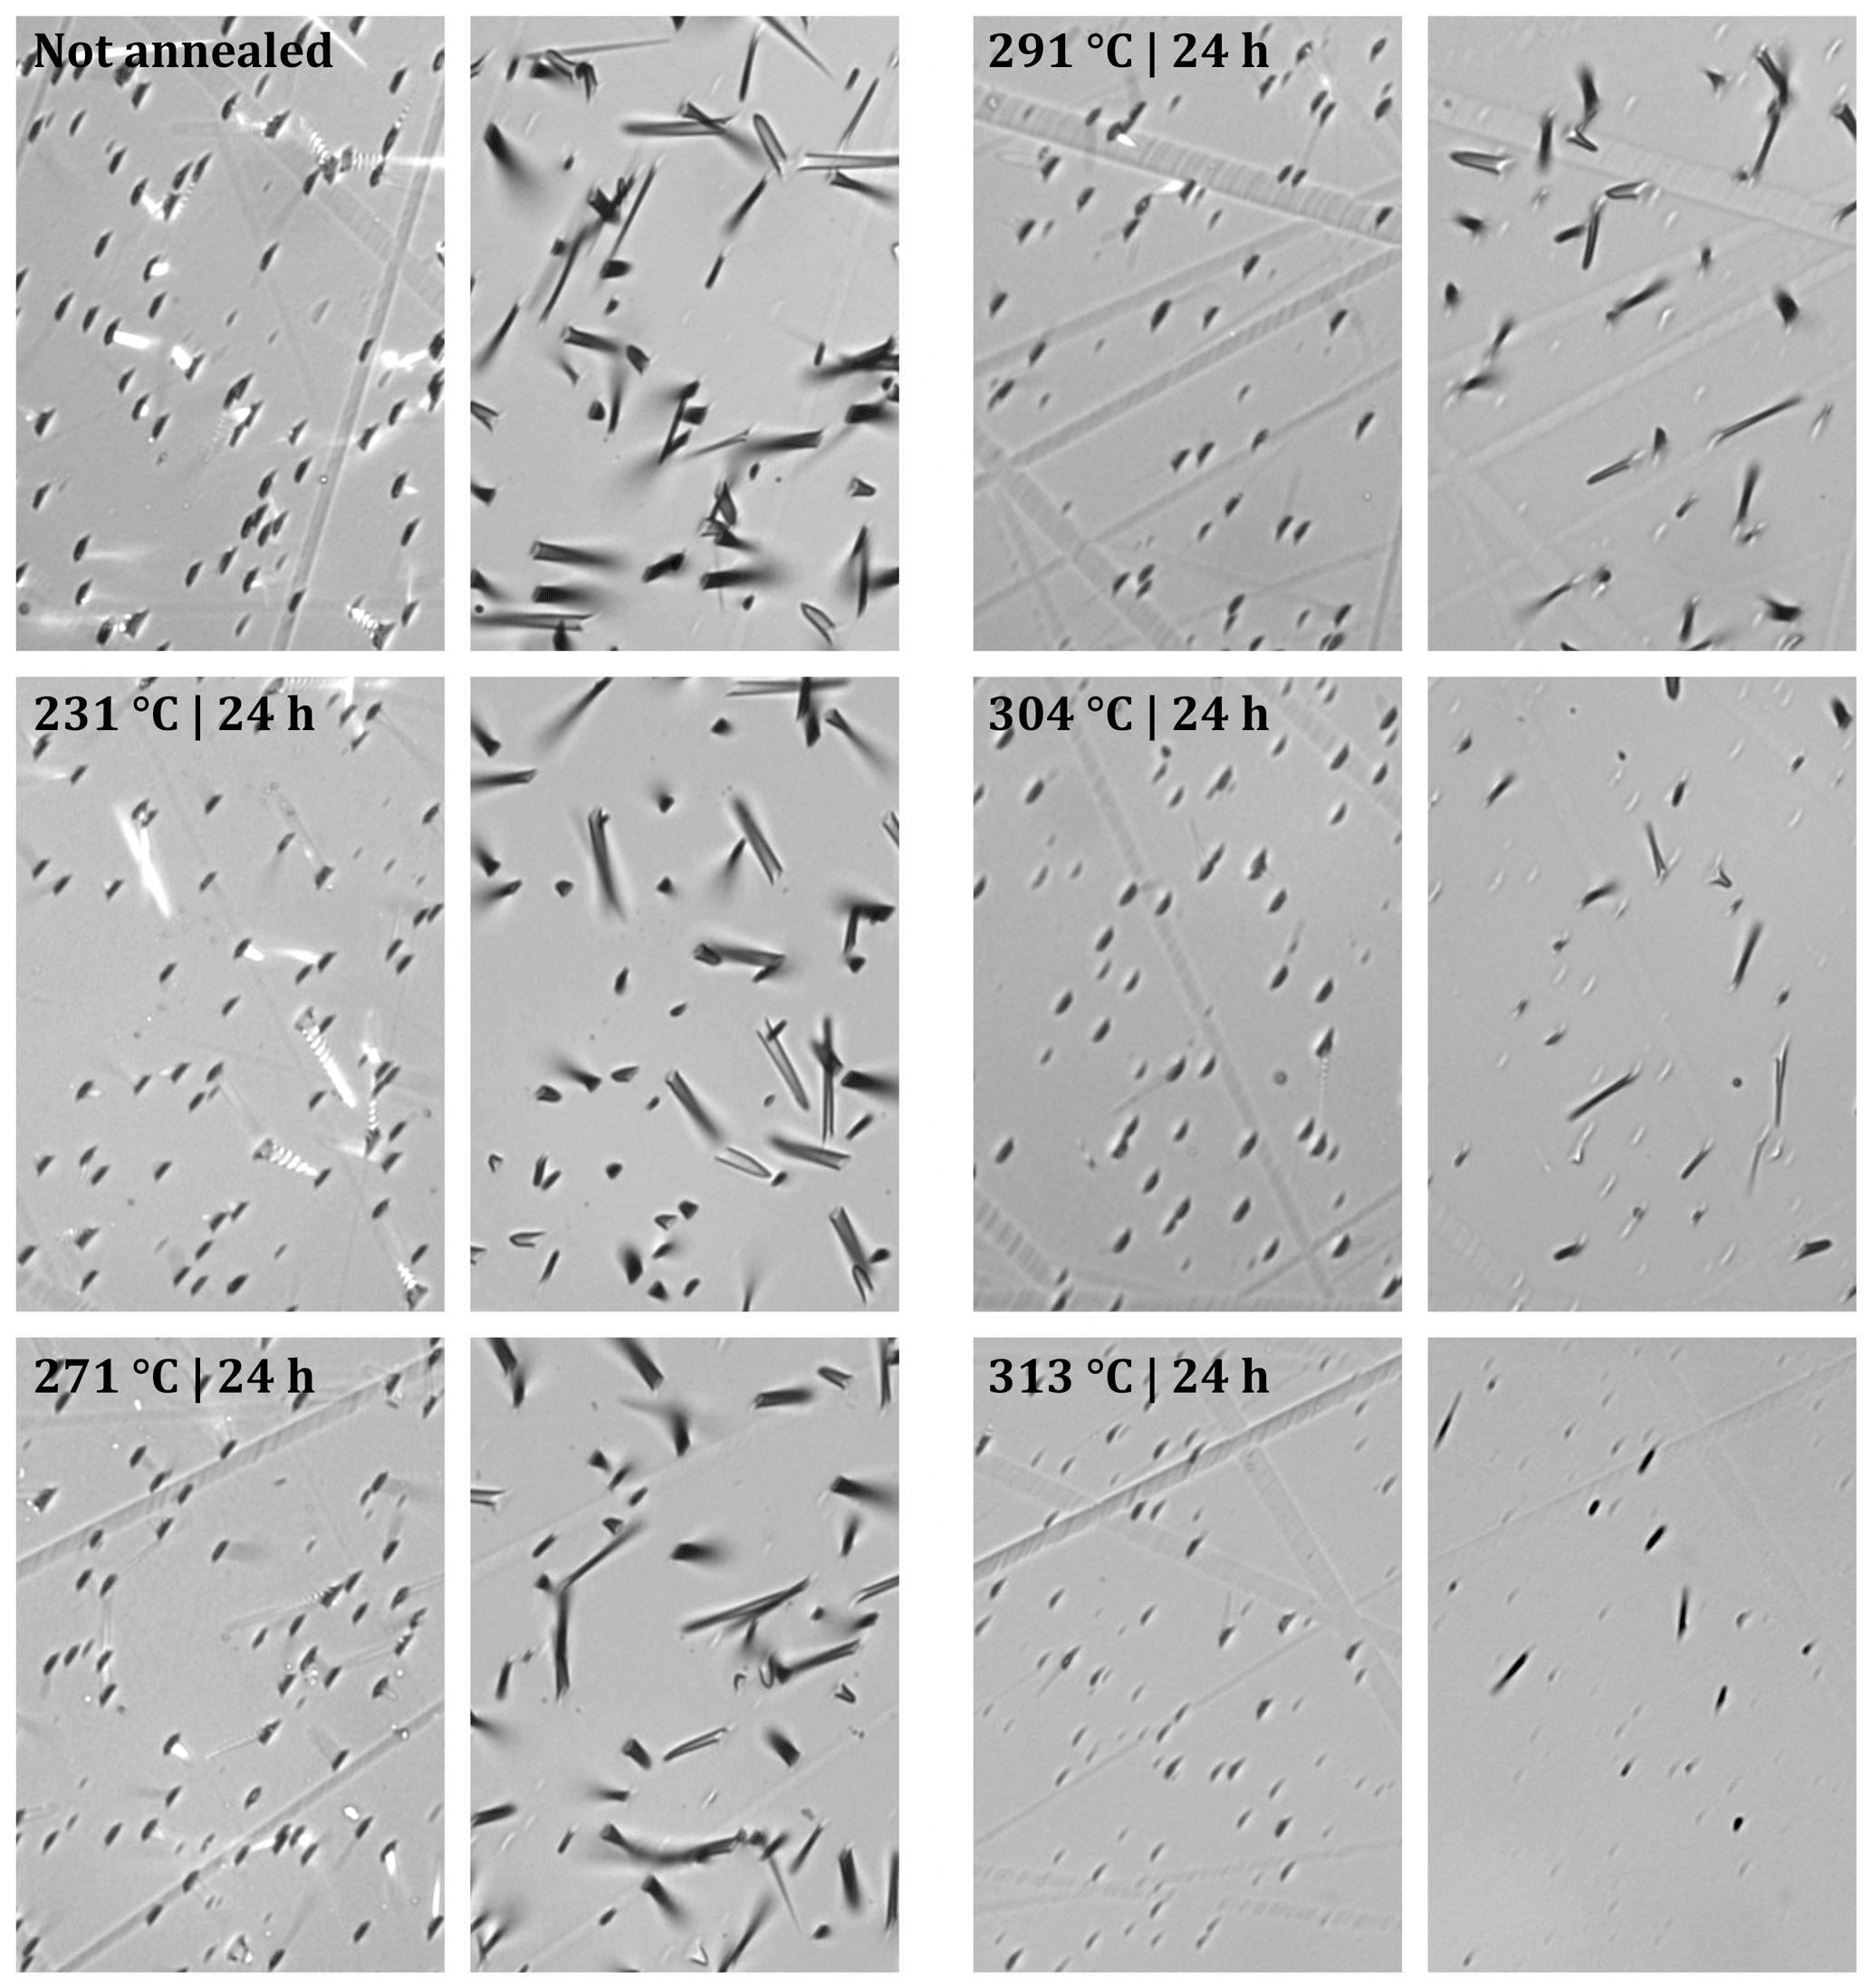
Figure 6Pairs of reflected-light (RL) and transmitted-light (TL) images of the same areas in prism faces of an unannealed Durango apatite and five annealed under different temperature–time conditions. All samples contain induced fission tracks and were etched for 20 s in 5.5 M HNO3 at 21 ∘C.
For the second experiment, we cut 14 prism sections from a crystal of Durango apatite. We annealed seven at 450 ∘C for 24 h to erase the fossil tracks; the other seven retained their full complement of fossil tracks. The annealed sections were irradiated with thermal neutrons in channel Y4 of the BR1 reactor of the Belgian Nuclear Research Center (SCK⋅CEN; ϕTH≈1016 cm−2) to produce induced fission tracks. A section with fossil tracks was paired with one containing induced tracks and annealed for 24 h at temperatures of 183, 231, 271, 291, 304 and 313 ∘C; the remaining sections were not annealed. The samples were mounted in resin, ground to expose internal surfaces, and polished with 6, 3 and 1 µm diamond suspensions and 0.04 µm silica suspension to the highest standard attainable with our equipment and expertise. Each mount was equipped with reference points and etched for 20 s in 5.5 M HNO3 at 21 ∘C. Our samples also included four prismatic sections of Durango apatite from an inter-lab experiment. The pre-annealing, neutron-irradiation and partial-annealing conditions are given in Ketcham et al. (2015). These apatite sections were also mounted, ground and polished as described. We carried out track counts in transmitted light and reflected light on the same areas, with a Zeiss Z2m microscope with a Märzhäuser motorized stage connected to a desktop computer. The Autoscan software was used for stage control and for recording the positions of the counted areas but the track counts were done at the microscope at an overall magnification of 800×.
Figure 6 shows reflected-light (RL) and transmitted-light (TL) images of the same areas in one unannealed section and five with different degrees of partial annealing. The RL images show numerous near-identical features (RL features). In the samples annealed at ≤271 ∘C, most – but not all – RL features correspond to the openings of unmistakable fission-track channels in TL (TL tracks). To our knowledge, the RL features that do not correspond to TL tracks have not been reported before, and it is reasonable to question if they are actually fission tracks. Then again, the shallow RL features would not be distinguishable in less well polished surfaces. Apatite samples are often not polished to the standard of our present samples, i.e., a nano-polish with 0.04 µm silica suspension, until no scratches are visible with RL Nomarski differential interference contrast, although faint polishing scratches reappeared after etching (Fig. 6). A second reason for shallow RL features not to have been reported is that they cannot be counted in transmitted light, whereas track counts in reflected light are uncommon. Moreover, an operator observing them may be inclined to dismiss them, either as not being tracks or as being uncertain or impossible to count. The RL features are shallower than an etch pit in a prism face after 20 s etching (Fig. 4) and lack the distinctive track channel, which affords them their uniform appearance. However, none of this is reason enough for concluding that they are not tracks.
Our reflected-light counts were performed on the assumption that each distinct RL-feature corresponds to the surface intersection of a continuous track or of a section of a segmented track (Gleadow et al., 1983; Green et al., 1986). The TL counts of the most annealed apatite sections required some judgment but presented no more difficulties than routine counts of unproblematic geological samples. Table 2 summarizes the RL and TL counts; Fig. 7 plots the normalized RL counts () against the normalized TL counts (. The TL counts are normalized to the RL counts of the unannealed samples for the purpose of comparing TL and RL. It is significant that, with few exceptions, the RL and TL densities have standard deviations close to those of a Poisson distribution (), irrespective of the ratio, as expected for products of a radioactive process. It is most improbable that defect swarms possess statistical properties indistinguishable from those of the actual fission tracks in the same samples.
Table 2Transmitted-light (TL) and reflected-light (RL) counts of induced and fossil tracks in annealed prism sections of Durango apatite. Detailed data in the Supplement file S2.
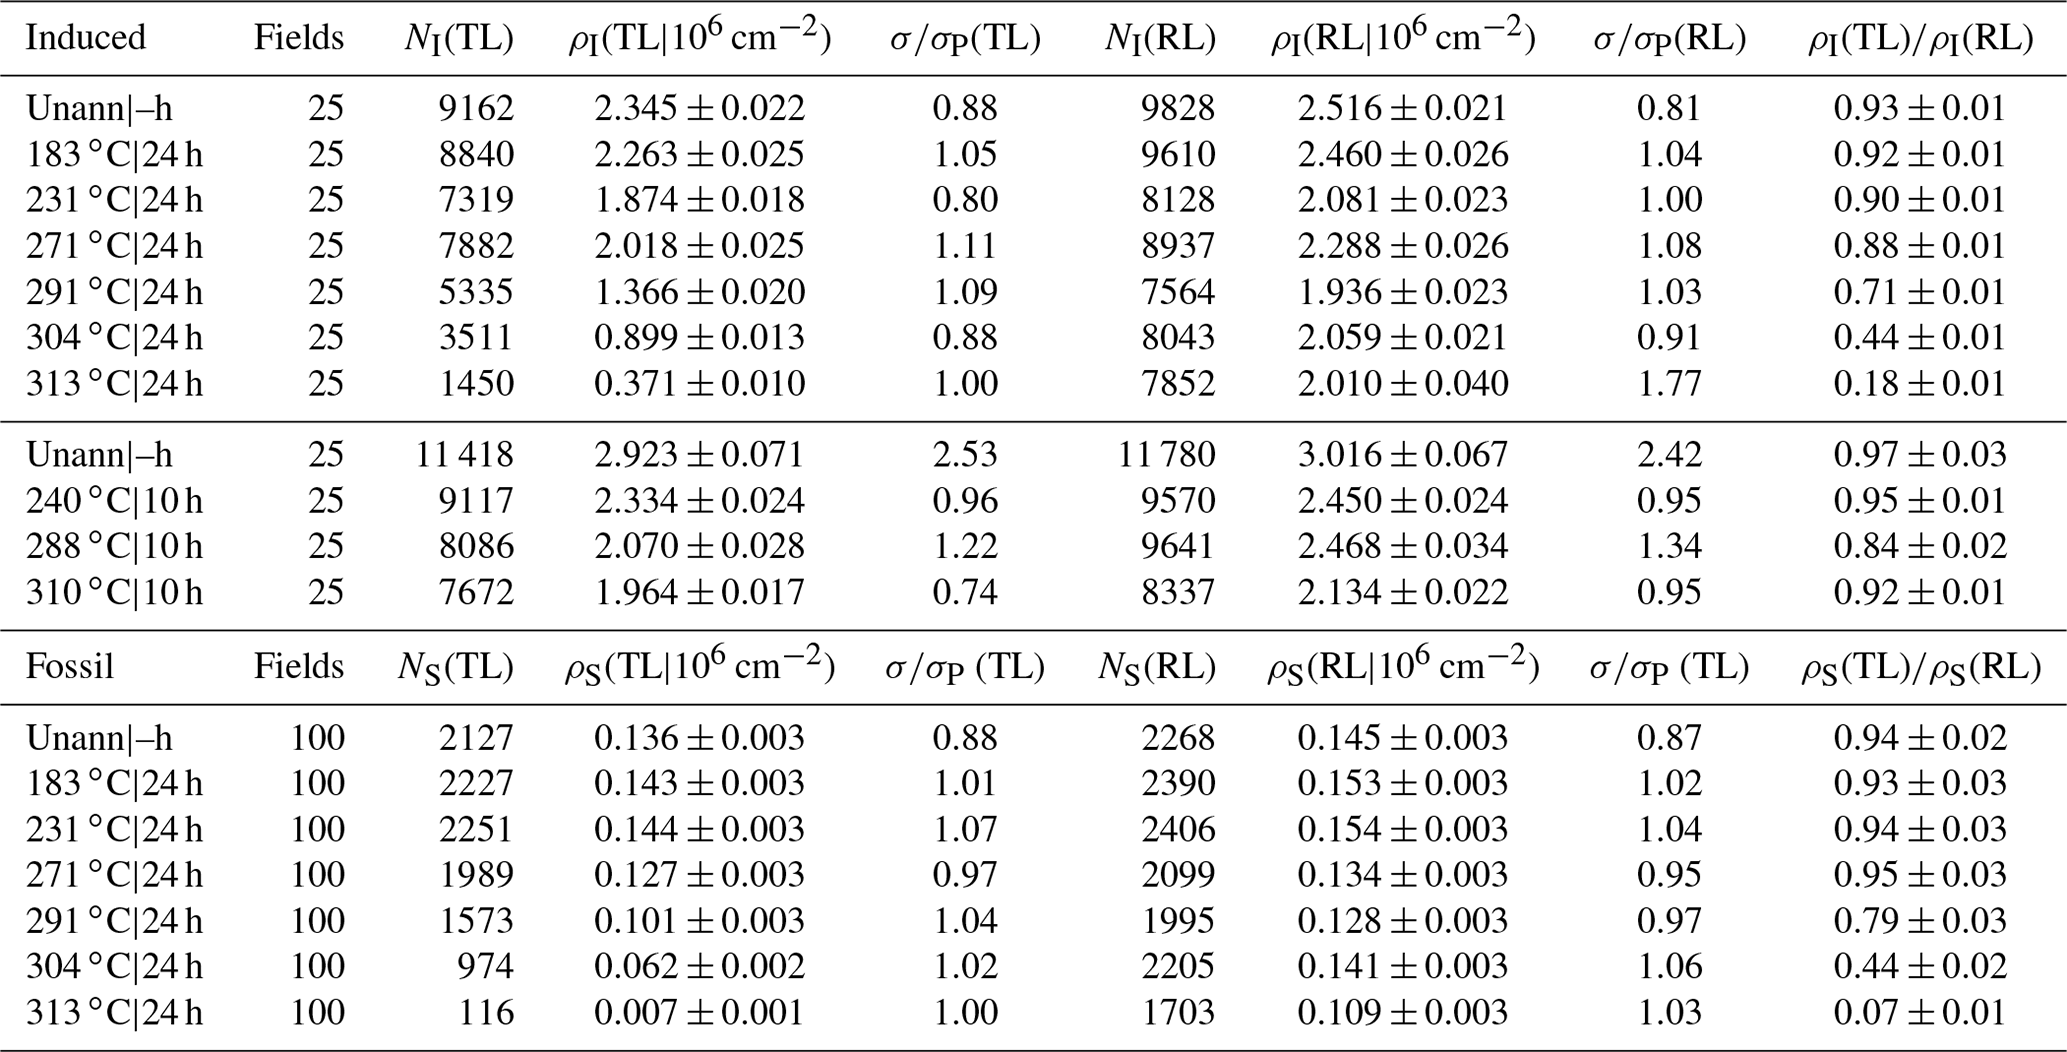
First column: annealing conditions (temperature|duration). Fields: number of microscope fields counted ( cm2). NI(TL), NI(RL), NS(TL), NS(RL): number of induced (I) and fossil (S) tracks counted in transmitted (TL) and reflected light (RL). ρI(TL), ρI(RL), ρS(TL), ρS(RL): induced (I) and fossil (S) track densities measured in transmitted (TL) and reflected light (RL). (TL), (RL): ratio of the standard deviations of the track density distributions to those of a Poisson distribution.
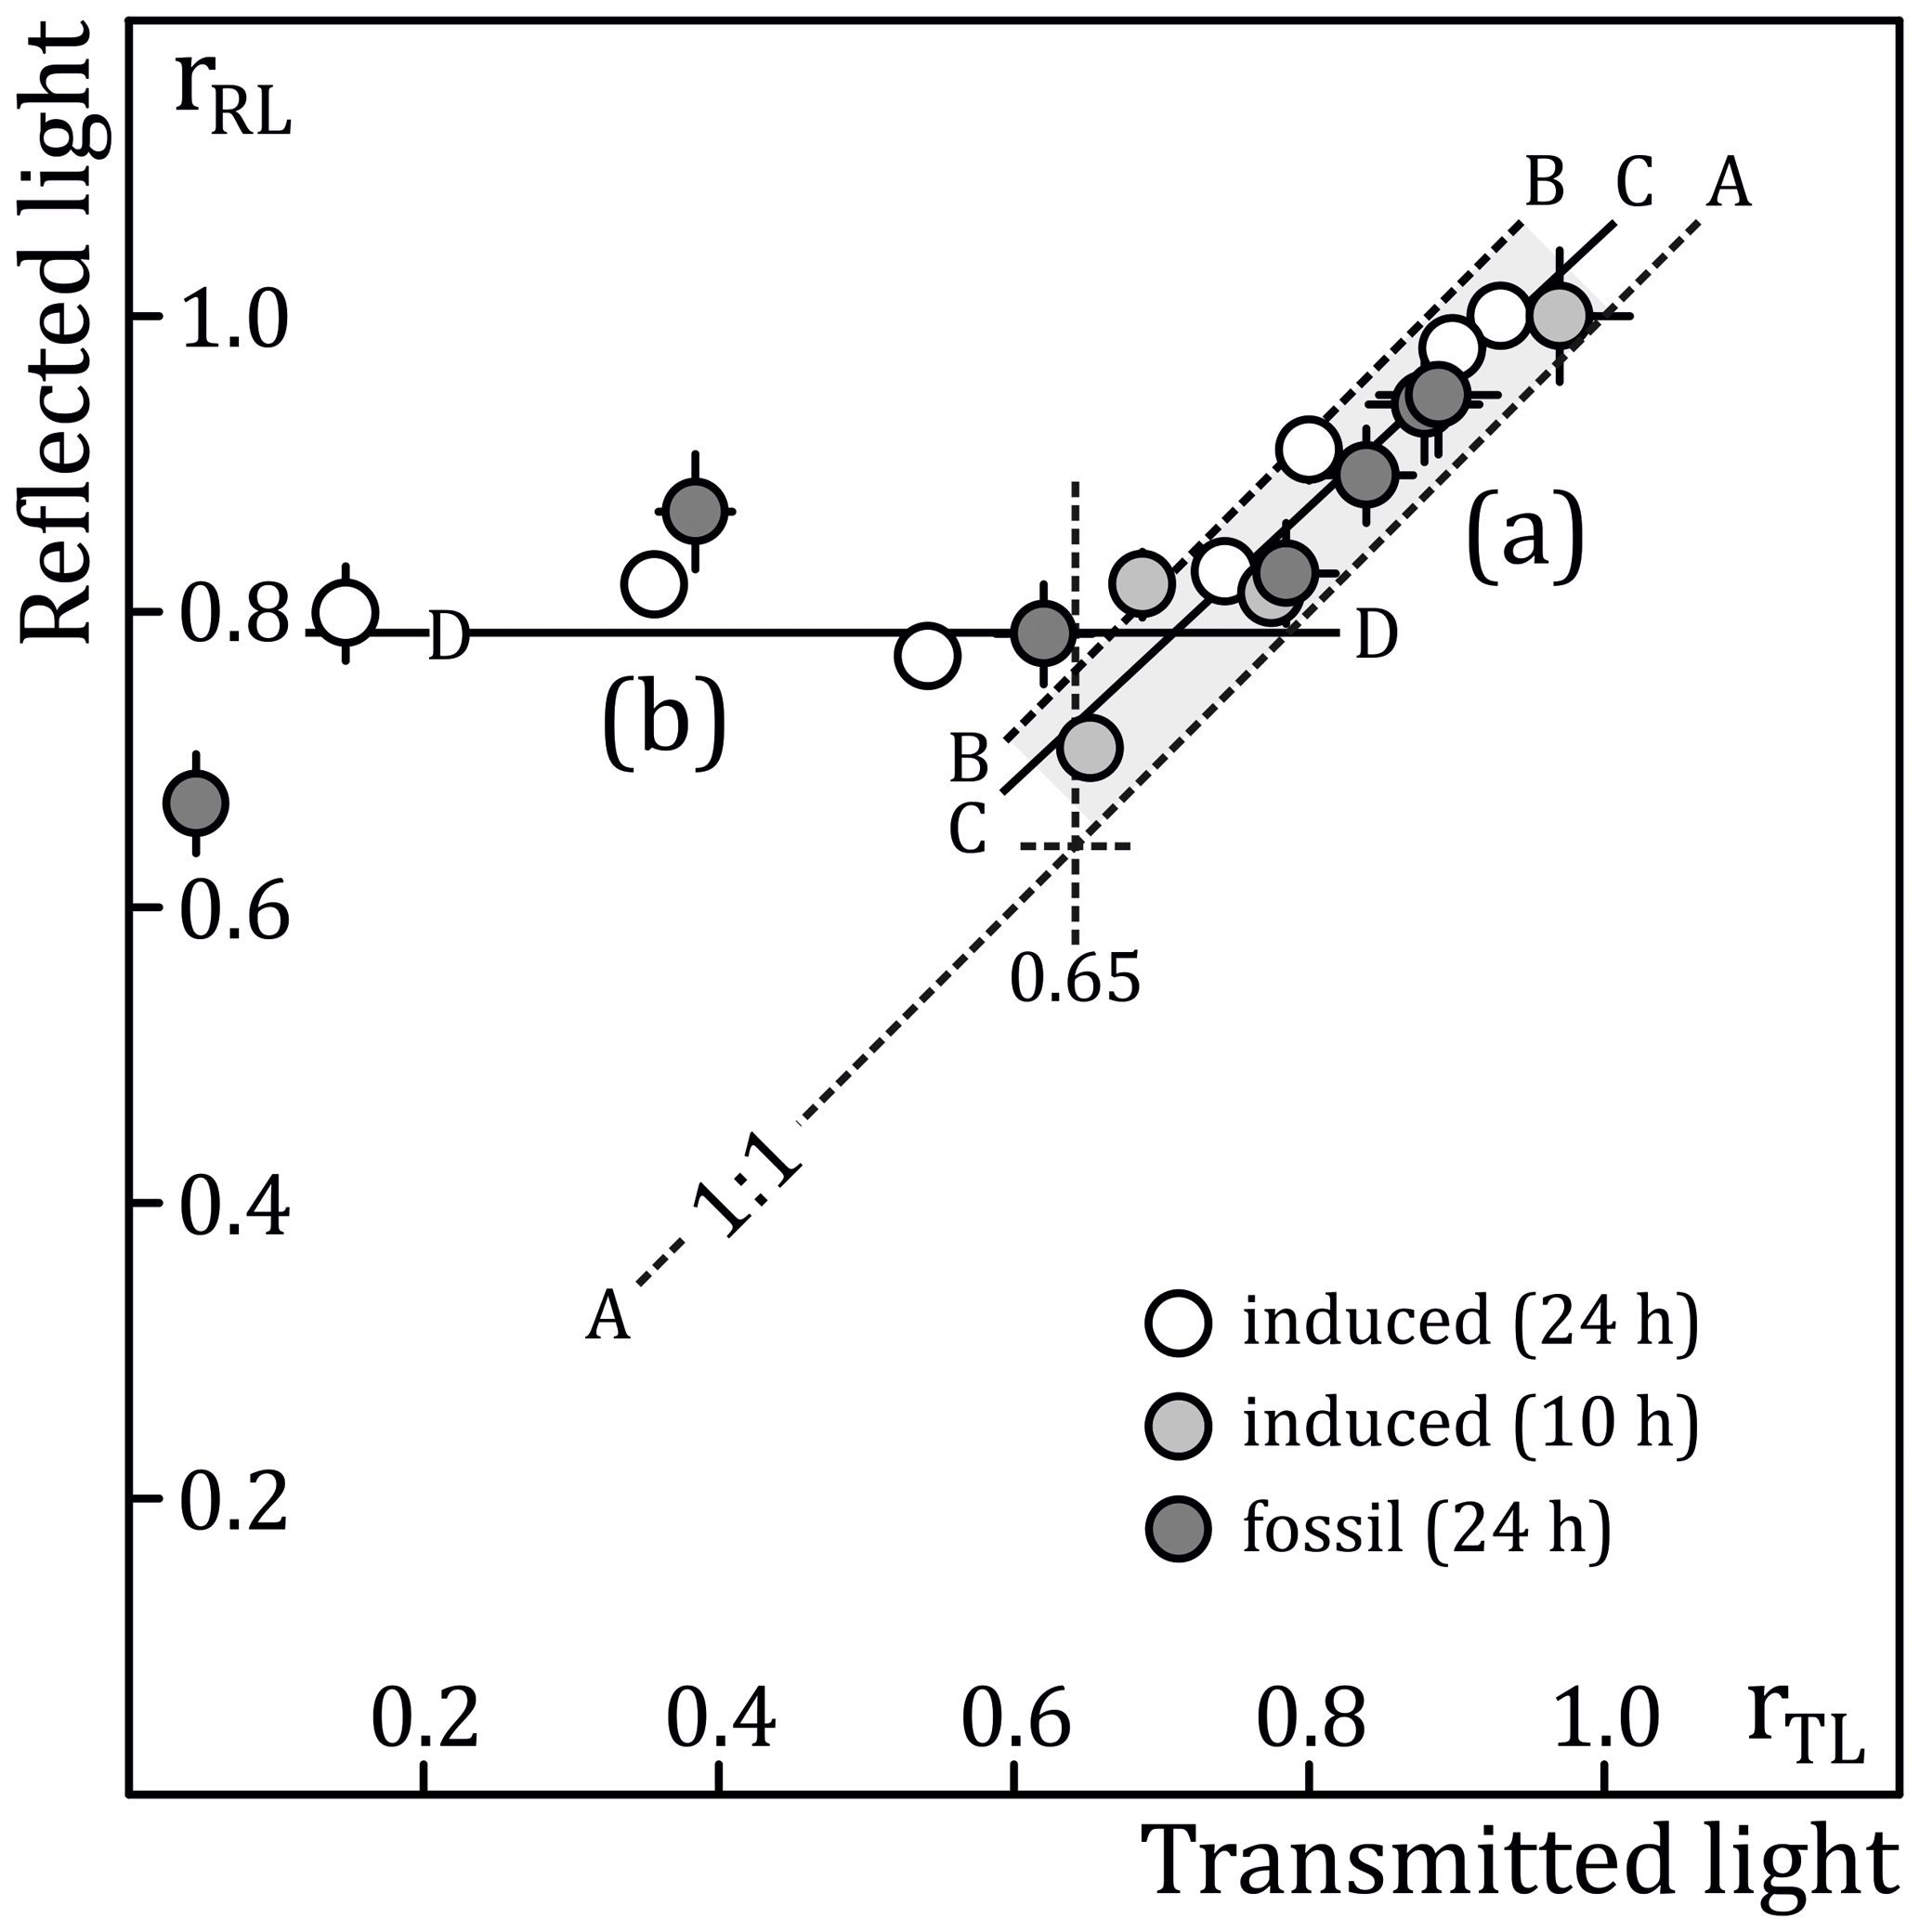
Figure 7Normalized fossil and induced track densities in prism faces of Durango apatite determined using reflected light (rRL) plotted against those measured in the same counting areas using transmitted light (rTL). The samples were annealed under different temperature–time conditions, summarized in Table 2, polished to a final high finish with 0.04 µm silica suspension and etched for 20 s in 5.5 M HNO3 at 21 ∘C. The induced track densities are normalized to those of the unannealed samples and those of the fossil tracks to 0.89× that of the unannealed sample, to account for natural annealing. A–A: theoretical relationship for an observation threshold z=0 µm; B–B: theoretical relationship for z=1 µm; C–C: geometric mean regression line to the data before the break in slope (a; ); D–D: mean rRL value of the data past the break in slope (b; rTL≤0.65).
Jonckheere and Van den haute (2002) calculated from their projected-length distributions which fraction of the tracks intersecting internal and external apatite prism faces and mica external detectors is counted (counting efficiencies; ηq factors). The results showed that ηq≈0.90 for an internal surface, ηq≈1.00 for an external surface and ηq≈0.90 for an external detector. The authors concluded that fission-track counts are in much greater measure governed by an observation threshold than by the etching properties of the tracks and the mineral (vT, vB). They proposed that the observation threshold corresponds to a critical depth, z. Shallow tracks lack the shape and contrast to be identified as fission tracks in transmitted light, as Figs. 2 and 6 show. The fact that shallow surface tracks are the most abundant in an internal surface and external detector but almost absent in an external surface explains their relative counting efficiencies (Dakowski, 1978; Iwano and Danhara, 1998; Jonckheere and Van den haute, 1998; Soares et al., 2013).
The relationship between rRL and rTL presents two distinct trends (Fig. 7a and b). In the interval (Fig. 7a), there is a strong correlation between rRL and rTL, with rRL values 5 %–10 % higher than rTL values. This applies to fossil and to induced tracks over a wide range of track densities (Table 2: ρTL= 0.127–2.923 ×106 cm−2; ρRL= 0.134–3.016 ×106 cm−2). A geometric mean regression line (; r=0.956) has a slope <1 and positive intercept at some distance from the data. We interpret the offset between rRL and rTL as reflecting the fact that shallow tracks, not observed in TL, were counted in RL. The ηq factor for an internal surface is given by ηq≈ 1–2 1–2, wherein z is the critical depth and l the mean track length (Jonckheere and van den Haute, 1999). In the case that all the tracks are counted in RL:
Equation (1) implies that an observation threshold, in the form of a minimum depth for counting a track in TL, accounts for the offset between rRL and rTL and for their correlation. For fixed z, the difference between rRL and rTL increases a little with decreasing l. On average, our results indicate that z≈0.60 µm ( for ), which is less than the depth or width of an etch pit in a prism face after 20 s etching (Figs. 3 and 4). Accounting for 10 % track loss by etching (; e.g., Hurford, 2019) requires a critical angle and tracks with a cone angles , instead of the 1–8∘ angles measured by Aslanian et al. (2021).
The TL count collapses in the interval , while the RL count exhibits little change (Fig. 7b). The change from correlated to uncorrelated TL and RL counts occurs at the point at which tracks at high angles to the c axis break up in a string of etchable segments separated by unetchable gaps (rTL≈0.65; Watt et al., 1984; Green et al., 1986; Green, 1988) or undergo accelerated length reduction (Donelick et al., 1999; Ketcham, 2003). Figure 8 illustrates how the segmentation, combined with an observation threshold, accounts for the break in slope and for the ρRL trend. Before break-up (Fig. 8a), all tracks intersecting the surface are counted in RL, but only those extending below the threshold depth z are also counted in TL. This accounts for the correlation as well as the offset between ρTL and ρRL. Following break-up (Fig. 8b), a fraction of the tracks that extend below z can no longer be etched from the surface over their entire lengths, causing ρTL to plummet without affecting ρRL, terminating their correlation. At advanced annealing stages, the etchable sections are further shortened causing a rapid decrease in those exceeding the TL threshold (ρTL) while having little effect on ρRL (Fig. 8c). We emphasize that the proposed mechanism is conceptual. The assumption that all surface tracks are counted in reflected light, irrespective of the extent of annealing, may be too radical. On the other hand, the sudden breakdown of the TL track densities due to the combination of segmentation and an observation threshold also provides an explanation for the break in slope in plots of reduced mean confined-track lengths against normalized TL track densities (Watt et al., 1984; Watt and Durrani, 1985; Green 1988; Ketcham, 2003). At the same time, it underlines the tenuous character of empirical fits and their dependence on observation criteria and in part explains the disagreement between different solutions (see Table 5 and Fig. 5 of Wauschkuhn et al., 2015a).
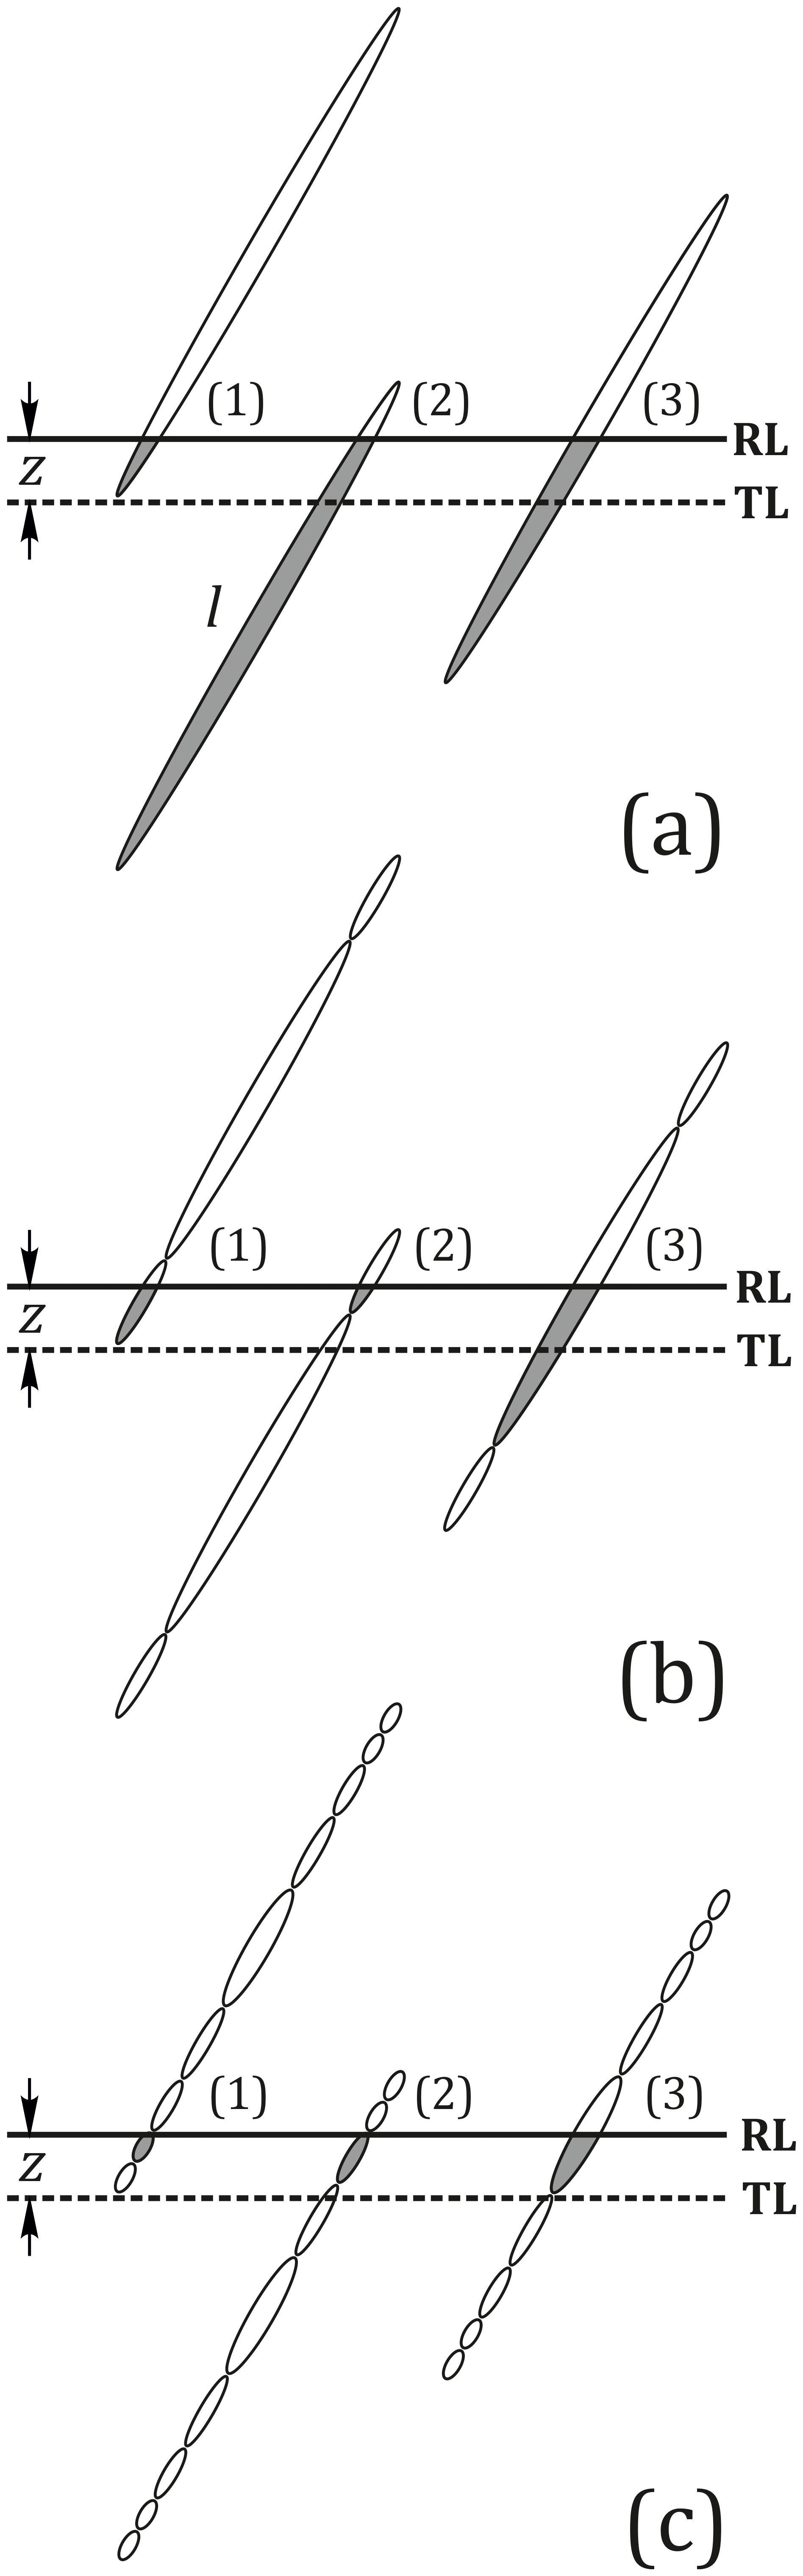
Figure 8The effect of break-up of fission tracks due to the appearance of unetchable gaps in the course of progressive annealing on the number of tracks counted using transmitted (TL) and reflected (RL) light. We assume for the purpose of illustration that all the tracks that intersect the surface are counted in reflected light but only those that reach at least a depth z below the surface have enough optical contrast to be counted in transmitted light. (a) Continuous tracks: the RL count is proportional to the mean track length l (ignoring anisotropy), while the TL count is low by a fraction proportional to (), which varies little with l. (b) Initial break-up: there is no loss of tracks in RL; (1) short tracks invisible in TL remain invisible, but (2) some long tracks can no longer be etched over a sufficient distance from the surface to be visible in TL; (3) if their longer central segments intersect the surface they continue to be counted in TL; the corresponding sections in the grain interior contribute most to the mean confined-track length. (c) Advanced annealing and break-up: the shortest sections remain countable in RL, but none reaches far enough below the surface to be counted in TL. The sketch does not aim to depict the actual dimensions or proportions of etched fission tracks.
We submit this contribution from a concern that, while the tools for interpreting fission-track data are evolving, the calculated ages, age components and thermal histories are only as good as the track counts and the measured track lengths. Measuring and counting fission tracks requires etching to make them accessible for microscopic examination. Track etching is often regarded as an inconsequential sample preparation step. However, recent studies that have taken up the twin issues of etching and observation confirm that both have an effect on confined-track lengths (Jonckheere et al., 2007, 2017; Tamer et al., 2019; Tamer and Ketcham, 2020; Aslanian et al., 2021; Ketcham and Tamer, 2021). Our results show that etching and observation also have consequences for the track counts, which we cannot be confident of evading by selecting apatite prism faces and adopting the ζ calibration for age calculations. Besides being inadequate for the purpose, both measures have drawbacks. Selecting prism (scratched) faces for dating often implies that a large fraction of the grains in a mount is ignored. This can lead to reduced grain counts, which is a particular problem for distinguishing age components in a mixture. Grain selection based on shape can also cause an age component to be missed. The drawbacks of the ζ calibration are of a different nature (Hurford, 1998; Enkelmann et al., 2005; Soares et al., 2013; Jonckheere et al., 2015; Iwano et al., 2018, 2019); ζ is an efficient workaround for the calibration problem, but it is just that: it circumvents difficulties without addressing them. It must be taken on trust that it deals with etching- and counting-related factors under all circumstances.
Our findings provide no solution. It is doubtful that there is a single solution for all polishing, etching and counting protocols or for all samples. Our results do illustrate how simple experiments throw light on the factors affecting the track counts and, hence, the sample ages. This is relevant to the advantages and disadvantages of manual and automatic track counts (Gleadow et al., 2009, 2019; Enkelmann et al., 2012) and to designing training strategies for neural networks (Nachtergaele and De Grave, 2021). It is, in general, useful for evaluating the input, and thus the output, of modeling programs. Grain orientation, polishing finish, etching conditions (time) and observation method are all shown to influence the fission-track counts in apatite. Prism faces are not unproblematic for counting tracks and other orientations are not per se useless. Faster-etching surfaces, in which etch pits do not form at the track–surface intersections (Jonckheere et al., 2020, 2022) can indeed present practical advantages, in addition to the numerical advantage of including them. Their fission-track properties are the subject of ongoing studies. Our results also support the fact that fossil and induced fission tracks are discontinuous towards their tips and that individual segments remain etchable after annealing and break-up.
All raw data are available in Supplement file S2.
The supplement related to this article is available online at: https://doi.org/10.5194/gchron-4-109-2022-supplement.
RJ conceived the experiments, and CA and BW carried them out. They interpreted the results together. CA prepared the figures and the tables. RJ wrote the first draft of the paper. CA, BW and LR discussed and revised it. CA handled the reviews and made the corrections.
The contact author has declared that neither they nor their co-authors have any competing interests.
Publisher’s note: Copernicus Publications remains neutral with regard to jurisdictional claims in published maps and institutional affiliations.
The authors wish to express their gratitude to Murat Taner Tamer and Hideki Iwano for their thoughtful reviews, which enriched the paper, and to associate editor Shigeru Sueoka for efficient editorial handling.
This research has been supported by the Deutsche Forschungsgemeinschaft (grant nos. Jo 358/4-1 and Wa 4390/1-1).
This paper was edited by Shigeru Sueoka and reviewed by Murat Taner Tamer and Hideki Iwano.
Aslanian, C., Jonckheere, R., Wauschkuhn, B., and Ratschbacher, L.: A quantitative description of fission-track etching in apatite, Am. Mineral., 106, 518–526, 2021.
Bhandari, N., Bhat, S. G., Lal, D., Rajagopalan, G., Tamhane, A. S. J., and Venkatavaradan, V. S.: Fission fragment tracks in apatite: recordable track lengths, Earth Planet. Sc. Lett., 13, 191–199, 1971.
Dakowski, M.: Length distributions of fission tracks in thick crystals, Nuclear Track Detection, 2, 181–189, 1978.
Donelick, R. A., Ketcham, R. A., and Carlson, W. D.: Variability of apatite fission-track annealing kinetics: II. Crystallographic orientation effects, Am. Mineral., 84, 1224–1234, 1999.
Enkelmann, E., Jonckheere, R., and Wauschkuhn, B.: Independent fission-track ages (ϕ-ages) of proposed and accepted apatite age standards and a comparison of ϕ-, Z-, ζ- and ζ0-ages: Implications for method calibration, Chem. Geol., 222, 232–248, 2005.
Enkelmann, E., Ehlers, T. A., Buck G., and Schatz A.-K.: Advantages and challenges of automated apatite fission track counting, Chem. Geol., 322–323, 278–289, 2012.
Gleadow, A. J. W., Duddy, I. R., and Lovering, J. F.: Fission-track analysis: A new tool for the evaluation of thermal histories and hydrocarbon potential, APPEA Journal, 23, 93–102, 1983.
Gleadow, A. J. W., Gleadow, S. J., Belton, D. X., Kohn, B. P., Krochmal, M. S., and Brown, R. W.: Coincidence mapping – a key strategy for the automatic counting of fission tracks in natural minerals, Geological Society, London, Special Publications, 324, 25–36, 2009.
Gleadow, A., Kohn, B., and Seiler, C.: The future of fission-track thermochronology, in: Fission-Track Thermochronology and its Application to Geology, edited by: Malusà, M. G. and Fitzgerald, P. G., Springer Textbooks in Earth Sciences, Geography and Environment, 77–92, ISBN 978-3-319-89419-5, 2019.
Green, P. F.: The relationship between track shortening and fission track age reduction in apatite: combined influences of inherent instability, annealing anisotropy, length bias and system calibration, Earth Planet. Sc. Lett., 89, 335–352, 1988.
Green, P. F., Duddy, I. R., Gleadow, A. J. W., Tingate, P. R., and Laslett, G. M.: Thermal annealing of fission tracks in apatite 1. A qualitative description, Chemical Geology: Isotope Geoscience Section, 59, 237–253, 1986.
Hicks, M.-L., Pakpour-Tabrizi, A. C., and Jackman, R. B.: Polishing, preparation and patterning of diamond for device applications, Diam. Relat. Mater., 97, 107424, https://doi.org/10.1016/j.diamond.2019.05.010, 2019.
Hurford, A. J.: Standardization of fission track dating calibration. Recommendation by the Fission Track Working Group of the I.U.G.S. Subcomission on Geochronology, Chemical Geology: Isotope Geoscience Section, 80, 171–178, 1990.
Hurford, A. J.: Zeta: the ultimate solution to fission track analysis calibration or just an interim measure?, in: Advances in fission-track geochronology, edited by: Van den haute, P. and De Corte, F., Kluwer Academic Publishers, 19–32, ISBN 0-7923-4904-0, 1998.
Hurford, A. J.: An historical perspective on fission-track thermochronology, in: Fission-Track Thermochronology and its Application to Geology, edited by: Malusà, M. G. and Fitzgerald, P. G., Springer Textbooks in Earth Sciences, Geography and Environment, 3–23, ISBN 978-3-319-89419-5, 2019.
Iwano, H. and Danhara, T.: A re-investigation of the geometry factors for fission-track dating of apatite, sphene and zircon, in: Advances in fission-track geochronology, edited by: Van den haute, P. and De Corte, F. G., Kluwer Academic Publishers, 47–66, ISBN 0-7923-4904-0, 1998.
Iwano, H., Danhara, T., and Hirata, T.: Standardless fission-track ages of the IUGS age standards, Chem. Geol., 488, 87–104, 2018.
Iwano, H., Danhara, T., Yuguchi, T., Hirata, T., and Ogasawara, M.: Duluth Complex apatites: Age reference material for LA-ICP-MS-based fission-track dating, Terra Nova, 31, 247–256, 2019.
Jonckheere, R.: On the densities of etchable fission tracks in a mineral and co-irradiated external detector with reference to fission-track dating of minerals. Chem. Geol., 200, 41–58, 2003.
Jonckheere, R. and Van den haute, P.: Observations on the geometry of etched fission tracks in apatite: implications for models of track revelation, Am. Mineral., 81, 1476–1493, 1996.
Jonckheere, R. and Van den haute, P.: On the frequency distributions per unit area of the dimensions of fission tracks revealed in an internal and external mineral surface and in the surface of an external detector, Radiat. Meas., 29, 135–143, 1998.
Jonckheere, R. and Van den haute, P.: On the frequency distributions per unit area of the projected and etchable lengths of surface-intersecting fission tracks: Influences of track revelation, observation and measurement, Radiat. Meas., 30, 155–179, 1999.
Jonckheere, R. and Van den haute, P.: On the efficiency of fission-track counts in an internal and external apatite surface and in a muscovite external detector, Radiat. Meas., 35, 29–40, 2002.
Jonckheere, R., Enkelmann, E., Min, M., Trautmann, C., and Ratschbacher, L.: Confined fission tracks in ion-irradiated and step-etched prismatic sections of Durango apatite, Chem. Geol., 242, 202–217, 2007.
Jonckheere, R., Van den haute, P., and Ratschbacher, L.: Standardless fission-track dating of the Durango apatite age standard, Chem. Geol., 417, 44–57, 2015.
Jonckheere, R., Tamer, M. T., Wauschkuhn, B., Wauschkuhn, F., and Ratschbacher, L.: Single-track length measurements of step-etched fission tracks in Durango apatite: “Vorsprung durch Technik”, Am. Mineral., 102, 987–996, 2017.
Jonckheere, R., Wauschkuhn, B., and Ratschbacher, L.: On growth and form of etched fission tracks in apatite: A kinetic approach, Am. Mineral., 104, 569–579, 2019.
Jonckheere, R., Aslanian, C., Wauschkuhn, B., and Ratschbacher, L.: Some geometrical properties of fission-track-surface intersections in apatite, Am. Mineral., 105, 1355–1364, 2020.
Jonckheere, R., Aslanian, C., Wauschkuhn, B., and Ratschbacher, L.: Fission-track etching in apatite: A model and some implications, Am. Mineral., 107, https://doi.org/10.2138/am-2022-8055, in press, 2022.
Ketcham, R. A.: Observations on the relationship between crystallographic orientation and biasing in apatite fission-track measurements, Am. Mineral., 88, 817–829, 2003.
Ketcham, R. A. and Tamer, M. T.: Confined fission-track revelation in apatite: how it works and why it matters, Geochronology, 3, 433–464, 2021.
Ketcham, R. A., Carter A., and Hurford A. J.: Inter-laboratory comparison of fission track confined length and etch figure measurements in apatite, Am. Mineral., 100, 1452–1468, 2015.
Kumar, P., Lee, J., Lee, G., Rao, S., Singh, D., and Singh, R. K.: Low temperature wet etching to reveal sub-surface damage in sapphire substrates, Appl. Surf. Sci., 273, 58–61, 2013.
Li, W., Wang, L., Lang, M., Trautmann, C., and Ewing, R. C.: Thermal annealing mechanisms of latent fission tracks: Apatite vs. zircon, Earth Planet. Sc. Lett., 302, 227–235, 2011.
Li, W., Lang, M., Gleadow, A. J. W., Zdorovets, M. V., and Ewing, R. C.: Thermal annealing of unetched fission tracks in apatite, Earth Planet. Sc. Lett., 321–322, 121–127, 2012.
Li, W., Kluth, P., Schauries, D., Rodriguez, M. D., Lang, M., Zhang, F., Zdorovets, M., Trautmann, C., and Ewing, R. C.: Effect of orientation on ion track formation in apatite and zircon, Am. Mineral., 99, 1127–1132, 2014.
Nachtergaele, S. and De Grave, J.: AI-Track-tive: open-source software for automated recognition and counting of surface semi-tracks using computer vision (artificial intelligence), Geochronology, 3, 383–394, https://doi.org/10.5194/gchron-3-383-2021, 2021.
Paul, T. A.: Transmission electron microscopy investigation of unetched fission tracks in fluorapatite – physical process of annealing, Nucl. Tracks Rad. Meas., 21, 507–511, 1993.
Paul, T. A. and Fitzgerald, P. G.: Transmission electron microscopic investigation of fission tracks in fluorapatite, Am. Mineral., 77, 336–344, 1992.
Soares, C. J., Guedes, S., Tello, C. A., Lixandrão Filho, A. L., Osório, A. M., Alencar, I., Dias, A. N. C., and Hadler, J.: Further investigation of the initial fission-track length and geometry factor in apatite fission-track thermochronology, Am. Mineral., 98, 1381–1392, 2013.
Stübner, K., Jonckheere, R., and Ratschbacher, L.: Revelation of nuclear tracks and dislocations: A Monte Carlo simulation of mineral etching, Geochim. Cosmochim. Ac., 72, 3184–3199, 2008.
Tagami, T. and O'Sullivan, P. B.: Fundamentals of fission-track thermochronology, Rev. Mineral. Geochem., 58, 19–47, 2005.
Tamer, M. T. and Ketcham, R. A.: The along-track etching structure of fission tracks in apatite: Observations and implications, Chem. Geol., 553, 119809, https://doi.org/10.1016/j.chemgeo.2020.119809, 2020.
Tamer, M. T., Chung, L., Ketcham, R. A., and Gleadow, A. J. W.: Analyst and etching protocol effects on the reproducibility of apatite confined fission-track length measurement, and ambient-temperature annealing at decadal timescales, Am. Mineral., 104, 1421–1435, 2019.
Wauschkuhn, B., Jonckheere, R., and Ratschbacher, L.: The KTB apatite fission-track profiles: Building on a firm foundation?, Geochim. Cosmochim. Ac., 167, 27–62, 2015a.
Wauschkuhn, B., Jonckheere, R., and Ratschbacher, L.: Xe- and U-tracks in apatite and muscovite near the etching threshold, Nucl. Instrum. Meth.-B, 343, 146–152, 2015b.
Watt, S. and Durrani, S. A.: Thermal stability of fission tracks in apatite and sphene: using confined-track-length measurements, Nuclear Tracks, 10, 349–357, 1985.
Watt S., Green, P. F., and Durrani, S. A.: Studies of annealing anisotropy of fission tracks in mineral apatite using track-in-track (tint) length measurements, Nucl. Tracks Rad. Meas., 8, 371–375, 1984.