the Creative Commons Attribution 4.0 License.
the Creative Commons Attribution 4.0 License.
 | 29 Mar 2022
Comparison of basin-scale in situ and meteoric 10Be erosion and denudation rates in felsic lithologies across an elevation gradient at the George River, northeast Tasmania, Australia
Leah A. VanLandingham
Eric W. Portenga
Edward C. Lefroy
Amanda H. Schmidt
Paul R. Bierman
Alan J. Hidy
Long-term erosion rates in Tasmania, at the southern end of Australia's Great Dividing Range, are poorly known; yet, this knowledge is critical for making informed land-use decisions and improving the ecological health of coastal ecosystems. Here, we present quantitative, geologically relevant estimates of erosion rates for the George River basin, in northeast Tasmania, based on in situ-produced 10Be (10Bei) measured from stream sand at two trunk channel sites and seven tributaries (mean: 24.1±1.4 ; 1σ). These new 10Bei-based erosion rates are strongly related to elevation, which appears to control mean annual precipitation and temperature, suggesting that elevation-dependent surface processes influence rates of erosion in northeast Tasmania. Erosion rates are not correlated with slope in contrast to erosion rates along the mainland portions of Australia's Great Dividing Range. We also extracted and measured meteoric 10Be (10Bem) from grain coatings of sand-sized stream sediment at each site, which we normalize to measured concentrations of reactive 9Be and use to estimate 10Bem-based denudation rates for the George River. denudation rates replicate 10Bei erosion rates within a factor of 3 but are highly sensitive to the value of 9Be that is found in bedrock (9Beparent), which was unmeasured in this study. denudation rates seem sensitive to recent mining, forestry, and agricultural land use, all of which resulted in widespread topsoil disturbance. Our findings suggest that denudation metrics will be most useful in drainage basins that are geologically homogeneous, where recent disturbances to topsoil profiles are minimal, and where 9Beparent is well constrained.
- Article
(6247 KB) - Full-text XML
- BibTeX
- EndNote


Erosion rates of river basins derived from measurements of the in situ-produced cosmogenic isotope, 10Bei, have been used to infer topographic, tectonic, and climatic drivers of landscape evolution for thousands of individual river basins (Codilean et al., 2018; Harel et al., 2016; Mishra et al., 2019; Portenga and Bierman, 2011; Wittmann et al., 2020) and to contextualize the effects of land use on erosion and sediment dynamics (Portenga et al., 2019; Schmidt et al., 2018). Sufficient data now exist that erosion rates from individual studies have been compiled and analyzed at the scale of entire continental orogens to demonstrate primary and secondary controls on erosion across thousands to tens of thousands of years (Aguilar et al., 2014; Carretier et al., 2018; Codilean et al., 2021; Delunel et al., 2020; Starke et al., 2020). For example, Delunel et al. (2020) find that 10Bei erosion rates across the European Alps are strongly linked to mean basin slope and influenced by uplift and glaciation. A number of north–south latitudinal studies from the South American Andes show that erosion in some segments of the range is driven by uplift (Carretier et al., 2015; Starke et al., 2017) and slope (Carretier et al., 2018) but not necessarily by rainfall unless one considers the effects of vegetation in driving soil weathering rates (Carretier et al., 2015; Starke et al., 2020). A new compilation and analysis of 10Bei erosion rates across the Great Dividing Range of eastern Australia is the first to analyze landscape dynamics across a continent-spanning, passive, post-orogenic rift margin and finds that basin slope is most closely related to erosion at all spatial scales, more so than any other potential driver of erosion (Codilean et al., 2021). While Codilean et al.'s (2021) analysis comprises erosion rates from the western and eastern flanks of the Great Dividing Range – from tropical rainforests in northern Queensland to temperate southeast Victoria – it is restricted to mainland Australia.
Despite the widespread measurement of 10Bei to elucidate erosion rates globally, erosion rate data do not exist for many areas of Earth's surface. An understanding of drivers of erosion will be improved by measuring erosion rates in these understudied areas. In this study, we supplement Codilean et al.'s (2021) erosion compilation with the first 10Bei-based erosion rates from the southernmost end of the eastern Australian passive margin on the island state of Tasmania, specifically the George River basin (Fig. 1). Data in this study are also the first erosion rates measured in temperate rainforests of the Southern Hemisphere (cf. Adams and Ehlers, 2017; Belmont et al., 2007). Quantitative erosion rate data for Tasmania and many of its fluvial systems are currently lacking (Jerie et al., 2003; Koehnken, 2001); data, such as we provide here, are useful information for land managers and for estuary restoration efforts.
Figure 1Generalized tectonic map of the eastern Southern Ocean and southwest Pacific Ocean, surrounding Tasmania, including large-scale geologic structures in southeast Australia and Tasmania: double-black lines are active mid-ocean ridges; bold dashed black line are convergent plate boundaries; thin solid black lines are transform boundaries. Inset shows detailed topography of Tasmania. The main George River basin is shown outlined in black. Major estuaries of other Tasmanian river systems are indicated for reference: Derwent Estuary (DE), Macquarie Harbour (MH), Tamar Estuary (TE), Georges Bay (GB). Cities are shown with black dots for reference: Hobart (H), Launceston (L), St. Helens (SH).
The George River empties into Georges Bay (with an “s”), which is known for its oyster stocks (Mitchell et al., 2000) but has been degraded by a history of timber production, tin mining, and agriculture. Historical land-use practices in the catchment have supplied > 106 m3 of sediment to Georges Bay since the late 19th century (Knighton, 1991) and continue to release pollutants into the bay (Bleaney et al., 2015; Crawford and White, 2005). The success of efforts to rehabilitate Georges Bay relies in part on reducing sediment delivery from the George River to Georges Bay to pre-disturbance levels (Batley et al., 2010; Crawford and White, 2005; Kragt and Newham, 2009; McKenny and Shepherd, 1999; Mount et al., 2005), but no pre-disturbance erosion data exist for the George River, nor do any geologically relevant erosion rates exist for any part of Tasmania. Measuring erosion rates for the George River contributes to the growing geomorphological understanding of the drivers of erosion in Tasmania, across Australia, and in similar geological settings elsewhere.
Quantifying landscape dynamics with in situ and meteoric 10Be
The primary goal of this study is to provide background rates (over millennia) of landscape change in the George River basin using the in situ cosmogenic isotope beryllium-10 (10Bei) in fluvial sediment (Bierman and Steig, 1996; Brown et al., 1995; Granger et al., 1996). 10Bei production decreases exponentially with depth in rock and sediment near Earth's surface such that 10Bei concentrations at depths > 2 m are much lower compared to those measured closer to Earth's surface (Gosse and Phillips, 2001; Lal, 1991). 10Bei produced by muons dominates at depths > 2 m (Braucher et al., 2003; Gosse and Phillips, 2001; Heisinger et al., 1997), but muogenic 10Bei production is negligible when compared to near-surface spallogenic 10Bei production, except in rapidly eroding landscapes or landscapes with steep terrain (e.g., Dethier et al., 2014; Fellin et al., 2017; Rosenkranz et al., 2018; Scherler et al., 2014; Siame et al., 2011). Bioturbation homogenizes 10Bei concentrations in soils, in many places to depths of at least ∼ 1 m (Brown et al., 1995; Schaller et al., 2018), and thus 10Bei erosion rates are largely insensitive to widespread shallow erosion. This insensitivity allows 10Bei erosion rates to be a useful gauge of pre-disturbance rates of landscape change (Ferrier et al., 2005; Portenga et al., 2019; Schmidt et al., 2018; Vanacker et al., 2007), except where human land use is intensive (i.e., Schmidt et al., 2016) or the effects of human land use are exacerbated by climate extremes (i.e., Rosenkranz et al., 2018). Pre-disturbance 10Bei erosion data can thus inform approaches to reducing sediment delivery from the George River and support efforts to improve the ecological health of the Georges Bay estuary and possibly other watersheds in northeast Tasmania that share similar bedrock and topographic characteristics by providing a benchmark against which to compare modern sediment loads.
In addition to 10Bei, which is produced in rock and sediment, 10Be is also produced via spallation of oxygen and nitrogen in the atmosphere; this 10Be rains out or falls to Earth's surface (meteoric 10Be; 10Bem; Heikkilä and von Blanckenburg, 2015; Monaghan et al., 1986; Reusser et al., 2010) where it is readily adsorbed into sediment grain coatings. 10Bem has traditionally been used to trace sediment through landscapes (Brown et al., 1988; Helz et al., 1992; Portenga et al., 2017; Reusser and Bierman, 2010; Valette-Silver et al., 1986), but recently derived equations (along with a series of assumptions) now allow denudation rates to be calculated from measurements of 10Bem that are normalized to non-cosmogenic, stable 9Be, which weathers out of mineral grains (9Bereac; von Blanckenburg et al., 2012). denudation rates have been used to quantify landscape evolution over a variety of spatial scales for different river basins (Dannhaus et al., 2018; Deng et al., 2020; Portenga et al., 2019; Rahaman et al., 2017; Wittmann et al., 2012, 2015; in some cases 10Bem is referred to as the reactive phase of 10Bem [10Bereac], and denudation rates may be referred to as 10Bereac/9Bereac denudation rates) and have shown promise in quantifying landscape dynamics in quartz-poor landscapes (Deng et al., 2020; Rahaman et al., 2017).
In this study, we use both 10Bei and to measure the rates at which mass is lost from the George River basin's slopes. Over timescales sufficiently long that the assumption of steady state is approached, all of this mass will transported to the Georges Bay. Such mass loss from the George River basin is both chemical (dissolved load) and physical (sediment transport). The partitioning between these phases differs dramatically around the world depending on rock type, topography, and weathering regime and likely differs within the study basin. The assumptions underlying these two methods (10Bei and ) differ; thus, results from each method may not be the same. The concentration of 10Bei is biased towards mass loss within the upper meters of Earth's surface where rates of neutron spallation are high. Both chemical and physical mass losses within this surface layer of regolith are reflected by 10Bei concentrations. , if the assumptions of the analytical model are met, reflects both physical and chemical mass loss throughout the regolith, regardless of depth.
The terms “erosion” and “denudation” have been used without precision in the literature, often as a replacement for one another. Erosion is applied more often to rates calculated using the concentration of 10Bei; rates calculated using are more frequently referred to as denudation. We follow that convention in this paper. Because we have dissolved and suspended load data as well as river flow over time from the mouth of the George River, we attempt to provide a full discussion of what the rates we measure mean for landscape dynamics within the George River basin.
The small size and relatively uniform bedrock geology of the George River basin provide an ideal location to compare 10Bei erosion rates with denudation rates (von Blanckenburg et al., 2012). 10Bem can be desorbed from sediment grain coatings under low-pH conditions (Aldahan et al., 1999; You et al., 1989), but 10Bem loss from soil profiles in solution is likely minimal in the George River basin, because measured soil pH values in the catchment range from 4.0–5.5 (Kidd et al., 2015) and long-term monitoring of stream water pH at two gauging stations – one in Ransom Creek and the other at the George River in St. Helens – shows that stream pH is consistently > 5 and mostly > 6 (DPIPWE, 2021a, b). The George River basin is a landscape of relative geological homogeneity in comparison to more geologically diverse landscapes with similar datasets (i.e., Deng et al., 2020; Portenga et al., 2019; Rahaman et al., 2017). Although the George River has a simple bedrock geology, it also has a long history of forestry and lode and placer tin mining that has, in the past, disturbed the hillslopes and fluvial systems (Knighton, 1991; Preston, 2012). Given that land use is speculated to affect the results of -derived denudation rate calculations elsewhere (Portenga et al., 2019), we also explore how land use in the George River affects our interpretations of 10Be-based erosion and denudation calculations in this study.
Tasmania separated from mainland Australia during Cretaceous rifting of Antarctica and Australia and sits at the southern end of the Great Australian Escarpment – a steep arch-type escarpment that formed during the separation of Zealandia from mainland Australia in the middle to Late Cretaceous (Fig. 1; Codilean et al., 2021; Crowder et al., 2019; Etheridge et al., 1987; Gaina et al., 1998; Griffiths, 1971; Gunn, 1975; Hayes and Ringis, 1973; Lanyon et al., 1993; Matmon et al., 2002; McDougall and van der Lingen, 1974; Mortimer et al., 2017; Persano et al., 2002; Sutherland et al., 2001; Weissel and Hayes, 1977). Bedrock of the George River basin is granodiorite and granite associated with the Blue Tier Batholith (S-type granites), which was emplaced into sediments of the Mathinna Supergroup in the Devonian (Fig. 2; Foster et al., 2000; Gee and Groves, 1971; Gray and Foster, 2004; Higgins et al., 1985; McCarthy and Groves, 1979; Seymour et al., 2006). Siluro-Devonian sedimentary rocks and Neogene basalts underlie small areas, primarily along drainage divides in the central and the western George River basin (Seymour et al., 2006).
Figure 2(a) Elevation map of the topography of the George River basin. Sample collection sites (white circles), active and inactive Australian Bureau of Meteorology rainfall gauging stations (upright and inverted cyan triangles, respectively), and temperature logger locations (green stars) are shown (Webb et al., 2018, 2020). (b) Bedrock geology map of George River shows the widespread occurrence of Devonian felsic intrusions of the Blue Tier Batholith, which underlies the vast majority of the field area. Note that basins TG-2, TG-4, TG-5, and TG-8 are almost entirely underlain by Devonian felsic intrusions. Areas of historic mining are shown (pink squares and polygons; Knighton, 1991), the action of which delivered > 106 m3 to the George River delta in Georges Bay (GB). Locations of boreholes that strike bedrock are shown by yellow diamonds (BoM, 2015). Maps are projected in UTM Zone 55S; coordinates shown in panel (b) are the same for panel (a). Topographic relief base maps come from the ArcGIS Online World Topographic Map (Esri, 2012).
Table 1Meteorological and bedrock data for the George River basin.

a Years listed in data ranges are the first and last years for which 12 months of data are available. b Temperature logger data sourced from the State of Tasmania Air Temperature Logger Recording Database, used by Webb et al. (2018, 2020). Each year has temperature recorded for at least 30 % of days (average = 71 %). c Depth to regolith measured in boreholes (BoM, 2015).
The George River basin, located in northeastern Tasmania, is of modest size (557 km2) with low elevation (mean: 386 m) and gentle hillslopes (mean: 10∘). It drains the eastern slopes of the Rattler Range, which currently has a warm, temperate climate (Kottek et al., 2006). Despite eastern Tasmania being in the rain shadow of the central Tasmanian Highlands and western coast ranges, measurements from rainfall gauging stations and temperature data loggers within and near the George River basin show that the local topography of the Ben Lomond Plateau induces strong relationships across the basin between elevation, mean annual precipitation, and mean annual temperature (Fig. 3; Table 1; BoM, 2021; Webb et al., 2018, 2020).
Figure 3(a) Mean annual precipitation from active (cyan triangles) and inactive (inverted cyan triangles) Australian Bureau of Meteorology rainfall gauging stations across George River basin that have at least 1 full year of recorded data exhibiting a strong correlation with station elevation. (b) Mean annual temperature (green stars) taken from temperature loggers with > 2 years of nearly daily data showing a strong inverse correlation with elevation. Precipitation and temperature data shown in Table 1.
Human land use in Tasmania begins > 35 ka, when Aboriginal Australians crossed to the island from the Australian mainland (Cosgrove, 1995; Cosgrove et al., 1990), possibly corresponding to subaerial exposure of the Bass Strait ∼ 56–40 ka (MacIntosh et al., 2006) and localized ice advances in the central Tasmanian highlands (Barrows et al., 2001, 2002; Colhoun, 2002; MacIntosh et al., 2006). Ecological habitat suitability models, based on characteristics and locations of thousands of archeological sites across Tasmania, indicate that Aboriginal communities were located close to freshwater sources and coastal resources, such as the landscapes around Georges Bay and the lower elevations within tributaries to the George River (Jones et al., 2019). Human arrival in Tasmania has been linked to widespread erosion events in mid-elevation landscapes (McIntosh et al., 2009).
More recently, decades of intensive tin lode mining in isolated headwaters of some tributaries and pockets of hydraulic sluice mining for tin in lowland floodplains introduced > 106 m3 of tailings to the George River and its tributaries (Fig. 2a). Knighton (1991) notes that the pre-mining average grain size of alluvium for the George River was 30–50 mm, and that this was reduced to 1–2 mm during the mining era; however, it is not clear whether the 30–50 mm average grain size was specific to one sample site, or for the George River as a whole. Knighton (1991) notes that bedload characteristics have since returned to their pre-disturbance values following widespread alluvium storage in floodplains and aggradation at the George River delta in Georges Bay (Cheetham and Martin, 2018; Martin and Cheetham, 2018). Despite the George River's return to pre-disturbance channel and bedload characteristics, a study from an experimental forest in the Gentle Annie tributary to the George River shows that sediment yields from logged plots continue to be elevated relative to sediment yields from unlogged plots (Wilson, 1999). More recently, land use within the George River basin in 2008, at the time of sample collection, consisted primarily of forestry production from relatively natural environments and secondarily of conservation land (Fig. 4); intensive land use (i.e., built structures, permanent land alteration) and agricultural production from unirrigated land occur in equal proportion, though much less than the primary and secondary land uses. Only a small percentage of the George River basin is used for agricultural production from irrigated lands (ABARES, 2016).
Figure 4Land cover for each sampled tributary catchment in the George River basin from 2001 (top), 2005 (center), and 2010 (bottom) – the period of leading up to and immediately following sample collection in 2008. The Australian Land Use and Management Classification system groups land use into five primary classes based on their potential to impact the natural environment (ABARES, 2016). The white square denotes location of the Gentle Annie experimental catchment (Wilson, 1999). Stippled areas outlined in white are areas that have been affected by forest fires or prescribed burns in the past (Land Tasmania, 2020). Maps are projected in UTM Zone 55S. Topographic relief base maps come from the ArcGIS Online World Topographic Map (Esri, 2012).
Table 2Sample locations and topographical basin data.

a Based or derived from Satellite Radar Topography Mission data, 90 m resolution (Gallant et al., 2011). Mean local relief calculated using a 10-cell (∼ 900 m) circular moving window. b Used in the calculation of the meteoric 10Be delivery rate, , for each catchment (Graly et al., 2011). Calculated using the basin average elevation and using the regression equation between elevation and mean annual precipitation at Australian Bureau of Meteorology stations (Figs. 2 and 3; Table 1). c Erosivity ratings from Kidd et al. (2014, 2015).
3.1 Sample collection and measurement
Sediment samples for this study were collected in 2008 from several locations along the trunk (n = 2) and tributaries (n = 7) of the George River (samples TG-1 through TG-9; Fig. 2; Table 2), upstream of which channels are generally concave-up and therefore in geomorphic steady state (Fig. 5). At each site, sediment was collected from the streambed and/or in-channel bars to ensure active fluvial transport and mixing. Samples were sieved in the field to the 250–850 µm grain-size fraction. Although this grain size is finer than the mean natural grain size (30–50 mm; Knighton, 1991), previous studies show that 10Bei grain-size bias is minimal or not present in small, low-elevation, low-relief, temperate landscapes where landslides are uncommon (van Dongen et al., 2019); thus, 10Bei measured from the 250–850 µm grain-size fraction at George River can be interpreted as a geological erosion rate.
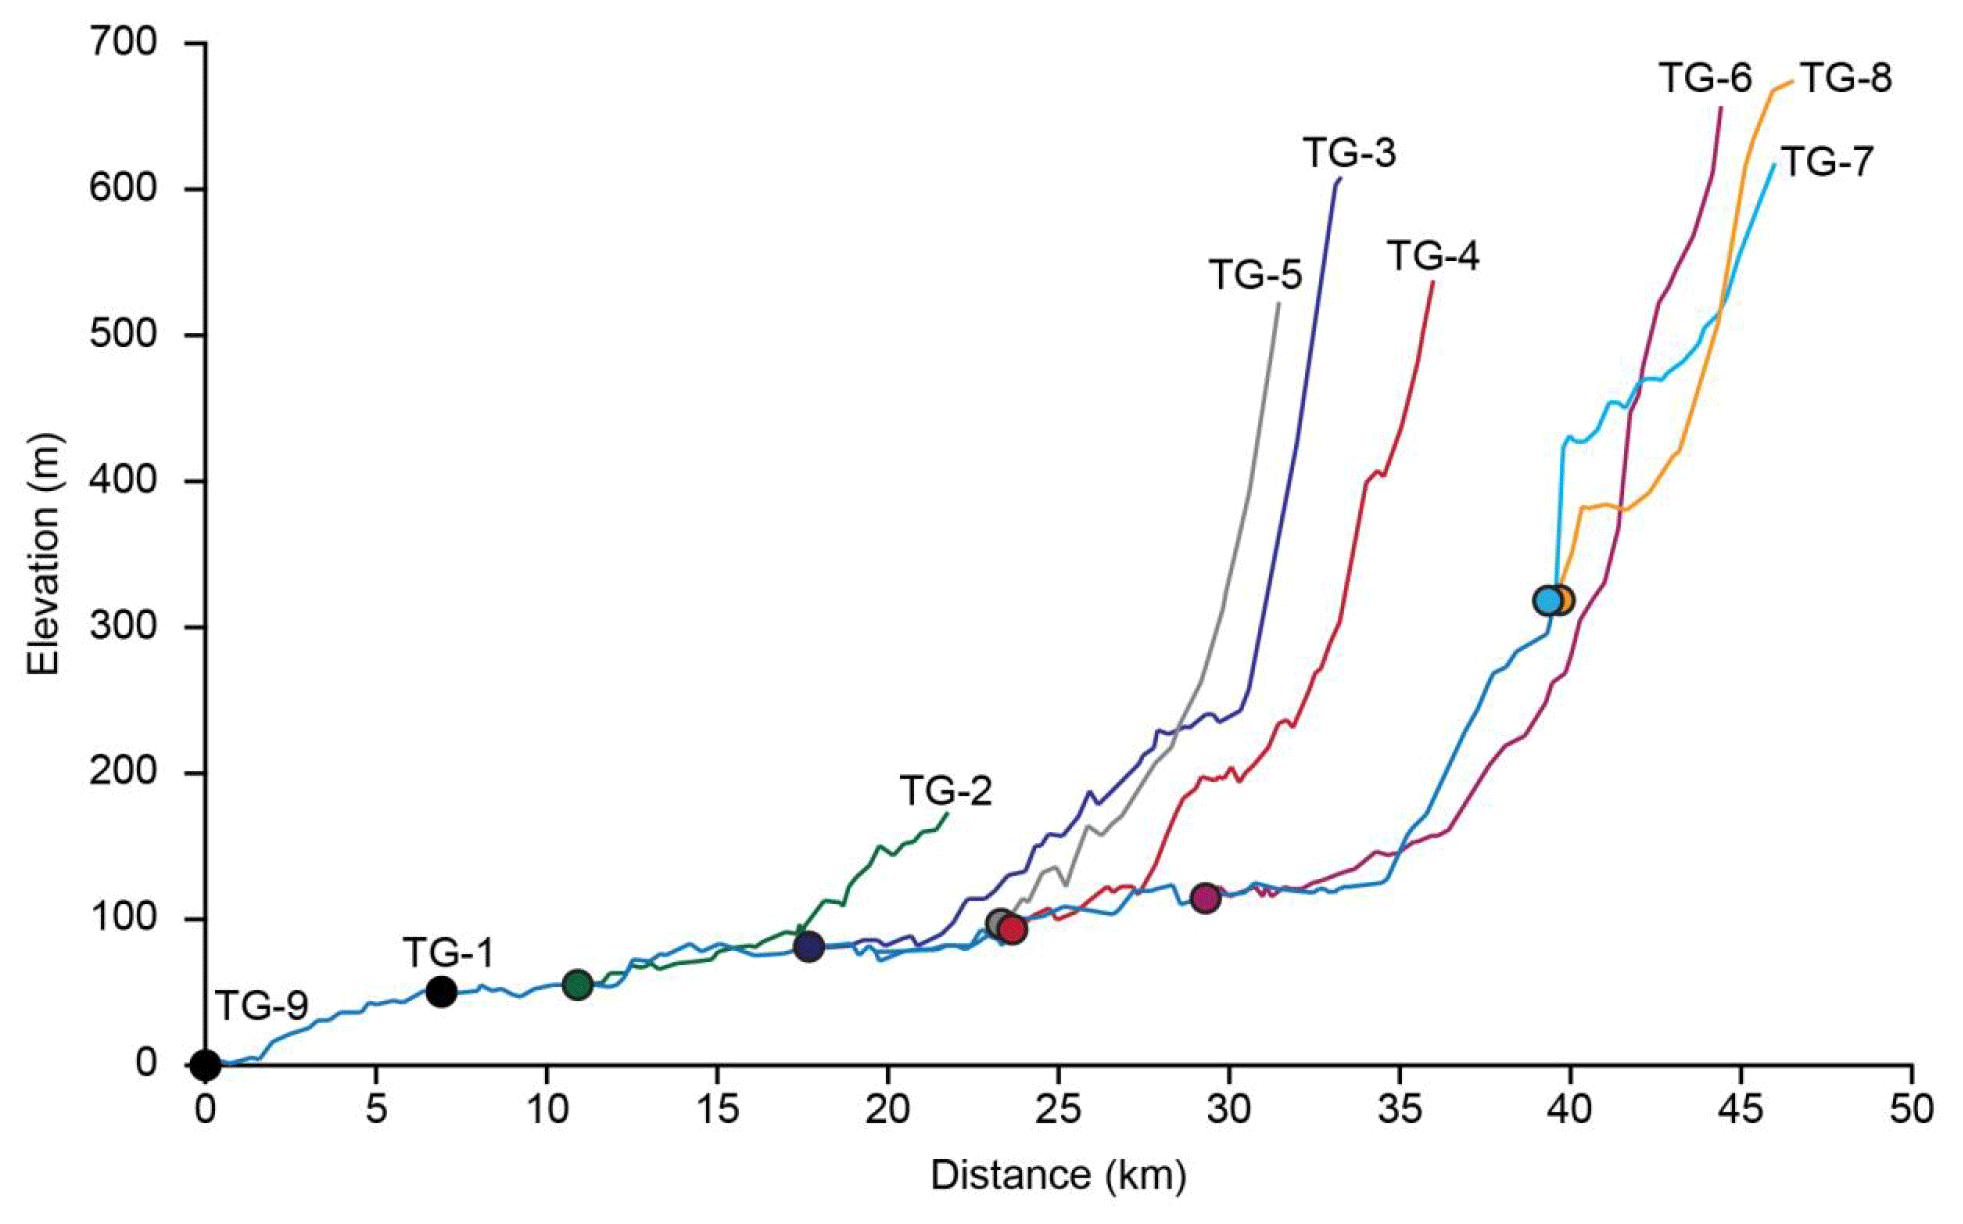
Figure 5Stream profiles of sampled sites along the George River trunk channel (TG-1, TG-9) and its tributaries (TG-2 through TG-8).
10Bem and the weathered reactive and silicate-bound in situ phases of 9Be (9Bereac and 9Bemin, respectively) were measured only from the 250–850 µm grain-size fraction from all seven tributary sites (TG-2 through TG-8) and one of the trunk channel sites (TG-9). When 10Bem is normalized to 9Bereac following von Blanckenburg et al.'s (2012) denudation rate equation, grain-size biases in resulting -based denudation rates are diminished (Wittmann et al., 2012). Singleton et al. (2016) also showed the diminishment of grain-size bias in stream sand for 10Bem measurements when normalized to 9Bereac. Although it is possible to calculate erosion rates from 10Bem alone (Brown et al., 1988; Harrison et al., 2021; Willenbring and von Blanckenburg, 2010), this method does not include any normalization to 9Bereac, and 10Bem erosion rates are thus susceptible to grain-size bias, especially if the full grain-size distribution is not known and/or has not been analyzed. As our samples are of one grain-size fraction and were collected and sieved in the field prior to 10Bem erosion rate derivations, we only present -based denudation rates in this study.
Table 3Isotope data.

a In situ batch 432 blank ratio .
b In situ batch 438 blank ratio .
c In situ batch 446 blank ratio = .
d Meteoric batch MB-15 blank ratio .
Table 4In situ and meteoric beryllium isotopic data.
a Balco et al. (2008), Gosse and Phillips (2001). b Scaled for each basin following Lal (1991) and Stone (2000). c Half-life of 10Be = 1.36 Myr. d von Blanckenburg et al. (2012). e Various values used; see Sect. 5.4 for full discussion.
Table 510Bei-based erosion rates and -based denudation rates.

* 10Bei erosion rates calculated using the CRONUS erosion rate calculator version 3.0, wrapper version 3.0, erates version 3.0, muons version 3.1 (Balco et al., 2008).
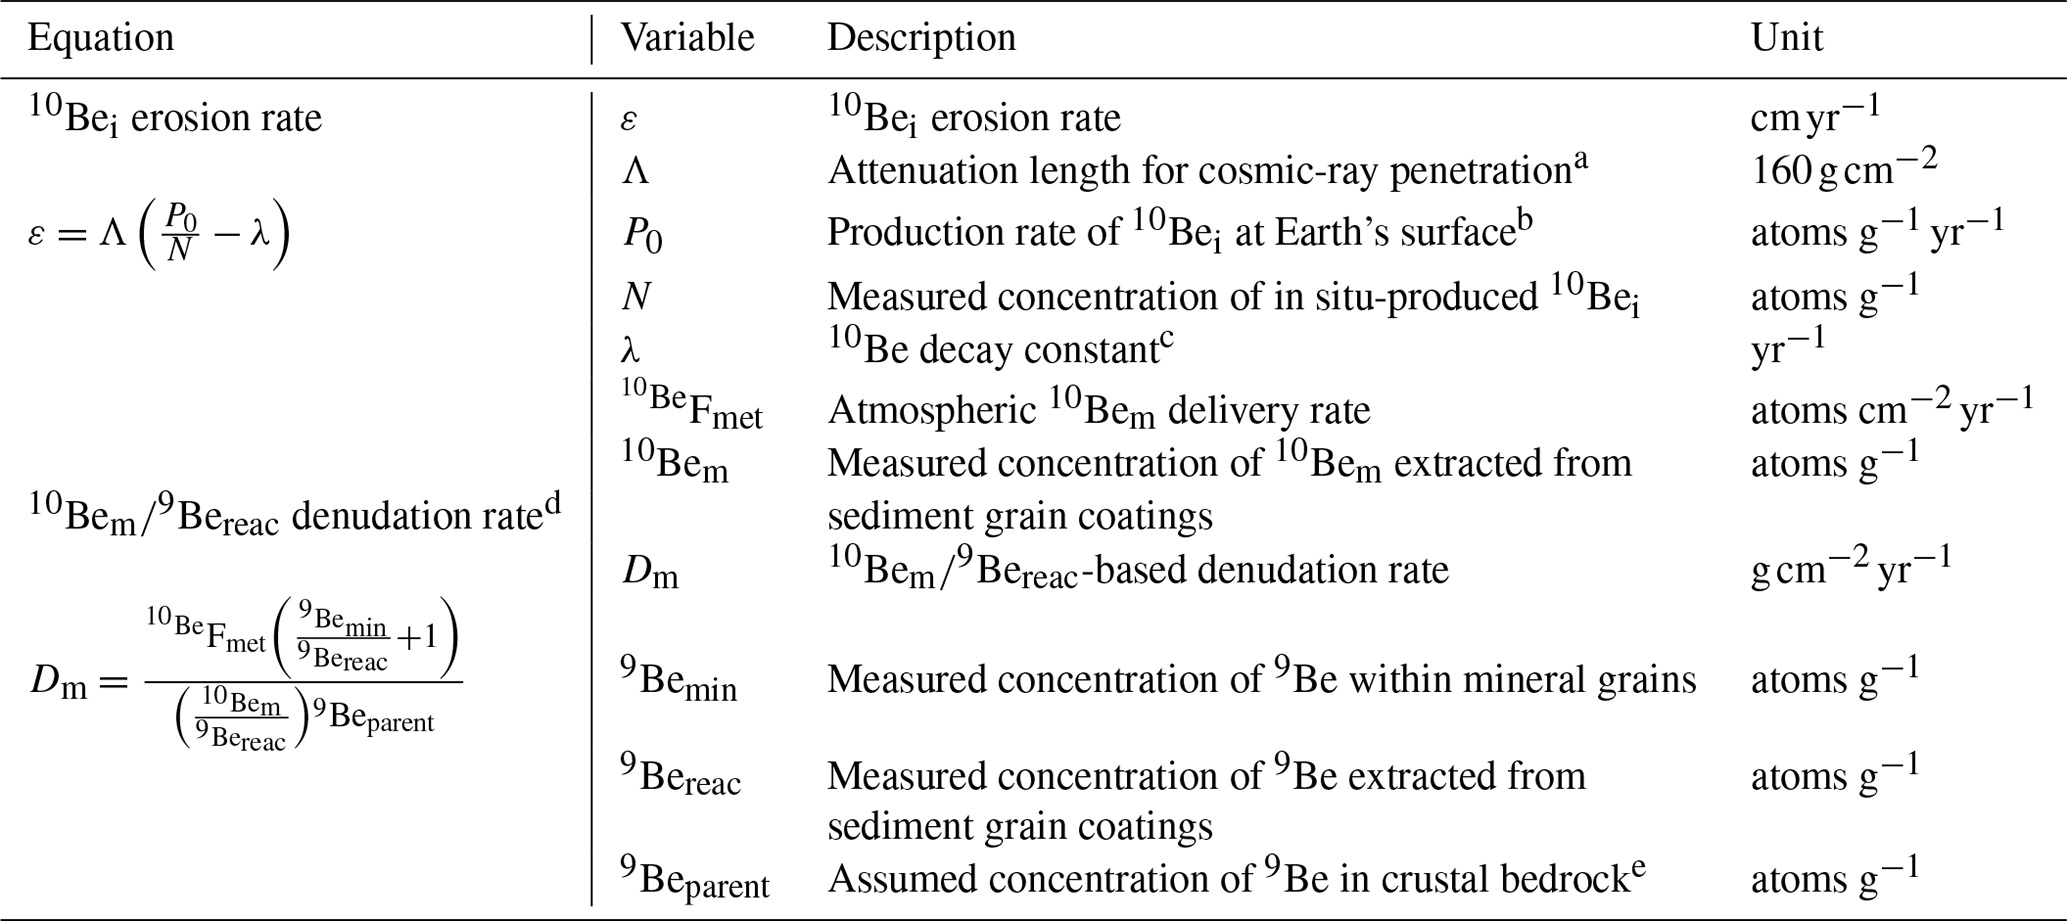
10Bei was extracted at the University of Vermont from quartz from each sample following standard methods, during which a known amount of a 9Be carrier (9Becarr) was added to each sample (Kohl and Nishiizumi, 1992; Corbett et al., 2016); relative to the amount of 9Becarr, no significant native Be was found in quartz concentrates from any sample, which can otherwise lead to significant overestimates of 10Bei-based erosion rates (Portenga et al., 2015). ratios were measured by accelerator mass spectrometry at the Lawrence Livermore National Laboratory CAMS facility (Table 3); 10Bei measurements were blank-corrected (the average ratio of three blanks was subtracted from the ratio of each unknown sample) and normalized to the 07KNSTD3110 accelerator mass spectrometry 10Be standard material, which has a nominal ratio of 2.85 × 10⁻¹² (Nishiizumi et al., 2007). 10Bei production was averaged across all sampled basins to a single point following Portenga and Bierman (2011), and the online erosion rate calculator described by Balco et al. (2008), which has been subsequently updated, was used to derive 10Bei erosion rates following the Lal (1991) and Stone (2000) scaling schemes (ε, Tables 4 and 5). Here, ε is presented in units of (Table 5) allowing us to compare measurements of ε directly with -based denudation rates (Dm; see below). Muogenic production of 10Bei is incorporated into ε; however, muogenic 10Bei is negligible relative to spallogenic 10Bei production given the George River's post-orogenic, low-elevation, low-relief setting.
10Bem was extracted following Stone's (1998) fusion method, and a 9Be carrier solution was added to each sample. Through this process, some amount of 10Bei from bulk sediment is incorporated into the 10Bem sample; however, the amount of 10Bei is negligible, consistently 2 orders of magnitude less than 10Bem measurements (Table 3). ratios of these fusion extracts were measured at the Lawrence Livermore National Laboratory CAMS facility, blank-corrected (ratio of one blank was subtracted from ratio of each unknown sample; Table 3) and normalized to the 07KNSTD3110 standard material (Nishiizumi et al., 2007). Sample material used to calculate 9Bereac was first subject to 6 N HCl acid leaching to remove sediment grain coatings (Greene, 2016; Portenga et al., 2019, their supplement); it was then fully digested in HF, and 9Bemin was measured in that solution. Both 9Bereac from sediment grain coatings and 9Bemin from the remaining mineral material were measured by inductively coupled plasma-optical emission spectrometry (ICP-OES) at the University of Vermont. Together, these data were used to derive denudation rates following von Blanckenburg et al. (2012; Table 4); two variables required to calculate denudation rates that we did not or were not able to measure are the deposition rate of meteoric 10Be () and the amount of 9Be that is naturally occurring in bedrock (9Beparent). We use estimated values of based on global deposition models presented in Graly et al. (2011), because it provides an estimate of that is specific for each sampled basin (8.55 × 10⁵ to 1.46 × 10⁶ ). At the time of sample collection (2008), the equations to calculate Dm had not been published, and bedrock samples from the field area were not collected. We therefore use a value of 4.1 ppm for the amount of 9Beparent in our samples because the George River basin is underlain by biotite granites, and the average 9Beparent value of biotite granites comprising a subset from over 200 felsic intrusions measured across China and the Soviet Union in the mid-1900s was reported to be 4.1 ppm (Beus, 1962; additionally reported in Sainsbury, 1964). We discuss the use of Graly et al.'s (2011) estimates and Beus's (1962) average 9Beparent for biotite granites in the Discussion section. In this study, Dm is presented in units of (Table 5).
3.2 Topographic, climatic, and anthropogenic characterization of the George River basin
We compare ε and Dm to various topographic and land-use factors to assess possible processes driving or related to background landscape evolution in the George River (Tables 1 and 2). Topographic data are derived from the Shuttle Radar Topography Mission (SRTM) 90 m resolution global dataset (Gallant et al., 2011). Mean local relief was calculated over a moving 10-cell (∼ 900 m) circular window. We do not compare ε or Dm to climate data from global gridded datasets for mean annual temperature and mean annual precipitation, although such data are available. This is because the gridded datasets are all models based on limited measurements and include a strong elevation component in their interpolation scheme (e.g., WorldClim, Fick and Hijmans, 2017) or have spatial resolutions that do not provide sufficient detail for the small size of the George River basin (e.g., TRMM, Huffman, 2021). These characteristics of gridded climate datasets make it difficult to attribute erosion to climatic drivers independent of their self-correlation with elevation. Thus, we rely on observed relationships between elevation and precipitation and temperature data from precipitation gauges (n = 10, each with > 4 years of daily data; Table 1, Figs. 2 and 3) and temperature loggers (n = 5, each with > 2 years of hourly data from at least 30 % of days reporting, average = 70 % of days reporting; Table 1, Figs. 2 and 3). Although the spatial coverage of rainfall gauges and temperature loggers is small relative to the coverage of interpolated, modeled, gridded data, they provide us an opportunity to work with measured, basin-specific data.
Proper interpretation of 10Bem-derived denudation rates requires an understanding of the potential for beryllium weathering and desorption from sediment grain coatings and mobility through regolith (von Blanckenburg et al., 2012). To this end, information on (1) the depth of regolith and (2) chemical weathering data across the George River basin is needed. A potentially relevant dataset available for Tasmania is an interpolated gridded map of the depth of regolith (Wilford et al., 2016). However, like the WorldClim precipitation and temperature datasets, the gridded regolith dataset was created by interpolating measured data from around Australia using a model and has an implicit dependence on elevation that does not reflect measured depths to bedrock in the George River basin. Only three boreholes exist in the George River basin that clearly go through regolith to bedrock, from which we extracted regolith depth (BoM, 2015; Fig. 2a; Table 1). They do not match the model results. These three boreholes, and others in the study area, have some units that could be alluvium or regolith; this differentiation is not clear, and therefore the depth of regolith could be overestimated if alluvium is marked as regolith. Thus, we do not know with certainty the depth of regolith across our field area, and we therefore cannot draw any clear conclusions about beryllium mobility in deep, weathered soils from the borehole data alone and do not explore it further.
Qualitative ratings of soil erosivity have previously been determined for Tasmania (Kidd et al., 2014, 2015) based on modeled soil loss should substantial vegetation and ground cover be removed; these ratings are strongly tied to hillslope angle within the George River basin (Fig. 6). Additionally, slope and erosion are strongly linked across the Great Dividing Range on the Australian mainland (Codilean et al., 2021). Thus, we compare erosion and denudation metrics against basin slope metrics, which enables us to compare our measurements of ε and Dm to basin slope to assess how Kidd et al.'s (2014, 2015) metrics for hillslope erodibility and erosion in the George River are related and to compare these new 10Bei erosion rates to those presented by Codilean et al. (2021) for the Australian mainland.
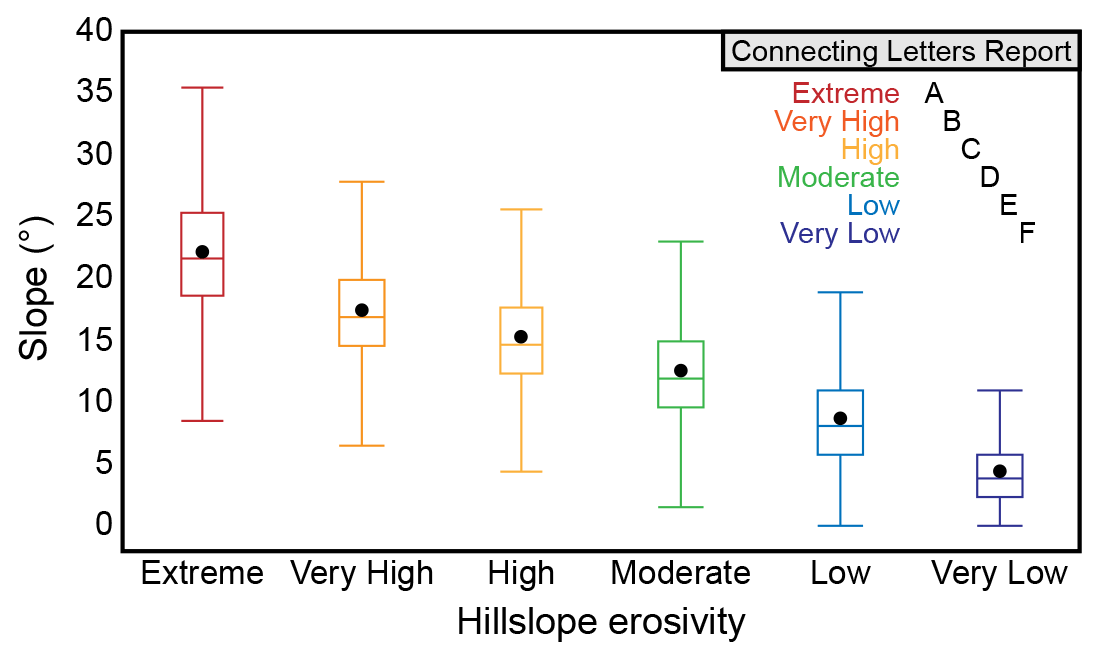
Figure 6Analysis of variance, showing hillslope angles associated with categories of landscape erosivity (Kidd et al., 2014, 2015) at George River. Boxes and whiskers cover ± 1.5× the interquartile range; black dots are the mean slope for the erosivity category. The mean slope for each erosivity category is significantly different from every other category, illustrated by the Connecting Letters Report (if the mean slope in any two erosivity categories were statistically indistinguishable, they would otherwise share a letter in the report). We therefore use hillslope angle as a quantitative proxy for erosivity in the George River basin.
3.3 Calculating the dissolved and suspended loads of George River at St. Helens
There is one long-term water quality and stream gauging station in the George River basin at the inlet to the local water treatment plant drawing water from the trunk channel of the George River in the town of St. Helens (Fig. 2). Thus, we can only estimate the dissolved load for the entire George River basin, not individual tributaries. Chemical weathering rates for the George River at St. Helens were calculated using these water quality data (i.e., dissolved major and trace element data) and discharge data (John Fawcett, TasWater, personal communication, 2021). Discharge measurements were taken at intervals ranging from 4 to 96 times per day from 1968 to 2021; 26 complete years of discharge data were available. Water quality measurements have been conducted since 2015 and we used the data from July 2015 to September 2021 in our derivation of the dissolved load for the George River basin.
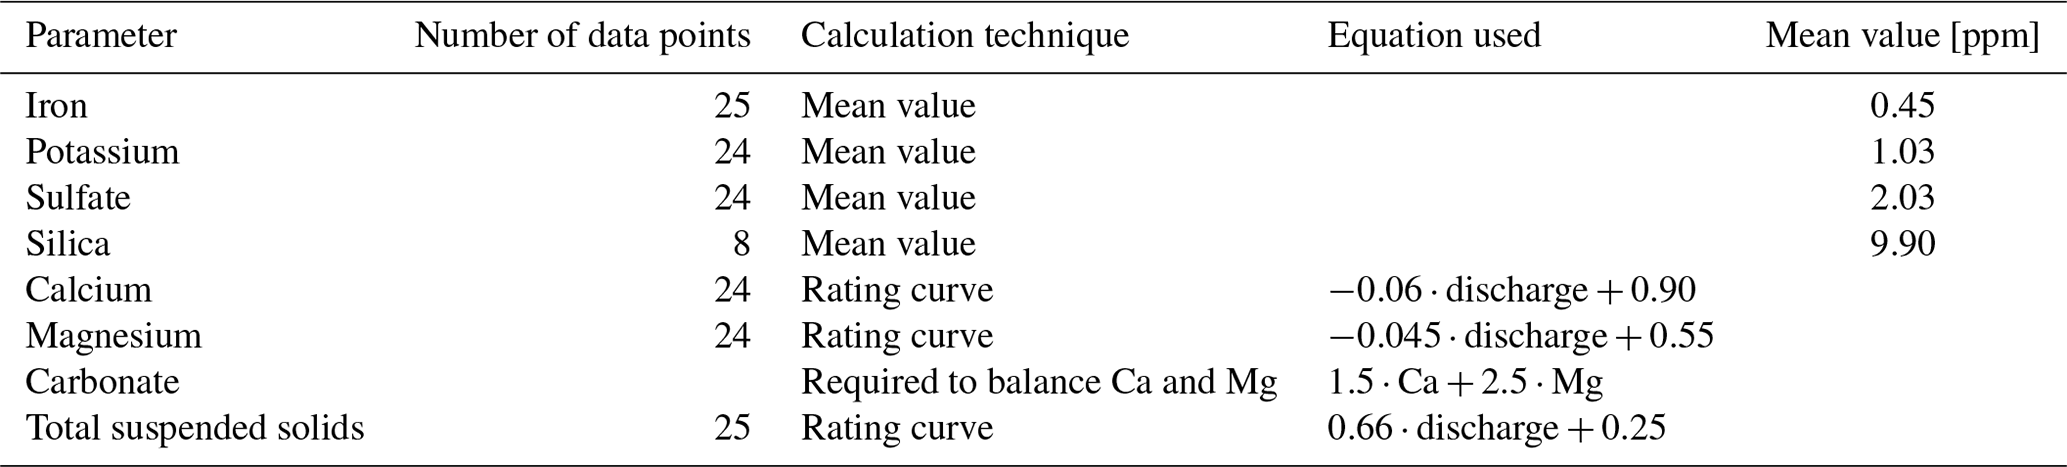
We matched water quality measurements with the nearest discharge measurement in time; when times did not line up exactly, we used the average of the nearest two discharge measurements. We then explored the relationship between discharge and each water quality parameter. For parameters that are invariant with discharge (iron, potassium, sulfate, silica), we calculated the mean concentration of the parameter (Table 6). For parameters that scale with discharge (calcium, magnesium), we used a rating curve to determine how discharge relates to each water quality parameter; we then applied the mean measured values and rating curves, as appropriate, to every discharge measurement for years with complete discharge records (Table 6). Sodium and chlorine were balanced (suggesting a sea salt contribution) and were thus omitted from the calculation. Carbonate that balanced the calcium and magnesium present was included; the rest was assumed to be from atmospheric sources (Table 6). Silica concentrations were measured independently, once annually from 1974 to 1981 (John Fawcett, TasWater, personal communication, 2021), and we used all eight of those measurements; measurements in individual years were taken in March, June, August, October, and November (Table 6). We report total dissolved solids (TDS) measurements that are the sum of potassium, sulfate, silica, calcium, magnesium, and carbonate concentrations following West et al.'s (2005) chemical weathering rate calculation. We used a similar method to calculate the total suspended sediment (TSS) for each year of complete discharge data; TSS scales with discharge and so we applied a rating curve (Table 6).
4.1 10Bei erosion rates, ε
Erosion rates, ε, based on measured concentrations of 10Bei, range from 13.1 to 66.2 . They have integrated landscape dynamics in the George River basin since ∼ 24–122 ka (Table 4). The average ε from tributaries (36.8±1.3 ) is greater than from either of the trunk channel samples (TG-1 ; TG-9 ). Tributary values for ε are greater in the high-elevation, western headwaters of the George River basin and decrease systematically eastwards towards the lower-elevation coast (Fig. 6; R2=0.91, p<0.001). Relationships between ε in tributary catchments and mean local relief, mean basin slope, and the percent of each basin that is categorized as being greater than or equal to “High” erosivity are weak and not significant (R2=0.28, R2=0.17, R2=0.05, respectively, p≥0.13). Taking the product of ε and basin area provides us with the average annual mass loss for each catchment. Making the assumption of steady state and no change in storage over time, we can then compare mass export rates across the catchment. Following this approach, we find that a similar mass exited sampled tributaries (10 511±390 Mg yr−1) as the mass that passes through the trunk channel sites (TG-1 = 10 286 ± 860 Mg yr−1; TG-9 Mg yr−1). This comparison suggests little to no contribution of mass from the lowland, mainstem George River valley below the tributaries and above the basin outlet sampling sites.
4.2 10Bem denudation rates, Dm
Based on an assumed 9Beparent value of 4.1 ppm (Beus, 1962), -based denudation rates, Dm, range from 16.7 to 36.9 . Most values for Dm in tributaries do not replicate well the 10Bei-derived erosion rates, ε, with the exception of TG-4 (Fig. 8). The -based denudation rate at the trunk channel site, TG-9 (23.4±0.3 ), replicates the 10Bei erosion rate (22.4±1.9 ). In general, 10Bem-based measures Dm of tributaries are not significantly related to any topographic or basin metric such as mean basin elevation, mean local relief, or mean basin slope (R2=0.12, R2=0.06, R2=0.11, respectively; p>0.44). 10Bem-based measures Dm of tributaries appear to be moderately related to the percentage of each basin that Kidd et al. (2014, 2015) categorizes with a land use of “High” to “Extreme” erosivity, though we note this relationship is not significant at high-confidence levels (R2=0.42; p=0.18; Fig. 9).
4.3 Dissolved load and suspended sediment fluxes
The annual dissolved load in the George River at St. Helens for the 26 years between 1969 and 2020 is between 1820 and 10 770 Mg yr−1 (mean: 4400±2230 Mg yr−1, 1σ) and the total suspended sediment load ranges from 280 to 10 560 Mg yr−1 (mean: 1830±2180 Mg yr−1, 1σ). The water treatment plant from which the dissolved load data were obtained is close to site TG-9, and data from this site allow us to place 10Be-inferred erosion and denudation rates for the whole George River basin in context. These data show that the dissolved load export rate averages to about 10.3 , which is < 50 % of ε (22.4 ), based on decades of flow records and 5 years of discontinuous water sampling at the same sampling location. The suspended sediment export rate out of the George River basin is lower, at 4.3 .
The multi-methodological approach we employ in this study provides four new datasets, all of which quantify some component of landscape change at different spatial scales: (1) mass loss rates inferred 10Bei at seven tributary and two trunk channel sites, (2) denudation rates from from seven tributary sites and one trunk channel site, (3) suspended sediment export at the mouth of the George River, and (4) the dissolved load of the George River from the water quality and flow data at the mouth of the catchment. Comparing and interpreting these new datasets improves our understanding of the rate of landscape change over time in the George River basin. Given that the only location for which we have data from all four of datasets is at the mouth of the George River in St. Helens, we explore what the different rates presented in this study might mean for landscape change across the whole river basin, recognizing that without more data, we cannot be more specific in our interpretation of ε or Dm at tributary sites beyond the traditional meanings of erosion or denudation, respectively.
5.1 Relationships between ε, elevation-dependent climate conditions and land use
Erosion rates in the George River basin are strongly related to mean basin elevation, which varies greatly across the catchment as the study area extends east from the Rattler Range and Mt. Victoria (1213 m) to the coast at sea level (Fig. 2). In contrast, we find no evidence to suggest that ε is related to slope in the George River over millennial timescales. This result differs from many studies, which show strong correlations between ε and mean basin slope at a global scale (Portenga and Bierman, 2011) and at regional scales across the Great Dividing Range on Australia's mainland (Fig. 10; Codilean et al., 2021; Nichols et al., 2014). Our results also differ from prior assessments of the George River basin using measured climate data, bedrock structure, topographic analysis, water quality models, and geographical landscape characterization that suggest slope imparts a large control over erosion and sediment generation in the catchment on human timescales (Jerie et al., 2003; Kragt and Newham, 2009).
Any process-based explanation for the correlation of erosion rates with elevation requires that we consider how relevant geomorphic and geochemical processes vary across the George River basin. Climatic data collected from stations in and near the George River basin indicate that both mean annual temperature and mean annual precipitation are strongly correlated with elevation (Fig. 3). At higher elevations, rocks are experiencing lower temperatures more frequently and receive more precipitation than those at lower elevations, increasing the potential for both mechanical (frost cracking) and chemical weathering (dissolution). Frost cracking rates are greatest in rocks where mean annual temperature is above freezing (which is the case for all of the George River basin), but temperatures go below freezing both long and frequently enough to crack rocks, which is also the case across much of the basin (Delunel et al., 2010; Hales and Roering, 2007). In the George River basin, the only temperature-related metric that correlates with elevation is mean annual temperature, in contrast to, for example, the time spent below freezing, likely because temperature inversions, with cold air drainage to lower elevation valleys, are common (Webb et al., 2018, 2020). Additionally, the underlying mechanics that lead to rock fracturing in the first place have been demonstrated to be strongly linked to climate and the availability of water (Eppes and Keanini, 2017; Eppes et al., 2018). While water is plentiful across the George River basin, we see that ε is greater at higher elevations where rainfall is also greater, facilitating faster breakdown of rock.
Mean annual precipitation at meteorology stations in the George River basin varies less (2.7-fold) from low to high elevations (681–1836 mm yr−1; Fig. 3) than ε (4.8–24.5 mm kyr−1; a 5.1-fold difference; Table 4). The elevation-induced precipitation and erosion rate gradients we observe are consistent with suggestions made at regional and global scales that the relationship between slope and erosion becomes secondary to precipitation in low-slope, low-elevation, post-tectonic settings (Henck et al., 2011; Mishra et al., 2019). We note that Mishra et al. (2019) also suggest that at the global scale, the erosional effects of increased precipitation may be balanced by increased vegetation cover, which serves to stymie erosion. However, the George River basin is densely vegetated throughout, and forests are no more prevalent at higher than lower elevations in our field area. We propose that in the George River basin, ε is related to elevation in large part because precipitation is strongly correlated with elevation. This interpretation seems to hold true for bedrock outcrops, the erosion rates of which are most closely correlated to mean annual rainfall in aseismic landscapes, globally; however, basin-wide erosion rates in aseismic areas globally remain more strongly correlated to mean basin slope and subsequently to elevation and climate-related processes (Portenga and Bierman, 2011), which stands in contrast to the relationship we observe here between elevation and ε.
The concave-up geometry of sampled streams (Fig. 5) demonstrates that values of ε presented here come from streams that are in steady state. Thus, the very strong relationship between elevation, climate (both mean annual rainfall and temperature), and ε would likely not have emerged had our 10Bei samples been affected by clast attrition (Carretier et al., 2009); deep-seated landslides (Aguilar et al., 2014; Gonzalez et al., 2016; Puchol et al., 2014); or intensive erosion associated with mining, forestry, or agriculture (Barreto et al., 2014; Neilson et al., 2017). Even intensive tin mining, which supplied > 106 m3 to the George River over the last two centuries (Knighton, 1991) seems not to have had a long-lasting diluting effect on 10Bei in sampled stream sediment. It is possible that mining efforts, especially sluice mining, did not lead to 10Bei dilution because of the homogenizing effect of 10Bei in bioturbated soils (Brown et al., 1995; Schaller et al., 2018) or because the size of the George River basin is large enough to buffer the effects of mining efforts in a similar way that large catchments may buffer the effects of landslide material (Niemi et al., 2005; Yanites et al., 2009). It is also possible that mining activity did lead to 10Bei dilution, but concentrations have returned to pre-disturbance levels in the same way that bedload characteristics returned to pre-disturbance levels (Knighton, 1991) and similar to the rapid, two-year recovery of 10Bei concentrations following storm-triggered landslides in Puerto Rico (Grande et al., 2021).
Overall, the close relationship between 10Bei erosion rates and climate across the George River basin demonstrates that 10Bei erosion rates reflect background, geologically meaningful rates of landscape evolution on millennial timescales, even in areas with long histories of intensive human land use (e.g., Barreto et al., 2014; Rosenkranz et al., 2018; Vanacker et al., 2007). Secondarily, that higher values of ε are observed where there is more rainfall and there are colder temperatures suggests that more sediment is being generated per unit area in the western portion of the catchment. There, larger volumes of rainfall and colder temperatures facilitate the generation, erosion, entrainment, and delivery of more sediment to trunk channels than in the eastern portion of the catchment.
Since pre-disturbance stream flow and bedload conditions were re-established by the 1990s (Knighton, 1991), it appears the greatest risk of enhanced sediment flux from the George River to Georges Bay in the future comes from land-use changes involving the widespread disturbance of surficial soils, such as through forestry (Wilson, 1999). The percentage of land used for production forestry in native environments has been decreasing throughout the 21st century (Fig. 4). Although some land previously used for production forestry in native environments is being supplanted by conservation and protected native land cover, which could buffer the effects of widespread erosion, much is being replaced by grazing and agriculture, which would likely increase erosion, particularly in the headwater catchments where geological erosion rates are naturally higher (Fig. 4). Given recent land-use trends, the 10Bei erosion rates presented here provide a useful benchmark level of sediment delivery to the George River, Georges Bay, and other fluvial systems in northeast Tasmania that share topographic and geologic characteristics similar to those of the George River basin.
5.2 Considerations of ε for trunk channel versus tributary sites
Taking the product of ε and basin area calculates the annual mass exported from sampled basins. The mass leaving the tributaries (mean: 10 510±390 Mg yr−1) is about the same as the mass passing through TG-1 (10 290±860 Mg yr−1) and the mass of sediment leaving TG-9 (9560±820 Mg yr−1). We infer from these data that the 10Bei measured at TG-1 and TG-9 trunk channel locations is dominated by mass produced in the higher-elevation tributary basins with minimal sediment input from the George River valley bottoms. Similar interpretations have been made elsewhere, albeit in much larger river basins (i.e., Wittmann et al., 2009, 2011, 2016). Given these similarities, we average ε from the two trunk channel sites to produce a nominal average erosion rate for the George River basin as a whole (24.1±1.4 ; or 8.9±0.5 mm kyr−1 when dividing ε by rock density, ρ=2.7 g cm−3), which is of the same magnitude as the average erosion rate of catchments draining the eastern flanks of the Great Dividing Range along the southeastern passive margin of mainland Australia (11.6 mm kyr−1; Fig. 10; Codilean et al., 2021). Average ε from the George River basin is most consistent with erosion of basins across the Bass Strait, which share similar topographic characteristics and geological histories to the George River basin (Codilean et al., 2021). The similarity between the geology, topography, and climate of newly sampled basins and derived 10Bei erosion rates in Tasmania from this study and those from southeast mainland Australia supports the notion that evolution of landscapes that share similar climatic, topographic, and geologic characteristics is similar.
5.3 Comparing 10Bei-based erosion rates and 10Bem-based denudation rates
Once delivered to Earth's surface in temperate regions, 10Bem concentrates in the uppermost soil horizons (Graly et al., 2010; Willenbring and von Blanckenburg, 2010). This behavior differs from that of 10Bei, the concentration of which remains homogenous in well-mixed, bioturbated soils for millennia (Jungers et al., 2009). Thus, any disturbance of large volumes of topsoil (i.e., agriculture, forestry, wildfire erosion, or mining activities) strips material with the highest concentrations of 10Bem and introduces that material into streams, a process similar to that identified following early land-use changes and deforestation in the Chesapeake Bay and San Francisco Bay (Portenga et al., 2019; Valette-Silver et al., 1986; van Geen et al., 1999). In contrast, the strong relationship between 10Bei erosion rates and elevation, and thus both precipitation and temperature, across the George River basin (Fig. 7) suggests that 10Bei erosion rates, ε, are unaffected by land use.

Figure 7A strong correlation between 10Bei-based erosion rates (ε) and mean basin elevation for the seven tributary samples collected in this study. We do not include trunk-channel sites because erosion rates here also incorporate erosion occurring in tributary catchments.
Assuming a 9Beparent value of 4.1 ppm (Beus, 1962), calculated values of Dm do not consistently replicate ε (Fig. 8), nor does Dm replicate the spatial patterns or yield the same relationships with topographic parameters that we observe with ε in the small, geologically homogeneous landscape of the George River basin (e.g., Fig. 7). In fact, we calculate similar Dm values at TG-2 and TG-7, which have the lowest and highest calculated values for ε (Fig. 8). We know that decades-old historical mining activities and historical bushfires in the George River were restricted to lower catchment areas and tributaries where measurements of Dm are highest (Figs. 4 and 9). Additionally, we infer from the moderate correlation observed between Dm and the percent of tributary basins classified as “High” to “Extreme” erosivity (R2 = 0.42; Fig. 9; Kidd et al., 2014, 2015) that -derived denudation rates appear to be sensitive to recent land-use practices that disturb soils. The highest denudation rates, Dm, we measured are those from basins with past histories of intense surface disruption through mining and forestry (i.e., TG-4, TG-5).
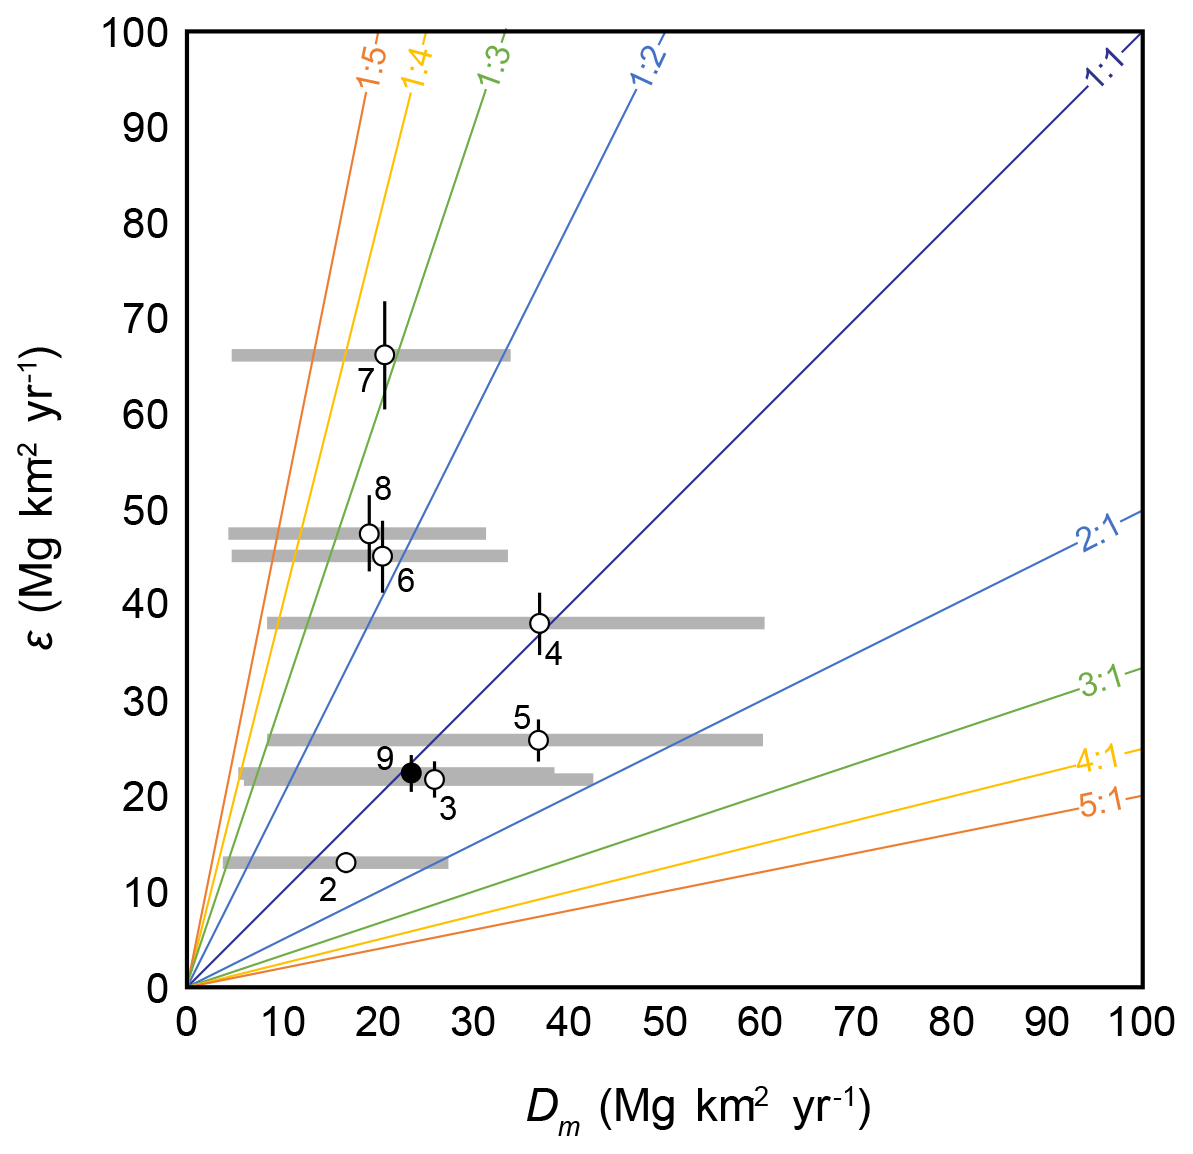
Figure 810Bei-based erosion rates (ε) compared -based denudation rates (Dm) for tributary basins (open circles) and the trunk channel site, TG-9 (closed circle). Measures of ε and Dm are different at each site, but similar within a factor of 3. Dm is calculated using a 9Beparent value of 4.1 ppm, taken from average values of a suite of biotite granites across the former Soviet Union and China (Beus, 1962; also reported in Sainsbury, 1964); horizontal grey bars, however, show the range of Dm values calculated using low estimates of crustal 9Beparent (2.5 ppm; high end of Dm values; von Blanckenburg et al., 2012) and the average measured 9Beparent values of S-type and tin-bearing granites (18 ppm; n=11; low end of Dm values; London and Evanson, 2002).

Figure 9-based denudation rates, Dm (gray squares), from tributary basins measured at George River are related to the percentage of the basin that is classified as “High,” “Very High,” or “Extreme” erosivity (Kidd et al., 2014, 2015), though this relationship is not significant (p = 0.18). The basins with the highest denudation rates are those with histories of intensive mining and/or recent forestry, both of which disturb topsoils.
The similarity of Dm and ε for the entire George River basin, however – within a factor of 3 (Fig. 8) – provides general support for the hypothesis that -based denudation rates more-closely resemble 10Bei-based erosion rates in small river basins where geological heterogeneity is minimized. This observed similarity between Dm and ε supports the continued exploration and application of denudation rates in geomorphological studies (i.e., Dannhaus et al., 2017; Deng et al., 2020; Portenga et al., 2019; Rahaman et al., 2017; Wittmann et al., 2012, 2015). However, data presented here suggest that this method should be used with caution in landscapes with recent soil disturbance.
5.4 Sensitivity analysis of 9Beparent and Fmet
The values of Dm we present in this study are calculated with assumed values for the amount of 9Be naturally occurring in bedrock in the field area (9Beparent) and the rate at which meteoric 10Be is delivered from the atmosphere to Earth's surface () because we did not measure these values specifically for the field area. Thus, we carry out a sensitivity analysis of both variables to assess how much Dm responds to changes in these values.

Figure 10(a) Map of river basins draining east off the Great Australian Escarpment, where 10Bei erosion rate data are available; figure adapted from Codilean et al. (2021). Filled circles are trunk streams and open circles are tributaries. Orange data include previously published data (Codilean et al., 2021; Croke et al., 2015; Fülöp et al., 2020; Godard et al., 2019; Nichols et al., 2014; Tomkins et al., 2007). Blue data are new data presented in this study from the George River basin, Tasmania. The average 10Bei erosion rates from the George River (8.9 mm kyr−1) are consistent with erosion rates from southeast mainland Australia (average 11.6 mm kyr−1; Codilean et al., 2021). (b) Comparison of 10Bei erosion rates from the George River basin (blue circles; tributaries) and the eastern flanks of the Great Australian Escarpment (orange circles) to basin average slope. (c) Comparison of 10Bei erosion rates from the George River basin (blue circles) and the eastern flanks of the Great Australian Escarpment (orange circles) to mean annual precipitation; in this comparison, mean annual precipitation for George River samples comes from the elevation scaling for measured rainfall at meteorological gauging stations (Figs. 2 and 3, Table 1), whereas Codilean et al. (2021) summarize precipitation data for mainland basins from the WorldClim database (Fick and Hijamans, 2017).
Grew (2002) suggests that Earth's crustal average concentration of 9Beparent is 3 ppm, though it is not unheard of for 9Beparent to be < 1 ppm in (ultra)mafic lithologies and that 9Beparent can vary 10-fold within the same igneous complex. Von Blanckenburg et al. (2012), who first present calculations for Dm, cite a slightly lower crustal average for 9Beparent of 2.5 ppm. London and Evensen (2002) present 9Beparent concentrations measured from felsic granites, which range from 1.6–160 ppm; for S-type granites or those that are tin-bearing – the same as the Blue Tier batholith in our field area (Higgins, 1985) – 9Beparent ranges from 2.3–130 ppm (n = 11, mean: 18 ppm). Additionally, Sainsbury (1964) presents data from a tin-bearing biotite granite in Alaska, showing that 9Beparent concentrations range from 2–26 ppm (n = 5, mean: 16.6 ppm). Thus, it seems a reasonable range of values for 9Beparent that might apply to bedrock in this study are as low as crustal averages (2.5 ppm) or as high as tin-bearing biotite granites elsewhere (> 100 ppm). We choose to calculate and analyze Dm from a more modest estimate of 4.1 ppm (Beus, 1962), because single-digit concentrations of Be are most common for felsic igneous intrusions (London and Evensen, 2002). At lower 9Beparent concentrations (2.5 ppm), Dm values across the George River basin increase such that Dm values replicate ε within a factor of two. However, when conservative but higher 9Beparent concentrations are used (18 ppm; the average of values presented for S-type and tin-bearing granites presented by London and Evensen, 2002), Dm values decrease across the field area such that all Dm values are lower than ε by at least a factor of 3 (Fig. 8). The results of this sensitivity analysis highlight the importance of collecting representative bedrock samples throughout a field area to ascertain appropriate measures of 9Beparent when using von Blanckenburg et al.'s (2012) denudation rate method because of the highly sensitive dependency of Dm on 9Beparent.

Figure 11Comparison of denudation rates, Dm, using the von Blanckenburg et al. (2012) method; a bedrock beryllium concentration, 9Beparent, value of 4.1 ppm (Beus, 1962), measured values from stream sand (Table 3); and meteoric 10Be delivery rates, , of 1.68 × 10⁶ to 1.72 × 10⁶ (Reusser et al., 2010; blue, square), 1.9 × 10⁶ to 2.7 × 10⁶ (Graham et al., 2003; turquoise, black X), 1.0 × 10⁶ to 1.5 × 10⁶ (Heikkilä and von Blanckenburg, 2015; orange, triangle), ∼ 7 × 10⁵ (Masarik and Beer, 2009; Willenbring and von Blanckenburg, 2010; purple, star), and 8.5 × 10⁵ to 1.5 × 10⁶ (Graly et al., 2011; white circle with dashed black line).
Values for the rate at which 10Bem is delivered from the atmosphere to Earth's surface () have been measured and modeled in various ways at both local and global scales, each with its own strengths. In the South Pacific region, for instance, Reusser et al. (2010a) directly measured in a dated New Zealand paleosol (1.68 to 1.72 × 10⁶ ) and Graham et al. (2003) report values measured from rainfall across New Zealand, finding a wider range of 10Bem deposition rates (1.7 to 2.9 × 10⁶ ). In the absence of direct measurement, must be estimated or modeled. Heikkilä and von Blanckenburg (2015) integrate through the Holocene while others integrate for total atmospheric thickness, all at a global scale (Masarik and Beer, 2009; Willenbring and von Blanckenburg, 2010), but the resolution of these models is coarse, relative to the small spatial scale of this study, and would be the same for each sampled basin (1.0–1.5 × 10⁶ for Holocene integrated or ∼ 7 × 10⁵ for atmospheric depth-integrated ). Graly et al. (2011), however, present an equation that estimates from a location's mean annual precipitation and latitude, which provides a more specific value for for a given study site. We choose to use modeled from Graly et al.'s (2011) equation because of its ability to provide basin-specific values of , but we present Dm calculations for all basins using other values to assess the sensitivity of Dm to (Fig. 11). In doing so, we find that Dm calculated from Reusser et al.'s (2010a) and Graham et al.'s (2003) values of are consistently higher than using the Graly et al.'s (2011) model, likely owing to precipitation rate differences between northeast Tasmania and New Zealand, thousands of kilometers away. Dm calculated using values integrated through total atmospheric thickness (Masarik and Beer, 2009; Willenbring and von Blanckenburg, 2010) are consistently lower than those calculated using Graly et al.'s (2011) model, but those using values averaged through the Holocene (Heikkilä and von Blanckenburg, 2015) are remarkably consistent with results from the Graly et al. (2011) model. We suggest that the consistency of Dm modeled using the Graly et al. (2011) values and Dm calculated using Heikkilä and von Blanckenburg's (2015) values provides support for our decision to use Graly et al.'s model. Additionally, we suggest our use of Graly et al.'s (2011) estimates of is reasonable because Dm values using Graly et al.'s values plot between Dm values calculated using values from both global climate models (Heikkilä and von Blanckenburg, 2015; Masarik and Beer, 2009; Willenbring and von Blanckenburg, 2010), at least for northeast Tasmania.
5.5 Where does the dissolved load originate in the George River basin?
If chemical weathering occurs primarily in the uppermost meters of the landscape, where most 10Bei is produced, then the erosion rate, ε, we calculate represents total landscape mass loss over time – a combination of physical and chemical mass loss. We could then partition ε along the trunk channel at the mouth of the George River basin (TG-9 = 22.4 ) into mass flux removed in the measured dissolved load (10.3 ) and the remainder, mass flux removed as solid sediment (12.1 ). Of the sediment mass flux, it appears that 4.3 is transported as suspended load (measured from water quality data), and the difference of 7.8 is bedload (i.e., 12.1 minus 4.3 ). Our measure of ε at TG-9 (22.4 ) is similar to the measure of denudation at this site (23.4 ), which, if the assumptions of the method are met, represents total physical and chemical mass loss. Taken at face value, Dm assuming 9Beparent = 4.1 ppm is an accurate measure of total mass loss from the George basin at TG-9. However, given the wide range of Dm possible using other reasonable values for 9Beparent, it is difficult to know how well the two measures of landscape change, ε and Dm, truly compare.
If the majority of chemical weathering occurs below the penetration depth of most cosmic rays (< 2 m), then the chemical denudation and physical mass loss are at least in part and perhaps wholly disconnected. In this case, ε (TG-9 = 22.4 ) would need to be summed with the measured chemical mass flux (10.3 ), and together (30.7 ) they would estimate the total mass loss from the landscape. In this case, the summed total is ∼ 24 % greater than Dm at TG-9. The presence of bedrock outcrops in some of the George River basin channels suggests that regolith thickness is limited in places, and in that case 10Bei measurements incorporate much of the chemical mass loss from the basin. However, the few boreholes that extend to unweathered bedrock (n = 3; Fig. 2; Table 1) clearly indicate that regolith is deeper in some parts of the catchment. With the paucity of available data, we cannot determine how much of the dissolved load is coming from below the penetration depth of cosmic-ray neutrons, but it could be significant.
Thus, despite the fact that ε and Dm at TG-9 are similar (22.4 and 23.4 , respectively), -based denudation rates appear to have little correlation with landscape-scale metrics suggesting that they do not reflect the rate of geomorphic processes controlling mass loss over time. Dm is highest in basins with known histories of intensive land-use disturbance and high erosivity (Figs. 2 and 8), a relationship that exists regardless of what value is used for 9Beparent. In contrast, ε is well-correlated to elevation and thus temperature and precipitation across the George River basin.
The 10Bei-based erosion rates we present in this study are the first measured for any river system for Tasmania. In contrast to erosion across the Great Dividing Range on mainland Australia, where erosion rates and mean basin slope are closely linked, erosion in the George River basin has a strong relationship with mean basin elevation, and thus with mean annual precipitation and temperature, both of which are strongly correlated with elevation. The mean 10Bei erosion rate in the George River basin, 24.1±1.4 , reflects erosion in tributaries to the George River where precipitation is greatest and temperatures are lowest; little sediment is generated in trunk channel valley bottoms. These findings support the notion that precipitation imparts a significant influence on landscape development in low-slope, low-elevation landscapes, which are often located in post-orogenic, passive margin settings. We also suspect that low but positive mean annual temperatures with frequent excursions below zero drive the mechanical breakdown of rock, thereby increasing sediment production in high-elevation basins through frost cracking. Although hillslope erosion associated with mining, agricultural, and forestry land-use practices occurred in the George River basin during the 19th and 20th centuries, 10Bei-based erosion rates in the basin appear to reflect pre-disturbance rates of landscape change. Such rates are useful as part of Tasmania's current efforts to re-establish healthy and sustainable ecological conditions in its many estuarine environments, particularly those in northeast Tasmania where estuary tributaries have similar geological and topographic characteristics to those found in the George River basin. denudation rates generally replicate 10Bei-based erosion within a factor of 3 but show no correlation with landscape-scale metrics. Calculated denudation rates are highly sensitive to the concentration of native beryllium in bedrock (9Beparent) and appear to be affected by intensive topsoil disturbance by mining, forestry, and agricultural land use. Data from the George River basin suggest that denudation rates will be most meaningful in small, lithologically homogeneous basins with limited amounts of topsoil disturbance and where the value of 9Beparent is well constrained by sampling and measurement of local bedrock.
All maps were created by EWP; data within maps (e.g., DEMs, geology) is properly cited. All data used in this study and all data needed to reproduce our findings and the equations used to calculate 10Bei erosion rates and denudation rates are presented in Tables 1–6. Mean annual precipitation and geological borehole data were gathered from online databases supported by the Australian Bureau of Meteorology (Rainfall: http://www.bom.gov.au/climate/data/, last access: November 2021, BoM, 2021; borehole: http://www.bom.gov.au/water/groundwater/explorer/index.shtml, last access: November 2021, BoM, 2015). Mean annual temperature data come from the State of Tasmania Air Temperature Logger Recording Database (©2018 State of Tasmania), accessed through personal communication. Water quality data for the water intake station in St. Helens was provided by TasWater (John Fawcett, personal communication, 2021). Maps throughout this book were created using ArcGIS® software by Esri.
The conceptual analysis of the data presented in this paper comes from LAV's Undergraduate Honors Thesis (2020) at Eastern Michigan University. EWP, PRB, and AHS contributed to post-thesis manuscript revisions, data analysis, and figure drafting. Samples and the 10Bei data presented here were collected and facilitated by PRB and ECL in 2008. 9Be and 10Bem data were first presented in Sophie E. Greene's Master's thesis (2016) at the University of Vermont; Sophie E. Greene declined a request to participate in the writing and publication of this paper. AHS completed chemical weathering calculations. AJH verified the Lawrence Livermore National Laboratory's measurement of beryllium at the Center for Accelerator Mass Spectrometry in 2009.
The contact author has declared that neither they nor their co-authors have any competing interests.
Publisher's note: Copernicus Publications remains neutral with regard to jurisdictional claims in published maps and institutional affiliations.
We acknowledge the Palawa peoples of lutruwita, the traditional custodians of the lands on which this work was completed. This work was performed in part under the auspices of the U.S. Department of Energy by the Lawrence Livermore National Laboratory under contract DE-AC52-07NA27344. This is LLNL-JRNL-825534.
Data collection was supported by the Australian Government's National Environmental Research Program through the Landscapes and Policy Research Hub based at the University of Tasmania.
This paper was edited by Hella Wittmann-Oelze and reviewed by two anonymous referees.
Adams, B. A. and Ehlers, T.: Deciphering topographic signals of glaciation and rock uplift in an active orogen: A case study from the Olympic Mountains, USA, Earth Surf. Proc. Land., 42, 1680–1692, https://doi.org/10.1002/esp.4120, 2017.
Aguilar, G., Carretier, S., Regard, V., Vassallo, R., Riquelme, R., and Martinod, J.: Grain size-dependent 10Be concentrations in alluvial stream sediment of the Huasco Valley, a semi-arid Andes region, Quat. Geochronol., 19, 163–172, https://doi.org/10.1016/j.quageo.2013.01.011, 2014.
Aldahan, A., Haiping, Y., and Possnert, G.: Distribution of beryllium between solution and minerals (biotite and albite) under atmospheric conditions and variable pH, Chem. Geol., 156, 209–229, https://doi.org/10.1016/S0009-2541(98)00186-7, 1999.
Balco, G., Stone, J. O., Lifton, N. A., and Dunai, T. J.: A complete and easily accessible means of calculating surface exposure ages or erosion rates from 10Be and 26Al measurements, Quat. Geochronol., 3, 174–195, https://doi.org/10.1016/j.quageo.2007.12.001, 2008.
Barreto, H. N., Varajão, C. A. C., Braucher, R., Bourlès, D. L., Salgado, A. A. R., and Varajão, A. F. D. C.: The impact of diamond extraction on natural denudation rates in the Diamantina Plateau (Minas Gerais, Brazil), J. S. Am. Earth Sci., 56, 357–364, https://doi.org/10.1016/j.jsames.2014.09.002, 2014.
Barrows, T. T., Stone, J. O., Fifield, L. K., and Cresswell, R. G.: Late Pleistocene Glaciation of the Kosciuszko Massif, Snowy Mountains, Australia, Quaternary Res., 55, 179–189, https://doi.org/10.1006/qres.2001.2216, 2001.
Barrows, T. T., Stone, J. O., Fifield, L. K., and Cresswell, R. G.: The timing of the Last Glacial Maximum in Australia, Quaternary Sci. Rev., 21, 159–173, https://doi.org/10.1016/S0277-3791(01)00109-3, 2002.
Batley, G., Crawford, C., Moore, M., McNeil, J., Reid, J., Koehnken, L., and Ramsay, J.: June 2010 Report of the George River Water Quality Panel, George River Water Quality Panel, 8 pp., ISBN: 978-0-646-53794-8, 2010.
Belmont, P., Pazzaglia, F., and Gosse, J. C.: Cosmogenic 10Be as a tracer for hillslope and channel sediment dynamics in the Clearwater River, western Washington State, Earth Planet. Sc. Lett., 264, 123–135, https://doi.org/10.1016/j.epsl.2007.09.013, 2007.
Beus, A. A.: Beryllium: Evaluation of deposits during prospecting and exploratory work, W. H. Freeman and Co., San Francisco and London, 161 pp., ISBN: 978-0716702184, 1962.
Bierman, P., and Steig, E. J.: Estimating rates of denudation using cosmogenic isotope abundances in sediment, Earth Surf. Proc. Land., 21, 125–139, https://doi.org/10.1002/(SICI)1096-9837(199602)21:2<125::AID-ESP511>3.0.CO;2-8, 1996.
Bleaney, A., Hickey, C. W., Stewart, M., Scammell, M., and Senjen, R.: Preliminary investigations of toxicity in the Georges Bay catchment, Tasmania, Australia, Int. J. Environ. Stud., 72, 1–23, https://doi.org/10.1080/00207233.2014.988550, 2015.
BoM: Australian Groundwater Explorer, Australia Bureau of Meteorology, http://www.bom.gov.au/water/groundwater/explorer/index.shtml (last access: November 2021), 2015.
BoM: Climate Data Online, Australia Bureau of Meteorology [data set], http://www.bom.gov.au/climate/data/, last access: November 2021.
Braucher, R., Brown, E., Bourlès, D., and Colin, F.: In situ produced 10Be measurements at great depths: implications for production rates by fast muons, Earth Planet. Sc. Lett., 211, 251–258, https://doi.org/10.1016/S0012-821X(03)00205-X, 2003.
Brown, E. T., Stallard, R. F., Larsen, M. C., Raisbeck, G. M., and Yiou, F.: Denudation rates determined from the accumulation of in situ-produced 10Be in the Luquillo Experimental Forest, Puerto Rico, Earth Planet. Sc. Lett., 129, 193–202, https://doi.org/10.1016/0012-821X(94)00249-X, 1995.
Brown, L., Pavich, M. J., Hickman, R. E., Klein, J., and Middleton, R.: Erosion of the eastern United States observed with 10Be, Earth Surf. Proc. Land., 13, 441–457, https://doi.org/10.1002/esp.3290130509, 1988.
Carretier, S., Regard, V., and Soual, C.: Theoretical cosmogenic nuclide concentration in river bed load clasts: Does it depend on clast size?, Quat. Geochronol., 4, 108–123, https://doi.org/10.1016/j.quageo.2008.11.004, 2009.
Carretier, S., Tolorza, V., Rodríguez, M., Pepin, E., Aguilar, G., Regard, V., Martinod, J., Riquelme, R., Bonnet, S., and Brichau, S.: Erosion in the Chilean Andes between 27∘ S and 39∘ S: tectonic, climatic and geomorphic control, J. Geol. Soc. London Sp., 399, 401–418, https://doi.org/10.1144/SP399.16, 2015.
Carretier, S., Tolorza, V., Regard, V., Aguilar, G., Bermúdez, M. A., Martinod, J., Guyot, J. L., Hérail, G., and Riquelme, R.: Review of erosion dynamics along the major NS climatic gradient in Chile and perspectives, Geomorphology, 300, 45–68, https://doi.org/10.1016/j.geomorph.2017.10.016, 2018.
Cheetham, M. D. and Martin, J. C.: Hope for the best, plan for the worst: Managing sediment input in the upper catchment whilst preparing for avulsion at the mouth, Proceedings of the River Basin Management Society, 9th Australian Stream Management Conference, Hobart, Tasmania, Australia, 12–15 August, p. 8, 2018.
Codilean, A. T., Munack, H., Cohen, T. J., Saktura, W. M., Gray, A., and Mudd, S. M.: OCTOPUS: an open cosmogenic isotope and luminescence database, Earth Syst. Sci. Data, 10, 2123–2139, https://doi.org/10.5194/essd-10-2123-2018, 2018.
Codilean, A. T., Fülöp, R.-H., Munack, H., Wilcken, K. M., Cohen, T. J., Rood, D. H., Fink, D., Bartley, R., Croke, J., and Fifield, L.: Controls on denudation along the East Australian continental margin, Earth-Sci. Rev., 214, 103543, https://doi.org/10.1016/j.earscirev.2021.103543, 2021.
Colhoun, E. A.: Periglacial landforms and deposits of Tasmania: Periglacial and Permafrost Research in the Southern Hemisphere, S. Afr. J. Sci., 98, 55–63, 2002.
Corbett, L. B., Bierman, P. R., and Rood, D. H.: An approach for optimizing in situ cosmogenic 10Be sample preparation, Quat. Geochronol., 33, 24–34, https://doi.org/10.1016/j.quageo.2016.02.001, 2016.
Cosgrove, R.: Late Pleistocene behavioural variation and time trends: the case from Tasmania, Archaeol. Ocean., 30, 83–104, https://doi.org/10.1002/j.1834-4453.1995.tb00333.x, 1995.
Cosgrove, R., Allen, J., and Marshall, B.: Palaeo-ecology and Pleistocene human occupation in south central Tasmania, Antiquity, 64, 59–78, https://doi.org/10.1017/S0003598X00077309, 1990.
Crawford, C. and White, C.: Establishment of an integrated water quality monitoring framework for Georges Bay, Tasmanian Aquaculture and Fisheries Institute, TAFI Internal Report, 80 pp., 2005.
Croke, J., Bartley, R., Chappell, J., Austin, J. M., Fifield, K., Tims, S. G., Thompson, C. J., and Furuichi, T.: 10Be-derived denudation rates from the Burdekin catchment: The largest contributor of sediment to the Great Barrier Reef, Geomorphology, 241, 122–134, https://doi.org/10.1016/j.geomorph.2015.04.003, 2015.
Crowder, E., Rawlinson, N., Pilia, S., Cornwell, D. G., and Reading, A. M.: Transdimensional ambient noise tomography of Bass Strait, southeast Australia, reveals the sedimentary basin and deep crustal structure beneath a failed continental rift, Geophys. J. Int., 217, 970–987, https://doi.org/10.1093/gji/ggz057, 2019.
Dannhaus, N., Wittmann, H., Krám, P., Christl, M., and von Blanckenburg, F.: Catchment-wide weathering and erosion rates of mafic, ultramafic, and granitic rock from cosmogenic meteoric ratios, Geochim. Cosmochim. Ac., 222, 618–641, https://doi.org/10.1016/j.gca.2017.11.005, 2018.
Delunel, R., van der Beek, P. A., Carcaillet, J., Bourlès, D. L., and Valla, P. G.: Frost-cracking control on catchment denudation rates: Insights from in situ produced 10Be concentrations in stream sediments (Ecrins–Pelvoux massif, French Western Alps), Earth Planet. Sc. Lett., 293, 72–83, https://doi.org/10.1016/j.epsl.2010.02.020, 2010.
Delunel, R., Schlunegger, F., Valla, P. G., Dixon, J., Glotzbach, C., Hippe, K., Kober, F., Molliex, S., Norton, K. P., Salcher, B., Wittmann, H., Akçar, N., and Christl, M.: Late-Pleistocene catchment-wide denudation patterns across the European Alps, Earth-Sci. Rev., 211, 103407, https://doi.org/10.1016/j.earscirev.2020.103407, 2020.
Deng, K., Yang, S., von Blanckenburg, F., and Wittmann, H.: Denudation rate changes along a fast-eroding mountainous river with slate headwaters in Taiwan from 10Be (meteoric) 9Be ratios, J. Geophys. Res.-Earth, 125, e2019JF005251, https://doi.org/10.1029/2019JF005251, 2020.
Dethier, D. P., Ouimet, W., Bierman, P. R., Rood, D. H., and Balco, G.: Basins and bedrock: Spatial variation in 10Be erosion rates and increasing relief in the southern Rocky Mountains, USA, Geology, 42, 167–170, https://doi.org/10.1130/G34922.1, 2014.
DPIPWE: Water Information for George River at St. Helens Water Supply, Site ID 2205, Tasmanian Department of Primary Industries, Parks, Water, and Environment, https://portal.wrt.tas.gov.au/Data/Location/Summary/Location/2205-1/Interval/Latest, last access: November 2021a.
DPIPWE: Water Information for Ransom River at Sweets Hill, Site ID 2217, Tasmanian Department of Primary Industries, Parks, Water, and Environment, https://portal.wrt.tas.gov.au/Data/Location/Summary/Location/2217-1/Interval/Latest, last access: November 2021b.
Eppes, M.-C. and Keanini, R.: Mechanical weathering and rock erosion by climate-dependent subcritical cracking, Rev. Geophys., 55, 470–508, https://doi.org/10.1002/2017RG000557, 2017.
Eppes, M.-C., Hancock, G. S., Chen, X., Arey, J., Dewers, T., Huettenmoser, J., Kiessling, S., Moser, F., Tannu, N., Weiserbs, B., and Whitten, J.: Rates of subcritical cracking and long-term rock erosion, Geology, 46, 951–954, https://doi.org/10.1130/G45256.1, 2018.
Esri: World Topographic Map (no scale given), Esri, http://www.arcgis.com/home/item.html?id=30e5fe3149c34df1ba922e6f5bbf808f (last access: 12 February 2022), 2012.
Etheridge, M. A., Branson, J. C., and Stuart-Smith, P. G.: The Bass, Gippsland and Otway Basins, Southeast Australia: A branched rift system formed by continental extension, in Sedimentary Basins and Basin-Forming Mechanisms – Memoir 12, edited by: Beaumont, C. and Tankard, A. J., Canadian Society of Petroleum Geologists, 147–162, 1987.
Fellin, M. G., Chen, C.-Y., Willett, S. D., Christl, M., and Chen, Y.-G.: Erosion rates across space and timescales from a multi-proxy study of rivers of eastern Taiwan, Global Planet. Change, 157, 174–193, https://doi.org/10.1016/j.gloplacha.2017.07.012, 2017.
Ferrier, K. L., Kirchner, J. W., and Finkel, R. C.: Erosion rates over millennial and decadal timescales at Caspar Creek and Redwood Creek, northern California Coast Ranges, Earth Surf. Proc. Land., 30, 1025–1038, https://doi.org/10.1002/esp.1260, 2005.
Fick, S. E. and Hijmans, R. J.: WorldClim 2: new 1-km spatial resolution climate surfaces for global land areas, Int. J. Climatol., 37, 4302–4315, https://doi.org/10.1002/joc.5086, 2017.
Foster, D. A. and Gray, D. R.: Evolution and Structure of the Lachlan Fold Belt (Orogen) of Eastern Australia, Annu. Rev. Earth Pl. Sc., 28, 47–80, https://doi.org/10.1146/annurev.earth.28.1.47, 2000.
Fülöp, R.-H., Codilean, A. T., Wilcken, K. M., Cohen, T. J., Fink, D., Smith, A. M., Yang, B., Levchenko, V. A., Wacker, L., Marx, S. K., Stromsoe, N., Fujioka, T., and Dunai, T. J.: Million-year lag times in a post-orogenic sediment conveyor, Sci. Adv., 6, eaaz8845, https://doi.org/10.1126/sciadv.aaz8845, 2020.
Gaina, C., Müller, D. R., Royer, J.-Y., Stock, J., Hardebeck, J., and Symonds, P.: The tectonic history of the Tasman Sea: A puzzle with 13 pieces, J. Geophys. Res.-Sol. Ea., 103, 12413–12433, https://doi.org/10.1029/98JB00386, 1998.
Gallant, J., Wilson, N., Dowling, T., Read, A., and Inskeep, C.: SRTM-derived 1 Second Digital Elevation Models Version 1.0. Record 1, Geoscience Australia, 2011.
Gee, R. D. and Groves, D. I.: Structural features and mode of emplacement of part of the blue tier batholith in Northeast Tasmania, J. Geol. Soc. Aust., 18, 41–55, https://doi.org/10.1080/00167617108728742, 1971.
Godard, V., Dosseto, A., Fleury, J., Bellier, O., and Siame, L.: Transient landscape dynamics across the Southeastern Australian Escarpment, Earth Planet. Sc. Lett., 506, 397–406, https://doi.org/10.1016/j.epsl.2018.11.017, 2019.
Gonzalez, V. S., Bierman, P. R., Nichols, K. K., and Rood, D. H.: Long-term erosion rates of Panamanian drainage basins determined using in situ 10Be, Geomorphology, 275, 1–15, https://doi.org/10.1016/j.geomorph.2016.04.025, 2016.
Gosse, J. C. and Phillips, F. M.: Terrestrial in situ cosmogenic nuclides: theory and application, Quaternary Sci. Rev., 20, 1475–1560, https://doi.org/10.1016/S0277-3791(00)00171-2, 2001.
Graham, I., Ditchburn, R., and Barry, B.: Atmospheric deposition of 7Be and 10Be in New Zealand rain (1996–98), Geochim. Cosmochim. Ac., 67, 361–373, https://doi.org/10.1016/S0016-7037(02)01092-X, 2003.
Graly, J. A., Bierman, P. R., Reusser, L. J., and Pavich, M. J.: Meteoric 10Be in soil profiles – A global meta-analysis, Geochim. Cosmochim. Ac., 74, 6814–6829, https://doi.org/10.1016/j.gca.2010.08.036, 2010.
Graly, J. A., Reusser, L. J., and Bierman, P. R.: Short and long-term delivery rates of meteoric 10Be to terrestrial soils, Earth Planet. Sc. Lett., 302, 329–336, https://doi.org/10.1016/j.epsl.2010.12.020, 2011.
Grande, A., Schmidt, A. H., Bierman, P. R., Corbett, L. B., López-Lloreda, C., Willenbring, J., McDowell, W. H., and Caffee, M. W.: Landslides, hurricanes, and sediment sourcing impact basin-scale erosion estimates in Luquillo, Puerto Rico, Earth Planet. Sc. Lett., 562, 116821, https://doi.org/10.1016/j.epsl.2021.116821, 2021.
Granger, D. E., Kirchner, J. W., and Finkel, R.: Spatially averaged long-term erosion rates measured from in situ-produced cosmogenic nuclides in alluvial sediment, J. Geol., 104, 249–257, 1996.
Gray, D. R. and Foster, D. A.: Tectonic evolution of the Lachlan Orogen, southeast Australia: Historical review, data synthesis and modern perspectives, Aust. J. Earth Sci., 51, 773–817, https://doi.org/10.1111/j.1400-0952.2004.01092.x, 2004.
Greene, E. S.: Comparing meteoric 10Be, in situ 10Be, and native 9Be across a diverse set of watersheds, M.S., University of Vermont, Burlington, Vermont, United States, 118 pp., 2016.
Grew, E. S.: Mineralogy, Petrology and Geochemistry of Beryllium: An Introduction and List of Beryllium Minerals, Rev. Mineral. Geochem., 50, 1–76, https://doi.org/10.2138/rmg.2202.50.01, 2002.
Griffiths, J. R.: Continental margin tectonics and the evolution of south-east Australia, APPEA Journal, 11, 75–79, https://doi.org/10.1071/AJ70013, 1971.
Gunn, P. J.: Mesozoic-Cainozoic tectonics and igneous activity: Southeastern Australia, J. Geol. Soc. Aust., 22, 215–221, https://doi.org/10.1080/00167617508728889, 1975.
Hales, T. C. and Roering, J. J.: Climatic controls on frost cracking and implications for the evolution of bedrock landscapes, J. Geophys. Res., 11, F02033, https://doi.org/10.1029/2006JF000616, 2007.
Harel, M.-A., Mudd, S., and Attal, M.: Global analysis of the stream power law parameters based on worldwide 10Be denudation rates, Geomorphology, 268, 184–196, https://doi.org/10.1016/j.geomorph.2016.05.035, 2016.
Harrison, E. J., Willenbring, J. K., and Brocard, G. Y.: Quaternary record of terrestrial environmental change in response to climatic forcing and anthropogenic perturbations, in Puerto Rico, Quaternary Sci. Rev., 253, 106770, https://doi.org/10.1016/j.quascirev.2020.106770, 2021.
Hayes, D. E. and Ringis, J.: Seafloor Spreading in the Tasman Sea, Nature, 243, 454–458, https://doi.org/10.1038/243454a0, 1973.
Heikkilä, U. and von Blanckenburg, F.: The global distribution of Holocene meteoric 10Be fluxes from atmospheric models, Distribution maps for terrestrial Earth's surface applications, GFZ Data Services [data set], https://doi.org/10.5880/GFZ.3.4.2015.001, 2015.
Heisinger, B., Niedermayer, M., Hartmann, F., Korschinek, G., Nolte, E., Morteani, G., Neumaier, S., Petitjean, C., Kubik, P., and Synal, A.: In-situ production of radionuclides at great depths, Nucl. Instrum. Meth. B, 123, 341–346, https://doi.org/10.1016/S0168-583X(96)00702-1, 1997.
Helz, G. R. and Valette-Silver, N.: Beryllium-10 in Chesapeake Bay sediments: An indicator of sediment provenance, Estuar. Coast. Shelf S., 34, 459–469, https://doi.org/10.1016/S0272-7714(05)80117-9, 1992.
Henck, A. C., Huntington, K. W., and Hallet, B.: Spatial controls on erosion in the Three Rivers Region, southwest China, Earth Planet. Sc. Lett., 303, 71–83, https://doi.org/10.1016/j.epsl.2010.12.038, 2011.
Higgins, N. C., Solomon, M., and Varne, R.: The genesis of the Blue Tier Batholith, northeastern Tasmania, Australia, Lithos, 18, 129–149, https://doi.org/10.1016/0024-4937(85)90015-5, 1985.
Huffman, G., Pendergrass, A., and National Center for Atmospheric Research Staff (Eds.): The Climate Data Guide: TRMM: Tropical Rainfall Measuring Mission, last modified 20 March 2021, https://climatedataguide.ucar.edu/climate-data/trmm-tropical-rainfall-measuring-mission, last access: 20 March 2021.
Jerie, K., Houshold, I., and Peters, D.: Tasmania's river geomorphology: stream character and regional analysis, Vol. 1, Nature Conservation Branch, Tasmanian Department of Primary Industries, Parks, Water, and Environment, Nature Conservation Branch, DPIWE, Nature Conservation Report 03/5, 77 pp., 2003.
Jones, P. J., Williamson, G. J., Bowman, D. M. J. S., and Lefroy, E. C.: Mapping Tasmania's cultural landscapes: Using habitat suitability modelling of archaeological sites as a landscape history tool, J. Biogeogr., 46, 2570–2582, https://doi.org/10.1111/jbi.13684, 2019.
Jungers, M. C., Bierman, P. R., Matmon, A., Nichols, K., Larsen, J., and Finkel, R.: Tracing hillslope sediment production and transport with in situ and meteoric 10Be, J. Geophys. Res., 114, F04020, https://doi.org/10.1029/2008JF001086, 2009.
Kidd, D., Malone, B., McBratney, A., Minasny, B., Odgers, N., Webb, M., and Searle, R.: A new digital soil resource for Tasmania, Australia, Proceedings 20th World Congress of Soil Science, Jeju, South Korea, 08–13 June, 612–613, 2014.
Kidd, D., Webb, M., Malone, B., Minasny, B., and McBratney, A.: Eighty-metre resolution 3D soil attribute maps for Tasmania, Australia, Soil Res., 53, 932–955, https://doi.org/10.1071/SR14268, 2015.
Knighton, A.: Channel bed adjustment along mine-affected rivers of northeast Tasmania, Geomorphology, 4, 205–219, https://doi.org/10.1016/0169-555X(91)90004-T, 1991.
Koehnken, L.: North-east rivers environmental review: A review of Tasmanian environmental quality data to 2001, Supervising Scientist Report 168, Australian Government Department of Agriculture, Water and the Environment, 64 pp., 2001.
Kohl, C. P. and Nishiizumi, K.: Chemical isolation of quartz for measurement of in-situ -produced cosmogenic nuclides, Geochim. Cosmochim. Ac., 56, 3583–3587, https://doi.org/10.1016/0016-7037(92)90401-4, 1992.
Kottek, M., Grieser, J., Beck, C., Rudolf, B., and Rubel, F.: World map of the Köppen-Geiger climate classification updated, Meteorol. Z., 15, 259–263, https://doi.org/10.1127/0941-2948/2006/0130, 2006.
Kragt, M. E. and Newham, L. T.: Developing a water-quality model for the George catchment, Tasmania, Landscape Logic, 38 pp., 2009.
Lal, D.: Cosmic ray labeling of erosion surfaces: in situ nuclide production rates and erosion models, Earth Planet. Sc. Lett., 104, 424–439, https://doi.org/10.1016/0012-821X(91)90220-C, 1991.
Land-Tasmania: Fire History [of Tasmania], Tasmania Department of Primary Industries, Water and Environment, https://www.thelist.tas.gov.au/app/content/data/geo-meta-data-record?detailRecordUID=b94d4388-995d-416a-9844-a39de2798bed (last access: November 2021), 2020.
Lanyon, R., Varne, R., and Crawford, A. J.: Tasmanian Tertiary basalts, the Balleny plume, and opening of the Tasman Sea (southwest Pacific Ocean), Geology, 21, 555–558, https://doi.org/10.1130/0091-7613(1993)021<0555:TTBTBP>2.3.CO;2, 1993.
London, D. and Evensen, J. M.: Beryllium in silicic magmas and the origin of beryl-bearing pegmatites, Rev. Mineral. Geochem., 50, 445–486, https://doi.org/10.2138/rmg.2002.50.11, 2002.
Mackintosh, A. N., Barrows, T. T., Colhoun, E. A., and Fifield, L. K.: Exposure dating and glacial reconstruction at Mt. Field, Tasmania, Australia, identifies MIS 3 and MIS 2 glacial advances and climatic variability, J. Quaternary Sci., 21, 363–376, https://doi.org/10.1002/jqs.989, 2006.
Martin, J. and Cheetham, M.: Final Report: Lower George River Investigation, Lower George Riverworks Trust, 41 pp., 2018.
Masarik, J. and Beer, J.: An updated simulation of particle fluxes and cosmogenic nuclide production in the Earth's atmosphere, J. Geophys. Res.-Atmos., 114, D11103, https://doi.org/10.1029/2008JD010557, 2009.
Matmon, A., Bierman, P., and Enzel, Y.: Pattern and tempo of great escarpment erosion, Geology, 30, 1135–1138, https://doi.org/10.1130/0091-7613(2002)030<1135:PATOGE>2.0.CO;2, 2002.
McCarthy, T. S. and Groves, D. I.: The Blue Tier Batholith, Northeastern Tasmania, Contrib. Mineral. Petr., 71, 193–209, https://doi.org/10.1007/BF00375436, 1979.
McDougall, I. and van der Lingen, G. J.: Age of the rhyolites of the Lord Howe Rise and the evolution of the southwest Pacific Ocean, Earth Planet. Sc. Lett., 21, 117–126, https://doi.org/10.1016/0012-821X(74)90044-2, 1974.
McIntosh, P. D., Price, D. M., Eberhard, R., and Slee, A. J.: Late Quaternary erosion events in lowland and mid-altitude Tasmania in relation to climate change and first human arrival, Quaternary Sci. Rev., 28, 850–872, https://doi.org/10.1016/j.quascirev.2008.12.003, 2009.
McKenny, C. and Shepherd, C.: Ecological flow requirements for the George River, Report Series WRA 99/14, Department of Primary Industries, Water and Environment, Tasmania, 31 pp., 1999.
Mishra, A. K., Placzek, C., and Jones, R.: Coupled influence of precipitation and vegetation on millennial-scale erosion rates derived from 10Be, Plos One, 14, e0211325, https://doi.org/10.1371/journal.pone.0211325, 2019.
Mitchell, I. M., Crawford, C. M., and Rushton, M. J.: Flat oyster (Ostrea angasi) growth and survival rates at Georges Bay, Tasmania (Australia), Aquaculture, 191, 309–321, https://doi.org/10.1016/S0044-8486(00)00441-5, 2000.
Monaghan, M. C., Krishnaswami, S., and Turekian, K. K.: The global-average production rate of 10Be, Earth Planet. Sc. Lett., 76, 279–287, https://doi.org/10.1016/S0168-583X(00)00124-5, 1986.
Mortimer, N., Campbell, H. J., Tulloch, A. J., King, P. R., Stagpoole, V. M., Wood, R. A., Rattenbury, M. S., Sutherland, R., Adams, C. J., Collot, J., and Seton, M.: Zealandia: Earth's hidden continent, GSA Today, 27, 27–35, https://doi.org/10.1130/GSATG321A.1, 2017.
Mount, R., Crawford, C., Veal, C., and White, C.: Bringing back the bay: marine habitats and water quality in Georges Bay, Break O'Day Council, 100 pp., 2005.
Neilson, T. B., Schmidt, A. H., Bierman, P. R., Rood, D. H., and Sosa Gonzalez, V.: Efficacy of in situ and meteoric 10Be mixing in fluvial sediment collected from small catchments in China, Chem. Geol., 471, 119–130, https://doi.org/10.1016/j.chemgeo.2017.09.024, 2017.
Nichols, K. K., Bierman, P. R., and Rood, D. H.: 10Be constrains the sediment sources and sediment yields to the Great Barrier Reef from the tropical Barron River catchment, Queensland, Australia, Geomorphology, 224, 102–110, https://doi.org/10.1016/j.geomorph.2014.07.019, 2014.
Niemi, N. A., Oskin, M., Burbank, D. W., Heimsath, A. M., and Gabet, E. J.: Effects of bedrock landslides on cosmogenically determined erosion rates, Earth Planet. Sc. Lett., 237, 480–498, https://doi.org/10.1016/j.epsl.2005.07.009, 2005.
Nishiizumi, K., Imamura, M., Caffee, M. W., Southon, J. R., Finkel, R. C., and McAninch, J.: Absolute calibration of 10Be AMS standards, Nucl. Instrum. Meth. B, 258, 403–413, https://doi.org/10.1016/j.nimb.2007.01.297, 2007.
Persano, C., Stuart, F. M., Bishop, P., and Barfod, D. N.: Apatite (U–Th)/He age constraints on the development of the Great Escarpment on the southeastern Australian passive margin, Earth Planet. Sc. Lett., 200, 79–90, https://doi.org/10.1016/S0012-821X(02)00614-3, 2002.
Portenga, E. W. and Bierman, P. R.: Understanding Earth's eroding surface with 10Be, GSA Today, 21, 4–10, https://doi.org/10.1130/G111A.1, 2011.
Portenga, E. W., Bierman, P. R., Duncan, C., Corbett, L. B., Kehrwald, N. M., and Rood, D. H.: Erosion rates of the Bhutanese Himalaya determined using in situ-produced 10Be, Geomorphology, 233, 112–126, https://doi.org/10.1016/j.geomorph.2014.09.027, 2015.
Portenga, E. W., Bishop, P., Rood, D. H., and Bierman, P. R.: Combining bulk sediment OSL and meteoric 10Be fingerprinting techniques to identify gully initiation sites and erosion depths, J. Geophys. Res.-Earth, 122, 513–527, https://doi.org/10.1002/2016JF004052, 2017.
Portenga, E. W., Bierman, P. R., Trodick Jr., C. D., Greene, S. E., DeJong, B. D., Rood, D. H., and Pavich, M. J.: Erosion rates and sediment flux within the Potomac River basin quantified over millennial timescales using beryllium isotopes, Geol. Soc. Am. Bull., 131, 1295–1311, https://doi.org/10.1130/B31840.1, 2019.
Preston, K.: Anchor tin mine, Tasmania: A century of struggle for profitability, Journal of Australasian Mining History, 10, 140–159, 2012.
Puchol, N., Lavé, J., Lupker, M., Blard, P.-H., Gallo, F., and France-Lanord, C.: Grain-size dependent concentration of cosmogenic 10Be and erosion dynamics in a landslide-dominated Himalayan watershed, Geomorphology, 224, 55–68, https://doi.org/10.1016/j.geomorph.2014.06.019, 2014.
Rahaman, W., Wittmann, H., and von Blanckenburg, F.: Denudation rates and the degree of chemical weathering in the Ganga River basin from ratios of meteoric cosmogenic 10Be to stable 9Be, Earth Planet. Sc. Lett., 469, 156–169, https://doi.org/10.1016/j.epsl.2017.04.001, 2017.
Reusser, L., Graly, J., Bierman, P., and Rood, D.: Calibrating a long-term meteoric 10Be accumulation rate in soil, Geophys. Res. Lett., 37, L19403, https://doi.org/10.1029/2010GL044751, 2010.
Reusser, L. J. and Bierman, P. R.: Using meteoric 10Be to track fluvial sand through the Waipaoa River basin, New Zealand, Geology, 38, 47–50, https://doi.org/10.1130/G30395.1, 2010.
Rosenkranz, R., Schildgen, T., Wittmann, H., and Spiegel, C.: Coupling erosion and topographic development in the rainiest place on Earth: Reconstructing the Shillong Plateau uplift history with in-situ cosmogenic 10Be, Earth Planet. Sc. Lett., 483, 39–51, https://doi.org/10.1016/j.epsl.2017.11.047, 2018.
Sainsbury, C. L.: Association of beryllium with tin deposits rich in fluorite, Econ. Geol., 59, 920–929, https://doi.org/10.2113/gsecongeo.59.5.920, 1964.
Schaller, M., Ehlers, T., Lang, K. A., Schmid, M., and Fuentes-Espoz, J.: Addressing the contribution of climate and vegetation cover on hillslope denudation, Chilean Coastal Cordillera (26∘–38∘ S), Earth Planet. Sc. Lett., 489, 111–122, https://doi.org/10.1016/j.epsl.2018.02.026, 2018.
Scherler, D., Bookhagen, B., and Strecker, M. R.: Tectonic control on 10Be-derived erosion rates in the Garhwal Himalaya, India, J. Geophys. Res.-Earth, 119, 83–105, https://doi.org/10.1002/2013JF002955, 2014.
Schmidt, A. H., Neilson, T. B., Bierman, P. R., Rood, D. H., Ouimet, W. B., and Sosa Gonzalez, V.: Influence of topography and human activity on apparent in situ 10Be-derived erosion rates in Yunnan, SW China, Earth Surf. Dynam., 4, 819–830, https://doi.org/10.5194/esurf-4-819-2016, 2016.
Schmidt, A. H., Gonzalez, V. S., Bierman, P. R., Neilson, T. B., and Rood, D. H.: Agricultural land use doubled sediment loads in western China's rivers, Anthropocene, 21, 95–106, https://doi.org/10.1016/j.ancene.2017.10.002, 2018.
Seymour, D. B., Green, G. R., and Calver, C. R.: The Geology and Mineral Deposits of Tasmania: A Summary, Tasmanian Geological Survey Bulletin 72, Mineral Resources Tasmania, Department of Infrastructure, Energy and Resources, 32 pp., ISBN: 0 7246 4017 7, 2006.
Siame, L., Angelier, J., Chen, R.-F., Godard, V., Derrieux, F., Bourlès, D., Braucher, R., Chang, K.-J., Chu, H.-T., and Lee, J.-C.: Erosion rates in an active orogen (NE-Taiwan): A confrontation of cosmogenic measurements with river suspended loads, Quat. Geochronol., 6, 246–260, https://doi.org/10.1016/j.quageo.2010.11.003, 2011.
Singleton, A. A., Schmidt, A. H., Bierman, P. R., Rood, D. H., Neilson, T. B., Greene, E. S., Bower, J. A., Perdrial, N.: Effects of grain size, mineralogy, and acid-extractable grain coatings on the distribution of the fallout radionuclides 7Be, 10Be, 137Cs, and 210Pb in river sediment, Geochim. Cosmochim. Ac., 197, 71–86, https://doi.org/10.1016/j.gca.2016.10.007, 2016.
Starke, J., Ehlers, T., and Schaller, M.: Tectonic and climatic controls on the spatial distribution of denudation rates in Northern Chile (18∘ S to 23∘ S) determined from cosmogenic nuclides, J. Geophys. Res.-Earth, 122, 1949–1971, https://doi.org/10.1002/2016JF004153, 2017.
Starke, J., Ehlers, T., and Schaller, M.: Latitudinal effect of vegetation on erosion rates identified along western South America, Science, 367, 1358–1361, https://doi.org/10.1126/science.aaz0840, 2020.
Stone, J.: A rapid fusion method for separation of Beryllium-10 from soils and silicates, Geochim. Cosmochim. Ac., 62, 555–561, https://doi.org/10.1016/S0016-7037(97)00340-2, 1998.
Stone, J.: Air pressure and cosmogenic isotope production, J. Geophys. Res., 105, 23753–23759, https://doi.org/10.1029/2000JB900181, 2000.
Sutherland, R., King, P., and Wood, R.: Tectonic evolution of Cretaceous rift basins in south-eastern Australia and New Zealand: Implications for exploration risk assessment, Proceedings of the Petroleum Exploration Society of Australia, Eastern Australasian Basins Symposium, Melbourne, Victoria, Australia, 25–28 November, 3–13, 2001.
Tomkins, K. M., Humphreys, G. S., Wilkinson, M. T., Fink, D., Hesse, P. P., Doerr, S. H., Shakesby, R. A., Wallbrink, P. J., and Blake, W. H.: Contemporary versus long-term denudation along a passive plate margin: the role of extreme events, Earth Surf. Proc. Land., 32, 1013–1031, https://doi.org/10.1002/esp.1460, 2007.
Valette-Silver, J. N., Brown, L., Pavich, M., Klein, J., and Middleton, R.: Detection of erosion events using 10Be profiles: example of the impact of agriculture on soil erosion in the Chesapeake Bay area (U.S.A.), Earth Planet. Sc. Lett., 80, 82–90, https://doi.org/10.1016/0012-821X(86)90021-X, 1986.
van Dongen, R., Scherler, D., Wittmann, H., and von Blanckenburg, F.: Cosmogenic 10Be in river sediment: where grain size matters and why, Earth Surf. Dynam., 7, 393–410, https://doi.org/10.5194/esurf-7-393-2019, 2019.
van Geen, A., Valette-Silver, N. J., Luoma, S. N., Fuller, C. C., Baskaran, M., Tera, F., and Klein, J.: Constraints on the sedimentation history of San Francisco Bay from 14C and 10Be, Mar. Chem., 64, 29–38, https://doi.org/10.1016/S0304-4203(98)00082-6, 1999.
Vanacker, V., von Blanckenburg, F., Govers, G., Molina, A., Poesen, J., Deckers, J., and Kubik, P.: Restoring dense vegetation can slow mountain erosion to near natural benchmark levels, Geology, 35, 303–306, https://doi.org/10.1130/G23109A.1, 2007.
von Blanckenburg, F., Bouchez, J., and Wittmann, H.: Earth surface erosion and weathering from the 10Be(meteoric) 9Be ratio, Earth Planet. Sc. Lett., 351–352, 295–305, https://doi.org/10.1016/j.epsl.2012.07.022, 2012.
Webb, M., Pirie, A., Kidd, D., and Minasny, B.: Spatial analysis of frost risk to determine viticulture suitability in Tasmania, Australia, Aust. J. Grape Wine R., 24, 219–233, https://doi.org/10.1111/ajgw.12314, 2018.
Webb, M. A., Kidd, D., and Minasny, B.: Near real-time mapping of air temperature at high spatiotemporal resolutions in Tasmania, Australia, Theor. Appl. Climatol., 141, 1181–1201, https://doi.org/10.1007/s00704-020-03259-4, 2020.
Weissel, J. K. and Hayes, D. E.: Evolution of the Tasman Sea reappraised, Earth Planet. Sc. Lett., 36, 77–84, https://doi.org/10.1016/0012-821X(77)90189-3, 1977.
West, A. J., Galy, A., and Bickle, M.: Tectonic and climatic controls on silicate weathering, Earth Planet. Sc. Lett., 235, 211–228, https://doi.org/10.1016/j.epsl.2005.03.020, 2005.
Wilford, J., Searle, R., Thomas, M., Pagendam, D. E., and Grundy, M.: A regolith depth map of the Australian continent, Geoderma, 266, 1–13, https://doi.org/10.1016/j.geoderma.2015.11.033, 2016.
Willenbring, J. K. and von Blanckenburg, F.: Meteoric cosmogenic Beryllium-10 adsorbed to river sediment and soil: Applications for Earth-surface dynamics, Earth-Sci. Rev., 98, 105–122, https://doi.org/10.1016/j.earscirev.2009.10.008, 2010.
Wilson, C. J.: Effects of logging and fire on runoff and erosion on highly erodible granitic soils in Tasmania, Water Resour. Res., 35, 3531–3546, https://doi.org/10.1029/1999WR900181, 1999.
Wittmann, H., von Blanckenburg, F., Guyot, J. L., Maurice, L., and Kubik, P. W.: From source to sink: Preserving the cosmogenic 10Be-derived denudation rate signal of the Bolivian Andes in sediment of the Beni and Mamoré foreland basins, Earth Planet. Sc. Lett., 288, 463–474, https://doi.org/10.1016/j.epsl.2009.10.008, 2009.
Wittmann, H., von Blanckenburg, F., Guyot, J.-L., Maurice, L., and Kubik, P.: Quantifying sediment discharge from the Bolivian Andes into the Beni foreland basin from cosmogenic 10Be-derived denudation rates, Rev. Bras. Geociências, 41, 629–641, https://doi.org/10.25249/0375-7536.2011414629641, 2011.
Wittmann, H., von Blanckenburg, F., Bouchez, J., Dannhaus, N., Naumann, R., Christl, M., and Gaillardet, J.: The dependence of meteoric 10Be concentrations on particle size in Amazon River bed sediment and the extraction of reactive ratios, Chem. Geol., 318–319, 126–138, https://doi.org/10.1016/j.chemgeo.2012.04.031, 2012.
Wittmann, H., von Blanckenburg, F., Dannhaus, N., Bouchez, J., Gaillardet, J., Guyot, J. L., Maurice, L., Roig, H., Filizola, N., and Christl, M.: A test of the cosmogenic 10Be(meteoric)/9Be proxy for simultaneously determining basin-wide erosion rates, denudation rates, and the degree of weathering in the Amazon basin, J. Geophys. Res.-Earth, 120, 2498–2528, https://doi.org/10.1002/2015JF003581, 2015.
Wittmann, H., Malusà, M. G., Resentini, A., Garzanti, E., and Niedermann, S.: The cosmogenic record of mountain erosion transmitted across a foreland basin: Source-to-sink analysis of in situ 10Be, 26Al and 21Ne in sediment of the Po river catchment, Earth Planet. Sc. Lett., 452, 258–271, https://doi.org/10.1016/j.epsl.2016.07.017, 2016.
Wittmann, H., Oelze, M., Gaillardet, J., Garzanti, E., and von Blanckenburg, F.: A global rate of denudation from cosmogenic nuclides in the Earth's largest rivers, Earth-Sci. Rev., 204, 103147, https://doi.org/10.1016/j.earscirev.2020.103147, 2020.
Yanites, B. J., Tucker, G. E., and Anderson, R. S.: Numerical and analytical models of cosmogenic radionuclide dynamics in landslide-dominated drainage basins, J. Geophys. Res.-Earth, 114, F1, https://doi.org/10.1029/2008JF001088, 2009.
You, C. F., Lee, T., and Li, Y. H.: The partition of Be between soil and water, Chem. Geol., 77, 105–118, https://doi.org/10.1016/0009-2541(89)90136-8, 1989.