the Creative Commons Attribution 4.0 License.
the Creative Commons Attribution 4.0 License.
 | 21 Apr 2022
Calcite U–Pb dating of altered ancient oceanic crust in the North Pamir, Central Asia
Edward R. Sobel
Jonas Kley
Jie Chen
Jian-Xin Zhao
Yuexing Feng
Daryl L. Howard
The North Pamir, part of the western syntax of the India–Asia collision zone, preserves remnants of a poorly understood Paleozoic intra-oceanic subduction zone. To constrain the age of this ancient ocean floor, we analyzed calcite phases in vesicular basalt and basaltic volcanic breccia with U–Pb geochronology using laser ablation inductively coupled plasma mass spectrometry (LA-ICP-MS). Dating of radial fibrous to equant spary calcite yielded three meaningful Visean–Serpukhovian ages. Rare-earth elements and yttrium (REE + Y) data reveal that the basaltic host rock of the calcite and oxidizing seawater are major sources of trace elements during calcite precipitation. U–Pb ages seem to be independent of REE + Y concentrations. Our results demonstrate the potential of calcite dating to constrain the age of ancient ocean floors. We challenge the hypothesis that a continuous early Paleozoic Kunlun Terrane extended from northern Tibet into the North Pamir.
- Article
(27328 KB) - Full-text XML
-
Supplement
(760 KB) - BibTeX
- EndNote


Constraining the timing of formation of ocean floor basalts is significant to develop models of various tectonic processes given the voluminous occurrence of ocean floor basalts in ophiolites, sections of ocean plate stratigraphy and exhumed subduction complexes, and remnants of island arcs and oceanic plateaus in ancient convergent margins. However, mafic volcanic rocks, in which zircons are sparse, are challenging to date with radiometric methods. dating of separated phenocrysts or groundmass is frequently attempted (e.g., Waagstein et al., 2002; Heath et al., 2018). However, ocean floor alteration (OFA) often disturbs K–Ar isotopic compositions by secondary potassium gain (Staudigel et al., 2013) or loss (Pringle, 1993), making dating more successful in providing high-precision age data for fresh volcanic rocks but problematic if samples were affected by OFA.
Calcite veins and calcite-filled amygdules are commonly observed in submarine volcanic rocks. Studies show that calcite formation occurs during OFA by alkalinity-generating reactions shortly after the eruption of lavas (e.g., Coogan and Gillis, 2018; Spivack and Staudigel, 1994; Coogan et al., 2016), driven by the infiltrating seawater and heat extraction from the oceanic crust. Such processes dominantly occur within ∼ 25 Myr after rock consolidation (Coogan and Gillis, 2018). Therefore, dating the calcite phases in ocean floor volcanic rocks has the potential to constrain the timing of rock formation.
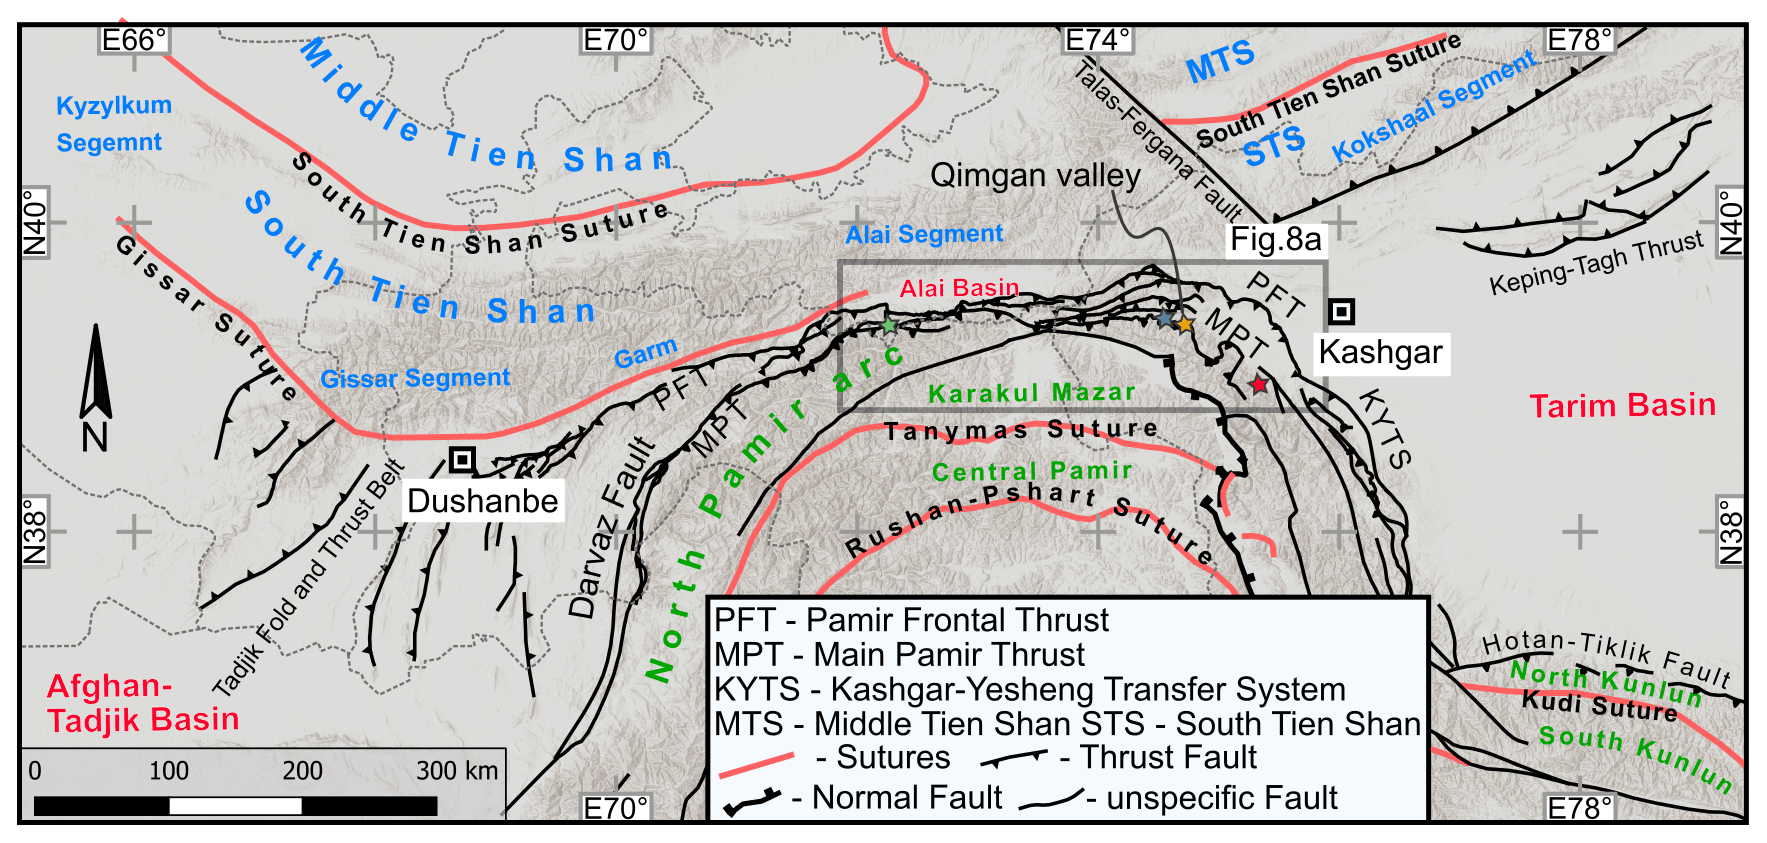
Figure 1Overview map of the North Pamir and surroundings. The yellow star marks the position of the Qimgan valley, as noted. The meanings of the other star symbols are explained in Fig. 8. Map drawn after Konopelko et al. (2019), Li et al. (2020), and Henan Institute of Geological Survey (2014).
Calcite laser ablation inductively coupled plasma mass spectrometry (LA-ICP-MS) U–Pb dating has been applied to a range of geological problems such as dating of deformation (e.g., Nuriel et al., 2019), diagenesis, and sedimentation (e.g., Godeau et al., 2018), especially since several international reference materials were established (Roberts et al., 2017; Rasbury et al., 2021). We present calcite LA-ICP-MS U–Pb dating of Paleozoic oceanic crust from Central Asia. Several types of calcite were dated from a volcanic sequence in the Carboniferous North Pamir arc (Fig. 1, e.g., Bazhenov and Burtman, 1982). Calcite U–Pb ages are consistent with regional geological data and existing radiometric ages from correlative volcanic units. With additional petrographic and geochemical data, our work sheds light on the potential of calcite U–Pb dating on ancient ocean floor volcanics and allows us to test tectonic models of the Pamir.
The North Pamir magmatic arc formed during subduction of the Paleo-Tethys oceanic lithosphere (e.g., Bazhenov and Burtman, 1982). The arc can be traced from the Chinese NE Pamir along strike into the Darvaz mountain range in the Gorno-Badakhshan province of Tajikistan and further south into the Badakhshan province of Afghanistan (Fig. 1). Outcrops in the Chinese Oytag and Gez valleys have been correlated with the South Kunlun Terrane in the northern Tibetan West Kunlun by connecting ophiolitic sequences along the proposed Oytag–Kudi suture (e.g., Mattern et al., 1996). However, existing age dating reveals dissimilarities of key rock units in this suture in the West Kunlun compared to the North Pamir. The West Kunlun Kudi suture closed in the Silurian, as interpreted from zircon and monazite LA-ICP-MS U–Pb dating of amphibolite-facies rock (Zhang et al., 2018). In contrast, the North Pamir magmatic arc, to which the mafic volcanic rocks and associated plagiogranites in the Oytag and Gez valleys are assigned, seems to be much younger. It consists of poorly dated mafic and intermediate volcanics, associated volcaniclastic rocks, and subordinate cherts. A series of leucogranites and granodiorites that intruded the arc between 360 and 314 Ma has been dated recently (Jiang et al., 2008; Kang et al., 2015; Rembe et al., 2021; Zhang et al., 2006). The Oytag suture itself is represented by a small outcrop of altered ultramafic rocks in the Gez valley (Jiang, 1992). To date, no age data have been presented for those rocks. The green color of the North Pamir arc volcanic rocks implies thorough spilitization, making them unsuitable for dating. We propose that abundant calcite associated with spilitic basalts are a product of OFA, and that calcite ages can serve as a constraint on the formation of ocean floor. Specifically, they provide the possibility of directly dating OFA as a proxy for the emplacement age of mafic volcanic rocks.
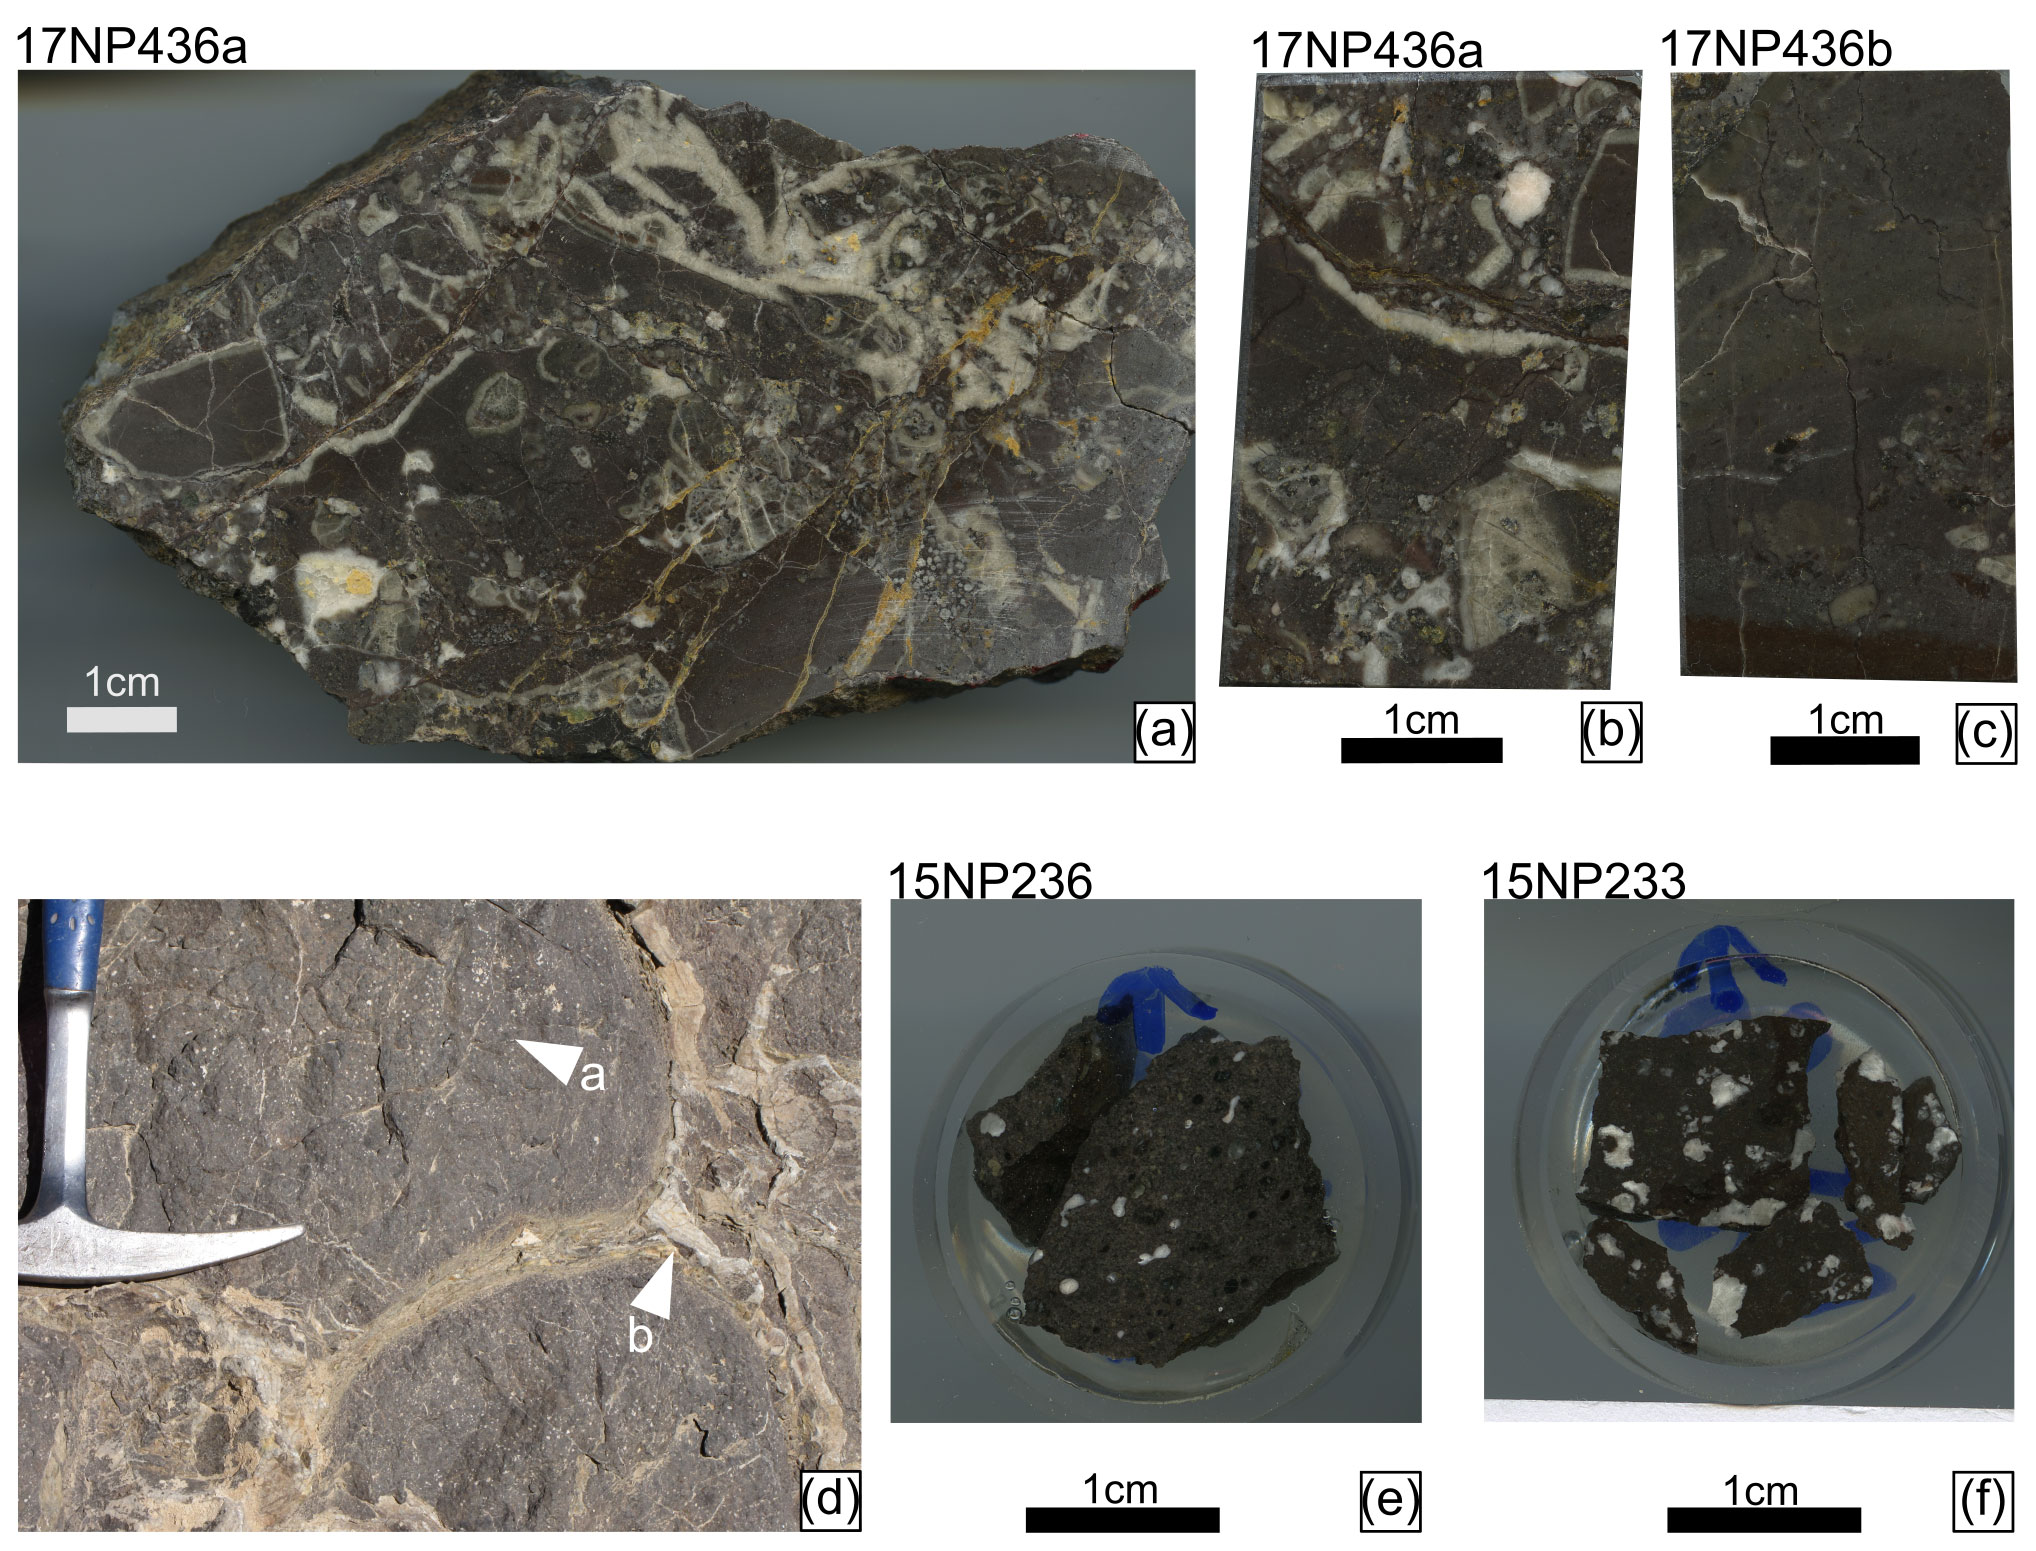
Figure 2Photographs of hand specimen of sample 17NP436a (a) and polished rock block used for LA-ICP-MS measurements of sample 17NP436a (b) and 17NP436b (c). Field photograph of well-preserved amygdaloidal pillow basalts in Oytag valley near Qimgan valley (d), with white arrows pointing at calcite-filled vesicles (arrow a) and massive interstitial calcite (arrow b). Polished rock specimen 15NP236 (e) and 15NP233 (f) of similar rock were used for LA-ICP-MS.
We conducted calcite dating based on detailed petrographic and geochemical observations in order to provide age constraints on the North Pamir arc volcanic rocks and test its correlation with the West Kunlun. For that purpose, we sampled four specimens at three different localities in the Chinese Qimgan valley (Fig. 1). Samples 17NP436a and 17NP436b are from the same locality (sample location at 39∘18′27′′ N, 74∘51′32′′ E) and represent redeposited brecciated mafic volcanic rock with interstitial calcite cement that was formed during an early phase of brecciation (Fig. 2a–c). Samples 15NP236 (sample location at 39∘18′18′′ N, 74∘51′30′′ E) and 15NP233 (sample location at 39∘18′16′′ N, 74∘51′47′′ E) are from two localities with amygdaloid basalt, where 15NP236 was taken from a pillow basalt. We investigated amygdules filled exclusively with calcite (Fig. 2e and f)
3.1 Petrological microscopy, cathodoluminescence microscopy (CL), and X-ray fluorescence microscopy (XFM)
Petrographic thin sections of all samples were studied with conventional light microscopy and cathodoluminescence microscopy (CL). Polished thin sections of all samples were prepared. CL imaging was done using an Olympus BXFM-F microscope equipped with a Lumic hot-cathode electron source and a highly sensitive Olympus XC10 camera at the University of Potsdam. We recognized well-preserved primary features (see Sect. 4.1), which were then identified on the rock chips prepared for laser ablation. Detailed sample petrography raises the chances of obtaining robust, meaningful ages, as emphasized recently by Roberts et al. (2021). High-resolution reflected light images indicate the position of ablation spots in Appendix Figs. A1 to A4.
Additionally, we examined sample 17NP436a with scanning X-ray fluorescence microscopy (XFM). A polished slab cut parallel to the surface examined with LA-ICP-MS was prepared from the same rock chip. XFM maps were collected at the XFM beamline at the Australian Synchrotron (Howard et al., 2020). The incident excitation energy was 18.5 keV. Pixel size and dwell time per pixel are indicated in Appendix Figs. B1 to B4.
3.2 Laser ablation inductively coupled plasma mass spectrometry (LA-ICP-MS)
Rock samples were processed at the School of Earth and Environmental Sciences, The University of Queensland. Samples 15NP233 and 15NP236 were cut and mounted on 1 in. (2.54 cm) diameter round mounts (Fig. 2e and f); for samples 17NP436a and 17NP436b, we used polished rock chips (Fig. 2b and c). Sample mounts were polished using standard polishing procedures and finished with a 0.25 µm diamond suspension.
LA-ICP-MS U–Pb dating and geochemical analysis was performed at the Radiogenic Isotope Facility of the Centre for Geoanalytical Mass Spectrometry, The University of Queensland following methods in Su et al. (2020) and Yang et al. (2021). Laser ablation was achieved using an ASI RESOlution 193 ArF nm excimer laser system. Following evacuation of air, He carrier gas was introduced into the laser cell at a flow rate of 0.35 L min−1; 0.005 L min−1 of N2 gas was also introduced to the laser cell to enhance the measurement sensitivity. The gas mixture was then introduced into the plasma torch of a Thermo iCAP RQ quadruple ICP-MS with 1.06 L min−1 Ar nebulizer gas. No reaction gas was employed. The laser was run with a 100 µm diameter round spot at 10 Hz, with a measured instrument laser fluence (laser pulse energy per unit area) of 2.5 J cm−2. For U–Pb dating, each spot had 8 s of background, 20 s of data acquisition, and 15 s of washout. For trace elemental analysis, each spot had 6 s of background, 25 s of data acquisition, and 10 s of washout. Prior to data acquisition, ICP-MS signals were optimized during tuning. For our session, ∼ 950 kcps (kilocounts per second) of 238U counts and ∼ 0.22 of were achieved for measuring NIST612 glass using line scans of 3 µm s−1, 10 Hz, 50 µm round laser pit, and 3 J cm−2.
U–Pb isotopes for geochronology (206Pb, 207Pb, 208Pb, 232Th, and 238U) were measured with the following dwell times, 206Pb (0.025 s), 207Pb (0.055 s), 208Pb (0.005 s), 232Th (0.005 s), and 238U (0.02 s). Both glass standard NIST614 and matrix-matched calcite standards were measured, bracketing unknown spots. NIST614 glass was used for correction of fractionation and instrument drift in the ratio (Woodhead and Hergt, 2001). Raw data were processed using Iolite software v3.64 (Paton et al., 2011). After the initial correction, a matrix-matched calcite reference material of known age was used for further correction of matrix-related mass bias impacting the measured ratios, following the approach described elsewhere, as summarized in Yang et al. (2021). We used cross-calibrated in-house calcite reference materials AHX-1D and PTKD-2 and an international reference material WC-1 (Roberts et al., 2017) in our laser ablation session. The accuracy of unknown spots is checked by measuring WC-1 and PTKD-2 as monitoring standards. For WC-1 we obtained an age of 251 ± 1 Ma (2σ), consistent with the recommended age of 254.4 ± 6.4 Ma (Roberts et al., 2017). The in-house PTKD-2 standard gave an age of 154 ± 3 (2σ), consistent with our recommended age of 153.7 ± 1.7 Ma (2σ), calibrated by isotope dilution. Therefore, we note that the accuracy for our measurements can be calculated as 1.5 % for WC-1 and 0.3 % for PTKD-2. Uncertainty propagation was done according to the principles defined by Horstwood et al. (2016). We present two age uncertainties as ± (2σ), where α is without propagated systematic uncertainties, and β is with propagated systematic uncertainties. We propagated our analytical errors (typically < 5 % (2σ) on ratios) by incorporating 238U decay constant error, long-term variance of the reference materials ratios in the lab, and the analytical error of the monitor standard. This resulted in a total propagated systematic uncertainty of 4.6 % (2σ) into the analytical error.
Trace elemental analysis was conducted in the same ablation areas as the U–Pb spots but without overlapping the U–Pb spots. Prior to data acquisition, ICP-MS signals were optimized during tuning while the oxide production rate was controlled to be as low as possible. The ratio during our session was < 0.002 for NIST612 glass using line scans of 3 µm s−1, 10 Hz, 50 µm round laser pit, and 3 J cm−2. 43Ca was measured as an internal standard. Data reduction was conducted using the Iolite software v3.64 (Paton et al., 2011) with the trace element data reduction scheme. All reported concentrations were after international standardization using Ca (Ca = 40.1 %).
4.1 Petrography and calcite occurrences
In the Chinese Qimgan valley, basaltic to andesitic volcanic rocks contain large amounts of calcite in amygdules, in between single lava pillows, and volcanic breccia layers (Fig. 2 and Appendix Figs. A1 to A4) Two samples, 15NP233 and 15NP236, are altered amygdaloid basalts with published geochemistry (Table S1 in the Supplement, Rembe et al., 2021). Samples 17NP436a and 17NP436b are from a volcanic breccia, rich in calcite cement fragments and calcite-overgrown, angular volcanic rock fragments. The samples were collected from three localities, whereas 17NP436a and 17NP436b are from the same locality.
Amygdules in samples 15NP233 and 15NP236 show one generation of spary or botryoidal calcite with typical sweeping extinction under cross-polarized light (Fig. 3a and b). Sample 15NP233 has vesicles up to 5 mm in diameter filled exclusively with calcite. Sample 15NP236 has much smaller vesicles, around 1 mm in diameter, filled with either calcite or zeolite. Both samples show high “loss on ignition” (LOI) values and anomalous major element values for whole rock geochemistry, accounting for high secondary, volatile-rich mineral content (Table S1 in the Supplement). No fractures or veins cut across amygdules in these samples.
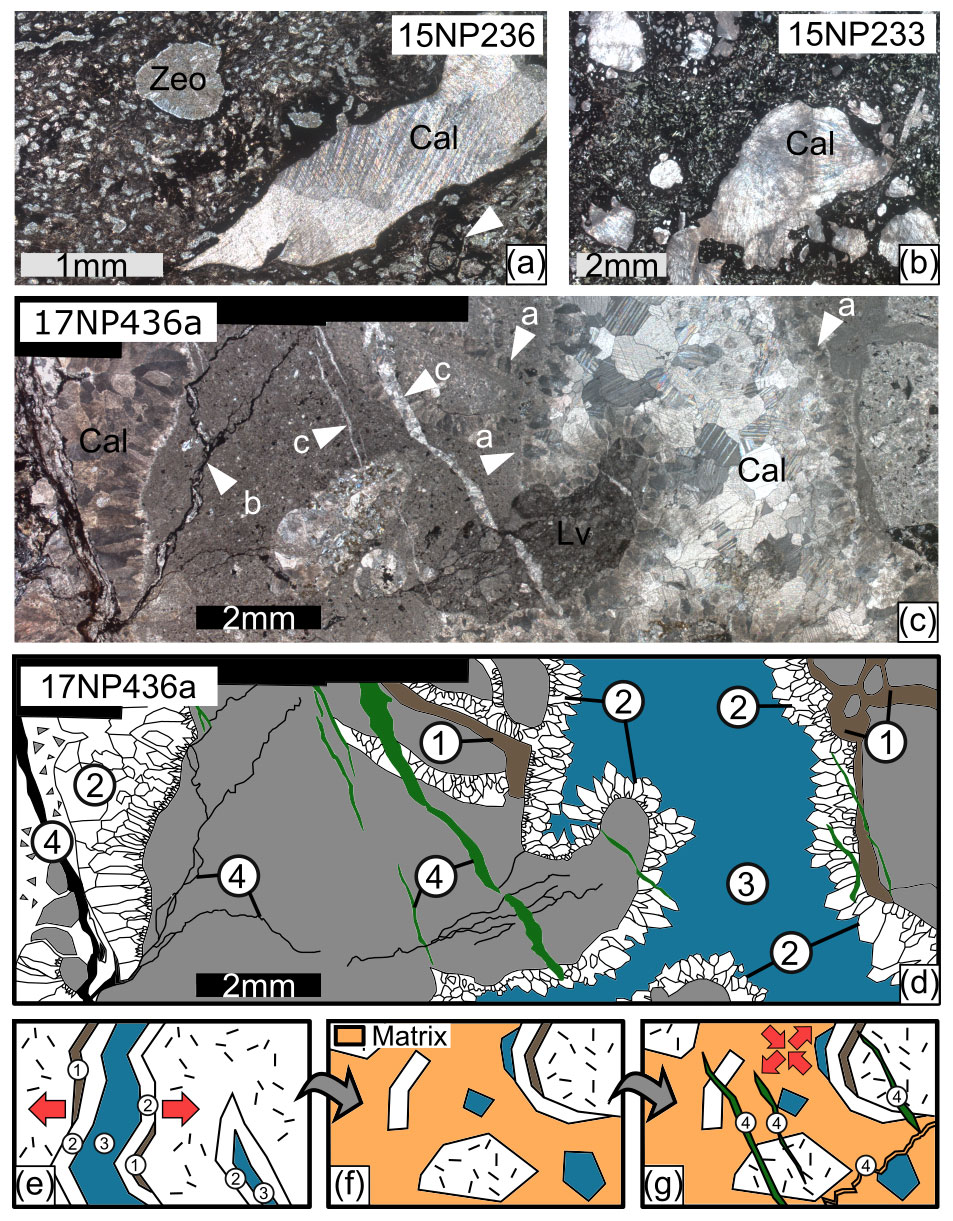
Figure 3Typical calcite-filled vesicles from sample 15NP236 (a), in this case with spary calcite and zeolite mineralization. The white arrow marks preserved perlitic structures. Botryoidal calcite was found in both amygdaloid-basalt samples; the example in (b) is from 15NP233. Panel (c) shows a thin section photograph of sample 17NP436a. White arrows indicate radial fibrous calcite (a), dark stylolites (b), and calcite-filled fissures (c). (a–c) Under crossed polarized light. Panel (d) shows a schematic sketch of microphotograph (c), delineating a sequence of four events: (1) formation of hydrothermal clay, (2) precipitation of fibrous-radial calcite along the walls of brecciated volcanic rock fragments, (3) late-stage equant calcite formation, and (4) pressure solution and formation of stylolites (dark lines) and reprecipitation of dissolved calcite in fissures (green). Areas 2 and 3 are targets for laser ablation. In (e) and (f) a schematic sequence of events leading to the formation of the basaltic breccias is sketched. (e) Fracturing of the basaltic rock and formation of clay (1) and calcite cement phases (2) and (3). (f) Disarticulation and sedimentation of debris containing isolated calcite cement fragments. (g) Late-stage pressure solution and fissure formation of phase (4). Red arrows schematically indicate stress regime.
In samples 17NP436a and b, fracture and pore space in basaltic rock fragments shows multiple calcite generations (Fig. 3c and d). Most calcite formed prior to deposition of the breccia. Specifically, isolated cement fragments are fully embedded in a fine-grained matrix (e.g., in sample 17NP436b). They may have formed in fractures of a volcanic edifice and were redeposited after its collapse. In some cases, calcite cement is still attached to the basaltic clasts and a series of four consecutive mineralization phases can be recognized (numbered 1 to 4 in Fig. 3d, schematically depicted in Fig. 3e–g). Some of the volcanic rock fragments show an early, hydrothermal clay layer (Fig. 3c and phase 1 in Fig. 3d). The rock fragments – or if present, the clay coatings – are overgrown by a first generation of radial-fibrous calcite. Larger voids are filled with late, equant calcite (phase 2 and 3 in Fig. 3d). The early, medium to coarse spary calcite cements (2 and 3 in Fig. 3d) and the matrix are crosscut by fine-sparitic calcite-filled fissures (4 in Fig. 3d). The fissures are distinguishable from the spary calcite in transmitted and reflected light and were avoided during ablation.
Cathodoluminescence microscopy imaging reveals fibrous botryoidal textures of the vesicle-filling calcite of samples 15NP233 and 15NP236. They usually show no luminescence or a zonation of dull-yellowish and non-luminescent fringes (Fig. 4a and b). Bright-yellow luminescence irregularly occurs along the rims of the vesicles. Secondary fractures crosscutting the vesicular fabric were not observed. We prepared slides from the rock chips analyzed with LA-ICP-MS of samples 17NP436a and 17NP436b (Fig. 4c–f). The basalt breccia samples 17NP436a and 17NP436b show non-luminescent to dull-yellow luminescent spary calcite. Bright-yellow luminescence was observed along hairline subzones, which are interpreted as grain boundaries. The largely non-luminescent spary calcite fragments stand out against the yellow luminescent altered volcaniclastic matrix. Matrix and spary calcite fragments are intersected by bright-yellow, late-stage calcite-filled (phase 4 in Fig. 3d) fractures (e.g., Fig. 4c). They are clearly visible in transmitted and reflected light and were avoided during ablation.
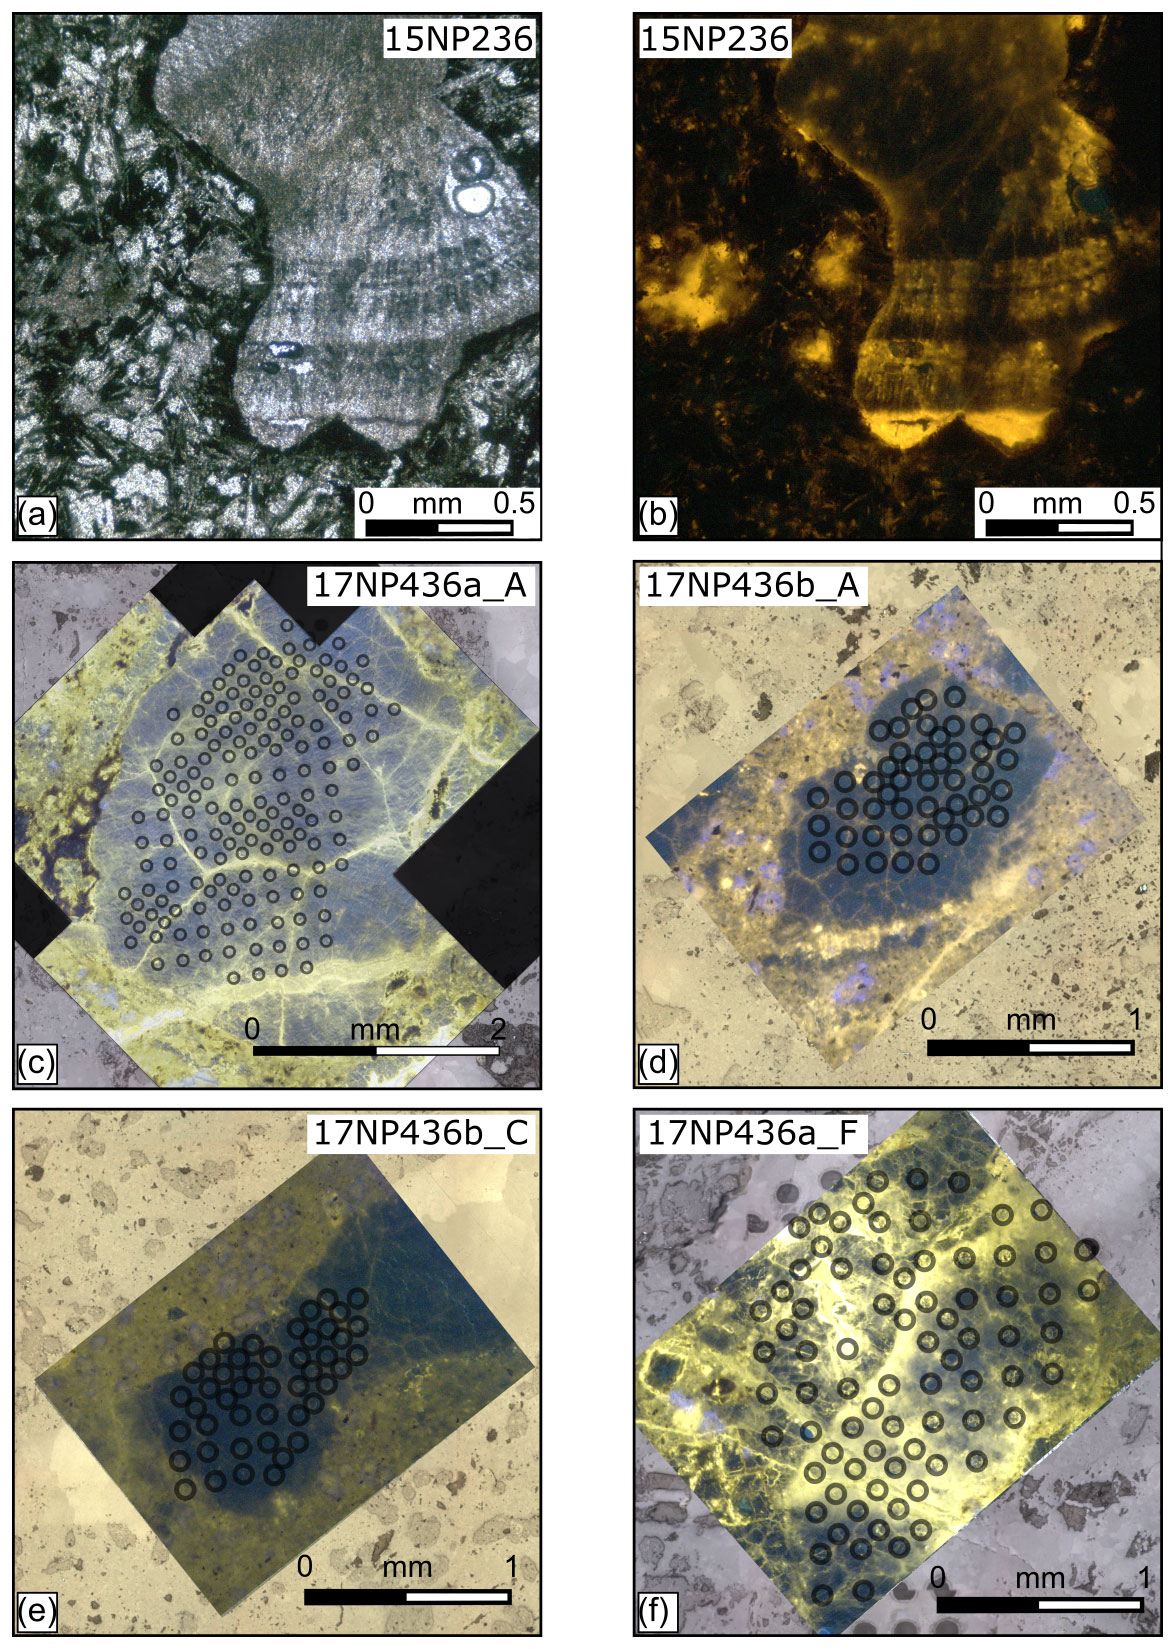
Figure 4Microphotographs under plain light (a) and cathodoluminescence (b) of an exemplary vesicle from sample 15NP236 show primary botryoidal structure of the calcite. Primary calcite seems non-luminescent to dull luminescent. Cathodoluminescence images of ablation areas 17NP436a_A (c), 17NP436b_A (d), and 17NP436b_C (e) show relatively homogenous non-luminescent calcite cement fragments with a small portion of bright-yellow veins. The calcite cement fragments are embedded in a dull-yellow luminescent volcaniclastic matrix. All three samples yielded high-quality calcite U–Pb ages (MSWD < 2). Ablation area 17NP436a_F (f), which has a high portion of bright-yellow calcite, yielded a less precise age (MSWD = 3.5). Ablation spots for geochemistry and U–Pb dating are marked with grey circles.
In order to better understand calcite phases, we further study 17NP436a with high-resolution synchrotron X-ray fluorescence mapping (Howard et al., 2020), following methods described in Vanghi et al. (2019). Sr maps show elevated concentration for the phase 2 and 3 calcite and much lower content in fissure filling calcite phase 4, suggesting different geochemical regimes (Appendix Figs. C1 to C4).
4.2 LA-ICP-MS U–Pb dating
Four samples from three field sites were prepared for analysis. We obtained data from 839 single spots from 18 laser ablation areas (Appendix Figs. A1 to A4), 3–6 ablation areas per sample (Figs. 5 and 6), Table S2 in the Supplement. For age calculation, we used the IsoplotR program (Vermeesch, 2018) version 3.5 running in R version 3.6.0. Ages are calculated for individual ablation areas by linear regression in a Tera–Wasserburg plot. Of the 839 single-spot ablation data, only 16 had to be omitted due to U content below the detection limit.
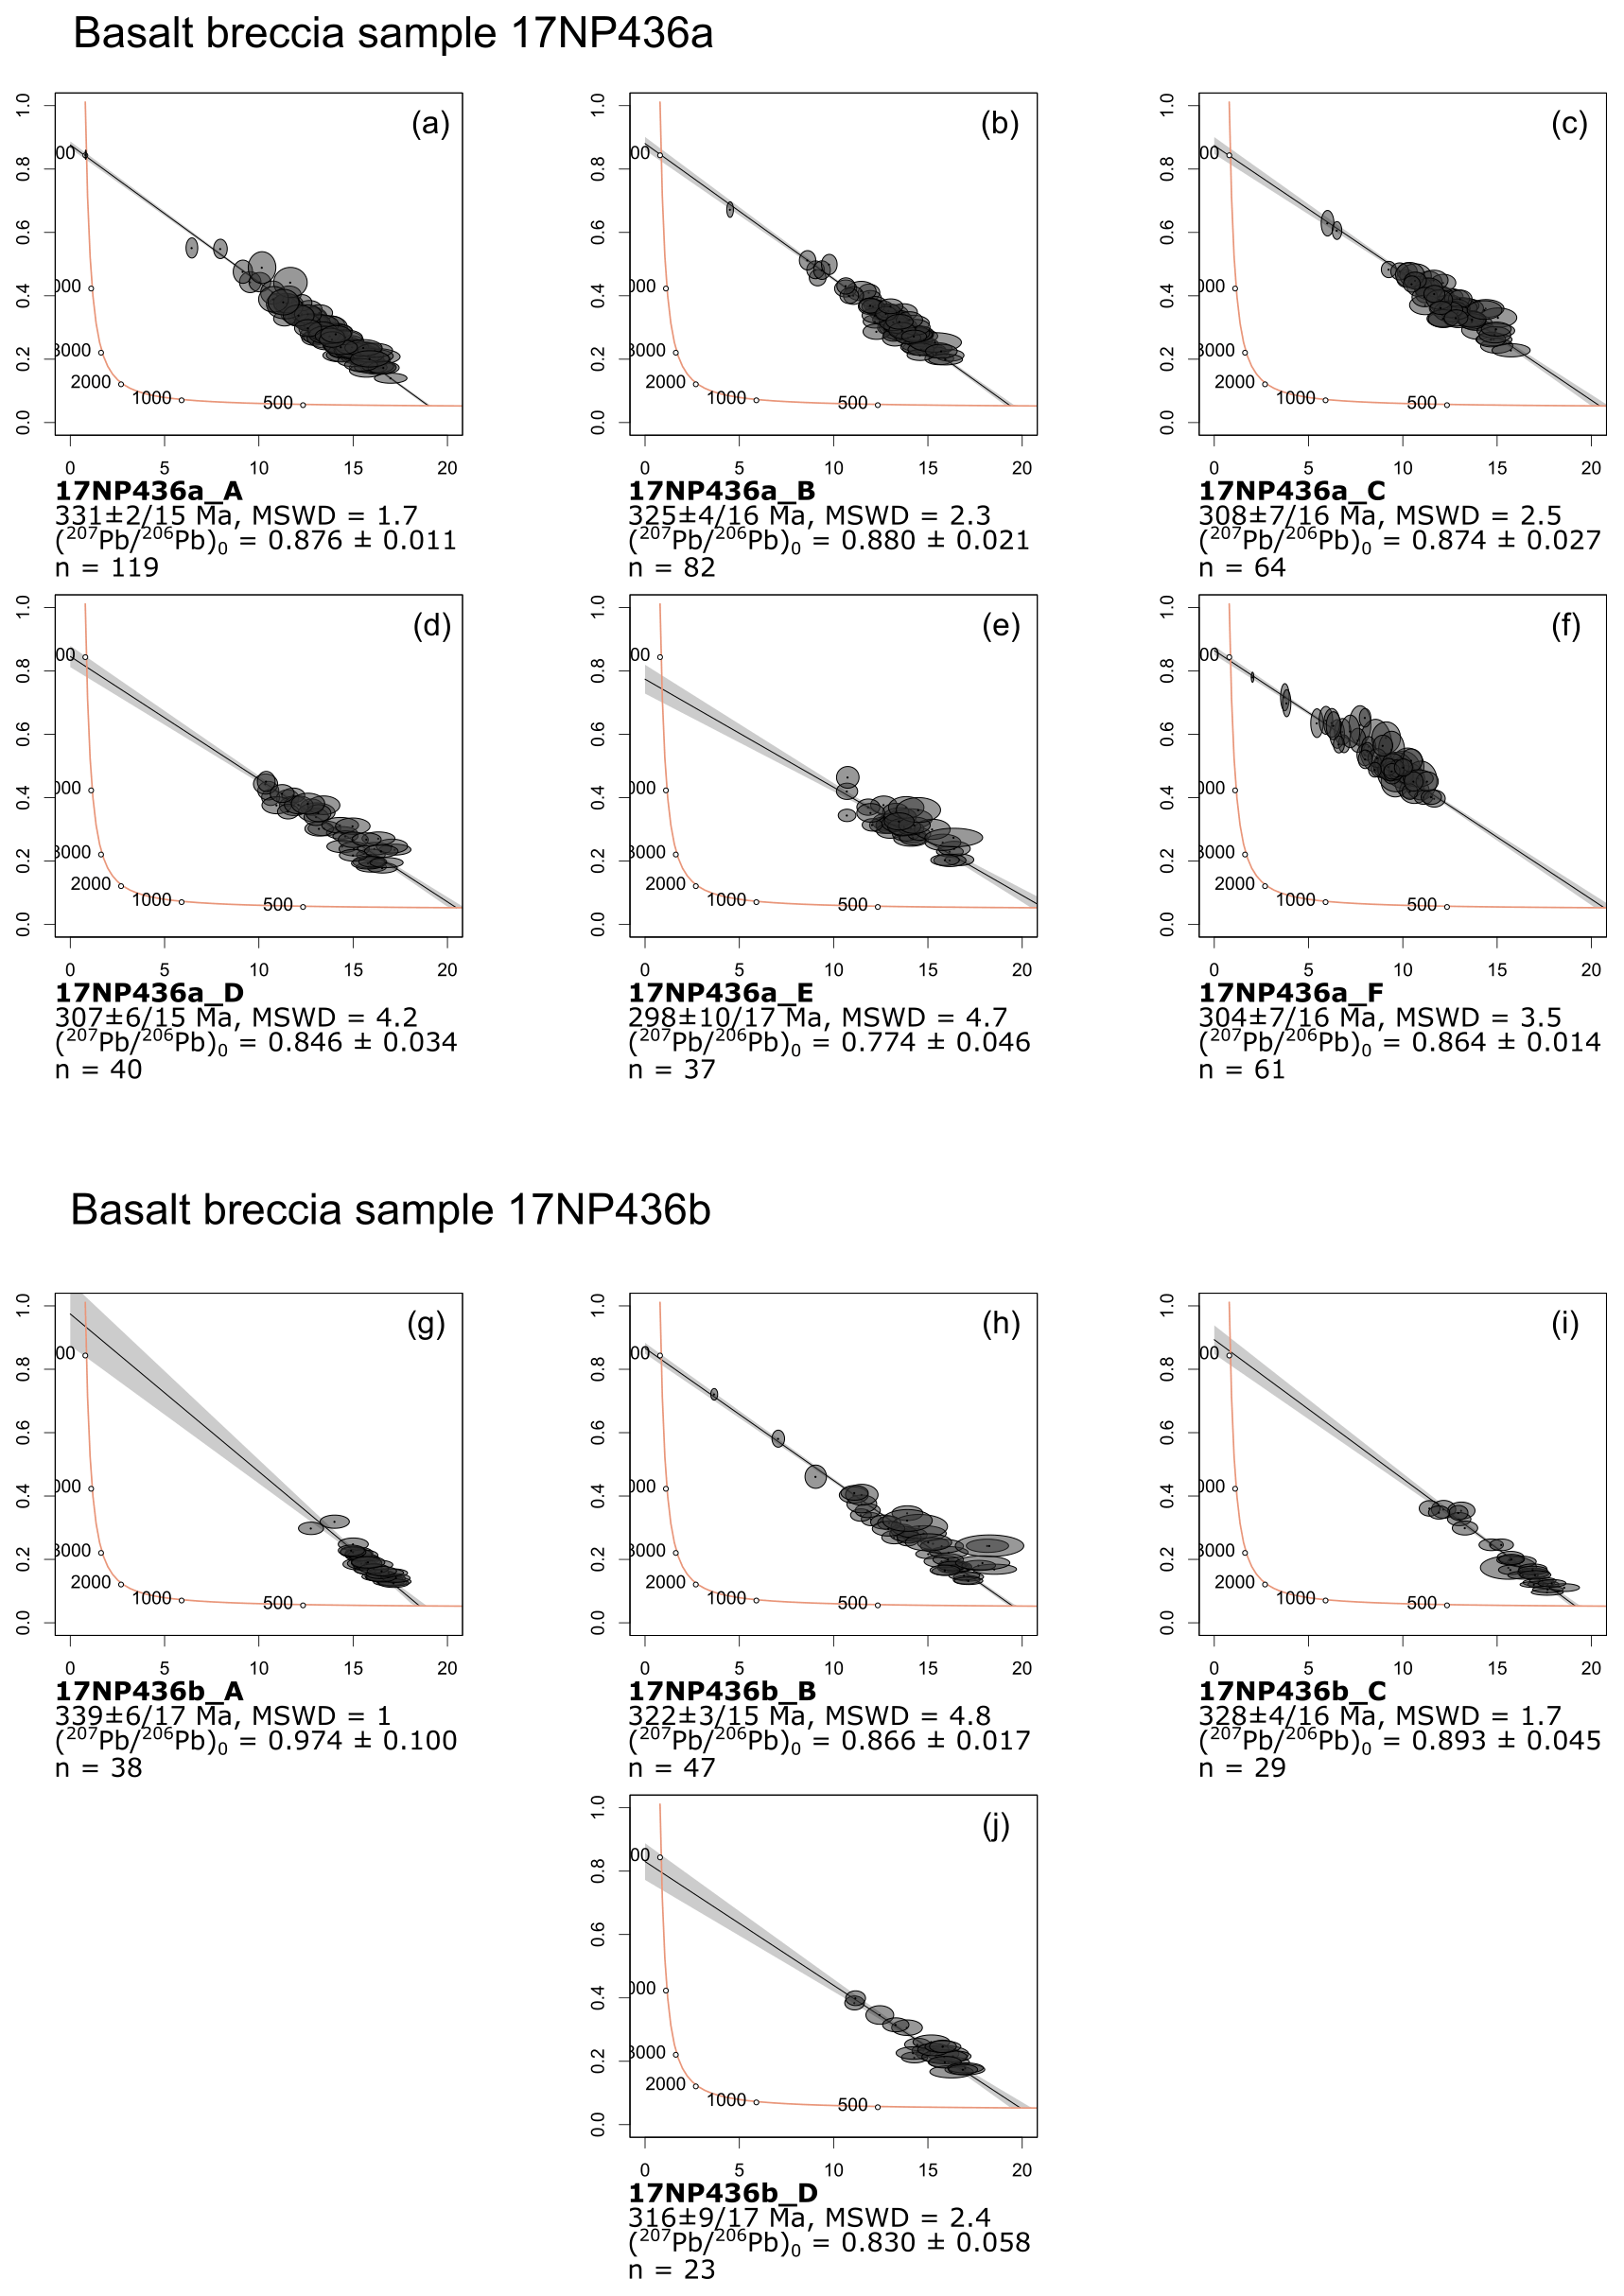
Figure 5Tera–Wasserburg plots of ablation area ages on basalt breccia samples 17NP436a and 17NP436b. All errors are given as 2σ.
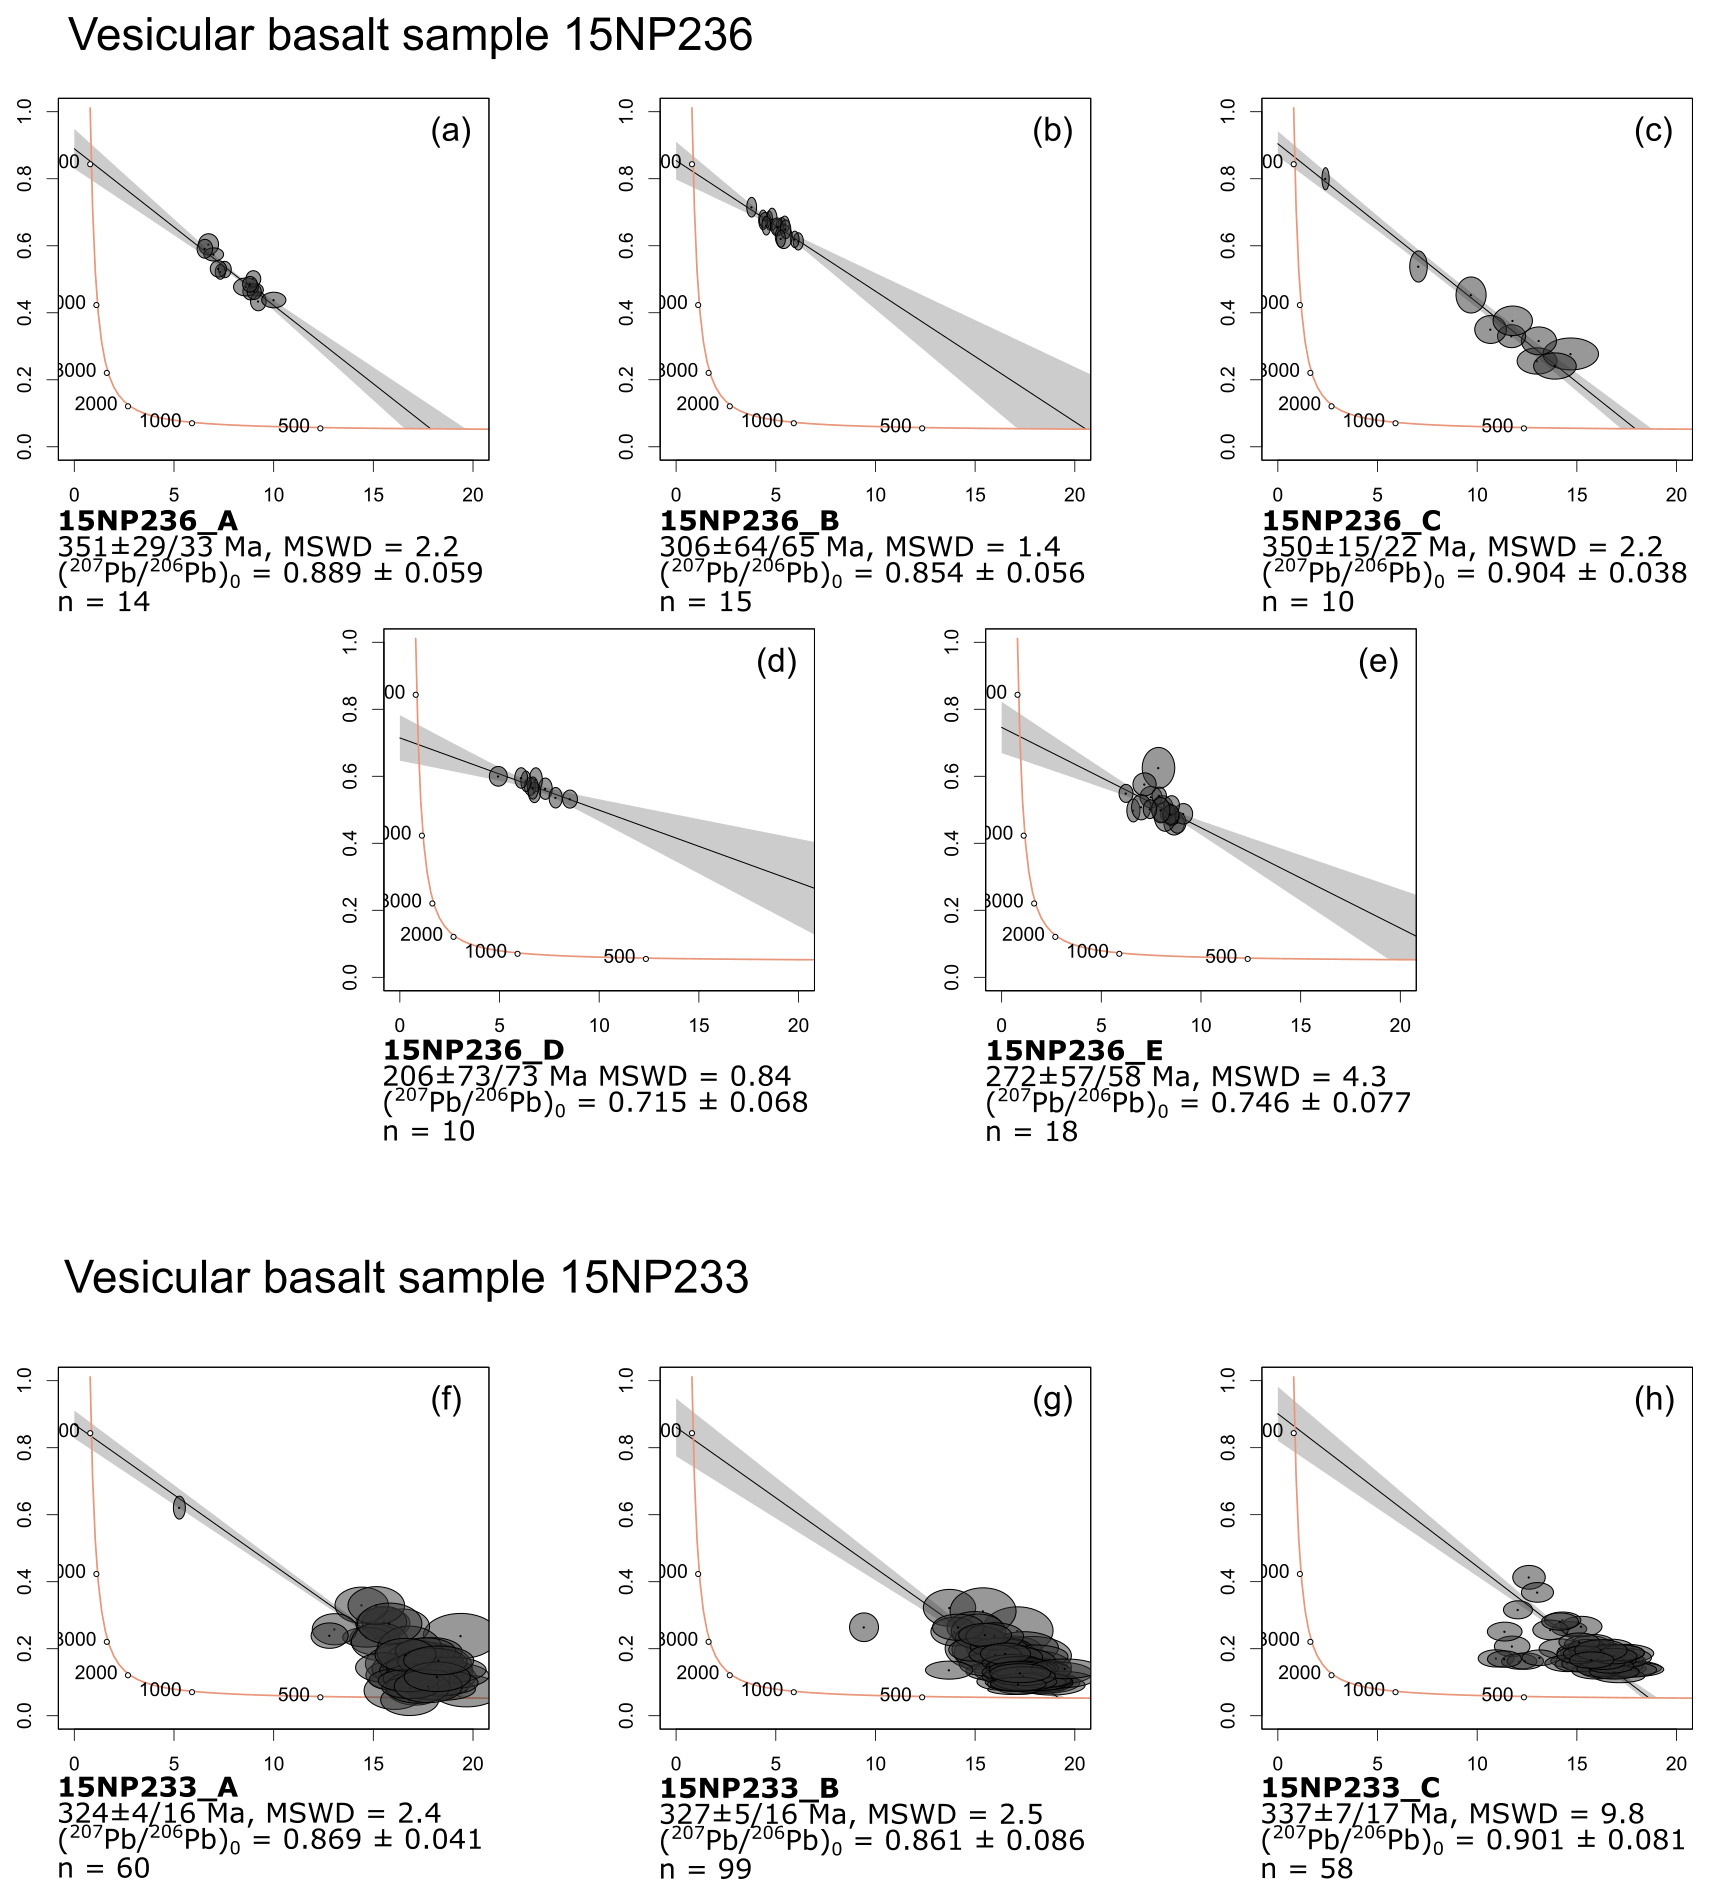
Figure 6Tera–Wasserburg plots of ablation area ages on vesicular basalt samples 15NP236 and 15NP233. All errors are given as 2σ.
4.2.1 17NP436a
Six ablation areas were targeted in basalt breccia sample 17NP436a (Fig. 5a–f). They are placed on isolated coarse sparitic, equant calcite cement fragments (areas A, C, D, and E) and coarse-sparitic radial fibrous to equant calcite cement still connected to their basaltic substratum (areas B and F). Propagated errors are generally small (∼ 5 %) and mean squared weighted deviation (MSWD) values are low to moderate. Area A is an isolated fragment of coarse spary cement (Fig. 4c) and yielded a lower intercept age of 331 ± 2/15 Ma (MSWD = 1.7) calculated from 119 single-spot data points. Eighty-two ablation spots yielded a lower intercept age of 324 ± 4/16 Ma (MSWD = 2.3) for Area B. Sixty-four ablation spots gave a lower intercept age of 308 ± 7/16 Ma (MSWD = 2.5) for Area C. Area D gave a similar lower intercept age of 307 ± 6/15 Ma (MSWD = 4.2, n = 40). Area E gave a rather low age of 298 ± 10/17 Ma with an elevated MSWD of 4.7, defined by 37 ablation spots. Sixty-one ablation spots on Area F (Fig. 4f) defined a lower intercept age of 304 ± 7/16 Ma (MSWD = 3.5).
4.2.2 17NP436b
In basalt breccia sample 17NP436b, four ablation areas were targeted (Fig. 5g–j). They are placed on isolated coarse sparitic, equant calcite cement fragments. Propagated errors are generally small (∼ 5 %), and MSWD values are low to moderate. Area A (Fig. 4d) yielded a lower intercept age of 339 ± 6/17 Ma (MSWD = 1) defined by 38 ablation spots. Area B yielded a lower intercept age of 322 ± 3/15 Ma (MSWD = 4.8) defined by 47 ablation spots. Twenty-nine laser spots on Area C (Fig. 4e) yielded a lower intercept age of 328 ± 4/16 Ma (MSWD = 1.7). Twenty-three ablation spots gave a lower intercept age of 316 ± 9/17 Ma (MSWD = 2.4).
4.2.3 15NP236
Five ablation areas were targeted in vesicular basalt sample 15NP236 (Fig. 6a–e). Each ablation area represents one calcite-filled vesicle. Due to the small vesicles, only a few spots were placed per area. Propagated errors are moderate to large (6 %–36 %), and MSWD values are low to moderate. Area A yielded a lower intercept age of 351 ± 29/33 Ma (MSWD = 2.2) defined by 14 single ablation spots. Fifteen ablation spots on Area B gave a lower intercept age of 306 ± 64/65 Ma with a low MSWD of 1.4. Ten spots on Area C gave an age of 350 ± 15/22 Ma (MSWD = 2.2). Area D yielded a very young age of 206 ± 73/73 Ma (MSWD = 0.84) defined by 10 ablation spots. A similarly young age of 272 ± 57/58 Ma (MSWD = 4.3) was defined by 18 laser spots for Area E.
4.2.4 15NP233
Three ablation areas were placed on calcite in three filled vesicles in sample 15NP233 (Fig. 6f–h). Propagated errors are small (∼ 5 %), and MSWD values are moderate. Area A gave an age of 324 ± 4/16 Ma (MSWD = 2.4) defined by 60 ablation spots. Ninety-nine ablation spots on Area B yielded a similar age of 327 ± 5/16 Ma (MSWD = 2.5). Fifty-eight ablation spots on Area C gave a slightly higher age of 337 ± 7/17 Ma (MSWD = 9.8).
4.2.5 LA-ICP-MS geochemistry
For each laser ablation area, we measured Ca, Mn, Sr, Zr, Ba, and REE + Y geochemical data (a total of 380 single-spot analyses) using LA-ICP-MS (data in Table S3 in the Supplement). Calcite REE patterns normalized to chondrite (Boynton, 1984) are mostly flat to slightly “U” shaped (Appendix Figs. C1 to C4). REE content of the vesicle-hosted calcite is higher (61 ppm mean total REE content in sample 15NP233, 59 ppm in sample 15NP236) compared to the breccia calcite cement (8 ppm in 17NP436a and 12 ppm in 17NP436b). Light rare-earth elements (LREEs) are enriched over middle rare-earth elements (MREEs) () and negatively correlate with enriched MREE over heavy rare-earth elements (HREEs) values () in all samples. The vesicle-filling calcite shows both positive and negative values between 0.75 and 1.4; the breccia calcite cement shows negative values between 0.18 and 0.92. Negative Ce anomalies are usually associated with oxidizing conditions producing Ce4+ instead of Ce3+ (e.g., Alibo and Nozaki, 1999). We observe positive to slightly negative Gd anomalies (; Fig. 7a). Positive anomalies are common (Fig. 7b). Negative and anomalies together with higher and in the calcite cement of the volcanic breccia are interpreted to reflect a stronger influence of infiltrating seawater (; ).
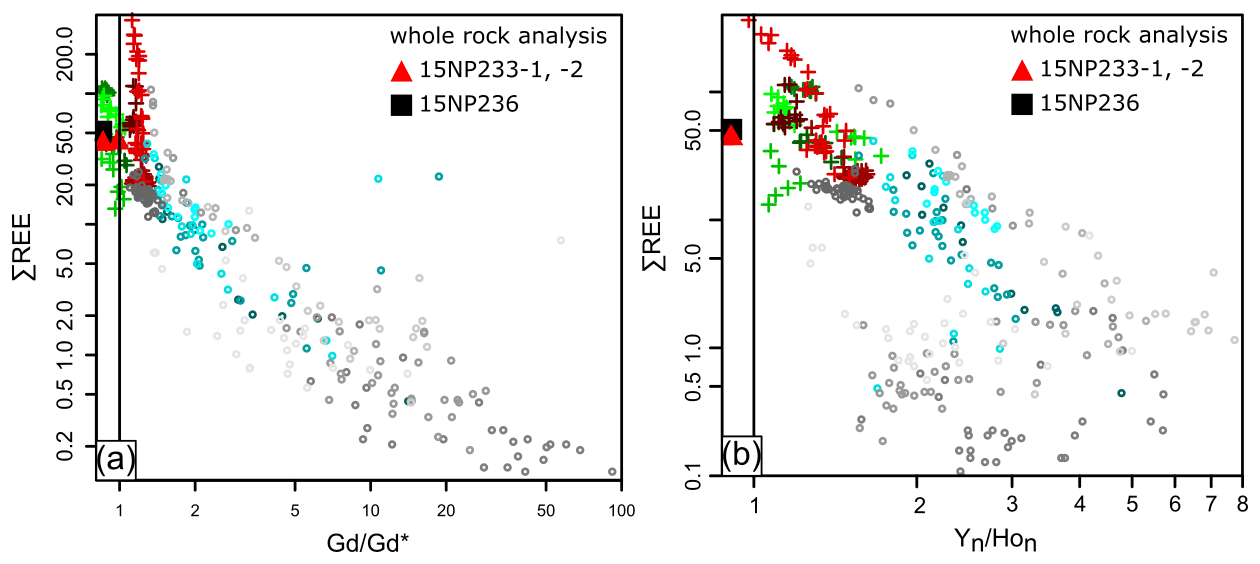
Figure 7(a) Mixing trend between high total REE–negative and low total REE–positive composition. (b) Higher values correlate with low total REE. Y and Ho normalized against chondrite values of Anders and Grevesse (1989). + -15NP233, -236, o -17NP436A, -B; color code see Appendix A.
5.1 Calcite age data and its significance
In newly formed submarine volcanic rocks, calcite formation marks the phase of alkalinity-generating reactions. Alkalinity describes the acid-neutralizing capacity by formation of alkali and alkaline earth metal ion species during rock weathering (e.g., Spivack and Staudigel, 1994). This is crucial for interpreting OFA calcite U–Pb ages, implying that these ages should be no older than the “true” rock formation age. High-temperature hydrothermal alteration is also a common phenomenon in submarine volcanic environments. This is, in contrast, restricted to discrete zones, such as veins, shear zones, and hydrothermal upflow zones (Harlov and Austrheim, 2013; Honnorez, 2003). It changes the mineral composition of the volcanic host rock completely, such that primary igneous textures are obliterated (e.g., epidosites, Honnorez, 2003). Such rock types must be avoided as they are unlikely to produce ages related to OFA. By dating isolated calcite, far from hydrothermal upflow zones, we determine the age range of OFA that occurred shortly after rock consolidation. This gives a minimum age estimate for ocean floor formation, if not the actual age of formation. This must not be mistaken for the radiometric ages of the volcanic rock itself (e.g., ages from zircon U–Pb dating).
We observed one botryoidal to spary calcite phase in the vesicular basalts (Figs. 3a and 4a and b). Four stages of mineralization were observed in the basaltic breccia: (1) hydrothermal clay, (2) radial-fibrous calcite, (3) coarse equant-spary calcite, and (4) fissure filling calcite crosscutting the entire fabric (Fig. 3b–g). The presence of radial fibrous and sparry, equant calcite crystals is typical of continuous calcite precipitation in a porous substratum (Gonzalez et al., 1992). In a first phase, radial-fibrous calcite grows along the wall of the voids and successively reduces the porosity of the substratum, thereby hindering fluid flow. This reduces the calcite precipitation rate and the amount of nucleation, leading to larger, equant calcite crystals in the center of the voids. This model can be adopted for a first calcite phase (2 and 3 in Fig. 3d). As the radial fibrous and the equant calcite growth reflects one process, both calcite phases were chosen for ablation. The phase-4 fine-sparitic-filled fissures are interpreted to reflect a later tectonic event, expressed by differential stress, pressure solution, and reprecipitation of calcite in open joints (Fig. 3g).
To explore the geologic significance of our age data, we first applied a very conservative filter, closely examining ages with MSWD < 2 and 2σ error < 10 %, as their isotope ratios are most likely measured from single homogenous domains (e.g., Lan et al., 2022). Subsequently, we also discuss all ages for a full view of the age spectrum.
Our samples generally show a low variability in ablation area ages and initial Pb values (Figs. 5 and 6); 2σ errors with propagated systematic uncertainties are typically around 5 %. Only vesicular basalt sample 15NP236 shows high 2σ errors. However, multi-stage calcite formation and possible subsequent alteration lead to MSWD values above 2 and elevated age errors. Primary calcite was eventually affected by alteration and crystallization of calcite with differing chemistry even within microscopically identified seemingly homogenous phases (e.g., phase 2 and 3 in Fig. 3d). This is made visible by CL imaging of yellow-luminescent subzones penetrating non-luminescent phase-2 and phase-3 calcite zones in Fig. 4f. However, ablation spots placed on ablation areas 17NP436a_A, 17NP436b_A and 17NP436b_C largely fall on what we interpret as phase 2 and 3, radial fibrous to equant calcite, characterized by non-luminescence (Fig. 4c–e). The lower intercept ages are 331 ± 2/15 Ma (17NP436a_A), 339 ± 6/17 Ma (17NP436b_A), and 328 ± 4/16 Ma (17NP436b_C), which consistently constrains the volcanic breccia to the Visean–Serpukhovian boundary. All ablation areas of basalt breccia samples 17NP436a and 17NP436b and vesicular basalt sample 15NP233 overlap within propagated 2σ errors. Their scatter reflects either the mixed ages of multiple calcite formation events during the late Mississippian to Pennsylvanian which cannot be resolved or minor isotope disturbance (by heating and/or fluid flow) during a much younger event. Vesicular basalt sample 15NP236 yielded less defined regressions, thus high age errors, caused by the small spread of the limited number of ablation spots. However, two ablation areas, 15NP236_B and 15NP236_D, gave MSWD values of 1.4 and 0.84, respectively, while yielding much different lower intercept ages; 15NP326_B gave an age of 306 ± 64/65 Ma, which overlaps with the ages of 15NP326_A (351 ± 29/33 Ma, MSWD = 2.2) and 15NP326_C (350 ± 15/22 Ma, MSWD = 2.2); 15NP236_D gave an age of 206 ± 73/73 Ma, which is apparently younger. This leads us to conclude that Carboniferous primary ages were affected by young events causing isotope disturbance and shift of the apparent yet mixed ages towards younger values. This might be true to a limited degree for all samples with MSWD > 2.
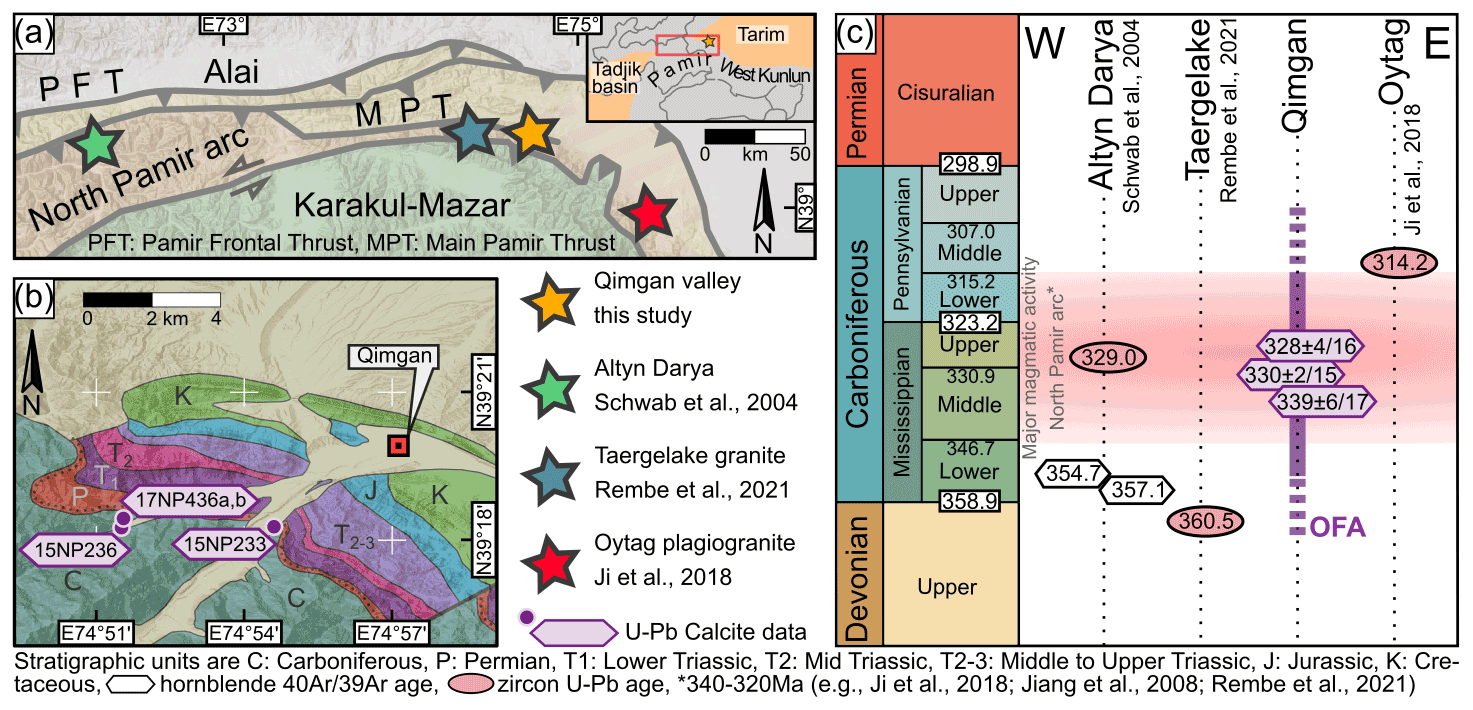
Figure 8(a) Map of the northeastern Pamir with location of radiometric ages for the North Pamir arc volcanic rocks, shown in (c). (b) Detailed field locations of samples in the Qimgan valley (map after Henan Institute of Geological Survey, 2014). There is a sedimentary hiatus between the Middle Pennsylvanian and the Guadalupian (Rembe et al., 2021). (c) Overview of selected literature data and newly obtained data for OFA of the North Pamir Carboniferous arc. Stratigraphic table and ages according to the International Chronostratigraphic Chart (Cohen et al., 2013).
Calcite ages are consistent with published radiometric ages of correlative rock units in the North Pamir arc, including two hornblende ages of ∼ 350 Ma from a meta-andesite, zircon U–Pb ages of ∼ 329 Ma from felsic to intermediate volcanics in Altyn Darya valley (Schwab et al., 2004), and zircon U–Pb ages of ∼ 360 to 314 Ma from island arc granites (Ji et al., 2018; Rembe et al., 2021) (Fig. 8). All these ages are interpreted by the aforementioned authors to be primary magmatic ages and reflect the age of emplacement of those units.
5.2 Calcite REE + Y geochemistry
Whole-rock geochemical data from altered basalt have a flat C1-normalized REE pattern (Boynton, 1984), implying an intra-oceanic arc origin (Jiang et al., 2008; Rembe et al., 2021). We suggest a possible control of the basalt geochemistry on calcite REE patterns; any process altering this signal would significantly change the calcite REE pattern (Debruyne et al., 2016).
REE partition coefficients between aqueous solution and precipitating calcite have been experimentally studied (e.g., Perry and Gysi, 2018; Voigt et al., 2017); results suggest that variable physicochemical conditions could lead to strongly differing integration of rare earth elements into the calcite lattice. We show that calcite cements of samples 17NP436a and b are distinguishable from vesicle fillings in samples 15NP233 and 15NP236 (Fig. 7a and b).
Calcite must be the major REE + Y sink as our samples do not show any intergrowing, co-precipitated mineral phase. The dominance of calcite hints at precipitation from CO2-rich seawater derived hydrothermal fluids under low-temperature conditions (Talbi and Honnorez, 2003; Honnorez, 2003). This happened in the upper few 100 m of the oceanic crust. We assume a low mineralization temperature. Under this condition, Eu is trivalent and negative is directly inherited from the fluid reservoir (Debruyne et al., 2016). Pronounced negative values are a typical inherited signal of oxidizing seawater (e.g., Alibo and Nozaki, 1999); in correlation with increasing values, they trace back to oxidative sorption by Fe–Mn O(OH) species (Debruyne et al., 2016). Positive values may be interpreted as a seawater signal (e.g., Baar et al., 1985). However, markedly positive Gd anomalies together with positive values are less commonly reported. Similar features were observed in high-salinity waters from Jordan graben lakes (e.g., Möller et al., 2007). Because ocean floor aquifer porosities are highly heterogenous (e.g., Fisher and Becker, 2000), the higher porosity of volcanic breccias 17NP436a and 17NP436b may have promoted seawater infiltration, leading to lower REE concentrations and more pronounced , , , and anomalies compared to amygdaloidal basalt samples. We note that Gd anomalies strongly correlate with REE concentration. Although LA-ICP-MS data acquisition was done according to international standards, we cannot completely exclude the possibility of polyatomic interference of the measured 157Gd isotope with 141Pr16O+ (May and Wiedmeyer, 1998).
5.3 Implications on tectonic models of the Pamir
The results from petrological thin section examination, showing primary calcite fabrics, together with LA-ICP-MS trace element geochemistry, which reflect sea water infiltration, typical for OFA, are major arguments for preserved, primary U–Pb isotopic ratios. Our studies constrain the emplacement age of arc volcanic rocks in the NE Pamir to Middle–Upper Mississippian (Visean–Serpukhovian) (Fig. 8), significantly younger than correlative lithologies in the West Kunlun, which are dated to the Cambrian (e.g., Yixieke dacite, Xiao et al., 2005; Kudi ophiolite, Wang et al., 2021). The results carry significant implications for the interpretation of the Mesozoic and Cenozoic geodynamic evolution of the Tibet–Pamir orogen. Since the pioneering works of Burtman et al. (1963), Burtman and Molnar (1993), Pan (1994), Mattern et al. (1996), Xiao et al. (2002), and references therein, the Kudi–Oytag suture, or the “Paleozoic suture”, has been hypothesized to be a single, once continuous, E–W-striking feature that was bent towards the north by Cenozoic indentation of the Pamir into a postulated Tarim–Tajik block.

Figure 9(a) Paleogeographic situation in the mid-Cambrian: the roll-back of the Proto-Tethys slab caused the formation of the Kudi ophiolite, exposed in the Buziwan valley (Wang et al., 2021). (b) Paleogeographic situation in the late Mississippian: the North Pamir arc formed along an intra-oceanic subduction zone (Jiang et al., 2008) forming the Oytag segment in its eastern branch. Subduction-related Waqia granite (Tang et al., 2020) and East Mazar granite (Li et al., 2006), both today part of tectonic slivers, suggest the presence of a remnant oceanic basin between Tianshuihai and the South Kunlun Terrane accretionary complex, as suggested by Zhang et al. (2018). Small photographs show pillow basalts in the Kudi section (in a) and Oytag near Qimgan (in b). SKT – South Kunlun Terrane, TSHT – Tianshuihai Terrane, NPA – North Pamir volcanic arc, NKT – North Kunlun Terrane.
Recent publications outline an early Paleozoic history of the West Kunlun arc magmatism (Fig. 9a). The southward subduction of the Proto-Tethys started in the Terreneuvian, dated by the 531 Ma Nanpingxueshan pluton in the Tianshuihai Group (Yin et al., 2020). As a consequence of the development of the Yixieke volcanic arc (Xiao et al., 2005) and the Yierba arc, the South Kunlun was intruded by the Yierba adakitic diorite at ca. 513 Ma (Yin et al., 2020). In response to slab roll-back, the Kudi ophiolite formed in a back-arc position between 513–516 Ma (Wang et al., 2021). The Proto-Tethys closed in the Silurian between 431–420 Ma (Wang et al., 2020) with exhumation of metamorphic units starting from ca. 440 Ma, as dated by monazite U–Pb from the Saitula Group (Zhang et al., 2018). Closure of the Proto-Tethys was followed by the intrusion of A-type post-orogenic granites, dated as 420–405 Ma by zircon U-Pb in the North Kudi granite (Yuan et al., 2002; Liu et al., 2014).
However, corresponding early Paleozoic geologic events or rock records in the North Pamir have not been reported. Instead, previous works on mafic to intermediate volcanic rocks and granitoids of the North Pamir show major subduction-related arc magmatic activity in the mid to late Carboniferous (Rembe et al., 2021; Jiang et al., 2008; Ji et al., 2018; Kang et al., 2015; Ruzhentsev et al., 1977). Carboniferous arc magmatic rocks found in the Waqia (Tang et al., 2020) and East Mazar (Li et al., 2006) tectonic slivers reflect the closure of a remnant ocean basin, whereas major arc magmatic activity was focused on the North Pamir arc further to the west (Fig. 9b). Stratigraphic relations and hiatuses point to a soft collision and obduction of the North Pamir arc in the early Permian (Rembe et al., 2021). No broad Paleozoic magmatic activity younger than Lower Devonian is known in the West Kunlun. The Carboniferous North Pamir arc granitoids intrude largely into poorly dated mafic volcanic rocks. Our calcite U–Pb ages agree with the only known ages of this volcanic unit from Schwab et al. (2004) (Fig. 8). They corroborate the dissimilarity of the West Kunlun and North Pamir arc volcanic rocks and therefore argue against the existence of a continuous Paleozoic suture extending from the Pamir to the West Kunlun.
Recent studies on the Gissar and Kyzylkum segment of the South Tien Shan (STS) of Uzbekistan (Fig. 1), west of the North Pamir, document the presence of early Carboniferous metamorphism and constrain the volcanic age of meta-basalts from the northern Kyzylkum segment by zircon U–Pb dating to 320–300 Ma (Konopelko et al., 2019, and references therein). This is coeval with arc magmatic activity along the North Pamir arc. Konopelko et al. (2019) propose an archipelago model for the late Paleozoic suture zones in the STS, characterized by high-temperature metamorphism, rapid exhumation, and multiple subduction zones. This archipelago might have been connected to the Paleo-Tethys realm. We argue for a North Pamir arc continuing from the northeastern Pamir into the Tajik northwestern Pamir and the Gissar segment of the South Tien Shan.
Calcite phases in Paleozoic ocean floor volcanic rocks were studied with LA-ICP-MS. From four samples, we investigated a total of 18 laser ablation areas. Although systematic errors of lower intercept ages could be small (as low as < 1 % at 2σ), we focus on propagated errors because they include the long-term variance of the reference materials, the analytical error of the monitor standard, and other important sources of errors. Three ablation areas yielded high-quality lower intercept ages, 331 ± 15 Ma (17NP436a_A), 339 ± 17 Ma (17NP436b_A), and 328 ± 16 Ma (17NP436b_C), each with MSWD < 2 and propagated 2σ error < 10 %, which we interpret as representing the timing of individual geologic events. The majority of the remaining ablation area ages from volcanic breccia samples 17NP436a and 17NP436b as well as vesicular basalt sample 15NP233 overlap with this age within propagated 2σ errors. They show slightly elevated MSWDs, implying that they are mixed ages. Sample 15NP236 has the most complex age results, possibly caused by more severe disturbance of the isotope ratios by younger events. Ages of samples 17NP436a, 17NP436b, and 15NP233 agree with existing radiometric ages of correlative volcanic units in the North Pamir, demonstrating that calcite formed during ocean floor volcanism, due to coeval or subsequent ocean floor alteration, provides a valuable age constraint on the timing of volcanism. We note that these calcite ages do not directly date the formation of these volcanic rock but provide minimum age constraints within a time span of about 25 Myr of ocean floor alteration.
Age data must be evaluated in the light of detailed petrographic analysis, including petrographic microscopy and cathodoluminescence microscopy, as well as geochemistry of the investigated calcite. Geochemical data support our hypothesis of an ocean floor alteration-related origin of the investigated calcite. However, we underline that interpretation of REE content in calcite is not straightforward, since the trace element uptake by calcite is dependent on a multitude of factors.
The presence of Middle to Upper Mississippian ocean floor in the North Pamir argues against models invoking a continuous, early Paleozoic Kunlun belt, stretching from the West Kunlun far into the North Pamir. Instead, they support the presence of a mid to late Carboniferous volcanic arc system, tying the North Pamir more to comparative units in the Tien Shan.
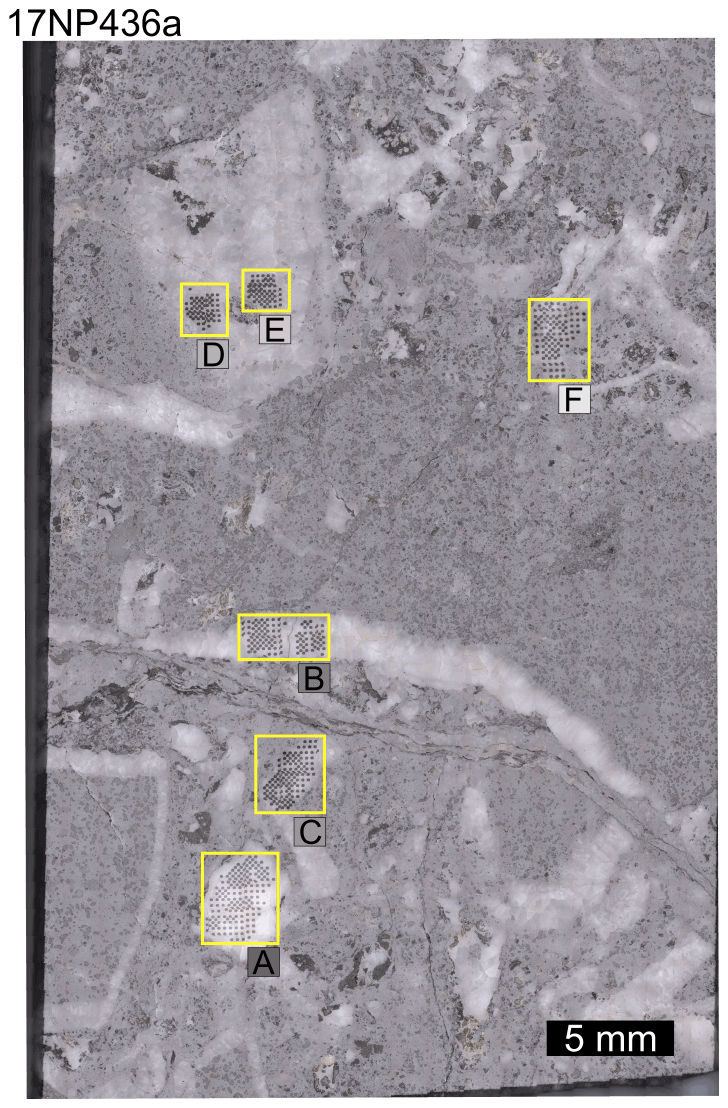
Figure A1Reflected light image of sample 17NP436a with marked ablation areas. Letter, attached to the yellow boxes, appended to the sample name, labels the ablation areas. Colors of label boxes are consistent with colors of in-text figures.

Figure A2Reflected light image of sample 17NP436b with marked ablation areas. Letter, attached to the yellow boxes, appended to the sample name, labels the ablation areas. Colors of label boxes are consistent with colors of in-text figures.
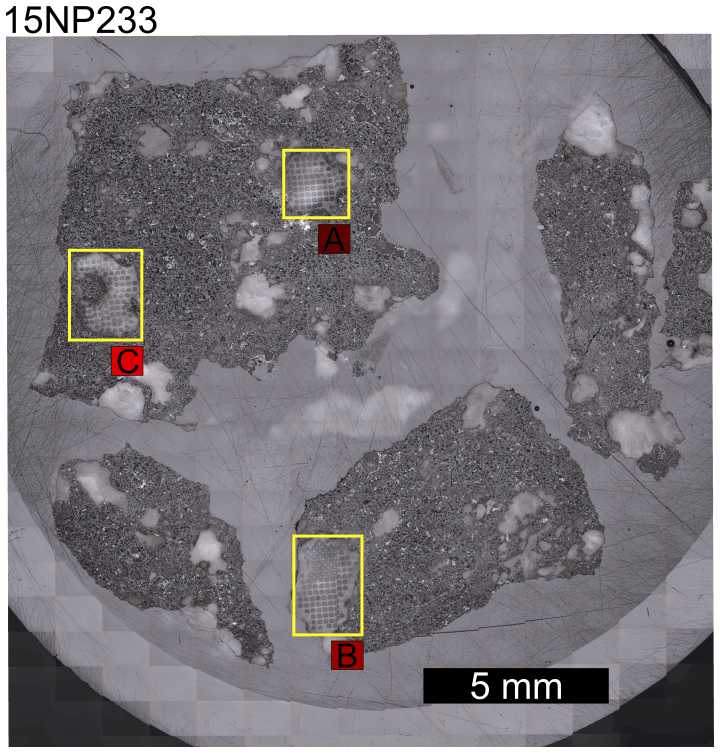
Figure A3Reflected light image of sample 15NP233 with marked ablation areas. Letter, attached to the yellow boxes, appended to the sample name, labels the ablation areas. Colors of label boxes are consistent with colors of in-text figures.
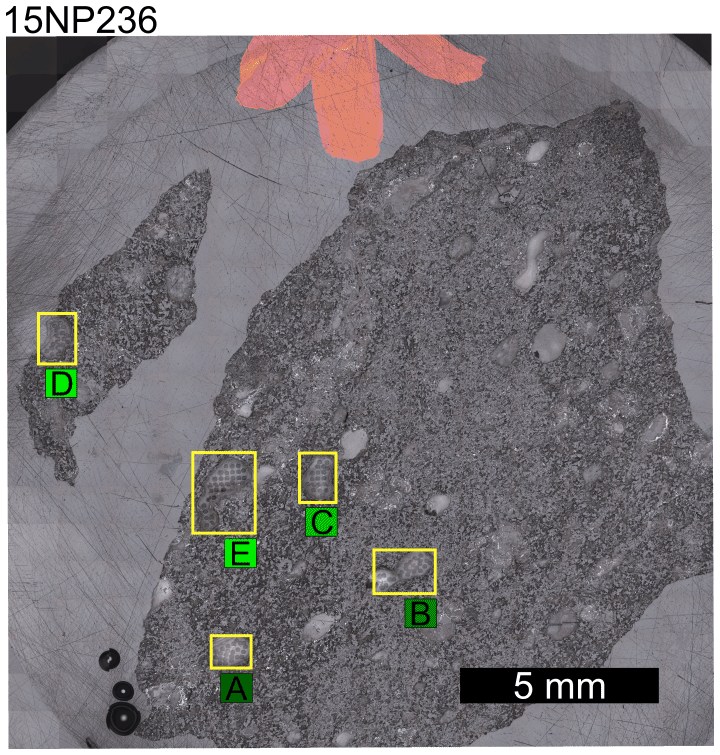
Figure A4Reflected light image of sample 15NP236 with marked ablation areas. Letter, attached to the yellow boxes, appended to the sample name, labels the ablation areas. Colors of label boxes are consistent with colors of in-text figures.
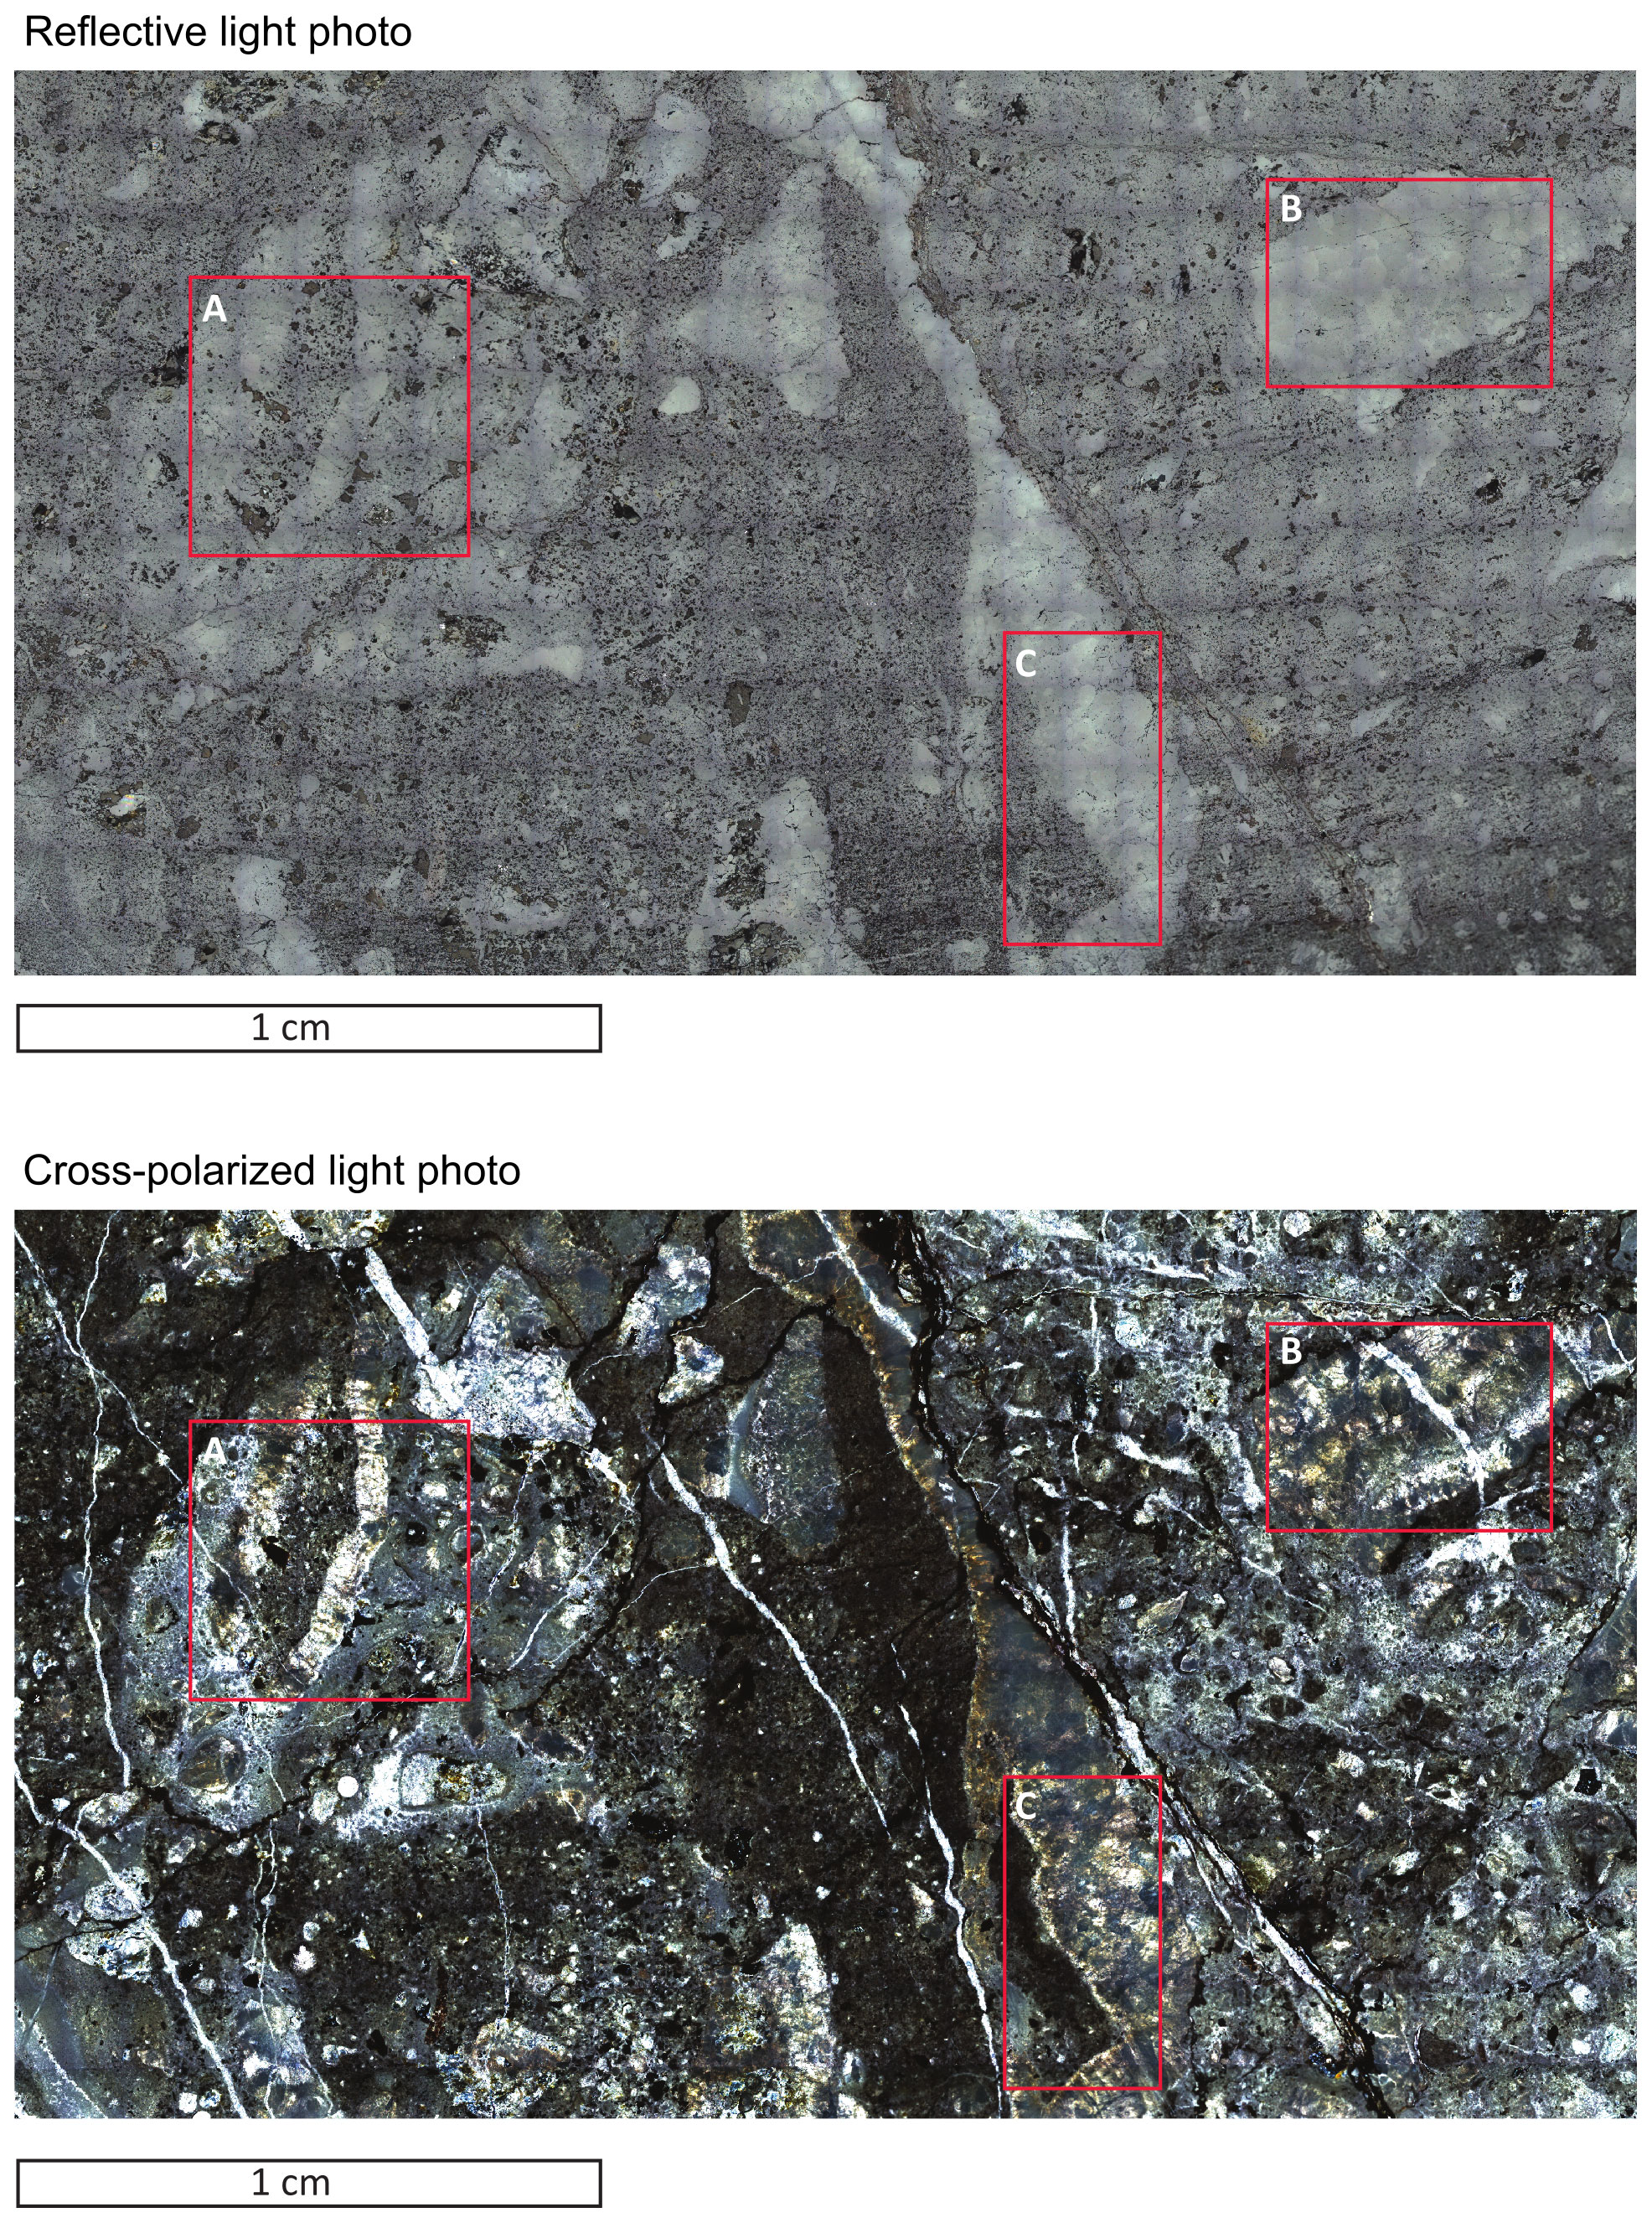
Figure B1Reflected light image and cross-polarized light image of the investigation area on sample 17NP436a.
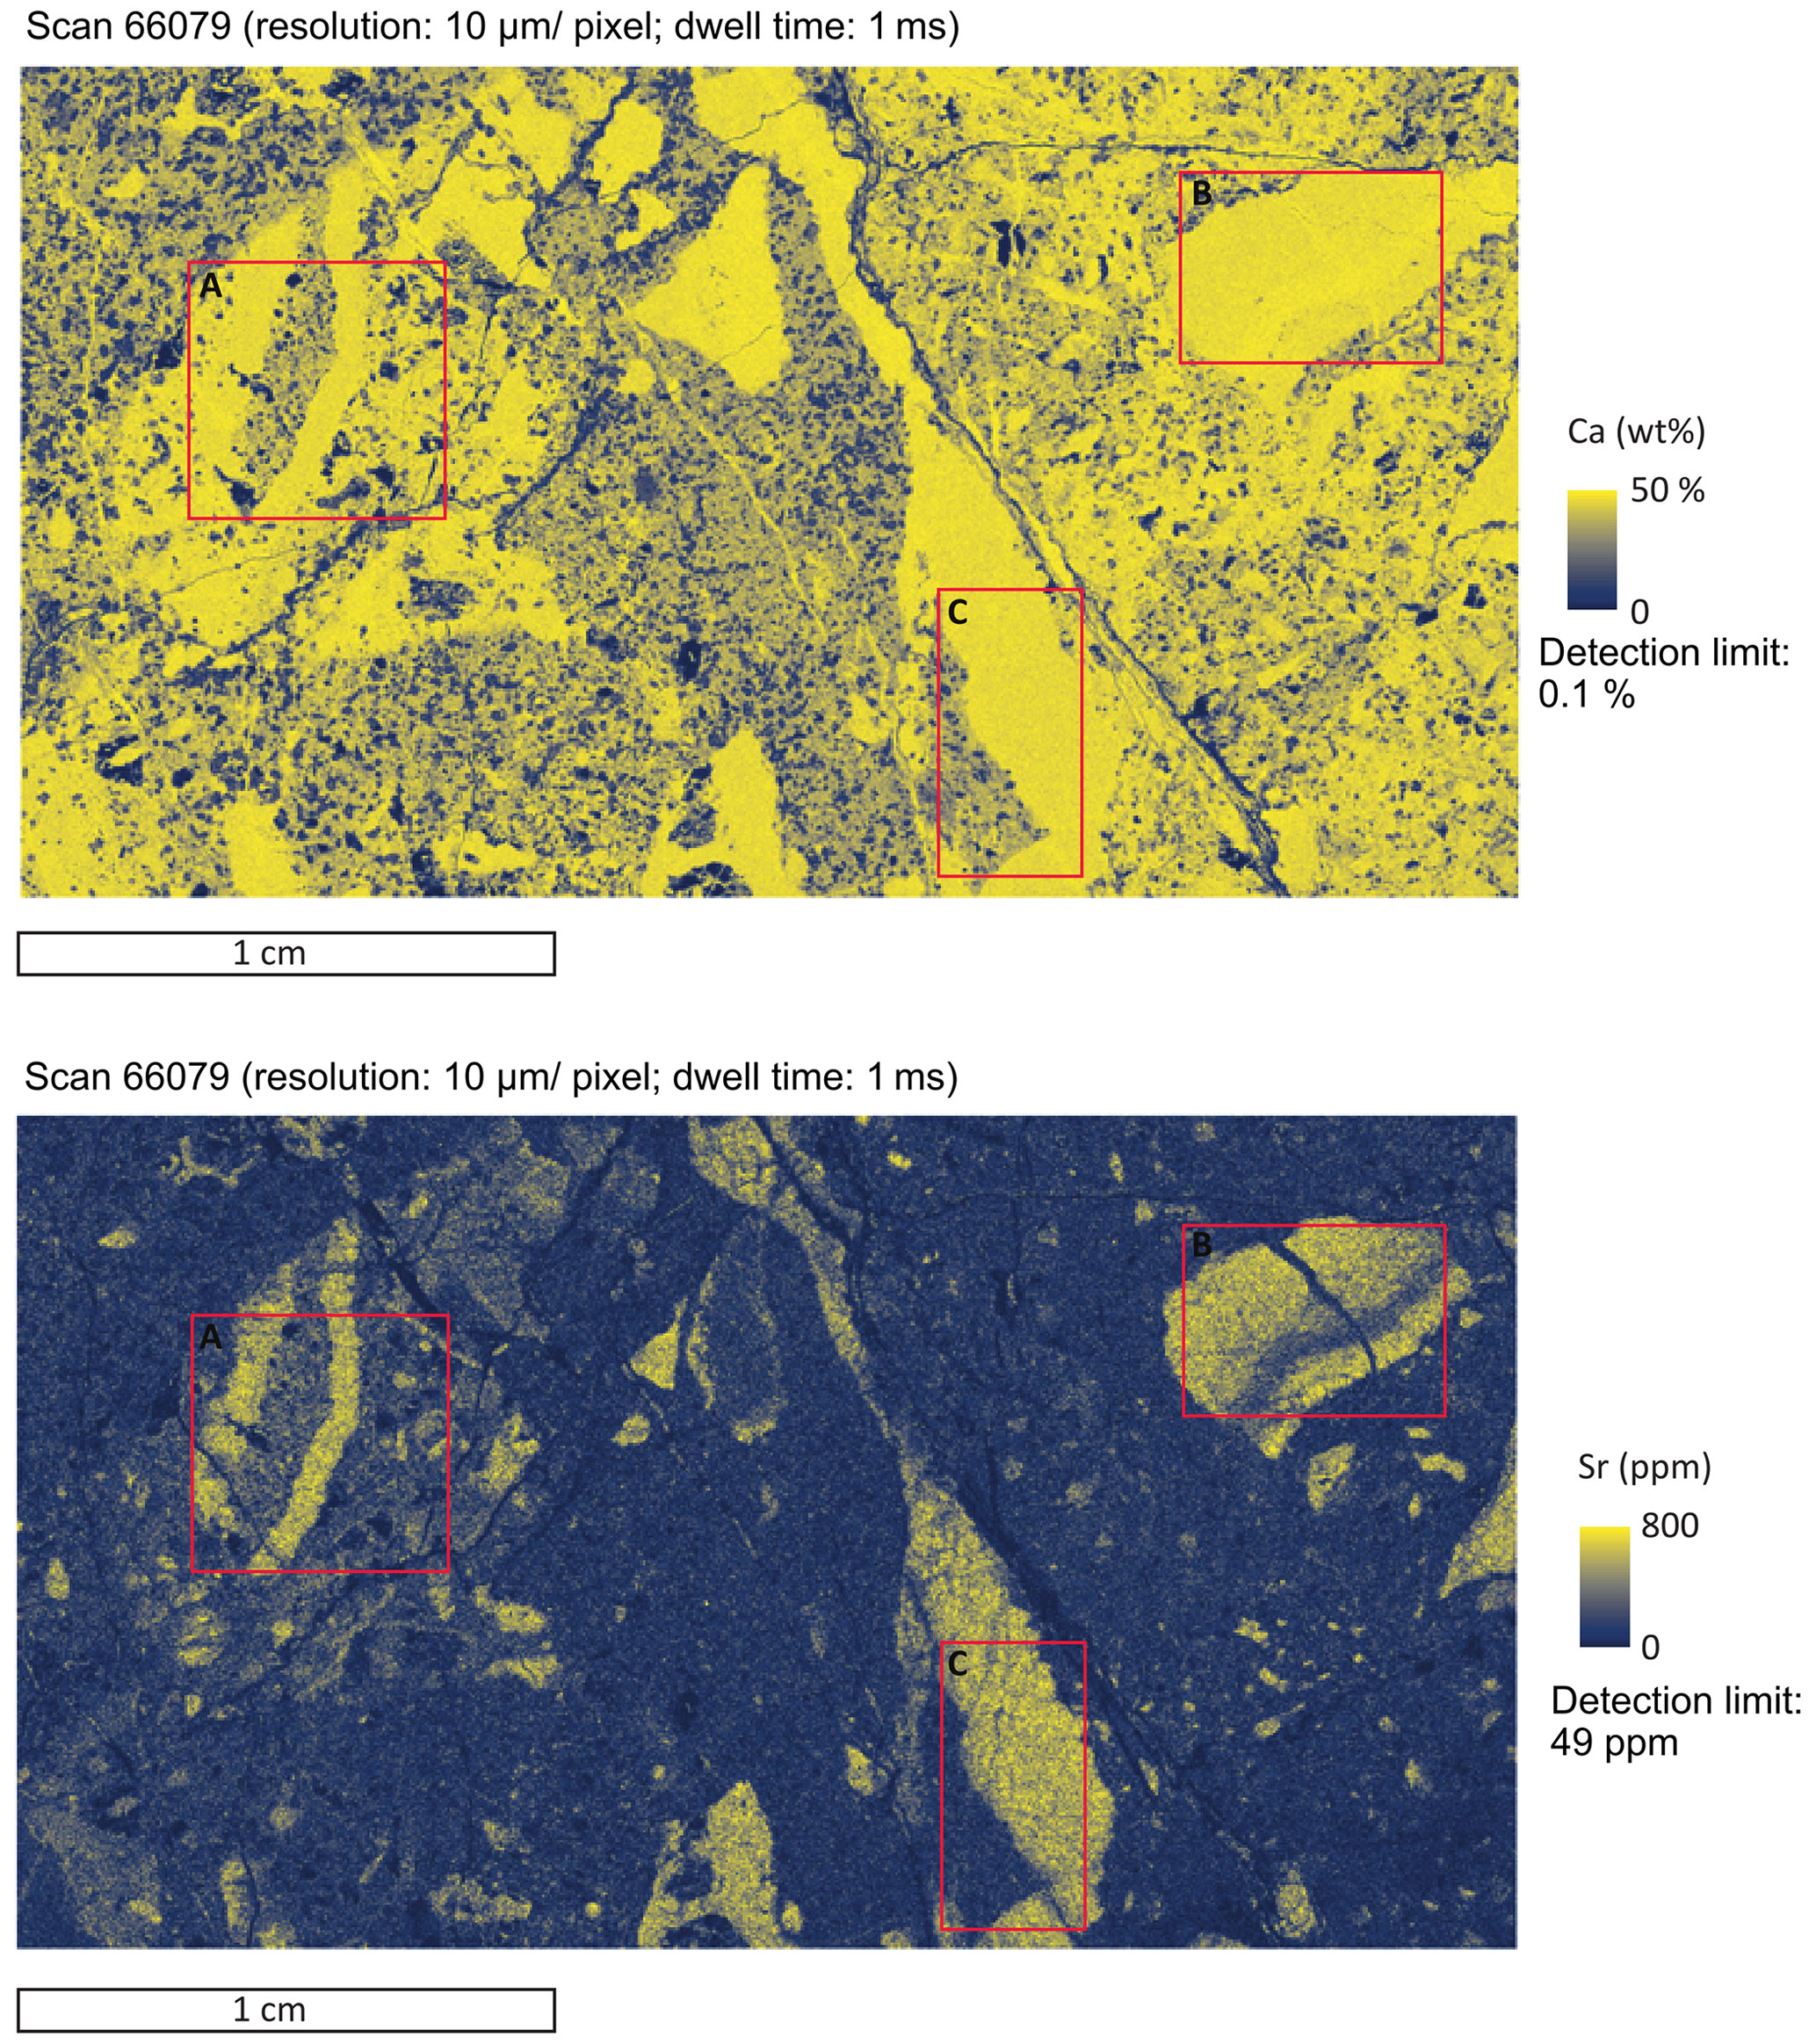
Figure B2Coarse scan of the investigation areas on sample 17NP436a for Ca and Sr. Area A shows a rock fragment fringed by radial-fibrous calcite cement. The right fissure shows calcite growing from both walls toward the center, showing lower Sr values in the center of the vein. Area B shows an isolated fragment of radial fibrous to equant cement with Sr and Ca zoning. High Sr/low Ca values occur in the radial-fibrous calcite along the lower-right boundary with an abrupt change to low Sr/high Ca values in the center that grade into high Sr/low Ca values in a broad zone along the upper-left boundary. The low Sr/high Ca values occur at the transition from radial fibrous to equant calcite crystals. A younger calcite-filled fissure crosscuts the calcite cement fragment. Crucial are the much lower Sr values. This fissure formed during tectonic straining of the rock, pressure solution, and reprecipitation of calcite. Area C shows calcite crystals with highest Sr/lowest Ca values in the center of the single crystals.


Figure C1Rare earth element plots of each individual ablation area for sample 17NP436a. Grey shaded area in each diagram represents the range of chondrite-normalized REE concentrations in all calcite ablation spots.
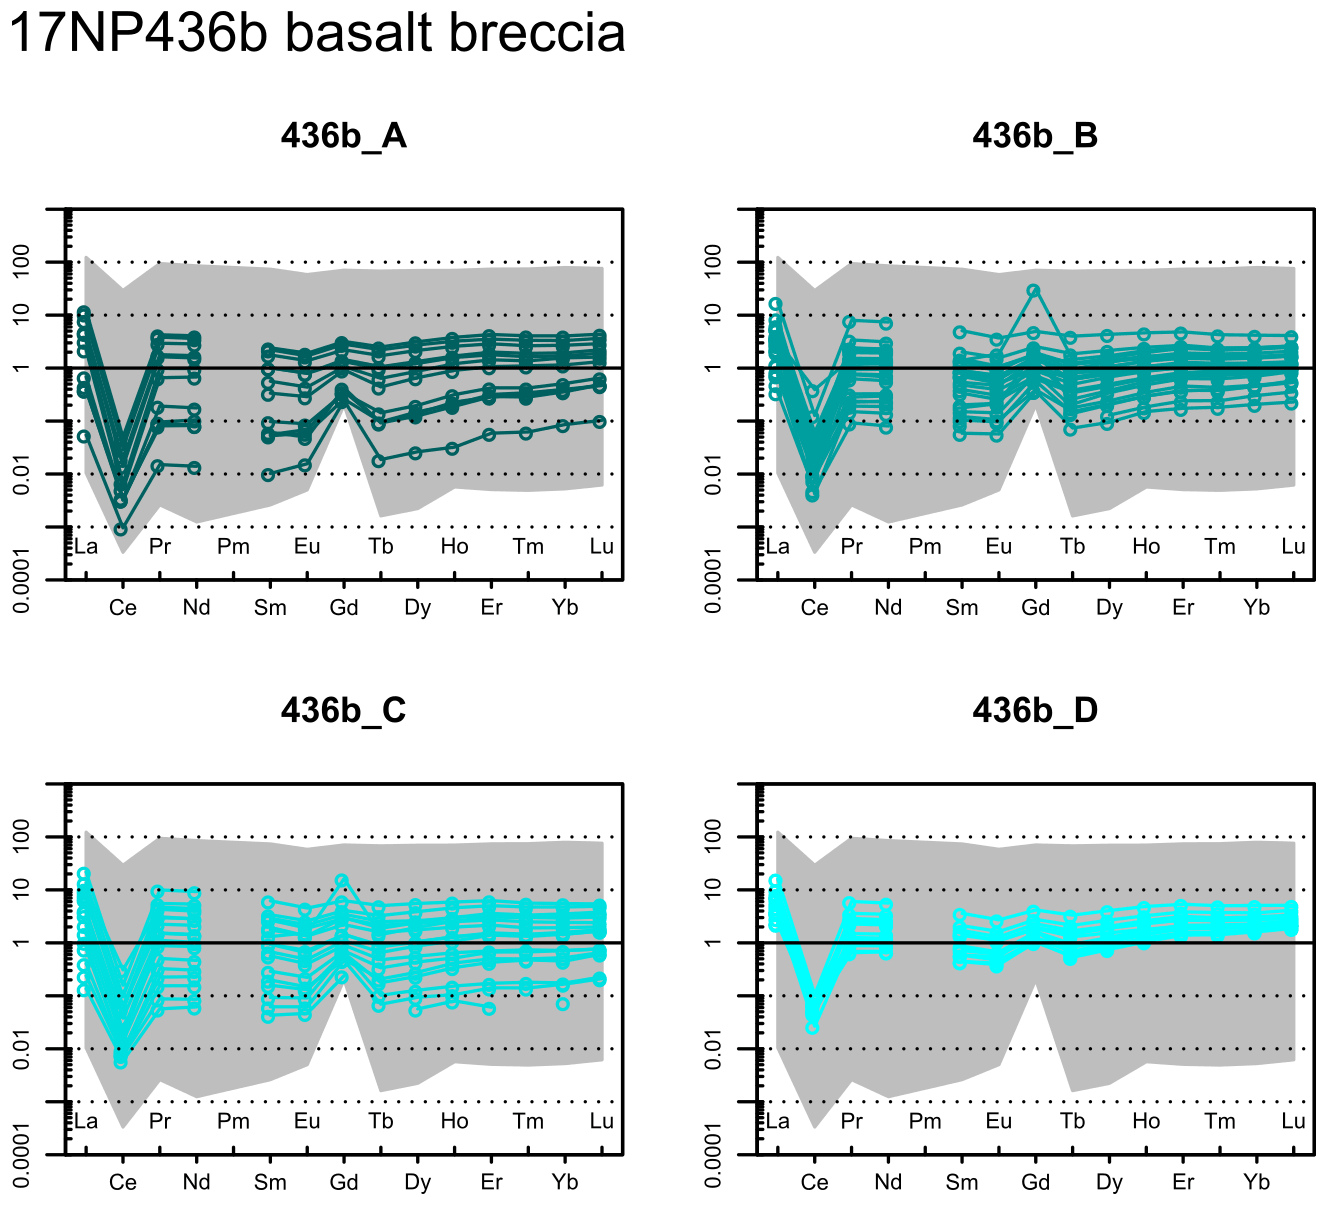
Figure C2Rare earth element plots of each individual ablation area for sample 17NP436b. Grey shaded area in each diagram represents the range of chondrite-normalized REE concentrations in all calcite ablation spots.
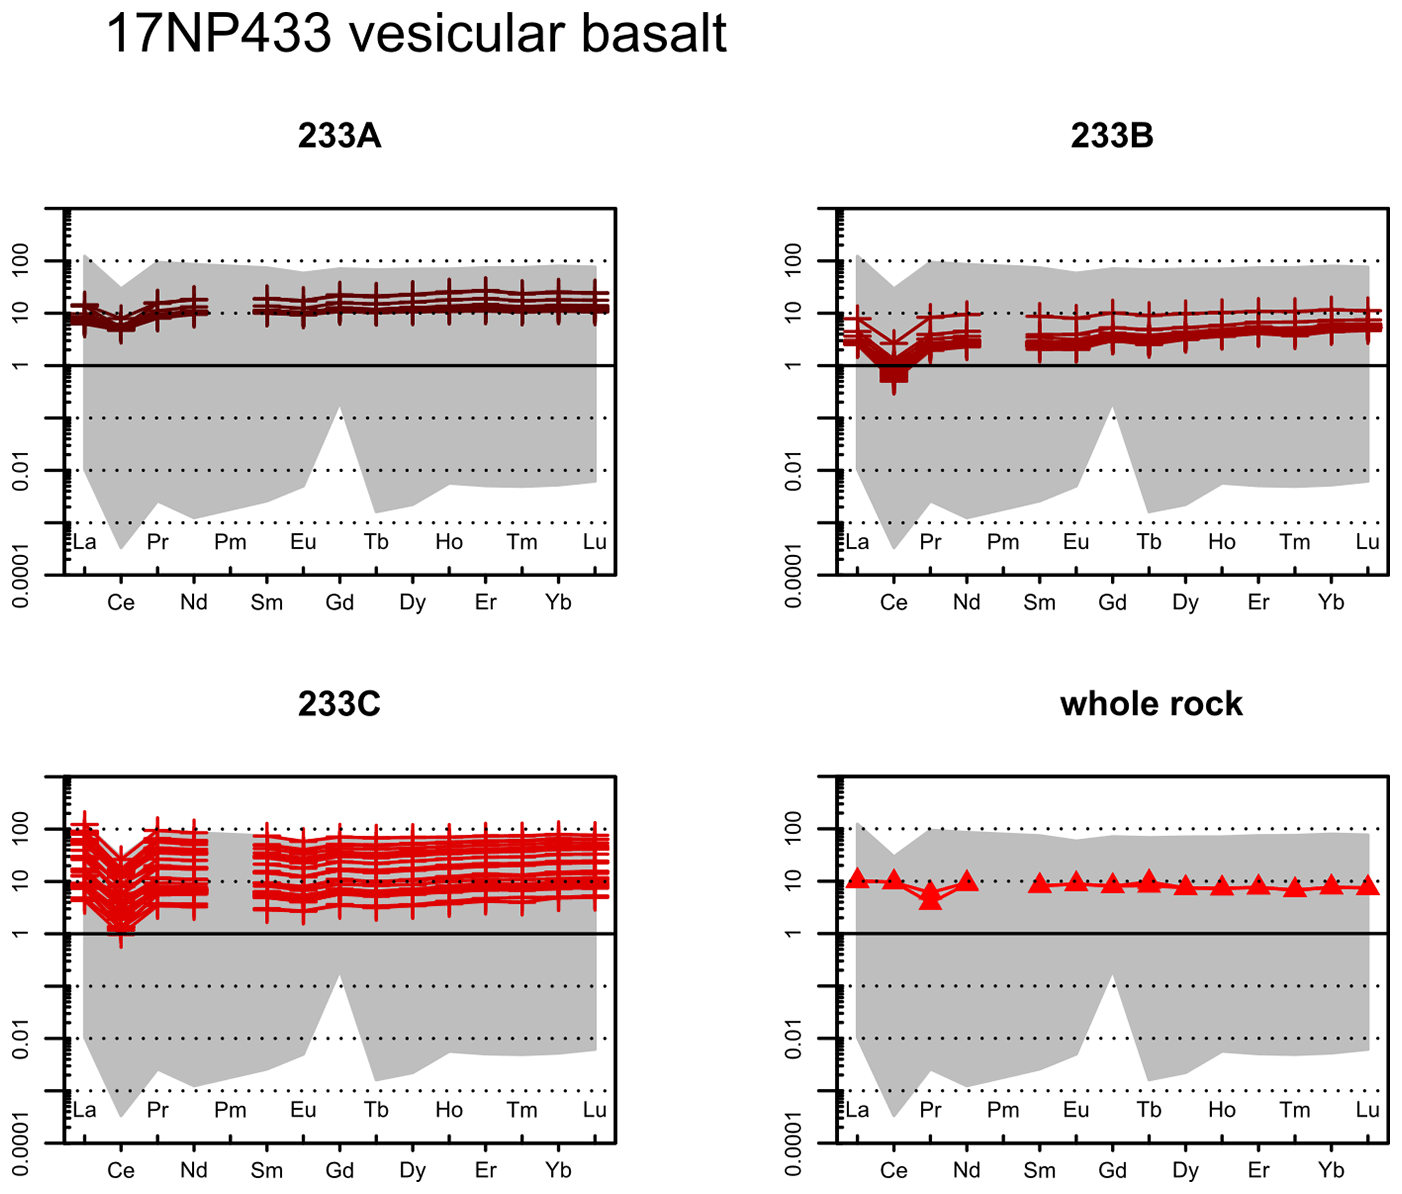
Figure C3Rare earth element plots of each individual ablation area for sample 15NP233. Whole rock data from Rembe et al. (2021). Grey shaded area in each diagram represents the range of chondrite-normalized REE concentrations in all calcite ablation spots.
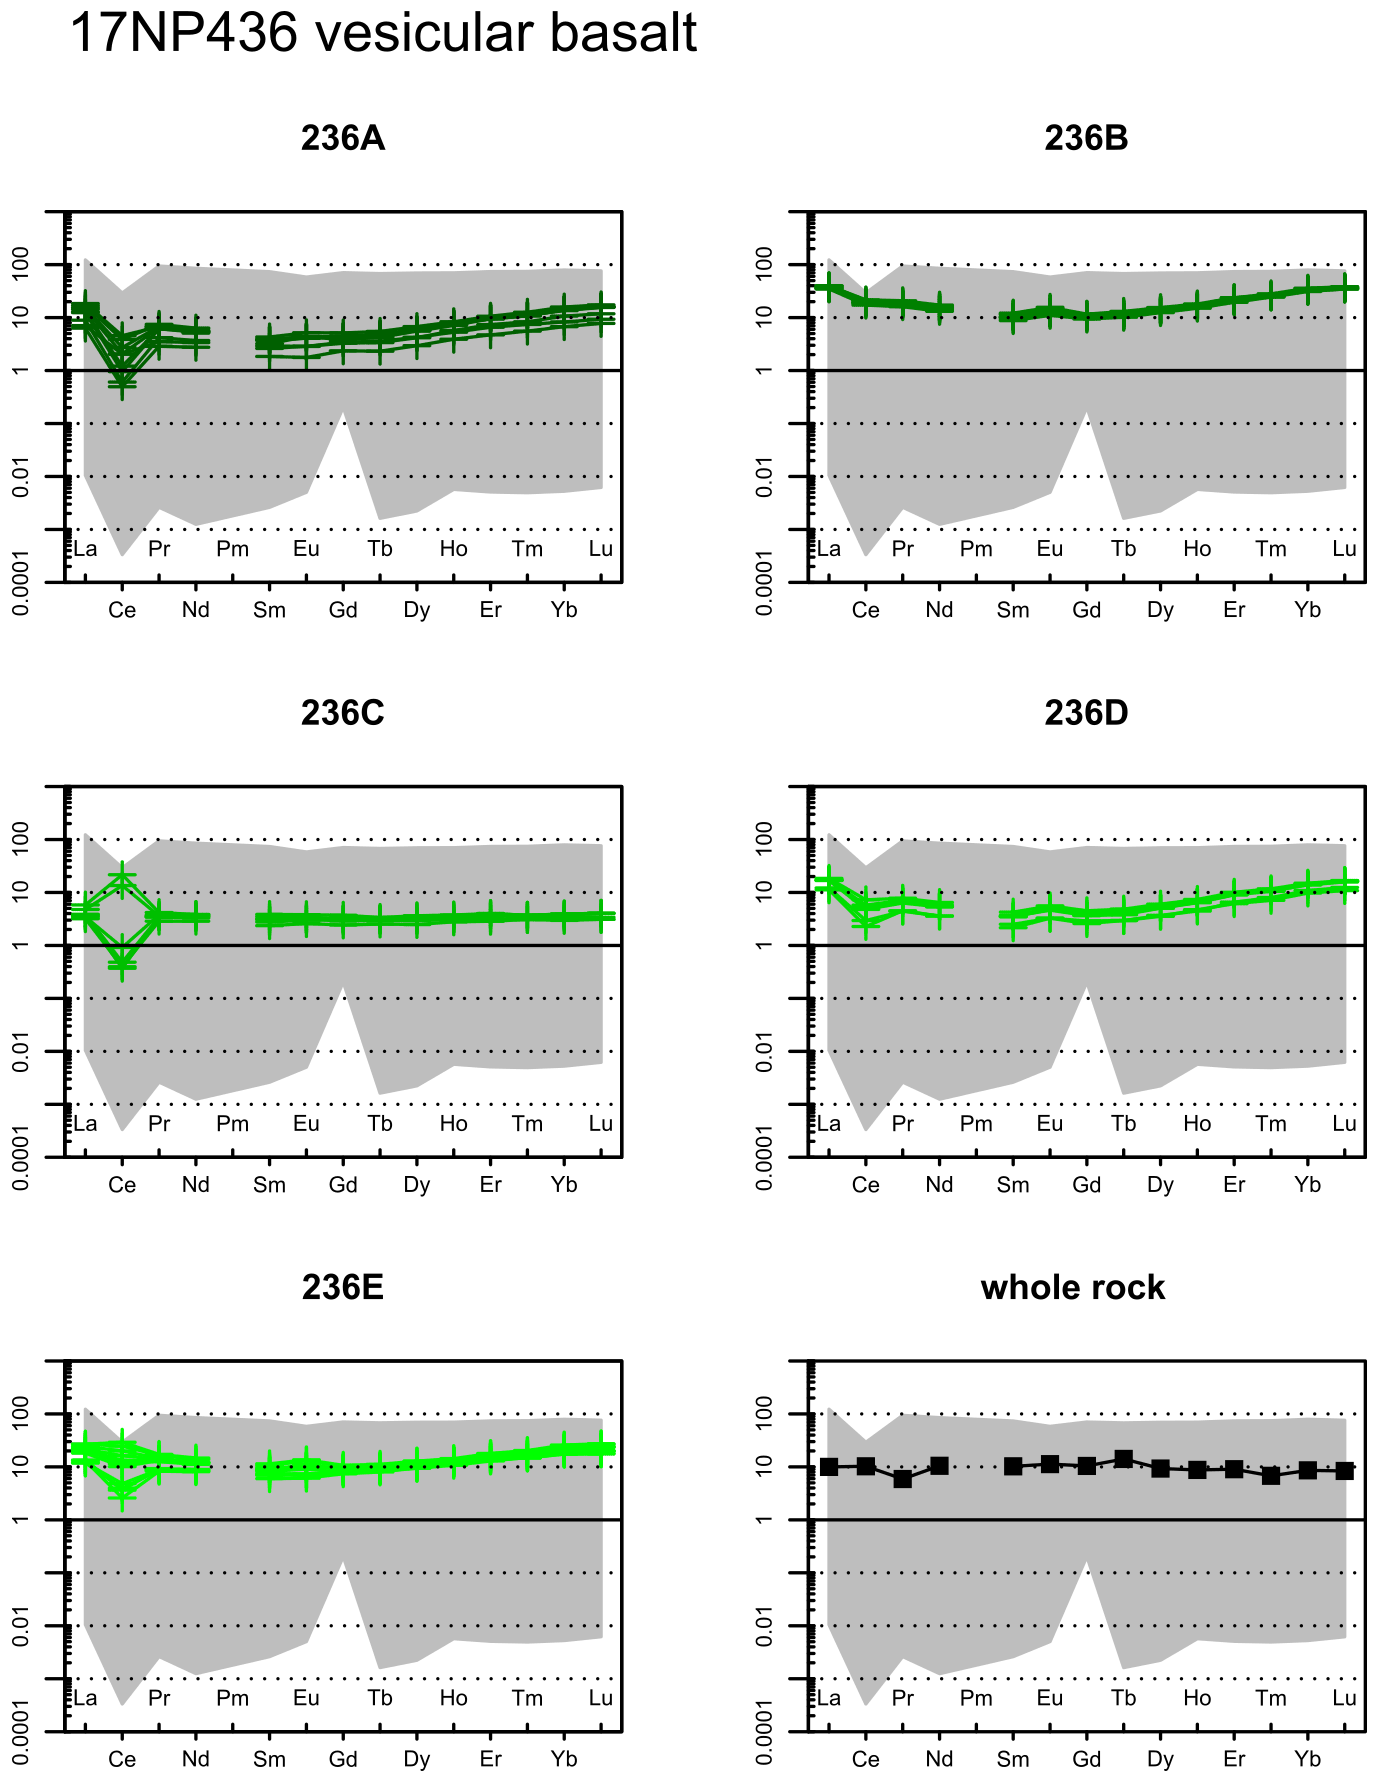
Figure C4Rare earth element plots of each individual ablation area for sample 15NP236. Whole rock data from Rembe et al. (2021). Grey shaded area in each diagram represents the range of chondrite-normalized REE concentrations in all calcite ablation spots.
Whole rock geochemistry data used from literature (Rembe et al., 2021; Table S1 in the Supplement) as well as LA-ICP-MS isotope data (Table S2) and geochemistry (Table S3) were uploaded to UQ eSpace (https://doi.org/10.48610/8dba1c2, Rembe et al., 2022), run by The University of Queensland.
The supplement related to this article is available online at: https://doi.org/10.5194/gchron-4-227-2022-supplement.
JR, RZ, ERS, and JK conceptualized the project. Fieldwork was carried out by JR, ERS, JK, and JC. Methodological concept preparation, laboratory work, and data interpretation were done by RZ, JR, JXZ, YF, and DLH. JR prepared a first draft of the manuscript, and all authors contributed to the review and editing procedure.
The contact author has declared that neither they nor their co-authors have any competing interests.
Publisher's note: Copernicus Publications remains neutral with regard to jurisdictional claims in published maps and institutional affiliations.
We thank Langtao Liu for help with fieldwork, and Antje Musiol and Baiansuluu Terbishalieva for support with laboratory work at the University of Potsdam. We are thankful for suggestions and constructive comments of Dimitry Konopelko, Alexander Robinson, and an anonymous reviewer. We also thank the editor, Daniela Rubatto, for the assistance and the handling of the manuscript.
The project was funded by Deutsche Forschungsgemeinschaft e.V. (DFG) grant SO 436/12-1 to Edward R. Sobel and DFG grant KL 495/27-1 to Jonas Kley. Additional support was provided by grants to Edward R. Sobel, Jian-Xin Zhao, and Renjie Zhou through the Australia–Germany Joint Research Cooperation Scheme, to Daryl L. Howard and Renjie Zhou through the Australian Synchrotron Access Program and to Renjie Zhou through a UQ ECR grant. Jie Chen was supported by grants through the Second Tibetan Plateau Scientific Expedition and Research Program (STEP, 2019QZKK0901) and State Key Laboratory of Earthquake Dynamics of China (LED2016A05).
This research has been supported by the Deutsche Forschungsgemeinschaft (grant nos. SO 436/12-1 and KL 495/27-1), the Deutscher Akademischer Austauschdienst (grant no. 2016001932), the Australian Nuclear Science and Technology Organisation (grant no. AS2/XFM/16307), the Ministry of Science and Technology of the People's Republic of China through the Second Tibetan Plateau Scientific Expedition and Research Program (STEP) (grant no. 2019QZKK0901), the State Key Laboratory of Earthquake Dynamics of China (grant no. LED2016A05), and a UQ ECR grant.
This paper was edited by Daniela Rubatto and reviewed by Alexander Robinson, Dimitry Konopelko, and one anonymous referee.
Alibo, D. S. and Nozaki, Y.: Rare earth elements in seawater: particle association, shale-normalization, and Ce oxidation, Geochim. Cosmochim. Ac., 63, 363–372, https://doi.org/10.1016/S0016-7037(98)00279-8, 1999.
Anders, E. and Grevesse, N.: Abundances of the elements: Meteoritic and solar, Geochim. Cosmochim. Ac., 53, 197–214, 1989.
Baar, H. J. de, Brewer, P. G., and Bacon, M. P.: Anomalies in rare earth distributions in seawater: Gd and Tb, Geochim. Cosmochim. Ac., 49, 1961–1969, https://doi.org/10.1016/0016-7037(85)90090-0, 1985.
Bazhenov, M. L. and Burtman, V. S.: The kinematics of the Pamir arc, Geotectonics, 16, 288–301, 1982.
Boynton, W. V.: Cosmochemistry of the rare earth elements: meteorite studies, in: Developments in geochemistry, Elsevier, 2, 63–114, https://doi.org/10.1016/B978-0-444-42148-7.50008-3, 1984.
Burtman, V. S. and Molnar, P. H.: Geological and geophysical evidence for deep subduction of continental crust beneath the Pamir, Geological Society of America, https://doi.org/10.1130/SPE281-p1, 1993.
Burtman, V. S., Peive, A. V., and Ruzhentsev, S. V.: The main lateral faults of the Tien Shan and Pamir, in: Faults and Horizontal Movements of the Earth's Crust, USSR Academy of Sciences, Moskow, Russia, 152–172, 1963.
Cohen, K. M., Finney, S. C., Gibbard, P. L., and Fan, J.-X.: The ICS International Chronostratigraphic Chart, Episodes, 36, 199–204, 2013.
Coogan, L. A. and Gillis, K. M.: Low-Temperature Alteration of the Seafloor: Impacts on Ocean Chemistry, Annu. Rev. Earth Pl. Sc., 46, 21–45, 2018.
Coogan, L. A., Parrish, R. R., and Roberts, N. M. W.: Early hydrothermal carbon uptake by the upper oceanic crust: Insight from in situ U-Pb dating, Geology, 44, 147–150, 2016.
Debruyne, D., Hulsbosch, N., and Muchez, P.: Unraveling rare earth element signatures in hydrothermal carbonate minerals using a source–sink system, Ore Geol. Rev., 72, 232–252, 2016.
Fisher, A. T. and Becker, K.: Channelized fluid flow in oceanic crust reconciles heat-flow and permeability data, Nature, 403, 71–74, 2000.
Godeau, N., Deschamps, P., Guihou, A., Leonide, P., Tendil, A., Gerdes, A., Hamelin, B., and Girard, J.-P.: U-Pb dating of calcite cement and diagenetic history in microporous carbonate reservoirs: Case of the Urgonian Limestone, France, Geology, 46, 247–250, 2018.
Gonzalez, L. A., Carpenter, S. J., and Lohmann, K. C.: Inorganic calcite morphology; roles of fluid chemistry and fluid flow, J. Sediment. Res., 62, 382–399, 1992.
Harlov, D. E. and Austrheim, H. (Eds.): Metasomatism and the chemical transformation of rock: The role of fluids in terrestrial and extraterrestrial processes, Lecture notes in earth system sciences, 2193–8571, Springer, Heidelberg, London, https://doi.org/10.1007/978-3-642-28394-9, 2013.
Heath, M., Phillips, D., and Matchan, E. L.: An evidence-based approach to accurate interpretation of ages from basaltic rocks, Earth Planet. Sc. Lett.s, 498, 65–76, 2018.
Henan Institute of Geological Survey: The 1 : 250 000 Geological Map of the Peoples Republic of China (J43C001002, Kuergan), China Coal Xi' and Map Printing Co., Ltd., map ID J43C001002, 2014.
Honnorez, J.: Hydrothermal alteration vs. ocean-floor metamorphism. A comparison between two case histories: the TAG hydrothermal mound (Mid-Atlantic Ridge) vs. DSDP/ODP Hole 504B (Equatorial East Pacific), C. R. Geosci., 335, 781–824, 2003.
Horstwood, M. S. A., Košler, J., Gehrels, G., Jackson, S. E., McLean, N. M., Paton, C., Pearson, N. J., Sircombe, K., Sylvester, P., and Vermeesch, P.: Community-derived standards for LA-ICP-MS U-(Th-) Pb geochronology–Uncertainty propagation, age interpretation and data reporting, Geostand. Geoanal. Res., 40, 311–332, 2016.
Howard, D. L., de Jonge, M. D., Afshar, N., Ryan, C. G., Kirkham, R., Reinhardt, J., Kewish, C. M., McKinlay, J., Walsh, A., and Divitcos, J.: The XFM beamline at the Australian Synchrotron, J. Synchrotron Radiat., 27, 1447–1458, 2020.
Ji, W. H., Chen, S. J., Li, R. S., He, S. P., Zhao, Z. M., and Pan, X. P.: The origin of Carboniferous-Permian magmatic rocks in Oytag area, West Kunlun: Back-arc basin?, Acta Petrol. Sin, 34, 2393–2409, 2018.
Jiang, C. F.: Opening-closing tectonics of Kunlun Mountains, Geol. Memoirs. MGMR, 12, 1–224, 1992.
Jiang, Y.-H., Liao, S.-Y., Yang, W.-Z., and Shen, W.-Z.: An island arc origin of plagiogranites at Oytag, western Kunlun orogen, northwest China: SHRIMP zircon U–Pb chronology, elemental and Sr–Nd–Hf isotopic geochemistry and Paleozoic tectonic implications, Lithos, 106, 323–335, https://doi.org/10.1016/j.lithos.2008.08.004, 2008.
Kang, L., Xiao, P. X., Gao, X. F., Wang, C., Yang, Z. C., and Xi, R. G.: Geochemical characteristics, petrogenesis and tectonic setting of oceanic plagiogranites belt in the northwestern margin of western Kunlun, Acta Petrol. Sin, 31, 2566–2582, 2015.
Konopelko, D., Biske, Y. S., Kullerud, K., Ganiev, I., Seltmann, R., Brownscombe, W., Mirkamalov, R., Wang, B., Safonova, I., and Kotler, P.: Early Carboniferous metamorphism of the Neoproterozoic South Tien Shan-Karakum basement: New geochronological results from Baisun and Kyzylkum, Uzbekistan, J. Asian Earth Sci., 177, 275–286, 2019.
Lan, Z., Roberts, N. M. W., Zhou, Y., Zhang, S., Li, Z., and Zhao, T.: Application of in situ U-Pb carbonate geochronology to Stenian-Tonian successions of North China, Precambrian Res., 370, 106551, 2022.
Li, B., Yao, J., Ji, W. H., Zhang, J., Yin, Z., Chen, G., Lin, X., Zhang, Q., KONG, W., Wang, F., and Liu, X.: Characteristics and zircon SHRIMP U-Pb ages of the arc magmatic rocks in Mazar, southern Yecheng, West Kunlun Mountains., Geological Bulletin of China, Z1, 124–132, 2006.
Li, Y.-P., Robinson, A. C., Lapen, T. J., Righter, M., and Stevens, M. K.: Muztaghata Dome Miocene Eclogite Facies Metamorphism: A Record of Lower Crustal Evolution of the NE Pamir, Tectonics, 39, e2019TC005917, https://doi.org/10.1029/2019TC005917, 2020.
Liu, Z., Jiang, Y.-H., Jia, R.-Y., Zhao, P., Zhou, Q., Wang, G.-C., and Ni, C.-Y.: Origin of Middle Cambrian and Late Silurian potassic granitoids from the western Kunlun orogen, northwest China: a magmatic response to the Proto-Tethys evolution, Miner. Petrol., 108, 91–110, 2014.
Mattern, F., Schneider, W., Li, Y., and Li, X.: A traverse through the western Kunlun (Xinjiang, China): Tentative geodynamic implications for the Paleozoic and Mesozoic, Geol. Rundsch., 85, 705–722, 1996.
May, T. W. and Wiedmeyer, R. H.: A table of polyatomic interferences in ICP-MS, Atom. Spectrosc., 19, 150–155, 1998.
Möller, P., Rosenthal, E., Geyer, S., Guttman, J., Dulski, P., Rybakov, M., Zilberbrand, M., Jahnke, C., and Flexer, A.: Hydrochemical processes in the lower Jordan valley and in the Dead Sea area, Chem. Geol., 239, 27–49, 2007.
Nuriel, P., Craddock, J., Kylander-Clark, A. R. C., Uysal, I. T., Karabacak, V., Dirik, R. K., Hacker, B. R., and Weinberger, R.: Reactivation history of the North Anatolian fault zone based on calcite age-strain analyses, Geology, 47, 465–469, 2019.
Pan, Y.: Discovery and evidence of the fifth suture zone of Qinghai-xizang plateau, Sinica, 37, 184–192, 1994.
Paton, C., Hellstrom, J., Paul, B., Woodhead, J., and Hergt, J.: Iolite: Freeware for the visualisation and processing of mass spectrometric data, J. Anal. Atom. Spectrom., 26, 2508–2518, 2011.
Perry, E. P. and Gysi, A. P.: Rare Earth Elements in Mineral Deposits: Speciation in Hydrothermal Fluids and Partitioning in Calcite, Geofluids, 2018, 1–19, https://doi.org/10.1155/2018/5382480, 2018.
Pringle, M. S.: Age progressive volcanism in the Musicians seamounts: a test of the hot spot hypothesis for the late Cretaceous Pacific. Washington DC American Geophysical Union Geophysical Monograph Series, 77, 187–215, 1993.
Rasbury, E. T., Present, T. M., Northrup, P., Tappero, R. V., Lanzirotti, A., Cole, J. M., Wooton, K. M., and Hatton, K.: Tools for uranium characterization in carbonate samples: case studies of natural U–Pb geochronology reference materials, Geochronology, 3, 103–122, https://doi.org/10.5194/gchron-3-103-2021, 2021.
Rembe, J., Sobel, E. R., Kley, J., Zhou, R., Thiede, R., and Chen, J.: The Carboniferous Arc of the North Pamir, Lithosphere, 2021, 6697858, https://doi.org/10.2113/2021/6697858, 2021.
Rembe, J., Zhou, R., Sobel, E. R., Kley, J., Chen, J., Zhao, J.-X., Feng, Y., and Howard, D. L.: Supplementary files: Calcite U–Pb dating of altered ancient oceanic crust in the North Pamir, Central Asia, The University of Queensland [data set], https://doi.org/10.48610/8dba1c2, 2022.
Roberts, N. M. W., Rasbury, E. T., Parrish, R. R., Smith, C. J., Horstwood, M. S. A., and Condon, D. J.: A calcite reference material for LA-ICP-MS U-Pb geochronology, Geochem. Geophy. Geosy., 18, 2807–2814, https://doi.org/10.1002/2016GC006784, 2017.
Roberts, N. M. W., Žák, J., Vacek, F., and Sláma, J.: No more blind dates with calcite: Fluid-flow vs. fault-slip along the Očkov thrust, Prague Basin, Geosci. Front., 12, 101143, 2021.
Ruzhentsev, S., Pospelov, I., and Sukhanov, A. N.: Tectonics of Khalaihumb-Sauksau zone of the North Pamir, Geotectonics, 4, 68–80, 1977.
Schwab, M., Ratschbacher, L., Siebel, W., McWilliams, M., Minaev, V., Lutkov, V., Chen, F., Stanek, K., Nelson, B., Frisch, W., and Wooden, J. L.: Assembly of the Pamirs: Age and origin of magmatic belts from the southern Tien Shan to the southern Pamirs and their relation to Tibet, Tectonics, 23, TC4002, https://doi.org/10.1029/2003TC001583, 2004.
Spivack, A. J. and Staudigel, H.: Low-temperature alteration of the upper oceanic crust and the alkalinity budget of seawater, Chem. Geol., 115, 239–247, 1994.
Staudigel, H., Plank, T., White, B., and Schmincke, H.-U.: Geochemical Fluxes During Seafloor Alteration of the Basaltic Upper Oceanic Crust: DSDP Sites 417 and 418, in: Subduction top to bottom, edited by: Bebout, G. E., Scholl, D. W., and Kirby, S. H., American Geophysical Union, Washington, 19–38, https://doi.org/10.1029/GM096p0019, 2013.
Su, A., Chen, H., Feng, Y., Zhao, J., Nguyen, A. D., Wang, Z., and Long, X.: Dating and characterizing primary gas accumulation in Precambrian dolomite reservoirs, Central Sichuan Basin, China: Insights from pyrobitumen Re-Os and dolomite U-Pb geochronology, Precambrian Res., 350, 105897, https://doi.org/10.1016/j.precamres.2020.105897, 2020.
Talbi, E. H. and Honnorez, J.: Low-temperature alteration of mesozoic oceanic crust, Ocean Drilling Program Leg 185, Geochem. Geophys. Geosyst., 4, 8906, https://doi.org/10.1029/2002GC000405, 2003.
Tang, W., Wang, S., Liu, Y., Yao, X., and Li, M.: Origin of Carboniferous intra-oceanic arc granitoids from the eastern Pamir and implications for the Paleo-Tethyan ocean, 204, 104558, https://doi.org/10.1016/j.jseaes.2020.104558, 2020.
Vanghi, V., Borsato, A., Frisia, S., Howard, D. L., Gloy, G., Hellstrom, J., and Bajo, P.: High-resolution synchrotron X-ray fluorescence investigation of calcite coralloid speleothems: Elemental incorporation and their potential as environmental archives, Sedimentology, 66, 2661–2685, 2019.
Vermeesch, P.: IsoplotR: a free and open toolbox for geochronology, Geosci. Front., 9, 1479–1493, 2018.
Voigt, M., Mavromatis, V., and Oelkers, E. H.: The experimental determination of REE partition coefficients in the water-calcite system, Chem. Geol., 462, 30–43, 2017.
Waagstein, R., Guise, P., and Rex, D.: K/Ar and whole-rock dating of zeolite facies metamorphosed flood basalts: the upper Paleocene basalts of the Faroe Islands, NE Atlantic, Geological Society, London, Special Publications, 197, 219–252, https://doi.org/10.1144/GSL.SP.2002.197.01.09, 2002.
Wang, P., Zhao, G., Han, Y., Liu, Q., Yao, J., Yu, S., and Li, J.: Timing of the final closure of the Proto-Tethys Ocean: Constraints from provenance of early Paleozoic sedimentary rocks in West Kunlun, NW China, Gondwana Res., 2020.
Wang, P., Zhao, G., Liu, Q., Han, Y., Zhang, Y., Yao, J., and Yu, S.: Slab-controlled progressive evolution of the Kudi back-arc ophiolite in response to the rollback of the Proto-Tethys oceanic slab, in Western Kunlun, NW Tibetan Plateau, Lithos, 380–381, 105877, 2021.
Woodhead, J. D. and Hergt, J. M.: Strontium, neodymium and lead isotope analyses of NIST glass certified reference materials: SRM 610, 612, 614, Geostandards Newslett., 25, 261–266, 2001.
Xiao, W. J., Windley, B. F., Chen, H. L., Zhang, G. C., and Li, J. L.: Carboniferous-Triassic subduction and accretion in the western Kunlun, China: Implications for the collisional and accretionary tectonics of the northern Tibetan Plateau, Geology, 30, 295–298, 2002.
Xiao, W. J., Windley, B. F., Liu, D. Y., Jian, P., Liu, C. Z., Yuan, C., and Sun, M.: Accretionary tectonics of the Western Kunlun Orogen, China: A Paleozoic–Early Mesozoic, long-lived active continental margin with implications for the growth of Southern Eurasia, J. Geol., 113, 687–705, 2005.
Yang, P., Wu, G., Nuriel, P., Nguyen, A. D., Chen, Y., Yang, S., Feng, Y., Ren, Z., and Zhao, J.: In situ LA-ICPMS UPb dating and geochemical characterization of fault-zone calcite in the central Tarim Basin, northwest China: Implications for fluid circulation and fault reactivation, Chem. Geol., 568, 120125, 2021.
Yin, J., Xiao, W., Sun, M., Chen, W., Yuan, C., Zhang, Y., Wang, T., Du, Q., Wang, X., and Xia, X.: Petrogenesis of Early Cambrian granitoids in the western Kunlun orogenic belt, Northwest Tibet: Insight into early stage subduction of the Proto-Tethys Ocean, GSA Bulletin, 132, 2221–2240, 2020.
Yuan, C., Sun, M., Zhou, M., Zhou, H., Xiao, W., and Li, J.: Tectonic Evolution of the West Kunlun: Geochronologic and Geochemical Constraints from Kudi Granitoids, Int. Geol. Rev., 44, 653–669, https://doi.org/10.2747/0020-6814.44.7.653, 2002.
Zhang, C., Yu, H., Ye, H., Zhao, Y., and Zhang, D.: Aoyitake plagiogranite in western Tarim Block, NW China: Age, geochemistry, petrogenesis and its tectonic implications, Sci. China Ser. D, 49, 1121–1134, https://doi.org/10.1007/s11430-006-1121-y, available at: https://doi.org/10.1007/s11430-006-1121-y, 2006.
Zhang, C.-L., Zou, H.-B., Ye, X.-T., and Chen, X.-Y.: Tectonic evolution of the West Kunlun Orogenic Belt along the northern margin of the Tibetan Plateau: Implications for the assembly of the Tarim terrane to Gondwana, Geosci. Front., 2018.
- Abstract
- Introduction
- Geological background and motivation
- Methods
- Results
- Discussion
- Conclusion
- Appendix A: Reflected light images
- Appendix B: X-ray fluorescence microscopy (XFM) maps
- Appendix C: REE data of each ablation area
- Code and data availability
- Author contributions
- Competing interests
- Disclaimer
- Acknowledgements
- Financial support
- Review statement
- References
- Supplement