the Creative Commons Attribution 4.0 License.
the Creative Commons Attribution 4.0 License.
 | 17 Jan 2022
A simplified isotope dilution approach for the U–Pb dating of speleogenic and other low-232Th carbonates by multi-collector ICP-MS
Andrew J. Mason
Anton Vaks
Sebastian F. M. Breitenbach
John N. Hooker
Gideon M. Henderson
We describe a new method for the measurement of ratios by isotope dilution multi-collector inductively coupled plasma mass spectrometry (MC-ICP-MS) for the dating of geologically young clean carbonates, particularly speleothems. The method is intended for materials containing little or no initial 232Th. We illustrate and validate the method with four examples ranging from 0.57 to 20 Ma. The new method is capable of applying the 235U–207Pb and 238U–234U–206Pb chronometers, common Pb and quantifiable residual disequilibrium permitting. These provide an alternative to the more widely used 238U–206Pb chronometer, which can be highly inaccurate for samples that are < ca. 20 million years old, owing to uncertainties in the excess initial 234U (hence, excess radiogenic 206Pb) commonly observed in speleothems.
- Article
(7775 KB) - Full-text XML
- BibTeX
- EndNote


Carbonates such as calcite and aragonite exist widely within the geological record, occurring as skeletal components of fossils such as corals, primary sedimentary deposits, secondary deposits such as speleothems, and veins and fracture fillings. Such carbonates have the capacity to capture a range of information about past sea level and climate, regional tectonics (and so on) and are of particular significance because they are often amenable to direct radiometric dating based on the decay of U (Cheng et al., 1998; Edwards et al., 2003; Nuriel et al., 2012; Rasbury and Cole, 2009). Historically, this has been achieved mainly using 238U–234U–230Th disequilibrium dating (e.g. Scholz and Hoffmann, 2008, and references therein) or less commonly 235U–231Pa disequilibrium dating (Cheng et al., 1998). These radiometric clocks are inherently limited to samples younger than the timescale over which the intermediate daughter used effectively returns to secular equilibrium, i.e. roughly 600 000 years for the 238U–234U–230Th chronometer (Scholz and Hoffmann, 2008). Uranium–lead dating, being based on the accumulation of stable radiogenic Pb, does not have this limitation, and has been applied for many decades to the dating of igneous and metamorphic accessory minerals (e.g. Heaman and Parrish, 1991). U–Pb dating has also been utilised in a more restricted way to date Mesozoic and older sedimentary carbonates (e.g. Moorbath et al., 1987; Rasbury et al., 1997; Wang et al., 1998). More recently, U–Pb dating has been adapted and applied to geologically young carbonates as a means of circumventing the ca. 600 ka limit of the 238U–234U–230Th chronometer, opening up far more of the geological record (Bajo et al., 2012; Cliff et al., 2010; Getty et al., 2001; Li et al., 2014; Pickering et al., 2010; Richards et al., 1998; Roberts et al., 2017; Vaks et al., 2020; Woodhead et al., 2006; Woodhead and Pickering, 2012). However, the U–Pb system remains underutilised in this regard, and given the variety of sample material available and differences in laboratory set-ups, it is unlikely that any implementation of the U–Pb system will be universally applicable. To this end, we document in detail a novel protocol for the U–Pb dating of carbonates by isotope dilution multi-collector inductively coupled plasma mass spectrometry (MC-ICP-MS) recently used in a study of Siberian permafrost dynamics (Vaks et al., 2020).
The U–Th–Pb system is based on the twin decay chains of 238U to 206Pb and 235U to 207Pb, plus the decay chain of 232Th to 208Pb, together with non-radiogenic 204Pb. The 232Th decay chain is not of direct relevance here as we are only considering systems that have sufficiently low 232Th that 208Pb can also be treated as non-radiogenic; for our purposes, we consider 232Th as negligible where < 0.002 (Sect. 3.5). Owing to the insolubility of Th in many aqueous systems, many carbonates approximate a 232Th-free system (e.g. Thomas et al., 2012; Vaks et al., 2013b).
Most previous U–Pb work on carbonates has focused on the 238U–206Pb system taking either a traditional solution-based isotope dilution approach where the samples are spiked with an isotopic tracer, dissolved, and then the U and Pb purified for analysis on a multi-collector MS or have utilised in situ laser ablation analysis (e.g. Getty et al., 2001; Pickering et al., 2010; Roberts et al., 2017; Woodhead et al., 2006). The former approach was initially used in our case (Mason et al., 2013) as it offers better precision, e.g. < 0.1 % uncertainty versus ca. 0.6 % or more by laser ablation on the ratio and < 1 % by isotope dilution versus 5 %–10 % by laser ablation on the ratio, as well as the ability to date younger material with lower U and Pb concentrations (Cheng et al., 2013; Lin et al., 2017; Roberts et al., 2017; Spooner et al., 2016; Woodhead et al., 2006; Woodhead and Petrus, 2019). However, because relatively large samples (> 100 mg) were required, miniaturisation of the columns to help control blanks was not an option, making the anion exchange chromatography both time consuming and challenging. Although reasonable Pb blanks (4 pg total Pb for a 2 mL resin bed) were attainable, this required secondary distillation of reagents, for example, and in some instances inconsistent purity of different anion exchange resin batches resulted in much higher Pb blanks (> 40 pg). Moreover, to avoid wasting effort and reagents on processing non-radiogenic material, separate reconnaissance analysis would be required to first identify datable material, adding to the overall time needed to obtain an age. Having a simplified procedure that simultaneously maintained acceptable precision, side-stepped the Pb blank associated with anion exchange chromatography and minimised the time penalty for processing non-radiogenic material to the point that separate reconnaissance U–Pb analyses were unnecessary, were significant motivations for developing a new method.
A caveat in U–Pb dating is that calculated U–Pb ages can strongly depend on the assumptions made regarding the initial state of the decay chains, especially initial , and ratios (Ludwig, 1977). For carbonates precipitated from fresh or sea waters, initial 230Th and 231Pa are likely to have been near absent owing to their insolubility in aqueous systems (Cheng et al., 1998; Edwards et al., 2003) and thus in practice do not present a major source of age uncertainty. However, initial 234U can be strongly enriched with initial ratios as high as 7 to 12 times equilibrium known to occur (Kronfeld et al., 1994; Plagnes et al., 2002; Vaks et al., 2013b). If unaccounted for, the initial 234U excess could lead to 238U–206Pb age inaccuracies of upwards of 2 Myr. For samples where the initial 234U disequilibrium has not yet completely decayed (typically < 2 Ma), the initial ratio can be calculated from the measured ratio as part of the age calculation (here termed the 238U–234U–206Pb chronometer), avoiding such inaccuracies. However, for older material, the initial ratio must be assumed in the age calculation (here termed the 238U–206Pb chronometer), potentially leading to significant inaccuracies in assessed ages. Where ages extend beyond the limit of the 238U–234U–206Pb method, particularly where there is evidence for large variability in initial ratios, the 235U–207Pb chronometer could prove a powerful alternative dating tool. Such a situation was found in speleothems from Siberian caves (Vaks et al., 2020), which provided an additional motivation for developing the dating approach presented here. We pursue a solution-based method over laser ablation in order to obtain precise measurements to most effectively utilise the 238U–234U–206Pb chronometer and because it represents a better prospect for detecting the tiny quantities of radiogenic 207Pb necessary to apply the 235U–207Pb chronometer to samples that are a few million years old.
A second caveat in U–Pb dating is that carbonates often contain an appreciable amount of initial (common) Pb that must be accounted for, usually requiring some form of isochron technique, though the choice of isochron used varies widely (e.g. Mason et al., 2013; Pickering et al., 2010; Woodhead et al., 2006). One approach (e.g. Roberts et al., 2017) is to use the intersection of an isochron in – (Tera–Wasserburg) space (or – – 204Pb-206Pb “total” Pb space, Ludwig, 1998) with concordia to determine the rad ratio (20xPbrad= radiogenic 20xPb) and, by extension, the age. However, this approach precludes an independent assessment of the rad ratio, inhibiting the use of the 235U–207Pb chronometer. This strategy is further complicated by the calculation of concordia itself being sensitive to initial disequilibrium in the 238U and 235U decay chains. Alternatively, separate 2-D isochrons based on non-radiogenic 204Pb (e.g. Rasbury and Cole, 2009) can be used to independently correct common 206Pb and common 207Pb, permitting the usage of both the 238U–206Pb and 235U–207Pb systems. Nevertheless, using 204Pb has the practical drawbacks of it being a low-abundance isotope and having an isobaric interference on ICP systems from instrumental Hg. However, in samples with negligible 232Th, the much more abundant 208Pb can be used in place of 204Pb as the non-radiogenic Pb isotope (e.g. Mason et al., 2013). Implementing a streamlined 208Pb-based approach, which obviously requires that 208Pb be measured, was a further motivation for the development work presented here.
In summary, the objective of the present work is to present a new isotope-dilution-based method that streamlines sample preparation, particularly with regard to analysing blank-sensitive and ratios, and which allows a 208Pb-based approach to common Pb correction, such that the 238U–234U–206Pb and 235U–207Pb chronometers can both be utilised, where the nature of the sample permits.
3.1 Protocol overview and reagents
The protocol comprises two distinct analytical procedures carried out sequentially, which in tandem are intended to provide the information necessary to calculate 238U–234U–206Pb, 238U–206Pb, and 235U–207Pb ages, utilising 208Pb for common Pb correction. The first procedure is concerned with determining the , , and ratios within a sample or part of a sample if more than one growth interval is present. The second procedure is concerned with analysing the same sample material to characterise residual disequilibrium, where the aforementioned measurement indicates a 238U–234U–206Pb age may be attainable.
The two procedures collectively require the following reagents, consumables, etc., but will otherwise be described separately:
-
18.2 MΩ cm water
-
Quartz-distilled (or equivalent high-purity) 10 M HCl and dilutions of this product;
-
Quartz-distilled (or equivalent high-purity) 16 M HNO3 and dilutions of this product;
-
Reagent grade 16 M HNO3;
-
Bio-Rad AG-1 X8 anion exchange resin (or equivalent) 100–200 mesh;
-
15 mL polypropylene bottles, acid cleaned for ∼ 1 week in 1–2 M distilled HNO3, then rinsed thoroughly with 18.2 MΩ cm water;
-
22 mL or 27 mL PFA vials, acid cleaned in hot, concentrated reagent-grade HNO3 for ∼ 1 week, then refluxed in distilled 10 M HCl for at least 24 h and thoroughly rinsed with 18.2 MΩ cm water after each acid stage;
-
2 mL Bio-Rad polyprep columns (or equivalent), acid cleaned for ∼ 1 week in 1–2 M distilled HNO3, then rinsed thoroughly with 18.2 MΩ cm water;
-
CRM145 (New Brunswick Laboratory) natural U or equivalent U isotopic reference material;
-
Single-element Tl standard.
The quartz-distilled acids used are comparable to commercially available ultra-pure acids – i.e. parts per trillion or lower concentrations for the analytes of interest. The 18.2 MΩ cm water used is approaching absolute purity for the analytes of interest (e.g. < 20 ppq for Pb). All dilutions of distilled acids were prepared with 18.2 MΩ cm water.
3.2 U–Pb measurements
Collected samples were first sawn using a diamond-coated wire saw to reveal their internal structure and provide access to the stratigraphic horizons or growth domains of interest. Clean carbonate subsamples weighing between ca. 50 and 500 mg were then cut from specific stratigraphic horizon or growth domains using a small diamond circular saw and transferred to acid-cleaned 15 mL polypropylene bottles. These subsamples were then sonicated repeatedly in 18.2 MΩ cm water until no suspended particles were visible, rinsing between each wash. The subsamples were then acid cleaned twice for a few minutes in distilled 2 % HNO3 with sonication to remove any residual dirt and surface contamination. Following each wash, the subsamples were thoroughly rinsed with 18.2 MΩ cm water and sonicated to ensure removal of any residual acid and dislodged surface material. Each acid wash was removed before the acid was consumed to prevent adsorption of dissolved ions back on to the surface of the sample. Where sample material was abundant, we used initial subsample masses of a few hundred milligrams for ease of handling during cleaning, but this mass was reduced where material was limited. The subsample mass after cleaning should be no smaller than ca. 10 mg. Cleaned subsamples were then stored until the day of analysis.
Subsamples were usually taken from specific sample domains without prior characterisation of the system. Instead, surplus subsamples were prepared from a number of different samples or sample domain to provide the flexibility to re-target the subsequent analytical session, as it became apparent which material was radiogenic and which was not.
On the day of analysis, one to two drops of a mixed 204Pb–230Th–236U (∼ 30 µL drop volume, ca. 15 pg µL−1 236U, ca. 1 pg µL−1 204Pb, and 0.5 pg µL−1 230Th; full isotopic calibration is given in Mason et al., 2013) spike in ca. 2 M HNO3 was added directly to the acid-cleaned carbonate subsample and gently agitated to mix as the spike dissolved the subsample. Cleaned subsamples were not weighed in order to minimise handling. Instead, the mass of CaCO3 from the subsample used was in excess of the HNO3 in the spike, such that the spike can dissolve sample material until the contained HNO3 is consumed, thereby fixing the mass of sample material dissolved (typically 3–8 mg) to ca. 10 % of the added spike mass. Although not critical to the age calculation, this allowed the absolute sample U concentration to be estimated without weighing, based on the amount of sample expected to dissolve in a given mass of spike. Once visible reaction with the spike was complete, the solution was diluted to around 15 mL with 18.2 MΩ cm water, thoroughly shaken to homogenise and then immediately analysed, with no preconcentration of U and Pb. Dilution to ca. 15 mL provides sufficient solution to check the instrument set-up (see below) prior to analysis, allows replicate analyses if needed and mitigates matrix loading on the instrument.
Analyses were performed on a first-generation Nu Plasma MC-ICP-MS (Belshaw et al., 1998) using the collector configuration given in Table 1 and described further below. The instrument was fitted with a set of “B-type” Ni cones reserved for very low-level Pb work. Sample introduction was via a DSN100 (Nu Instruments) desolvator using either a ca. 50 µL min−1 or 75 µL min−1 self-aspirating PFA nebuliser (ESI). The instrument and desolvator were slightly modified by replacing the gas and sample lines with acid-cleaned PFA to lower the long-term instrumental Hg background, reducing the 204Hg interference on 204Pb. The “hot gas” feed to the DSN100 spray chamber was also disconnected and sealed.
At the beginning of an analytical session the instrument was prepared by cleaning the desolvator and sample lines with 10 % HNO3, 2 % HNO3, and 18.2 MΩ cm water. The Ni cones were also gently cleaned by rinsing with deionised water prior to use to remove excessive Ca build-up from the skimmer orifice from previous use; however, as far as possible, the surface coating on the cones was not disturbed. The instrument was then initially tuned and optimised with ca. 100 ppt Tl solution and 5 ppb CRM145 U solution (both in 2 % HNO3). Pb was avoided to prevent re-contamination of the instrument, and sufficient Pb-blank was present in the Tl solution to identify the Pb peaks. Instrumental Pb background could then be further reduced by temporarily lowering the auxiliary gas flow (to ca. 0.5 L min−1) with RF power at 1300 W, allowing the plasma to run hot to “evaporate” residual Pb from the instrument interface and then using relatively cool running conditions (auxiliary gas flow of 1.15 L min−1 and 1200–1250 Watts RF power). In some instances, this reduced the Pb background by a factor of > 10×, without major loss of sensitivity. The instrument was then left for several hours until Hg adsorbed on the interface had evaporated and the Hg background had stabilised.
After the initial tuning and optimisation of the instrument on the dilute Tl and U solutions, instrument settings were checked on actual samples. At the beginning of an analytical session, particularly after the cones had been cleaned, it was often necessary to refocus the zoom optics to obtain optimal flat-topped peaks on the matrix-heavy samples. The DSN100 membrane gas flow was also retuned to suppress a molecular interference observed to overlap the Pb peaks, particularly 208Pb, but with its peak centres offset by ca. 0.15 AMU to the low-mass side of the Pb peaks. The ca. 0.15 AMU mass offset generally made the superimposed interference peaks obvious, such that the DSN100 “membrane” gas flow could be adjusted while performing a mass scan until the superimposed peak had been largely eliminated. Based on the mass offset, the interference is a molecular of a mid-mass element; Sr2O is suspected based on the group 2 element-rich matrix and the relative magnitude at masses 208, 207, 206, etc. The signal intensity of this interference varies over several orders of magnitude with the DSN100 membrane and hot gas settings, but has been observed to be largely eliminated by disabling the hot gas flow and setting the membrane gas flow slightly below the optimum value for Tl signal intensity on the pure Tl solution. Where a residual interference was seen (only apparent on 208Pb and occasionally up to 10 % of the 208Pb signal, but only on highly radiogenic samples with little 208Pb), the mass offset between the Pb and interference beams meant the extreme high-mass side of the Pb peaks was effectively resolved from the interference, proving peak shape was optimal. No correction was made for the Sr2O interference, and the method is based on its elimination. 208Pb, although not directly used for age calculation, forms the basis of the common Pb correction (Sect. 3.5), and thus at this stage an assessment of any residual interference was made in terms of its impact on the common Pb correction. Where no residual interference on 208Pb was observed or where it was considered irrelevant (e.g. for material with almost no common Pb), the instrument was set to analyse on the centre of the Pb peaks for optimum stability. Where this was not the case, particularly where 235U–207Pb ages were targeted (owing to the larger common Pb correction on 207Pb), the instrument was set to analyse the extreme high-mass side of the Pb peak flats where the interference is resolved. No evidence of interferences on U has been observed.
Table 1Collector configuration for U–Pb analysis.

“DVM” collectors are Faraday collectors. “IC” collectors are electron multiplier ion counters. Step 6 is optional and can be omitted if the 232Th is already known to be negligible in the sample (e.g. from a prior attempt at U–Th dating).
Analyses were carried out in a six-step routine with the magnet switched successively between steps (Table 1) for 10 or 15 repetitions. In steps 0–3 208Pb, 207Pb, 206Pb, 204Pb+204Hg, and 202Hg were measured on three ion-counters (ICx collectors in Table 1) separated by Faraday collectors (DVMx collectors in Table 1), which are not used in these steps owing to the small size of the Pb signals. The relative gains of the three ion counters were determined based on the successive measurement of the mass-204+ beam on each ion counter during the analysis. 207Pb was measured entirely dynamically owing to the ion counter spacing. Ion counter gains and dynamic ratios involving 207Pb were calculated with no beam interpolation between steps assuming a steady-state measurement. 202Hg was measured and used to correct for the 204Hg interference (typically ca. 15 % of the total 204+ beam with the quantity of spike used here). In steps 4–5 238U was measured on a Faraday collector, with 235U and 236U measured alternately on both Faraday and ion counter; the intention being that this gives the option of using the Faraday Faraday ratio or the Faraday ion counter ratio (using the 236U to calibrate the ion counter gain as needed) depending on 235U signal intensity. An optional step with 232Th in IC0 and 230Th in IC1 (Table 1) can be added where estimation of sample ratio is required (as a check 232Th is negligible), if this is not already known (e.g. from a prior attempt at U–Th dating). Mass fractionation for U was determined from the measured ratio of the samples and an assumed natural value of 137.75 (based on data for carbonates precipitated from surface waters summarised in Hiess et al., 2012, from Stirling et al., 2007, and Weyer et al., 2008). Mass fractionation for Pb was also estimated based on the measured ratio but with a +2 ‰/AMU offset applied based on previous characterisation of the U–Pb mass fractionation behaviour of this instrument (Mason and Henderson, 2010). In these tests, the offset between U and Pb fractionation was observed to be nearly constant over a wide range of fractionation values, including those seen for the matrix-rich samples analysed here. Samples were washed out with 10 % and 2 % distilled HNO3 while the next sample was spiked. Analysis time was around 15 min.
Instrument settings were checked periodically during the analytical session to ensure peak centring, peak shape, and suppression of interferences was maintained. Special care was taken when highly radiogenic material capable of yielding precise ages was encountered and when the instrument was set to measure on the extreme high-mass side of the Pb peak flats. The DSN100 was re-cleaned with 18.2 MΩ cm water as required to remove U and Pb background or when sensitivity dropped due to Ca-loading of the membrane.
Explicit procedural blank corrections were not made to the U–Pb analyses owing to the measured blank signals being below the instrumental detection limit. However, based on a typically observed detection limit for total Pb of ca. 20 ppq (based on 208Pb), an upper limit for the total procedural Pb blank can be estimated at ca. 0.3 pg.
3.3 Choice of tracer solution
We use a mixed 236U–230Th–204Pb tracer for isotope dilution (calibration in Mason et al., 2013). Using the non-radiogenic 204Pb as tracer allows the measurement of the radiogenic 206Pb and 207Pb, and it is the least abundant of the four stable Pb isotopes in the samples. 204Pb is also more easily obtainable than artificial 205Pb and 202Pb. The instrumental Hg background also makes the small non-spiked 204Pb signal unsuitable as a monitor for common Pb without preconcentration, and thus spiking with 204Pb does not sacrifice any sample information that would otherwise have been obtainable. Moreover, for 238U–234U–206Pb chronology, using a tracer with 204Pb paired with artificial 236U means that the critical ratio is determined from the and ratios, and thus it is relatively insensitive to instrumental mass fractionation due to the mass difference for the natural and spike isotope being the same for both U and Pb. For 238U–234U–206Pb chronology on the instrument used, 204Pb is also more favourable than 205Pb because it can be collected simultaneously on the ion counters with 206Pb, whereas 205Pb cannot (Table 1); 205Pb may, however, represent a better option for other hardware configurations. The disadvantage of using 204Pb is that sample (and blank) 204Pb must be corrected for, but this correction can be reduced by adding sufficient spike 204Pb that the sample contribution is minor. In our case, the sample to spike weight ratio is limited to about 0.1 by the availability of the HNO3 in the spike to dissolve sample. For most analyses, this corresponds to > 98.5 % 204Pb arising from the spike, with many of the highly radiogenic analyses (i.e. the fractions for which precise ages can be obtained) having > 99.8 % of the 204Pb originating from the spike. Any age bias introduced in accounting for the sample 204Pb is therefore likely to be at the ‰ level and less than the typical analytical precision on the and ratios.
230Th is included in the tracer to provide the option to measure 232Th as a check that 208Pb is non-radiogenic. 230Th is preferable to artificial 229Th on the instrument used because of the 2 AMU spacing of the ion counters (Table 1). Again sample 230Th needs to be accounted for, but for samples in the U–Pb age range sample 230Th is likely to be close to equilibrium with 234U. Moreover, the 232Th only needs to be measured semi-quantitatively as a check of the applicability of the method, and is not used in the age calculation.
3.4 measurements for 238U–234U–206Pb chronology
Where the U–Pb data indicated a particular sample domain is radiogenic and potentially young enough to retain measurable residual 234U disequilibrium, the domain was additionally analysed for the ratio for 238U–234U–206Pb chronology. Sample aliquots of up to about 0.2 g were dissolved and purified to obtain U cuts. As far as possible these aliquots comprised the residual solution and remaining carbonate from the U–Pb analysis so that the and measurements were made on as close to the same material as possible. Dissolution was by addition of 0.2 mL of 10 M HCl to the residual solution + residual carbonate. After obvious reaction had ceased, the solution was transferred to clean 22 mL or 27 mL PFA vials and evaporated to dryness. The sample was then converted to chloride form by adding 1 mL 10 M HCl and again evaporating to dryness. Samples were then dissolved in 1 mL of 10 M HCl for loading onto columns for separation of U. Purification used 2 mL Bio-Rad polyprep columns and an AG1X8 anion exchange resin bed of 2 mL. Resin was batched pre-cleaned by suspending it in either 18.2 MΩ cm H2O or dilute HCl, allowing it to settle and decanting any residual suspended fines 8–10 times. Resin was then loaded into the column and cleaned sequentially with ∼ 10 mL (column reservoir filled) 18.2 MΩ cm H2O, 10 M HCl and 18.2 MΩ cm H2O. The resin was then conditioned with two 4 mL aliquots of 10 M HCl, and the sample loaded and matrix Ca eluted with 2×5 mL aliquots of 10 M HCl. Sample U was eluted with 2×5 mL aliquots of 18.2 MΩ cm water and collected in the origin PFA vial (which was rinsed first with 18.2 MΩ cm H2O to remove the bulk of any sample Ca residue). The purified U was measured on the same instrument, with the 234U and 238U measured on ion counter and Faraday collectors, respectively. Standard bracketing with CRM145 (CRM112a) was used to correct both for mass fractionation and ion counter gain.
Owing to the very small 234U blank signal, the ratio of the U blank could not be meaningfully measured, and thus no blank correction was routinely applied to the measurements. The typical procedural blank for the ratio measurement was ca. 50 pg U.
Purification of the U fraction is required because the ratio must be measured to a higher precision than the ratio. This requires preconcentration of the U to obtain a sufficiently large 234U signal to ideally obtain better than 1 ‰ precision. Uranium, however, is generally less blank sensitive than Pb, and thus the ion exchange procedure is relatively straightforward. Moreover, only those samples for which a measurement will be beneficial need be processed.
3.5 Non-radiogenic Pb correction and Age calculation
To obtain an accurate age, it is necessary to account for any non-radiogenic Pb (blank and sample common Pb) in an analysis. The preferred method used here is to employ a 2-D isochron-type approach in which the 238U–(234U)–206Pb and 235U–207Pb systems are independently corrected for common Pb, respectively in – and – isotope space; example plots are shown in Sects. 5 and 6. For a 232Th-free system, subsamples of the same age should define a mixing trend between the common 208Pb 20xPb composition falling on the 208Pb 20xPb axis (i.e. where 23yU 20xPb = 0) and the radiogenic 23yU 20xPb composition falling on the 23yU 20xPb axis (i.e. where 208Pb 20xPb = 0, assuming all 208Pb is common), where 20xPb is the daughter of 23yU. The common Pb correction can then either be made by fitting a regression line through the data to estimate the 23yU 20xPbrad ratio (the intersection with the 23yU 20xPb axis), or a regression line can be fitted to estimate the common 208Pb 20xPb composition (the intersection with the 208Pb 20xPb axis), which can then be used to correct each U–Pb analysis based on its measured 208Pb 20xPb ratio. The latter option is preferred here because it allows age-independent scatter in the radiogenic 23yU 20xPb ratio arising from differences in initial disequilibrium state to be accommodated; the estimation of the common Pb composition is insensitive to such scatter in the radiogenic composition providing that any regression is anchored by relatively non-radiogenic analyses. Correcting measurements individually also allows for the pairing of each corrected U–Pb analysis with a corresponding measurement, capturing any additional information encoded in the ratio. For regressions we use the method of York (1969).
In practice, when dealing with a set of related material (e.g. different growth domains in the same speleothem, or different speleothems from the same cave), isochrons for every sample domain to be dated were not constructed at the outset to attempt to minimise analytical effort. Instead, data were acquired until subsets of material approximating a mixing trend between the radiogenic and common Pb endmembers could be identified (e.g. an non-radiogenic layer stratigraphically bracketed by more radiogenic layers) and regressed to estimate the common Pb composition. This estimate was then used as the basis for the common Pb correction in the wider data set for the related material under consideration. Where samples proved complex in terms of their U–Pb systematics, additional analyses were added to provide further characterisation and to allow true isochrons to be constructed if needed.
In reality, 232Th will be present in trace amounts, with the resulting trace 208Pbrad shifting the 208Pb 20xPb ratio to slightly higher values than if 232Th was absent, slightly biasing the calculated 23yU 20xPbrad ratio. We consider the bias to be acceptable without correction for 232Th where 232Th 235U < 0.276 (equivalent to < 0.002). This threshold corresponds to a maximum bias in the rad ratio of ca. 0.6 %, or ca. one-third of the typical analytical precision on the measured ratio; the rad ratio is much less sensitive owing to the smaller common Pb correction on 206Pb. Setting this limit on 232Th in terms of the Th/U ratio has two effects in terms of 208Pb 20xPb-23yU 20xPb space. Firstly, it constrains the 208Pbrad 20xPbrad ratio to be close to zero by limiting the ratio of the respective parent isotopes, such that an accurate radiogenic 23yU 20xPb composition can still be obtained by extrapolation to the 23yU 20xPb axis (i.e. to 208Pb 20xPb = 0). Secondly, it constrains compositions with a low ratio to also have a low ratio, such that extrapolation to the 208Pb 20xPb axis (23yU 20xPb = 0) to obtain the common Pb composition will also correspond to a 232Th-free composition free of radiogenic 208Pb.
For relatively young samples in which residual initial disequilibrium can still be quantified, model 238U–234U–206Pb ages were calculated from each corresponding pair of U–Pb and analyses, using the estimated common ratio to correct for the total non-radiogenic 206Pb, based on the measured ratio. In this instance, the initial ratio was calculated from the measured ratio as part of the age calculation analogous to U–Th dating. For generally older material where the initial cannot be directly quantified, model 238U–206Pb ages were calculated using an assumed initial ratio (which was chosen arbitrarily in the present work for illustrative purposes only). Model 235U–207Pb ages were calculated in an equivalent way correcting for the total non-radiogenic 207Pb in the analysis based on the measured ratio and the estimated common ratio. Where 235U–207Pb ages were calculated but no corresponding 238U–234U–206Pb age could be determined, the 238U→206Pb system was solved for the initial ratio using the calculated age.
Alternatively, Tera–Wasserburg space was used in which the age is determined without explicit common Pb correction, based on the intersection of an isochron with concordia (e.g. Roberts et al., 2017). This approach, however, is not favoured by us as it does not allow separate evaluation of the 238U–(234U)–206Pb and 235U–207Pb systems (and often involves assumptions about initial disequilibrium in order to calculate concordia) but is utilised here where necessary to compare independently obtained data (e.g. when 208Pb was not measured).
Model ages and concordia were calculated using an in-house implementation of the general decay equations given by Faure (1986), in which the decay chains are simplified to 238U →234U →230Th → 226Ra →206Pb and 235U→231Pa → 207Pb. Initial 230Th and 231Pa were assumed to have been absent, and initial 226Ra was assumed to have been at equilibrium. Decay constants used were 238U: 1.55125 × 10⁻¹⁰; 234U: 2.82203 × 10⁻⁶; 230Th: 9.17055 × 10⁻⁶; 226Ra: 4.33488 × 10⁻⁴; 235U: 9.8485 × 10⁻¹⁰; 231Pa: 2.11583 × 10⁻⁵; 232Th: 4.9475 × 10⁻¹¹ (Cheng et al., 1998, 2013; Steiger and Jäger, 1977). Age uncertainties were determined using a Monte Carlo approach to propagate analytical uncertainty and uncertainties arising from initial ratios such as the common Pb composition and initial U isotopic composition. A natural ratio of 37.1 ± 10 (95 % confidence level) was assumed when accounting for sample 204Pb in the isotope dilution calculation; the large uncertainty is to cover reasonably foreseeable terrestrial isotopic variations. As part of the isotope dilution calculation the spike 204Pb proportion is output so that analyses with an excessive sample 204Pb contribution can be identified. For most analyses, > 99 % of the total 204Pb originated from the tracer. Blank Pb is not separately corrected for and is dealt with as part of the total non-radiogenic Pb correction; however, given a number of analyses have yielded > 99 % radiogenic 206Pb, the Pb blank can be considered a generally minor source of non-radiogenic Pb.
In the absence of suitable well-characterised carbonate reference materials during the period of method development, the validation of the new procedure required means other than the direct analysis of reference materials. As an alternative, we set four independent validation tests for the new method.
-
The new method must be able to produce data and ages consistent with measurements by a conventional isotope dilution approach with purification of U and Pb – i.e. not removing the matrix must have no appreciable impact on the resulting data and ages.
-
The method must be able to generate U–Pb ages that vary systematically with stratigraphic order in samples where the successive growth intervals are resolvable.
-
In samples where the common Pb correction permits, the method must be able to generate concordant 238U–234U–206Pb and 235U–207Pb ages.
-
The method should replicate data obtained independently in a different laboratory.
These four tests have been performed on three samples: ASH-15, SLL10-6, and JOHO-1. A fourth sample, SB_pk142 is analysed as a case study for the application of the 235U–207Pb chronometer.
ASH-15 is a calcite flowstone comprising a younger relatively thin brownish layer overlying an older, more massive yellowish layer (Fig. 1), and originates from Ashalim cave, Negev Desert, Israel. The massive yellow layer has previously been independently analysed at the University of Melbourne (Vaks et al., 2013a) and the University of Oxford (Mason et al., 2013) and has an age of ca. 3 Ma and a U concentration of ca. 1.5 ppm; 232Th is negligible (Mason et al., 2013). The latter data set, obtained with purification of the U and Pb from the matrix, is compared to new data obtained using the new protocol (i.e. without matrix removal) as a preliminary test of not removing the matrix.
SLL10-6 is a high-U (6 to 43 ppm) calcite stalagmite from Ledyanaya Lenskaya cave, Siberia, Russia (Vaks et al., 2020). The sample comprises several distinct layers designated from A to G, in order of increasing stratigraphic age and mostly separated by visible hiatuses (Fig. 1). All seven stratigraphic layers have been analysed using the new protocol. Five subsamples each from the F and G layers have also been purified and analysed using the method of Mason et al. (2013). This provides control data, such that the reproducibility of the F and G ages, with and without matrix separation, can be tested. The multilayer nature of the sample is additionally used to test the ability of the new method to produce ages in stratigraphic order, while the high-U nature of the sample makes it suitable for testing concordance of 238U–234U–206Pb ages and 235U–207Pb ages. Previous measurements from this sample and other samples from the same cave (Vaks et al., 2013b) give a maximum ratio of 1.6 × 10⁻³ and indicate that the radiogenic 208Pb contribution is insignificant.
JOHO-1 (Fig. 1) is a fault vein calcite from the Middle East with a relatively low bulk U concentration of 0.3–0.5 ppm. The fault vein has been analysed independently at the University of Oxford using the new protocol described and at the NERC Isotope Geoscience Laboratory (NIGL), Keyworth, UK, by laser ablation ICP-MS, following the methods of Roberts et al. (2017). The laser ablation analyses targeted a domain that included material with a much higher U concentration (up to 25 ppm). The sample is used to test the new protocol via inter-laboratory comparison.
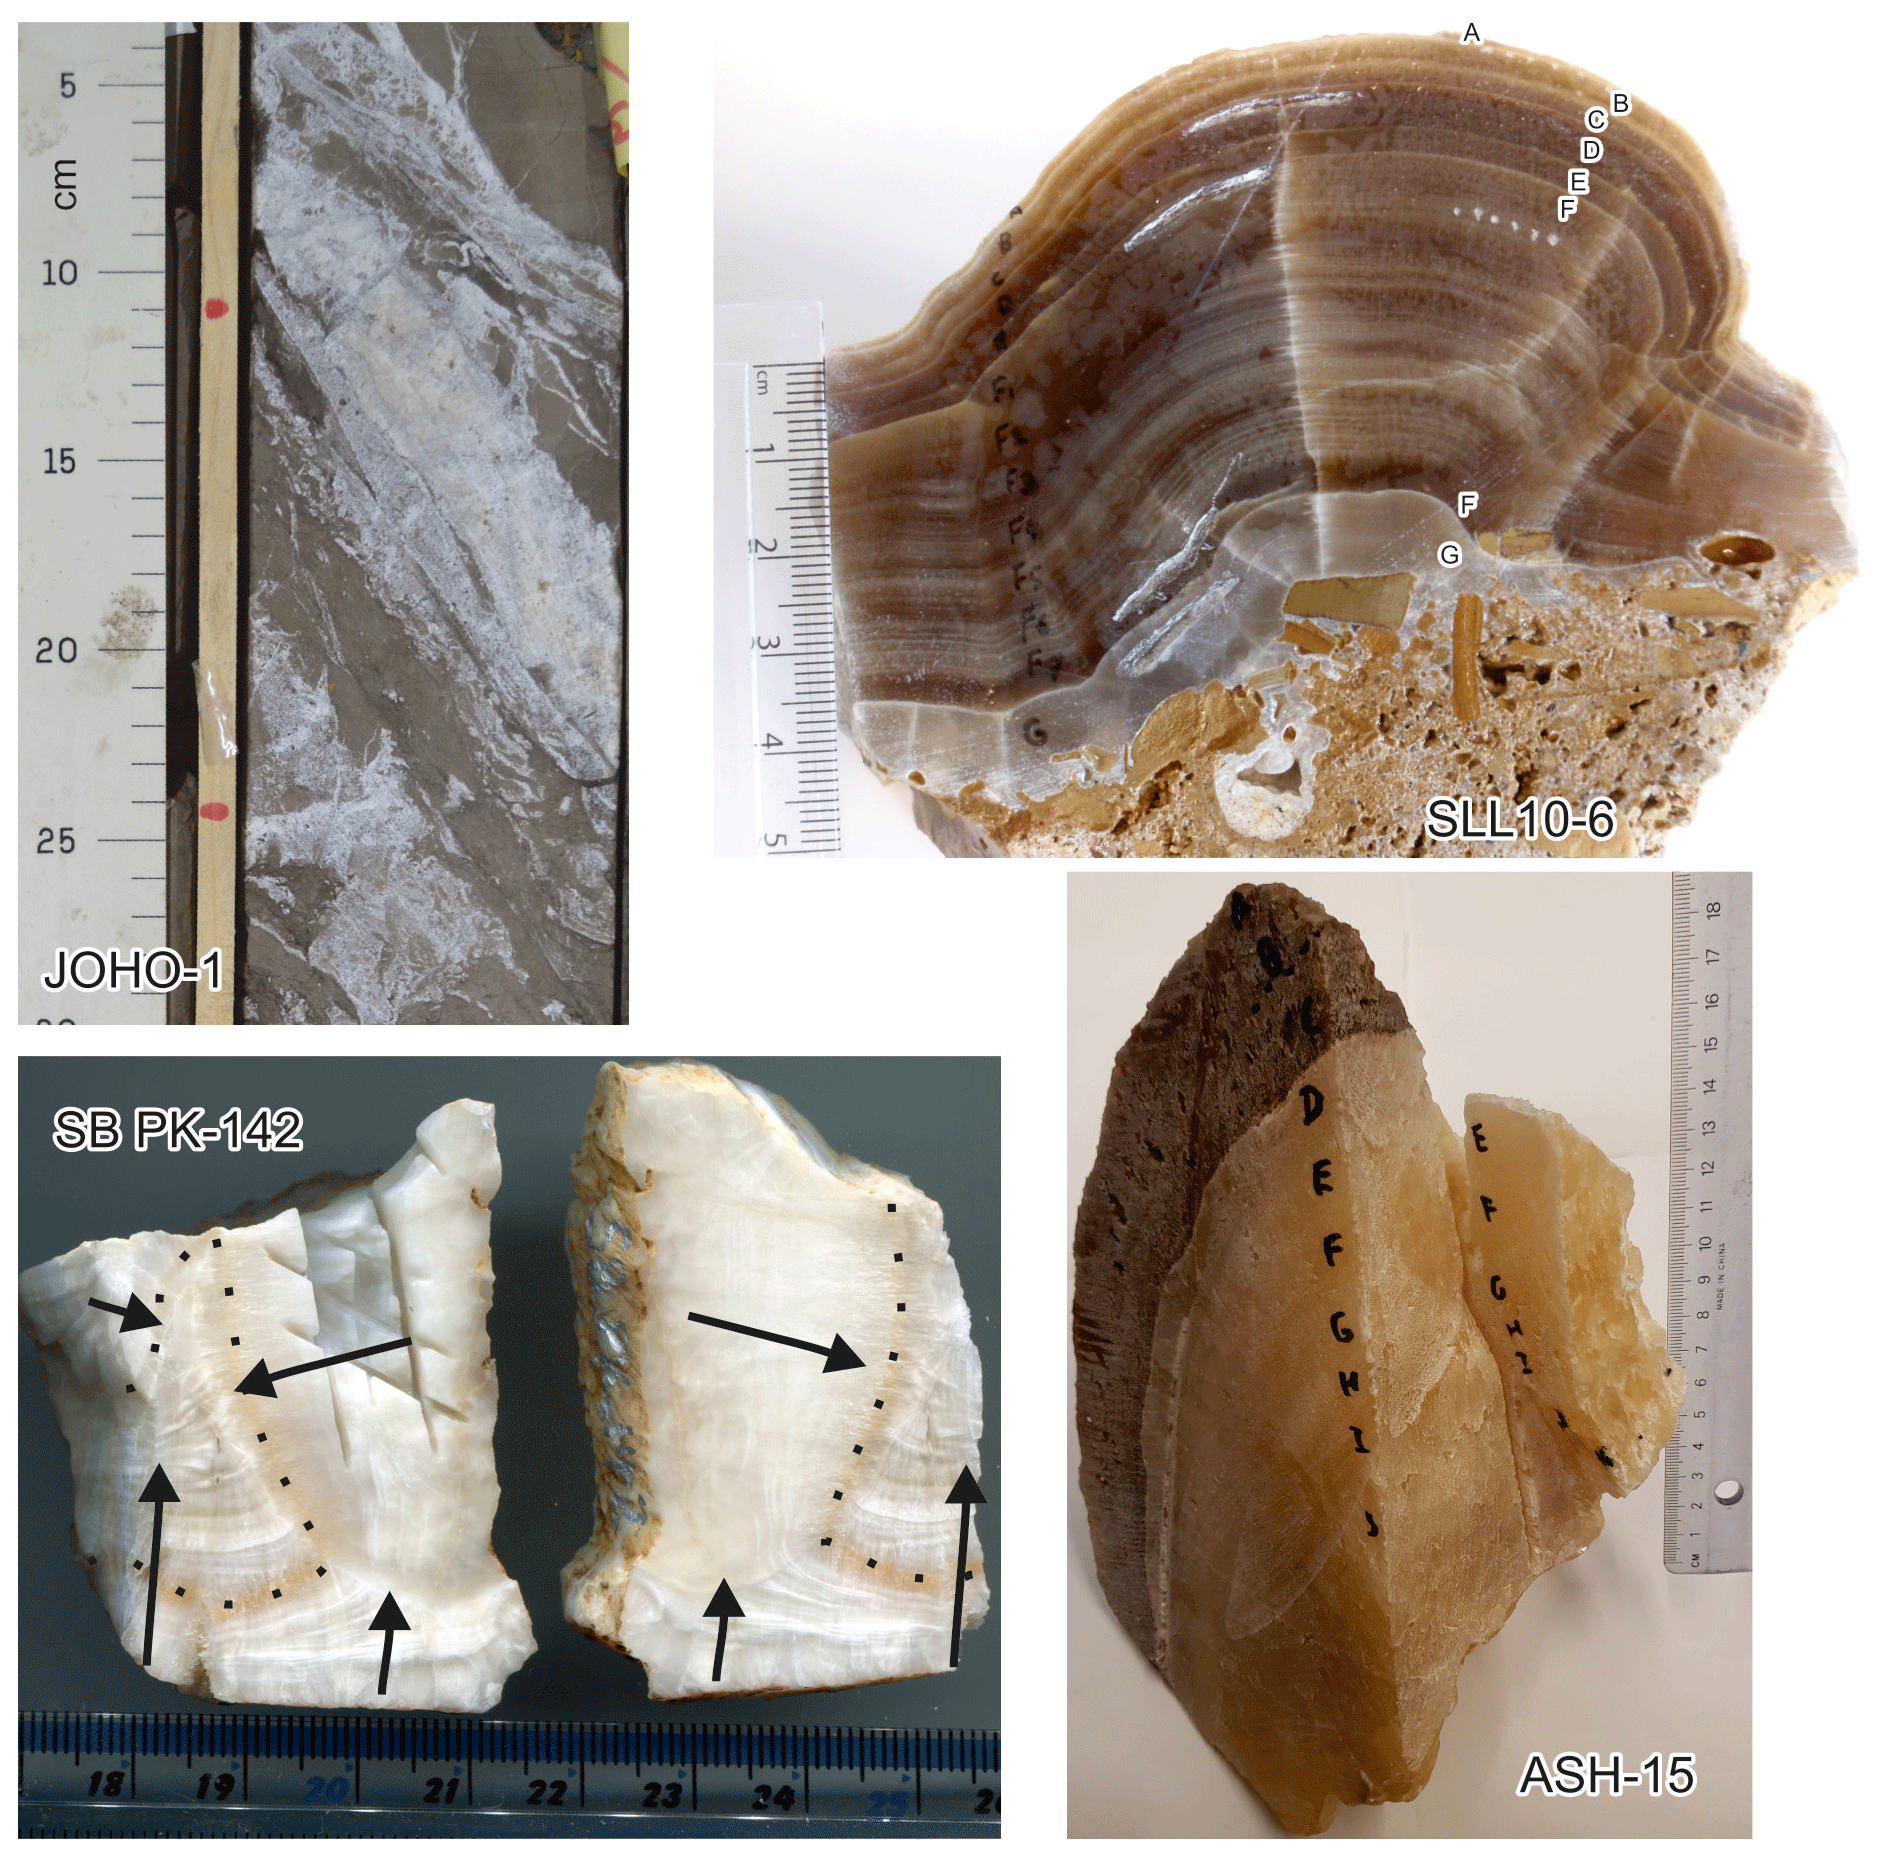
Figure 1ASH-15 is a calcite flowstone from Ashalim Cave, Negev Desert, Israel. It comprises a lower yellow-orange unit from ca. 3 Ma and a younger brown unit not analysed here. SLL10-6 is a calcite stalagmite from Ledyanaya Lenskaya Cave, Siberia, Russia. It comprises several layers designated A to G in order of increasing stratigraphic age, each apparently separated by a hiatus. SB_pk142 is an aragonitic speleothem comprising a flowstone that has merged with and encased two stalactites. The prominent iron oxide stained layer (dashed line) separating stratigraphically older and younger parts of the sample should be noted. The flowstone portion of the sample shows prominent lamination (sub-horizontal as viewed). The larger of the two stalactites forms the relatively featureless portion of the sample (with saw cuts on the left image), but some growth laminae (near vertical as viewed) can be seen on the right image, and these pass continuously, but with sharp inflection, into the flowstone portion of the sample below the iron oxide stained layer, indicating the stalactite and lower part of the flowstone are stratigraphically equivalent. Remnants of a smaller stalactite form the extreme top-left corner of the sample in the left image. The portion of the flowstone above the iron oxide stained layer appears to encase the stalactites and hence is mostly younger than them. Arrows indicate growth direction. JOHO-1 is a calcite fault vein from the Middle East.
SB_pk142 (Fig. 1) is an aragonite speleothem from Botovskaya cave, Siberia, Russia. The sample consists of part of a stalactite that has merged into flowstone, the remains of a second smaller stalactite (now encased by the flowstone portion of the sample) on one corner of the sample, and traces of reddish-brown clay on the stratigraphic base of the flowstone. The sample contains two stratigraphic domains separated by a prominent iron oxide stained lamina, possibly representing a hiatus. Multiple subsamples from both stratigraphic domains have been analysed using the new method. A notable feature of speleothems from this cave is the large and variable 234U excess, with known initial ratios ranging between 3.4 and 8.1 times equilibrium (Vaks et al., 2013b, 2020). This sample is used as an example application of the 235U–207Pb chronometer to a cave system where the 238U–206Pb chronometer is problematic. Aragonite samples from Botovskaya cave show consistently low ratios (< 2 × 10⁻⁴, Vaks et al., 2013b), such that the radiogenic 208Pb contribution is insignificant.
Detailed representative sample petrography for samples from Ledyanaya Lenskaya and Botovskaya caves, as well as details of the caves themselves, are given in Vaks et al. (2013b, 2020).

Figure 2Preliminary data from ASH-15 showing comparison of data obtained with the new method with no preconcentration with published data obtained with preconcentration (Mason et al., 2013). The critical result is that the data produced using the new method are co-linear with the data obtained with preconcentration and define a common isochron. The intersection of the isochron with the axis gives the common ratio and the intersection with the axis gives the rad ratio providing the 208Pb is entirely non-radiogenic.
5.1 ASH-15
Results for ASH-15 are given in Table 2 and Fig. 2. These analyses were intended as a preliminary test that the new U–Pb measurement procedure without matrix separation produces data consistent with published data (Mason et al., 2013) obtained using the same spike but with purification of U and Pb from the matrix. The new analyses are slightly less radiogenic than the analyses of Mason et al. (2013); however, they are not exact replicates of the same subsamples, so some variation in the proportion of common Pb can be expected. The critical feature is that the data with and without matrix separation are co-linear defining a common isochron (Fig. 2) and are therefore consistent.

Figure 3(a) Modified Tera–Wasserburg diagram showing the control data for SLL10-6 G and F layers obtained with purification of the U and Pb from the matrix following the method of Mason et al. (2013). Because the initial ratio is not known a priori, a unique concordia curve appropriate to each sample layer cannot be defined. Instead, two sets of tie lines (the sub-horizontal curves) connecting concordia curves (not shown) with different initial ratios are plotted. The first set connects points of equal ratio for values corresponding to the mean measured ratio (± uncertainty) for the F and G layers. The second set of tie lines are age contours connecting points of equal age. The interpreted radiogenic and radiogenic ratios must simultaneously satisfy the tie line corresponding to the measured ratio, and the mixing trend with common Pb defined by the regression fits (grey-shaded bands) to the measured U–Pb data – i.e. the intersections shown with the black ellipses. The age is then defined by where the intersection falls in relation to the age contours. The vertical dashed lines indicate the radiogenic ratios interpreted from regression intercepts in - isotope space (not shown but equivalent to Fig. 6a) as a cross-check and are consistent with the aforementioned intersections. (b) Enlargement of the intersections between the regression fits to the measured data and the equal tie lines for the sample measured ratios. Age contours correspond to the maximum and minimum 238U–234U–206Pb age defined by the intersections for each sample layer. Calculations assume = 137.75, no initial 231Pa or 230Th and equilibrium initial 226Ra.
5.2 SLL10-6
Control data for the F and G layers obtained with purification of U and Pb from the matrix following the method of Mason et al. (2013) are given in Table 2 and Fig. 3. Data and ages obtained using the new analytical methodology for all layers of SLL10-6 are also given in Table 2 and Fig. 4. Blanks for the control data were 4.1 pg Pb, 24.8 pg U for the F layer and 42.0 pg Pb, 18.8 pg U for the G layer. Control data are blank corrected.
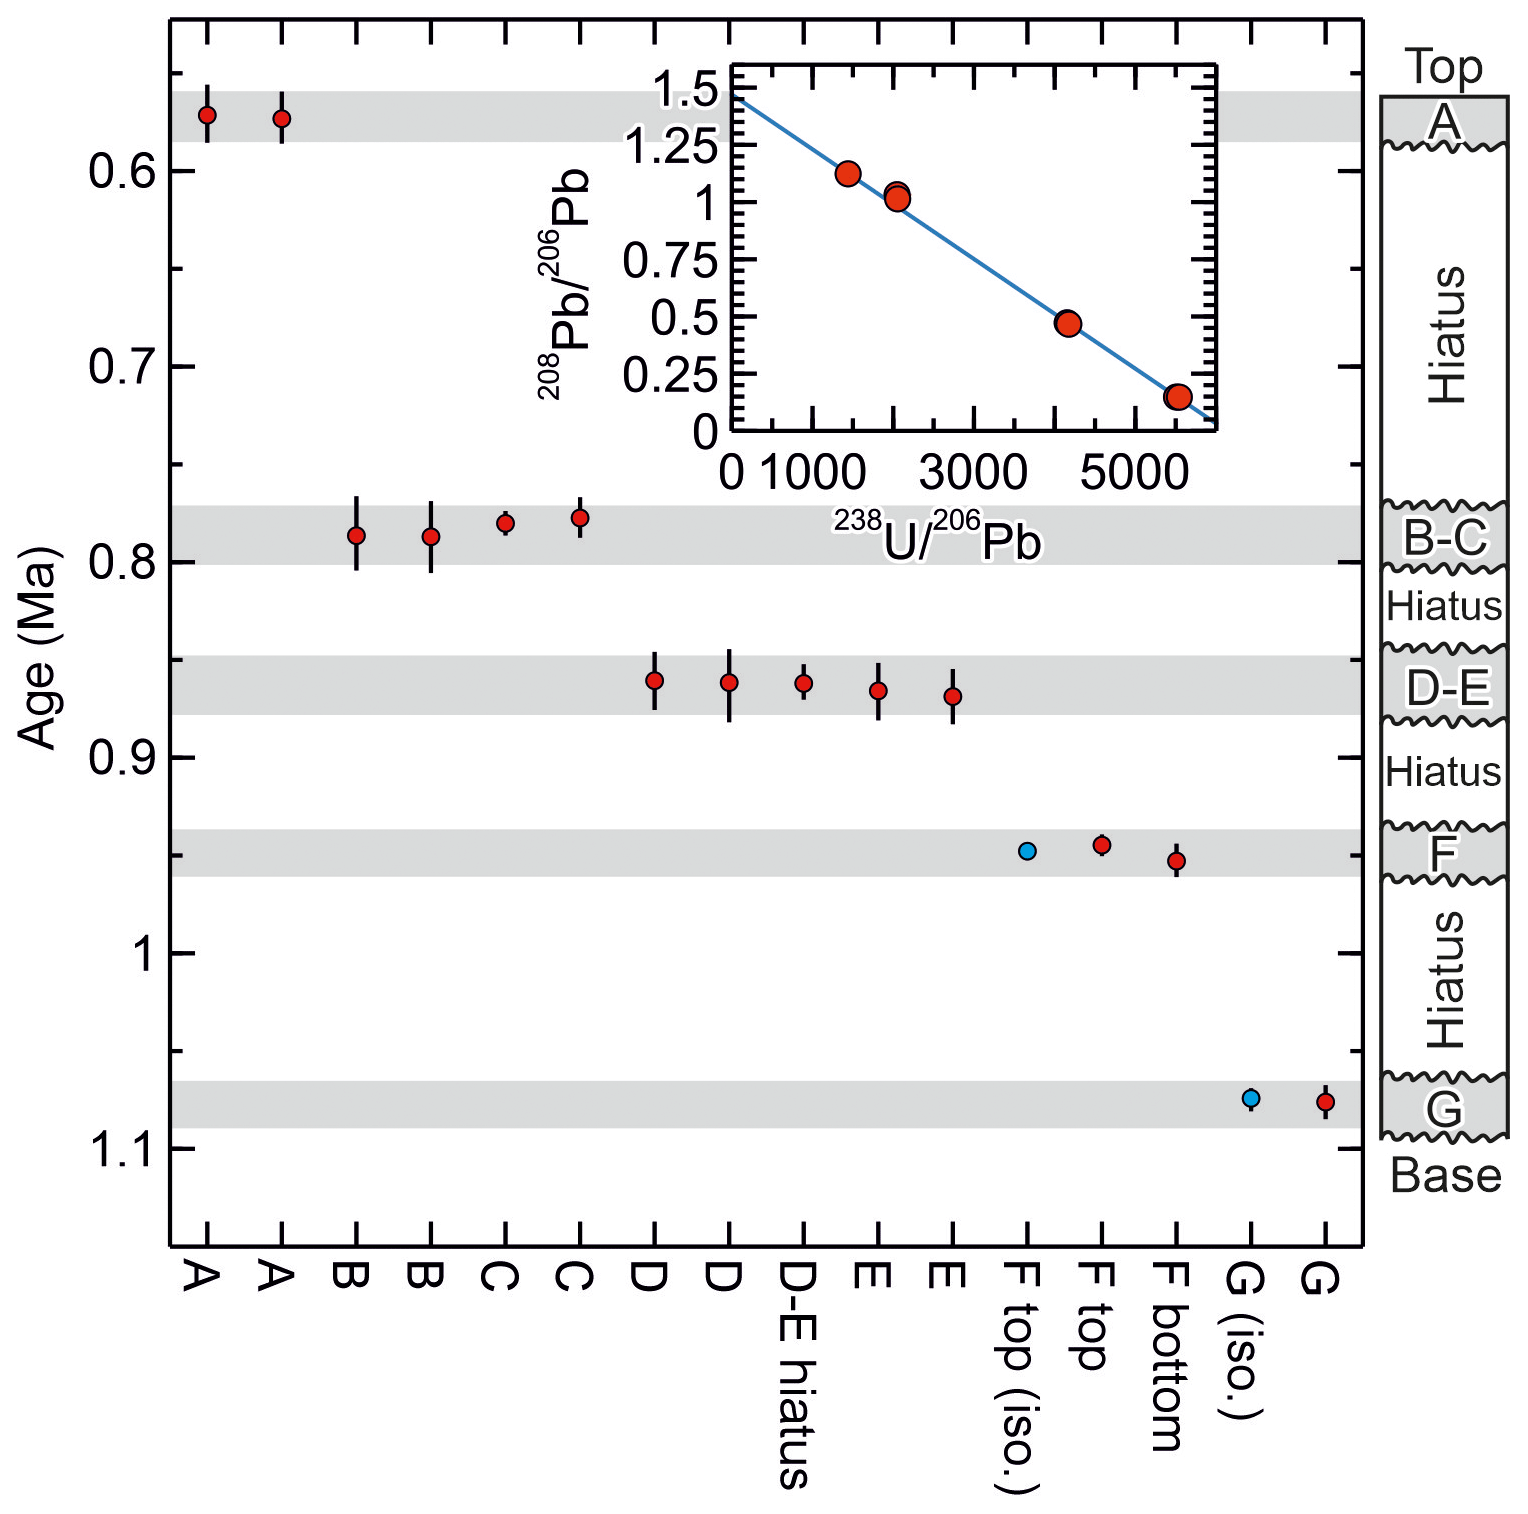
Figure 4Summary data for SLL10-6 showing the replication of the ages from the layers F and G obtained using the method of Mason et al. (2013) (ages with “iso.” label) with the ages obtained using the new method and the consistency of the ages produced with the new method with the stratigraphic order of the sampled layers. The inset shows isotopic data from the layers B and C, which include some of the least radiogenic analyses obtained from this cave and were used to help constrain the common to ca. 1.5 ( axis intercept). The rather low (radiogenic) common ratio is considered to have resulted from ingrowth of 206Pb in the source of the common Pb (presumably the cave host rock) prior to the growth of SLL10-6.
In terms of the measured ratio, for the F layer, the control data are markedly more precise than the data obtained using the new protocol (typical relative uncertainty of ±0.075 % versus ±0.9 %; Table 2), but the precision is more similar for the G layer (0.8 % versus 1.2 %) owing to the larger Pb blank correction in the G layer control data. The control data yield 238U–234U–206Pb isochron ages of 1073.6 ± 6.7 and 949.9 ± 5.4 ka (95 % conf.) for the G layer and the upper part of the F layer, respectively. The corresponding ages for the G layer and the upper part of the F layer obtained using the new protocol are 1076.2 + 8.58.8 ka and 944.7 + 5.65.6 ka, respectively. The 238U–234U–206Pb ages therefore replicate with an uncertainty of better than 1 %, irrespective of whether the matrix is removed or not. Moreover, the precision of the ages is not greatly degraded by applying the simplified protocol, and interestingly the higher analytical precision of the control data for the F layer does not translate to higher age precision because of scatter in the data.
238U–234U–206Pb ages for SLL10-6 obtained using the new protocol vary systematically from 1076.2 + 8.58.8 ka near the stratigraphic base of the sample to 571.4 + 13.714.4 ka near the stratigraphic top of the sample, with no age reversals. Treating replicate and overlapping ages as single values, five distinct age values are observed. The likelihood of these ages falling in stratigraphic order as the consequence of a fluke result is thus 1 in 5! or less than 1 %.
235U–207Pb ages obtained for SLL10-6 using the new method are less precise than the 238U–234U–206Pb ages owing mainly to the proportionally larger common Pb correction on 207Pb. Nevertheless, the most radiogenic analyses, layer G and Ftop, yield fairly precise (ca. ±5 %) 235U–207Pb ages of 1060 + 4648 ka and 960 + 47 ka respectively, in agreement with the corresponding 238U–234U–206Pb ages of 1076.2 + ka and 944.7 + ka. All other obtained 235U–207Pb ages are also concordant with their corresponding 238U–234U–206Pb ages.
5.3 JOHO-1
Results for JOHO-1 are given in Table 2 and Fig. 5. The results are intended as an inter-laboratory comparison of isotopic measurements made using the new protocol at the University of Oxford with those obtained independently at NIGL by laser ablation. Results are given in terms of – ratios for compatibility with the NIGL laser ablation measurements. In terms of the measured ratio, the precision of the two data sets is comparable (with typical ±2 % uncertainties for the Oxford solution data versus ±3 % for the NIGL data; Table 2). However, the NIGL data targeted a small domain with up to 25 ppm U, whereas the solution measurements were made on material with a bulk U concentration of 0.3–0.5 ppm.
The NIGL data define a mixing trend from highly radiogenic compositions (with a ratio of ca. 340 and a ratio of ca. 0.05) falling just above concordia, towards a common Pb ratio of ca. 0.65, but with the majority of the analyses clustering towards the radiogenic end of the trend. The Oxford data fall towards the radiogenic end of the same trend and are thus consistent with the NIGL analyses and yield a comparable age if common assumptions are used. Thus, for example, regression of each data set through a common ratio of 0.65 ± 0.1 yields concordia intercepts at 19.34 ± 0.30 and 19.19 ± 0.15 Ma, respectively, for the Oxford solution data and NIGL laser ablation data (concordia assumes no initial 230Th or 231Pa and equilibrium initial 234U and 226Ra). Less spread towards non-radiogenic compositions is seen in the Oxford data, but this is unsurprising given that fewer analyses were made.
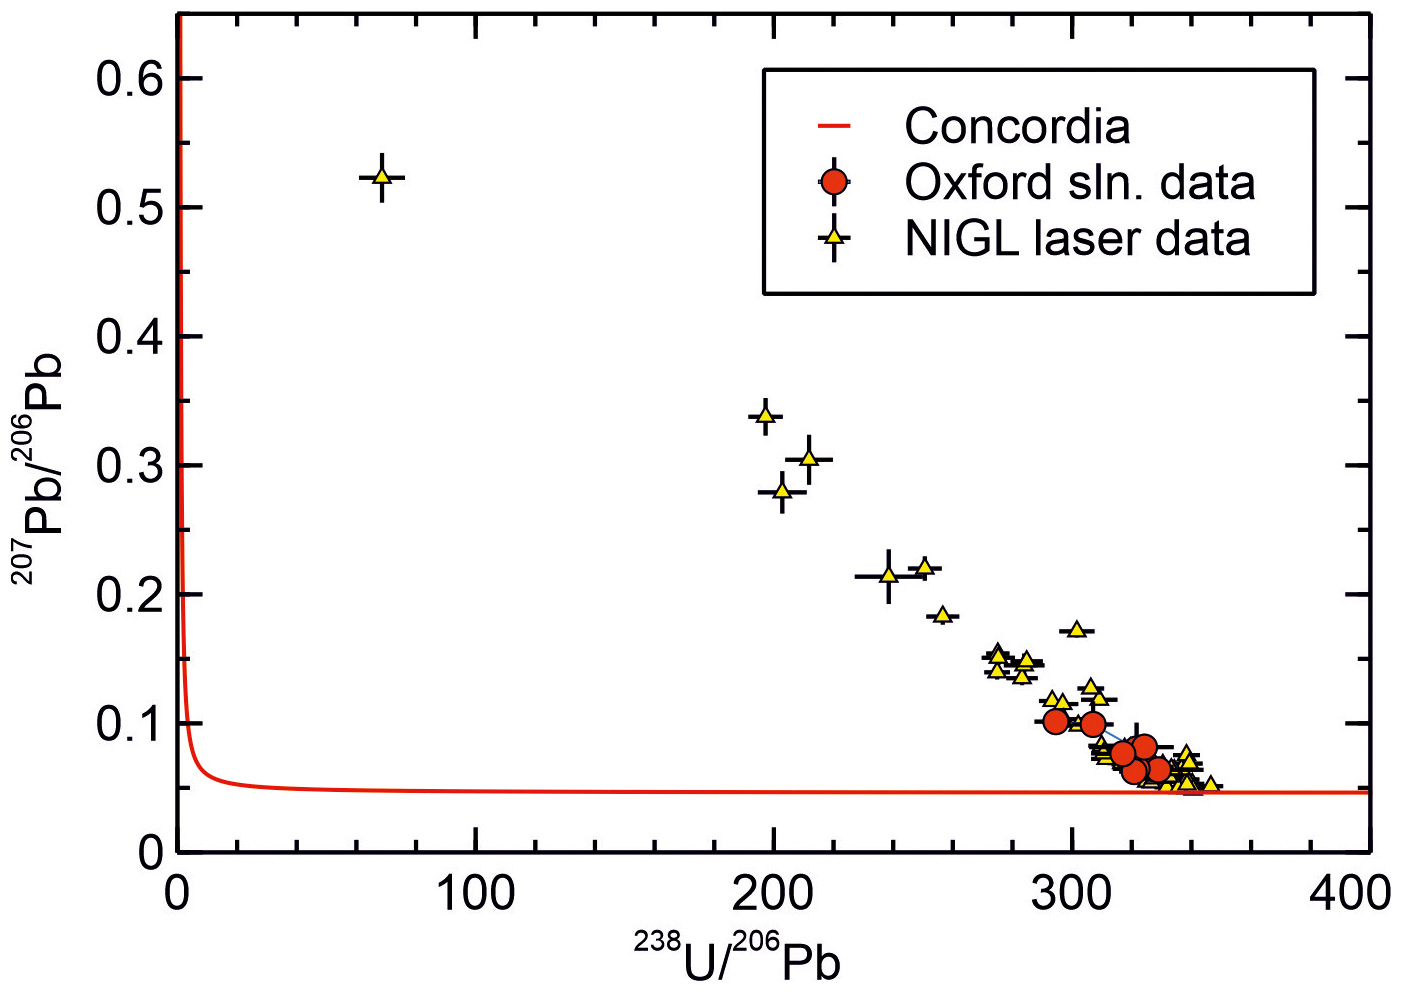
Figure 5Tera–Wasserburg diagram showing a comparison of data from sample JOHO-1 obtained at NIGL by LA ICP-MS with data obtained at Oxford using the new method. Data are presented in – isotope space for compatibility with the NIGL LA data and because no independent measurement of the is presently available. Equilibrium concordia is shown for reference. The co-linearity of the Oxford and NIGL data indicate the consistency of the two data sets. The intersection of the array of data with concordia at ca. 340 and ca. 0.05 gives the radiogenic endmember without the use of a purely non-radiogenic Pb isotope but at the expense of obtaining independent ages. The intersection with concordia corresponds to an age of ca. 19.25 Ma, assuming equilibrium initial 234U. The intersection with the axis gives a common ratio of ca. 0.65. The somewhat low (radiogenic) common ratio is attributed to ingrowth of 206Pb in the source of the common Pb prior to sample formation.
Results for SB_pk142 from Botovskaya cave are shown in Table 2 and Fig. 6. On a – plot data from SB_pk142 fall on two distinct trends corresponding to the stratigraphically older and younger sections of the sample. The stratigraphically older part of the sample has a consistently lower ratio for a given ratio than the stratigraphically younger section. The intercept values of the two trends at ca. 685 and ca. 910, respectively, for the older and younger sections of the sample correspond to apparent 238U–206Pb ages of ca. 9.5 and 7.2 Ma, assuming equilibrium initial 234U and no initial 230Th. The assumption that initial 234U was in equilibrium is likely incorrect (see below) but demonstrates the point that there is an noticeable apparent age difference between the older and younger sections of the sample, which appears consistent with the apparent hiatus, and the age order superficially agrees with the stratigraphy of the sample. The common ratios suggested by the upper and lower sections of the sample are not appreciably different.
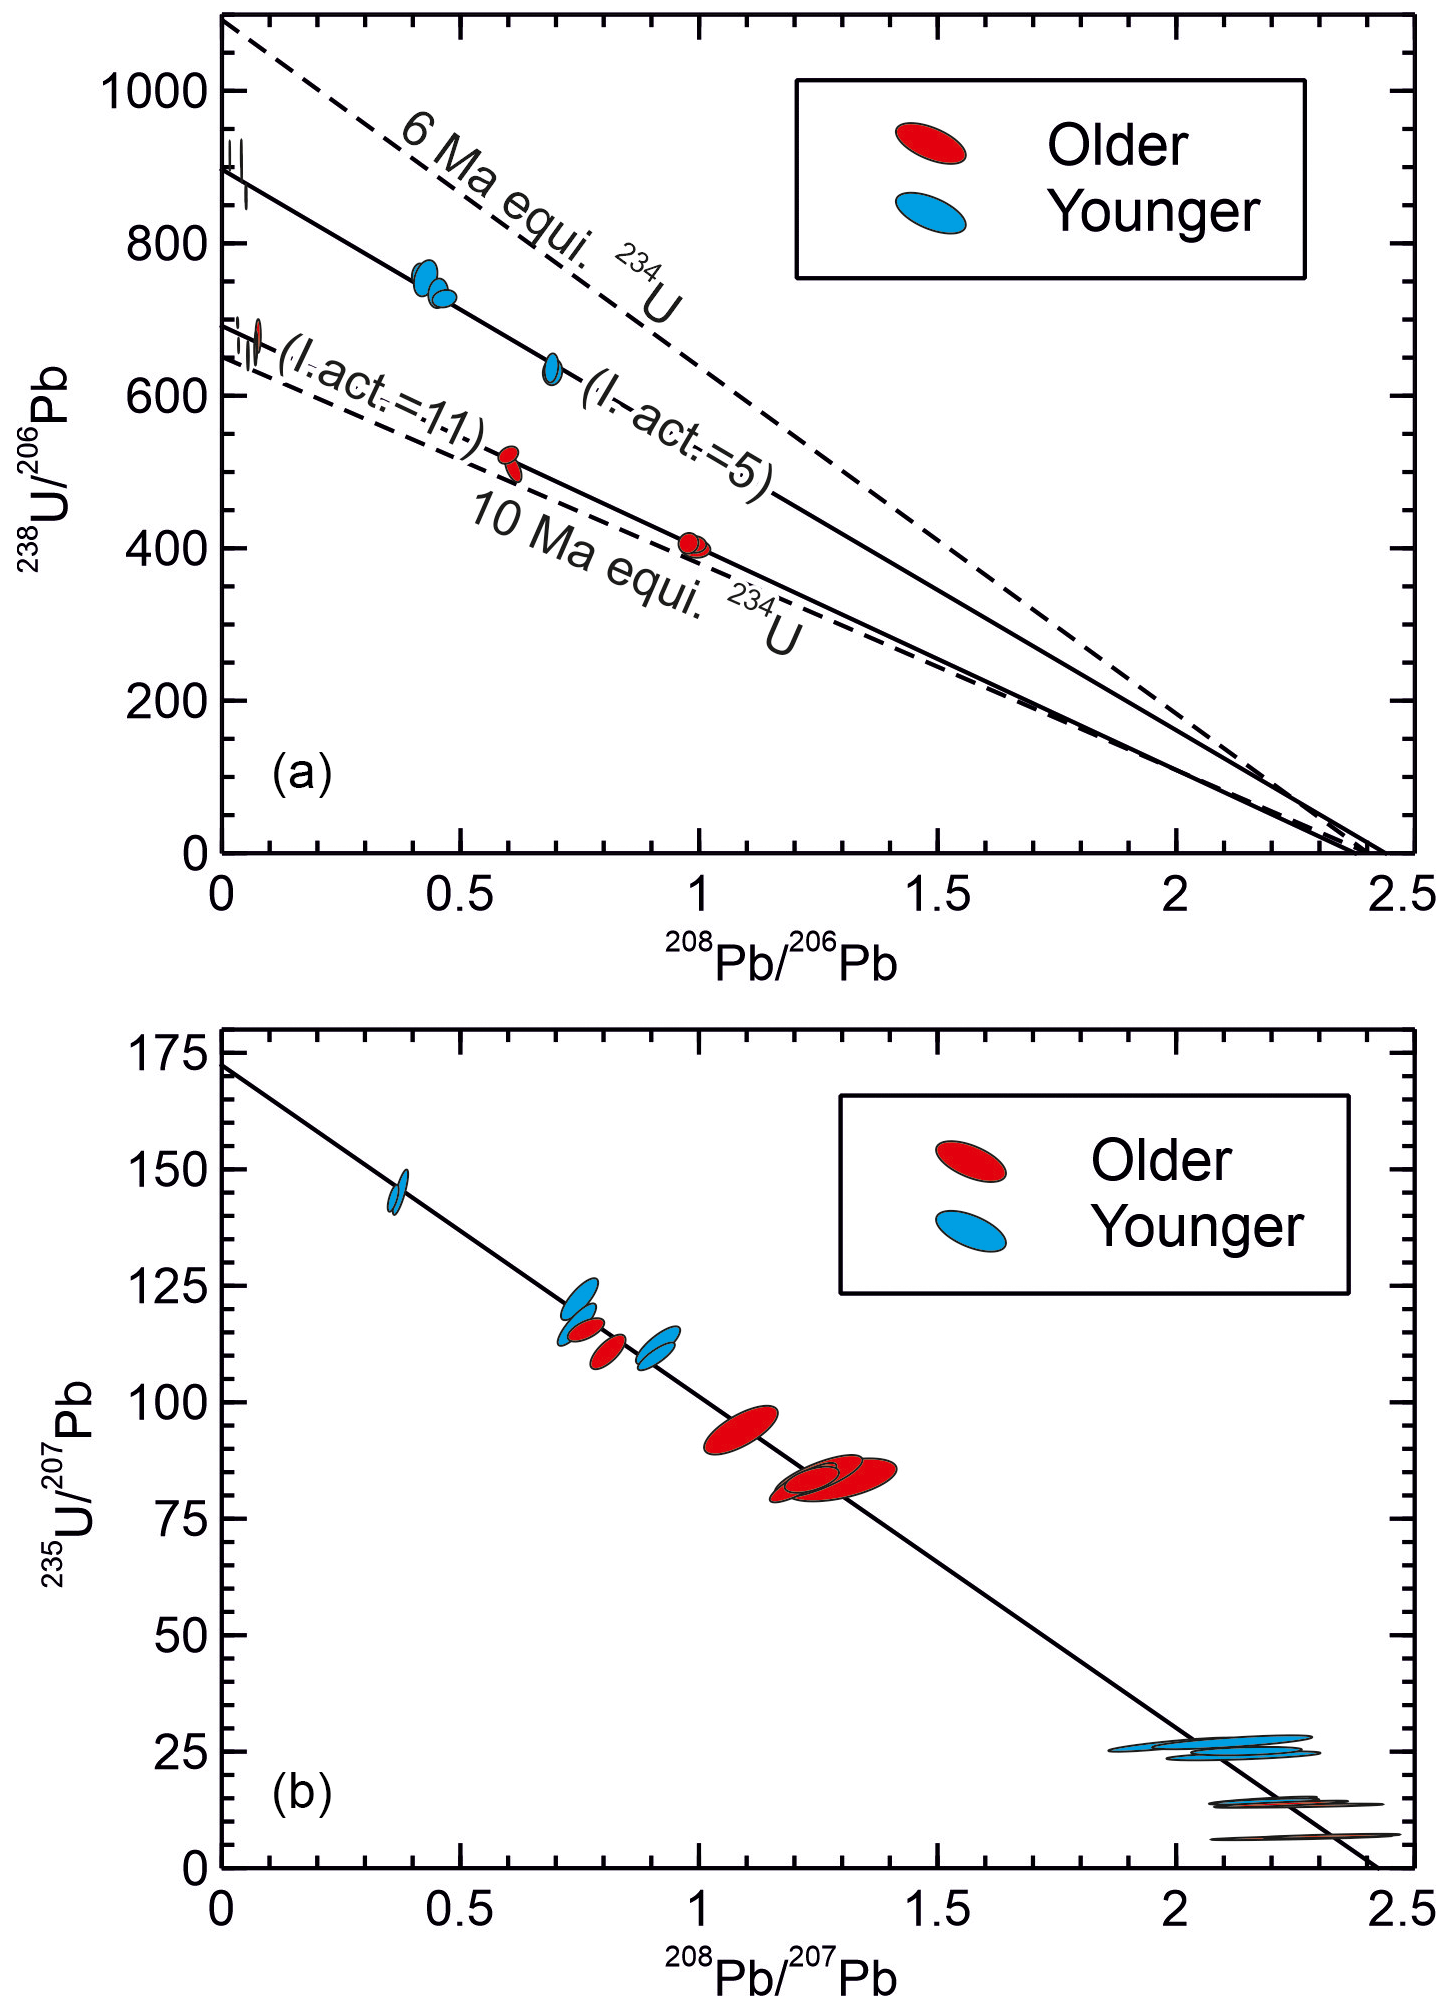
Figure 6Isochron plots for sample SB_pk142. The “older” and “younger” sections are stratigraphically older and younger than an iron oxide stained lamina possibly marking a hiatus, respectively. Based on the maximum observed for aragonite samples in this cave (Vaks et al., 2013a), ingrown 208Pb is estimated to make no more than a ca. 3 ‰ contribution to the and ratios for the most radiogenic analyses, becoming inconsequential for the least radiogenic analyses. This contribution is negligible for the common Pb correction and has a maximum effect on the (235U–207Pb) age of ∼ 0.5 ‰. In both plots the isochron intersection with the x axis corresponds to the common Pb composition, while in the effective absence of ingrown 208Pb, the intersection with the y axis corresponds to the 23yU 20xPbrad ratio. (a) – plot showing the two portions of the sample falling on clearly distinct trends corresponding to apparent 238U–206Pb ages of ca. 7.2 Ma and ca. 9.5 Ma. The dashed lines are reference isochrons for 6 and 10 Ma assuming equilibrium initial 234U. The figures in brackets are the initial activity ratios associated with each portion of the sample, estimated by solving the 238U–206Pb decay equation using the 235U–207Pb age. (b) – plot showing the two sections of the sample falling on a common trend, suggesting they actually have a similar age of ca. 6 Ma. The 6 Ma reference isochron on (a) is considered to represent the true age of the sample based on the 235U–207Pb data. The plotting of the data on two separate and apparently older isochrons in (a) is attributable to the distinct and high initial ratios in the two parts of the sample, which resulted in two populations of data with different radiogenic 206Pb excesses relative to the 6 Ma reference isochron.
On a – plot data from SB_pk142 show a different pattern, and the data from both the stratigraphically older and younger portions of the sample define a single trend with an intercept of ca. 171.2. This corresponds to a age of ca. 6 Ma, and suggests the stratigraphically older and younger portions of the sample are not, in fact, appreciably different in age, and that the sample is younger than the 238U–206Pb system suggests.
The data show basically coherent mixing lines between a radiogenic endmember and common Pb. Thus, the discrepancy between the 238U–206Pb system and 235U–207Pb system cannot be easily attributed to open system behaviour. Moreover, such an explanation would require U or Pb isotopes from the two systems to have behaved differently. Extreme 234U disequilibrium is, however, known to occur in samples from Botovskaya cave, with initial ratios between 3.4 and 8.1 times equilibrium reported for samples from the last 0.5 Ma based on dating (Vaks et al., 2013b, 2020). Excess 206Pb from the decay of excess initial 234U will make the rad ratio appear low (old) compared to the corresponding rad ratio, with the discrepancy depending on the initial ratio; in other words, it allows time-independent variation of the rad ratio not seen in the ratio. This could account for older apparent 238U–206Pb ages and the difference between the – and – plots. Excluding subsamples 15–17, which are non-radiogenic, the upper section of the sample gives a mean 235U–207Pb model age of 5.9 Ma with typical uncertainties on individual model ages of ±0.2 to 0.3 Myr, and suggests an initial ratio varying between 3.8 and 5.8 times equilibrium (Table 2). This initial is typical of that already documented from Botovskaya cave. The lower section of the sample is generally slightly less radiogenic, but where subsamples yield ages they are indistinguishable from the upper section of the sample. Calculated initial ratios for the lower part of the sample are higher than those previously reported but not particularly unexpected for this cave, at between 10 and 11.6 times equilibrium. It is uncertain why the initial changed between the two sections of the sample, though the fact that a prominent iron oxide stained lamina separates the two portions of the sample seems to indicate a change in growth conditions occurred.
Table 2U–Pb data and ages. (a) Preliminary test data for ASH-15 obtained without preconcentration of U and Pb. (b) Isochron reference data for SLL10-6 F and G obtained with preconcentration of U and Pb. Each analysis is a separate subsample. (c) U–Pb data, 238U–234U–206Pb ages and 235U–207Pb ages for SLL10-6 obtained without preconcentration of U and Pb. (d) U–Pb data obtained without preconcentration of U and Pb, 238U–206Pb reference ages and 235U–207Pb ages for SB_PK_142. The 238U–206Pb reference ages use an arbitrary assumed initial and are included only to highlight the apparent age difference between the upper and lower portion of the sample. (e) U–Pb data and 238U–206Pb reference ages for JOHO-1 obtained without preconcentration of U and Pb. (f) Reference laser ablation U–Pb data for JOHO-1.
a Correlation coefficient for the uncertainties on the specified ratio pairs. b The assumed composition and uncertainty used to make corrections for the Pb initially in the samples. c The initial ratio is arbitrarily chosen to allow ages to be calculated to show the apparent age differences between the different sections of SB_PK 142. The ages should not be taken as an accurate estimate of the true age. The assigned initial uncertainty assumes a normal distribution. d The initial ratio estimated from the ratio using the 235U–207Pb age.
7.1 Method validation
The results from the samples used for method validation indicate that the new protocol passes all four method validation tests. This in turn implicitly demonstrates that matrix effects such as molecular interferences or decoupling of U and Pb mass fractionation during analysis are either unimportant or can be adequately controlled with proper setup of the instrument. Similarly, significant biases introduced during sample preparation, such as preferential leaching of U or Pb during partial sample dissolution by the spike, can also be excluded.
Not separating the matrix does not lead to inconsistent data in the preliminary test using ASH-15, that is to say the data with and without matrix separation are co-linear, i.e. they define a common isochron, and therefore would yield the same age. Replication of 238U–234U–206Pb ages with and without matrix separation is demonstrated to a high precision for the F and G layers of SLL10-6, again demonstrating that matrix separation via anion exchange chemistry is not necessary for measurements. This finding is in line with the fact that laser ablation techniques have allowed measurements for a number of years without matrix separation (e.g. Roberts et al., 2017).
For SLL10-6, 238U–234U–206Pb ages obtained with the new protocol from all stratigraphic layers vary systematically with stratigraphic order, without age reversals. Moreover, for sample layers that are sufficiently radiogenic to allow 235U–207Pb ages to be calculated, these are concordant with the 238U–234U–206Pb ages, demonstrating the ability of the new protocol to exploit the 235U–207Pb system where the nature of the sample permits, even on material as young as ca. 1 Ma. This is significant because it demonstrates the ability to have a continuity of dating between young samples where the initial 234U can be directly constrained via the 238U–234U–206Pb chronometer and old material (i.e. > 20 Ma) where 238U–206Pb age inaccuracies associated with assuming the initial ratio will be proportionally small compared to the age.
Analysis of JOHO-1 using the new protocol replicates independently obtained laser ablation data, demonstrating inter-laboratory consistency of the new method. Additional data quality tests of the new method are presented in the larger data set of Vaks et al. (2020) in the form of comparison with U-Th ages and the testing of age reproducibility between different speleothems from a single location.
7.2 Limitations of 238U–206Pb dating and the of utility of the 235U–207Pb system
One of the major limitations to applying the 238U–206Pb system to geologically young materials just beyond the limit of the 238U–234U–206Pb chronometer (ca. 2 Ma, depending on initial ) is that while ages can be highly precise (e.g. Woodhead et al., 2006), an age calculated assuming equilibrium initial and one calculated using the most extreme known initial ratio differ by > 2 Myr, which is proportionally a massive difference for ages of a few million years. While it is possible to try to characterise initial for a particular cave using younger material (e.g. Woodhead et al., 2006), it is difficult to test whether such younger material is representative, and in some instances younger material may not exist. Consequently, 238U–206Pb dating beyond the limit of the 238U–234U–206Pb chronometer is something of a game of Russian roulette in terms of age accuracy, with SB_pk142 from Botovskaya cave being an example of where the “bullet” of extreme initial 234U disequilibrium is in the chamber. The 235U–207Pb chronometer provides an alternative option for highly radiogenic samples. Moreover, because decay of excess 234U leads to a permanent excess of radiogenic 206Pb relative to radiogenic 207Pb, comparison of the 238U–206Pb and 235U–207Pb systems can be used to constrain initial after any residual disequilibrium has decayed (e.g. Mason et al., 2013). This is potentially very useful for testing assumed initial 238U/234U ratios used for other samples in a set where these can only be dated by the 238U–206Pb chronometer because of common Pb.
7.3 Applicability of the new protocol and potential future development
The present method is only applicable to samples in which 232Th is near absent. The method is not intended as a blanket replacement for prior implementations of the U–Pb system, but rather as a complementary technique that can be applied where it is best suited.
The new protocol has significant advantages over a traditional solution-based approach in terms of the simplicity of sample preparation for U–Pb analysis. Sample preparation is fast to the point that prior reconnaissance characterisation of the U–Pb system is unnecessary as the time penalty for preparing an undatable sample is minimal. Moreover, redundant sample material can be prepared with little extra effort, such that an analytical session can be re-targeted in real time, as it becomes apparent which material is most favourable for dating. The greatly reduced sample preparation also eliminates stages at which contamination could occur (column chemistry, sample dry-downs), reducing the need for an optimal lab and column setup. The more traditional solution-based approach with purification of U and Pb retains an advantage in terms of analytical precision (at least under ideal conditions, e.g. the SLL10-6 F control data; Table 2) and is therefore likely to remain the preferred approach for the calibration of reference materials (e.g. Roberts et al., 2017). However, high analytical precision may not translate to high age precision if other limiting factors, such as scatter in the data, are present (as in the SLL10-6 F control data; see also the compilation of Woodhead and Petrus, 2019) – i.e. the lower analytical precision of the new procedure need not be a significant limitation in terms of age precision. Indeed, the utilisation of the new approach by us (Vaks et al., 2020) to obtain ca. 50 238U–234U–206Pb ages, many with corresponding concordant 235U–207Pb ages, on material < 1.6 Ma old, demonstrates that it can be applied effectively to generate fairly large data sets. In this case, the reduction in analytical effort achieved with the new approach allowed replication of growth ages between different stalagmites, providing additional quality control that would not otherwise have been available.
The new protocol does not provide an alternative for in situ techniques where high spatial resolution is required, e.g. on samples that are very small or have a complex morphology (e.g. Li et al., 2014). However, the results from JOHO-1 indicate the new method can be applied to carbonates with < 1 ppm U. Although not investigated in detail, the comparable precision of the JOHO-1 solution and laser ablation data, despite the latter being acquired on a domain with > 10 × the U concentration, suggests the new protocol would outperform laser ablation in terms of the lower U and Pb concentration limit at which ages could be obtained. Moreover, the higher-precision measurements obtained with the new method relative to laser ablation (< ± 1 ‰ attained here versus ±5 ‰–6 ‰ obtained by Lin et al. (2017) by laser ablation) makes the former generally more suitable for 238U–234U–206Pb dating, where quantifying slight residual disequilibrium in the ratio can be critical.
The new protocol was developed on a first-generation Nu plasma, an instrument ca. 20 years old at the time of writing. Hardware advancements, notably the Isotopx ATONA amplifier, which can greatly expand the dynamic range of Faraday collectors into the range traditionally belonging to the ion counter (Szymanowski and Schoene, 2020), offer future potential to refine the present methodology. While the small 206Pb, 207Pb and 208Pb signals from radiogenic samples would still likely require measurement on ion counters, with suitable spike design, it may be possible to shift measurement of the Pb spike isotope and also 202Hg onto Faraday collectors, providing more flexibility in the collector configurations that could be used. In particular, it may be a means to measure 207Pb simultaneously with the spike isotope to help improve the precision of the ratio. Similarly, it may be possible to avoid the use of ion counting for small 235U signals, simplifying the analysis.
Demonstrating the ability to make U–Pb measurements by directly dissolving samples with an isotopic tracer and analysing with no further preparation other than dilution, opens another intriguing possibility for future method development; the prospect of some form of quasi-in situ isotope dilution analysis. If an acid-cleaned subsample can be dissolved directly with the tracer and analysed, there is no reason, in principle, why an entire sample could not be acid cleaned and small domains then dissolved with the tracer for analysis while still in situ. Obviously, there would be practical hurdles to overcome, and this would not be a substitute for high spatial resolution techniques, but it could substantially streamline isotope dilution analysis and make it less destructive to the sample.
A new isotope dilution method for the U–Pb dating of carbonate samples is presented that removes the need for preconcentration of Pb. The new method produces data consistent with those obtained by isotope dilution with preconcentration of U and Pb, and with data obtained independently by another laboratory using laser ablation ICP-MS. The new method also generates self-consistent data; specifically, ages that vary systematically with growth direction without age reversals and which are concordant between the 238U–234U–206Pb and the 235U–207Pb chronometers. The new method thus satisfies reasonable data quality control criteria.
The new method is capable of utilising both the 238U–234U–206Pb chronometer and the 235U–207Pb chronometers, subject to inherent limitations imposed by sample age and isotopic composition.
All data used are contained within Table 2.
AJM carried out the isotope dilution method development, analyses and age interpretation. AV, GMH and SFMB obtained funding supporting this work. AV, SFMB and JNH obtained samples and assisted with sample preparation. JNH provided reference laser ablation data. AJM wrote the manuscript with input from all co-authors.
The authors declare that they have no conflict of interest.
Publisher's note: Copernicus Publications remains neutral with regard to jurisdictional claims in published maps and institutional affiliations.
Speleoclub Arabika Irkutsk is thanked for invaluable assistance in obtaining speleothem samples from Siberia. Nick Roberts (NIGL) is thanked for assistance in obtaining reference laser ablation data for JOHO-1. Shell is thanked for providing sample JOHO-1.
This research has been supported by the Natural Environment Research Council (grant nos. NE/K005057/1 and NE/G013829/1) and the Deutsche Forschungsgemeinschaft (grant no. BR 3437/2-1).
This paper was edited by Norbert Frank and reviewed by Robert Cliff and Ryan Ickert.
Bajo, P., Drysdale, R., Woodhead, J., Hellstrom, J., and Zanchetta, G.: High-resolution U-Pb dating of an Early Pleistocene stalagmite from Corchia Cave (central Italy), Quat. Geochronol., 14, 5–17, https://doi.org/10.1016/j.quageo.2012.10.005, 2012.
Belshaw, N. S., Freedman, P. A., O'Nions, R. K., Frank, M., and Guo, Y.: A new variable dispersion double-focusing plasma mass spectrometer with performance illustrated for Pb isotopes, Int. J. Mass Spectrom., 181, 51–58, https://doi.org/10.1016/S1387-3806(98)14150-7, 1998.
Cheng, H., Edwards, R. L., Murrell, M. T., and Benjamin, T. M.: Uranium-thorium-protactinium dating systematics, Geochim. Cosmochim. Ac., 62, 3437–3452, https://doi.org/10.1016/S0016-7037(98)00255-5, 1998.
Cheng, H., Lawrence Edwards, R., Shen, C. C., Polyak, V. J., Asmerom, Y., Woodhead, J., Hellstrom, J., Wang, Y., Kong, X., Spötl, C., Wang, X., and Calvin Alexander, E.: Improvements in 230Th dating, 230Th and 234U half-life values, and U-Th isotopic measurements by multi-collector inductively coupled plasma mass spectrometry, Earth Planet. Sc. Lett., 371–372, 82–91, https://doi.org/10.1016/j.epsl.2013.04.006, 2013.
Cliff, R. A., Spötl, C., and Mangini, A.: U-Pb dating of speleothems from Spannagel Cave, Austrian Alps: A high resolution comparison with U-series ages, Quat. Geochronol., 5, 452–458, https://doi.org/10.1016/j.quageo.2009.12.002, 2010.
Edwards, R. L., Gallup, C. D., and Cheng, H.: Uranium-series Dating of Marine and Lacustrine Carbonates, Rev. Mineral. Geochem., 52, 363–405, https://doi.org/10.2113/0520363, 2003.
Faure, G.: Principles of Isotope Geology, John Wiley & Sons, New York, 1986.
Getty, S. R., Asmerom, Y., Quinn, T. M., and Budd, A. F.: Accelerated Pleistocene coral extinctions in the Caribbean Basin shown by uranium-lead (U-Pb) dating, Geology, 29, 639–642, https://doi.org/10.1130/0091-7613(2001)029<0639:APCEIT>2.0.CO;2, 2001.
Heaman, L. and Parrish, R.: U-Pb Geochrononology of Accessory Minerals, in: Short course Handbook on Applications of Radiogenic Isotope Systems to Problems in Geology, edited by: Heaman, L. and Ludden, J. N., Mineralogical Association of Canada, 59–102, 1991.
Hiess, J., Condon, D. J., McLean, N., and Noble, S. R.: Systematics in Terrestrial Uranium-Bearing Minerals, Science, 335, 1610LP–1614, https://doi.org/10.1126/science.1215507, 2012.
Kronfeld, J., Vogel, J. C., and Talma, A. S.: A new explanation for extreme disequilibria in a dolomitic aquifer, Earth Planet. Sc. Lett., 123, 81–93, https://doi.org/10.1016/0012-821X(94)90259-3, 1994.
Li, Q., Parrish, R. R., Horstwood, M. S. A., and Mcarthur, J. M.: U–Pb dating of cements in Mesozoic ammonites, Chem. Geol., 376, 76–83, https://doi.org/10.1016/j.chemgeo.2014.03.020, 2014.
Lin, Y., Jochum, K. P., Scholz, D., Hoffmann, D. L., Stoll, B., Weis, U., and Andreae, M. O.: In-situ high spatial resolution LA-MC-ICPMS 230Th/U dating enables detection of small-scale age inversions in speleothems, Solid Earth Sci., 2, 1–9, https://doi.org/10.1016/j.sesci.2016.12.003, 2017.
Ludwig, K. R.: Effect of initial radioactive-daughter disequilibrium on U-Pb isotope apparent ages of young minerals, J. Res., 5, 663–667, 1977.
Ludwig, K. R.: On the treatment of concordant uranium-lead ages, Geochim. Cosmochim. Acta, 62, 665–676, https://doi.org/10.1016/S0016-7037(98)00059-3, 1998.
Mason, A. J. and Henderson, G. M.: Correction of multi-collector-ICP-MS instrumental biases in high-precision uranium-thorium chronology, Int. J. Mass Spectrom., 295, 26–35, https://doi.org/10.1016/j.ijms.2010.06.016, 2010.
Mason, A. J., Henderson, G. M. and Vaks, A.: An acetic acid-based extraction protocol for the recovery of U, Th and Pb from calcium carbonates for U-(Th)-Pb geochronology, Geostand. Geoanal. Res., 37, 261–275, https://doi.org/10.1111/j.1751-908X.2013.00219.x, 2013.
Moorbath, S., Taylor, P. N., Orpen, J. L., Treloar, P., and Wilson, J. F.: First direct radiometric dating of Archaean stromatolitic limestone, Nature, 326, 865–867, https://doi.org/10.1038/326865a0, 1987.
Nuriel, P., Rosenbaum, G., Zhao, J.-X., Feng, Y., Golding, S. D., Villemant, B., and Weinberger, R.: U-Th dating of striated fault planes, Geology, 40, 647–650, https://doi.org/10.1130/G32970.1, 2012.
Pickering, R., Kramers, J. D., Partridge, T., Kodolanyi, J., and Pettke, T.: Quaternary Geochronology U – Pb dating of calcite – aragonite layers in speleothems from hominin sites in South Africa by MC-ICP-MS, Quat. Geochronol., 5, 544–558, https://doi.org/10.1016/j.quageo.2009.12.004, 2010.
Plagnes, V., Causse, C., Genty, D., Paterne, M., and Blamart, D.: A discontinuous climatic record from 187 to 74 ka from a speleothem of the Clamouse Cave (south of France), Earth Planet. Sc. Lett., 201, 87–103, https://doi.org/10.1016/S0012-821X(02)00674-X, 2002.
Rasbury, E. T. and Cole, J. M.: Directly dating geologic events: U-Pb dating of carbonates, Rev. Geophys., 47, 1–27, https://doi.org/10.1029/2007RG000246, 2009.
Rasbury, E. T., Hanson, G. N., Meyers, W. J., and Saller, A. H.: Dating of the time of sedimentation using U-Pb ages for paleosol calcite, Geochim. Cosmochim. Ac., 61, 1525–1529, https://doi.org/10.1016/S0016-7037(97)00043-4, 1997.
Richards, D. A., Bottrell, S. H., Cliff, R. A., Ströhle, K., and Rowe, P. J.: U-Pb dating of a speleothem of Quaternary age, Geochim. Cosmochim. Ac., 62, 3683–3688, https://doi.org/10.1016/S0016-7037(98)00256-7, 1998.
Roberts, N. M. W., Rasbury, E. T., Parrish, R. R., Smith, C. J., Horstwood, M. S. A., and Condon, D. J.: A calcite reference material for LA-ICP-MS U-Pb geochronology, Geochem. Geophy. Geosy., 18, 2807–2814, https://doi.org/10.1002/2016GC006784, 2017.
Scholz, D. and Hoffmann, D.: 230Th/U-dating of fossil corals and speleothems, E&G Quaternary Sci. J., 57, 52–76, https://doi.org/10.3285/eg.57.1-2.3, 2008.
Spooner, P. T., Chen, T., Robinson, L. F., and Coath, C. D.: Rapid uranium-series age screening of carbonates by laser ablation mass spectrometry, Quat. Geochronol., 31, 28–39, https://doi.org/10.1016/j.quageo.2015.10.004, 2016.
Steiger, R. H. and Jäger, E.: Subcommission on geochronology: Convention on the use of decay constants in Geo- and Cosmochronology, Earth Planet. Sc. Lett., 36, 359–362, https://doi.org/10.1016/0012-821X(77)90060-7, 1977.
Stirling, C. H., Andersen, M. B., Potter, E. K., and Halliday, A. N.: Low-temperature isotopic fractionation of uranium, Earth Planet. Sc. Lett., 264, 208–225, https://doi.org/10.1016/j.epsl.2007.09.019, 2007.
Szymanowski, D. and Schoene, B.: U-Pb ID-TIMS geochronology using ATONA amplifiers, J. Anal. Atom. Spectrom., 35, 1207–1216, https://doi.org/10.1039/d0ja00135j, 2020.
Thomas, A. L., Fujita, K., Iryu, Y., Bard, E., Cabioch, G., Camoin, G., Cole, J. E., Deschamps, P., Durand, N., Hamelin, B., Heindel, K., Henderson, G. M., Mason, A. J., Matsuda, H., Ménabréaz, L., Omori, A., Quinn, T., Sakai, S., Sato, T., Sugihara, K., Takahashi, Y., Thouveny, N., Tudhope, A. W., Webster, J., Westphal, H., and Yokoyama, Y.: Assessing subsidence rates and paleo water-depths for Tahiti reefs using U-Th chronology of altered corals, Mar. Geol., 295–298, 86–94, https://doi.org/10.1016/j.margeo.2011.12.006, 2012.
Vaks, A., Woodhead, J., Bar-matthews, M., Ayalon, A., Cliff, R. A., and Zilberman, T.: Pliocene – Pleistocene climate of the northern margin of Saharan – Arabian Desert recorded in speleothems from the Negev Desert, Israel, Earth Planet. Sc. Lett., 368, 88–100, https://doi.org/10.1016/j.epsl.2013.02.027, 2013a.
Vaks, A., Gutareva, O. S., Breitenbach, S. F. M., Avirmed, E., Mason, A. J., Thomas, A. L., Osinzev, A. V, Kononov, A. M., and Henderson, G. M.: Speleothems reveal 500,000-year history of Siberian permafrost, Science, 61), 183–186, https://doi.org/10.1126/science.122872, 2013b.
Vaks, A., Mason, A. J., Breitenbach, S. F. M., Kononov, A. M., Osinzev, A. V., Rosensaft, M., Borshevsky, A., Gutareva, O. S., and Henderson, G. M.: Palaeoclimate evidence of vulnerable permafrost during times of low sea ice, Nature, 577, 221–225, https://doi.org/10.1038/s41586-019-1880-1, 2020.
Wang, Z. S., Rasbury, E. T., Hanson, G. N., and Meyers, W. J.: Using the U-Pb system of calcretes to date the time of sedimentation of clastic sedimentary rocks, Geochim. Cosmochim. Ac., 62, 2823–2835, https://doi.org/10.1016/S0016-7037(98)00201-4, 1998.
Weyer, S., Anbar, A. D., Gerdes, A., Gordon, G. W., Algeo, T. J. and Boyle, E. A.: Natural fractionation of , Geochim. Cosmochim. Ac., 72, 345–359, https://doi.org/10.1016/j.gca.2007.11.012, 2008.
Woodhead, J. and Petrus, J.: Exploring the advantages and limitations of in situ U–Pb carbonate geochronology using speleothems, Geochronology, 1, 69–84, https://doi.org/10.5194/gchron-1-69-2019, 2019.
Woodhead, J. and Pickering, R.: Beyond 500 ka: Progress and prospects in the U/Pb chronology of speleothems, and their application to studies in palaeoclimate, human evolution, biodiversity and tectonics, Chem. Geol., 322–323, 290–299, https://doi.org/10.1016/j.chemgeo.2012.06.017, 2012.
Woodhead, J., Hellstrom, J., Maas, R., Drysdale, R., Zanchetta, G., Devine, P., and Taylor, E.: U – Pb geochronology of speleothems by MC-ICPMS, Quat. Geochronol., 1, 208–221, https://doi.org/10.1016/j.quageo.2006.08.002, 2006.
York, D.: Least squares fitting of a straight line with correlated errors, Earth Planet. Sc. Lett., 5, 320–324, https://doi.org/10.1016/S0012-821X(68)80059-7, 1969.
- Abstract
- Introduction
- Overview of the U–(Th)–Pb system and the motivation for a new method
- Protocol description
- Protocol validation methodology and sampling
- Protocol validation results
- SB_pk142 results
- Discussion
- Conclusions
- Data availability
- Author contributions
- Competing interests
- Disclaimer
- Acknowledgements
- Financial support
- Review statement
- References