the Creative Commons Attribution 4.0 License.
the Creative Commons Attribution 4.0 License.
 | 25 Jan 2022
Investigation of quartz electron spin resonance residual signals in the last glacial and early Holocene fluvial deposits from the Lower Rhine
Marcus Richter
Sumiko Tsukamoto
In this study, we examined the residual doses of the quartz electron spin resonance (ESR) signals from eight young fluvial sediments with known luminescence ages from the Lower Rhine terraces. The single aliquot regenerative (SAR) protocol was applied to obtain the residual doses for both the aluminium (Al) and titanium (Ti) impurity centres. We show that all of the fluvial samples carry a significant amount of residual dose with a mean value of 1270 ± 120 Gy for the Al centre (including the unbleachable signal component), 591 ± 53 Gy for the lithium-compensated Ti centre (Ti-Li), 170 ± 21 Gy for the hydrogen-compensated Ti centre (Ti-H) and 453 ± 42 Gy for the signal that originated from both the Ti-Li and Ti-H centres (termed Ti-mix). To test the accuracy of the ESR SAR protocol, a dose recovery test was conducted and this confirmed the validity of the Ti-Li and Ti-mix signal results. The Al centre shows a dose recovery ratio of 1.75 ± 0.18, whereas the Ti-H signal shows a ratio of 0.55 ± 0.17, suggesting that the rate of signal production per unit dose changed for these signals after the thermal annealing. Nevertheless, all fluvial sediments investigated in this study carry a significant residual dose. Our result suggests that more direct comparisons between luminescence and ESR equivalent doses should be carried out, and, if necessary, the subtraction of residual dose obtained from the difference is essential to obtain reliable ESR ages.
- Article
(1020 KB) - Full-text XML
-
Supplement
(222 KB) - BibTeX
- EndNote


When sedimentary quartz was first investigated for electron spin resonance (ESR) dating 35 years ago by Yokoyama et al. (1985), a bleaching test was performed and an optically unbleachable residual signal for the Al centre was detected. Moreover “zero age” samples were investigated, residual signals were detected and subsequently subtracted from the natural signal intensity to calculate the equivalent dose (De). This procedure led to ESR ages which were in good agreement with expected ages. Over the years, several bleaching experiments on quartz ESR signals were conducted and varying proportions of bleachable and unbleachable signal intensities for the Al centre were reported (e.g. Toyoda et al., 2000; Voinchet et al., 2003; Rink et al., 2007; Tsukamoto et al., 2018; Beerten et al., 2020). The Ti centre instead showed a better but varying optical bleachability depending on the monovalent charge compensator: the Ti-Na centre and the Ti-H centre were fully bleached within 24 h of artificial optical bleaching using a halogen lamp, whereas the Ti-Li centre was bleached within 72 to 168 h (Toyoda et al., 2000). Investigations of different samples revealed a significant variability in bleaching kinetics for both the Ti-Li and the Ti-H signals (e.g. Tissoux et al., 2007; Duval et al., 2017). The Ti centre is believed to be fully bleachable by sunlight exposure (e.g. Toyoda et al., 2000; Tissoux et al., 2007). So far, very few studies have reported residual doses of the quartz ESR signals from young or modern analogue samples, which could be directly comparable with the quartz optically stimulated luminescence (OSL) De values. Beerten et al. (2006) found a total of 55 Gy (Ti-Li) for the youngest sample in a aeolian sedimentary profile and see this as a strong indicator of an unbleachable or unbleached residual dose. Tsukamoto et al. (2017) used modern aeolian quartz samples, whose OSL signal is well bleached, to investigate the bleachability of the ESR signals. They found large and varying residual doses for both the Al and Ti centres: from 130 to larger than 1700 Gy for the Al centre (including the unbleachable signal component) and from 60 to 460 Gy for the Ti centre. They thus emphasised the importance of subtracting the residual dose, not only for the Al centre but also for the Ti centre. Timar-Gabor et al. (2020) measured the residual dose of aeolian samples from Australia and Ukraine, which have reported OSL De values. For all samples, the ESR residual doses were found to be significantly larger than the OSL De, with the Al centre (also with unbleachable signal component) ranging from 480 to 700 Gy and the Ti centre ranging 100 to 580 Gy, highlighting the necessity of performing a residual dose subtraction. Although studies were done on dating fluvial sediments using ESR (e.g. Yokoyama et al., 1985; Laurent et al., 1998; Bahain et al., 2007; Tissoux et al., 2007, 2008; Duval et al., 2015, 2020; Bartz et al., 2018; Voinchet et al., 2019; del Val et al., 2019), the potential effects of the residual signals before deposition in both the Al centre and Ti centre have not been well investigated. Voinchet et al. (2015) introduced a bleaching index for various fluvial and aeolian sediment samples, and a very small residual dose of 4–28 Gy, after subtracting the unbleachable signal of the Al centre, has been reported. Toyoda et al. (2000) conducted a comparison of the signal bleachability derived from multiple signals. Based on the result, they reported quartz ESR intensities from multiple centres with different bleachability. An agreement of the ages can confirm that the signals were well bleached before deposition. Since then, this so-called “multiple centres” approach has been applied in several studies (e.g. Duval et al., 2015, 2017; Bartz et al., 2018, 2020). A similar comparison was also conducted between the quartz ESR ages and feldspar post-infrared stimulated luminescence (IRSL) or quartz thermally transferred (TT-) OSL ages (Bartz et al., 2019, 2020).
Another important issue which affects the accuracy of ESR dating is the ability of the measurement protocol to recover a known dose (Murray and Wintle, 2003). Previously, ESR dose recovery tests have been conducted by Beerten et al. (2008) on quartz derived from dune sands and Asagoe et al. (2011), who used quartz from tephra samples. Unfortunately, both studies use an intensive thermal treatment (annealing) of the sample to erase the natural signal before artificial irradiation, which reduces the significance of the test. Tsukamoto et al. (2017) applied a SAR-SARA (single aliquot regeneration and added dose; Mejdahl and Bøtter-Jensen, 1994) procedure for unheated modern sediments and used a slope between the added dose on top of the natural dose and the measured dose as a surrogate for the dose recovery ratio (Kars et al., 2014). A similar method was also adopted by Toyoda et al. (2009) and Fang and Grün (2020), who plotted the relationship between the added dose on natural aliquots and the increase in the apparent dose.
This study aims to investigate the size of the residual doses for the quartz Al and Ti centres in fluvial sediments using eight samples with known OSL ages (Lauer et al., 2011). In this study, we define the residual dose as the ESR De values minus the OSL De of the same sample, and this includes both bleachable and unbleachable components of the Al centre. These young sediments are investigated using the ESR SAR protocol and its performance is monitored by conducting dose recovery tests.
Fluvial sediments from Lauer et al. (2011) are from five gravel pits on either side of the lower terraces of the Rhine (Frechen, 1992) covering a clearance of 90 km from Niederkassel to Rheinberg, North Rhine-Westphalia, were used in this study. All sediments originated from the younger lower terrace of the Rhine River. A brief description of the samples is given in Table 1 and a detailed description of the sedimentary environment is given in Lauer et al. (2011). Previous work from Lauer et al. (2011) provides OSL De using SAR protocol in the range of several tens of Gray (see Table 2). They used IR-stimulated and yellow-stimulated luminescence signals of potassium-rich feldspar as well as OSL of quartz to date a total of 11 samples. Mean quartz OSL De values range from 14.8 ± 0.3 to 33.3 ± 1.4 Gy with dose rates in the range of 1.48 ± 0.15 to 2.41 ± 0.18 Gy kyr−1. The mean OSL ages range from 8.6 ± 0.5 to 16.0 ± 1.3 ka (see Table 3). Thus, the sediments are Holocene or late Pleistocene age rendering them to be treated as young samples for ESR residual measurements. All samples show the Al and Ti centres, but three samples (ALH-I, ALH-II and MHT-I) showed a broad and strong, overlapping signal, presumably arising from paramagnetic Mn2+ and Fe3+ impurities. Eventually, eight samples of a grain size ranging from 100 to 250 µm were used to conduct ESR measurements. These are exactly the same samples that Lauer et al. (2011) used. No additional preparation steps were taken.
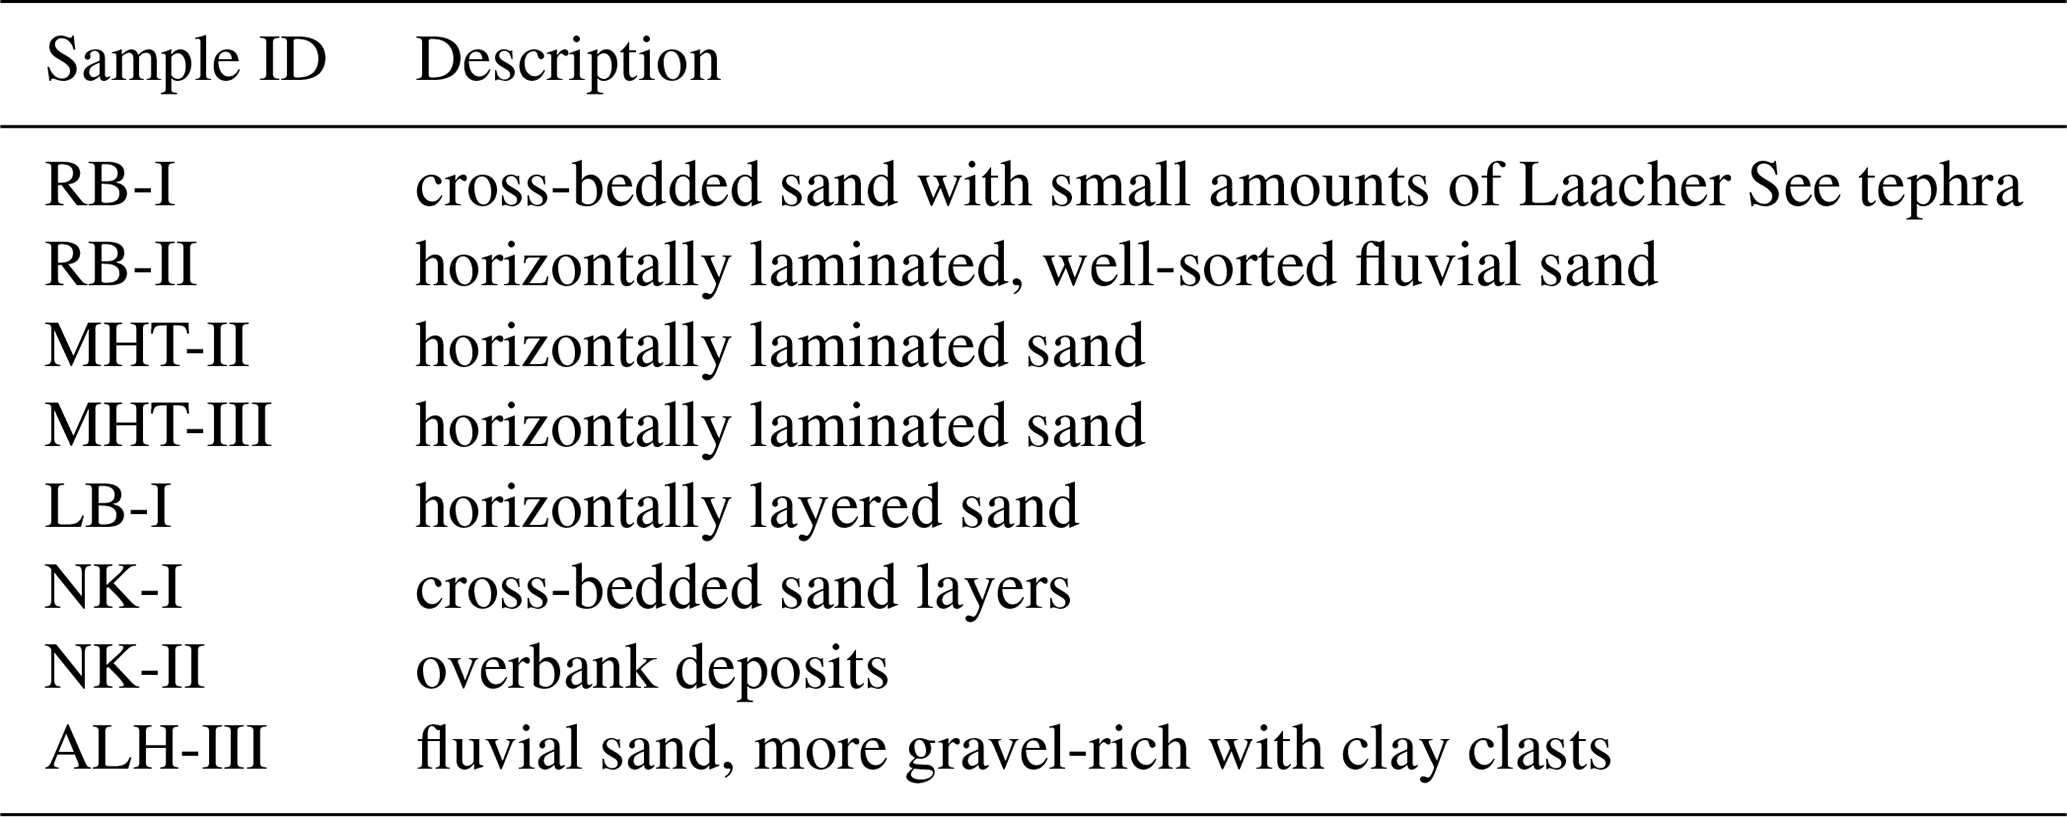
Table 2Mean ESR equivalent doses (De) and residual doses of the four signals compared with the mean OSL De.
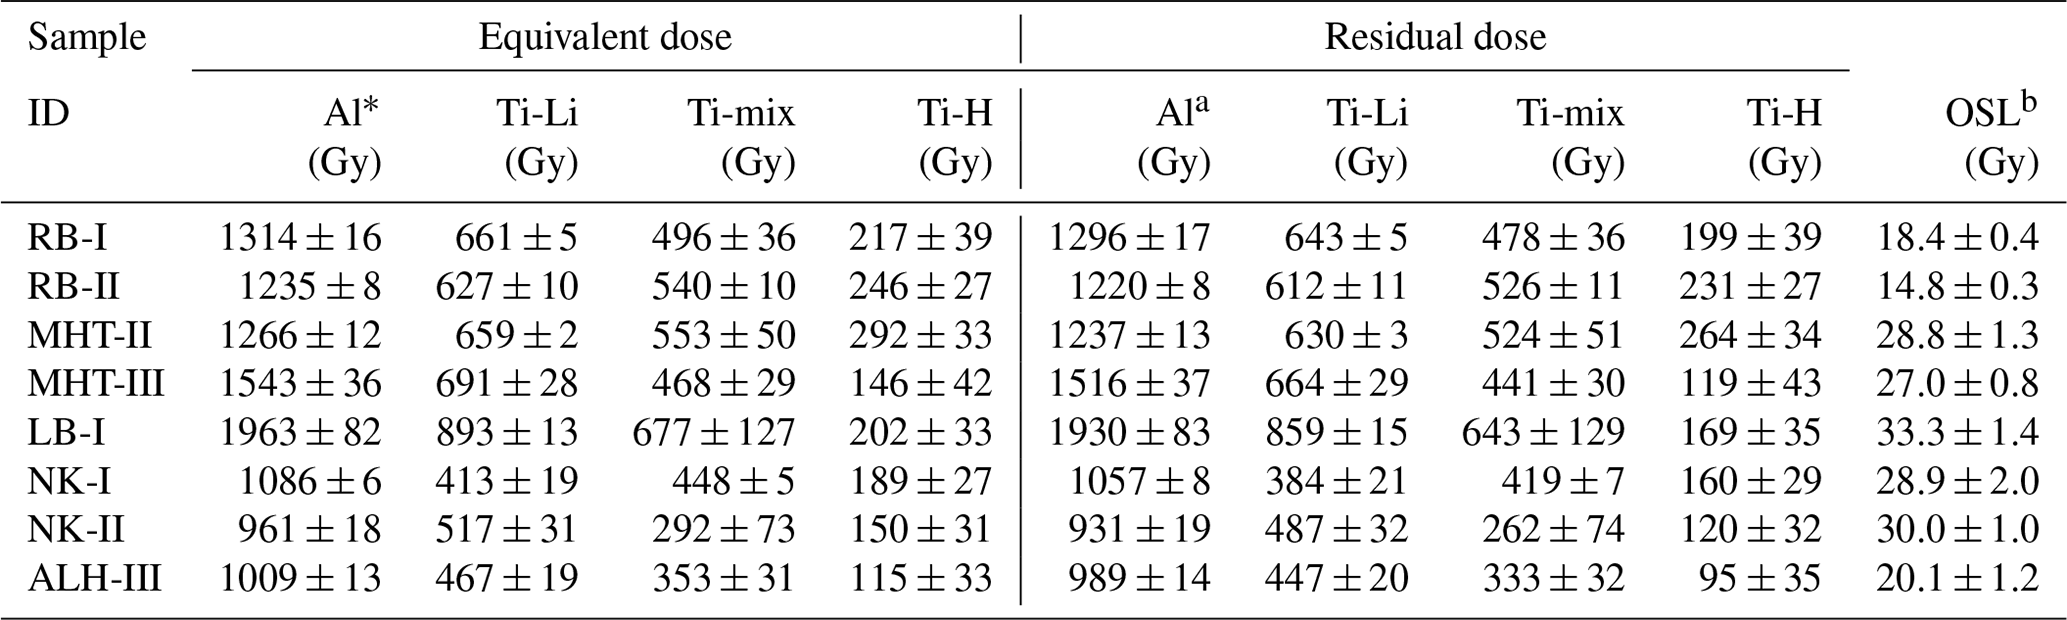
a Including unbleachable signal component. b Lauer et al. (2011).
Table 3External dose rates, ESR ages derived from De, residual ages before burial and mean OSL ages for comparison.
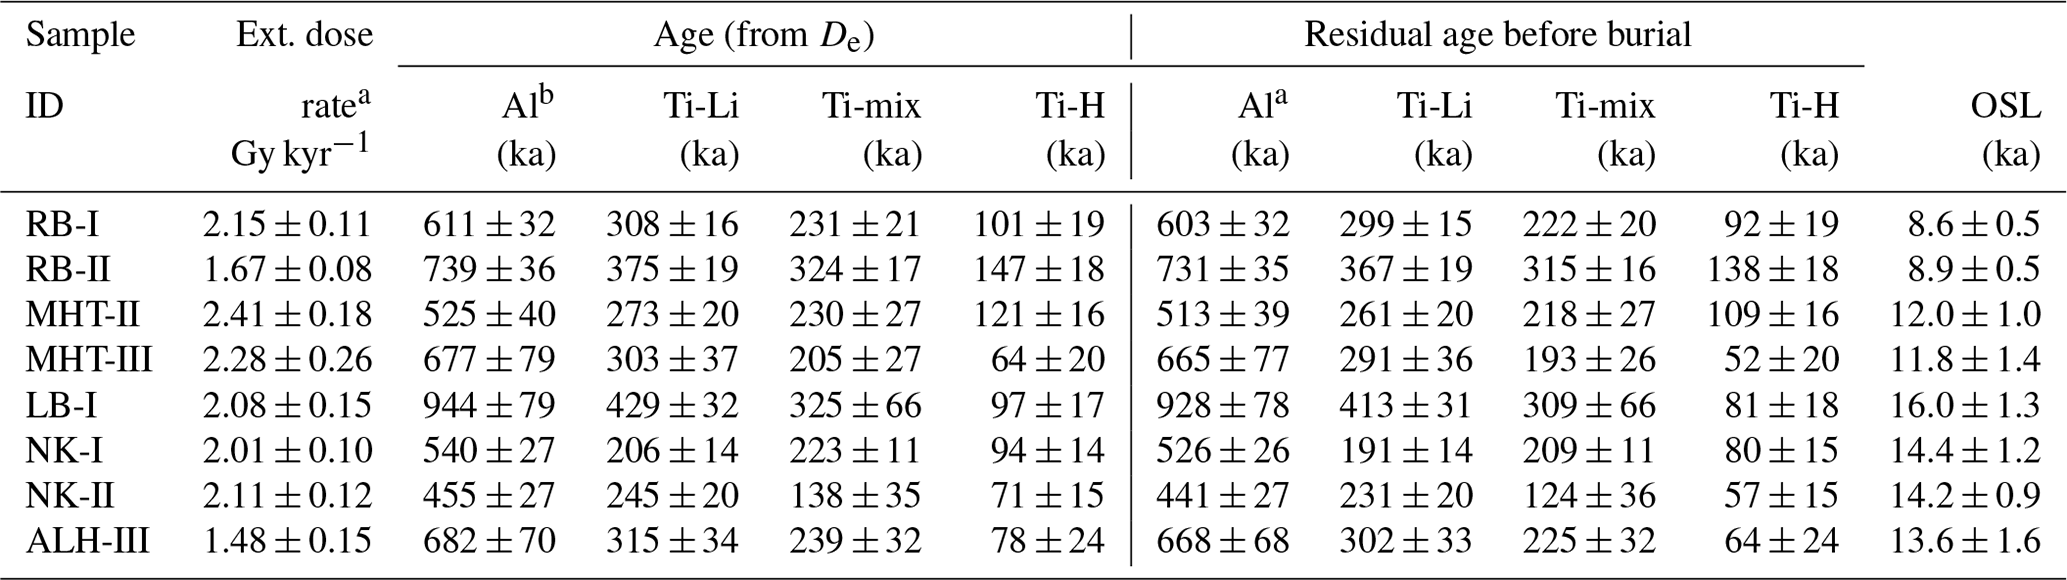
a Lauer et al. (2011). b Including unbleachable signal component.
A Bruker ELEXSYS E500 X-band ESR spectrometer with a variable temperature controller was used to run all measurements. The temperature inside the ER4119HS cavity was kept at 100 K through the evaporation of liquid nitrogen. The measurement settings for the detection of the Al centre [AlO4]0 were 335 ± 15 mT scanned magnetic field, modulation amplitude 0.1 mT, modulation frequency 100 kHz, 40 ms conversion time and 122.9 s sweep time and three to five scans. For the Ti centre [TiO4 M+]0, the settings were 350 ± 5 mT scanned magnetic field, modulation amplification 0.1 mT, modulation frequency 100 kHz, 30 ms conversion time and 61.4 s sweep time and 5–10 scans of the spectra. For all measurements, the microwave power was kept at 10 mW and the sample size was 60 mg. The light exposure of the quartz grains within the ESR quartz-glass sample tubes was kept at a minimum during the heating, artificial irradiation and ESR measurements. Furthermore, sample tubes were stored in opaque black plastic bags between measurements. During the measurements, meticulous care was taken to ensure that the sample quantity and sample tube positioning and measurement temperature always remained the same for all measurements. The quality factor (Q) of the cavity was always greater than 8000 during the runs. All the samples were rotated three times in the cavity to calculate the mean signal intensity and to take into account the angular dependence of the signal.
As suggested by Toyoda and Falguères (2003), the intensity of the Al centre was taken from the first (g=2.0185) to the last peak (g=1.9928), as depicted in Fig. 1a. The overlapping peroxy signal intensity was subtracted eventually by using the ESR signal intensity after annealing (step 4; see Table 4). The intensity of the Ti centre signals was evaluated from peak-to-baseline or peak-to-peak amplitude following Tissoux et al. (2008), Duval and Guilarte (2015) and Duval et al. (2017) (Fig. 1a and b). The intensity of the Ti-Li centre was taken from the baseline to the peak at g3=1.913, although this may be affected by Ti-H centre (cf. Tissoux et al., 2008). The intensity of the Ti-H centre was calculated from the g3=1.915 peak to the baseline. Duval and Guilarte (2015) used the peak-to-peak intensity at around g2=1.931 (see Fig. 1a and b) originating from both Ti-H and Ti-Li centres (referred to as Ti-mix in this study). These three different measurement options for the Ti centre are equivalent to options D, C and B of Duval and Guilarte (2015), respectively. An in-house-built X-ray irradiator, consisting of a Spellmann XRB401 source, was used for all laboratory irradiations. The X-ray parameters were fixed to 200 kV and 2 mA, and the dose rate was calibrated to 0.052 ± 0.004 Gy s−1 (Tsukamoto et al., 2021). For heating and annealing of samples, an in-house-built device was used (Oppermann and Tsukamoto, 2015). The dose response curve (DRC) was fitted to a single saturated exponential function using Origin 2017 without any weighting to calculate De.
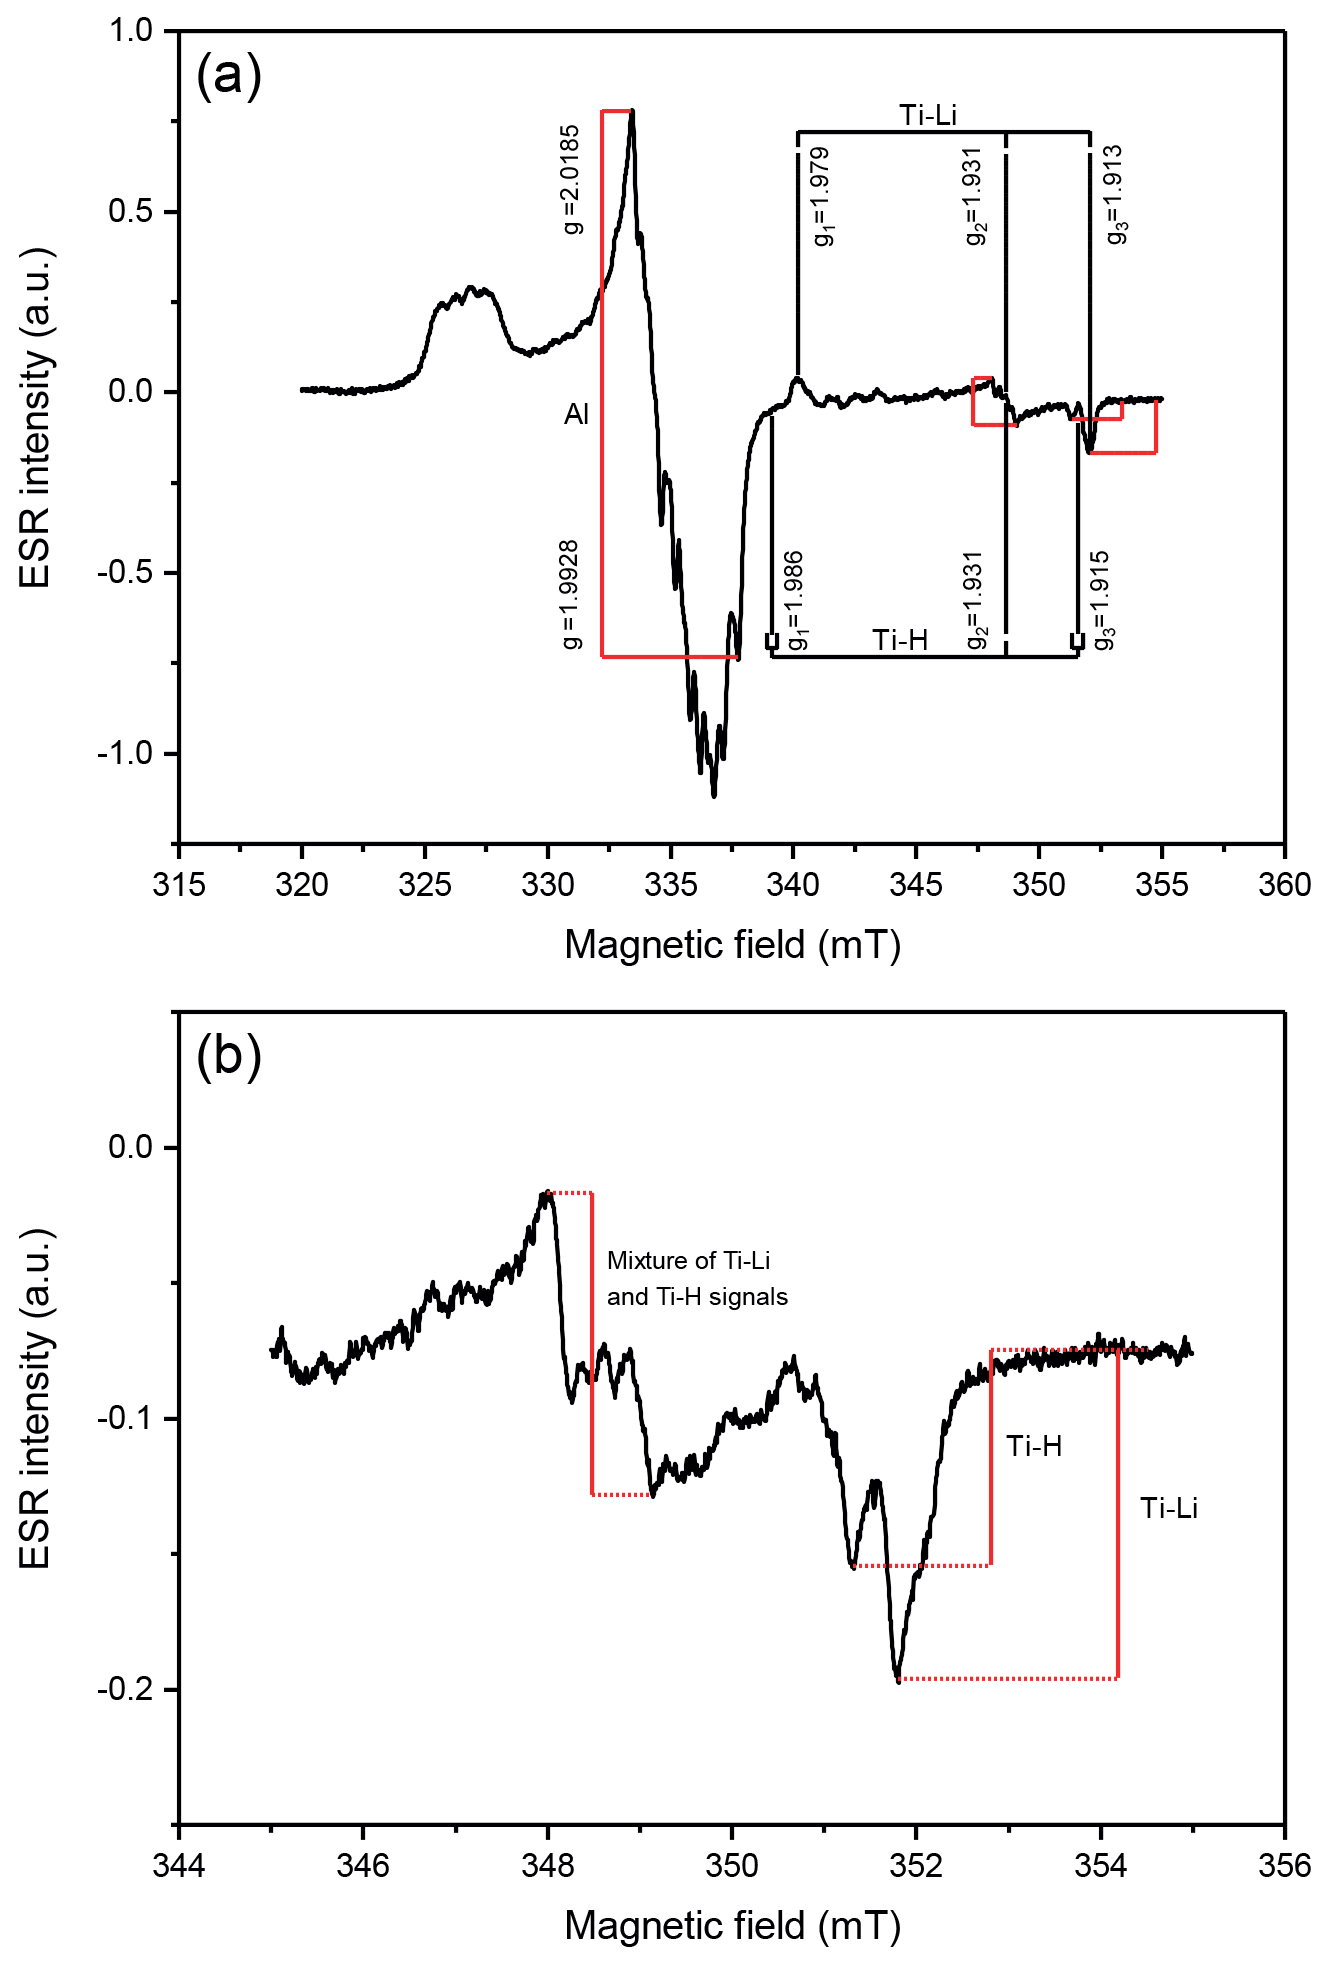
Figure 1(a) The natural Al centre and Ti centres of sample RB-II and overview of the g values; (b) close-up of titanium signals of sample RB-II after annealing and giving 500 Gy of artificial irradiation.

4.1 Preheat plateau test
The ESR SAR protocol (see Table 4), which has been tested and satisfyingly applied in previous studies in regards to the Ti centre (Tsukamoto et al., 2015, 2017, 2018; Richter et al., 2020), was used for all measurements. Prior to De measurements, a preheat plateau test was carried out to assure only stable signals are used. The sample with the lowest quartz OSL De was chosen for this test (RB-II; 14.8 ± 0.3 Gy). Temperatures were set to 160, 180, 200 and 220 ∘C. Additionally, an aliquot without heating treatment was used, which is referred to as 20 ∘C (room temperature). Heating time was 4 min for preheating and 120 min for annealing at 300 ∘C. In a previous study, Tsukamoto et al. (2015) compared 420 ∘C for 2 min and 300 ∘C for 120 min annealing time and found no significant difference in sensitivity change between both temperatures. Artificial irradiation dose steps used were 241, 963 and 2889 Gy to construct a dose response curve. The results are plotted in Fig. 2a. The De value of the Al centre was initially decreased by the preheat at 160 ∘C but shows a steady increase in De with increasing preheat temperature. At 220 ∘C, no De calculation was possible, because all regenerated signal intensities were below the natural. The Ti-Li and Ti-mix signals show a similar pattern in De; there was a small decrease from room temperature to 160 ∘C, but all preheats yielded similar De values, albeit a slight increasing trend with increasing temperature was observed. The Ti-H centre showed an opposite trend to Ti-Li and Ti-mix and showed a decrease in De with higher temperatures > 180 ∘C. Eventually, the preheat temperature was set to 160 ∘C for all of the following measurements because Ti-Li, Ti-H and Ti-mix De tend to form a plateau in the region of the 160–180 ∘C preheat temperature. An overview of the DRCs for 160 ∘C is shown in Fig. 2a, and each preheat temperature for each of the ESR centres can be found in Fig. S1 in the Supplement.
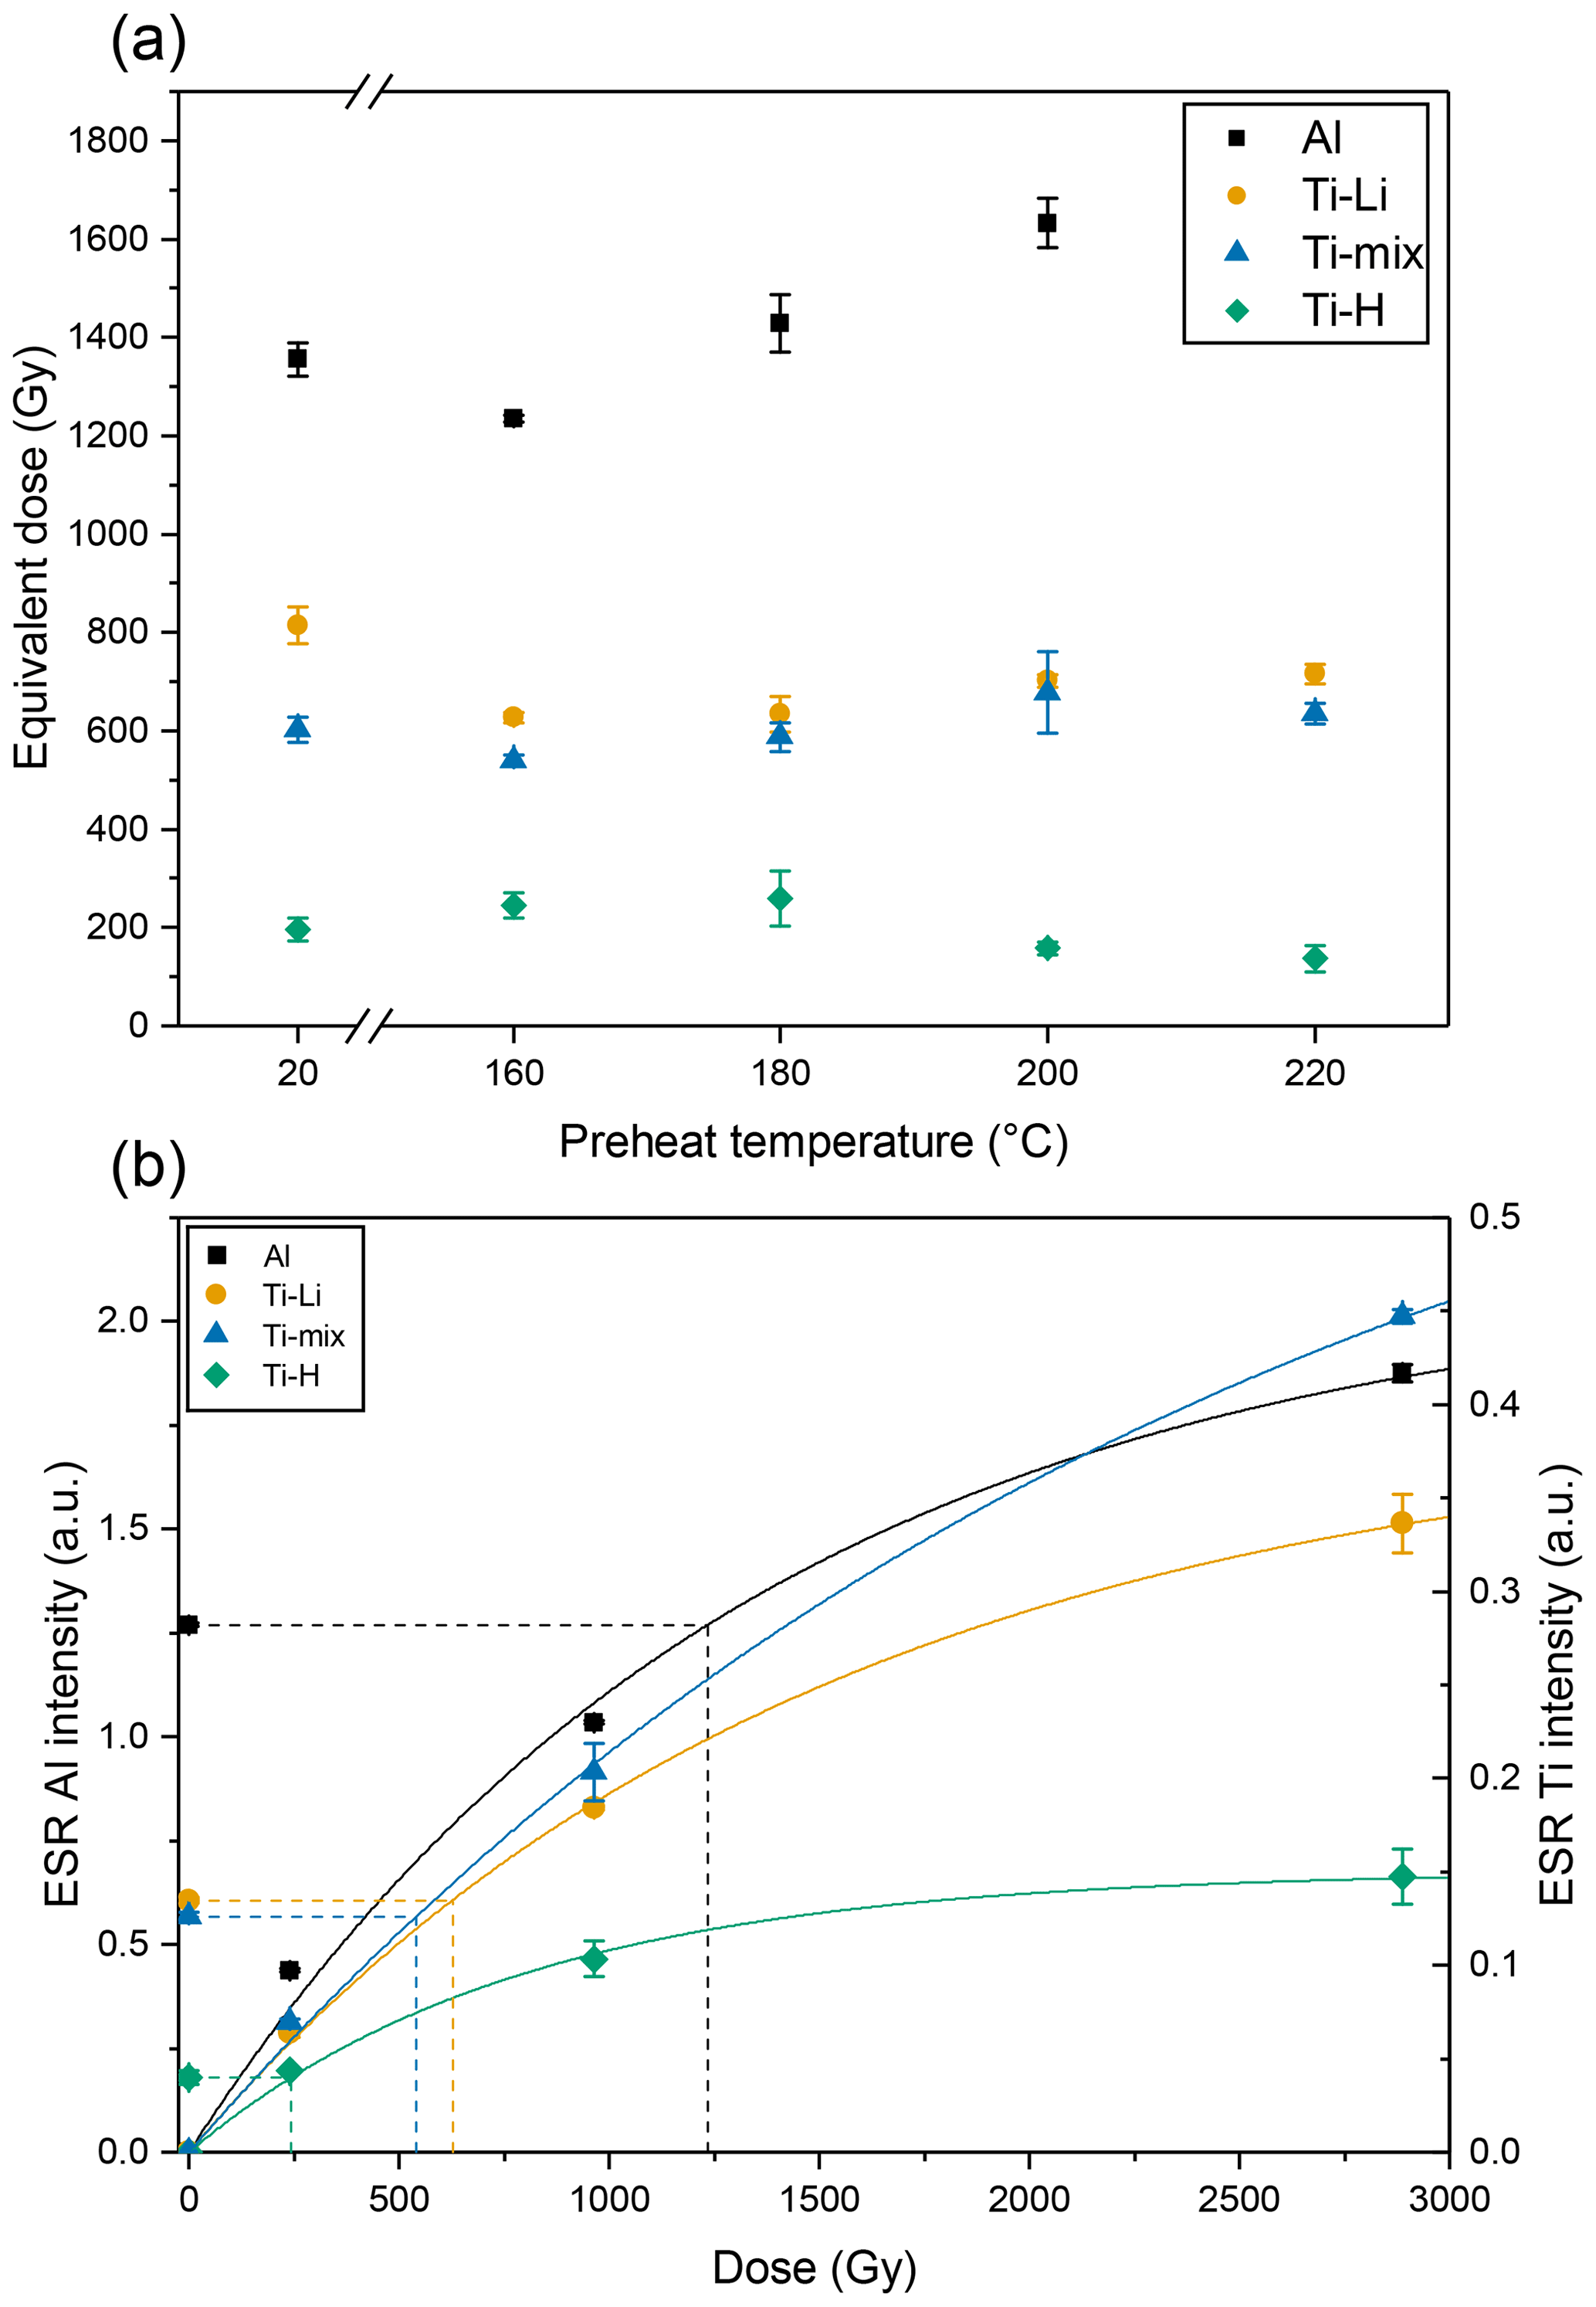
Figure 2(a) Preheat plateau test for sample RB-II. The dose response curve for Al centre for 220 ∘C did not fit, so the De value was not obtained. (b) Dashed lines indicate the mean dose for each signal. (b) The DRCs for 160 ∘C preheat temperature for each one of the ESR centres. The De values are marked.
4.2 Equivalent doses, residual doses and ESR ages
For each sample, one aliquot was used to conduct the De measurements. Dose response curves were created using three regenerated dose steps with a total dose up to 2889 Gy for all samples except for samples NK-1, NK-2 and ALH-III, which were irradiated up to 3022 Gy. The De values of the Al centre are in the range of 961 to 1963 Gy (including the unbleachable signal component). The De values of the Ti-Li centre span from 413 to 893 Gy. The Ti-mix De ranges from 292 to 677 Gy, and the Ti-H De goes from 115 to 292 Gy. The mean OSL De for each sample was subtracted from the ESR De to calculate the residual dose. This led to a residual dose of Al centre in the range of 931 to 1930 Gy with a mean value (±1 SE) of 1270 ± 120 Gy (including the unbleachable signal component). The Ti-Li centre residual dose goes from 384 to 859 Gy with a mean of 591 ± 53 Gy. The Ti-mix residual dose goes from 262 to 643 Gy with a mean of 453 ± 42 Gy, and Ti-H goes from 95 to 264 Gy with a mean of 170 ± 21 Gy. A detailed overview is given in Table 2. Residual doses of the four different ESR signals for all samples are plotted in Fig. 3. A detailed list of ages is given in Table 3. All the ESR ages significantly overestimate the OSL ages. The ages (calculated from the residual dose) are on average 634 ± 54 ka for Al centre (including the unbleachable signal component), 294 ± 25 ka for the Ti-Li, 227 ± 22 ka for the Ti-mix and 84 ± 10 ka for the Ti-H centre. These residual ages show how significant the effect of the residual dose may be in ESR dating of fluvial sediments.
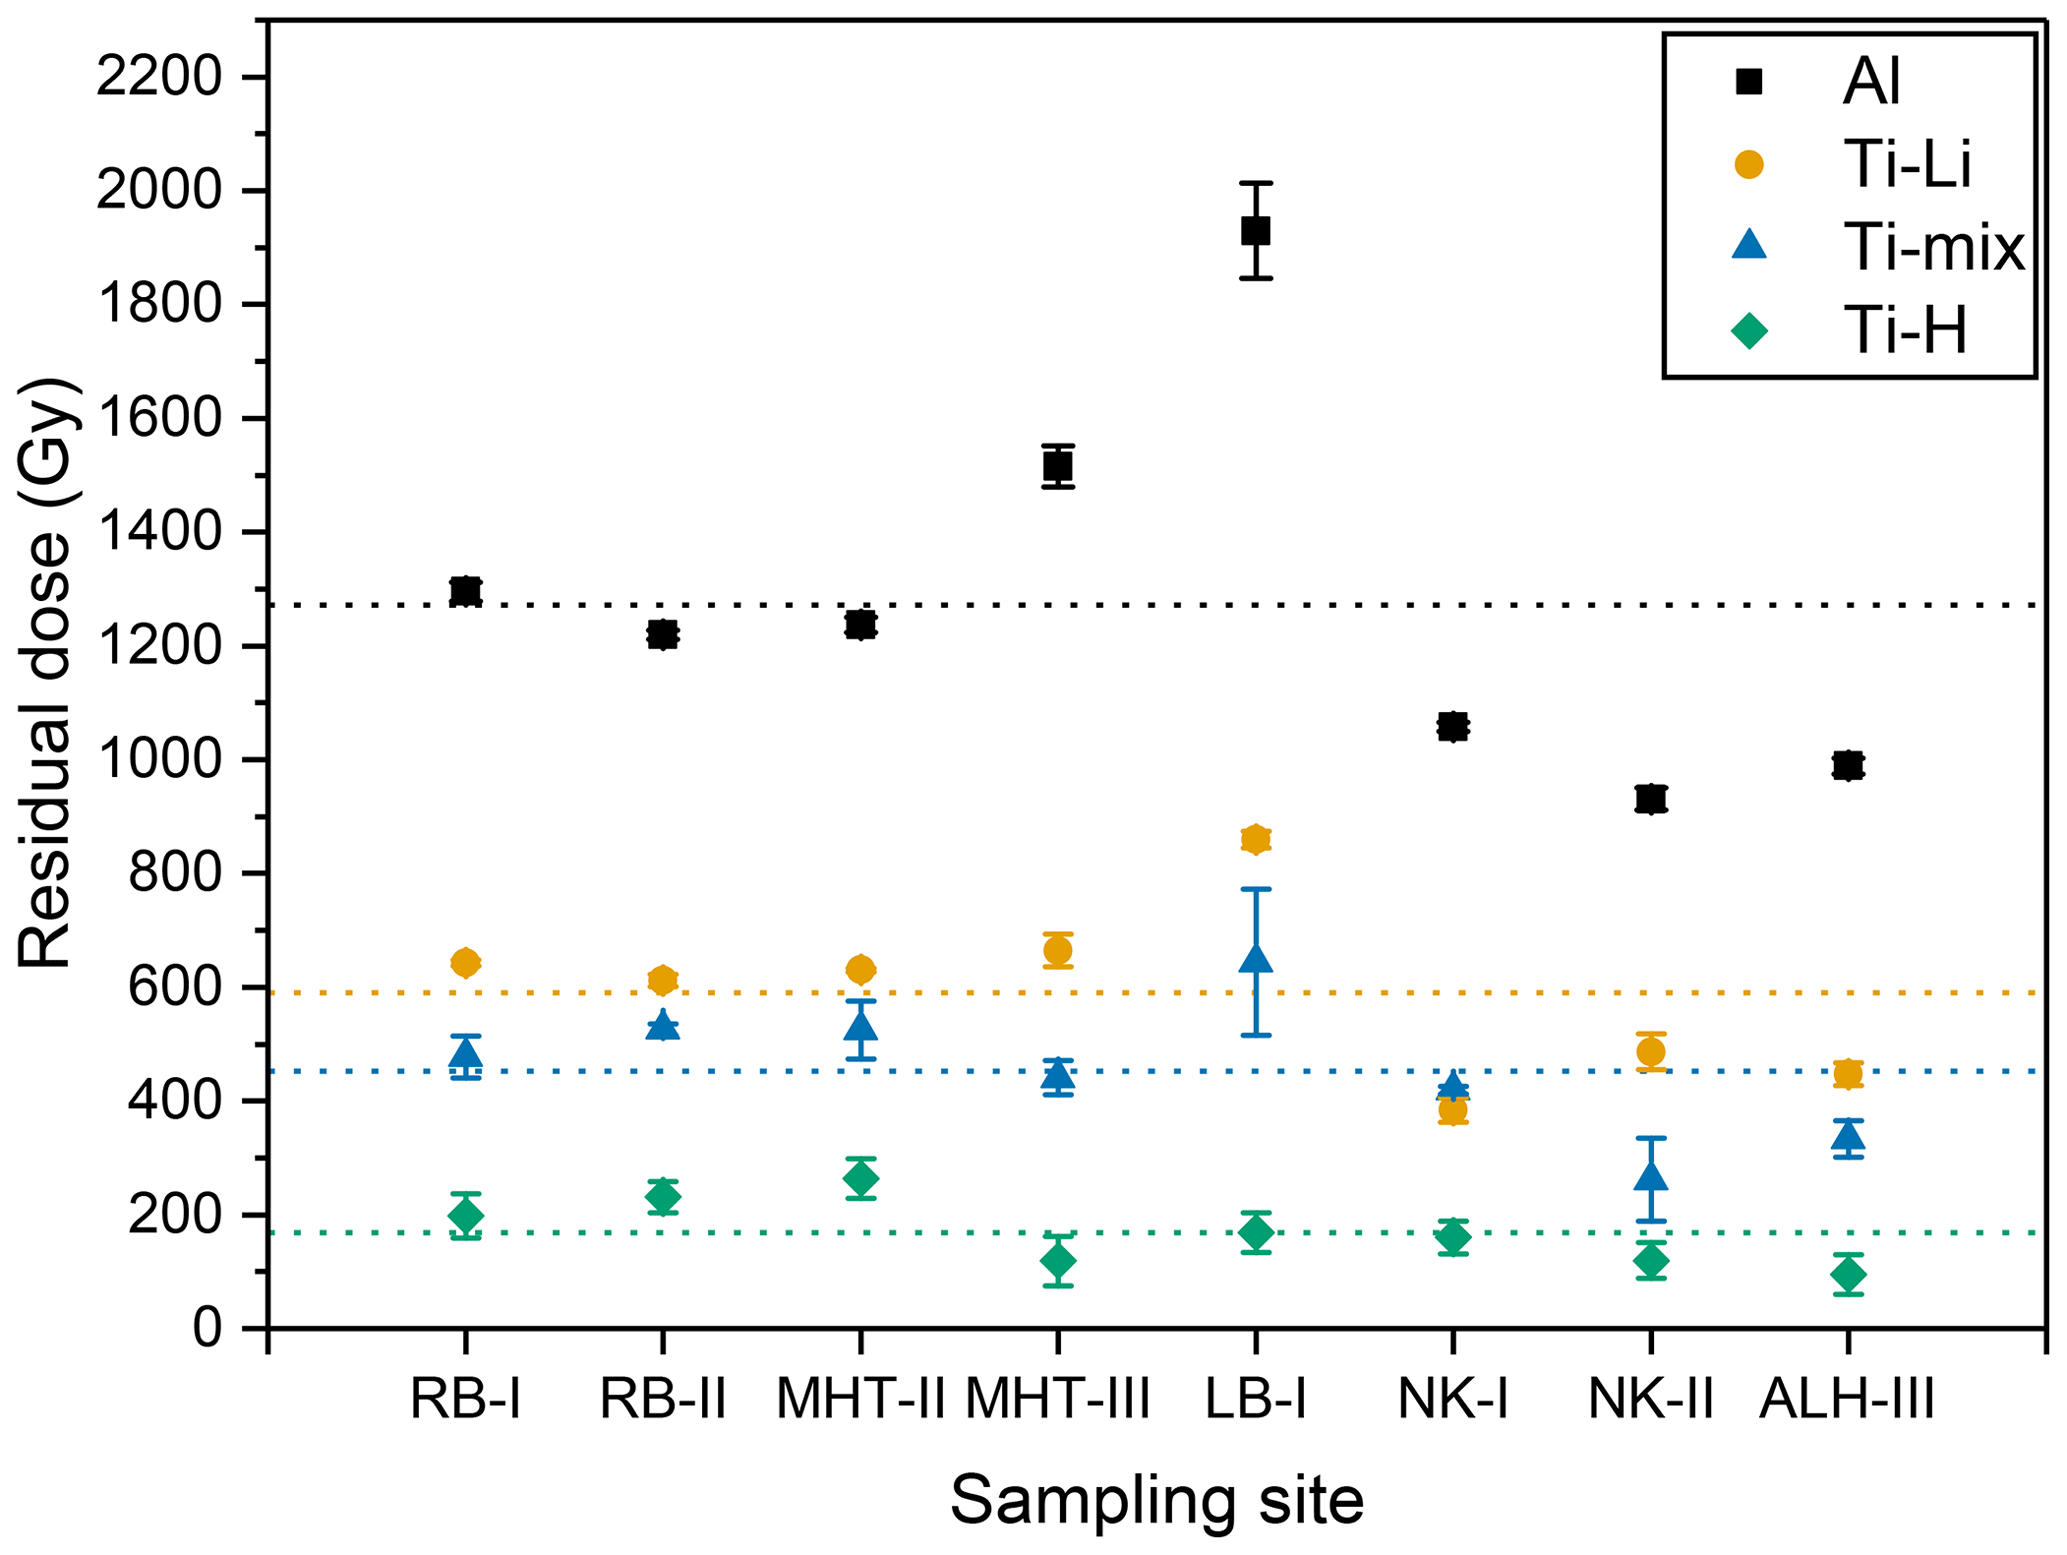
Figure 3Residual doses of the four different ESR signals for all samples. Dotted lines indicate the mean dose for each signal.
4.3 Dose recovery test
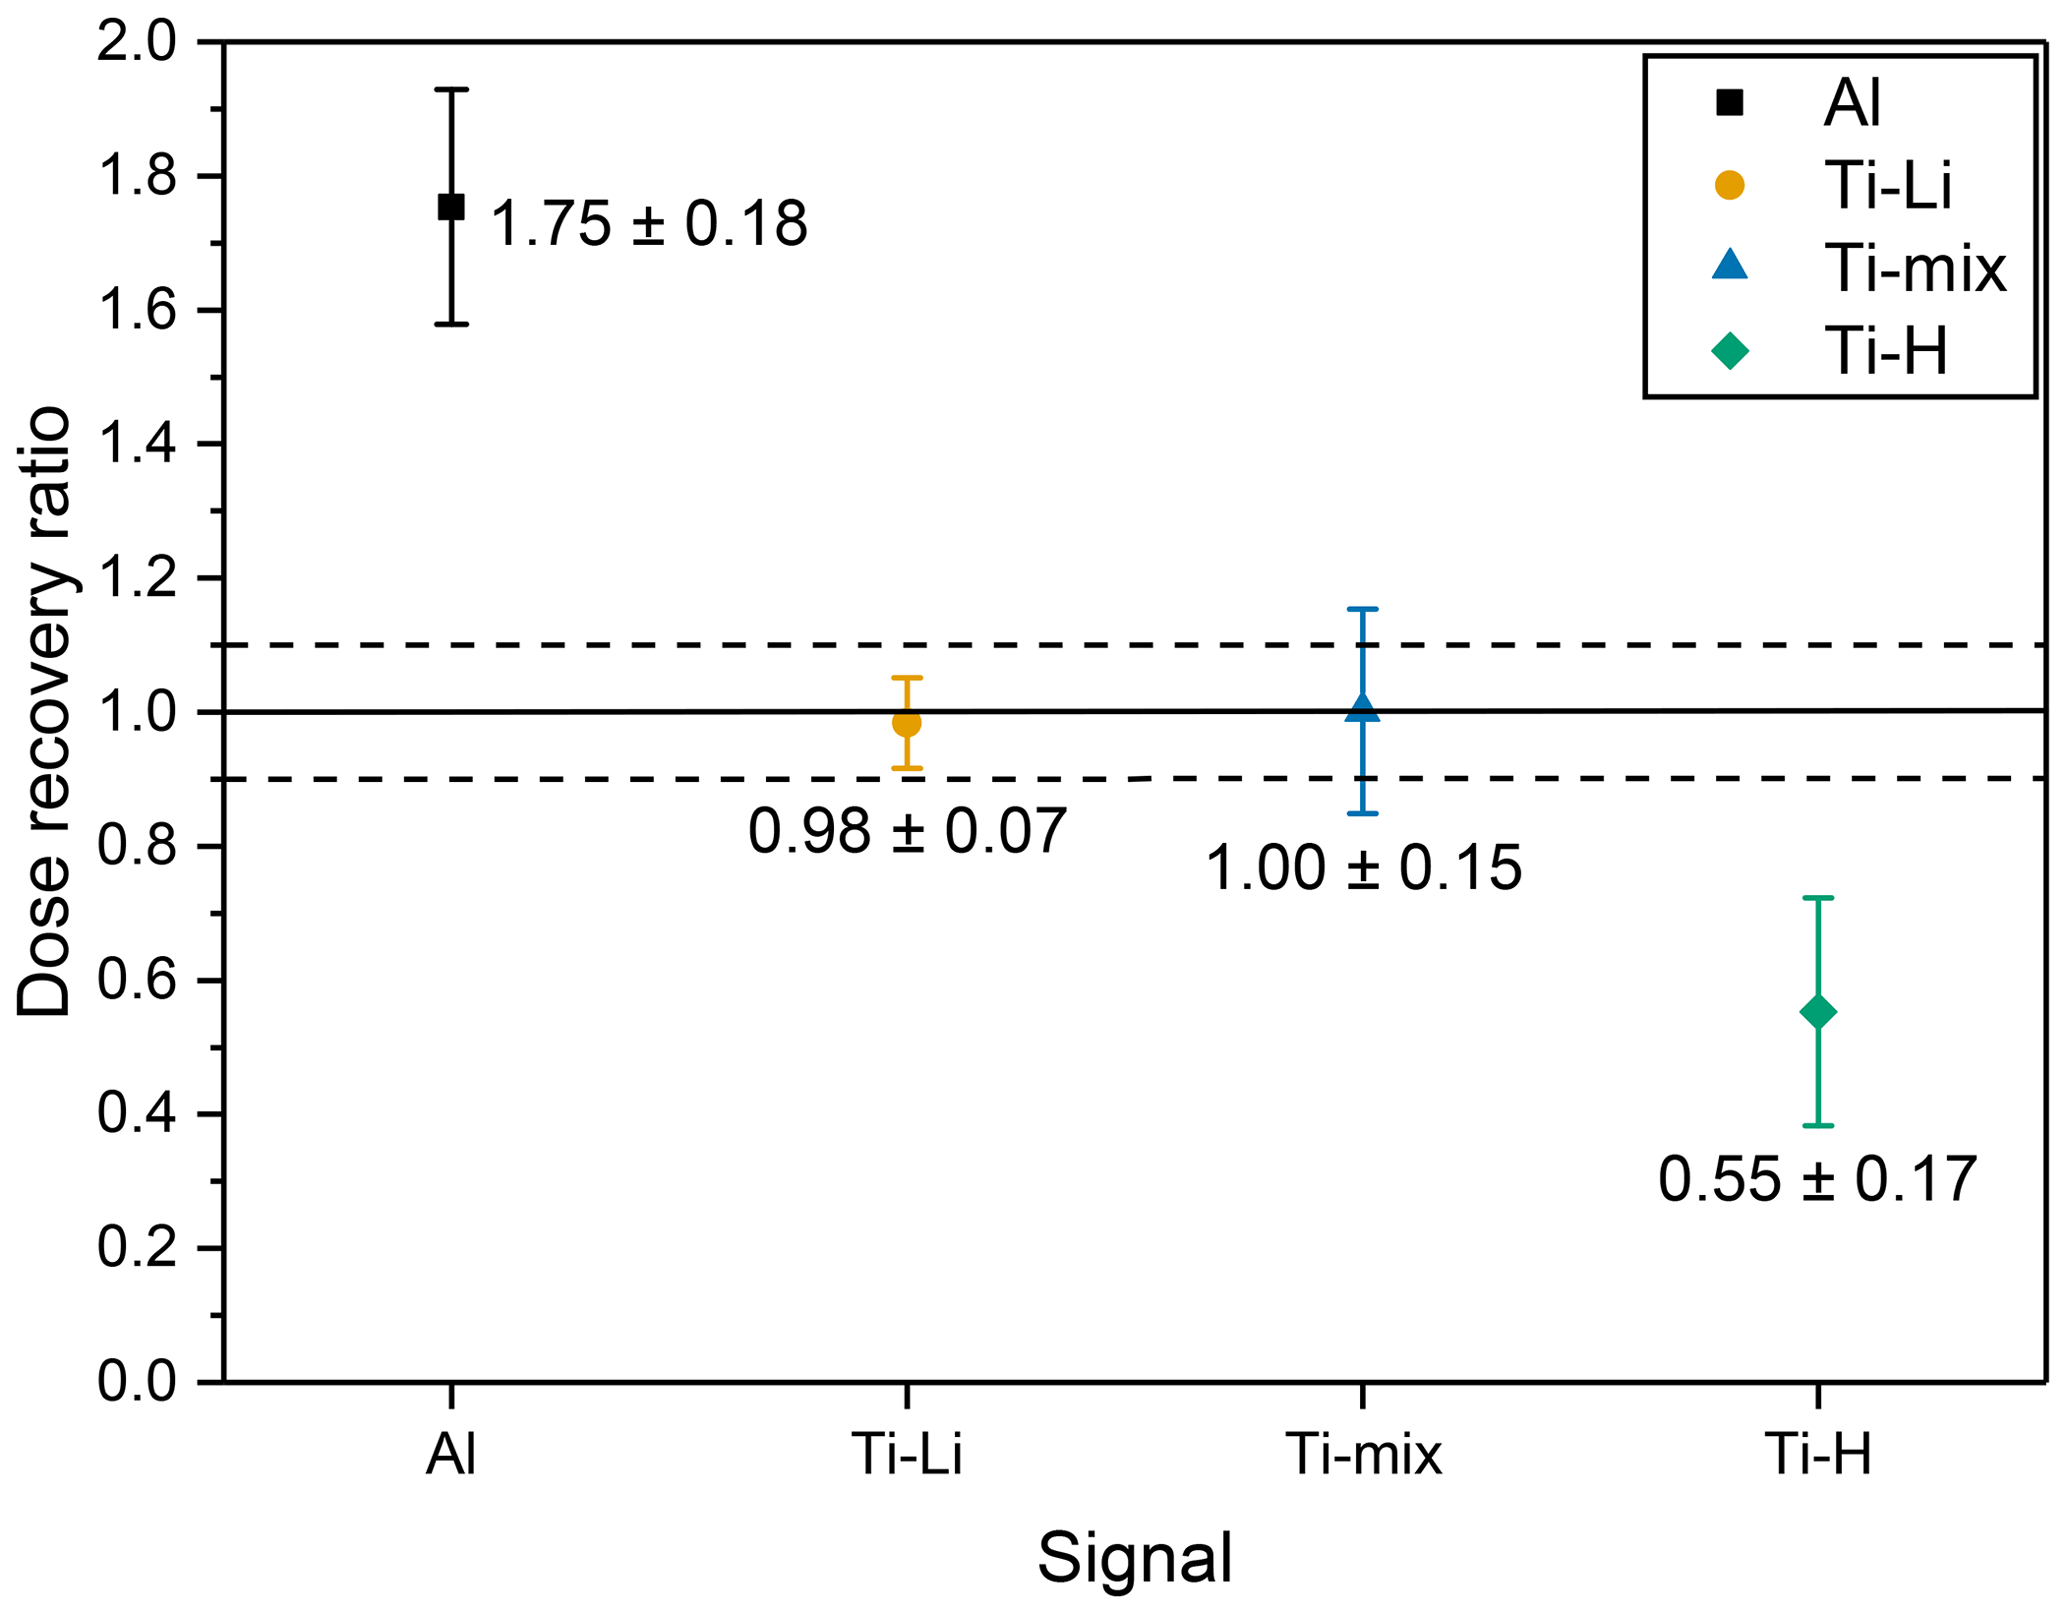
A dose recovery test, using the SAR protocol, was performed for all four ESR signals by adding 963 Gy on top of the natural signal using three aliquots of sample RB-II and thus is considered to be a new “natural” signal. The test was used to check the accuracy of the measurement protocol because the thermal treatment included in the SAR protocol may change sensitivity of the ESR centres. The De values of the aliquots (natural + 963 Gy) were measured by the SAR protocol, with three dose steps up to 3516 Gy. The dose recovery ratio was calculated by subtracting the natural De from the recovered dose and the difference of the natural + 963 Gy and the natural De was then divided by the added dose of 963 Gy. This experiment is a modified version of the single aliquot regenerative and added dose (SARA) by Tsukamoto et al. (2017) with a single added dose point. The dose recovery results (see Fig. 4) are satisfactory for the Ti-Li and Ti-mix signals with a ratio of 0.98 ± 0.07 and 1.00 ± 0.15, respectively, indicating that ESR SAR protocol works well for these signals. Our results resemble the results published by Tsukamoto et al. (2017). The dose recovery ratio for the Al signal is high with 1.75 ± 0.18, whereas the ratio of the Ti-H signal is low (0.55 ± 0.17). The significantly smaller Ti-H De compared to the Ti-Li De is probably partly a result of this (underestimating). The result of our dose recovery test suggests that the applied SAR protocol is robust in the dose estimation for the Ti-Li and Ti-mix signals, whereas those from the Al and Ti-H centres could be over- and underestimated.
The results clearly show that the ESR De for all samples are significantly larger than the OSL De of Lauer et al. (2011), and therefore residual subtraction is highly recommended if a representative modern analogue sample is available. Furthermore, the observed residual doses follow the trend in the signal's bleaching behaviour as described by Toyoda et al. (2000): the Al centre shows the largest residual followed by Ti-Li and Ti-H with the lowest residuals. The size of the residual dose for the Ti-mix lies in between those of Ti-Li and Ti-H. However, it should be noted that the recovered dose in the dose recovery test overestimated the given dose for the Al centre and showed underestimation for the Ti-H centre, which may have influenced the observed residual dose. Although the Ti-H shows the smallest De, and hence is closest to the expected OSL De, it is unreliable because it failed to recover the known given dose.
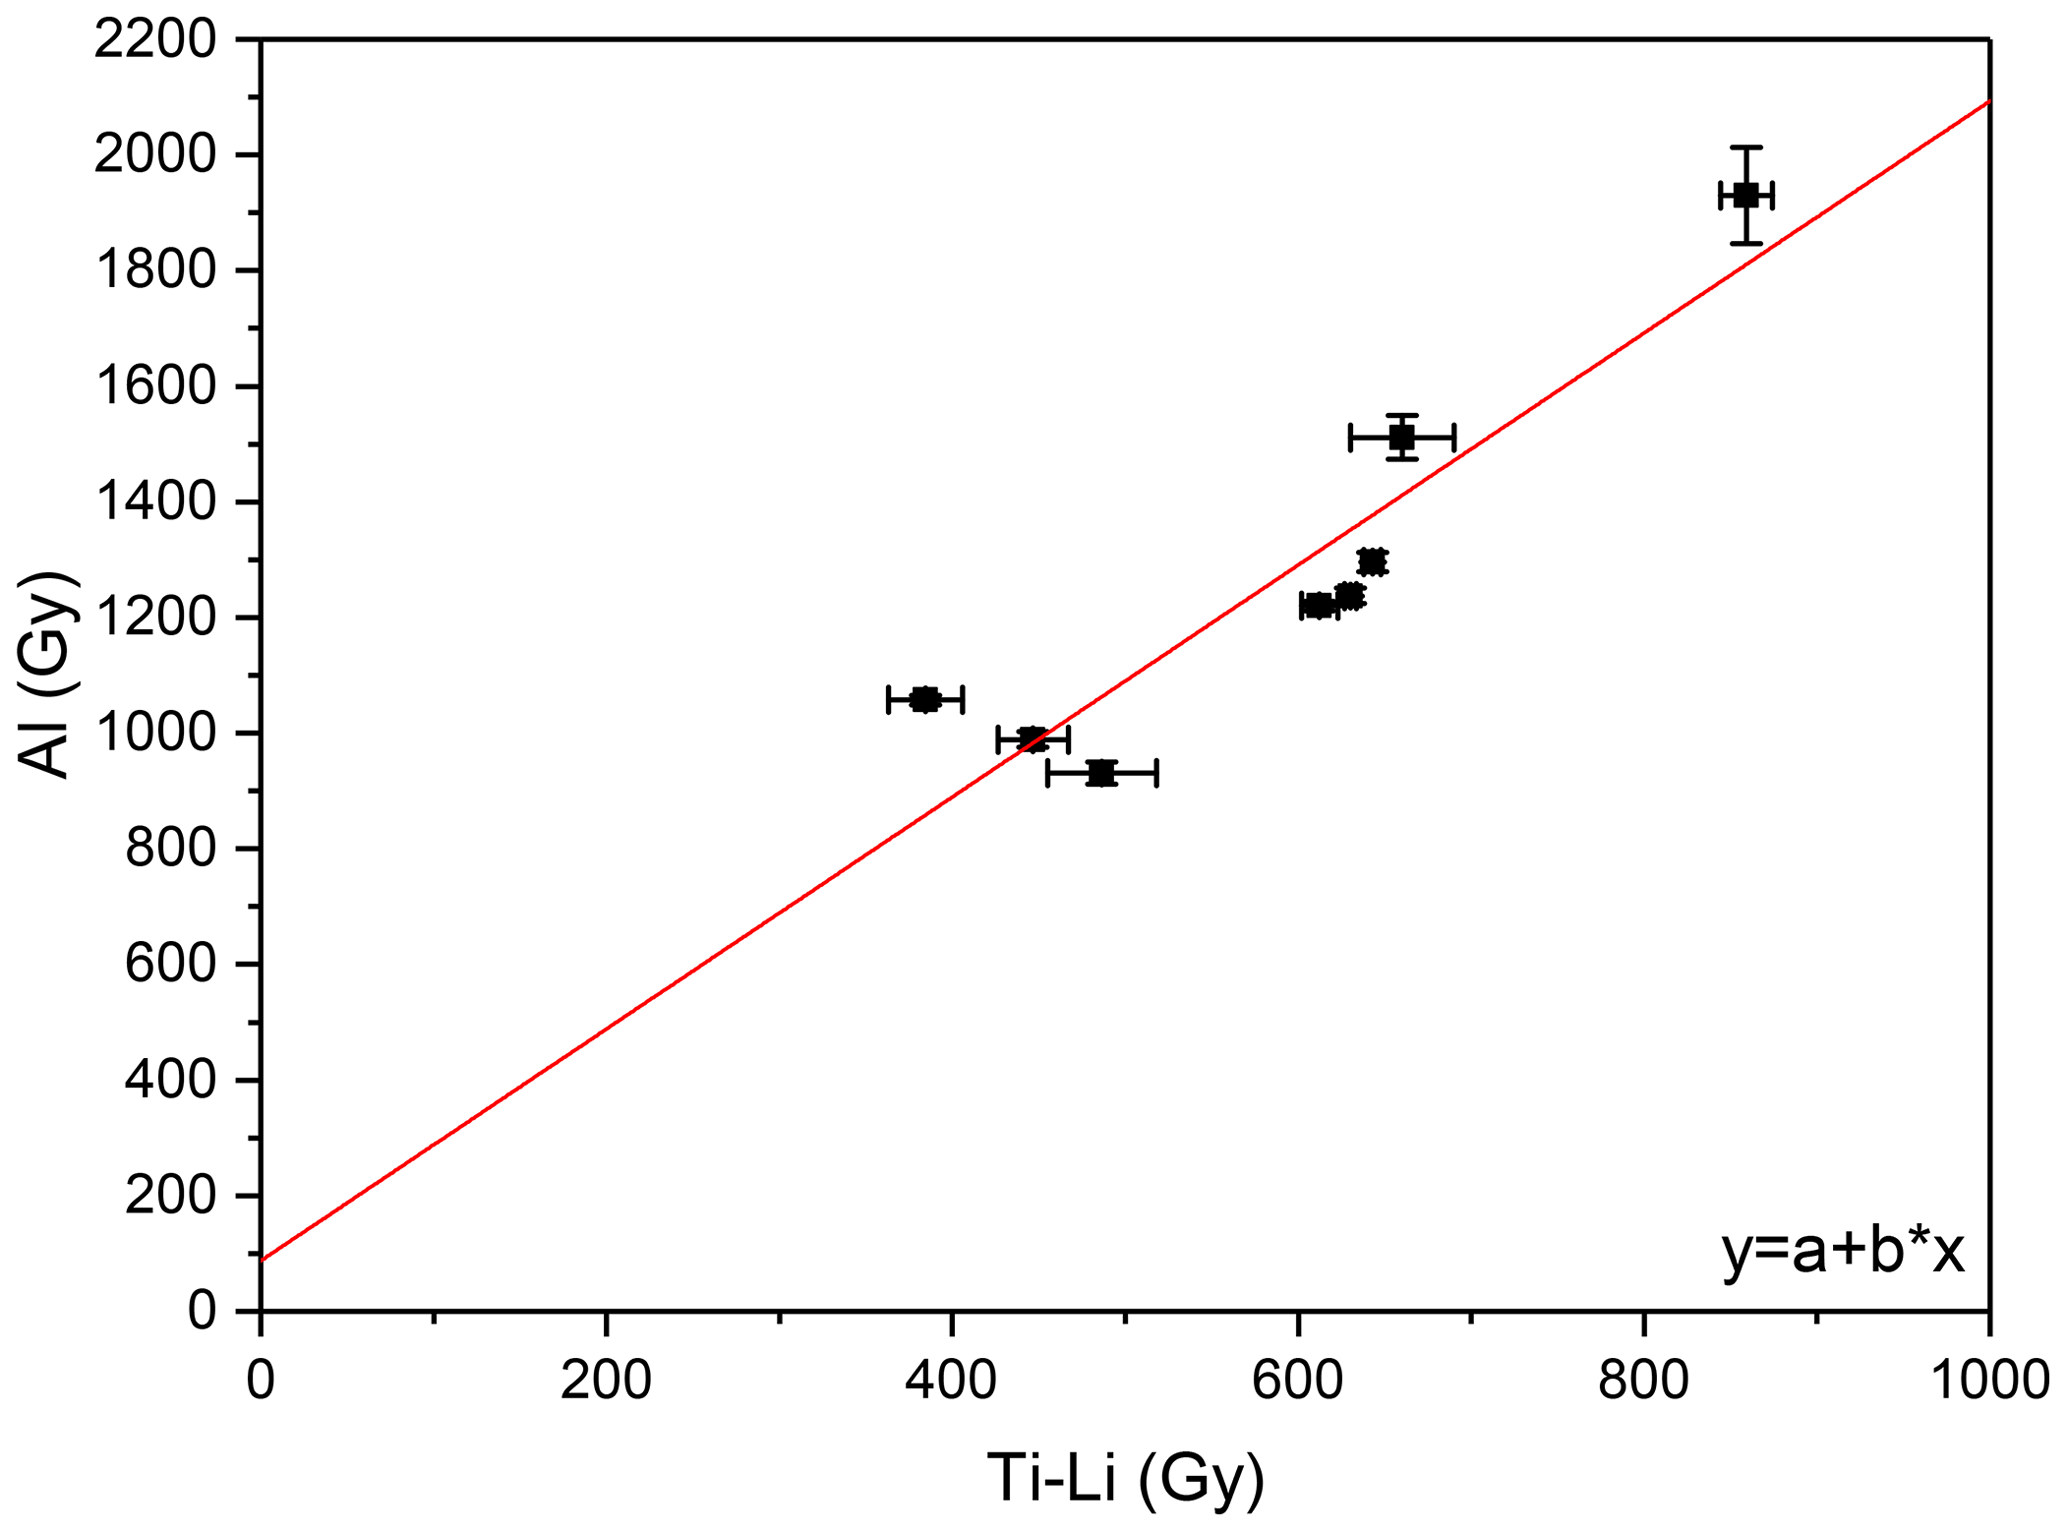
Regarding the Al centre, we did not estimate the size of the bleachable and unbleachable components by a bleaching test. Instead, a measured residual dose from young samples, preferably obtained from the same set of sedimentary sequence, could be subtracted from the De of older samples; this approach has an advantage over the very time-consuming bleaching experiment with the solar simulator for ∼ 1000 h. Figure 5 shows a comparison of all residual doses for the Al and Ti-Li. Additionally, a linear fitting was performed yielding the y intercept of 90 ± 220 Gy. This intercept indicates a rough estimate of the size of residual dose for the unbleachable Al centre, although it is much smaller than the values reported by Tsukamoto et al. (2018) and Timar-Gabor et al. (2020) from aeolian sediments.
However, the result of the dose recovery test suggests that the thermal annealing step in the SAR protocol changed the signal production efficiency of the Al centre. We hypothesise that the annealing changed the ratio of bleachable and unbleachable components of the Al centre, which led to the failure of the dose recovery test. Timar-Gabor et al. (2020) demonstrated that the intensity of both the bleachable and unbleachable components of the Al centre can be increased by additive dose irradiation on natural aliquots. They explained that the Al centre has an unbleachable component, because the amount of Al in quartz is far more abundant compared to any other electron centres, which contributes to bleaching (and recombines with the Al-hole centre). However, a thermal annealing reset both populations, and following irradiation it may have only produced the bleachable Al centre. Although this hypothesis must be tested experimentally, supporting evidence of the hypothesis is available from a comparison of the natural and regenerative dose response curves of the Al centre from the Chinese Loess Plateau. Tsukamoto et al. (2018) showed that the regenerated dose response curve, which was constructed after an annealing, was only comparable to the natural one, when the unbleachable Al signal intensity was subtracted from the natural dose response curve, suggesting that the regenerative dose response curve was dominated by the bleachable Al centre.
The dose recovery test of the Ti centre indicates that Ti-Li centre does not suffer any sensitivity changes after the annealing, whereas the Ti-H centre underestimates the given dose significantly. Beerten and Stesmans (2006) reported strong deviations in Ti-Li and Ti-H SAR De from the expected dose, although the total Ti centre provided a reliable result. They suggested different possible explanations including (1) charge transfer between Ti-Li and Ti-H centres during the artificial irradiation and (2) differences in production efficiency, but eventually they left the question open. Similar problems might have also affected the observed difference in the dose recovery ratios of the different Ti signals. More effort is needed to fully understand about the behaviour of different Ti signals.
Though available sedimentological information for the samples is limited, we compared the observed residual dose in different fluvial depositional environments affected. From Lauer et al. (2011), we identified three different depositional environments, which include (i) overbank deposits, (ii) deposits from braided river systems and (iii) deposits of a channel, i.e. meandering river system (Michael Kenzler, personal communication, 2021). The Rheinberg samples (RB-II and I) were taken from a point-bar setting and have been interpreted as channel deposits of a meandering river. The samples from Monheim–Hitdorf were deposited in a braided river system with channel and sheet flow deposits. At Libur, sample LB-I originated from a braided river system. The Niederkassel site sample (NK-I) was deposited in a braided river system, whereas the lower NK-II sample seems to have originated from an overbank deposit. The Aloysiushof/Dormagen sample (ALH-III) stems from the uppermost gravel-rich part of the profile and probably channel deposits.
From the observed residual doses, we do not see any pattern according to different depositional environments. Instead, all residual doses for our samples are relatively uniform, with a mean of 1270 ± 120 Gy for the Al centre (including the unbleachable signal component), 591 ± 53 Gy for the Ti-Li centre, 170 ± 21 Gy for Ti-H and 453 ± 42 Gy for Ti-mix.
In conclusion, we show that all of the investigated fluvial sediments were not fully bleached before burial, and after subtraction of OSL De a significant amount of the residual dose was still carried by the samples. Even the Ti-H, which is supposed to be the most bleachable, is far from zero. This highlights the importance of further investigation into the dynamics of residual doses in both aeolian and fluvial environments.
All data generated or analysed during this study are included in this published article.
The supplement related to this article is available online at: https://doi.org/10.5194/gchron-4-55-2022-supplement.
MR and ST conceived the study; MR carried out the measurements with input from ST. MR wrote the paper with input from ST.
At least one of the (co-)authors is a member of the editorial board of Geochronology. The peer-review process was guided by an independent editor, and the authors also have no other competing interests to declare.
Publisher’s note: Copernicus Publications remains neutral with regard to jurisdictional claims in published maps and institutional affiliations.
We are grateful to Gwynlyn Buchanan for language corrections and Michael Kenzler for sedimentological interpretation. The constructive comments from three reviewers, Mathieu Duval and two anonymous reviewers, helped to improve the paper.
This paper was edited by Georgina King and reviewed by Mathieu Duval and two anonymous referees.
Asagoe, M., Toyoda, S., Voinchet, P., Falguères, C., Tissoux, H., Suzuki, T., and Banerjee, D.: ESR dating of tephra with dose recovery test for impurity centers in quartz, Quatern. Int., 246, 118–123, https://doi.org/10.1016/j.quaint.2011.06.027, 2011. a
Bahain, J.-J., Falguères, C., Laurent, M., Voinchet, P., Dolo, J.-M., Antoine, P., and Tuffreau, A.: ESR chronology of the Somme River Terrace system and first human settlements in Northern France, Quat. Geochronol., 2, 356–362, https://doi.org/10.1016/j.quageo.2006.04.012, 2007. a
Bartz, M., Rixhon, G., Duval, M., King, G. E., Álvarez Posada, C., Parés, J. M., and Brückner, H.: Successful combination of electron spin resonance, luminescence and palaeomagnetic dating methods allows reconstruction of the Pleistocene evolution of the lower Moulouya river (NE Morocco), Quaternary Sci. Rev., 185, 153–171, https://doi.org/10.1016/j.quascirev.2017.11.008, 2018. a, b
Bartz, M., Arnold, L., Demuro, M., Duval, M., King, G., Rixhon, G., Álvarez Posada, C., Parés, J., and Brückner, H.: Single-grain TT-OSL dating results confirm an Early Pleistocene age for the lower Moulouya River deposits (NE Morocco), Quat. Geochronol., 49, 138–145, https://doi.org/10.1016/j.quageo.2018.04.007, 2019. a
Bartz, M., Duval, M., Brill, D., Zander, A., King, G. E., Rhein, A., Walk, J., Stauch, G., Lehmkuhl, F., and Brückner, H.: Testing the potential of K-feldspar pIR-IRSL and quartz ESR for dating coastal alluvial fan complexes in arid environments, Quatern. Int., 556, 124–143, https://doi.org/10.1016/j.quaint.2020.03.037, 2020. a, b
Beerten, K. and Stesmans, A.: The use of Ti centers for estimating burial doses of single quartz grains: A case study from an aeolian deposit Ma old, Radiat. Meas., 41, 418–424, https://doi.org/10.1016/j.radmeas.2005.10.004, 2006. a
Beerten, K., Lomax, J., Clémer, K., Stesmans, A., and Radtke, U.: On the use of Ti centres for estimating burial ages of Pleistocene sedimentary quartz: Multiple-grain data from Australia, Quat. Geochronol., 1, 151–158, https://doi.org/10.1016/j.quageo.2006.05.037, 2006. a
Beerten, K., Rittner, S., Lomax, J., and Radtke, U.: Dose recovery tests using Ti-related ESR signals in quartz: First results, Quat. Geochronol., 3, 143–149, https://doi.org/10.1016/j.quageo.2007.05.002, 2008. a
Beerten, K., Verbeeck, K., Laloy, E., Vanacker, V., Vandenberghe, D., Christl, M., De Grave, J., and Wouters, L.: Electron spin resonance (ESR), optically stimulated luminescence (OSL) and terrestrial cosmogenic radionuclide (TCN) dating of quartz from a Plio-Pleistocene sandy formation in the Campine area, NE Belgium, Quatern. Int., 556, 144–158, https://doi.org/10.1016/j.quaint.2020.06.011, 2020. a
del Val, M., Duval, M., Medialdea, A., Bateman, M. D., Moreno, D., Arriolabengoa, M., Aranburu, A., and Iriarte, E.: First chronostratigraphic framework of fluvial terrace systems in the eastern Cantabrian margin (Bay of Biscay, Spain), Quat. Geochronol., 49, 108–114, https://doi.org/10.1016/j.quageo.2018.07.001, 2019. a
Duval, M. and Guilarte, V.: ESR dosimetry of optically bleached quartz grains extracted from Plio-Quaternary sediment: Evaluating some key aspects of the ESR signals associated to the Ti-centers, Radiat. Meas., 78, 28–41, https://doi.org/10.1016/j.radmeas.2014.10.002, 2015. a, b, c
Duval, M., Sancho, C., Calle, M., Guilarte, V., and Peña-Monné, J. L.: On the interest of using the multiple center approach in ESR dating of optically bleached quartz grains: Some examples from the Early Pleistocene terraces of the Alcanadre River (Ebro basin, Spain), Quat. Geochronol., 29, 58–69, https://doi.org/10.1016/j.quageo.2015.06.006, 2015. a, b
Duval, M., Arnold, L. J., Guilarte, V., Demuro, M., Santonja, M., and Pérez-González, A.: Electron spin resonance dating of optically bleached quartz grains from the Middle Palaeolithic site of Cuesta de la Bajada (Spain) using the multiple centres approach, Quat. Geochronol., 37, 82–96, https://doi.org/10.1016/j.quageo.2016.09.006, 2017. a, b, c
Duval, M., Voinchet, P., Arnold, L. J., Parés, J. M., Minnella, W., Guilarte, V., Demuro, M., Falguères, C., Bahain, J.-J., and Despriée, J.: A multi-technique dating study of two Lower Palaeolithic sites from the Cher Valley (Middle Loire Catchment, France): Lunery-la Terre-des-Sablons and Brinay-la Noira, Quatern. Int., 556, 71–87, https://doi.org/10.1016/j.quaint.2020.05.033, 2020. a
Fang, F. and Grün, R.: ESR thermochronometry of Al and Ti centres in quartz: A case study of the Fergusons Hill-1 borehole from the Otway Basin, Australia, Radiat. Meas., 139, 106447, https://doi.org/10.1016/j.radmeas.2020.106447, 2020. a
Frechen, M.: Systematic thermoluminescence dating of two loess profiles from the Middle Rhine Area (F.R.G.), Quaternary Sci. Rev., 11, 93–101, https://doi.org/10.1016/0277-3791(92)90048-D, 1992. a
Kars, R. H., Reimann, T., and Wallinga, J.: Are feldspar SAR protocols appropriate for post-IR IRSL dating?, Quat. Geochronol., 22, 126–136, https://doi.org/10.1016/j.quageo.2014.04.001, 2014. a
Lauer, T., Frechen, M., Klostermann, J., Krbetschek, M., Schollmayer, G., and Tsukamoto, S.: Luminescence dating of Last Glacial and Early Holocene fluvial deposits from the Lower Rhine methodological aspects and chronological framework, Z. Dtsch. Ges. Geowiss., 162, 47–61, https://doi.org/10.1127/1860-1804/2011/0162-0047, 2011. a, b, c, d, e, f, g, h, i, j
Laurent, M., Falguères, C., Bahain, J., Rousseau, L., and Van Vliet Lanoé, B.: ESR dating of quartz extracted from quaternary and neogene sedimentsmethod, potential and actual limits, Quaternary Sci. Rev., 17, 1057–1062, https://doi.org/10.1016/S0277-3791(97)00101-7, 1998. a
Mejdahl, V. and Bøtter-Jensen, L.: Luminescence dating of archaeological materials using a new technique based on single aliquot measurements, Quaternary Sci. Rev., 13, 551–554, https://doi.org/10.1016/0277-3791(94)90076-0, 1994. a
Murray, A. S. and Wintle, A. G.: The single aliquot regenerative dose protocol: potential for improvements in reliability, Radiat. Meas., 37, 377–381, https://doi.org/10.1016/S1350-4487(03)00053-2, 2003. a
Oppermann, F. and Tsukamoto, S.: A portable system of X-ray irradiation and heating for electron spin resonance (ESR) dating, Ancient TL, 33, 11–15, 2015. a
Richter, M., Tsukamoto, S., and Long, H.: ESR dating of Chinese loess using the quartz Ti centre: A comparison with independent age control, Quatern. Int., 556, 159–164, https://doi.org/10.1016/j.quaint.2019.04.003, 2020. a
Rink, W., Bartoll, J., Schwarcz, H., Shane, P., and Bar-Yosef, O.: Testing the reliability of ESR dating of optically exposed buried quartz sediments, Radiat. Meas., 42, 1618–1626, https://doi.org/10.1016/j.radmeas.2007.09.005, 2007. a
Timar-Gabor, A., Chruścińska, A., Benzid, K., Fitzsimmons, K., Begy, R., and Bailey, M.: Bleaching studies on Al-hole ([AlO4 h]0) electron spin resonance (ESR) signal in sedimentary quartz, Radiat. Meas., 130, 106221, https://doi.org/10.1016/j.radmeas.2019.106221, 2020. a, b, c
Tissoux, H., Falguères, C., Voinchet, P., Toyoda, S., Bahain, J., and Despriée, J.: Potential use of Ti-center in ESR dating of fluvial sediment, Quat. Geochronol., 2, 367–372, https://doi.org/10.1016/j.quageo.2006.04.006, 2007. a, b, c
Tissoux, H., Toyoda, S., Falguères, C., Voinchet, P., Takada, M., Bahain, J.-J., and Despriée, J.: ESR Dating of Sedimentary Quartz from Two Pleistocene Deposits Using Al and Ti-Centers, Geochronometria, 30, 23–31, https://doi.org/10.2478/v10003-008-0004-y, 2008. a, b, c
Toyoda, S. and Falguères, C.: The method to represent the ESR signal intensity of the aluminium hole center in quartz for the purpose of dating, Advances in ESR applications, 20, 7–10, ISSN 0918-6824, 2003. a
Toyoda, S., Voinchet, P., Falguères, C., Dolo, J. M., and Laurent, M.: Bleaching of ESR signals by the sunlight: a laboratory experiment for establishing the ESR dating of sediments, Appl. Radiat. Isotopes, 52, 1357–1362, https://doi.org/10.1016/S0969-8043(00)00095-6, 2000. a, b, c, d, e
Toyoda, S., Miura, H., and Tissoux, H.: Signal regeneration in ESR dating of tephra with quartz, Radiat. Meas., 44, 483–487, https://doi.org/10.1016/j.radmeas.2009.03.002, 2009. a
Tsukamoto, S., Toyoda, S., Tani, A., and Oppermann, F.: Single aliquot regenerative dose method for ESR dating using X-ray irradiation and preheat, Radiat. Meas., 81, 9–15, https://doi.org/10.1016/j.radmeas.2015.01.018, 2015. a, b, c
Tsukamoto, S., Porat, N., and Ankjærgaard, C.: Dose recovery and residual dose of quartz ESR signals using modern sediments: Implications for single aliquot ESR dating, Radiat. Meas., 106, 472–476, https://doi.org/10.1016/j.radmeas.2017.02.010, 2017. a, b, c, d, e
Tsukamoto, S., Long, H., Richter, M., Li, Y., King, G. E., He, Z., Yang, L., Zhang, J., and Lambert, R.: Quartz natural and laboratory ESR dose response curves: A first attempt from Chinese loess, Radiat. Meas., 120, 137–142, https://doi.org/10.1016/j.radmeas.2018.09.008, 2018. a, b, c, d
Tsukamoto, S., Oppermann, F., Autzen, M., Richter, M., Bailey, M., Ankjærgaard, C., and Jain, M.: Response of the Ti and Al electron spin resonance signals in quartz to X-ray irradiation, Radiat. Meas., 149, 106676, https://doi.org/10.1016/j.radmeas.2021.106676, 2021. a
Voinchet, P., Falguères, C., Laurent, M., Toyoda, S., Bahain, J., and Dolo, J.: Artificial optical bleaching of the Aluminium center in quartz implications to ESR dating of sediments, Quaternary Sci. Rev., 22, 1335–1338, https://doi.org/10.1016/S0277-3791(03)00062-3, 2003. a
Voinchet, P., Toyoda, S., Falguères, C., Hernandez, M., Tissoux, H., Moreno, D., and Bahain, J.-J.: Evaluation of ESR residual dose in quartz modern samples, an investigation on environmental dependence, Quat. Geochronol., 30, 506–512, https://doi.org/10.1016/j.quageo.2015.02.017, 2015. a
Voinchet, P., Yin, G., Falguères, C., Liu, C., Han, F., Sun, X., and Bahain, J.-J.: Dating of the stepped quaternary fluvial terrace system of the Yellow River by electron spin resonance (ESR), Quat. Geochronol., 49, 278–282, https://doi.org/10.1016/j.quageo.2018.08.001, 2019. a
Yokoyama, Y., Falgueres, C., and Quaegebeur, J.: ESR dating of quartz from quaternary sediments: First attempt, Nucl. Tracks Rad. Meas., 10, 921–928, https://doi.org/10.1016/0735-245X(85)90109-7, 1985. a, b