the Creative Commons Attribution 4.0 License.
the Creative Commons Attribution 4.0 License.
 | 02 Feb 2023
Potential impacts of chemical weathering on feldspar luminescence dating properties
Jasquelin Peña
Stéphanie Grand
Georgina E. King
Chemical weathering alters the chemical composition of mineral grains. As a result, trapped-charge dating signals of primary silicates may be progressively modified. In this study, we treated three feldspar specimens to understand the effect of proton- and ligand-promoted dissolution on their luminescence properties. We conducted kinetic experiments over 720 h using two solutions: (1) oxalic acid (pH 3, 20 ∘C), an organic acid with chelating abilities, and (2) aqua regia (pH < 1, 40 ∘C), a mixture of strong acids creating aggressive acid hydrolysis conditions. These two solutions were chosen to provoke, on laboratory timescales, some of the changes that may occur on geological timescales as minerals weather in nature.
The effect of the extracting solutions on mineral dissolution was investigated by monitoring the concentration of dissolved elements, while changes in feldspar surface morphology were assessed by scanning electron microscopy (SEM). Subsequent changes in feldspar luminescence in the near-UV (∼ 340 nm) and blue (∼ 410 nm) thermoluminescence (TL) and infrared stimulated luminescence (IRSL) emission bands were assessed at the multi- and/or single-grain levels to gain insight into the emission spectra, dose response, saturation, and anomalous fading characteristics of the feldspars. In all experiments, only minor feldspar dissolution was observed after 720 h. In general, aqua regia, the more chemically aggressive solution, had a larger effect on feldspar dissolution compared to that of oxalic acid. Additionally, our results showed that although the TL and IRSL intensities changed slightly with increasing artificial weathering time, the feldspar luminescence properties were otherwise unmodified. This suggests that chemical alteration of feldspar surfaces may not affect luminescence dating signals obtained from natural samples.
- Article
(6020 KB) - Full-text XML
-
Supplement
(5092 KB) - BibTeX
- EndNote


Trapped-charge dating monitors the ionising-radiation-induced population of defects by electrons and holes. Specifically, exposure to heat or light causes the electron population to be evicted, resulting in the emission of light and forming the basis for luminescence dating (Aitken, 1985; Huntley et al., 1985). Luminescence dating can be used to constrain a rock or sediment's last exposure to heat (e.g. Aitken, 1985) or light (e.g. Huntley et al., 1985) or the cooling history of bedrock (e.g. Guralnik et al., 2015; King et al., 2016). Feldspar minerals constitute almost half of the oceanic and continental crusts (Parsons, 2010) and even the purest feldspar crystal contains a vast number of defects (e.g. impurities). These defects are sensitive to the effects of ionising radiation (Aitken, 1985; Marfunin, 1979). Alteration of feldspars due to chemical weathering occurs ubiquitously on the Earth's surface from shallow to deeply buried rocks (Yuan et al., 2019) and may modify the chemical composition of mineral grains (e.g. leaching of elements, Nesbitt et al., 1980). Thus, it follows that luminescence signals may also be modified.
Previous studies have observed that chemical weathering influences the luminescence properties of silicate minerals (Jeong et al., 2007; Jeong and Choi, 2012), and such changes have been used as indicators of relative weathering extent (Wang and Miao, 2006). Additionally, it has been proposed that stratigraphic age reversals in loess–palaeosol sequences, assessed through luminescence methods, may be attributed to the highly weathered nature of the sediments (Berger et al., 2001) and that variability in anomalous fading rates in bedrock feldspars might be correlated with weathering processes (Huntley, 2011; Valla et al., 2016). However, the effect of chemical weathering on luminescence properties has not been studied systematically. Without a better understanding of the effect of weathering on feldspar luminescence signals, luminescence chronologies over Quaternary timescales might be biased. Thus, two main research questions are targeted in this study: (i) does chemical weathering change the luminescence properties of feldspar, and (ii) what are the impacts of these changes on luminescence dating? To answer these questions, we studied the effect of partial dissolution on the luminescence properties of feldspar minerals important for luminescence dating. We treated K- and Na-feldspars in time series experiments for up to 720 h using acidic solutions. Luminescence analyses at the multi- and/or single-grain levels were carried out to gain insights into thermoluminescence (TL) emissions, infrared stimulated luminescence (IRSL) dose response, saturation, and anomalous fading characteristics of the feldspars, essential parameters in luminescence dating applications (e.g. Buylaert et al., 2012; Thomsen et al., 2008).
Feldspars belong to the group of aluminosilicates having a general structure of MT4O8, where M is usually Ca2+, Na+, or K+ and T is Al3+ or Si4+ (Ribbe, 1983). Feldspars exhibit partial ternary solid solutions between three pure components, namely CaAl2Si2O8 (anorthite), NaAlSi3O8 (albite), and KAlSi3O8 (orthoclase), forming the alkali feldspar series between the K and Na end-members and the plagioclase feldspar series between the Na and Ca end-members (Deer et al., 2013; Parsons, 2010). Depending on crystallisation temperature and thermal history, feldspars can be structurally classified as ordered or disordered based on the distribution of Al3+, substituted for Si4+ (Ribbe, 1983). Various elements can be substituted for K, Na, Ca, Al, and Si in the crystal lattice due to ionic characteristics, structural aspects, or formation processes, acting in some cases as luminescence centres (Krbetschek et al., 1997).
Most feldspars show a blue emission centred at ∼ 410 nm (see overview in Riedesel, 2020). The blue emission has been associated with a hole centre located on Al-bridging O ions (Finch and Klein, 1999; Speit and Lehmann, 1982), with Eu2+ substituting for Ca2+ on M sites (Götze et al., 1999; Krbetschek et al., 1997), or with Ti4+ activation (Mariano and Ring, 1975). Recently, Riedesel et al. (2021) concluded that Al–O–Al bridges are related to the blue luminescence emission as a function of Al–Si disorder, which is in agreement with previous observations (e.g. Speit and Lehmann, 1982). Whilst the blue emission is of particular interest for luminescence dating due to suitable luminescence dating properties (e.g. Buylaert et al., 2012), the isolation of the blue emission signal is challenging due to broad emission detection bands during luminescence measurements including parts of the UV and blue wavelength regions. Overlap with the blue luminescence emission and the near-UV (∼ 300–360 nm) and green–yellow emission (∼ 550–580 nm) bands has been found in various feldspar minerals (see Riedesel, 2020, for a review). Whilst the UV emission has been related to an intrinsic defect (Garcia-Guinea et al., 1999), the green–yellow emission is often ascribed to Mn2+ in Ca sites (Geake et al., 1977), although this has recently been questioned by Prasad et al. (2016).
Chemical weathering of feldspars leads to the breaking of bonds and the release of interstitial and framework elements to solution as well as to changes in surface morphology and chemistry (Chardon et al., 2006; Yuan et al., 2019). Thus, chemical and crystallographic changes during weathering might result in changes in the defects responsible for luminescence production. In particular, it remains unclear where luminescence signals in the mineral grain originate. In luminescence dating, it is generally assumed that luminescence originates from the entire grain rather than the surface, although light emitted from the centre of the grain would be re-absorbed by the grain itself (Duller, 1997). Additionally, optical absorption properties are different for different members of the feldspar groups and depend on grain properties such as transparency and grain size. Duller (1997) noted that pure feldspars absorb weakly in the visible part of the spectrum, but an absorption peak has been observed in the UV part of the spectrum at ∼ 320 nm. Since pure feldspar rarely exists in nature, trace and major elements, cracks, inclusions, and exsolution phenomena can result in a variety of mineral colours, which limit optical transmission (Duller, 1997; Hofmeister and Rossman, 1983). As chemical weathering is mostly a surface phenomenon (Yuan et al., 2019), we hypothesise that the luminescence emitted from feldspars with limited optical transmission will be influenced by chemical weathering.
All chemical, mineralogical, and luminescence experiments were carried out at the University of Lausanne (Switzerland).
3.1 Samples
Feldspar specimens from the Natural History Museum at the University of Oslo (Norway) were used in this study. These are samples ALB1 (KNR32491) and ALB2 (KNR16962), which are two plagioclase samples close to the albite end-member, and sample MIC (KNR32141), which is a microcline K-feldspar. These feldspars were chosen because they are commonly used in luminescence dating studies and are likely to persist in soils and sediments undergoing extensive chemical weathering. In order to compare our results to luminescence studies of sediment dating, the samples were ground manually with an agate mortar and pestle and sieved to a grain size fraction of 150–212 µm. Fines were removed by washing the powder in an ultrasonic basin with distilled water until the supernatant remained clear. The samples were then dried in an oven at 40 ∘C.
The chemical composition and mineralogy of the samples were determined by X-ray fluorescence (XRF) and X-ray diffraction (XRD), respectively. For both analyses, the 150–212 µm fraction was manually ground to a fine powder (∼ 20 µm). XRF measurements of major elements were carried out on fused glass discs on a Phillips PW 2400 spectrometer equipped with a rhodium tube, following the methods described by Pfeifer et al. (1991). XRD analyses were conducted using a Thermo ARL X'TRA powder diffractometer. Approximately 100 mg of powder sample was analysed using Cu Kα radiation covering the 1–65∘ 2θ range according to Adatte et al. (1996) and compared to the RRUFFTM Project mineralogical database (https://rruff.info/, last access: 21 January 2021).
3.2 Chemical alteration experiments
We conducted two artificial weathering experiments using each of the three museum feldspar samples. Experiments were performed in batch mode using two different solutions with five sampling times: 0 (untreated), 4, 96, 240, and 720 h. After each treatment duration, the solids and filtrates were kept for further analyses.
In the first set of experiments, samples were treated with an aqua regia solution (3 : 1 mixture of hydrochloric and nitric acids; U.S. EPA, 1996; International Organization for Standardization, 2020). Teflon containers were filled with 0.25 g of sample material and 2.5 mL of solution. The pH of this solution was < 1. The containers were closed and placed in an oven at a constant temperature of 40 ∘C and were shaken over the specific time periods with a shaking incubator. The aqua regia method was chosen because it induces strong acid hydrolysis conditions and efficiently leaches transition metals and trace elements from the mineral surface of minerals without destroying the silicate framework (and thus completely dissolving the mineral).
In the second set of experiments, samples were treated with a 0.2 M oxalic acid–oxalate buffer (Schwertmann, 1973). The pH of this solution was 3.0 ± 0.1. The extraction was conducted in the dark to prevent Fe(III) reduction. Falcon centrifuge tubes (50 mL) were filled with 0.25 g sample material and 12.5 mL of solution. The extraction solution was prepared by dissolving 1.62 g of ammonium oxalate monohydrate (NH4)2C2O4 ⋅ H2O and 1.08 g of oxalic acid hydrate COOH2 ⋅ 2H2O in 100 mL of deionised water. The tubes were shaken on a mechanical shaker table at 175 revolutions per minute at room temperature. This organic extractant was chosen because it offers weak acid hydrolysis conditions coupled with the chelating ability of Al3+ and Fe3+. The oxalate extractant is known to complex and release Al, Fe, and Si from minerals having a low crystalline order and mimics a chemical weathering pathway that would occur in nature. Plants have been shown to exude oxalic acid to promote mineral weathering and acquire essential nutrients (Collignon et al., 2012; Keiluweit et al., 2015).
Total dissolved concentrations of Si, Al, K, Ca, Na, Mg, Mn, and Fe after each treatment duration were analysed by inductively coupled plasma–optical emission spectroscopy (ICP-OES) using a Perkin Elma Optima 8300. For each sample and each element, three emission lines were measured in triplicate. Finally, Sc was used as an internal standard for the stability of the ICP-OES measurements. A normalisation approach was not applied as the Sc readings were constant. Congruent and incongruent dissolution of samples was tested using the mole ratio of Al to Si in the solids and in the solutions.
3.3 Grain surface morphology
Images of feldspar grains of samples ALB1, ALB2, and MIC were obtained using a Tescan Mira II LMU scanning electron microscope (SEM) operated in high vacuum. Energy dispersive X-ray (EDX) analyses were performed using a Penta-FET 3x detector monitored by the AZtec 2.4 software package released by Oxford Instruments. Twenty treated and 20 untreated grains were analysed in order to visualise the impact of aqua regia and oxalic acid on the grain surface.
3.4 Luminescence analyses
3.4.1 Instrumentation
Multi-grain luminescence measurements were made using an automated Risø TL/OSL-DA-20 reader equipped with a Detection And Stimulation Head (DASH) system (Lapp et al., 2015). The DASH system had a 90Sr 90Y beta source delivering a dose rate of ∼ 0.15 Gy s−1 and infrared (IR, ∼ 850 nm) light-emitting diodes (LEDs). TL and IRSL signals were detected using an Electron Tube PDM 9107Q-AP-TTL-03 (160–630 nm) attached to the DASH. In addition, TL emission spectra were measured using an Andor Kymera 193i spectrograph (wavelength and efficiency calibrated) equipped with an Andor iXon Ultra 888 electron multiplying charge coupling device (EMCCD, 300–900 nm) camera attached to the DASH system. The EMCCD has a 1024 × 1024 sensor format and a pixel size of 13 µm. The spectral resolution of the system is 13 nm for all spectra recorded. Single-grain luminescence measurements used an automated Risø TL/OSL-DA-20 reader equipped with a 90Sr 90Y beta source for irradiation delivering a dose rate of ∼ 0.08 Gy s−1. A single-grain attachment including an IR laser (∼ 830 nm) was used (Bøtter-Jensen et al., 2003). We used a 7.5 mm Hoya U-340 filter and a blue filter pack (Schott BG3/Schott BG39) to measure the luminescence in the UV (∼ 340 nm) and blue (∼ 410 nm) emission bands, respectively.
3.4.2 Thermoluminescence (TL) spectral measurements
Three multi-grain aliquots per treatment duration were mounted on stainless steel discs (6 mm); the mass of the grains was recorded for TL spectroscopy. TL signals were recorded from each disc without any optical filters. The vertical shift speed and horizontal shift readout speed were set to 4.33 µs and 30 MHz, respectively. The spectra consist of 1024 bins with a bin width of 0.43 nm between 281 and 717 nm (centred at 500 nm). The grating of the spectrograph was set to 150 lines mm−1 and 500 nm blaze. The aliquots were given a beta dose of 270 Gy, and TL measurements were made by heating the samples to 400 ∘C at a rate of 1 ∘C s−1, detecting the emitted light as a function of wavelength. After measurement of the TL emissions, the same discs were measured to correct for background noise and black body radiation in the high-temperature region. The resulting TL spectra were corrected for sample mass (∼ 9 mg) and electron multiplying (EM) gain to allow absolute signal intensity comparisons.
3.4.3 Infrared stimulated luminescence (IRSL) dose response and fading measurements
Three multi-grain aliquots (2 mm) were measured for each treatment point of the weathering experiments with an elevated temperature post-infrared (pIR)-IRSL single-aliquot regenerative-dose (SAR) protocol (Buylaert et al., 2009; Thomsen et al., 2008) using a preheat of 250 ∘C (for 60 s, 1 ∘C s−1), a first IR stimulation temperature of 50 ∘C (IR50 for 200 s, 1 ∘C s−1), and a second IR stimulation temperature of 225 ∘C (pIR225 for 200 s, 1 ∘C s−1). The response to a test dose (38 Gy) was measured in the same manner. At the end of each SAR cycle an IR stimulation at 290 ∘C was used for 100 s to reduce signal recuperation. An artificial beta dose of 75 Gy was given to the museum specimens and regarded as the natural signal. Eight regenerative dose points up to 2250 Gy were used to construct the dose response curve, including a zero dose and repeated dose point, allowing measurement of the characteristic saturation dose (D0). Athermal signal loss was estimated following Auclair et al. (2003) in order to determine sample-specific g values, which were normalised to a measurement delay time of 2 d after irradiation (g2 d; Huntley and Lamothe, 2001). Regenerative doses of 75 Gy, test doses of 38 Gy, and delay times of 100, 200, 400, and 800 min were used including a prompt measurement at the beginning and end of the fading measurements. The first 3.6 s of stimulation minus a late background of the last 35.5 s was used for signal integration. Single-grain measurements were carried out by loading the 150–212 µm grains into 300 µm diameter hole single-grain discs. One disc (100 grains) was measured for each subsample. We checked whether multiple grains were bedded in one hole, but multi-grain holes were infrequent (< 1 %). The pIR-IRSL225 measurement protocol used for the multi-grain aliquots was modified for single-grain dose response and fading measurements using an IR stimulation time of 5 s. The first 0.12 s of stimulation minus the background acquired from the last 1.0 s were used for single-grain signal integration.
4.1 Feldspar characteristics and dissolution features
The Ca, Na, and K contents measured by XRF were used to determine the composition of each feldspar sample, which was calculated as a percentage of the pure calcic, sodic, and potassic end-members (Table 1). These analyses showed that the ALB1 and ALB2 samples were high-sodium plagioclases in the oligoclase range with an accessory K component. Sample ALB1 yielded a higher Ca content compared to sample ALB2. Sample MIC is a microcline K-feldspar with intermediate characteristics and about 25 % Na; diffraction data suggest partial exsolution. XRD experiments on the treated albite samples ALB1 and ALB2 after 240 h did not show any differences except for intensity (Fig. S1 in the Supplement).
Table 1Bulk chemical composition of samples ALB1, ALB2, and MIC determined by X-ray fluorescence (XRF) and expressed as percent oxide. The Ca, Na, and K contents were used to determine the composition of each feldspar sample compared to the pure calcic (An), sodic (Ab), and potassic (Or) end-members.
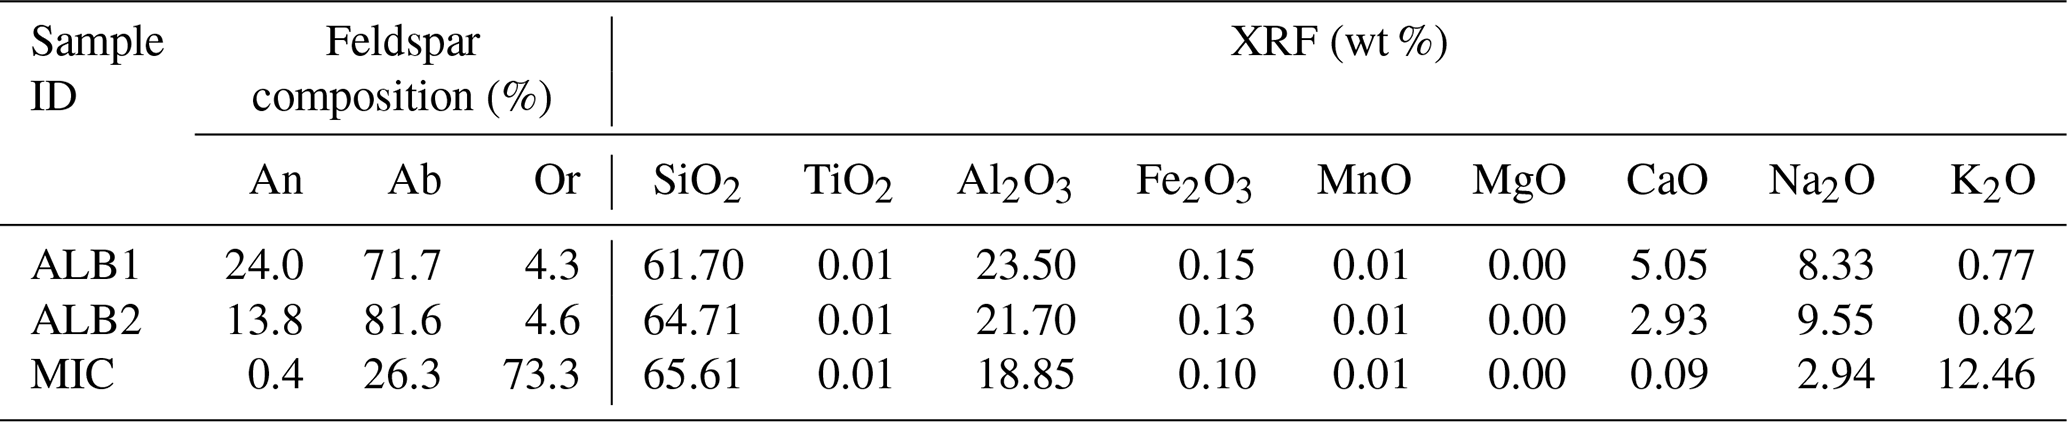
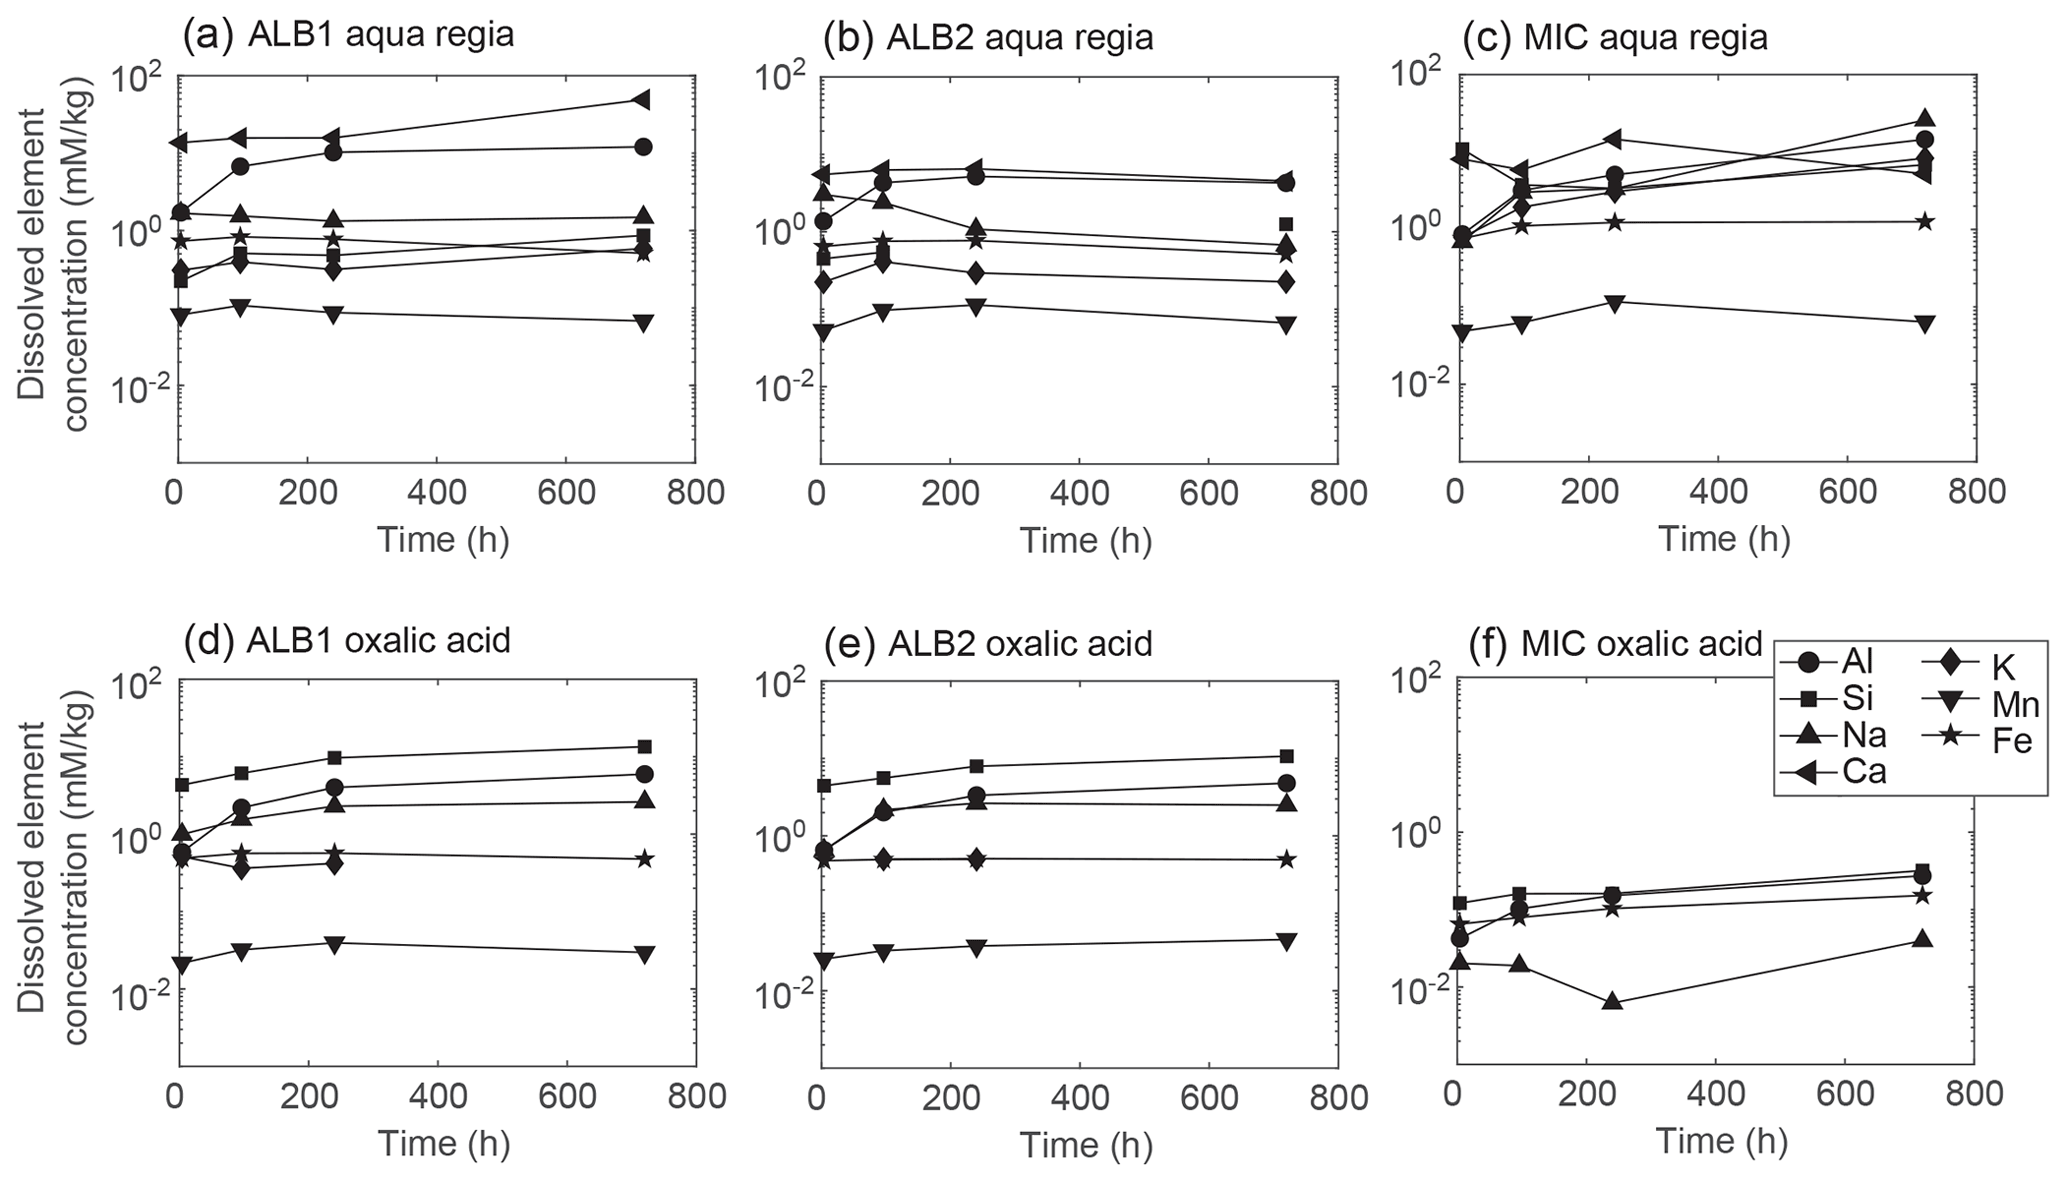
Figure 1Extracted elements from samples ALB1, ALB2, and MIC using aqua regia (a, b, c) as well as oxalic acid (d, e, f) solutions in the time intervals 4–720 h.
The dissolved element concentration in the solution after chemical treatments provided insights into the dissolution extent of the three feldspar samples. Changes in solution chemistry from both experiments are shown in Fig. 1. Most of the dissolved element concentrations remained relatively constant over the two 720 h experiments. In the aqua regia experiment (Fig. 1a–c), sample ALB1 showed higher leaching of Ca compared to sample ALB2, directly reflecting the higher Ca content in the crystal structure of sample ALB1 (Table 1). When considering the alkaline and alkaline earth elements, Ca was the more easily dissolved cation from the two plagioclases, while for sample MIC, Na, Ca, and K reached similar concentrations. Sample MIC also yielded more Si in solution than the plagioclases. Finally, the solutions' composition indicated increasing leaching of Al over time. Dissolution remained incongruent when comparing the mole ratio of Al to Si in the solids and in the solutions (Table S1).
Oxalic acid treatment resulted in the leaching of Al, Si, and Na from the ALB1 and ALB2 samples, with lesser amounts of Fe and K passing into solution (Fig. 1d, e). Very low amounts of elements were leached from sample MIC, even after the 720 h treatment, with dissolved concentrations of all analysed elements remaining close to or under 1 mM kg−1 (Fig. 1f). The three feldspars dissolved congruently in oxalic acid at pH 3 based on the Al Si mole ratios of the solids and solutions (Table S1).
In comparison with the initial element concentrations of the solids (Table 1), for both solutions, concentrations showed only minor feldspar dissolution after 720 h.

Figure 2Scanning electron microscope (SEM) images after chemical treatment using aqua regia (AR) and oxalic acid (OX) for 720 h of samples (a–d) ALB1, (e–f) ALB2, and (g–h) MIC. While panel (c) was detected with a BSE detector, all SEM images were detected with an SE detector using 20 kV HV and ∼ 21 mm WD.
SEM analyses were performed for each sample before and after chemical treatments (Figs. 2 and S2) and revealed that dissolution was non-uniform. Grains from the reacted samples exhibited areas that ranged from fresh to altered (Fig. 2). The most obvious dissolution features were etch pits of a few micrometres at the feldspar surfaces, although they occurred irregularly, demonstrating dissolution heterogeneity. Sample ALB1 revealed more dissolution features at the grain surface compared to that of samples ALB2 and MIC. For ALB1, discrete secondary precipitates were detected in the form of Fe and Mn phases (Fig. 2a, b). The SEM photomicrograph showed K-rich laminae at the surface of ALB1 (Fig. 2c), which seemed to be unaffected by the two solutions over 720 h. Similar features were observed at the surface of sample ALB2, although to a lesser extent. Besides the etch pits at the plagioclase surfaces and secondary precipitates (Fig. 2d, e), no other grain surface changes were observed. Sample MIC showed almost no surface dissolution features after aqua regia or oxalic acid treatments, which is consistent with the low extent of dissolution observed for this sample.
4.2 Luminescence dating properties
4.2.1 Thermoluminescence (TL)
TL emission spectra were recorded in the wavelength region between ∼ 280 and ∼ 715 nm, giving information about TL recombination centres (Fig. 3). Except for their absolute intensities, TL emissions looked similar for the two plagioclase samples (ALB1 and ALB2) with emissions in the near-UV (∼ 340 nm), blue (∼ 410 nm), and green–yellow (∼ 575 nm) wavelength bands. A tail of the red emission was visible around 710 nm. The detected luminescence emissions agreed with previous observations (e.g. Krbetschek et al., 1997; Riedesel et al., 2021). All emissions occurred in the low-temperature range at ∼ 100 ∘C, whilst the near-UV and green–yellow emissions showed a dominant peak at ∼ 250 ∘C. The blue emission of samples ALB1 and ALB2 revealed a tail to higher temperatures, but their intensities were lower compared to their dominant peaks in the lower temperature region. In contrast, sample MIC showed a broad emission ranging from ∼ 370 and ∼ 610 nm, which occurred around 100 ∘C (Fig. 3). Although much dimmer, the red emission tail was also evident in the region around 710 nm.
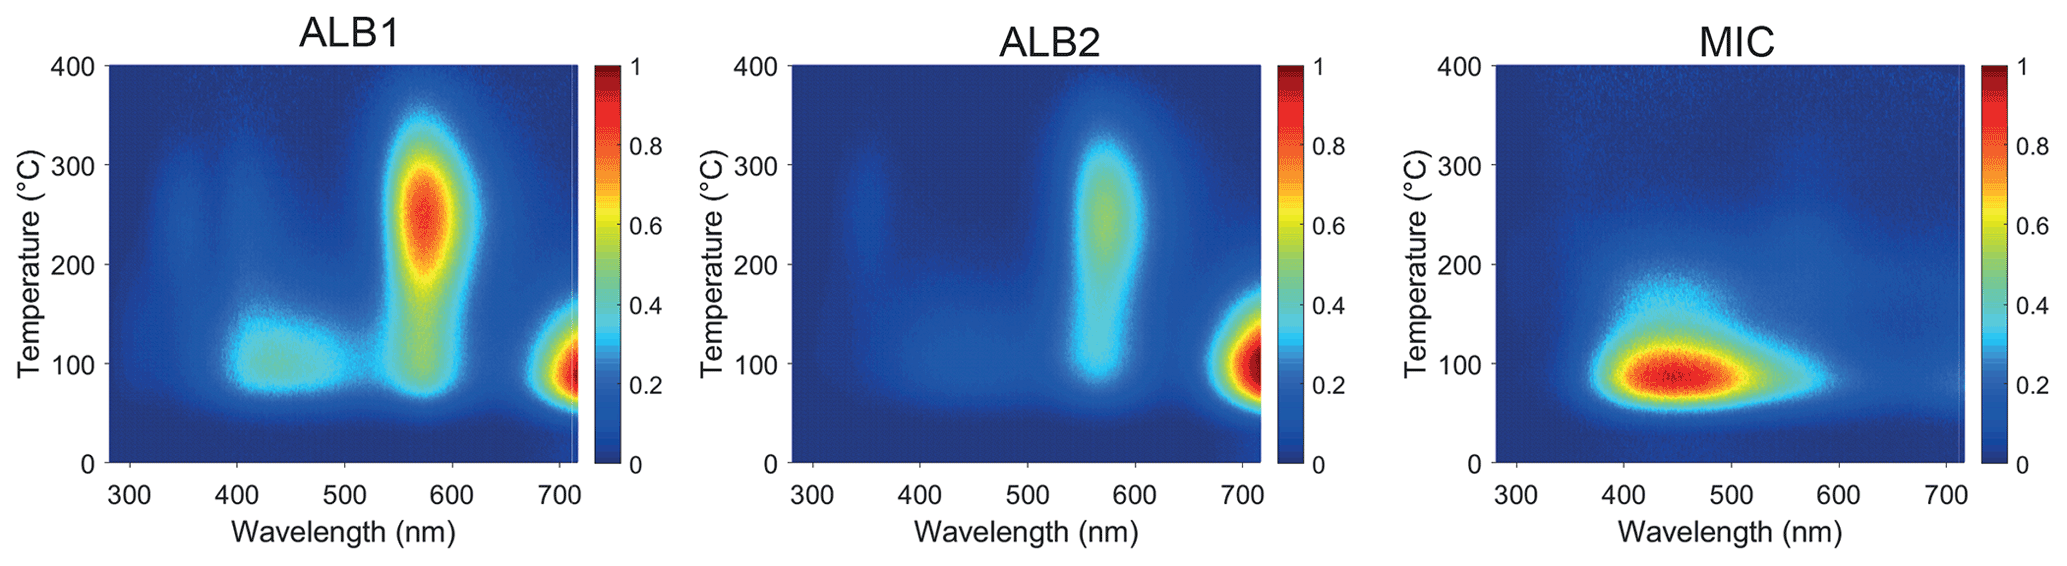
Figure 3Thermoluminescence (TL) emission spectra recorded up to 400 ∘C between ∼ 280 and ∼ 715 nm for samples ALB1, ALB2, and MIC (untreated). TL intensities are normalised for aliquot mass, dose (270 Gy), and electron multiplying gain to the highest TL intensity of the whole TL spectrum. Spectra are corrected for spectrometer efficiency.
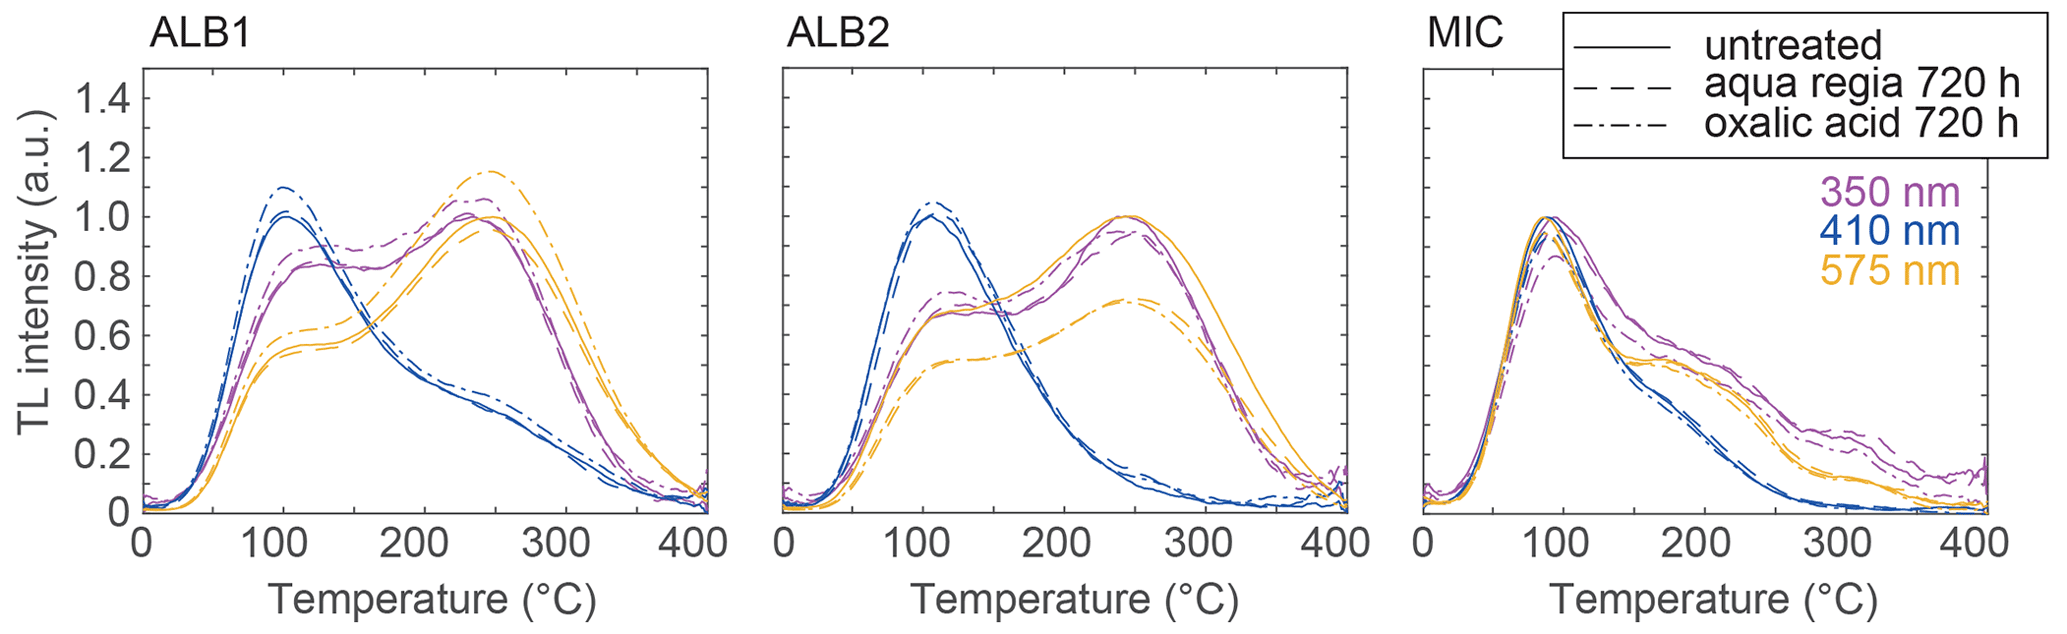
Figure 4Thermoluminescence (TL) curves extracted from TL emission spectra for different wavelengths (near-UV, blue, and green–yellow) for the untreated specimens and the chemically treated samples for 720 h using aqua regia (dashed line) and oxalic acid (dashed–dotted line). The aqua regia and oxalic acid spectra were normalised to the untreated sample (solid line) of each specific wavelength region for comparison. All curves show the mean values measured from three aliquots.
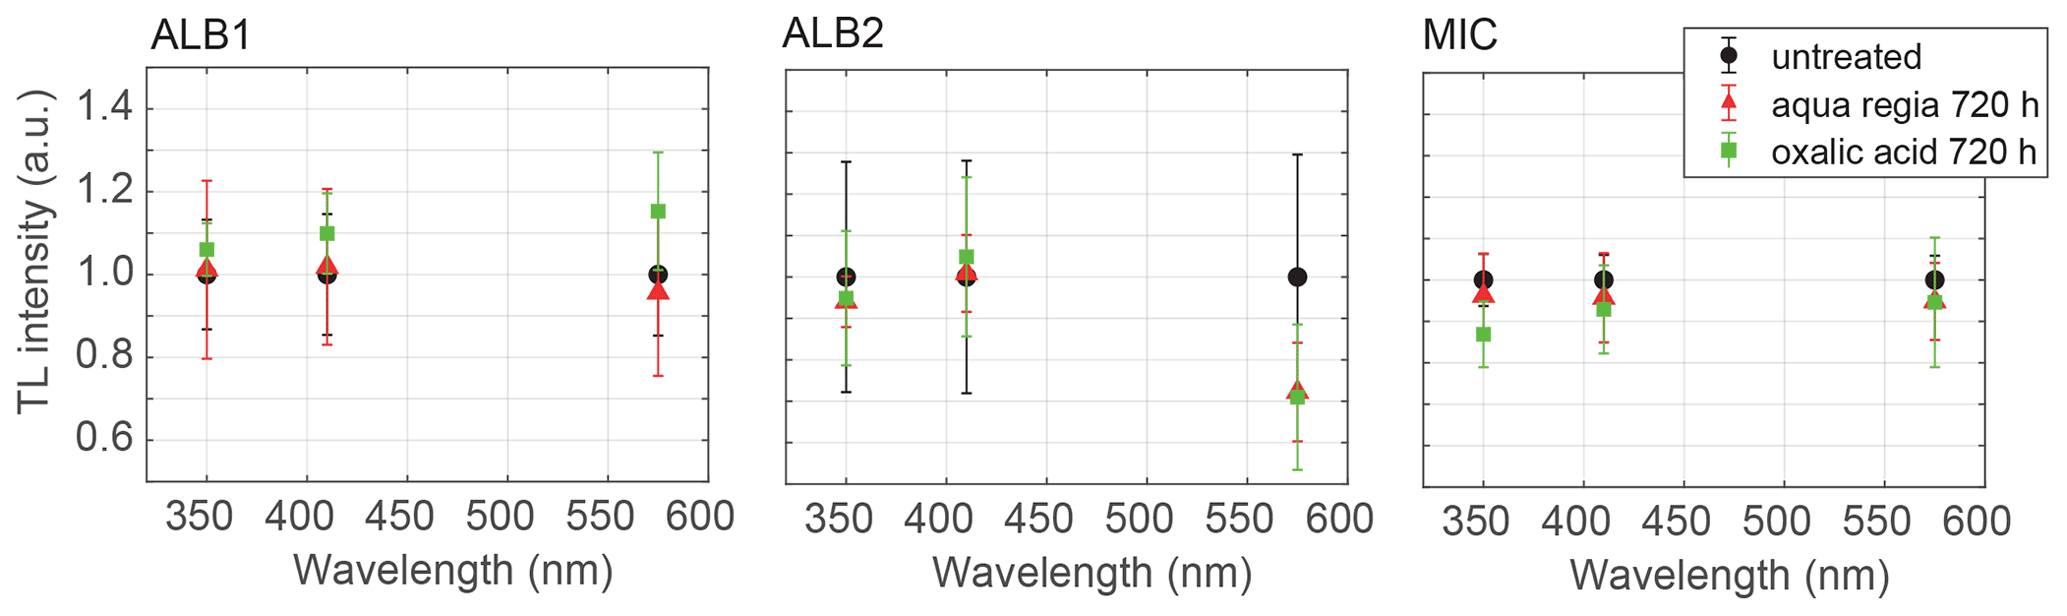
Figure 5Thermoluminescence (TL) dominant peak positions extracted from TL emission spectra for different wavelengths (near-UV, blue, and green–yellow) for the untreated (black circles) and the chemically treated samples for 720 h using aqua regia (red triangles) and oxalic acid (green squares). Aqua regia and oxalic acid spectra were normalised to the untreated sample. All symbols show the mean values measured from three aliquots and associated 1σ standard deviation. Dominant peak positions: near-UV – 100 ∘C (MIC) and 250 ∘C (ALB1, ALB2); blue – ∘C (all samples); green–yellow – 100 ∘C (MIC) and 250 ∘C (ALB1, ALB2).
The main TL peaks of the treated fractions of all samples were identical to those measured for the untreated fractions. However, TL intensities changed slightly with treatment duration (Figs. 3 and S3). Whilst mean TL intensities (n = 3) for sample ALB1 were up to 15 % higher after oxalic acid treatment, sample ALB2 showed insignificant changes with chemical treatment except for the green–yellow emission (Fig. 4). The latter was reduced by ∼ 25 % compared to the untreated TL emission with both aqua regia and oxalic acid treatments. Sample MIC showed no change with feldspar dissolution, showing similar TL intensities for the near-UV, blue, and green–yellow TL emission bands (Fig. 4). Although TL intensity changes were observed for the two plagioclase samples, between-aliquot-scatter could explain the slightly higher or lower TL intensities after chemical treatment. When comparing the mean TL intensities of the three aliquots with their corresponding 1σ standard deviations (Fig. S4), TL emissions are still identical and overlap the untreated TL curves (Fig. 5). Although the aliquots were mass corrected, the number of luminescent grains may have varied between aliquots, leading to the differences in TL intensities.
4.2.2 Infrared stimulated luminescence (IRSL)
pIR-IRSL decay and dose response
The multi-grain feldspar samples generally yielded bright IR50 and pIR225 signals in the near-UV and blue emission wavelength regions (Tn intensities = several 104–105 counts per 0.7 s) and IR50 signals decayed faster than the pIR225 signals, which is well known from previous pIR-IRSL dating studies (e.g. Kars et al., 2014). After chemical treatment, signal decay of the IR50 and pIR225 signals in the UV and blue luminescence emissions exhibited no change with aqua regia or oxalic acid treatment (Figs. 6 and S5–S6). Although a change in IRSL sensitivity was recorded, there was no clear trend of increasing or decreasing signal intensity. Greater variability in IRSL sensitivity was observed after oxalic acid treatment (Figs. 6c, d and S5–S6). As for the TL data, inter-aliquot scatter must also be accounted for, since IRSL intensities are dependent on the number of luminescent grains measured on a single aliquot. In agreement with the luminescence signal decay data, the dose response curves of the three samples in the UV and blue emissions showed no change after artificial chemical treatment (Figs. 6 and S7–S8). We measured the dose response curves until close to saturation (2250 Gy) to calculate the characteristic saturation dose (i.e. D0, 68 % of the dose response curve), after fitting the data with a single saturating exponential function (Figs. 6 and S7–S8). All D0 values were within 10 % of one another and did not show differences due to feldspar partial dissolution (Figs. 6 and S9).

Figure 6Exemplary pIR-IRSL signal decay, dose response (inset) (a–d), and characteristic saturation dose (D0; e–f) data of sample ALB1 measured of the blue emission before (0 h) and after aqua regia and oxalic acid treatment (4–720 h). IRSL signals are presented as the mean of three multi-grain aliquots and normalised to the initial (untreated, 0 h) IR50 and pIR225 signals. The single saturating exponential function was used to fit the regenerative dose points in the dose response curves. Fitting was performed through three measured aliquots and normalised to the highest IRSL intensity. D0 values are normalised to the initial D0 values of the IR50 and pIR225 signals.
Single-grain measurements using the pIR-IRSL225 protocol showed bright luminescence for the IR50 signals, while measurement of the pIR225 signal was challenging due to dim luminescence or anomalous dose response (i.e. dose response that did not exhibit monotonic growth). Only 2 % of grains were accepted for sample MIC, whilst samples ALB1 and ALB2 yielded an acceptance rate of 46 %–95 % of 100 grains for the IR50 signal (Table S2). As the samples are museum specimens and did not have a natural signal, we tested whether we could recover a laboratory-administered dose (i.e. a dose recovery test). Dose distributions following the different treatments yielded overdispersion values < 3 %, except for sample ALB1, which showed a higher overdispersion after 240 h aqua regia treatment in the UV emission with 8 ± 1 % (Table S2). Mean dose recovery ratios were all within unity indicating insignificant intrinsic scatter.
pIR-IRSL anomalous fading
Measurement of anomalous fading rates were carried out using the pIR-IRSL225 protocol at a multi-grain level (i.e. Buylaert et al., 2009; Thomsen et al., 2008) in the near-UV and blue wavelength regions. Figure 7 summarises fading rate data obtained for the IR50 and pIR225 signals in both detection wavelengths before (time point 0 h) and after chemical treatment (treatment durations 4–720 h). Measurement of fading rates showed variations in g2 d values between the three samples and the two luminescence emission bands. The two plagioclase samples yielded higher fading rates compared to the microcline sample. Moreover, signals emitted in the near-UV are generally less stable than the signal measured in the blue wavelength region (Fig. 7), which is in agreement with previous observations (e.g. Thomsen et al., 2008).
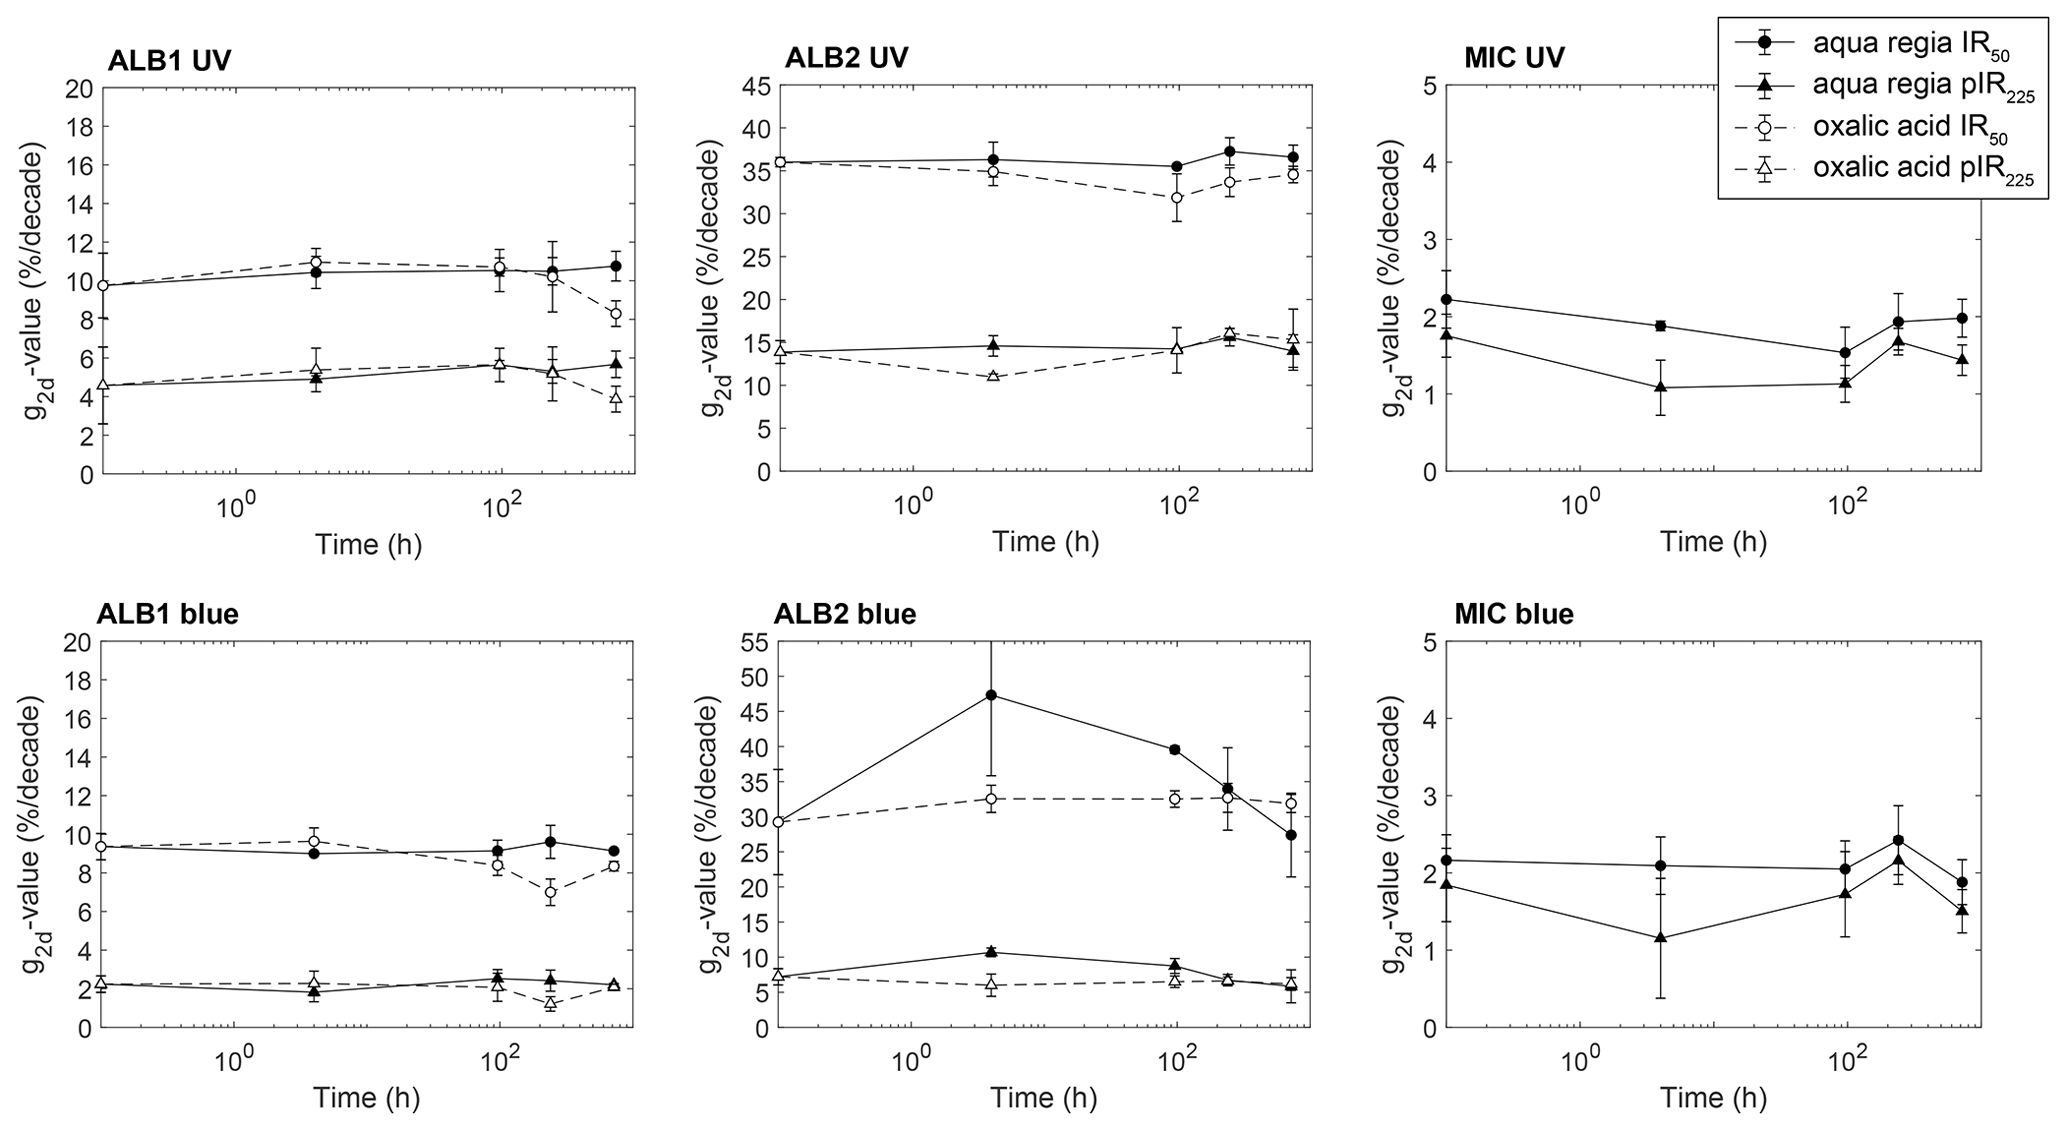
Figure 7Multi-grain fading data of the IR50 (circle) and pIR225 (triangle) signals treated with aqua regia (filled) and oxalic acid (unfilled).
Fading rates of the two plagioclases and the microcline showed little change with treatment duration. Most of the fading rates remained within 1σ uncertainty and did not follow a specific trend (Fig. 7). Sample ALB1 exhibited slightly decreasing fading rates following weathering with oxalic acid in both emissions. However, given the recovery of fading rates after 240 h in the blue emission, it is likely that fading rates changed slightly as a function of laboratory measurement uncertainty rather than artificial chemical weathering. Sample ALB2 yielded stable fading rates in the UV for both pIR-IRSL signals within uncertainty. In the blue emission, fading rates showed a decreasing trend with treatment time using aqua regia after 4 h, although large measurement uncertainties are observed. Fading rates decreased from very high rates of 47.3 ± 11.5 % per decade (IR50) and 10.7 ± 0.6 % per decade (pIR225) to 27.4 ± 6.0 % per decade (IR50) and 5.8 ± 2.3 % per decade (pIR225), respectively (Fig. 7). However, it should be noted that the initial fading rates of the untreated subsamples showed similar rates to the 720 h aqua regia treatment of 29.2 ± 7.5 % per decade (IR50) and 7.2 ± 1.2 % per decade (pIR225). Laboratory fading rates are likely biased by measurement uncertainties, as indicated by the large 1σ standard deviations of the three measured aliquots. Larger scatter has also been observed for sample MIC for both signals and luminescence emissions. Initial fading rates are 2.2 ± 0.4 % per decade (IR50) and 1.8 ± 0.3 % per decade (pIR225) in the UV and 2.2 ± 0.3 % per decade (IR50) and 1.8 ± 0.5 % per decade (pIR225) in the blue emission. No significant changes have been observed with aqua regia treatment; all treatment durations yielded fading rates that were within 1σ error (Fig. 7).
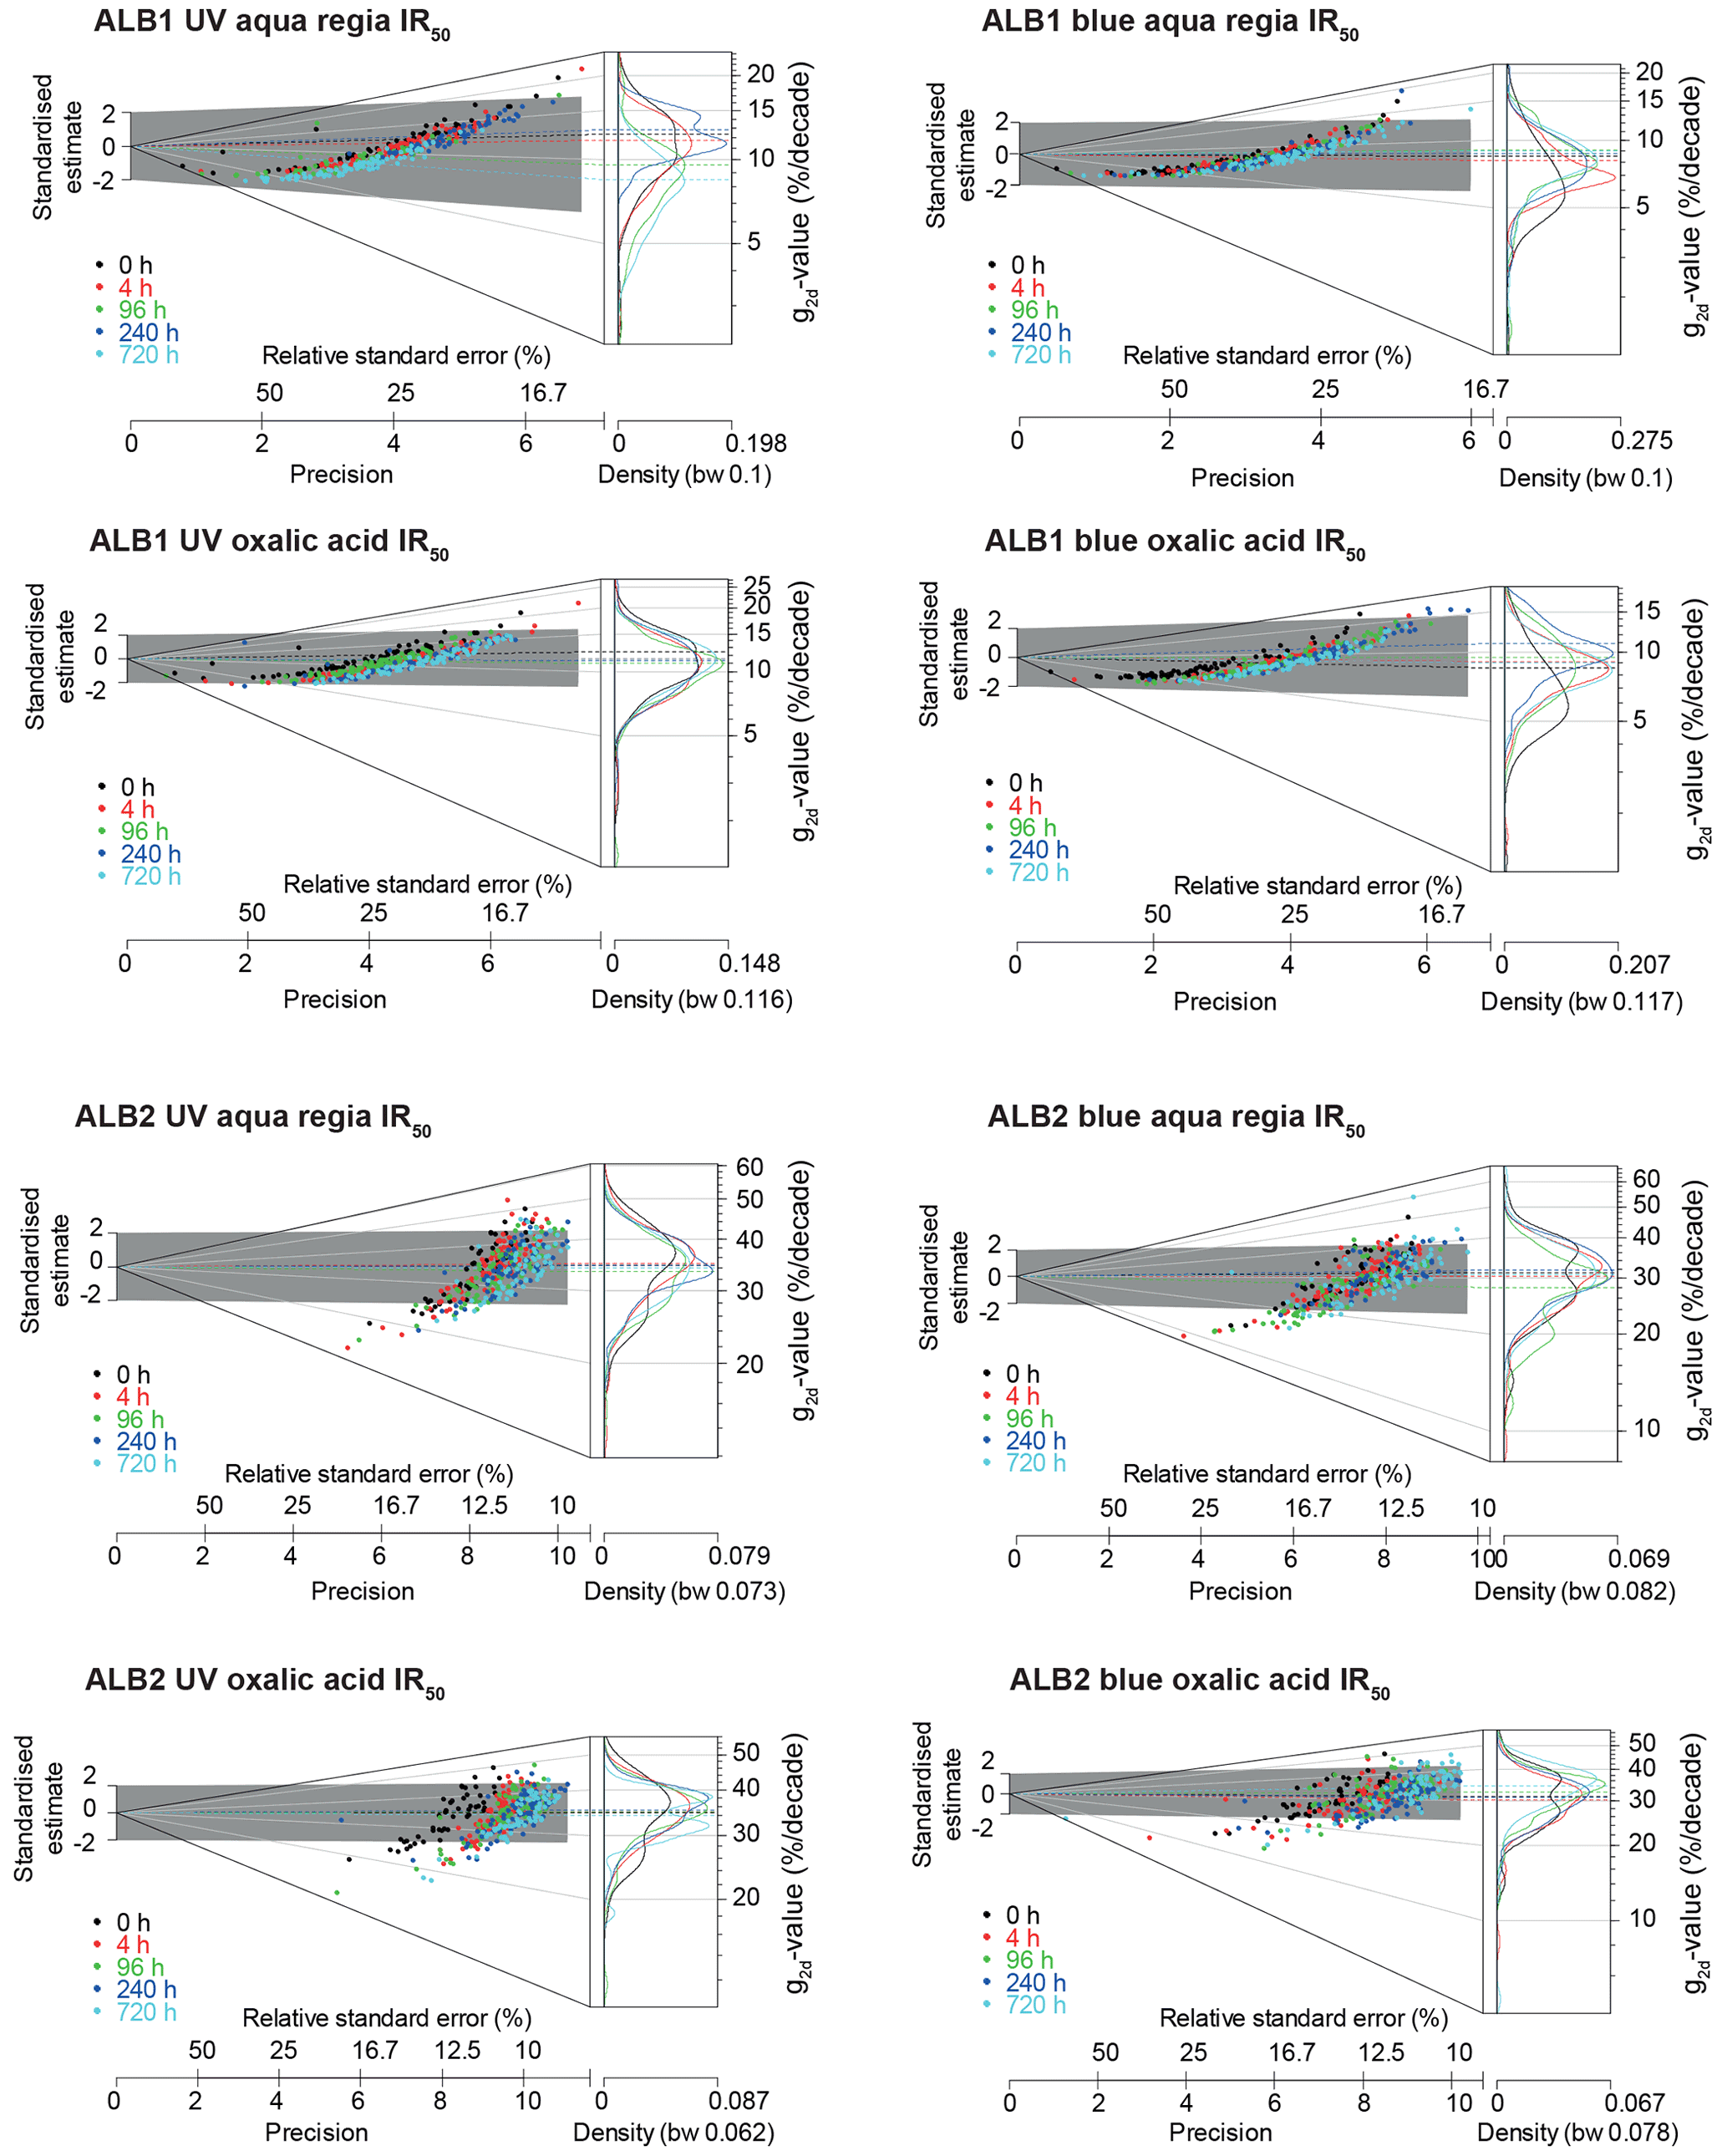
Figure 8Single-grain fading data of the IR50 signals illustrated as abanico plots (Dietze et al., 2016). Fading rates are normalised to 2 d (g2 d; Huntley and Lamothe, 2001) as a function of treatment time from 0 h (untreated) to 720 h for the near-UV and blue wavelength regions and two acid solutions (aqua regia and oxalic acid). The mean is centred in the abanico plots.
Since luminescence data at a multi-grain level can be affected by averaging effects (e.g. Reimann et al., 2012; Trauerstein et al., 2014), we also studied the fading properties at the single-grain level. Due to dim pIR225 signals, single-grain data are presented for the IR50 signals for the two plagioclase samples only (Fig. 8). Sample MIC has insufficiently bright signal intensities for robust fading rate determination at the single-grain level. For samples ALB1 and ALB2, although slight changes can be observed at the single-grain level, the initial and final fading rates remain within uncertainty. The most striking observation is an improvement in measurement precision: as treatment time increases from 0 h to 720 h, standard errors become smaller and precision improves (Fig. 8).
Our experiments showed that greater dissolution occurred for minerals in contact with aqua regia than oxalic acid (Fig. 1), as expected given the stronger acidity, higher oxidation potential, and higher temperature of the aqua regia digestion. However, the oxalic acid extraction allowed for the leaching of higher amounts of Si due to the presence of oxalate, a complex-forming ligand (Shotyk and Nesbitt, 1992). SEM analyses of treated samples revealed heterogeneously distributed etch pits or solution cracks, in agreement with the observations of Gout et al. (1997) for natural albite crystals. Moreover, few secondary precipitates rich in Fe and Mn were observed at grain surfaces (Fig. 2). Given that feldspar dissolution occurred incongruently after aqua regia and that the kinetics of Al and Si accumulation in solution were non-linear (Fig. 1), we infer that preferential diffusion-controlled dissolution occurred (Lasaga, 1984; Yuan et al., 2019). Thus, the dissolution rate slows down with time, controlled by ion substitution between H+ ions and Na+, K+, and Ca2+ cations and subsequent Al–O–Si and Si–O–Si bond breaking (e.g. Gout et al., 1997; Oelkers and Schott, 1995). The faster substitution of hydrogen and alkali ions compared to Al and Si was also evident in our experiments (Fig. 1). While feldspar partial dissolution led to the breaking of some Si–O–Si bonds, most of the initial feldspar surfaces remain unaltered. Therefore, feldspar dissolution seems to be controlled by selective chemical reaction at the solid–solution interface and not by uniform diffusion (Berner and Holdren, 1979).
Feldspar minerals show different chemical resistance to environmental changes (e.g. temperature, moisture, fluid composition) with K-feldspars being generally more resistant than plagioclases. For plagioclases, resistance to chemical weathering decreases with increasing Ca content (Goldich, 1938). This is apparent in our museum samples, with more dissolution observed for the Ca-rich plagioclase (sample ALB1) relative to sample ALB2 and with the microcline (sample MIC) exhibiting the least alteration (Figs. 1 and 2). The solution chemistry confirmed that the three feldspar samples behaved differently under chemical treatment (Fig. 1), consistent with feldspar dissolution being dependent upon mineral chemical composition (e.g. Shotyk and Nesbitt, 1992).
The TL emission spectroscopy showed that the two plagioclase samples were dominated by the green–yellow emission, whilst the UV and blue emissions were less intense. This emission spectrum may be indicative of an ordered mineral structure (Riedesel et al., 2021); however, high fading rates (i.e. IR50, > 10 % per decade, Fig. 7) in the near-UV and blue emission bands suggest that the two plagioclases are disordered (Spooner, 1994). Structural disorder would predispose the minerals to easier bond-breaking and element release (Yuan et al., 2019). However, the effect on the luminescence properties is rather minor as almost no change in the TL and IRSL signals (Figs. 5–8) was observed after 720 h of artificial weathering. Although fading rates appear to reduce with oxalic acid treatment at the multi-grain level, this trend is not apparent at the single-grain level (Figs. 7 and 8).
Luminescence production has been related to Mn2+ for the green–yellow emission (Geake et al., 1977) and Al–O–Al bridges for the blue emission (Finch and Klein, 1999; Speit and Lehmann, 1982). Our results show that Mn2+ was leached slightly from the crystal structure (Fig. 1) and sample ALB2 exhibited a reduction in the green–yellow TL emission. Therefore, the lower TL intensities around 575 nm following chemical treatment might reflect the leaching of Mn from the crystal's surface, which would indicate a change in TL sensitivity after weathering, although this was not observed for the other samples. As the blue emission likely results from Al–O–Al bridges (Finch and Klein, 1999; Speit and Lehmann, 1982), leaching of Al could affect the luminescence signal commonly used for dating purposes (e.g. Buylaert et al., 2012). However, based on our observation of negligible changes in the IRSL and TL properties in the blue emission band, it seems that the blue emission is unaffected by the dissolution of Al from the surface. Negligible change was also observed for the UV emission, which may contribute to the luminescence signal measured when using the blue filter pack (410 nm emission). Thus, surface-controlled mechanisms in feldspar dissolution characterised by leached surfaces and secondary precipitates seem to have only minor effects on luminescence dating properties. As most luminescence properties remain constant and show a very minor change after chemical weathering, we infer that luminescence originates from the entire grain rather than just the surface where chemical weathering takes place (Holdren and Berner, 1979). Given the improved data precision in the single-grain data, it seems that the artificial weathering led to cleaning of grain surfaces, potentially allowing better signal transmission from the grain bulk. A more subtle change in signal intensity is anticipated for less transparent feldspars (i.e. darker colour) (Duller, 1997) than those investigated in this study.
Dissolution rates under natural conditions differ from laboratory rates and have been found to be orders of magnitudes slower (e.g. Gruber et al., 2014; White and Brantley, 2003; Zhu, 2005). Using aqua regia at higher temperature (40 ∘C), we used aggressive hydrolysis conditions; yet we generally dissolved < 10 % of the elements. Longer laboratory treatment times or the use of different ligands (e.g. F−; Shotyk and Nesbitt, 1992) may allow natural weathering conditions over 106-year timescales to be approximated. Very high degrees of etching have been reported for some naturally weathered soil feldspars (Berner and Holdren, 1979). However, natural soil solution contains a wide range of organic and inorganic ions and is prone to ionic strength, pH, and redox fluctuations (e.g. Zhang and Furman, 2021). Natural weathering is furthermore difficult to mimic in the laboratory as biotic components will bring further complexities by exuding compounds specifically meant to extract the limiting nutrients from minerals (e.g. Epihov et al., 2021). In this study, we have nevertheless shown that slight to moderate alterations of the mineral surface (creation of etch pits and oxide precipitates) do not affect luminescence properties important for dating sediments. Based on our observations, it seems likely that complex feldspar luminescence properties such as variability in fading rates (Valla et al., 2016), differences in IRSL intensities (Wang and Miao, 2006), or age reversals (Berger et al., 2001) might not be correlated to the degree of chemical weathering alone and are probably affected by a complex interaction between intrinsic (mineral properties) and extrinsic factors (environmental properties) (Opolot and Finke, 2015).
Feldspar luminescence properties are assumed to be resistant to chemical weathering over Quaternary timescales. For the first time, we have studied the effect of artificial chemical weathering of feldspars on their luminescence dating properties. Only minor changes were observed, even after an aggressive chemical attack using aqua regia for 1 month. The acids attacked the grain surfaces, while the core of the grains remained intact. Intensities of TL and IRSL signals may have been slightly modified, although other factors may have played a role in causing these differences in signal intensities (e.g. between-aliquot variability). In conclusion, the feldspar luminescence properties explored in this study were mostly unmodified, and the complex luminescence characteristics that we recorded were likely due to other sources of uncertainty rather than the chemical treatments alone.
The experiments conducted in this study were chosen to approximate changes at longer timescales in nature. However, laboratory conditions can differ significantly from natural chemical weathering settings given the complex interplay of physical, biological, and chemical factors in the environment as well as variations in climate, hydrology, pore water chemistry, and secondary mineral precipitation. This may explain the discrepancy between our results that showed little modification of luminescence properties and previous observations of weathering-dependent changes in luminescence signals from studies based on natural environmental settings (e.g. Wang and Miao, 2006). In the future, feldspar minerals of different chemical compositions and their luminescence properties should be characterised in natural weathering profiles (e.g. regolith, soil horizons) and compared to their untreated parent material to shed light on complex luminescence characteristics and, in turn, challenging luminescence chronologies.
All data generated or analysed during this study are included in this paper or its Supplement. Raw data for this study are available at https://doi.org/10.5281/zenodo.7463140 (Bartz et al., 2022).
The supplement related to this article is available online at: https://doi.org/10.5194/gchron-5-51-2023-supplement.
MB, JP, SG and GEK contributed to the experimental design; analyses were performed by MB. MB prepared the paper with contributions from GEK, JP and SG.
At least one of the (co-)authors is a member of the editorial board of Geochronology. The peer-review process was guided by an independent editor, and the authors also have no other competing interests to declare.
Publisher's note: Copernicus Publications remains neutral with regard to jurisdictional claims in published maps and institutional affiliations.
This work was funded by the Swiss National Science Foundation (SPARK, grant no. CRSK-2_190905) awarded to Georgina E. King. We are grateful to Laetitia Monbaron for laboratory support and ICP-OES analysis. Caroline De Meyer is gratefully acknowledged for helping with the SEM analyses. Olivier Reubi and Thierry Adatte are thanked for their support with the XRF and XRD, respectively, and with preparation and analyses of the samples. We thank all reviewers for their constructive comments that helped to improve the paper.
This research has been supported by the Schweizerischer Nationalfonds zur Förderung der Wissenschaftlichen Forschung (grant no. CRSK-2_190905).
This paper was edited by James Feathers and reviewed by Paulramasamy Morthekai and one anonymous referee.
Adatte, T., Stinnesbeck, W., and Keller, G.: Lithostratigraphic and mineralogic correlations of near K/T boundary clastic sediments in northeastern Mexico: implications for origin and nature of deposition, Geol. Soc. Am. Spec. Papers, 307, 211–226, https://doi.org/10.1130/0-8137-2307-8.211, 1996.
Aitken, M. J.: Thermoluminescence Dating, Academic Press, London, ISBN 0-12-046380-6, 1985.
Auclair, M., Lamothe, M., and Huot, S.: Measurement of anomalous fading for feldspar IRSL using SAR, Radiat. Meas., 37, 487–492, https://doi.org/10.1016/S1350-4487(03)00018-0, 2003.
Bartz, M., Peña, J., Grand, S., and King, G. E.: Potential impacts of chemical weathering on feldspar luminescence dating properties, Zenodo [data set], https://doi.org/10.5281/zenodo.7463140, 2022.
Berger, G. W., Pillans, B. J., and Tonkin, P. J.: Luminescence chronology of loess-paleosol sequences from Canterbury, South Island, New Zealand, New Zeal. J. Geol. Geophys., 44, 501–516, https://doi.org/10.1080/00288306.2001.9514952, 2001.
Berner, R. A. and Holdren, G. R.: Mechanism of feldspar weathering – II. Observations of feldspars from soils, Geochim. Cosmochim. Acta, 43, 1173–1186, https://doi.org/10.1016/0016-7037(79)90110-8, 1979.
Bøtter-Jensen, L., Andersen, C. E., Duller, G. A. T., and Murray, A. S.: Developments in radiation, stimulation and observation facilities in luminescence measurements, Radiat. Meas., 37, 535–541, https://doi.org/10.1016/S1350-4487(03)00020-9, 2003.
Buylaert, J. P., Murray, A. S., Thomsen, K. J., and Jain, M.: Testing the potential of an elevated temperature IRSL signal from K-feldspar, Radiat. Meas., 44, 560–565, https://doi.org/10.1016/j.radmeas.2009.02.007, 2009.
Buylaert, J.-P., Jain, M., Murray, A. S., Thomsen, K. J., Thiel, C., and Sohbati, R.: A robust feldspar luminescence dating method for Middle and Late Pleistocene sediments, Boreas, 41, 435–451, https://doi.org/10.1111/j.1502-3885.2012.00248.x, 2012.
Chardon, E. S., Livens, F. R., and Vaughan, D. J.: Reactions of feldspar surfaces with aqueous solutions, Earth Sci. Rev., 78, 1–26, https://doi.org/10.1016/j.earscirev.2006.03.002, 2006.
Collignon, C., Ranger, J., and Turpault, M. P.: Seasonal dynamics of Al- and Fe-bearing secondary minerals in an acid forest soil: influence of Norway spruce roots (Picea abies (L.) Karst.), Eur. J. Soil Sci., 63, 592–602, https://doi.org/10.1111/j.1365-2389.2012.01470.x, 2012.
Deer, W. A., Howie, R. A., and Zussman, J.: An Introduction to the Rock-Forming Minerals, Mineralogical Society of Great Britain and Ireland, ISBN 9780903056274, https://doi.org/10.1180/DHZ, 2013.
Dietze, M., Kreutzer, S., Burow, C., Fuchs, M. C., Fischer, M., and Schmidt, C.: The abanico plot: Visualising chronometric data with individual standard errors, Quat. Geochronol., 31, 12–18, https://doi.org/10.1016/j.quageo.2015.09.003, 2016.
Duller, G. A. T.: Behavioural studies of stimulated luminescence from feldspars, Radiat. Meas., 27, 663–694, https://doi.org/10.1016/S1350-4487(97)00216-3, 1997.
Epihov, D. Z., Saltonstall, K., Batterman, S. A., Hedin, L. O., Hall, J. S., van Breugel, M., Leake, J. R., and Beerling, D. J.: Legume–microbiome interactions unlock mineral nutrients in regrowing tropical forests, P. Natl. Acad. Sci. USA, 118, e2022241118, https://doi.org/10.1073/pnas.2022241118, 2021.
Finch, A. A. and Klein, J.: The causes and petrological significance of cathodoluminescence emissions from alkali feldspars, Contrib. Mineral. Petrol., 135, 234–243, https://doi.org/10.1007/s004100050509, 1999.
Garcia-Guinea, J., Townsend, P. D., Sanchez-Muñoz, L., and Rojo, J. M.: Ultraviolet-blue ionic luminescence of alkali feldspars from bulk and interfaces, Phys. Chem. Miner., 26, 658–667, https://doi.org/10.1007/s002690050231, 1999.
Geake, J. E., Walker, G., Telfer, D. J., Mills, A. A., Massey, H. S. W., Brown, G. M., Eglinton, G., Runcorn, S. K., and Urey, H. C.: The cause and significance of luminescence in lunar plagioclase, Philos. Trans. R. Soc. London. Ser. A, Math. Phys. Sci., 285, 403–408, https://doi.org/10.1098/rsta.1977.0081, 1977.
Goldich, S. S.: A Study in Rock-Weathering, J. Geol., 46, 17–58, https://doi.org/10.1086/624619, 1938.
Götze, J., Habermann, D., Neuser, R. D., and Richter, D. K.: High-resolution spectrometric analysis of rare earth elements-activated cathodoluminescence in feldspar minerals, Chem. Geol., 153, 81–91, https://doi.org/10.1016/S0009-2541(98)00153-3, 1999.
Gout, R., Oelkers, E. H., Schott, J., and Wick, A.: The surface chemistry and structure of acid-leached albite: New insights on the dissolution mechanism of the alkali feldspars, Geochim. Cosmochim. Acta, 61, 3013–3018, https://doi.org/10.1016/S0016-7037(97)00122-1, 1997.
Gruber, C., Zhu, C., Georg, R. B., Zakon, Y., and Ganor, J.: Resolving the gap between laboratory and field rates of feldspar weathering, Geochim. Cosmochim. Acta, 147, 90–106, https://doi.org/10.1016/j.gca.2014.10.013, 2014.
Guralnik, B., Jain, M., Herman, F., Ankjærgaard, C., Murray, A. S., Valla, P. G., Preusser, F., King, G. E., Chen, R., Lowick, S. E., Kook, M., and Rhodes, E. J.: OSL-thermochronometry of feldspar from the KTB borehole, Germany, Earth Planet. Sci. Lett., 423, 232–243, https://doi.org/10.1016/j.epsl.2015.04.032, 2015.
Hofmeister, A. M. and Rossman, G. R.: Chapter 11. Color in feldspars, edited by: Ribbe, P. H., De Gruyter, https://doi.org/10.1515/9781501508547-016, 271–280, 1983.
Holdren, G. R. and Berner, R. A.: Mechanism of feldspar weathering – I. Experimental studies, Geochim. Cosmochim. Acta, 43, 1161–1171, https://doi.org/10.1016/0016-7037(79)90109-1, 1979.
Huntley, D. J.: Comment on “Isochron dating of sediments using luminescence of K-feldspar grains” by B. Li et al., J. Geophys. Res., 116, F01012, https://doi.org/10.1029/2010JF001856, 2011.
Huntley, D. J. and Lamothe, M.: Ubiquity of anomalous fading in K-feldspars and the measurement and correction for it in optical dating, Can. J. Earth Sci., 38, 1093–1106, https://doi.org/10.1139/e01-013, 2001.
Huntley, D. J., Godfrey-Smith, D. I., and Thewalt, M. L. W.: Optical dating of sediments, Nature, 313, 105–107, https://doi.org/10.1038/313105a0, 1985.
International Organization for Standardization: Soil, treated biowaste, sludge and waste – Digestion of aqua regia soluble fractions of elements, ISO standard 54321:2020, https://www.iso.org/standard/75441.html, last access: 13 October 2020.
Jeong, G. Y. and Choi, J.-H.: Variations in quartz OSL components with lithology, weathering and transportation, Quat. Geochronol., 10, 320–326, https://doi.org/10.1016/J.QUAGEO.2012.02.023, 2012.
Jeong, G. Y., Cheong, C.-S., and Choi, J.-H.: The effect of weathering on optically stimulated luminescence dating, Quat. Geochronol., 2, 117–122, https://doi.org/10.1016/J.QUAGEO.2006.05.023, 2007.
Kars, R. H., Reimann, T., Ankjærgaard, C., and Wallinga, J.: Bleaching of the post-IR IRSL signal: new insights for feldspar luminescence dating, Boreas, 43, 780–791, https://doi.org/10.1111/bor.12082, 2014.
Keiluweit, M., Bougoure, J. J., Nico, P. S., Pett-Ridge, J., Weber, P. K., and Kleber, M.: Mineral protection of soil carbon counteracted by root exudates, Nat. Clim. Chang., 5, 588–595, https://doi.org/10.1038/nclimate2580, 2015.
King, G. E., Herman, F., Lambert, R., Valla, P. G., and Guralnik, B.: Multi-OSL-thermochronometry of feldspar, Quat. Geochronol., 33, 76–87, https://doi.org/10.1016/j.quageo.2016.01.004, 2016.
Krbetschek, M. R., Götze, J., Dietrich, A., and Trautmann, T.: Spectral information from minerals relevant for luminescence dating, Radiat. Meas., 27, 695–748, https://doi.org/10.1016/S1350-4487(97)00223-0, 1997.
Lapp, T., Kook, M., Murray, A. S., Thomsen, K. J., Buylaert, J.-P., and Jain, M.: A new luminescence detection and stimulation head for the Risø TL/OSL reader, Radiat. Meas., 81, 178–184, https://doi.org/10.1016/j.radmeas.2015.02.001, 2015.
Lasaga, A. C.: Chemical kinetics of water-rock interactions, J. Geophys. Res.-Sol. Ea., 89, 4009–4025, https://doi.org/10.1029/JB089iB06p04009, 1984.
Mariano, A. N. and Ring, P. J.: Europium-activated cathodoluminescence in minerals, Geochim. Cosmochim. Acta, 39, 649–660, https://doi.org/10.1016/0016-7037(75)90008-3, 1975.
Marfunin, A. S.: Spectroscopy, Luminescence and Radiation Centers in Minerals, Springer, Berlin, https://doi.org/10.1007/978-3-642-67112-8, 1979.
Nesbitt, H. W., Markovics, G., and price, R. C.: Chemical processes affecting alkalis and alkaline earths during continental weathering, Geochim. Cosmochim. Acta, 44, 1659–1666, https://doi.org/10.1016/0016-7037(80)90218-5, 1980.
Oelkers, E. H. and Schott, J.: Experimental study of anorthite dissolution and the relative mechanism of feldspar hydrolysis, Geochim. Cosmochim. Acta, 59, 5039–5053, https://doi.org/10.1016/0016-7037(95)00326-6, 1995.
Opolot, E. and Finke, P. A.: Evaluating sensitivity of silicate mineral dissolution rates to physical weathering using a soil evolution model (SoilGen2.25), Biogeosciences, 12, 6791–6808, https://doi.org/10.5194/bg-12-6791-2015, 2015.
Parsons, I.: Feldspars defined and described: a pair of posters published by the Mineralogical Society. Sources and supporting information, Mineral. Mag., 74, 529–551, https://doi.org/10.1180/minmag.2010.074.3.529, 2010.
Pfeifer, H.-R., Lavanchy, J.-C., and Serneels, V.: Bulk chemical analysis of geological and industrial materials by X-ray fluorescence, recent developments and application to materials rich in iron oxide, J. Trace Microprobe Tech., 9, 127–147, 1991.
Prasad, A. K., Lapp, T., Kook, M., and Jain, M.: Probing luminescence centers in Na rich feldspar, Radiat. Meas., 90, 292–297, https://doi.org/10.1016/j.radmeas.2016.02.033, 2016.
Reimann, T., Thomsen, K. J., Jain, M., Murray, A. S., and Frechen, M.: Single-grain dating of young sediments using the pIRIR signal from feldspar, Quat. Geochronol., 11, 28–41, https://doi.org/10.1016/j.quageo.2012.04.016, 2012.
Ribbe, P. H.: Feldspar Mineralogy. Reviews in Mineralogy, 2nd edn., Mineralogical Society of America, Washington D.C., ISBN 0-939950-14-6, 1983.
Riedesel, S.: Exploring variability in the luminescence properties of feldspars, PhD thesis, Aberystwyth University, uk.bl.ethos.831244, 2020.
Riedesel, S., Bell, A. M. T., Duller, G. A. T., Finch, A. A., Jain, M., King, G. E., Pearce, N. J., and Roberts, H. M.: Exploring sources of variation in thermoluminescence emissions and anomalous fading in alkali feldspars, Radiat. Meas., 141, 106541, https://doi.org/10.1016/j.radmeas.2021.106541, 2021.
Schwertmann, U.: Use of oxalate for Fe extraction from soils, Can. J. Soil Sci., 53, 244–246, https://doi.org/10.4141/cjss73-037, 1973.
Shotyk, W. and Nesbitt, H. W.: Incongruent and congruent dissolution of plagioclase feldspar: effect of feldspar composition and ligand complexation, Geoderma, 55, 55–78, https://doi.org/10.1016/0016-7061(92)90005-R, 1992.
Speit, B. and Lehmann, G.: Radiation defects in feldspars, Phys. Chem. Miner., 8, 77–82, https://doi.org/10.1007/BF00309017, 1982.
Spooner, N. A.: The anomalous fading of infrared-stimulated luminescence from feldspars, Radiat. Meas., 23, 625–632, https://doi.org/10.1016/1350-4487(94)90111-2, 1994.
Thomsen, K. J., Murray, A. S., Jain, M., and Bøtter-Jensen, L.: Laboratory fading rates of various luminescence signals from feldspar-rich sediment extracts, Radiat. Meas., 43, 1474–1486, https://doi.org/10.1016/J.RADMEAS.2008.06.002, 2008.
Trauerstein, M., Lowick, S. E., Preusser, F., and Schlunegger, F.: Small aliquot and single grain IRSL and post-IR IRSL dating of fluvial and alluvial sediments from the Pativilca valley, Peru, Quat. Geochronol., 22, 163–174, https://doi.org/10.1016/j.quageo.2013.12.004, 2014.
U.S. EPA: Method 3050B: Acid digestion of sediments, sludges and soils, Revision 2, Washington, DC, USA, https://www.epa.gov/esam/epa-method-3050b-acid-digestion-sediments-sludges-and-soils (last access: 13 October 2020), 1996.
Valla, P. G., Lowick, S. E., Herman, F., Champagnac, J. D., Steer, P., and Guralnik, B.: Exploring IRSL50 fading variability in bedrock feldspars and implications for OSL thermochronometry, Quat. Geochronol., 36, 55–66, https://doi.org/10.1016/j.quageo.2016.08.004, 2016.
Wang, X. and Miao, X.: Weathering history indicated by the luminescence emissions in Chinese loess and paleosol, Quat. Sci. Rev., 25, 1719–1726, https://doi.org/10.1016/j.quascirev.2005.11.009, 2006.
White, A. F. and Brantley, S. L.: The effect of time on the weathering of silicate minerals: Why do weathering rates differ in the laboratory and field?, Chem. Geol., 202, 479–506, https://doi.org/10.1016/j.chemgeo.2003.03.001, 2003.
Yuan, G., Cao, Y., Schulz, H.-M., Hao, F., Gluyas, J., Liu, K., Yang, T., Wang, Y., Xi, K., and Li, F.: A review of feldspar alteration and its geological significance in sedimentary basins: From shallow aquifers to deep hydrocarbon reservoirs, Earth-Sci. Rev., 191, 114–140, https://doi.org/10.1016/j.earscirev.2019.02.004, 2019.
Zhang, Z. and Furman, A.: Soil redox dynamics under dynamic hydrologic regimes – A review, Sci. Total Environ., 763, 143026, https://doi.org/10.1016/j.scitotenv.2020.143026, 2021.
Zhu, C.: In situ feldspar dissolution rates in an aquifer, Geochim. Cosmochim. Acta, 69, 1435–1453, https://doi.org/10.1016/j.gca.2004.09.005, 2005.
- Abstract
- Introduction
- Feldspar crystal structure, luminescence centres, and their relationship to chemical weathering
- Material and methods
- Results
- Discussion
- Summary and conclusion
- Data availability
- Author contributions
- Competing interests
- Disclaimer
- Acknowledgements
- Financial support
- Review statement
- References
- Supplement