the Creative Commons Attribution 4.0 License.
the Creative Commons Attribution 4.0 License.
 | 22 Jul 2024
New age constraints reveal moraine stabilization thousands of years after deposition during the last deglaciation of western New York, USA
Jason P. Briner
Caleb K. Walcott
Brooke M. Chase
Andrew L. Kozlowski
Tammy M. Rittenour
Erica P. Yang
The timing of the last deglaciation of the Laurentide Ice Sheet in western New York is poorly constrained. The lack of direct chronology in the region has led to a hypothesis that the Laurentide Ice Sheet re-advanced to near its Last Glacial Maximum terminal position in western New York at ∼ 13 ka, which challenges long-standing datasets. To address this hypothesis, we obtained new chronology from the Kent (terminal) and Lake Escarpment (first major recessional) moraines using radiocarbon ages in sediment cores from moraine kettles supplemented with two optically stimulated luminescence ages from topset beds in an ice-contact delta. The two optically stimulated luminescence ages date the Kent (terminal) position to 19.8 ± 2.6 and 20.6 ± 2.9 ka. Within the sediment cores, there is sedimentological evidence of an unstable landscape during basin formation; radiocarbon ages from the lowest sediments in our cores are not in stratigraphic order and date from 19 350–19 600 to 14 050–14 850 cal BP. We interpret these ages as loosely minimum-limiting constraints on ice sheet retreat. Our oldest radiocarbon age of 19 350–19 600 cal BP – from a rip-up clast – suggests ice-free conditions at that time. Above the lowest sediments there is organic-rich silt and radiocarbon ages in stratigraphic order. We interpret the lowest ages in these organic-rich sediments as minimum-limiting constraints on kettle basin formation. The lowest radiocarbon ages from organic-rich sediments from sites on both Kent and Lake Escarpment moraines range from 15 000–15 400 to 13 600–14 000 cal BP. We interpret the 5 kyr lag between the optically stimulated luminescence ages and kettle basin formation as the result of persistent buried ice in ice-cored moraines until ∼ 15 to 14 ka. The cold conditions associated with Heinrich Stadial 1 may have enabled the survival of ice-cored moraines until after 15 ka, and, in turn, climate amelioration during the Bølling period (14.7–14.1 ka) may have initiated landscape stabilization. This model potentially reconciles the sedimentological and chronological evidence underpinning the re-advance hypothesis, which instead could be the result of moraine instability and sediment mobilization during the Bølling–Allerød periods (14.7–13 ka). Age control for future work should focus on features that are not dependent on local climate.
- Article
(11458 KB) - Full-text XML
-
Supplement
(704 KB) - BibTeX
- EndNote


Much glacial research over the last century has focused on the style and timing of Laurentide Ice Sheet (LIS) recession from the Great Lakes region of North America following the Last Glacial Maximum (LGM, 26–19 ka; Dalton et al., 2020; Dyke, 2004; Fairchild, 1909). Well-constrained ice sheet chronologies are necessary to determine the timing of meltwater rerouting events from ice-dammed lakes that occupied the Great Lakes basins during the last deglaciation (Barth et al., 2019; Calkin and Feenstra, 1985; Leydet et al., 2018; Porreca et al., 2018; Rayburn et al., 2007), as these events are hypothesized to have had significant climatic impacts (Broecker et al., 1989; Donnelly et al., 2005). Models that attempt to understand past climate change (Osman et al., 2021), ice sheet sensitivity (Briner et al., 2020), and atmospheric organization (Löfverström et al., 2014; Tulenko et al., 2020) all require paleo-ice sheet configurations. Therefore, well-defined ice sheet retreat chronologies are critical for understanding dynamics and forcings within the late glacial climate system.
Despite the critical need for precise chronologies of ice margin retreat of the LIS in the Great Lakes region, ice margin reconstructions in western New York lack detailed age control. Here, there are no local ages on the terminal moraine and few from the recessional moraines (Muller and Calkin, 1993), leaving the deglacial chronology to be largely based on correlations with dated moraines and proglacial shorelines to the west in Ohio and to the east in New York (Fullerton, 1980; Ridge, 2003). These correlations suggest that the western New York Kent (terminal) and Lake Escarpment (recessional) moraines date to ∼ 20 and 17 ka, respectively (Fig. 1). However, Young et al. (2020) recently interpreted new and existing radiocarbon ages from western New York to support a re-advance of the LIS at ∼ 13 ka that overtopped the Lake Escarpment Moraine and nearly reached the Kent Moraine (Fig. 1). The evidence includes the reinterpretation of several unrelated sites throughout western New York but largely hinges on new trenched sediment sections near the Kent Moraine revealing logs in clayey diamicton, which Young et al. (2020) suggest requires glacial overriding of a forest at ∼ 13.3 to 13.0 ka. In contrast to Young et al.'s (2020) reconstruction, most literature places the LIS margin north of Lake Ontario at this time (Dalton et al., 2020; Muller and Calkin, 1993; Terasmae, 1980; and references therein), with the drainage of Glacial Lake Iroquois occurring at ∼ 13 ka (Fig. 1; Cronin et al., 2012; Lewis and Anderson, 2019; Rayburn et al., 2005). To reconcile the disagreement in timing between the hypothesized re-advance and existing chronologies, Young et al. (2020) invoke a largely floating ice mass that left minimal traces of its existence in most areas. If a re-advance of the scale hypothesized by Young et al. (2020) occurred (henceforth referred to as the “Allerød re-advance hypothesis”), there would be a need to revisit many regional deglaciation chronologies.
Figure 1Map depictions of the deglaciation of the eastern Great Lakes after the Last Glacial Maximum. The black line is the Kent Moraine modified from Dalton et al. (2020), the Pennsylvania Department of Conservation and Natural Resources Late Wisconsin Glacial Border (https://www.pasda.psu.edu, last access: 29 March 2022), and the Quaternary Geology 500K – Glacial Boundary of Ohio (https://gis.ohiodnr.gov, last access: 29 March 2022). The dark gray line is the 17 ka ice margin from Dalton et al. (2020), which depicts the Lake Escarpment Moraine. The light gray line is the 15 ka ice margin from Dalton et al. (2020), which depicts the Marilla Moraine. Glacial Lakes Maumee and Whittlesey are included for general reference and drawn with shoreline elevations (Fisher et al., 2015). The white line is the 13 ka ice margin from Dalton et al. (2020), and we estimated Glacial Lake Iroquois using Bird and Kozlowski (2016). The dashed red line depicts a hypothesized ice sheet configuration to explain the hypothesis presented in Young et al. (2020). Note that the LIS would dam a pro-glacial lake in the Lake Erie basin and overrun several moraine belts, including the Lake Escarpment Moraine. Radiocarbon, cosmogenic nuclide, and OSL ages discussed in the text are shown with approximate locations. Arrows indicate that study sites are off the map extent. Panels are as follows. LGM: Glover et al. (2011), Corbett et al. (2017), Stanford et al. (2020), and Balco et al. (2009, 2002); 17 ka: Fisher et al. (2015), Fritz et al. (1987), Kozlowski et al. (2018), and Ridge (2003); 15 ka: Calkin and McAndrews (1980); 13 ka: Lewis and Anderson (2019), Rayburn et al. (2007), Richard and Occhietti (2005), and Young et al. (2020). DEM from the US Geological Survey's Center for Earth Resources Observations and Science (https://creativecommons.org/licenses/by-nc/3.0/, last access: 8 March 2021).
To further constrain moraine ages in western New York and to test the Allerød re-advance hypothesis, we obtained 23 new macrofossil-based radiocarbon ages from five sediment cores collected on the Kent Moraine and 18 new macrofossil-based radiocarbon ages from two sediment cores on the Lake Escarpment Moraine. The Lake Escarpment Moraine is within the extent of the proposed re-advance, so if basal ages from sites on this moraine pre-date ∼ 13 ka and the subsequent stratigraphy shows no evidence of a re-advance, then the evidence would refute the Allerød re-advance hypothesis. Conversely, basal radiocarbon ages that post-date ∼ 13 ka and/or evidence that the sediment stratigraphy is interrupted at ∼ 13 ka would support an Allerød re-advance. Additionally, we obtained two optically stimulated luminescence (OSL) ages from kame delta sediments associated with deposition of the Kent Moraine to provide a more complete understanding of deglaciation. Our results provide new chronological constraints in the western New York data gap and do not support the ∼ 13 ka re-advance proposed by Young et al. (2020). Rather, our data support a model of initial moraine deposition followed by thousands of years before kettle basin formation and final moraine stabilization.
The Kent Moraine in western New York is correlated with the Kent Moraine in northwest Ohio, the Olean Moraine in Pennsylvania, the Harbor Hill Moraine in New Jersey, and the Martha's Vineyard Moraine in Massachusetts (Fig. 1; Balco et al., 2002; Fullerton, 1980; Muller and Calkin, 1993; Stanford et al., 2020). Retreat from the LGM moraine in these adjacent regions is dated to 19.8 ± 0.4 ka in Ohio (Glover et al., 2011), 25.2 ± 2.1 ka (Corbett et al., 2017) and 23 200–23 750 cal BP in New Jersey (Stanford et al., 2020), and 25.5 ± 0.4 ka in Massachusetts (Balco et al., 2009, 2002). Therefore, we infer that the Kent Moraine in western New York was likely deposited sometime between 25 and 20 ka.
The first major moraine belts deposited after the maximum LGM position were the Ashtabula Moraine in Ohio and northwest Pennsylvania, the Lake Escarpment Moraine in western New York, and Valley Heads moraines in central New York (Fig. 1; Fullerton, 1980; Muller and Calkin, 1993). During this ice position, Glacial Lake Maumee occupied the Lake Erie basin around 17 000–16 000 cal BP based on radiocarbon dating at the paleo-outlet and OSL dating of strand lines (Calkin and Feenstra, 1985; Eschman and Karrow, 1985; Fisher et al., 2015). Ridge (2003) tied the outer and inner Valley Heads moraines to the New England Varve Chronology, placing these moraines at 17 200 and 16 200 cal BP, respectively. Kozlowski et al. (2018) report basal ages of 14 300–14 900 and 14 200–14 850 cal BP from basins within the outer Valley Heads limit. These ages are younger than previous estimates, leading Kozlowski et al. (2018) to suggest the moraine may have been reoccupied. Fritz et al. (1987) report minimum-limiting radiocarbon ages of 13 750–15 250 cal BP from wood within lake deposits stratigraphically above outwash sands from Nichols Brook in western New York (Fig. 2). Muller and Calkin (1993) extrapolated their ages to estimate ∼ 17 600 cal BP for the emplacement of the outwash.
Figure 2Study sites in relation to previously published work. Black and gray lines are the same as in Fig. 1. Squares 1 and 2 depict hypothesized sites overrun by the Allerød re-advance at 13 ka (Young et al., 2020). Circles A–D are our sites on the Kent Moraine. Circles E and F are our sites on the Lake Escarpment Moraine. Squares 3–6 are Winter Gulf, Nichols Brook (Calkin and McAndrews, 1980), and Houghton and Protection Bog (Miller, 1973). The two black boxes show the extent of the maps in Fig. 3. Inset DEM is the same as Fig. 1. The 1 m bare-Earth DEM hillshade is from https://data.gis.ny.gov/, last access: 8 March 2021.
Following the deposition of the Lake Escarpment Moraine, Glacial Lakes Whittlesey and Warren occupied the Lake Erie basin between 16 and 14 ka (Fig. 1; Fullerton, 1980; Muller and Calkin, 1993). The lowering of Glacial Lake Whittlesey to Glacial Lake Warren is dated to 14 150–15 550 cal BP at Winter Gulf in western New York (Fig. 2; Calkin and McAndrews, 1980), and Warren strand lines in northwest Ohio have been dated to 14.2 ± 1.3 ka (Higley et al., 2014) and 14.1 ± 1.0 ka in Campbell et al. (2011). These proglacial lake chronologies provide unambiguous minimum age constraints of > 15 ka for the deposition of the Lake Escarpment Moraine.
The LIS continued its northward retreat and formed Glacial Lake Iroquois from 14.7 to 13.0 ka in the Lake Ontario basin (Fig. 1; Muller and Calkin, 1993; Muller and Prest, 1985; Teller, 2003). The switch of the Glacial Lake Iroquois spillway from the Mohawk River valley to the lower outlet at Covey Hill is constrained between 13 200 and 13 000 cal BP by numerous radiocarbon constraints from the pre- and post-flood histories of Lake Vermont and Lake Iroquois (Lewis and Anderson, 2019; Rayburn et al., 2007; Richard and Occhietti, 2005). Similarly, the formation of the Champlain Sea occurred between 13 100 and 12 700 cal BP, which post-dates the final draining of Glacial Lake Iroquois and requires an ice margin north of the Lake Ontario outlet (Cronin et al., 2012; Rayburn et al., 2011). Collectively, this ice recession chronology is at odds with the Allerød re-advance hypothesis, with its LIS advance across the Lake Ontario basin and to near the terminal moraine in western New York ∼ 13 ka (Fig. 1; Young et al., 2020).
3.1 Sediment cores
Our primary approach for constraining the timing of deglaciation and testing the Allerød re-advance hypothesis was obtaining basal sediment ages from kettles within the Kent and Lake Escarpment moraines. Newly available light detection and ranging (lidar)-based bare-Earth 1 m digital elevation models (DEMs) enabled us to identify natural kettle basins (Fig. 3). Typically, moraines in western New York have both single ridges where the ice sheet abutted higher topography and hummocky moraine belts that contain numerous kettle basins. Kame deltas exist in places where the ice sheet dammed adjacent river valleys. The hummocky nature of most moraines indicates that the moraines were ice-rich when deposited (Fig. 3).
Figure 3Site maps of the sediment core locations. 1 m bare-Earth DEM hillshade from https://data.gis.ny.gov/ (last access: 8 March 2021) with the Kent (black) and Lake Escarpment (gray) moraines. Open yellow circles depict study site location and yellow lines associate each site location with a site map. Figure 4 contains the site map for the open yellow circle with no associated site map. The filled circles indicate the type of coring device used in each site and the coring location. The filled yellow circles depict where we used a Livingstone. The filled red circles depict where we used a Russian peat corer. The filled semi-circles indicate where we used a Livingstone or Russian peat corer in the soft sediment infill and then used the GeoProbe in the stiff minerogenic sediment.
We collected sediment cores from kettles that presently range from bogs to wetlands. We cored five sites on the Kent Moraine referred to as the Vincent-1 (core name: 20VIN1), Vincent-3 (20VIN3), Vincent-4 (20VIN4), Songster (21SONG1), and Allenberg (15ABB7) sites (Table 1, Fig. 3), as well as two sites on the Lake Escarpment Moraine referred to as the Little Protection (21LPB1) and Dragonfly (13DFK1) sites (Table 1, Fig. 3). All sites are within hummocky moraine.
Table 1Site location, core lengths, and ownership.
DD: decimal degrees, a.s.l.: above sea level, b.g.: belowground
We determined basin depocenters using thin steel rods to measure the depth of the organic sediment infill. In the depocenter, we used Livingstone- and Russian-peat-style corers to collect organic-rich sediment infill and a manual percussion GeoProbe system to collect the underlying stiff, minerogenic sediments. From some sites, our sediment cores extended from the present surface to mineral-rich sediments below the organic-sediment infill; from others, our sediment cores began and ended at depth, spanning the organic-to-mineral sediment contact and downward until we penetrated coarse deposits (Table 1). We returned and cored the Vincent-1 and Vincent-4 sites multiple times to collect the entire sequence.
We split, imaged, and generated downcore data on all sediment cores at the University at Buffalo. We measured magnetic susceptibility in contiguous 1 cm intervals using a Bartington MS2E high-resolution surface scanning sensor scanner connected to a Bartington MS2 magnetic susceptibility meter to assess the minerogenic content. We calculated loss-on-ignition (LOI) percent by burning ∼ 1 cm3 of sediment in a Thermolyne muffle furnace at successively higher temperatures for water (105 °C), organic carbon (550 °C), and carbonate (950 °C) content to help characterize the sediment units and depositional setting (Heiri et al., 2001; Last and Smol, 2001). To calculate composite core length, we spliced together overlapping sediment sections using visual lithologic changes and magnetic susceptibility measurements. We volumetrically sampled portions of the Little Protection sediment cores to determine sediment bulk density; these data are used to check for overcompaction during an Allerød re-advance. The data are only from Little Protection because Dragonfly data creation took place prior to Young et al. (2020) and we did not measure bulk density.
We use radiocarbon dating of macrofossils for age control (Table 2). The sediments are organic-rich in the upper portions of the cores and organic-poor in the lower sections. Where available, we picked full-plant macrofossils. We picked macrofossils that were from the center of the sediment core and demonstrably in situ. In macrofossil-devoid sections, we wet-sieved sediment with deionized water to isolate and combine the largest macrofossil fragments for dating. We attempted to identify macrofossils, but some macrofossil fragments were small and unidentifiable (Table 2). We rinsed samples with deionized water, freeze-dried them, and sent them to the National Ocean Sciences Accelerator Mass Spectrometry (NOSAMS) lab or the Keck Lab at the University of California Irvine (KCCAMS) for radiocarbon analysis. The facilities conducted acid–base–acid (ABA) pretreatments, converted samples to graphite, and ran them on the AMS (Elder et al., 2019; Olsson, 1986; Pearson et al., 1997; Shah Walter et al., 2015; Vogel et al., 1984).
Table 2Radiocarbon dates for each study site. Listed by depth.
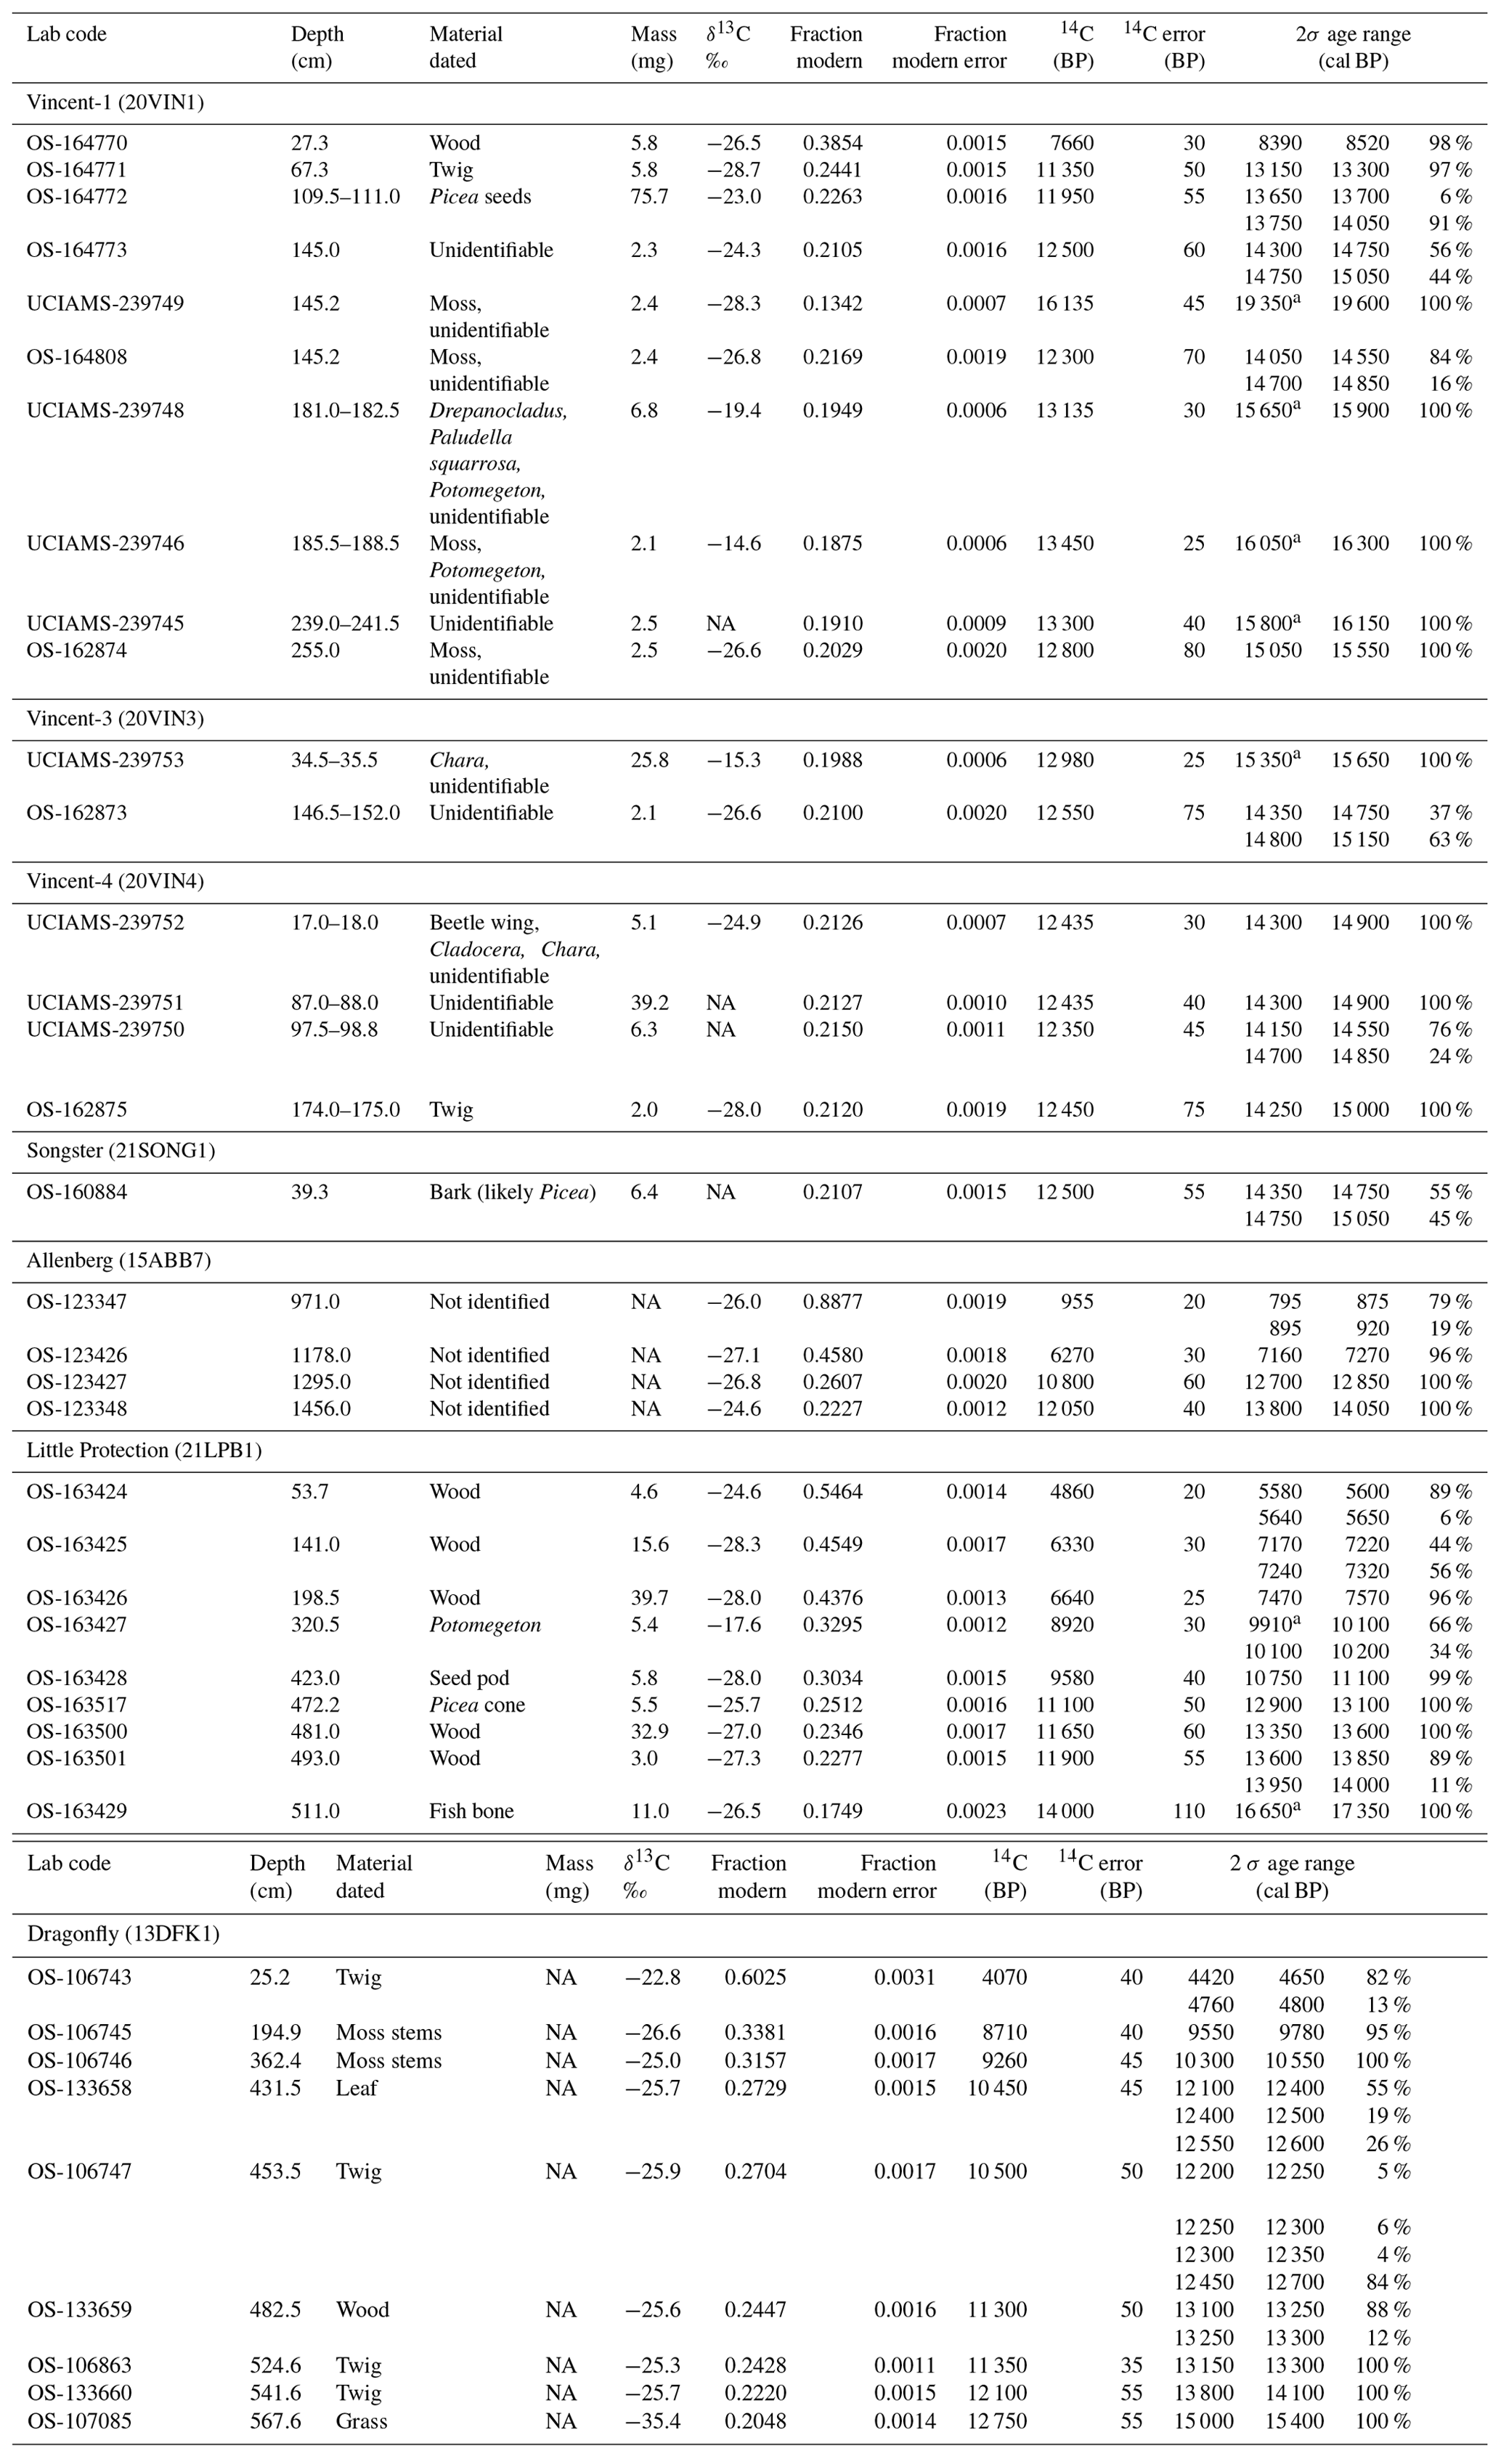
a Samples not used in the discussion due to possible hard-water effect. NA: not available. NA δ13C: Either the sample was too small or the measurement was not requested. NA mass: not recorded
In Table 2, we report the 2σ age range and round ages according to Stuiver and Polach (1977). We calibrated all the radiocarbon results using Calib8.1 with the IntCal20 dataset (Reimer et al., 2020; Stuiver and Reimer, 1993). All radiocarbon ages in the text were recalibrated with IntCal20. δ13C measurements were measured on a split of the CO2 gas generated from each sample on an isotope-ratio mass spectrometer. Uncertainties in the δ13C from both labs are < 0.1 ‰. We report δ13C values as ‰ VPDB.
3.2 Optically stimulated luminescence dating
We collected sediment samples for OSL dating from topset beds within an ice-contact delta deposit associated with the Kent Moraine to determine when the LIS was present at this location (Figs. 3 and 4). Our sample location was Corbett Hill Gravel Quarry, an active aggregate quarry that exposes large sedimentary sequences indicative of a proglacial delta. The sediments consisted of cobble-rich foreset beds overlain by ∼ 3 m of near-horizontal topset beds. We collected sand samples for OSL dating from the topset sequence ∼ 2.1 m below the delta surface. We created a fresh exposure of the topset beds with an excavator, exposing alternating layers of gravels and coarse sands, with lenses of medium to fine sand and silt. We collected two samples for OSL dating in fine-sand lenses in 5.1 × 25.4 cm (2 × 10 inch) aluminum tubes after clearing back outer sediments (Fig. 4). Samples for water content and dose rate determination were collected from surrounding sediments.
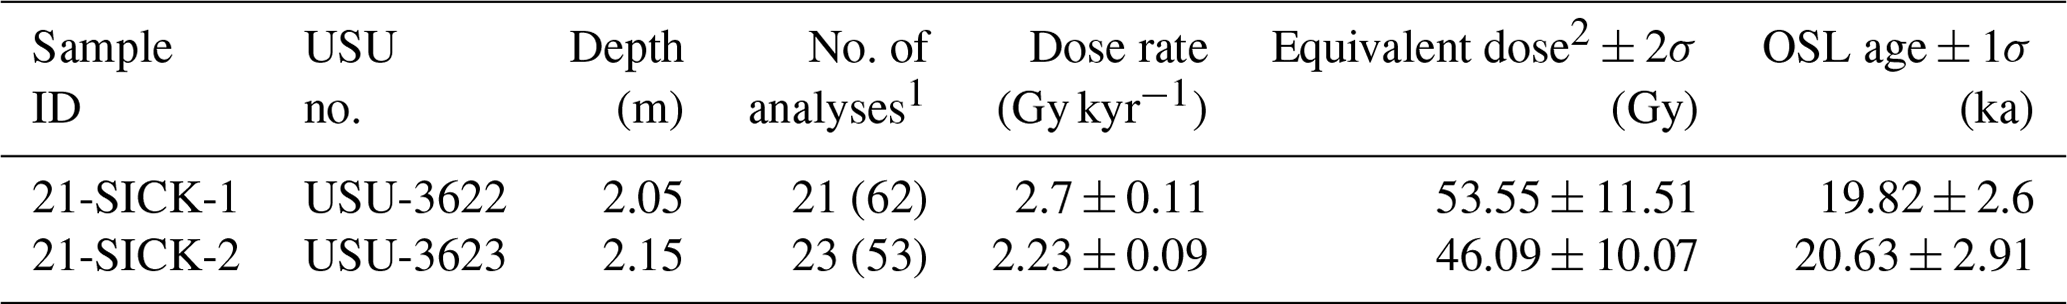
We processed the samples at the Utah State University Luminescence Laboratory for small-aliquot OSL dating of fine-grained quartz sand (Tables 3, S1 in the Supplement). First, we purified samples to 150–250 µm quartz sand using wet sieving and chemical treatment with 10 % hydrochloric acid to remove carbonates, 5 % peroxide to remove organics, 2.72 g cm−3 sodium polytungstate to remove heavy minerals, and 48 % hydrofluoric acid to remove feldspars and etch the quartz grains. We analyzed small aliquots of quartz (0.4 to 1 mm diameter of sand mounted on disk, ∼ 10–20 grains) on Risø DA-20 readers using the single-aliquot regenerative-dose (SAR) protocol (Murray and Wintle, 2000). We analyzed 42 aliquots for sample 21SICK-01 and 37 for sample 21SICK-02, of which we used 21 and 23 aliquots for age calculations, respectively (Figs. 4 and S7). Aliquots were rejected from age calculation if they showed signal depletion with infrared stimulation indicating feldspar contamination (0–12 aliquots), poor recycling of a repeat point (greater than 80 % difference between repeat points, 7–8 aliquots), high recuperation of a zero-dose point (> 10 % of the natural signal, 0–6 aliquots), extrapolation of the equivalent dose beyond the dose-response curve (0–2 aliquots), or poor dose-response curve fit (0–3 of aliquots). We applied a minimum age model (MAM) to the samples to calculate our equivalent does (DE; unit: gray, Gy; Figs. 4 and S7), as used by similar studies on LIS glaciofluvial terraces elsewhere in the northern United States (Rittenour et al., 2015). MAMs are useful in these glaciofluvial environments because of the increased potential for incomplete bleaching from subglacial or turbid-water sediment transport.
We determined the dose rate for OSL age calculation based on U, Th, K, and Rb concentrations from the surrounding sediments using inductively coupled plasma mass spectrometry and atomic emission spectrometry. Using the conversion factors of Guérin et al. (2011), we converted elemental concentrations to dose rate. The contribution of cosmic radiation was based on sample depth, elevation, and latitude following Prescott and Hutton (1994). We also determined water content by measuring the mass of the samples before and after desiccation. With these three factors, we were able to calculate environmental dose rates (Gy kyr−1). Our reported OSL ages are simply the DE (determined with the MAM) divided by the dose rate with 1σ standard error (Table 3). We report ages with 1σ uncertainty (Table 3).
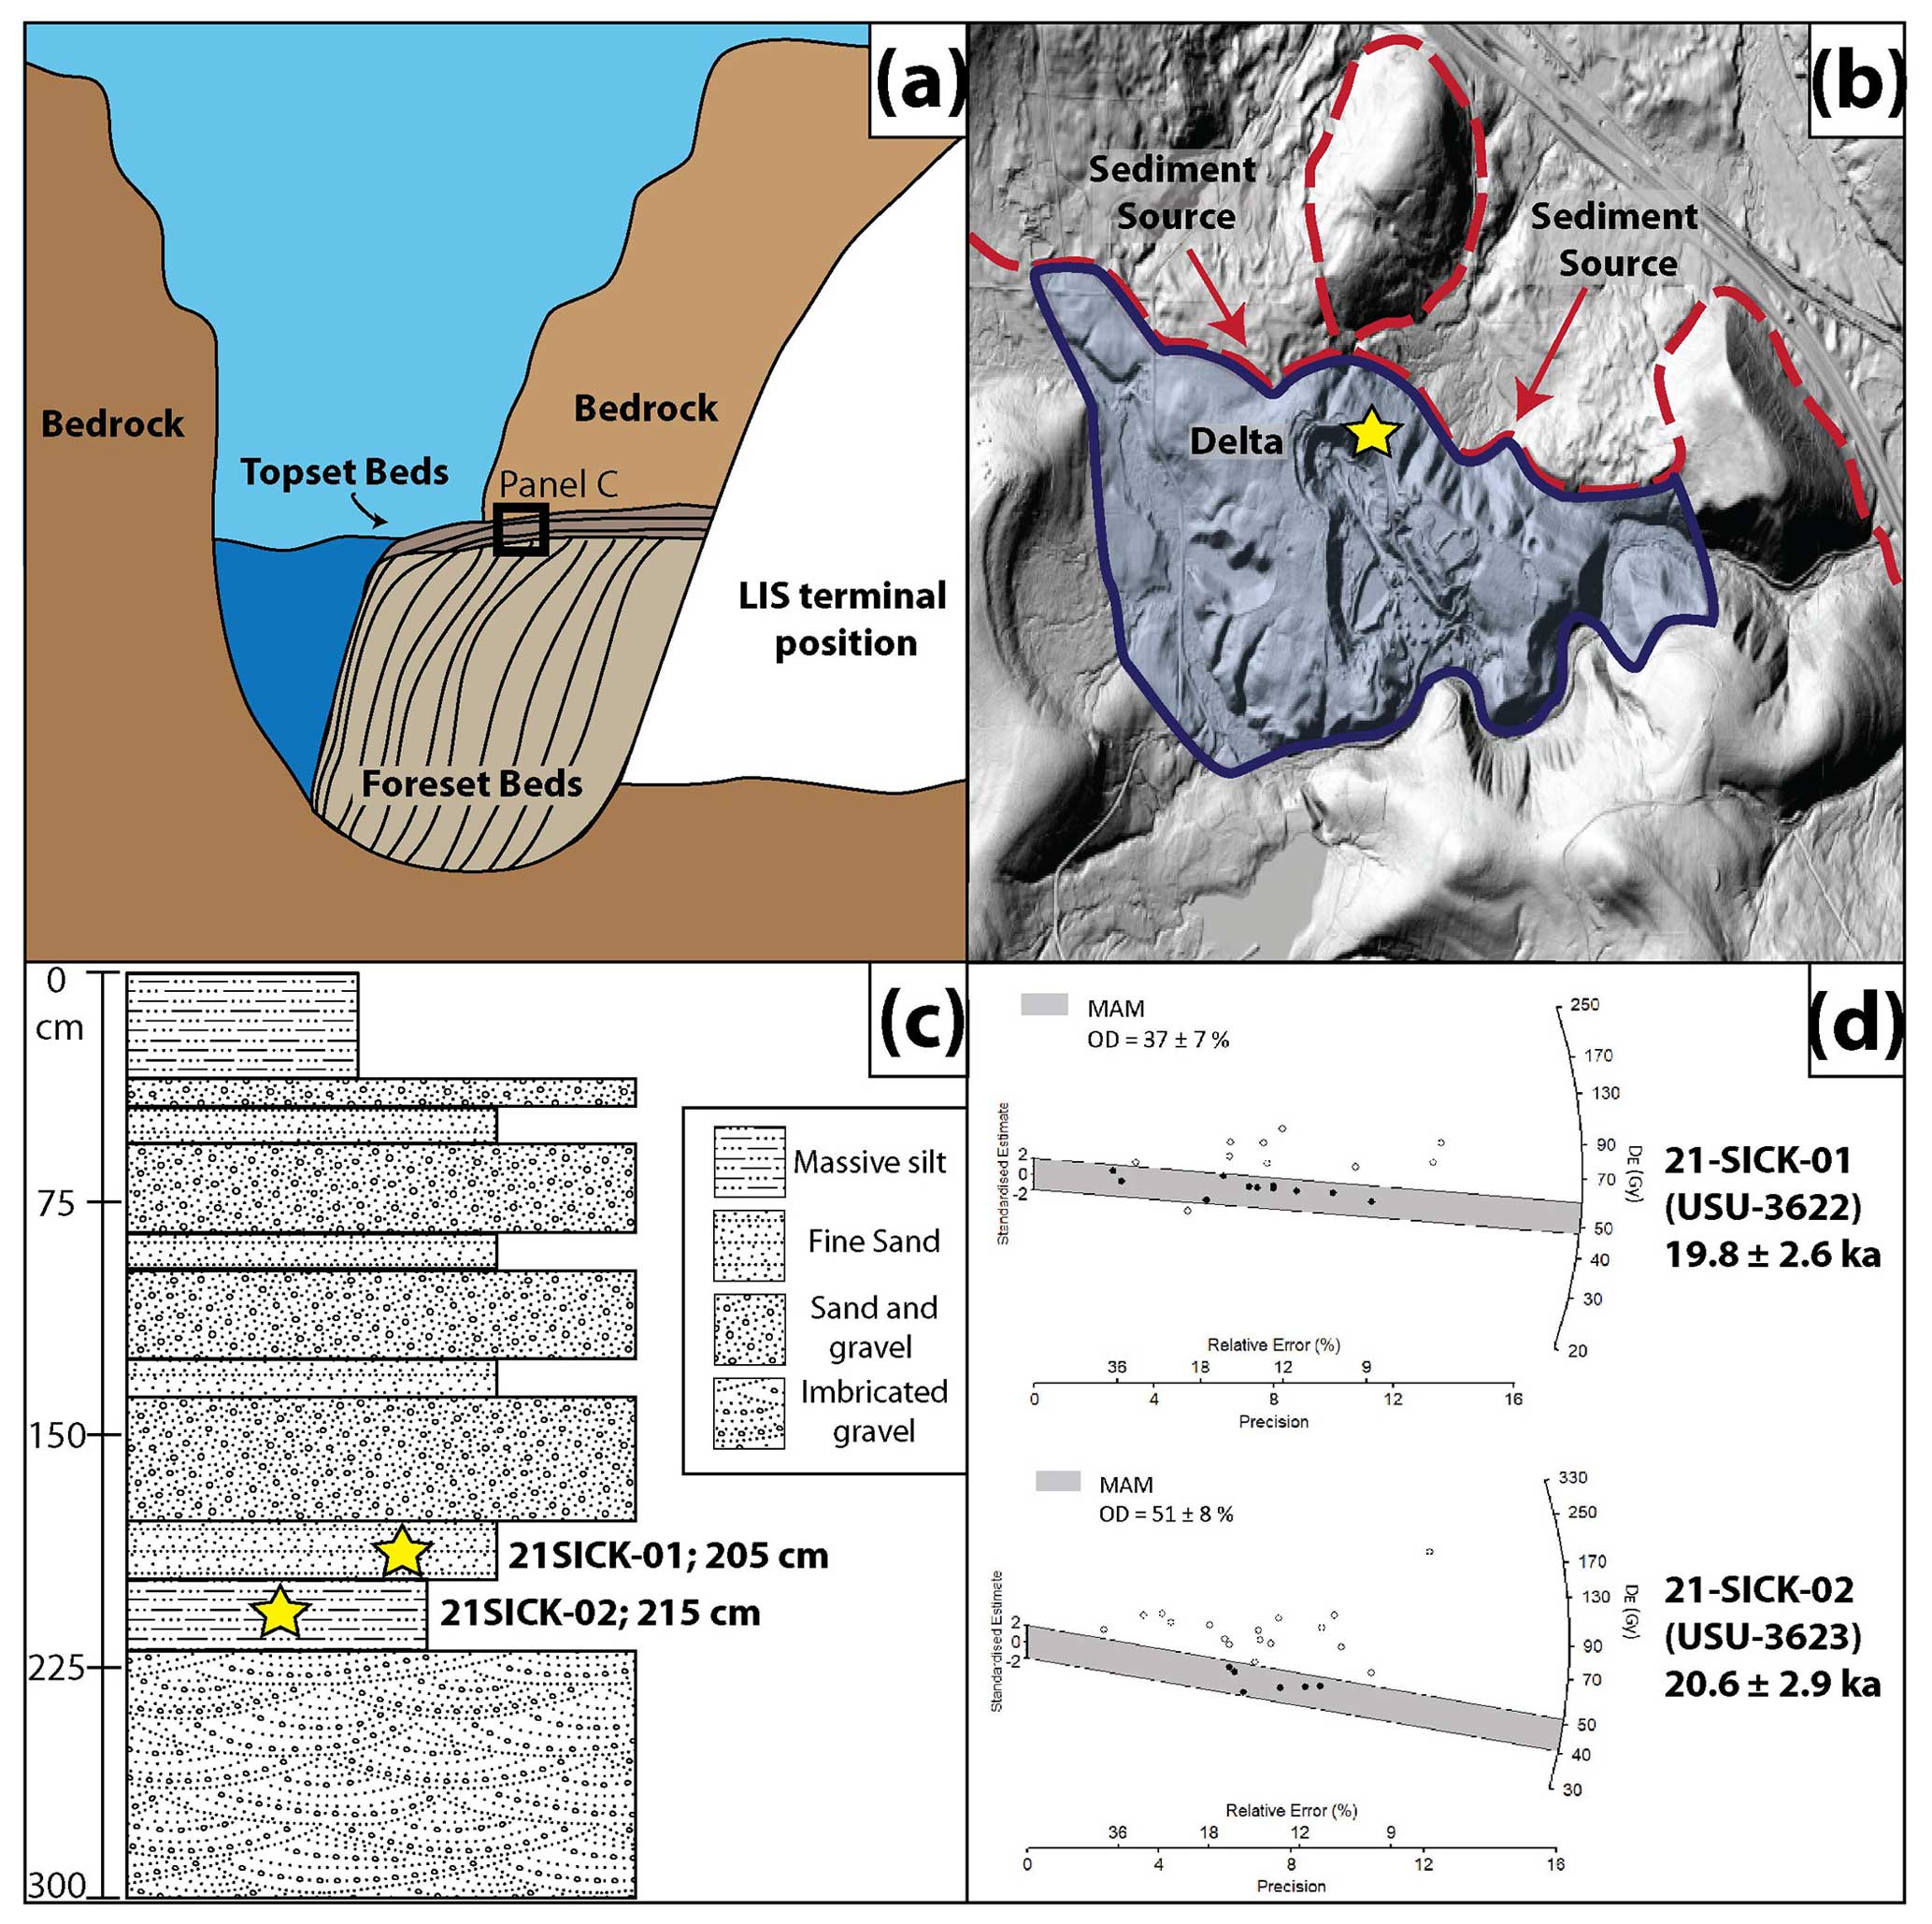
Figure 4Panel (a) is a schematic of the kame delta creation. The LIS dammed a lake and deposited the delta outboard of the Kent Moraine. Panel (b) is a 1 m DEM hillshade from https://data.gis.ny.gov/ (last access: 8 March 2021) showing the kame delta outboard of the Kent Moraine (within the open yellow circle in Fig. 3). The dashed red line depicts the extent of the Kent Moraine. Red arrows depict the sediment source for the delta. The blue line and shading depict the delta deposit. The yellow star on the side of the active quarry shows our sampling site. Panel (c) shows a stratigraphic column of the topset beds. We use the FGDC Digital Cartographic Standard for Geologic Map Symbolization (US Geological Survey, 2006). Yellow stars show our sampling location. (d) Equivalent dose (DE) distributions for the luminescence samples collected from the kame delta associated with an ice margin position near the Kent Moraine. MAM: minimum age model of Galbraith and Roberts (2012) fit to the DE data (gray shaded region). OD is overdispersion, a metric of DE scatter beyond instrumental error, where OD > 30 % is interpreted to be due to partial bleaching due to incomplete solar resetting of the luminescence signals in the quartz grains.
Table 3Optically stimulated luminescence age information.
1 Age analysis using the single-aliquot regenerative-dose procedure of Murray and Wintle (2000) on 0.4–1 mm small aliquots (SA) of quartz sand (150–250 µm). Number of aliquots used in the age calculation and number of aliquots in parentheses. 2 Equivalent dose (DE) calculated using the minimum age model (MAM) of Galbraith and Roberts (2012).
4.1 Stratigraphy and radiocarbon results
4.1.1 Vincent-1 (Kent Moraine)
The bottom 2.5 m is a gray massive pebbly diamicton with a silty matrix that we call Unit 1. We only recovered Unit 1 at this study site and collected it with the GeoProbe system (Fig. 5). There is a sharp contact with layered gray sand and silt that grades to alternating massive brown and gray silt with sparse macrofossils. We call this Unit 2. There is a sharp contact with massive dark brown organic-rich silt that we call Lower Unit 3. In the initial sediments of Lower Unit 3, there are three layers of gray silt and an inclusion of gray clay that are identical to the sediment of Unit 2. There is a sharp contact with peat which continues to the top of the core that we call Upper Unit 3. Broadly, this sediment progression is found in the other six sediment cores from both moraines, so we use Unit 2 and 3 terminologies for them as well. Figure 5a and b depict the downcore data. For all seven sediment cores, magnetic susceptibility values are higher in Unit 2 than Unit 3; water and organic carbon content values are lowest in Unit 2, rise in Lower Unit 3, and are highest in Upper Unit 3; and calcium carbonate remains below 8 % in all sediment cores so it is not plotted in Fig. 5.
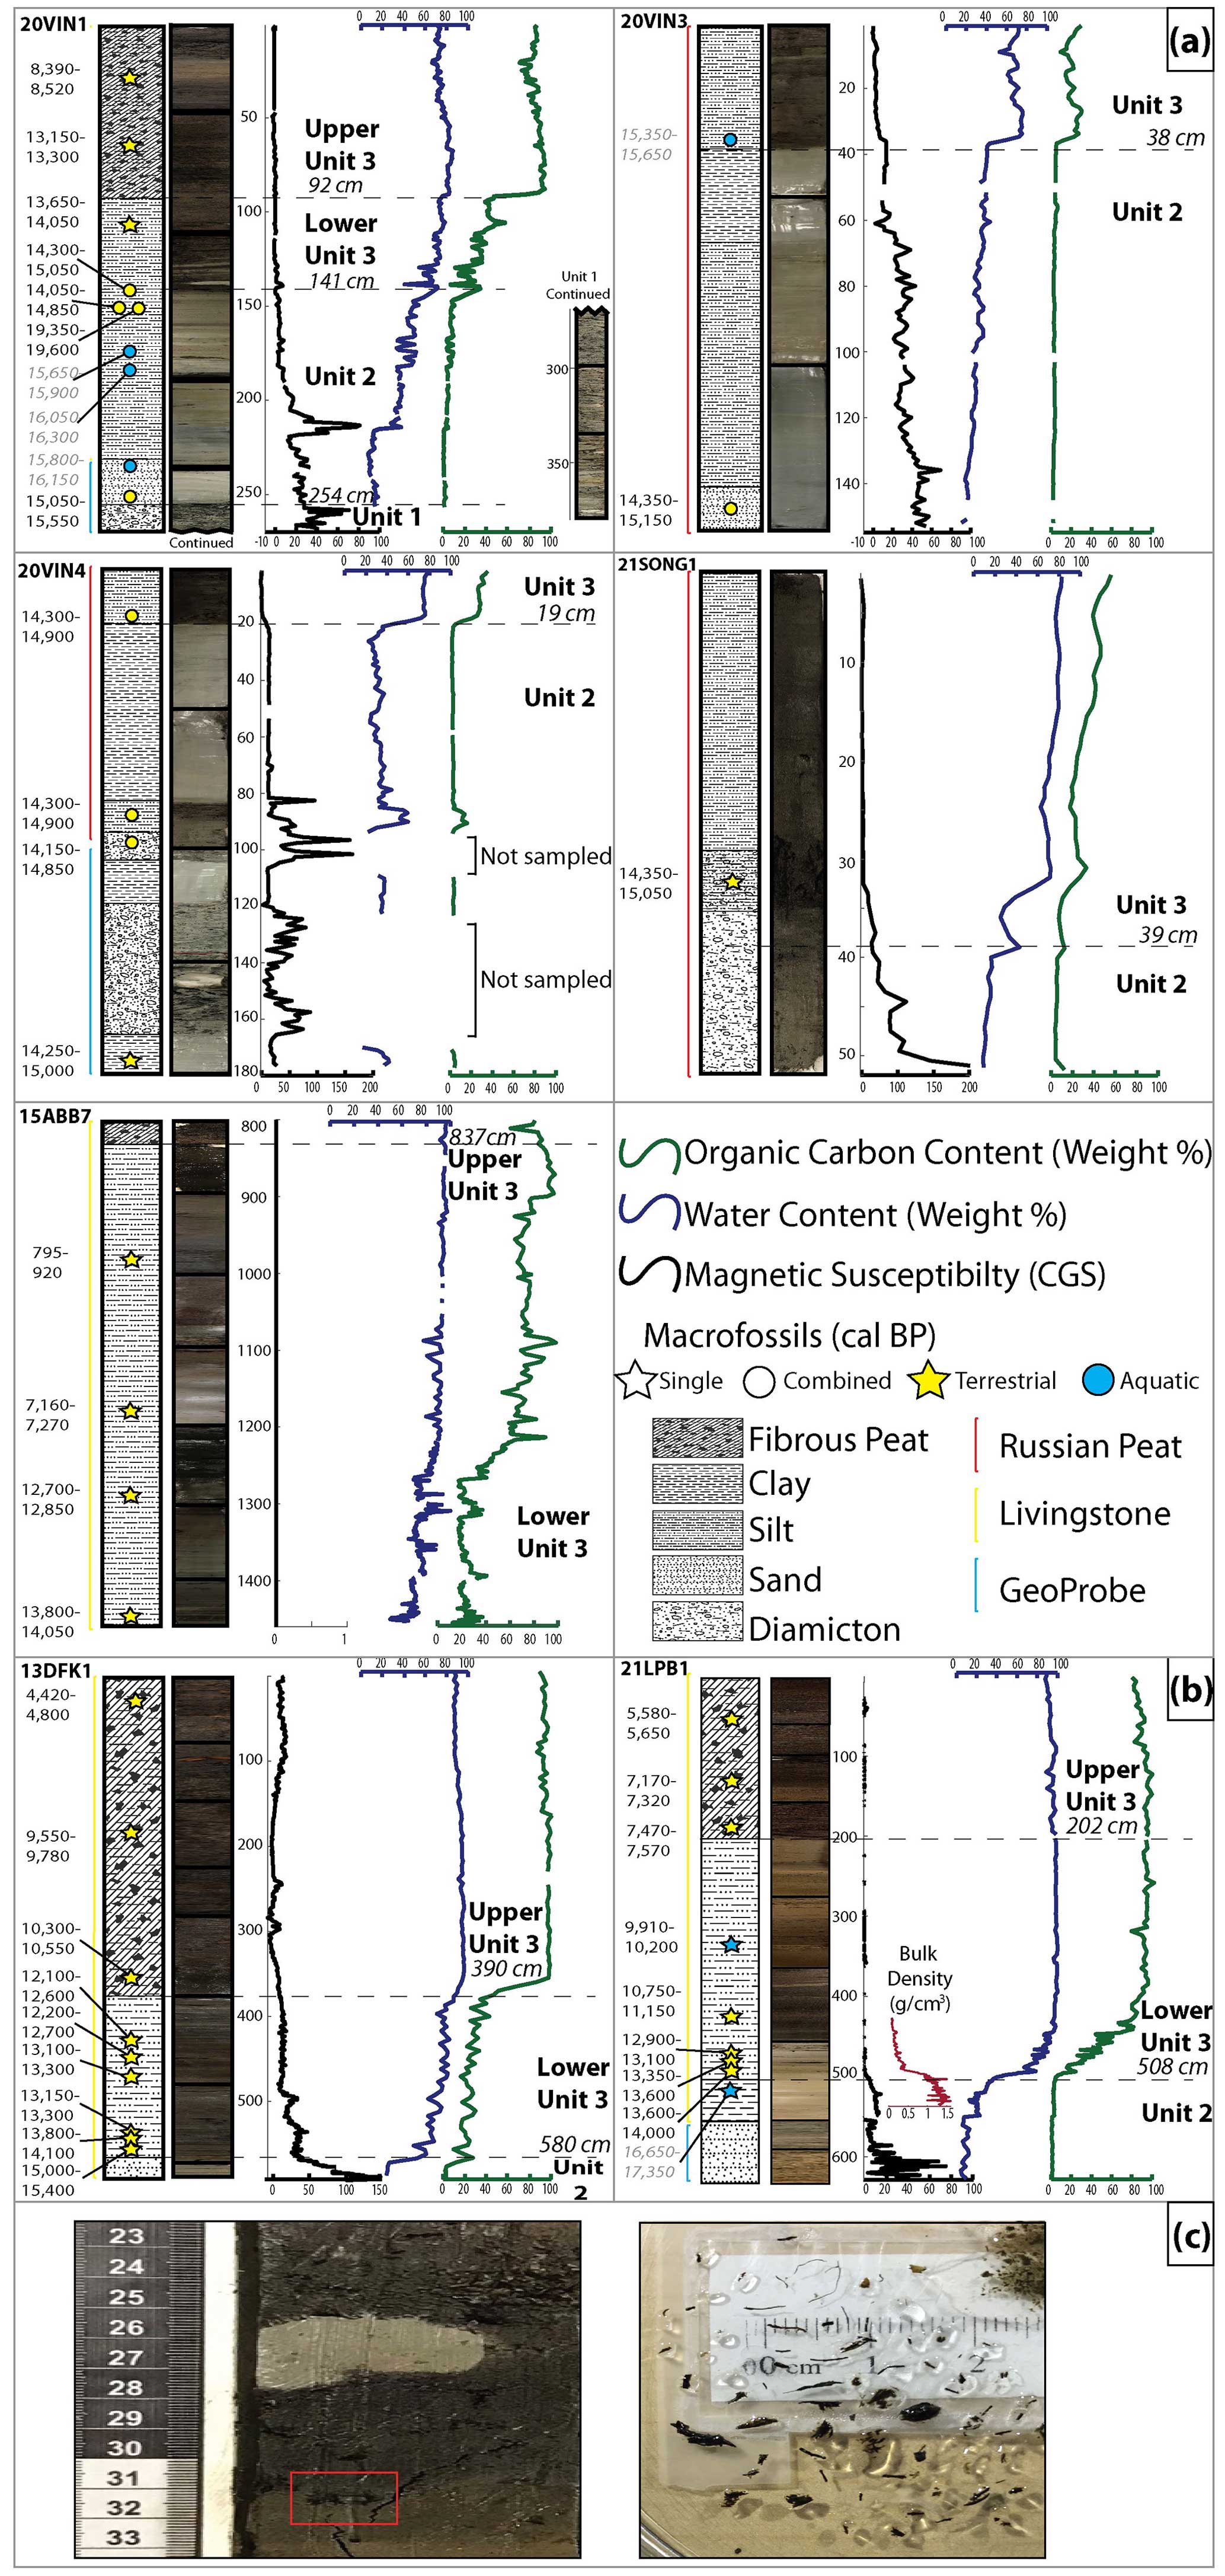
Figure 5Panel (a) has the sediment core stratigraphy from the Kent Moraine sites, and panel (b) has the sediment core stratigraphy from the Lake Escarpment Moraine sites. We show sediment texture next to the core images using the FGDC Digital Cartographic Standard for Geologic Map Symbolization (US Geological Survey, 2006). We plot magnetic susceptibility (CGS; black line), water content (weight %; blue line), and organic content (weight %, green line) by composite depth (cm). The colored line next to the stratigraphic column depicts if we used the Russian peat corer (red), Livingstone corer (yellow), or GeoProbe (blue). Stars indicate single macrofossils and circles indicate when we combined macrofossils. The yellow filling indicates the sample is terrestrial, and blue indicates the sample has aquatic macrofossils within it. Radiocarbon ages are presented as the full 2σ range in cal BP. We used gray text and italics for radiocarbon ages we suspect have hard-water contamination. Panel (c) is a close-up image of the inferred gray clay and macrofossil-rich rip-up clasts in the transition from Unit 2 to 3 in 20VIN1 (shown in red box). The black box has post-sieve macrofossils from the rip-up clast in the red box.
Figures 5 and S1 in the Supplement show the 10 radiocarbon ages from 20VIN1. The seven ages in Unit 2 are from combined macrofossils and have little stratigraphic order. The three ages in Unit 3, from single macrofossils, are in stratigraphic order. 20VIN1 has an age of 15 050–15 550 cal BP from the bottom of Unit 2, yet it is stratigraphically below older ages from Unit 2 of 15 650–15 900, 15 800–16 150, and 16 050–16 300 cal BP. There is an inclusion of macrofossils at the Unit 2–3 contact that was dated twice and yields two radiocarbon ages from combined macrofossils of 19 350–19 600 and 14 050–14 850 cal BP; combined macrofossils from the surrounding sediment produce an age of 14 300–15 050 cal BP. Picea seeds from the top of Lower Unit 3 are 13 650–14 050 cal BP. There are two ages in the Upper Unit 3: a twig that dates to 13 150–13 300 and wood that dates to 8390–8520 cal BP.
4.1.2 Vincent-3 (Kent Moraine)
In 20VIN3, Unit 2 begins as gray silt, transitions to a light brown silt, and is topped by gray clay. The contact with Unit 3 is sharp. Unit 3 is massive organic-rich silt. There is a layer of gray silt in the base of Unit 3. There are two radiocarbon ages from 20VIN3 (Figs. 5; S2). The one age in Unit 2 is from combined macrofossils that date to 14 350–15 150 cal BP. The one age at the base of Unit 3 is from combined macrofossils and dates to 15 350–15 650 cal BP.
4.1.3 Vincent-4 (Kent Moraine)
In 20VIN4, Unit 2 contains alternating layers of pebbly diamicton (with some clasts up to 5 cm long) and silty clay. The contacts between the layers are sharp and one is undulating. Unit 3 is a massive organic-rich silt. There are four radiocarbon ages from Unit 2 (Figs. 5; S3). The lowest age is from a piece of wood that dates to 14 250–15 000 cal BP. Then the next three ages are from combined macrofossils and date to 14 150–14 850, 14 300–14 900, and 14 300–14 900 cal BP.
4.1.4 Songster (Kent Moraine)
In 21SONG1, Unit 2 is silty clay with pebbles. The contact with Unit 3 is sharp. Unit 3 begins with organic-rich silt with some sand and pebbles. Large macrofossils are common. This grades into organic-rich silt. One radiocarbon age from a piece of wood in the bottom of Unit 3 dates to 14 350–15 050 cal BP (Fig. 5).
4.1.5 Allenberg (Kent Moraine)
In 15ABB7, we did not collect Unit 2. Lower Unit 3 is an organic-rich silt and Upper Unit 3 is peat. There are four ages from Unit 3 (Figs. 5; S4). These samples were not identified at the time of dating. The lowest age is 13 800–14 050 cal BP. The next three ages are in stratigraphic order and range from 12 700–12 850 to 795–920 cal BP.
4.1.6 Little Protection (Lake Escarpment Moraine)
In 21LPB1, Unit 2 begins with 2 cm of gray silty gravel before a sharp contact with massive, oxidized sand and gravel. Above this is a sharp transition to alternating layers of gray silt, silty gravel, and sand; these layers have sharp and sometimes undulating contacts. That is overlain by massive gray clay. The contact with Unit 3 is gradual over 3 cm. Lower Unit 3 is an organic-rich silt and Upper Unit 3 is peat. There is one radiocarbon age from Unit 2 on a fish bone that dates to 16 650–17 350 cal BP. There are eight radiocarbon ages from Unit 3 (Figs. 5; S6). The lowest age is from a piece of wood that dates to 13 600–14 000 cal BP. The next seven are in stratigraphic order and range from 13 350–13 600 to 5580–5650 cal BP. To address the Allerød re-advance hypothesis and seek evidence of whether the coring sites were overridden, we measured dry bulk density at 1 cm resolution through the time interval of hypothesized re-advance. The bulk density decreases from 1.55 to 0.42 g cm−3 in the transition from Unit 2 to 3. (Fig. 5) The density decreases due to the transition from minerogenic silt to organic-rich silt and remains below 0.42 g cm−3 into Unit 3.
4.1.7 Dragonfly (Lake Escarpment Moraine)
In 13DFK1, Unit 2 is gray silt. The contact with Unit 3 is sharp. Lower Unit 3 is an organic-rich silt and Upper Unit 3 is peat. There are nine radiocarbon ages from Unit 3 (Figs. 5; S5). The lowest age is from grass and dates to 15 000–15 400 cal BP. The next eight radiocarbon ages are in stratigraphic order and range from 13 800–14 000 to 4420–4800 cal BP.
4.2 Optically stimulated luminescence dating
Our small-aliquot De results from both 21SICK-01 and 21SICK-02 show evidence of partial bleaching, as expected in a glaciofluvial environment (Table 3; Figs. 4 and S7; Rittenour et al., 2015). De results from the two samples are considerably scattered, are positively skewed, and have overdispersion values between ∼ 30 % and ∼ 60 %; all are indicative of incomplete bleaching and justify the use of the MAM (e.g., Olley et al., 1999). Our two OSL MAM ages are 19.8 ± 2.6 and 20.6 ± 2.9 ka. The two samples are from within 10 cm of each other and yield statistically indistinguishable ages.
5.1 Stratigraphy
We interpret Unit 1 as the primary till that comprises the Kent Moraine. At the Vincent-1 (20VIN1) site we cored from 4.1 to 6.6 m below the wetland surface (2.5 m) but only recovered 1.2 m due to compaction with the GeoProbe system. We assume we reached below the post-glacial infill and into the primary glacial deposit since this unit spans 2.5 m and we found no changes in stratigraphy (Fig. 5).
Given the hummocky nature of the moraines (Fig. 3), the complex stratigraphy within Unit 2 (Fig. 5), and the similarity in Unit 2 from all sediment cores, we interpret this unit to record the transition from an ice-cored moraine to the modern kettled topography for both moraines. The most striking features of Unit 2 are the numerous transitions between fine- and coarse-grained deposition. We interpret Unit 2 silt and clay as being settled out of suspension in lacustrine conditions, indicating that all seven basins likely held small kettle lakes of shifting dimension during this period. We propose that the alternating clay and diamicton sediments captured in 20VIN4, on the Kent Moraine, are slumps of primary till into the kettle lake with otherwise clay-rich sedimentation; these slumps potentially occurred as buried glacial ice melted and destabilized the basin's slopes. The stratigraphy of Unit 2 in 21LPB1, on the Lake Escarpment Moraine, is likely the result of similar processes.
The transition in sediment type between Units 2 and 3 likely reflects a shift to more vegetation growing in the lake and landscape, in concert with increased stabilization of the surrounding moraine. We infer that the minerogenic sediments in the transition zone (inclusions of gray clay and brown silty macrofossils in 20VIN1) are rip-up clasts by their clast-like appearance and stark contrast to the surrounding sediment (Fig. 5c). They were potentially frozen during the time of deposition. This suggests the presence of reworked material near the Unit 2–3 transition. The subsequent transition from lacustrine organic-rich silt to peat (Lower and Upper Unit 3, respectively) records the shift from lake to bog–wetland due to the filling of the basin, shallowing of the lake, and encroachment of the shoreline.
5.2 Chronology
The OSL samples are from 2 m below the surface of the ∼ 70 m thick kame delta. The sample location within the topset beds of a short-lived ice-contact delta suggests that our OSL samples constrain the time just before the ice sheet retreated and ceased building the delta at 19.8 ± 2.6–20.6 ± 2.9 ka. The OSL ages support the estimated age of 25–20 ka for the Kent Moraine from prior literature and affirm our confidence in the age assignments using correlations of dated features elsewhere (Balco et al., 2009, 2002; Corbett et al., 2017; Glover et al., 2011; Stanford et al., 2020).
We have identified spores and seeds of aquatic plants Chara and Potamogeton (Ole Bennike, personal communication, 2022) among the macrofossils from samples dating to 15 800–16 150, 16 050–16 300, and 15 650–15 900 cal BP from 20VIN1 and the sample dating to 15 350–16 650 cal BP from 20VIN3. These macrofossil samples also have enriched δ13C values, suggesting they contained aquatic material (except 15 800–16 150, which was too small for a δ13C measurement; Deuser and Degens, 1967; Oana and Deevey, 1960; Wang and Wooller, 2006). Our sites lie within calcareous tills that overlie sedimentary bedrock (LaFleur, 1979; MacClintock and Apfel, 1944), which can add aged carbon to the lake water. Aquatic plants derive their carbon from lake water, so radiocarbon ages from aquatic plants could produce radiocarbon ages that overestimate the age of the material (the “hard-water effect”; Deevey et al., 1954; Keeley and Sandquist, 1992). The lowest sample in 21LPB1 is from a fish bone (16 650–17 350 cal BP); a fish could be susceptible to the same hard-water effect as aquatic vegetation, and thus we do not use it in our evaluation. We move forward using samples assumed to be terrestrial from a lack of identifiable aquatic macrofossils and supported by δ13C values.
The Unit 2 ages are trustworthy as minimum-limiting constraints on moraine abandonment, but we find that the evidence for slumps and rip-up clasts in Unit 2, plus the stratigraphic discordance in radiocarbon ages, is a reason to doubt the reliability of the radiocarbon ages to reflect the age of the sediment they are within. Our oldest minimum-limiting constraint from Unit 2 is from the macrofossil-rich rip-up clast in 20VIN1 on the Kent Moraine, which holds evidence for two important interpretations: (1) the landscape was ice-free and at least sparsely vegetated as early as 19 350–19 600 cal BP, consistent with our OSL ages suggesting ice sheet retreat by 19.8 ± 2.6–20.6 ± 2.9 ka, and (2) the landscape stored this long-dead vegetation for thousands of years before it was re-deposited. This age also bolsters our confidence that the MAM is working well in our study area.
We use the lowest ages in Unit 3 as minimum limits on the timing of kettle formation and moraine stabilization. The lowest ages from Unit 3 from the Kent Moraine range from 13 650–14 050 (20VIN1) to 14 350–15 050 (21SONG1) cal BP. The lowest ages from Unit 3 from the Lake Escarpment Moraine are 13 600–14 000 (21LPB1) to 15 000–15 400 (13DFK1) cal BP. The range of ages shows that the kettles formed through the interval of 13 600 to 15 400 cal BP, reflecting the time the moraines stabilized. This shows that both moraines stabilized at the same time, even though they are likely several thousand years apart in age. Using our OSL ages and minimum-limiting radiocarbon age from Unit 2 to estimate the deposition of the Kent Moraine before 19 350–19 600 cal BP, there appears to be a 5 kyr lag time between moraine deposition and stabilization.
5.3 A model for kettle basin formation
We propose the following post-glacial history in western New York (Fig. 6). The deposition of the Kent Moraine occurred at 19.8 ± 2.6–20.6 ± 2.9 ka and the landform remained ice-cored for the ensuing 5–6 kyr. The deposition of the Lake Escarpment Moraine took place around 17 ka and likewise remained ice-cored for the next 2–3 kyr. The hummocky nature of the moraines indicates that they were ice-cored, and we suggest that persistent buried glacial ice prohibited stabilization until well after deposition. Our interpretation is that after ∼ 15 ka buried ice began to melt, and moraine topography – including kettle basins – began to evolve more rapidly (Figs. 6 and 7). During the earliest stages of kettle basin formation, there was increased mobilization of sediments from within the uneven ice-rich topography. These initial sediments contained both reworked and contemporary organic matter from the catchment and were deposited in our study sites as Unit 2. According to this interpretation, our radiocarbon ages from Unit 2 could reflect plant death anytime between moraine deposition and kettle basin stabilization. The 13 750–15 250 cal BP wood age from basal lake sediments in Nichols Brook is likely another example of delayed kettle formation in this area (Fritz et al., 1987).
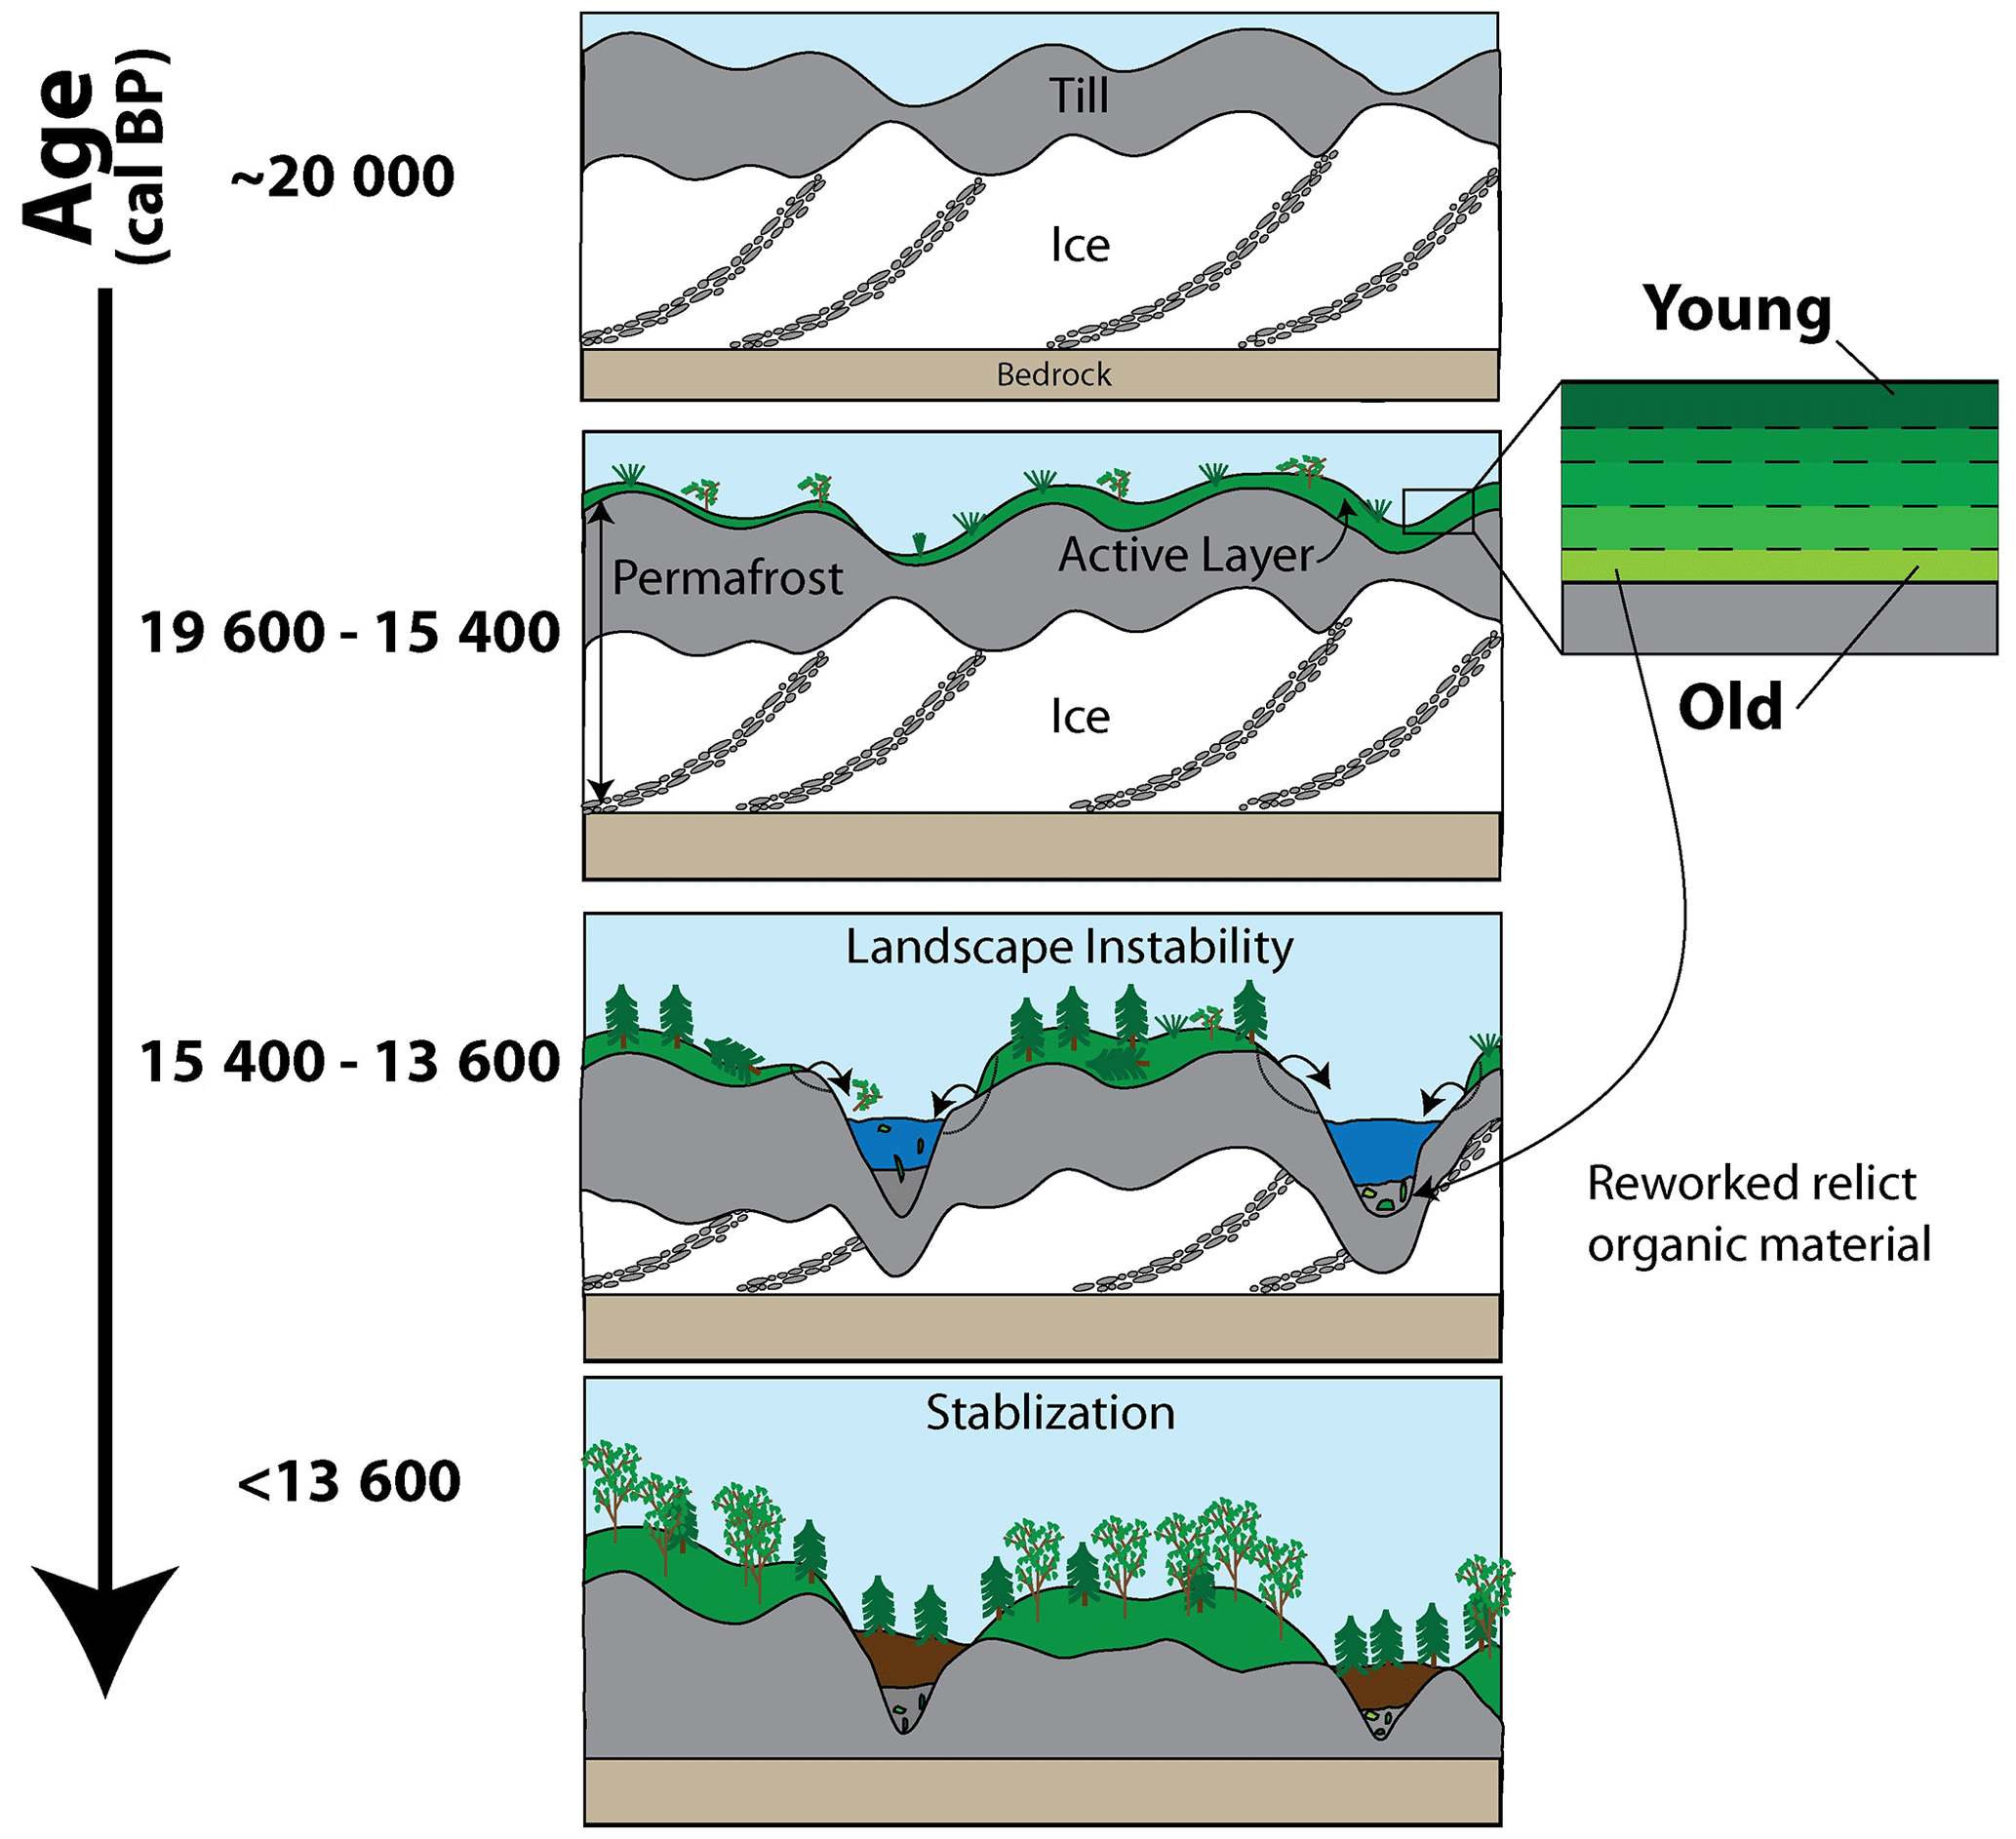
Figure 6Conceptual model of kettle basin formation of the Kent Moraine in western New York building on Florin and Wright (1969). The same model applies to the Lake Escarpment Moraine, except the timeline begins ∼ 17 ka. First, the LIS deposited the ice-cored Kent Moraine. It remained ice-cored, perhaps influenced by permafrost, while tundra vegetation grew atop the moraine and stored carbon in the soil. Next, during climate amelioration in the Bølling–Allerød periods, the ice in the moraine melted. This led to the formation of basins that were filled with both contemporaneous and reworked sediments. This is also likely the time when trees and other organic material could be slumped and formed deposits that placed primary tills adjacent to younger material. Finally, organic-rich sediment deposition dominates after ∼ 13.8 ka.
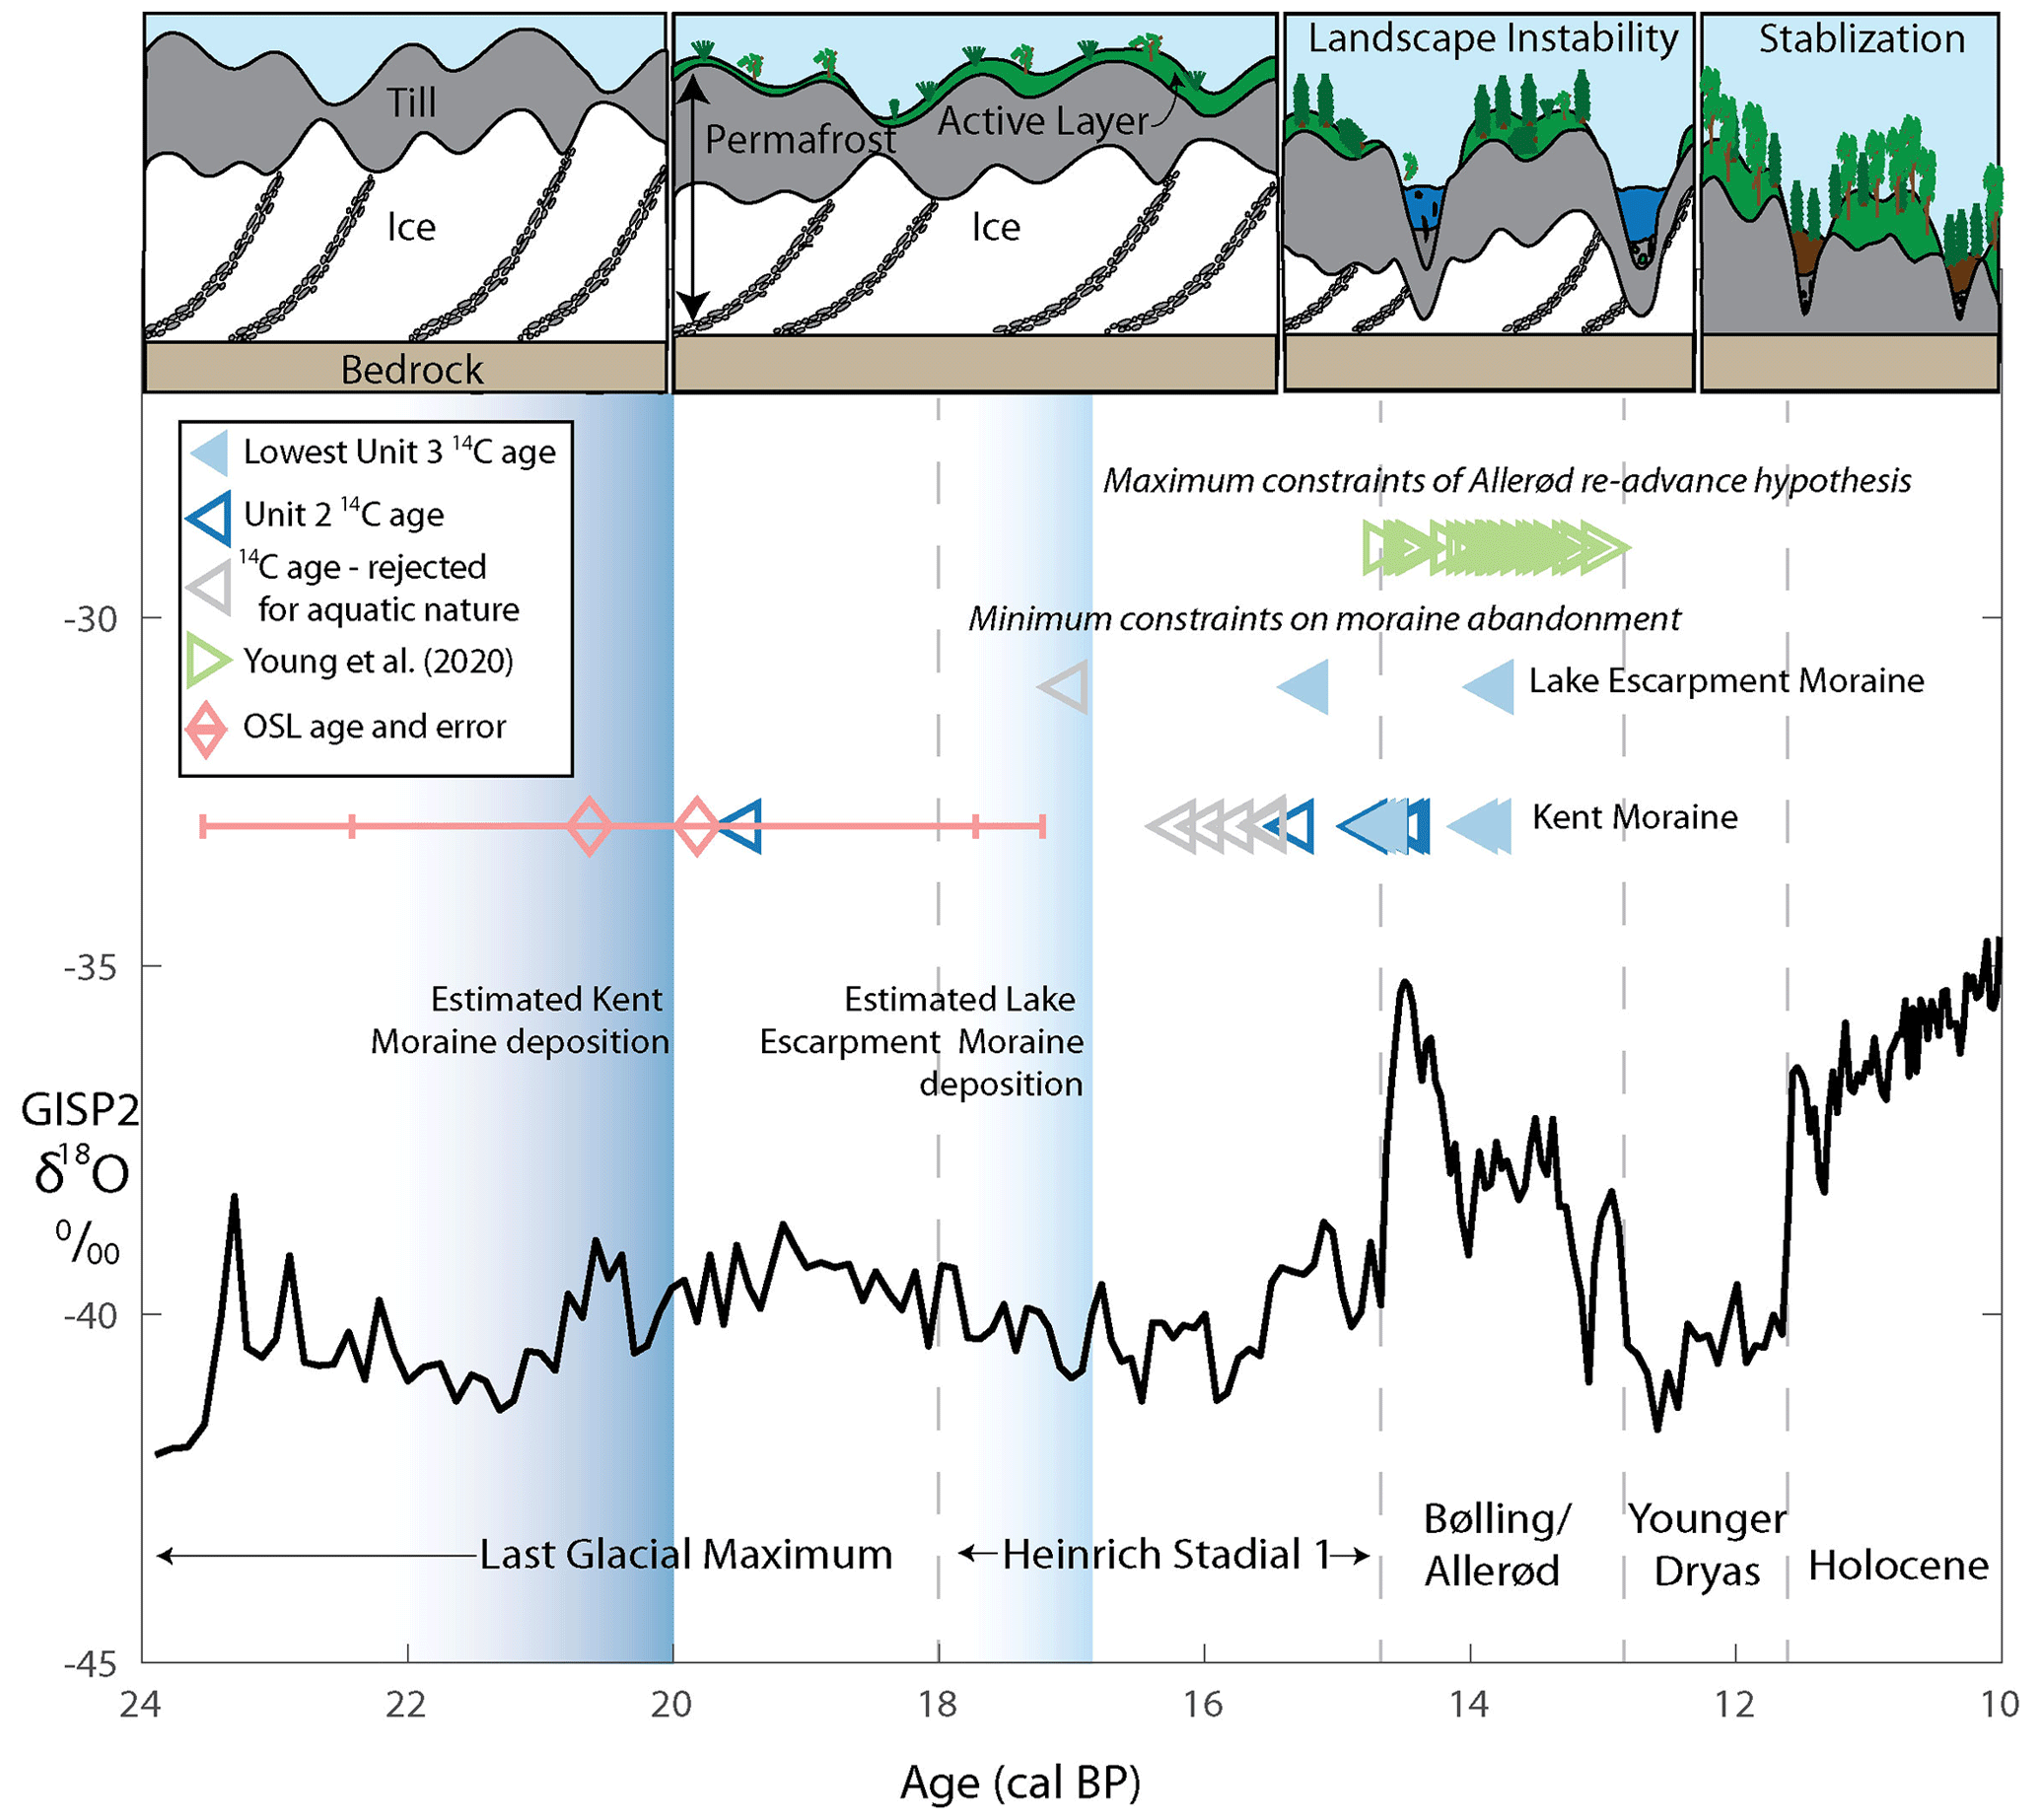
Figure 7Comparison of radiocarbon ages from the Kent and Lake Escarpment moraines and Young et al. (2020) in the context of North Atlantic deglacial climate changes. The black line is the GISP2 δ18O record (Grootes and Stuiver, 1999). The dark blue and light blue fading is the estimated deposition of the Kent Moraine and Lake Escarpment Moraine, respectively. Dark blue and light blue triangles are Unit 2 and the lowest Unit 3 radiocarbon ages from the Kent and Lake Escarpment Moraine sediment cores, respectively. Gray triangles are radiocarbon ages that we suspect have hard-water contamination. Pink diamonds are OSL ages and 2σ errors from the kame delta outboard of the Kent Moraine. Green triangles are ages from Young et al. (2020) interpreted by them to be maximum-limiting constraints on the 13 ka re-advance. Errors for all radiocarbon dates are not plotted because their width is smaller than the symbols.
Moraines can remain ice-cored for thousands of years after deposition due to sediment cover that insulates and preserves the buried ice (Florin and Wright, 1969). If the region is cold enough to support permafrost it may extend the duration that the moraine remains ice-cored (Clayton et al., 2001; Henriksen et al., 2003; Schomacker, 2008). Given that the kettles appear to have formed within ∼ 1 kyr of each other and that their formation coincided with the warm Bølling–Allerød period, this suggests that the climate during Heinrich Stadial 1 may have been cold enough to help preserve the ice.
5.4 Implications for the climate in western New York
The climate of western New York between 20 and 15 ka is poorly known, but records from Ontario, Ohio, and New England suggest that the climate events of the North Atlantic influenced the northeastern US. These terrestrial climate reconstructions depict a cold Heinrich Stadial 1 (∼ 18 to ∼ 14.7 ka), a shift to warmer temperatures during the Bølling–Allerød, and a cool Younger Dryas (Gill et al., 2012; Gonzales and Grimm, 2009; Grigg et al., 2021; Shuman et al., 2002; Watson et al., 2018; Yu, 2007; Yu and Eicher, 1998). A stable Heinrich Stadial 1 and shift to warmer temperatures during the Bølling–Allerød are shown by Watson et al. (2018), who used biomarkers (branched GDGTs) to report that mean annual temperature in central Ohio varied between −2.0 and −0.5 °C from 17.0 to 14.5 ka before warming 5 °C between 14.5 and 13.0 ka.
The rate of LIS retreat offers additional insight into the climate in the northeast US. Barth et al. (2019) used cosmogenic nuclide dating of glacially transported boulders to estimate LIS thinning in the Adirondack Mountains and showed increased thinning between 15.4 ± 1.0 and 13.9 ± 0.9 ka, generally coincident with the Bølling. The New England Varve Chronology shows a relatively steady net retreat rate of the LIS through the Hudson Valley between 18 and 14.7 ka; during the Bølling the net retreat rate tripled, implying that New England experienced elevated warmth at that time (Ridge et al., 2012).
Ice-wedge casts can be used to identify areas that experienced past permafrost and constrain past temperature because their formation requires mean annual temperatures between −6 and −8 °C (French, 2007; French and Miller, 2014). Ice-wedge casts are preserved in southern Ontario that were deposited at 18–15 ka based on regional correlations (Dalton et al., 2020; Gao, 2005; Morgan, 1982). This suggests that the mean annual air temperature was low enough near our study site during Heinrich Stadial 1 to support permafrost. While this temperature depression is larger than reported by Watson et al. (2018), it is likely that there was a strong temperature gradient between Ohio and western New York during deglaciation, with the latter remaining within 100 km of the ice margin until 14 ka (Dalton et al., 2020). This proximity to the ice sheet from the LGM to 14 ka may have been a driver of the cold climate that persisted in western New York. There are no reports of relict permafrost features within the LGM limit in western New York, but their presence south of the LGM extent suggests the likelihood of permafrost within the limit as well (French and Millar, 2014).
Finally, there are seven local pollen records from Miller (1973), Calkin and McAndrews (1980), and Doody (2018) that describe the initial deglacial vegetation in western New York. Only the Allenberg Bog (Miller, 1973) and Dragonfly Kettle (Doody, 2018) pollen records captured a “tundra” zone at the base, although the presence of both arctic and temperate vegetation complicates their interpretation. The tundra zone is overlain by an interval with high spruce and pine pollen; this is the lowest unit found in the other five records (Miller, 1973; Calkin and McAndrews, 1980). This likely reflects the new forest biome associated with warmer temperatures. Given our results, we believe the tundra pollen zone captured both the tundra vegetation that was growing on the moraine prior to basin formation and the more temperate vegetation as spruce and pine moved in during the Bølling. Unfortunately, the pollen records may be unreliable before 14 ka due to the same reworking problems as our radiocarbon dating, but this remains site-specific.
Altogether, there is evidence that the lag time between ice sheet retreat and kettle basin stabilization may be attributable to sustained permafrost in western New York due to cold North Atlantic conditions during Heinrich Stadial 1 (Fig. 7). The warming at the Bølling onset at ∼ 14.7 ka may have increased regional temperatures, causing the melting of buried ice, initiating a phase of rapid landscape evolution and the formation of kettle basins, and eventually stabilizing the moraine topography. Numerous studies discuss the role of permafrost in the lag time between moraine ages and basal macrofossils along the south-central LIS margin, including Indiana and Illinois (Curry et al., 2018; Fisher et al., 2020), Michigan (Yansa et al., 2020), and Wisconsin (Clayton et al., 2001).
Our findings support the observations and conclusions from numerous studies that radiocarbon dates can be extreme minimum age constraints on deglaciation (Curry et al., 2018; Fisher et al., 2020; Florin and Wright, 1969; Halsted et al., 2023; Yansa et al., 2020). In New England, minimum-limiting radiocarbon ages may be the reason for the discrepancy between the timing of moraine deposition as recorded by 10Be exposure dating (e.g., Balco et al., 2002; Corbett et al., 2017) and radiocarbon ages of basal macrofossils in lakes and bogs (e.g., Peteet et al., 2012). The younger-than-expected radiocarbon ages from the Valley Heads Moraine from Kozlowski et al. (2018) may be afflicted by similar processes. Permafrost during Heinrich Stadial 1 may have minimized landscape evolution in New England and central New York as well and could help explain the offset.
5.5 Allerød re-advance hypothesis
The stratigraphically lowest radiocarbon ages from Unit 3 in the Lake Escarpment Moraine kettle basins, which are 15 000–15 400 and 13 600–14 000 cal BP, pre-date the ∼ 13.1 ka re-advance suggested by Young et al. (2020) (Figs. 5 and 7). Chronologically constrained organic-rich sedimentation, with no stratigraphic evidence of interruption, ensued from at least 13 600–14 000 cal BP and well into the Holocene. Furthermore, there is no evidence of over-compaction in our bulk density measurements in 21LPB1 during this interval of time (Fig. 5). Thus, we do not find evidence that a ∼ 13.1 ka LIS advance created or overran the Lake Escarpment Moraine as hypothesized by Young et al. (2020). Rather, we suggest that the landscape was unstable during its transition from a permafrost-dominated landscape to one with evolving and then stabilizing moraine topography. This landscape instability with reworking of glacial sediments may have led to the stratigraphy interpreted by Young et al. (2020) as primary tills in contact with logs dating to 13 ka (Fig. 7). Both the Dragonfly and Little Protection sites have intervals with increased wood deposition between 14 and 13 ka, and future work could investigate the source of these woody intervals to further investigate the results from Young et al. (2020).
We present 41 new macrofossil-based radiocarbon ages from kettle basin infills in western New York. We find that the lowest radiocarbon ages from Unit 3 (15 000–15 400 and 13 600–14 000 cal BP) are 5 kyr younger than our OSL age constraints on moraine deposition of 19.8 ± 2.6–20.6 ± 2.9 ka and the oldest radiocarbon age from Unit 2 of 19 350–19 600 cal BP from the Kent Moraine. The lowest Unit 3 ages are 2 kyr younger than our estimated age of Lake Escarpment Moraine deposition from moraine correlations. We interpret this offset to be due to a cold climate in western New York during Heinrich Stadial 1 supporting persistent buried ice which inhibited kettle basin formation until regional warming that took place during the Bølling. Our results do not support a re-advance of the LIS over the Lake Escarpment Moraine at ∼ 13 ka (see Young et al., 2020). The lag time between ice sheet retreat and moraine stabilization in western New York may present an alternate explanation for inconsistencies between basal ages in sediment cores and other dating methods in central New York (Kozlowski et al., 2018) and eastern New York (Peteet et al., 2012).
Future work could target features that are stable during ice retreat even where permafrost is present, such as outcrops of pro-glacial and ice-walled lake plane deposits (e.g., Curry et al., 2018), or perhaps moraines that are not hummocky in nature. This limitation may not be as necessary in environments where climate more quickly ameliorated, such as appears to have been the case in southern Ohio (Glover et al., 2011). Additionally, it may be important to consider the coring equipment. The GeoProbe coring device enabled us to collect stiff mineral-rich sediments lower than otherwise possible with the Livingstone and Russian peat coring devices. This meant that our coring did not stop at first contact with stiff minerogenic sediment that could mistakenly be interpreted as primary glacial in origin.
Table 2 provides the data to calculate the radiocarbon ages from this study. Table 3 and Table S1 provide the data to calculate OSL ages from this study.
The supplement related to this article is available online at: https://doi.org/10.5194/gchron-6-409-2024-supplement.
JPB and KKP conceptualized the study. ALK and KKP provided funding for fieldwork and lab analyses. KKP, JPB, CKW, BMC, and EPY collected sediment cores. KKP, BMC, EPY, and JPB conducted downcore analyses and radiocarbon sampling. CKW collected OSL samples, and TMR conducted lab analyses and calculated the ages. KKP compiled and recalculated the radiocarbon ages. KKP, JPB, ALK, CKW, and BMC interpreted the results. KKP wrote the first draft of the manuscript, and all authors contributed to editing. KKP and TMR developed the figures and tables.
The contact author has declared that none of the authors has any competing interests.
Publisher's note: Copernicus Publications remains neutral with regard to jurisdictional claims made in the text, published maps, institutional affiliations, or any other geographical representation in this paper. While Copernicus Publications makes every effort to include appropriate place names, the final responsibility lies with the authors.
We thank the Vincent, Songster, Gebhard, and Bohall families for the access to their property, as well as their enthusiasm and friendship. We thank Joseph Tulenko, Brandon Graham, Elizabeth Thomas, Kurt Lindberg, Owen Cowling, Fiona Ellsworth, Joshua Charlton, Liza Wilson, Jason Parsons, Will Phillips, and George Thomas for their help in the field (it takes a village!). We thank the National Ocean Sciences Accelerator Mass Spectrometry and W. M. Keck Carbon Cycle Accelerator Mass Spectrometer laboratories for radiocarbon analyses. We thank the Luminescence Lab at Utah State University for OSL analyses.
This research was supported by the United State Geological Survey Great Lakes Geological Mapping Coalition under grant no. G20AC00418, NSF/GSA Graduate Student Geoscience (grant no. 13056-21, which was funded by NSF award no. 1949901), and the Mark Diamond Research Fund of the Graduate Student Association of the State University of New York at Buffalo.
This paper was edited by Christine Hatté and reviewed by Aaron M. Barth and two anonymous referees.
Balco, G., Stone, J. O. H., Porter, S. C., and Caffee, M. W.: Cosmogenic-nuclide ages for New England coastal moraines, Martha's Vineyard and Cape Cod, Massachusetts, USA, Quaternary Sci. Rev., 21, 2127–2135, https://doi.org/10.1016/S0277-3791(02)00085-9, 2002.
Balco, G., Briner, J., Finkel, R. C., Rayburn, J. A., Ridge, C., and Schaefer, J. M.: Regional beryllium-10 production rate calibration for late-glacial northeastern North America, Quat. Geochronol., 4, 93–107, https://doi.org/10.1016/j.quageo.2008.09.001, 2009.
Barth, A. M., Marcott, S. A., Licciardi, J. M., and Shakun, J. D.: Deglacial Thinning of the Laurentide Ice Sheet in the Adirondack Mountains, New York, USA, Revealed by 36Cl Exposure Dating, Paleoceanogr. Paleoclim., 34, 946–953, https://doi.org/10.1029/2018PA003477, 2019.
Bird, B. and Kozlowski, A.: Late Quaternary Reconstruction of Lake Iroquois in the Ontario Basin of New York. New York State Museum Map & Chart 80, https://www.nysm.nysed.gov/sites/default/files/mc80_iroquois.pdf (last access: 29 March 2022), 2016.
Briner, J. P., Cuzzone, J. K., Badgeley, J. A., Young, N. E., Steig, E. J., Morlighem, M., Schlegel, N. J., Hakim, G. J., Schaefer, J. M., Johnson, J. V., Lesnek, A. J., Thomas, E. K., Allan, E., Bennike, O., Cluett, A. A., Csatho, B., de Vernal, A., Downs, J., Larour, E., and Nowicki, S.: Rate of mass loss from the Greenland Ice Sheet will exceed Holocene values this century, Nature, 586, 70–74, https://doi.org/10.1038/s41586-020-2742-6, 2020.
Broecker, W. S., Kennett, J. P., Flower, B. P., Teller, J. T., Trumbore, S., Bonani, G., and Wolfli, W.: Routing of meltwater from the Laurentide Ice Sheet during the Younger Dryas cold episode, Nature, 341, 318–321, https://doi.org/10.1038/341318a0, 1989.
Calkin, P. E. and Feenstra, B. H.: Evolution of the Erie-Basin Great Lakes, in: Quaternary Evolution of the Great Lakes, edited by: Karrow, P. F. and Calkin, P. E., Geological Society of Canada, https://doi.org/10.1016/0033-5894(87)90011-1, 1985.
Calkin, P. E. and McAndrews, J. H.: Geology and paleontology of two late Wisconsin sites in western New York State, Geol. Soc. Am. Bull., 91, 295–306, https://doi.org/10.1130/0016-7606(1980)91<295:GAPOTL>2.0.CO;2, 1980.
Campbell, M. C., Fisher, T. G., and Goble, R. J.: Terrestrial sensitivity to abrupt cooling recorded by aeolian activity in northwest Ohio, USA, Quaternary Res., 75, 411–416, https://doi.org/10.1016/j.yqres.2011.01.009, 2011.
Clayton, L. E., Attig, J. W., and Mickelson, D. M.: Effects of late Pleistocene permafrost on the landscape of Wisconsin, USA, Boreas, 30, 173–188, https://doi.org/10.1111/j.1502-3885.2001.tb01221.x, 2001.
Corbett, L. B., Bierman, P. R., Stone, B. D., Caffee, M. W., and Larsen, P. L.: Cosmogenic nuclide age estimate for Laurentide Ice Sheet recession from the terminal moraine, New Jersey, USA, and constraints on latest Pleistocene ice sheet history, Quaternary Res., 87, 482–498, https://doi.org/10.1017/qua.2017.11, 2017.
Cronin, T. M., Rayburn, J. A., Guilbault, J. P., Thunell, R., and Franzi, D. A.: Stable isotope evidence for glacial lake drainage through the St. Lawrence Estuary, eastern Canada, ∼ 13.1-12.9 ka, Quatern. Int., 260, 55–65, https://doi.org/10.1016/j.quaint.2011.08.041, 2012.
Curry, B. B., Lowell, T. V., Wang, H., and Anderson, A. C.: Revised time-distance diagram for the Lake Michigan Lobe, Michigan Subepisode, Wisconsin Episode, Illinois, USA, https://doi.org/10.1130/2018.2530(04), 2018.
Dalton, A. S., Margold, M., Stokes, C., Tarasov, L., Dyke, A., Adams, R., Allard, S., Arends, H., Atkinson, N., Attig, J., Barnett, P., Barnett, R., Batterson, M., Bernatchez, P., Borns, H., Breckenridge, A., Briner, J., Brouard, E., Campbell, J., and Wright, H.: An updated radiocarbon-based ice margin chronology for the last deglaciation of the North American Ice Sheet Complex, Quaternary Sci. Rev., 234, 106223, https://doi.org/10.1016/j.quascirev.2020.106223, 2020.
Deevey, E. S., Gross, M. S., Hutchinson, G. E., and Kraybill, H. L.: The Natural 14C Contents of Materials from Hard-Water Lakes, P. Natl. Acad. Sci. USA, 40, 285–288, https://doi.org/10.1073/pnas.40.5.285, 1954.
Deuser, W. G. and Degens, E. T.: Carbon Isotope Fractionation in the System CO2(gas)–CO2(aqueous)–HCO(aqueous), Nature, 215, 1033–1035, https://doi.org/10.1038/2151033a0, 1967.
Donnelly, J. P., Driscoll, N. W., Uchupi, E., Keigwin, L. D., Schwab, W. C., Thieler, E. R., and Swift, S. A.: Catastrophic meltwater discharge down the Hudson Valley: A potential trigger for the Intra-Allerød cold period, Geology, 33, 89–92, https://doi.org/10.1130/G21043.1, 2005.
Doody, E.: A latest pleistocene palynologic record from western New York, Geology, University at Buffalo, http://hdl.handle.net/10477/78555 (last access: 13 April 2022), 2018.
Dyke, A. S.: An outline of North American deglaciation with emphasis on central and northern Canada, in: Developments in Quaternary Sciences, edited by: Ehlers, J. and Gibbard, P. L., Elsevier, 373–424, https://doi.org/10.1016/S1571-0866(04)80209-4, 2004.
Elder, K. L., Roberts, M. L., Walther, T., and Xu, L.: Single step Production of graphite from organic Samples for Radiocarbon Measurements, Radiocarbon, 61, 1843–1854, https://doi.org/10.1017/RDC.2019.136, 2019.
Eschman, D. F. and Karrow, P. F.: Huron Basin Glacial Lakes: A Review, in: Quaternary Evolution of the Great Lakes, edited by: Karrow, P. F. and Calkin, P. E., Geological Society of Canada, https://doi.org/10.1016/0033-5894(87)90011-1, 1985.
Fairchild, H. L. R.: Glacial Waters in Central New York, University of the State of New York, https://nysl.ptfs.com/#!/s?a=c&q=*&type=16&criteria=field11=5983116_TEXT&b=0 (last access: 7 December 2020), 1909.
Fisher, T. G., Blockland, J. D., Anderson, A., Krantz, D. E., Stierman, D. J., and Goble, R.: Evidence of Sequence and Age of Ancestral Lake Erie Lake-Levels, Northwest Ohio, Ohio J. Sci., 115, 62–78, https://doi.org/10.18061/ojs.v115i2.4614, 2015.
Fisher, T. G., Dziekan, M. R., McDonald, J., Lepper, K., Loope, H., McCarthy, F. M. G., and Curry, B. B.: Minimum limiting deglacial ages for the out-of-phase Saginaw Lobe of the Laurentide Ice Sheet using optically stimulated luminescence (OSL) and radiocarbon methods, Quaternary Res., 97, 71–87, https://doi.org/10.1017/qua.2020.12, 2020.
Florin, M.-B. and Wright Jr., H. E.: Diatom Evidence for the Persistence of Stagnant Glacial Ice in Minnesota, GSA Bull., 80, 695–704, https://doi.org/10.1130/0016-7606(1969)80[695:DEFTPO]2.0.CO;2, 1969.
French, H. M.: Surface Features of Permafrost, in: The Periglacial Environment, John Wiley & Sons, Ltd., 116–152, https://doi.org/10.1002/9781118684931.ch6, 2007.
French, H. M. and Millar, S. W. S.: Permafrost at the time of the Last Glacial Maximum (LGM) in North America, Boreas, 43, 667–677, https://doi.org/10.1111/bor.12036, 2014.
Fritz, P., Morgan, A. V., Eicher, U., and McAndrews, J. H.: Stable isotope, fossil coleoptera and pollen stratigraphy in late quaternary sediments from Ontario and New York state, Palaeogeogr. Palaeocl., 58, 183–202, https://doi.org/10.1016/0031-0182(87)90059-9, 1987.
Fullerton, D. S.: Preliminary correlation of post-Erie interstadial events: (16,000-10,000 radiocarbon years before present), central and eastern Great Lakes region, and Hudson, Champlain, and St. Lawrence Lowlands, United States and Canada, Professional Paper 1089, https://doi.org/10.3133/pp1089, 1980.
Galbraith, R. F. and Roberts, R. G.: Statistical aspects of equivalent dose and error calculation and display in OSL dating: An overview and some recommendations, Quat. Geochronol., 11, 1–27, https://doi.org/10.1016/j.quageo.2012.04.020, 2012.
Gao, C.: Ice-wedge casts in Late Wisconsinan glaciofluvial deposits, southern Ontario, Canada, Can. J. Earth Sci., 42, 2117–2126, https://doi.org/10.1139/e05-072, 2005.
Gill, J. L., Williams, J. W., Jackson, S. T., Donnelly, J. P., and Schellinger, G. C.: Climatic and megaherbivory controls on late-glacial vegetation dynamics: a new, high-resolution, multi-proxy record from Silver Lake, Ohio, Quaternary Sci. Rev., 34, 66–80, https://doi.org/10.1016/j.quascirev.2011.12.008, 2012.
Glover, K. C., Lowell, T. V., Wiles, G. C., Pair, D., Applegate, P., and Hajdas, I.: Deglaciation, basin formation and post-glacial climate change from a regional network of sediment core sites in Ohio and eastern Indiana, Quaternary Res., 76, 401–410, https://doi.org/10.1016/j.yqres.2011.06.004, 2011.
Gonzales, L. M. and Grimm, E. C.: Synchronization of late-glacial vegetation changes at Crystal Lake, Illinois, USA with the North Atlantic Event Stratigraphy, Quaternary Res., 72, 234–245, https://doi.org/10.1016/j.yqres.2009.05.001, 2009.
Grigg, L. D., Engle, K. J., Smith, A. J., Shuman, B. N., and Mandl, M. B.: A multi-proxy reconstruction of climate during the late-Pleistocene to early Holocene transition in the northeastern, USA, Quaternary Res., 102, 188–204, https://doi.org/10.1017/qua.2020.127, 2021.
Grootes, P. M. and Stuiver, M.: GISP2 Oxygen Isotope Data, PANGAEA [data set], https://doi.org/10.1594/PANGAEA.56094, 1999.
Guérin, G., Mercier, N., and Adamiec, G.: Dose-rate conversion factors: update, Ancient TL, 29, 5–8, 2011.
Halsted, C. T., Bierman, P. R., Shakun, J. D., Davis, P. T., Corbett, L. B., Drebber, J. S., and Ridge, J. C.: A critical re-analysis of constraints on the timing and rate of Laurentide Ice Sheet recession in the northeastern United States, J. Quaternary Sci., 39, 54–69, https://doi.org/10.1002/jqs.3563, 2023.
Heiri, O., Lotter, A. F., and Lemcke, G.: Loss on ignition as a method for estimating organic and carbonate content in sediments: reproducibility and comparability of results, J. Paleolimnol., 25, 101–110, https://doi.org/10.1023/A:1008119611481, 2001.
Henriksen, M., Mangerud, J., Matiouchkov, A., Paus, A., and Svendsen, J. I.: Lake stratigraphy implies an 80 000 yr delayed melting of buried dead ice in northern Russia, J. Quaternary Sci., 18, 663–679, https://doi.org/10.1002/jqs.788, 2003.
Higley, M. C., Fisher, T. G., Jol, H. M., Lepper, K., and Martin-Hayden, J. M.: Stratigraphic and chronologic analysis of the Warren Beach, northwest Ohio, USA, Can. J. Earth Sci., 51, 737–749, https://doi.org/10.1139/cjes-2014-0047, 2014.
Keeley, J. E. and Sandquist, D. R.: Carbon: freshwater plants, Plant Cell Environ., 15, 1021–1035, https://doi.org/10.1111/j.1365-3040.1992.tb01653.x, 1992.
Kozlowski, A. L., Bird, B. C., Lowell, T. V., Smith, C. A., Feranec, R. S., and Graham, B. L.: Minimum age of the Mapleton, Tully, and Labrador Hollow moraines indicates correlation with the Port Huron Phase in central New York State, in: Quaternary Glaciation of the Great Lakes Region: Process, Landforms, Sediments, and Chronology, https://doi.org/10.1130/2018.2530(10), 2018.
LaFleur, R. G.: Glacial geology and stratigraphy of Western New York Nuclear Service Center and vicinity, Cattaraugus and Erie Counties, New York, Report 79-989, https://doi.org/10.3133/ofr79989, 1979.
Last, W. and Smol, J. (Eds.): Tracking environmental change using lake sediments. 2. Physical and geochemical methods, Springer Dordrecht, https://doi.org/10.1007/0-306-47670-3, 2001.
Lewis, C. F. M. and Anderson, T. W.: A younger glacial Lake Iroquois in the Lake Ontario basin, Ontario and New York: re-examination of pollen stratigraphy and radiocarbon dating, Can. J. Earth Sci., 57, 453–463, https://doi.org/10.1139/cjes-2019-0076, 2019.
Leydet, D. J., Carlson, A. E., Teller, J. T., Breckenridge, A., Barth, A. M., Ullman, D. J., Sinclair, G., Milne, G. A., Cuzzone, J. K., and Caffee, M. W.: Opening of glacial Lake Agassiz's eastern outlets by the start of the Younger Dryas cold period, Geology, 46, 155–158, https://doi.org/10.1130/G39501.1, 2018.
Löfverström, M., Caballero, R., Nilsson, J., and Kleman, J.: Evolution of the large-scale atmospheric circulation in response to changing ice sheets over the last glacial cycle, Clim. Past, 10, 1453–1471, https://doi.org/10.5194/cp-10-1453-2014, 2014.
MacClintock, P. and Apfel, E. T.: Correlation of the drifts of the Salamanca re-entrant, New York, Bull. Geol. Soc. Am., 55, 1143–1164, https://doi.org/10.1130/GSAB-55-1143, 1944.
Miller, N. G.: Late-glacial and postglacial vegetation change in southwestern New York State, University of the State of New York, State Education Dept, Albany, https://www.biodiversitylibrary.org/bibliography/135533 (last access: 25 April 2022), 1973.
Morgan, A. V.: Distribution and probable age of relict permafrost features in south-western Ontario, 4th Canadian Permafrost Conference, Ottawa, Ontario, 2–6 March 1981, 91–100, ISBN 9780660510415, https://search.worldcat.org/it/title/proceedings-of-the-fourth-canadian-permafrost-conference-comptes-rendus-de-la-quatrieme-conference-canadienne-sur-le-pergelisol-calgary-alberta-march-2-6-mars-1981/oclc/8981237 (last access: 18 January 2022), 1982.
Muller, E. H. and Calkin, P. E.: Timing of Pleistocene glacial events in New York State, Can. J. Earth Sci., 30, 1829–1845, https://doi.org/10.1139/e93-161, 1993.
Muller, E. H. and Prest, V. K.: Glacial Lakes in the Ontario Basin, in: Quaternary Evolution of the Great Lakes edited by: Karrow, P. F. and Calkin, P. E., Geological Society of Canada, https://doi.org/10.1016/0033-5894(87)90011-1, 1985.
Murray, A. S. and Wintle, A. G.: Luminescence dating of quartz using an improved single-aliquot regenerative-dose protocol, Radiat. Meas., 32, 57–73, https://doi.org/10.1016/S1350-4487(99)00253-X, 2000.
Oana, S. and Deevey, E. S.: Carbon 13 in lake waters and its possible bearing on paleolimnology, Am. J. Sci., 258-A, 253–272, 1960.
Olley, J. M., Caitcheon, G. G., and Roberts, R. G.: The origin of dose distributions in fluvial sediments, and the prospect of dating single grains from fluvial deposits using optically stimulated luminescence, Radiat. Meas., 30, 207–217, https://doi.org/10.1016/S1350-4487(99)00040-2, 1999.
Olsson, I.: Radiometric Methods, in: Handbook of Holocene paleoecology and paleohydrology, edited by: Berglund, B., John Wiley & Sons, Chichester, 273–312, https://doi.org/10.1002/gea.3340040208, 1986.
Osman, M. B., Tierney, J. E., Zhu, J., Tardif, R., Hakim, G. J., King, J., and Poulsen, C. J.: Globally resolved surface temperatures since the Last Glacial Maximum, Nature, 599, 239–244, https://doi.org/10.1038/s41586-021-03984-4, 2021.
Pearson, A., McNichol, A. P., Schneider, R. J., Von Reden, K. F., and Zheng, Y.: Microscale AMS 14C Measurement at NOSAMS, Radiocarbon, 40, 61–75, https://doi.org/10.1017/S0033822200017902, 1997.
Peteet, D. M., Beh, M., Orr, C., Kurdyla, D., Nichols, J., and Guilderson, T.: Delayed deglaciation or extreme Arctic conditions 21–16 cal. kyr at southeastern Laurentide Ice Sheet margin?, Geophys. Res. Lett., 39, L11706, https://doi.org/10.1029/2012GL051884, 2012.
Porreca, C., Briner, J. P., and Kozlowski, A.: Laurentide ice sheet meltwater routing along the Iro-Mohawk River, eastern New York, USA, Geomorphology, 303, 155–161, https://doi.org/10.1016/j.geomorph.2017.12.001, 2018.
Prescott, J. R. and Hutton, J. T.: Cosmic ray contributions to dose rates for luminescence and ESR dating: Large depths and long-term time variations, Radiat. Meas., 23, 497–500, https://doi.org/10.1016/1350-4487(94)90086-8, 1994.
Rayburn, J. A., Franzi, D. A., and Knuepfer, P. L. K.: Evidence from the Lake Champlain Valley for a later onset of the Champlain Sea and implications for late glacial meltwater routing to the North Atlantic, Palaeogeogr. Palaeocl., 246, 62–74, https://doi.org/10.1016/j.palaeo.2006.10.027, 2007.
Rayburn, J. A., Knuepfer, P. L., and Franzi, D. A.: A series of large, Late Wisconsinan meltwater floods through the Champlain and Hudson Valleys, New York State, USA, Quaternary Sci. Rev., 24, 2410–2419, https://doi.org/10.1016/j.quascirev.2005.02.010, 2005.
Rayburn, J. A., Cronin, T. M., Franzi, D. A., Knuepfer, P. L. K., and Willard, D. A.: Timing and duration of North American glacial lake discharges and the Younger Dryas climate reversal, Quaternary Res., 75, 541–551, https://doi.org/10.1016/j.yqres.2011.02.004, 2011.
Reimer, P. J., Austin, W. E. N., Bard, E., Bayliss, A., Blackwell, P. G., Bronk Ramsey, C., Butzin, M., Cheng, H., Edwards, R. L., Friedrich, M., Grootes, P. M., Guilderson, T. P., Hajdas, I., Heaton, T. J., Hogg, A. G., Hughen, K. A., Kromer, B., Manning, S. W., Muscheler, R., Palmer, J. G., Pearson, C., van der Plicht, J., Reimer, R. W., Richards, D. A., Scott, E. M., Southon, J. R., Turney, C. S. M., Wacker, L., Adolphi, F., Büntgen, U., Capano, M., Fahrni, S. M., Fogtmann-Schulz, A., Friedrich, R., Köhler, P., Kudsk, S., Miyake, F., Olsen, J., Reinig, F., Sakamoto, M., Sookdeo, A., and Talamo, S.: The IntCal20 Northern Hemisphere Radiocarbon Age Calibration Curve (0–55 cal kBP), Radiocarbon, 62, 725–757, https://doi.org/10.1017/RDC.2020.41, 2020.
Richard, P. J. H. and Occhietti, S.: 14C chronology for ice retreat and inception of Champlain Sea in the St. Lawrence Lowlands, Canada, Quaternary Res., 63, 353–358, https://doi.org/10.1016/j.yqres.2005.02.003, 2005.
Ridge, J. C.: The last deglaciation of the northeastern United States: a combined varve, paleomagnetic, and calibrated 14C chronology, in: Geoarchaeology of landscapes in the glaciated northeast, edited by: Hart, J. P. and Cremeens, D. L., New York State Museum Bulletin, 15–45, OCLC/NY ID 52806782, https://nysl.ptfs.com/#!/s?a=c&q=*&type=16&criteria=field11=52806782&b=0 (last access: 12 January 2022), 2003.
Ridge, J. C., Balco, G., Bayless, R. L., Beck, C. C., Carter, L. B., Dean, J. L., Voytek, E. B., and Wei, J. H.: The new North American Varve Chronology: A precise record of southeastern Laurentide Ice Sheet deglaciation and climate, 18.2–12.5 kyr BP, and correlations with Greenland ice core records, Am. J. Sci., 312, 685–722, https://doi.org/10.2475/07.2012.01, 2012.
Rittenour, T. M., Cotter, J. F. P., and Arends, H. E.: Application of single-grain OSL dating to ice-proximal deposits, glacial Lake Benson, west-central Minnesota, USA, Quat. Geochronol., 30, 306–313, https://doi.org/10.1016/j.quageo.2015.02.025, 2015.
Schomacker, A.: What controls dead-ice melting under different climate conditions? A discussion, Earth-Sci. Rev., 90, 103–113, https://doi.org/10.1016/j.earscirev.2008.08.003, 2008.
Shah Walter, S. R., Gagnon, A. R., Roberts, M. L., McNichol, A. P., Gaylord, M. C. L., and Klein, E.: Ultra-Small Graphitization Reactors for Ultra-Microscale 14C Analysis at the National Ocean Sciences Accelerator Mass Spectrometry (NOSAMS) Facility, Radiocarbon, 57, 109–122, https://doi.org/10.2458/azu_rc.57.18118, 2015.
Shuman, B., Webb III, T., Bartlein, P., and Williams, J. W.: The anatomy of a climatic oscillation: vegetation change in eastern North America during the Younger Dryas chronozone, Quaternary Sci. Rev., 21, 1777–1791, https://doi.org/10.1016/S0277-3791(02)00030-6, 2002.
Stanford, S. D., Stone, B. D., Ridge, J. C., Witte, R. W., Pardi, R. R., and Reimer, G. E.: Chronology of Laurentide glaciation in New Jersey and the New York City area, United States, Quaternary Res., 99, 142–167, https://doi.org/10.1017/qua.2020.71, 2020.
Stuiver, M. and Polach, H. A.: Discussion Reporting of 14C Data, Radiocarbon, 19, 355–363, https://doi.org/10.1017/S0033822200003672, 1977.
Stuiver, M. and Reimer, P. J.: Extended 14C Data Base and Revised CALIB 3.0 14C Age Calibration Program, Radiocarbon, 35, 215–230, https://doi.org/10.1017/S0033822200013904, 1993.
Teller, J. T.: Controls, history, outbursts, and impact of large late-Quaternary proglacial lakes in North America, in: The Quaternary Period in the United States, Developments in Quaternary Sciences, 1, 45–61, https://doi.org/10.1016/S1571-0866(03)01003-0, 2003.
Terasmae, J.: Some problems of late Wisconsin history and geochronology in southeastern Ontario, Can. J. Earth Sci., 17, 361–381, https://doi.org/10.1139/e80-035, 1980.
Tulenko, J. P., Lofverstrom, M., and Briner, J. P.: Ice sheet influence on atmospheric circulation explains the patterns of Pleistocene alpine glacier records in North America, Earth Planet. Sc. Lett., 534, 116115, https://doi.org/10.1016/j.epsl.2020.116115, 2020.
US Geological Survey: FGDC Digital Cartographic Standard for Geologic Map Symbolization (PostScript Implementation), http://pubs.usgs.gov/tm/2006/11A02/ (28 September 2021), 2006.
Vogel, J. S., Southon, J. R., Nelson, D. E., and Brown, T. A.: Performance of catalytically condensed carbon for use in accelerator mass spectrometry, Nucl. Instrum. Meth. B, 5, 289–293, https://doi.org/10.1016/0168-583X(84)90529-9, 1984.
Wang, Y. and Wooller, M. J.: The stable isotopic (C and N) composition of modern plants and lichens from northern Iceland: with ecological and paleoenvironmental implications, Jökull, 56, 27–38, 10.33799/jokull2006.56.027, 2006.
Watson, B. I., Williams, J. W., Russell, J. M., Jackson, S. T., Shane, L., and Lowell, T. V.: Temperature variations in the southern Great Lakes during the last deglaciation: Comparison between pollen and GDGT proxies, Quaternary Sci. Rev., 182, 78–92, https://doi.org/10.1016/j.quascirev.2017.12.011, 2018.
Yansa, C. H., Fulton, A. E., Schaetzl, R. J., Kettle, J. M., and Arbogast, A. F.: Interpreting basal sediments and plant fossils in kettle lakes: insights from Silver Lake, Michigan, USA, Can. J. Earth Sci., 57, 292–305, https://doi.org/10.1139/cjes-2018-0338, 2020.
Young, R. A., Gordon, L. M., Owen, L. A., Huot, S., and Zerfas, T. D.: Evidence for a late glacial advance near the beginning of the Younger Dryas in western New York State: An event postdating the record for local Laurentide ice sheet recession, Geosphere, 17, 271–305, https://doi.org/10.1130/GES02257.1, 2020.
Yu, Z.: Rapid response of forested vegetation to multiple climatic oscillations during the last deglaciation in the northeastern United States, Quaternary Res., 67, 297–303, https://doi.org/10.1016/j.yqres.2006.08.006, 2007.
Yu, Z. and Eicher, U.: Abrupt Climate Oscillations During the Last Deglaciation in Central North America, Science, 282, 2235–2238, https://doi.org/10.1126/science.282.5397.2235, 1998.