the Creative Commons Attribution 4.0 License.
the Creative Commons Attribution 4.0 License.
 | 15 May 2025
40Ar ∕ 39Ar age constraints on the formation of fluid-rich quartz veins from the NW Rhenohercynian zone (Rursee area, Germany)
Akbar Aydin Oglu Huseynov
Jan Wijbrans
Klaudia Kuiper
Jeroen van der Lubbe
A substantial part of the subsurface geology in northwestern and central Europe is defined by the late Palaeozoic Variscan Orogeny (∼ 350 Ma). Our focus is mainly on veining in anchimetamorphic sedimentary rocks affected by this orogeny. Mineral veins serve as repositories for documenting the origin of subsurface fluid flows and dynamics, and dating them may provide crucial insight into the timing of orogenic and possible reactivation events. The Rursee area (Rhenish Massif, Germany), part of the Variscan foreland zone on the Avalonia microcontinent, represents a key locality for studying Variscan quartz vein formation. Based on structural grounds, two groups/types of Rursee quartz veins have been linked with the early stages of Variscan, but their absolute ages are still unknown.
The aim of this study is to date these quartz veins using the 40Ar 39Ar stepwise crushing method based on the radioactive decay of 40K dissolved in high-salinity fluid inclusions. We obtained Jurassic to Cretaceous ages, and isotopic analysis of the argon gases revealed that the fluid-rich quartz fractions release 39Ar in two distinct phases. Regardless of the salinity of fluid inclusions in quartz veins, stepwise crushing provides apparent K Cl > 1. Electron probe micro-analyser data confirm the presence of K (39Ar) in the K-bearing mineral inclusions (e.g. sericite, white mica, and chlorite) and microcracks and possibly in the crystal lattice of quartz.
Secondary fluid inclusions or K-bearing mineral inclusions and/or the crystal lattice of quartz, which formed subsequently in the Variscan vein fractures, provide a plausible explanation for the young apparent isotopic ages. Deformation-induced quartz sub-grains may suggest that obtained maximum apparent ages are likely to reflect post-Variscan fluid-assisted reactivation–recrystallization due to tectonic activity or its cooling moment during the Jurassic–Cretaceous period rather than the original Variscan vein formation.
- Article
(15897 KB) - Full-text XML
-
Supplement
(3886 KB) - BibTeX
- EndNote


Quartz veins are abundant in metamorphosed terranes and sedimentary basins filled with siliciclastic sediments, witnessing significant fluid movement during diagenesis and metamorphism (Yardley, 1983; Mullis et al., 1994; Cartwright and Buick, 2000; Oliver and Bons, 2001). An increase in both temperature and pressure during burial diagenesis, orogenesis, and deformation causes sedimentary and volcanic rocks to lose their volatile components and to release warm fluids, which cumulate minerals in fractures and faults (Baumgartner and Ferry, 1991; Yardley and Bottrell, 1993; Oliver and Bons, 2001; Cox, 2007). These often saline fluids contain, among others, KCl (aq) or K2CO3 (aq) (Rauchenstein-Martinek et al., 2014), which are partly precipitated during the crystallization of minerals in veins or as inclusions in these minerals (Sterner et al., 1988). One of the isotopes of potassium, 40K, is radioactive and can be used for K–Ar or its derivative, 40Ar 39Ar dating. Progressive crushing techniques enable the liberation of gases from fluid inclusions, mineral inclusions, and/or crystal lattice for the age determination of geological events provided that K concentrations are high enough (Qiu and Dai, 1989; Turner and Bannon, 1992; Turner and Wang, 1992; Qiu, 1996; Kendrick et al., 2001; Qiu and Wijbrans, 2006; Kendrick et al., 2006; Qiu and Wijbrans, 2008; Qiu and Jiang, 2007; Jiang et al., 2012; Bai et al., 2013; Liu et al., 2015). This method not only defines an age but also quantifies the ratio of noble gases (e.g. 39ArK 37ArCa, 39ArK 38ArCl) derived from Ca, K, and Cl, respectively, that have been formed during neutron radiation before analysis. The 39ArK 38ArCl provides crucial information on the composition of parental fluids and their sources (Sumino et al., 2011; Cartwright et al., 2013). Beyond studies on fluid composition and provenance (Kelley et al., 1986; Turner and Bannon, 1992; Kendrick et al., 2001, 2006), the initial 40Ar 36Ar values of fluid inclusions in quartz can considerably vary and may be used to differentiate between meteoric-sourced water (∼ 298.6) (Ballentine et al., 2002; Ozima and Podosek, 2002) and deeper crustal or mantle-derived fluids (> 10 000; MORB > 40 000) (Burnard et al., 1997). Additionally, hydrothermal waters can present sub-atmospheric 40Ar 39Ar ratios, as can be deduced from inverse isochrons of fluid-altered rocks (e.g. 280–290; Baksi, 2007).
To accurately determine the age of fluid inclusions in quartz veins using the 40Ar 39Ar stepwise crushing method or the source of the fluid based on 40Ar 36Ar ratios, it is necessary to consider three distinct components of 40Ar, namely (1) radiogenic 40ArR or 40Ar*, which is produced in the sample itself through the radioactive decay of 40K, and (2) 40Ar that was initially trapped in the fluid inclusion, either as (2a) atmospheric 40ArA or (2b) excess 40ArE. The presence of 40ArE in fluid inclusions could be a challenge in determining accurate vein formation ages using the K–Ar dating technique (Rama et al., 1965). More recently, isochron diagrams using 40Ar 39Ar geochronology helped to overcome this issue (McKee et al., 1993; Qiu, 1996; Qiu et al., 2002). In addition to 40ArE, the origin of 39ArK (or K content) has been a topic of debate, with the possibility that the 39ArK (and thus K) may come from the dissolved salts in fluid inclusions, leaking from the crystal lattice during crushing (Kendrick et al., 2011), and/or from any K-bearing mineral inclusions trapped inside the crystals (Qiu and Wijbrans, 2006; Kendrick, 2007; Qiu and Wijbrans, 2009; Kendrick and Phillips, 2009).
This study aims (i) to determine the absolute age of quartz vein formation by analysing fluid inclusions using the stepwise crushing 40Ar 39Ar dating method, (ii) to elucidate the location of K in the vein minerals (e.g. fluid inclusions, mineral inclusions, and/or crystal lattice), and (iii) to identify when different K sources release their 39ArK through the examination of released argon gases during the crushing process and geochemical analysis of quartz mineral samples using an electron probe micro-analyser (EPMA).
Quartz samples were obtained from an outcrop near the Rursee in the upper reaches of the Rur River in the North Eifel region of western Germany. Detailed structural investigations of this area have been previously conducted by Van Noten et al. (2007), who differentiated quartz veins into two groups. The older generation of quartz veins, the so-called bedding-normal veins (BNVs), is assigned to the early stages of the Variscan Orogeny, and the second group, comprising bedding-parallel veins (BPVs), is linked to the main stage of the Variscan Orogeny. Absolute 40Ar 39Ar ages of fluid inclusions representing the age of quartz vein formation would allow us to better constrain the structural evolution and subsurface fluid flow during the Variscan Orogeny in northwestern Europe. Reliable 40Ar 39Ar age constraints of quartz vein formation would provide the opportunity to understand the timing and evolution of mountain building in analogue fold-and-thrust belts.
Geological setting
The Rhenohercynian fold-and-thrust belt, part of the Variscan, is primarily located in the Rhenish Massif in Germany and extends westward into the Ardennes, southwest England, and eastward to the Harz Mountains (Kötonik et al., 2018). The Ardennes allochthon (Fig. 1a), the western part of the Rhenish Massif, structurally comprises three main components: the Dinant fold-and-thrust belt, the lower Palaeozoic inliers, and the High-Ardenne Slate Belt (HASB). The HASB primarily consists of Lower Devonian metasediments, including the Rurberg (upper Pragian) and Heimbach (upper Pragian to lower Emsian) units.
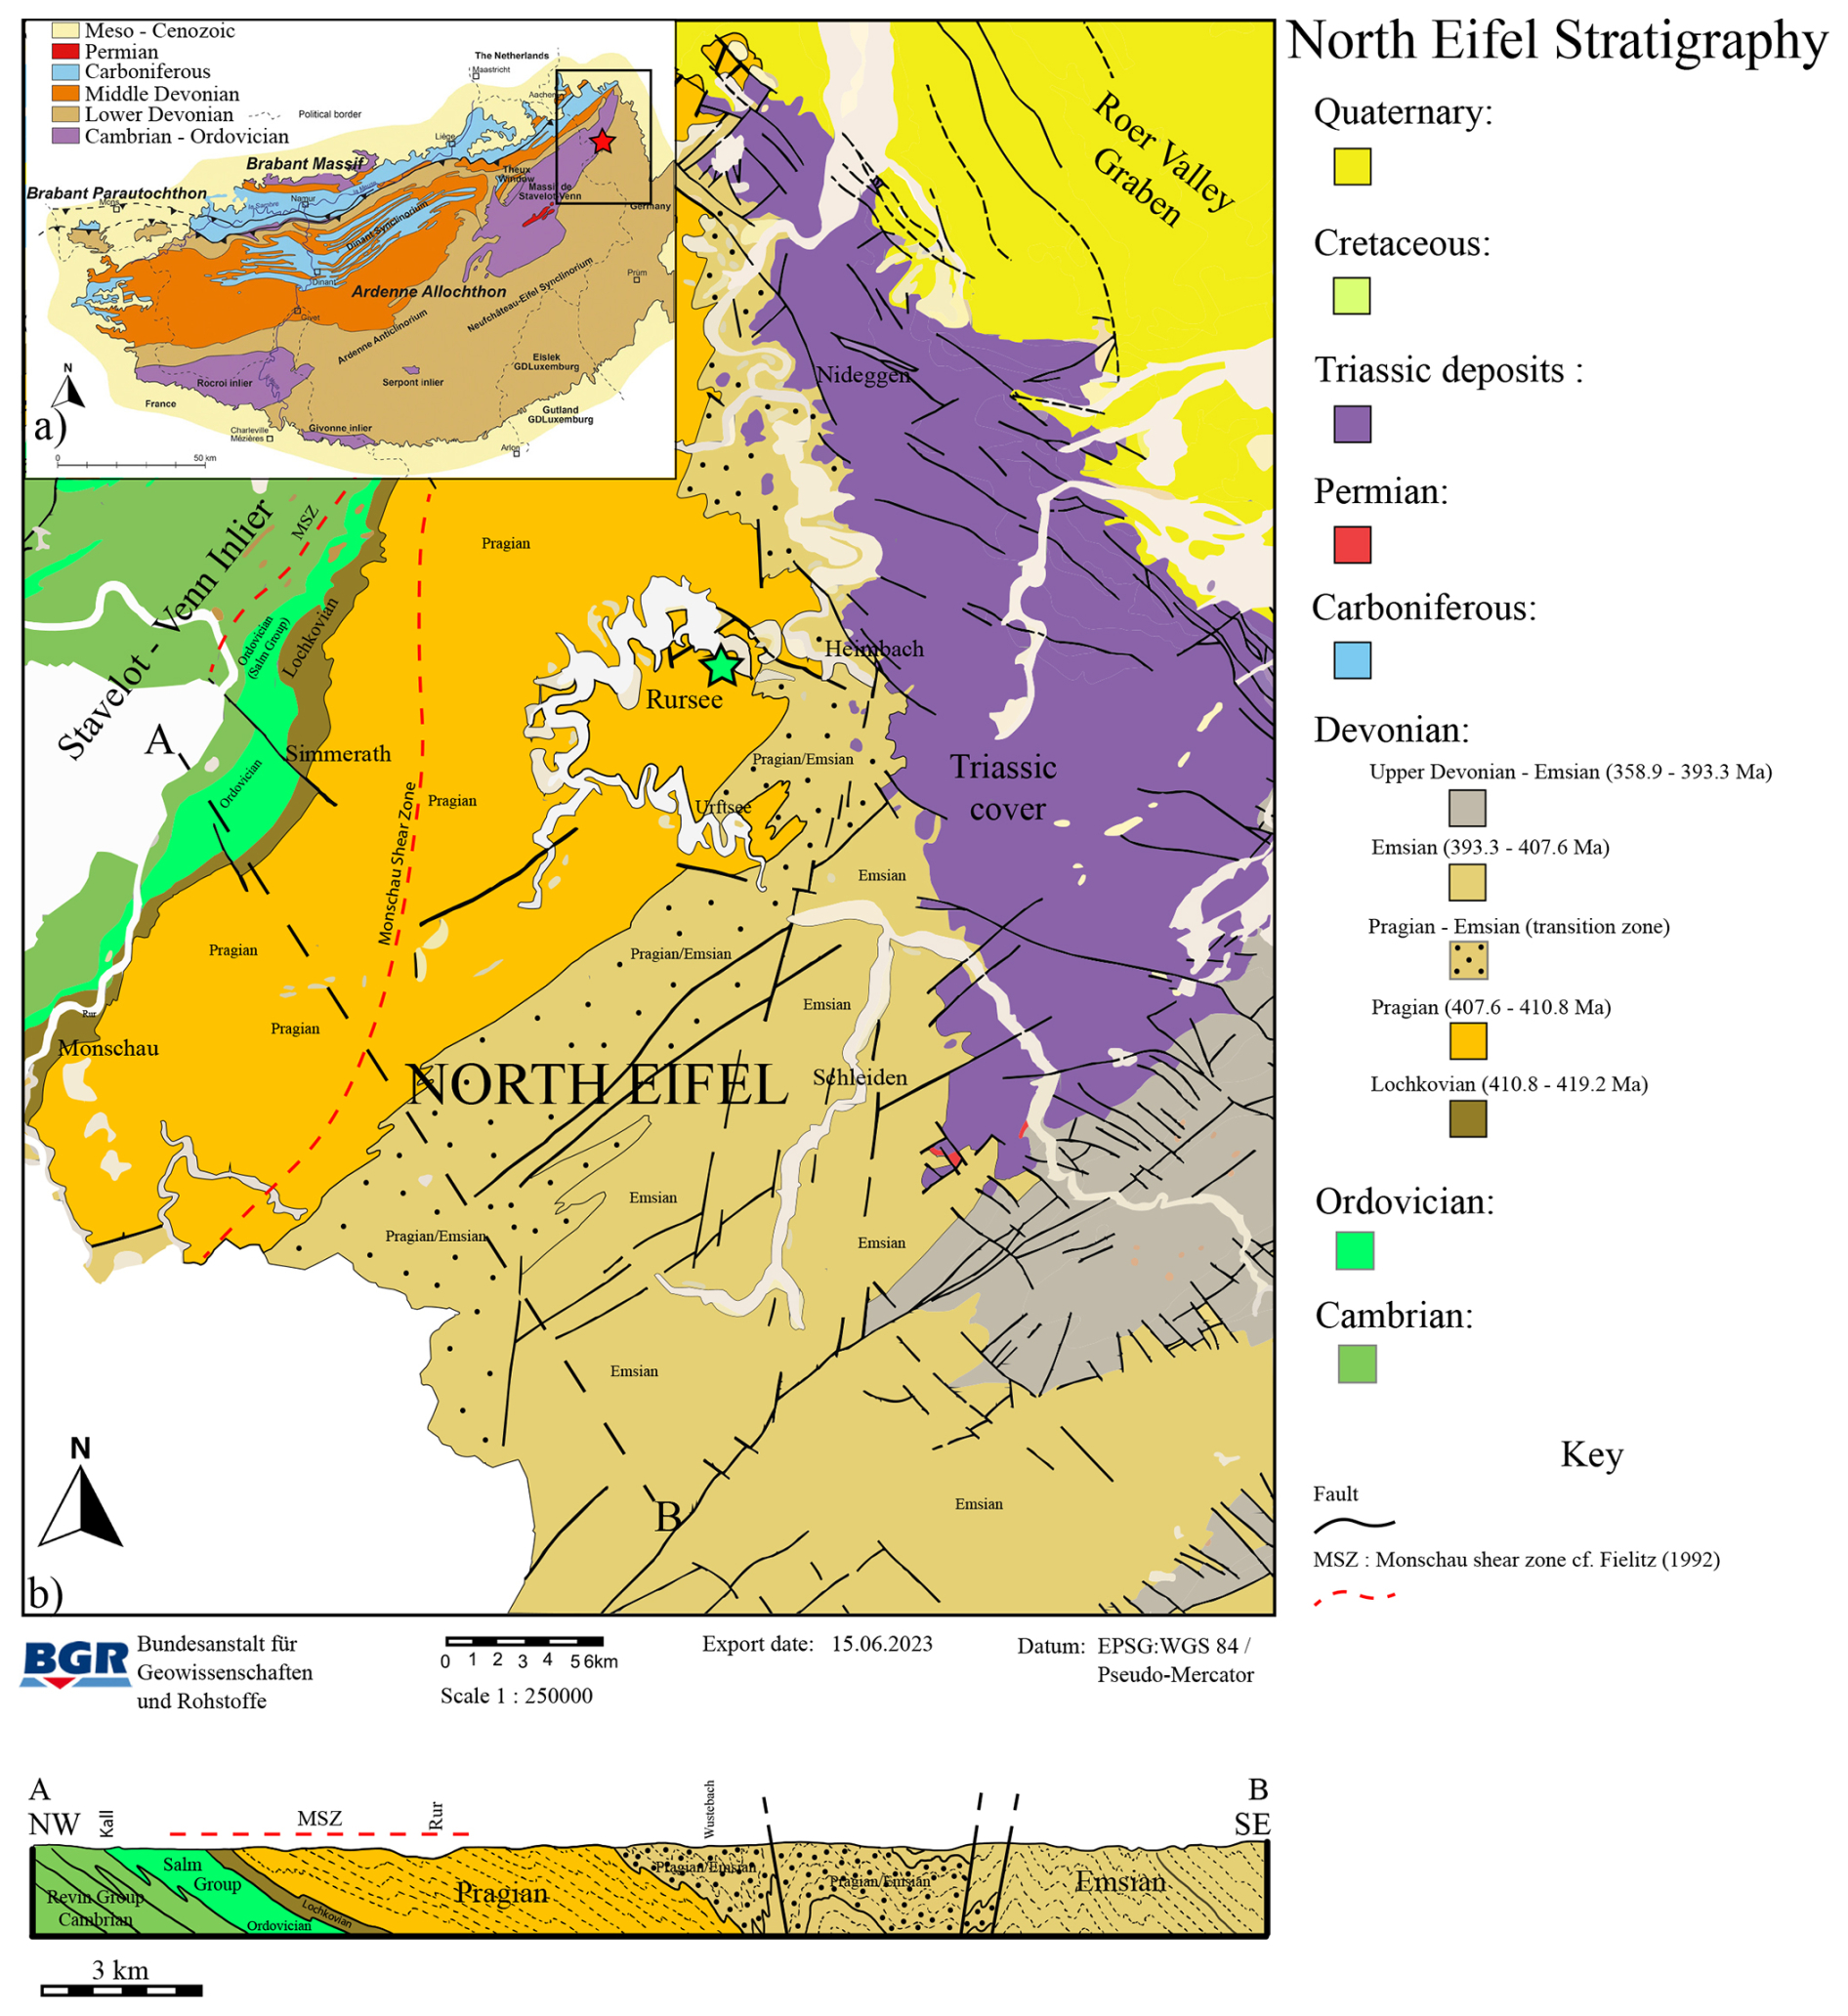
Figure 1(a) Geological map with the Variscan frontal zone in the Ardennes–Eiffel region (study area marked with a red star). (b) Geological map of the North Eifel region (modified after Ribbert et al., 1992; Van Noten et al., 2011). The Lower Devonian layers overlay metamorphic deposits of the lower Palaeozoic Stavelot–Venn inlier. These layers have been locally distorted in the Monschau Shear Zone (MSZ), as documented by Fielitz (1992). Triassic sediments overlay the Lower Devonian layers in the eastern region. The sample location, indicated by a green star, is situated next to the Rursee reservoir, which is near the Schwammenauel dam. Below, the cross-section illustrates the continuous northwest–southeast-trending overturned folds that characterize the North Eifel zone.
For this study, quartz vein samples were collected near the Schwammenauel dam in the Rursee area of the North Eifel region, Germany (Fig. 1b). The Rurberg and Heimbach units feature alternating layers of siltstones and fine- to coarse-grained sandstones (Goemaere and Dejonghe, 2005), deposited in shallow marine to deltaic environments in the northern Rhenohercynian Ocean (Oncken et al., 1999). The Early Devonian strata have accumulated to a total thickness of up to 7 km due to rapid subsidence and deposition (von Winterfeld, 1994), forming the Eifel syncline (Fig. 1b). These strata are overlain by a ∼ 3 km thick sequence of lower Lochkovian to Pragian deposits.
The late Carboniferous deformation of the Variscan foreland led to initial burial metamorphism (Mansy et al., 1999), with prehnite–pumpellyite facies similar to the anchizone conditions in the North Eifel area (Fielitz, 1995), where temperatures reached up to 220 °C (Littke et al., 2012). There is also evidence of the upward migration of warm fluids into the northern Variscan front in the Ardennes, driven by Variscan thrusting (Muchez et al., 2000; Schroyen and Muchez, 2000; Lünenschloss et al., 2008).
Following the Variscan period, the Rhenish Massif has been affected by transpressional and transtensional deformation that resulted in the formation of complex fault networks that host vein mineralization (Franzke and Anderle, 1995; Ziegler and Dèzes, 2005). During the Jurassic–Cretaceous period, the southern Rhenish Massif was periodically affected by hydrothermal activities (Kirnbauer et al., 2012), as indicated by geochronological data for post-Variscan vein mineralization (Bonhomme et al., 1983; Mertz et al., 1986; Bähr, 1987; Jakobus, 1992; Hein and Behr, 1994; Klügel, 1997; Schneider and Haack, 1997; Glasmacher et al., 1998; Schneider et al., 1999; Chatziliadou and Kramm, 2009).
The 40Ar 39Ar study targets the BNVs and BPVs (Fig. 2), which formed in low-grade metamorphosed (prehnite–pumpellyite facies) conditions as a result of the precipitates from warm fluids in fractures (Van Noten et al., 2008). The structural cross-cutting relationships between these quartz vein generations suggest that they originated from different geological events (Van Noten et al., 2008), revealing that BPVs are younger than BNVs. BNVs are mostly found within the competent psammite and hardly occur in incompetent pelitic layers. This positioning suggests that BNVs formed during the early stages of the Variscan Orogeny, associated with the final burial phases of the Ardennes–Eifel basin (Sintubin et al., 2000; Urai et al., 2001; Van Noten et al., 2008, 2009).
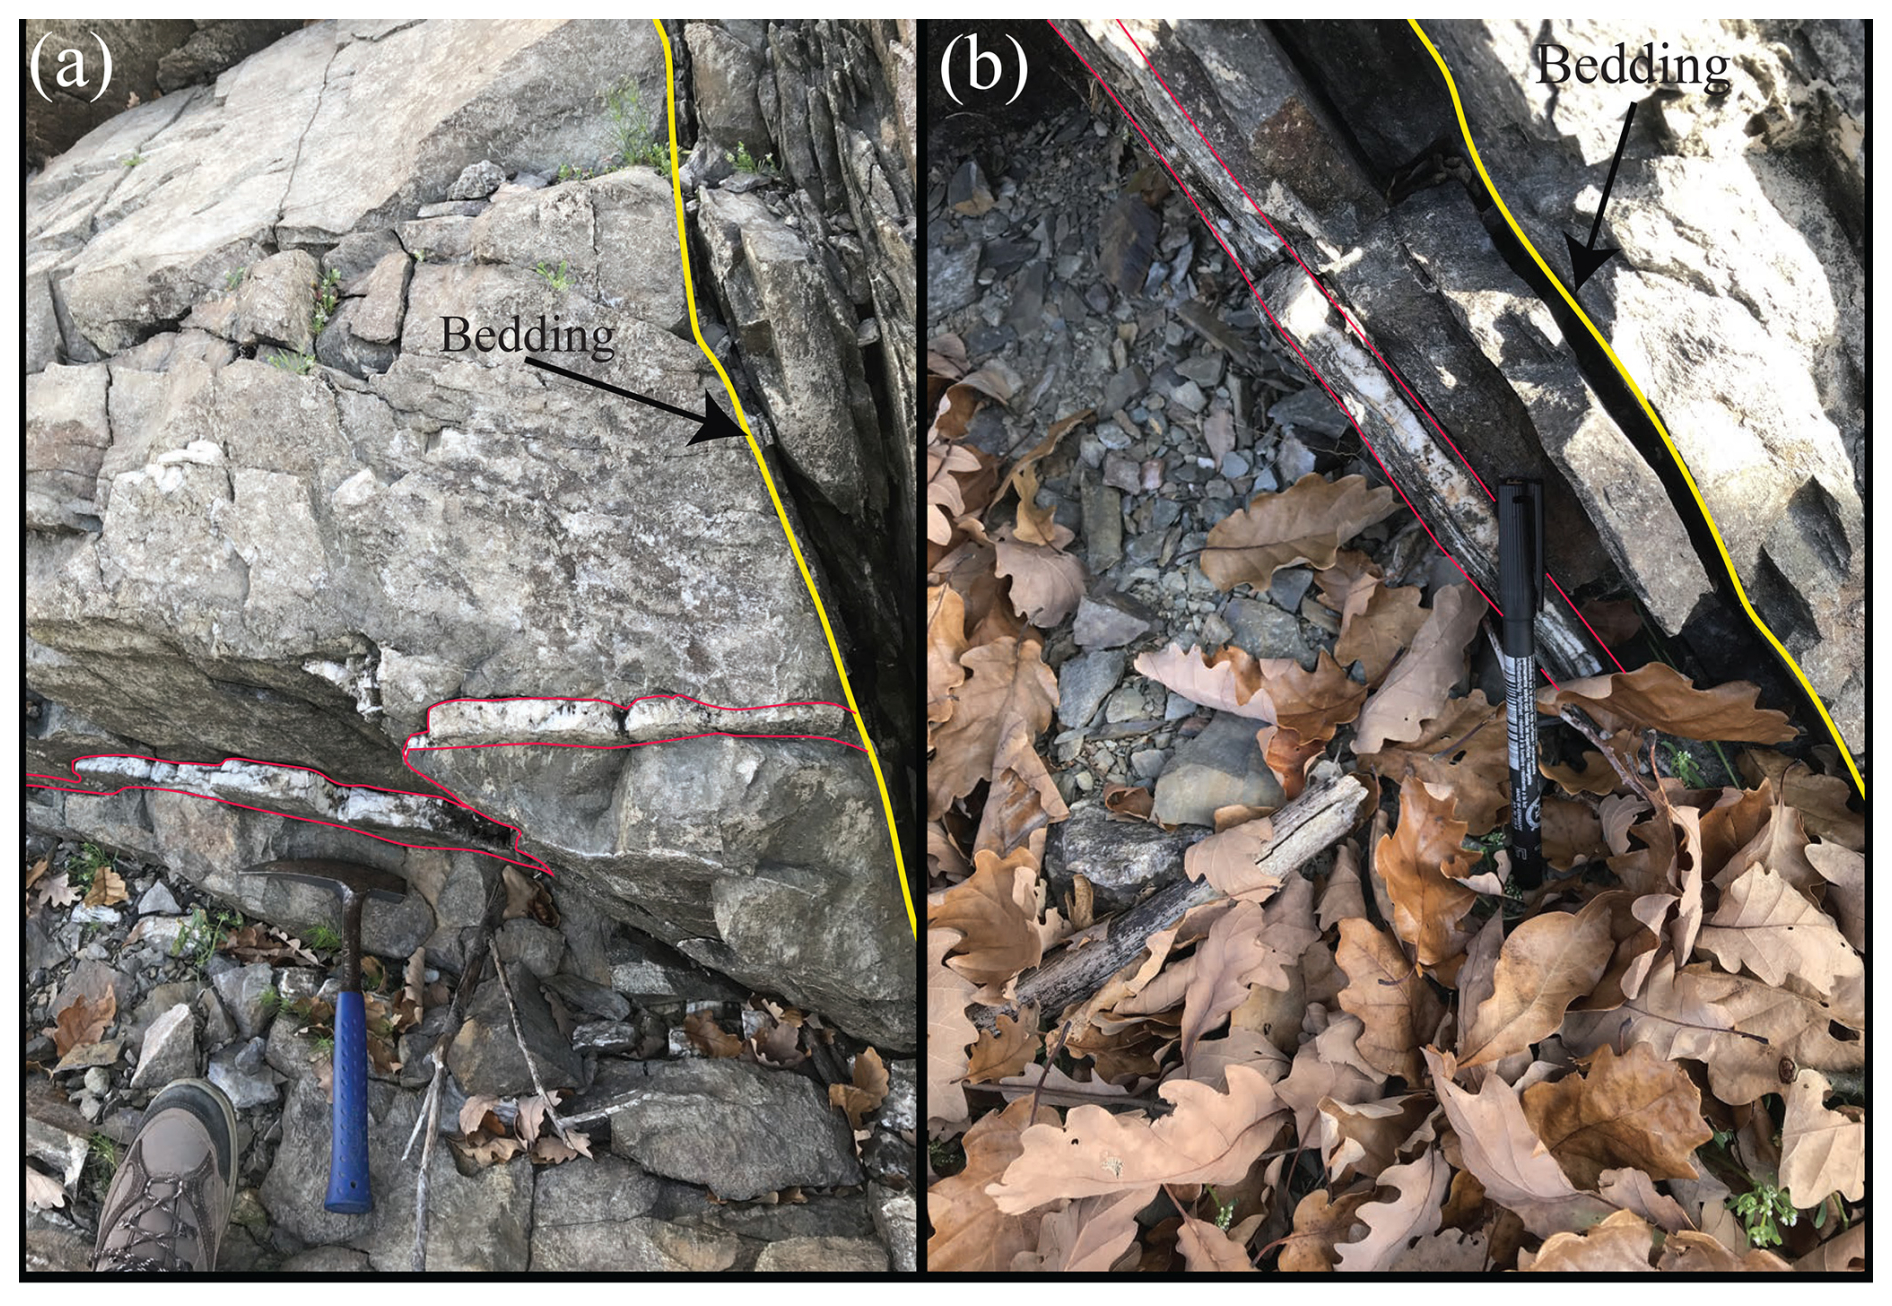
Figure 2Images of studied outcrops from the Rursee area. The image in (a) presents the bedding-normal veins (red lines), while panel (b) shows the bedding-parallel veins (red lines). Yellow lines indicate the bedding in both images.
In contrast, BPVs follow the strata between the psammatic and pelitic layers due to bedding-parallel slip caused by flexural folding during the Variscan Orogeny (Van Noten et al., 2008).
2.1 Quartz and inclusions in quartz minerals
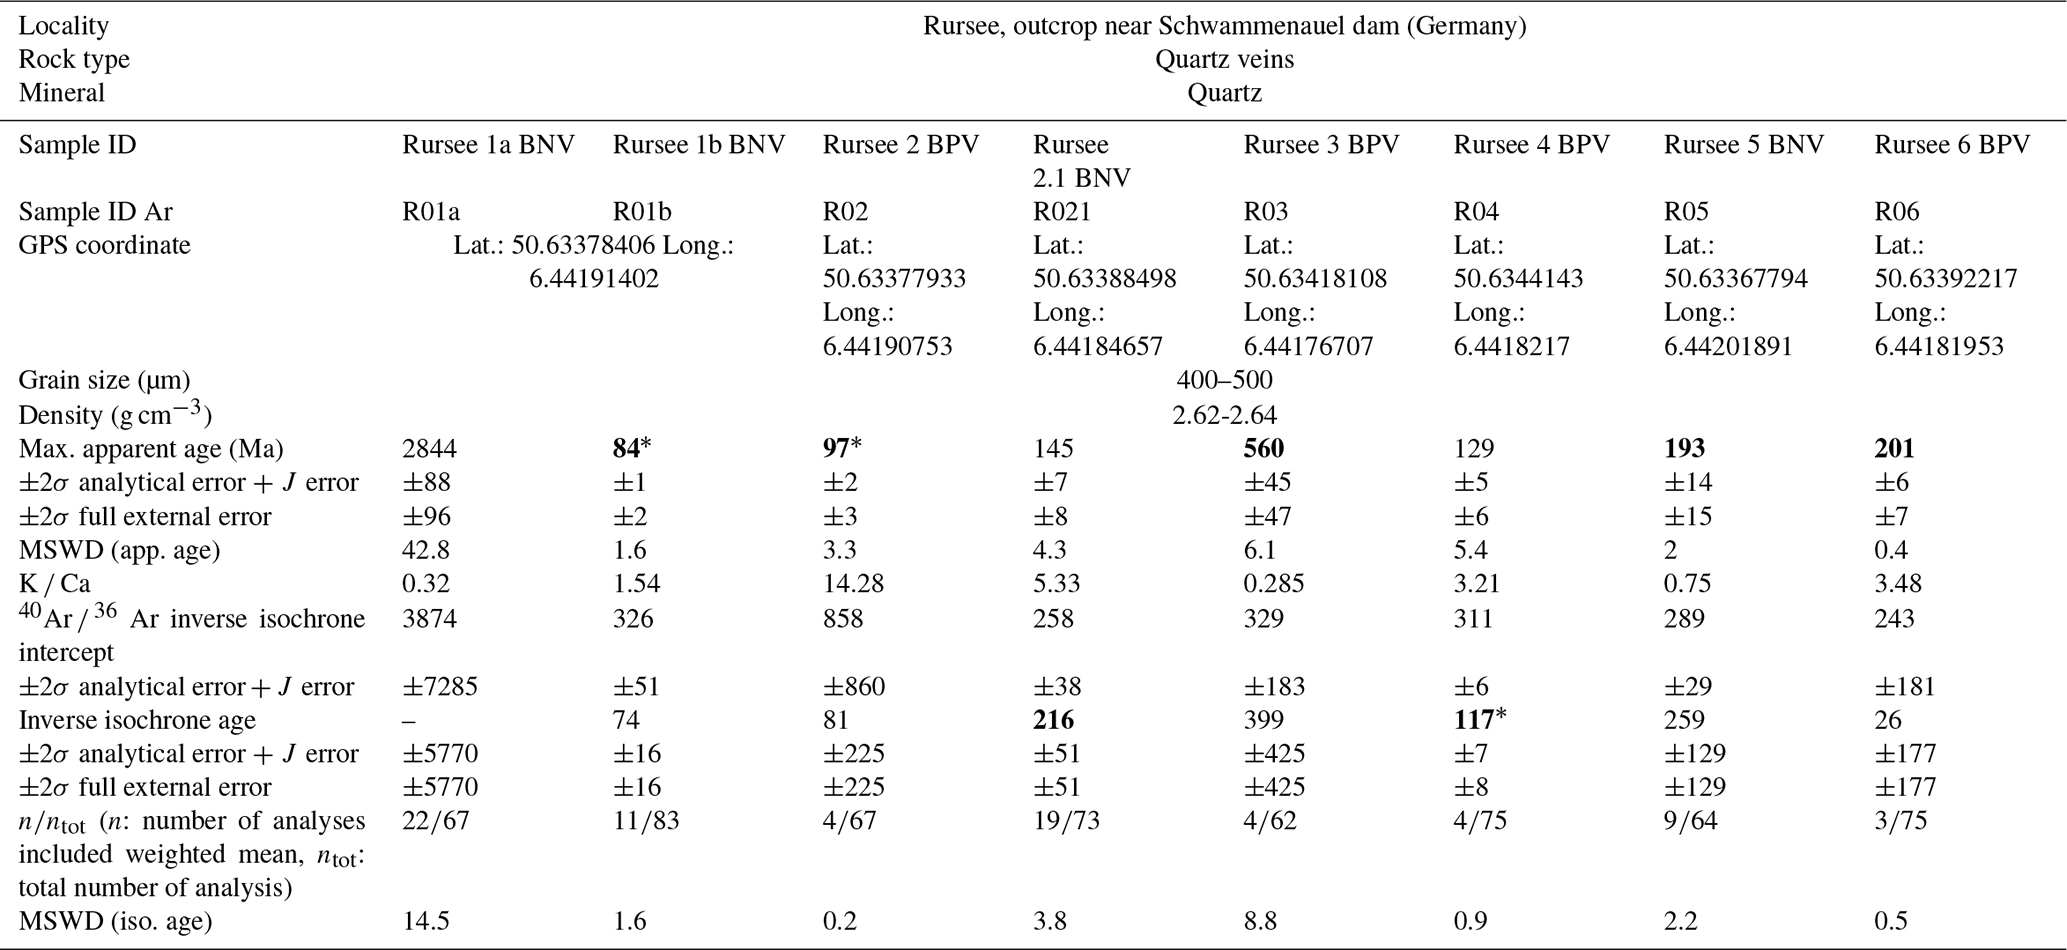
In total, seven samples of different veins (three BNVs and four BPVs) were collected from the Rursee outcrop for 40Ar 39Ar analysis (Table 1). Both vein types mainly consist of elongated-fibrous milky quartz grains that exhibit syntaxial growth, whereby the growth starts from the wall of the veins towards the central part of the veins (Ramsay, 1986). The pelitic host rock consists of sericite, illite, white mica, and chlorite. Chlorite is abundant within the vein fractures and between the host rock and the vein wall.
Table 1Summary of 40Ar 39Ar age spectra, including inverse isochron data of all analysed quartz samples. The maximum apparent ages of the late converging section and inverse isochron selected, as discussed in the text, are highlighted in bold, with an asterisk marking those used for geological interpretation.
Both quartz vein generations lack primary fluid inclusions in the crystal growth zones and contain pseudo-secondary and secondary fluid inclusions (FIs) (< 10 µm) (Van Noten et al., 2011) in the sealed microcracks being perpendicular to crystal elongation (Fig. 3). The Rursee quartz vein samples yield average fluid inclusions homogenization temperatures (minimum trapping temperature, Th) of ∼ 135 ± 25 and ∼ 160 ± 20 °C for BPV and BNV, respectively, with salinities of 3.5–8 eq. wt % NaCl. The Th values of pseudo-secondary and secondary fluid inclusions cover an equally broad range of 110–180 °C (Van Noten et al., 2011).
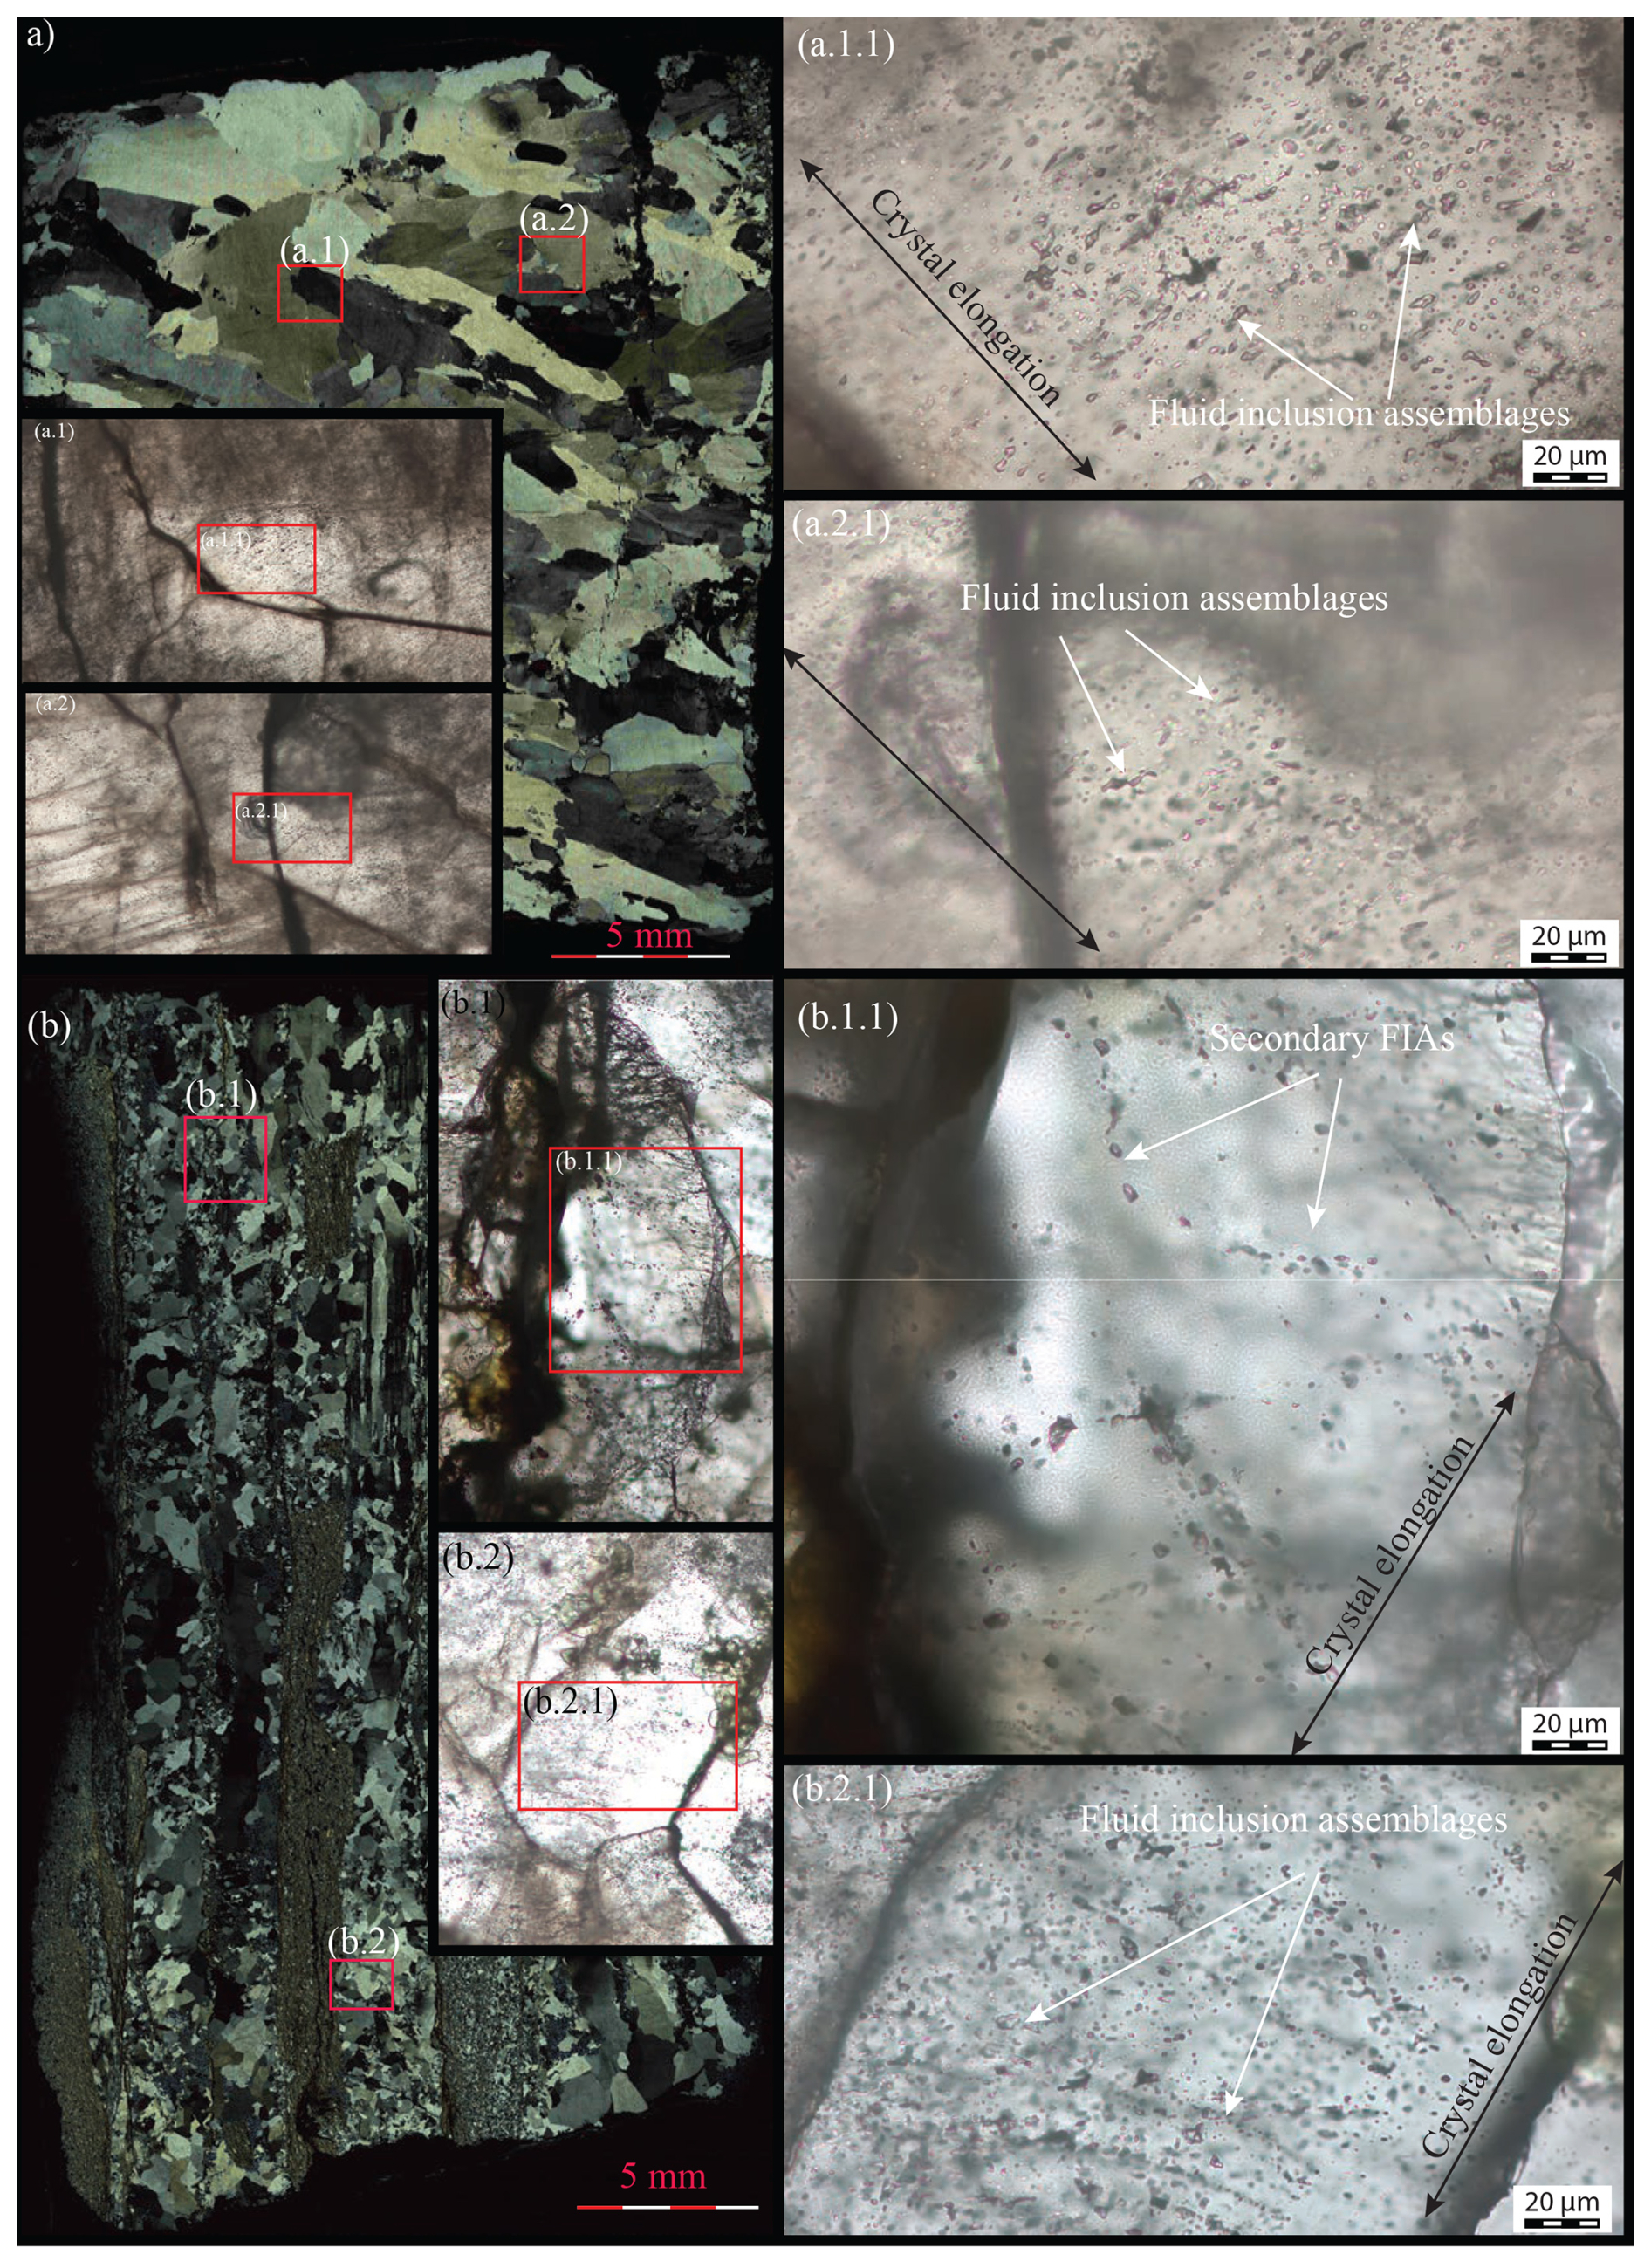
Figure 3Fluid inclusions in quartz veins under optical microscopy. (a) Image of BNVs under crossed polarizer light microscopy. Both (a.1.1) and (a.2.1) are the zoomed-in view of the images in (a.1) and (a.2), respectively, indicating pseudo-secondary fluid inclusions. (b) Crossed polarizer images of the BPV sample under microscopy. The images in (b.1.1) and (b.2.1) are areas focused on secondary and pseudo-secondary fluid inclusion (respectively), which are zoomed-in views of the images in (b.1) and (b.2), respectively. The white arrows represent the fluid inclusion assemblages (FIAs). Both generations of quartz veins bear FIAs in sealed microcracks rather than in crystal growth zones.
2.2 Mineral separation
Before 40Ar 39Ar analysis, mineral separation was conducted at Vrije Universiteit Amsterdam (VU; The Netherlands). The bulk vein samples were crushed, washed, and cleaned in an ultrasonic bath for at least 1 h to remove the adhering host rock contaminants from quartz grains. The samples were sieved into 250 and 500 µm fractions and dried in an oven at 60 °C. The samples were further separated by a custom-made system using an overflow centrifuge with conventional heavy liquids based on IJlst (1973) and Frantz magnetic separation (Porat, 2006). We used heavy liquids with a density of 2.62 and 2.64 g cm−3 to obtain a fluid inclusion-rich fraction of quartz grains (ρ= 2.62–2.64 g cm−3). The fraction was rinsed with acetone, dried, and further sieved to separate the 400–500 µm grain size range. From this fraction, only the purest quartz grains were handpicked under a binocular microscope for 40Ar 39Ar dating.
2.3 40Ar 39Ar stepwise crushing
Fluid-rich quartz grains (400–500 µm; 2.62–2.64 g cm−3) were carefully selected under a binocular zoom microscope, and a quantity of 200–270 mg of material was packed in aluminium foil and placed in 20 mm i.d.–22 mm o.d. aluminium cups. Drachenfels (DRA-2) sanidine standard was loaded after each three samples to monitor the neutron flux. The samples were irradiated at Oregon State University (USA) using the CLICIT (Cadmium-Lined In-Core Irradiation Tube) facility for 12 h (batch VU123). After irradiation, standards were placed in 2 mm copper planchet holes for single grain fusion analysis and pre-baked in a vacuum at 250 °C. The samples were then placed in an ultra-high vacuum system; baked at 120 °C; and connected with hot NP10 and ST172 getters, a Ti getter sponge at 400 °C, and a cold trap at −70 °C. The standards were fused with a Synrad 48-5 CO2 continuous-wave laser fusion system.
The samples were crushed in an in-house developed and built crusher consisting of a stainless-steel tube (height: 18 cm, outer diameter: 1.8 cm) that has a spherical curve on its interior base and a magnetic stainless-steel pestle (height: 5 cm, diameter: 1.6 cm, weight: ∼ 69.5 g) with rounded tips with a slightly narrower outer radius. These geometries allow optimization of the impact on the sample while crushing. Once a split of the sample (∼ 30 mg of quartz grains) was loaded into the crusher tube, the pestle was carefully relocated to the bottom of the tube to avoid crushing the sample. The crush tube, the pestle, and the sample were baked overnight at 250 °C. The pestle was dropped into a free-fall state using an external electromagnet with a frequency of 1 Hz controlled by an adjustable power supply and pulse generator to crush the sample. The pestle was dropped from a height of ∼ 3, ∼ 4, or ∼ 5 cm in vacuo. Subsequently, the gases emitted from fluid inclusions in the fragmented quartz sample were analysed. To obtain a sufficient amount of argon in the mass spectrometer, the number of pestle drops per extraction step and drop height were systematically increased during the experiment, with a maximum of 999 drops per analysis (in total, ∼ 40 000 cumulated pestle drops per experiment).
The gas released from the samples and standards was analysed isotopically using a ThermoFisher Scientific Helix MC+ mass spectrometer. The Helix MC+ mass spectrometer is a 5-collector channel instrument, equipped with a total of 10 collectors, a Faraday (Far) collector optionally fitted with a 1012 or 1013 Ohm resistor amplifier, and a compact discrete dynode secondary electron multiplier (CDD-SEM) collector on each collector channel. Five collectors can be used at the same time to simultaneously collect the beam intensity signals of the five isotopes of argon. The H2 Faraday collector is employed to detect 40Ar using a 1013 Ohm amplifier. Similarly, the H1 CDD collector is used for the measurement of 39Ar (H1 Faraday was used for the runs on the DRA-2 sanidine standard because of the higher 39Ar signal), the AX CDD collector for 38Ar, the L1-CDD collector for 37Ar, and the L2 CDD collector for 36Ar.
Line blanks were measured after every three to four unknowns and subtracted from the succeeding sample data. Gain calibration is done by correcting for gain relative to the beam intensity measured on the AX CDD, using measurements of ∼ 50 fA (40Ar-measured beam intensities) pipettes of air on each cup, and mass discrimination corrections are made by measuring a series of ∼ 400 fA (40Ar-measured beam intensities) air pipettes roughly every 12 h. Raw data were processed using the ArArCALC software (Koppers, 2002). Ages are calculated relative to Drachenfels (DRA-2) sanidine of 25.552 ± 0.078 Ma (Wijbrans et al., 1995), which was recalibrated against Fish Canyon Tuff sanidine of 28.201 ± 0.023 Ma (Kuiper et al., 2008). The decay constants of Min et al. (2000) are used. The atmospheric 40Ar 36Ar ratio of 298.56 ± 0.31 is based on Lee et al. (2006). The correction factors for neutron interference reactions are (2.64 ± 0.02) × 10−4 for (36Ar 37Ar)Ca, (6.73 ± 0.04) for (39Ar 37Ar)Ca, (1.21 ± 0.003) for (38Ar 39Ar)K, and (8.6 ± 0.7) for (40Ar 39Ar)K. Gain correction factors and their standard errors (±1 SE) are 1.00162 ± 0.00028 for H2 Far, 0.97963 ± 0.00021 for H1 CDD, 0.99921 ± 0.00027 for L1 CDD, and 0.96163 ± 0.00064 for L2 CDD for data measured in 2022 (R2.1) and 1.00465 ± 0.00031 for H2 Far, 0.97033 ± 0.00027 for H1 CDD, 0.99824 ± 0.00033 for L1 CDD, and 0.96309 ± 0.00070 for L2 CDD for data measured in 2023 (R1–R6). The K Cl ratios are calculated by K Cl Ar 38Ar, with β= 0.06 derived from K Cl = ∼ 18.7 in GA1550 and 39ArK 38ArCl= ∼ 316 for a 12 h irradiation at the OSU Triga CLICIT facility. All errors are quoted at the 2σ level and include all analytical uncertainties (Table 1).
Please note that it is impossible to directly correct the crushing blank because we cannot perform the exact experiment without crushing sample material. We tested the blanks for each tube without sample material, following the identical procedures as for real experiments. With this approach, we have direct metal-to-metal contact during pestle drops, which might not be representative of a real sample. We did observe a substantial increase in background, with a higher number of drops and a higher drop level. Notably, the composition of this blank is similar to that of atmospheric argon. Therefore, we follow the approach that the 40Ar signal derived from the line blank (measured every three to four unknowns where we mimic the sample experiment but without the crushing/pestle drops) is subtracted from the measured 40Ar intensity. The real blank has an atmospheric 40Ar 36Ar ratio and is incorporated in the air corrections, leading to a lower radiogenic 40Ar* if the real blanks are relatively high.
2.4 Electron probe microanalysis
Quartz grains of sub-samples that were analysed for 40Ar 39Ar were mounted in epoxy resin and carbon-coated for the JEOL JXA-8530F Hyperprobe field emission electron probe micro-analyser (EPMA) at Utrecht Universiteit (UU; the Netherlands) to define the elemental compositions of (1) the host quartz; (2) minerals that are present in fluid inclusions, filled cavities, or fractures; and (3) mineral inclusions in the quartz. For this analysis, an accelerating voltage of 15 kV and a beam current of 8 nA for host rock (quartz) and 7 nA for mineral inclusions are used with beam sizes of 10 and 1 µm, respectively. The elements analysed are Si, Ti, Al, Fe, Mn, Ca, Na, K, P, Cl, F, Ba, and Zr. The data are calibrated using Icelandic rhyolite glass (ATHO-G) and basalt glass (KL2-G) standards that were measured with a beam size of 10 µm multiple times both before and after measurements of the samples.
The age spectra of the in vacuo stepwise crushing of the quartz samples are plotted in Fig. 4. All samples show typical release patterns with unrealistically old apparent ages (> 6 Ga) in the initial 10 % of 39ArK released. Note that samples Rursee 1a BNV and Rursee 1b BNV are measured in two different experiments on subsets from the same irradiated sample, yielding different results. A lighter pestle (68 g) has been used for the sample Rursee 1a BNV than for sample Rursee 1b BNV (69.5 g) and all other samples.
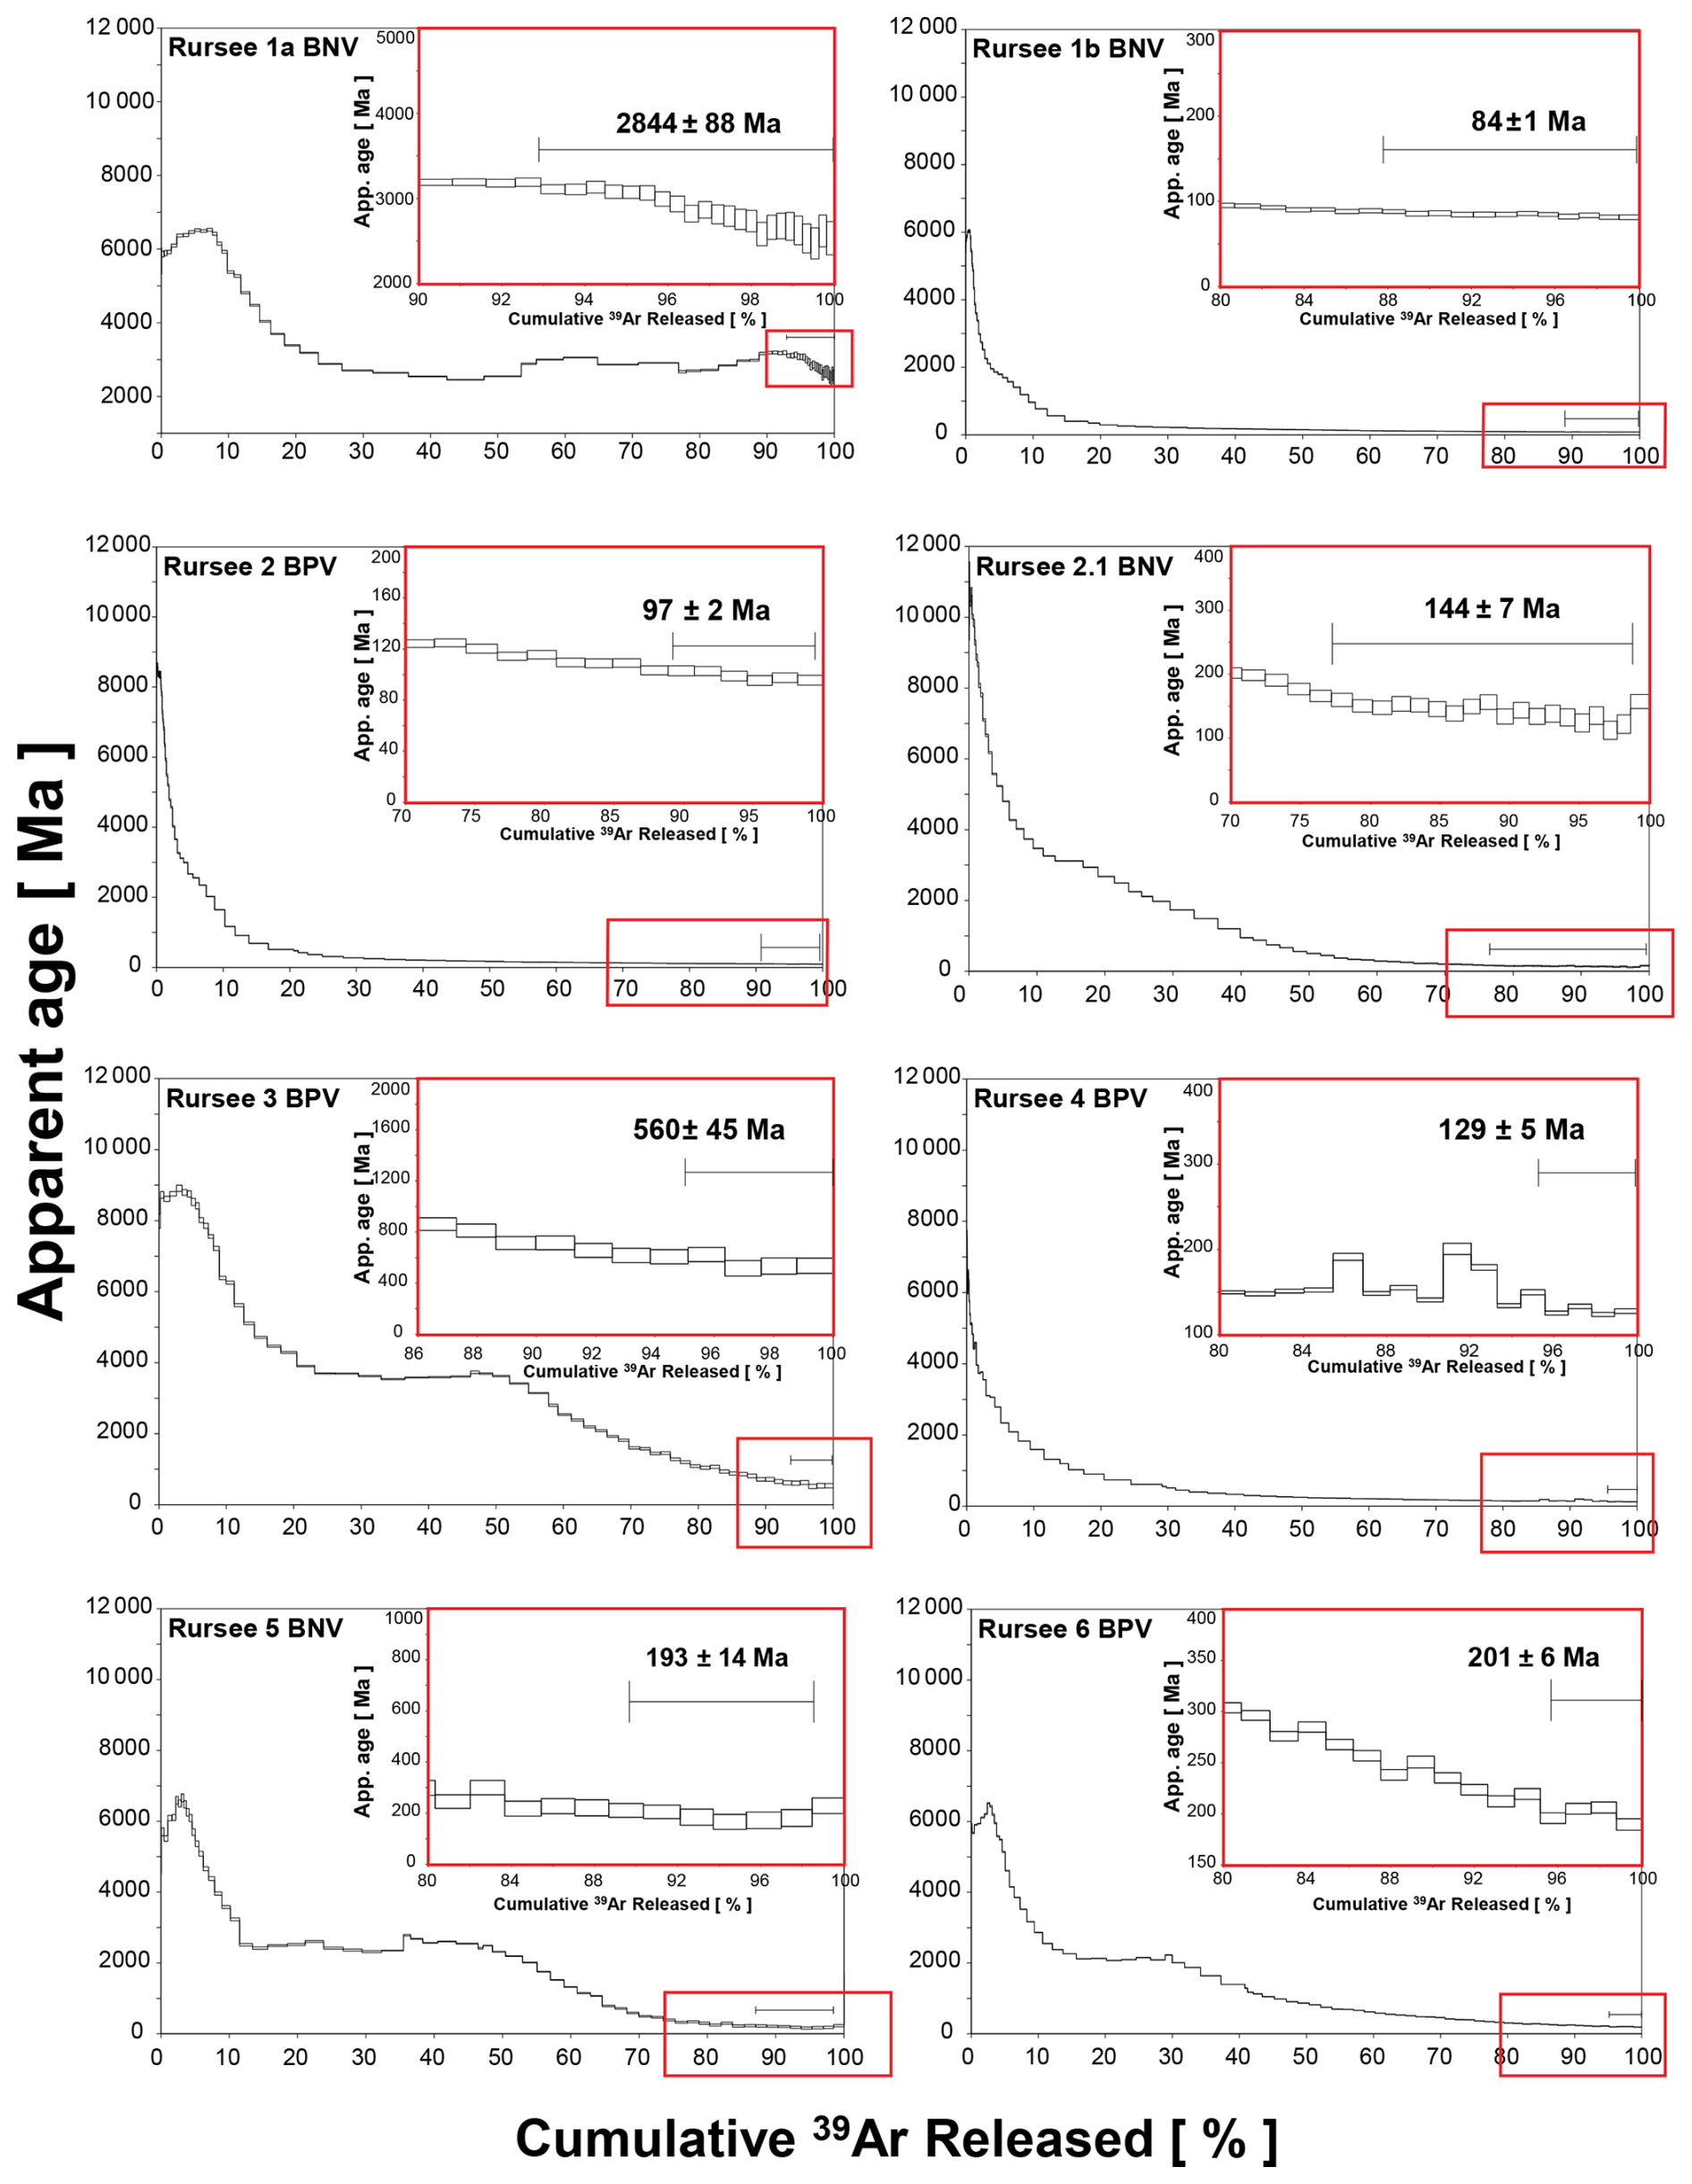
Figure 4The apparent late converging section age of all quartz vein experiments. The red boxes focus on the last part of the age spectra, where apparent ages are more or less stable.
The apparent ages of the spectra in samples Rursee 1b BNV, Rursee 2 BPV, Rursee 2.1 BNV, and Rursee 4 BPV exhibit a gradual decrease in age over the next 10 %–40 % of 39ArK released, eventually stabilizing at a more or less consistent maximum apparent age from ∼ 80 % 39ArK to ∼ 100 % 39ArK. Rursee 3 BPV, Rursee 5 BNV, and Rursee 6 BPV show comparable behaviour with, after the initial old apparent ages, a decrease in a maximum apparent age to an “early converging section” from ∼ 15 % to ∼ 40 % 39ArK released, followed by a gradual decrease in apparent age and a more or less uniform apparent age in the > 80 % released 39ArK part of the spectrum. For these early converging sections, we arrive at averaged maximum apparent ages of ∼ 84 Ma for Rursee 1b BNV, ∼ 97 Ma for Rursee 2 BPV, ∼ 117 Ma for Rursee 4 BPV, ∼ 216 Ma for Rursee 2.1 BNV, ∼ 190–200 Ma for Rursee 5 BNV and Rursee 6 BPV, and ∼ 560 Ma for Rursee 3 BPV. The maximum apparent ages of Rursee 2.1 BNV and Rursee 4 BPV correspond to the inverse isochron maximum apparent ages; however, due to significant uncertainty, the maximum apparent ages of other samples were obtained from the average “late converging section” age (Table 1).
The inverse isochrons (Fig. 5) confirm that the first part of all experiments is heavily affected by excess argon (36Ar 40Ar ratios are much lower than atmospheric composition), followed by an increase in 36Ar 40Ar and 39Ar 40Ar ratios and clustering of data points on the reference line. We derived maximum apparent ages from the data points that cluster along the reference line in the isochrons in the final part of the age spectra. There is no systematic maximum apparent age difference between BNV and BPV.
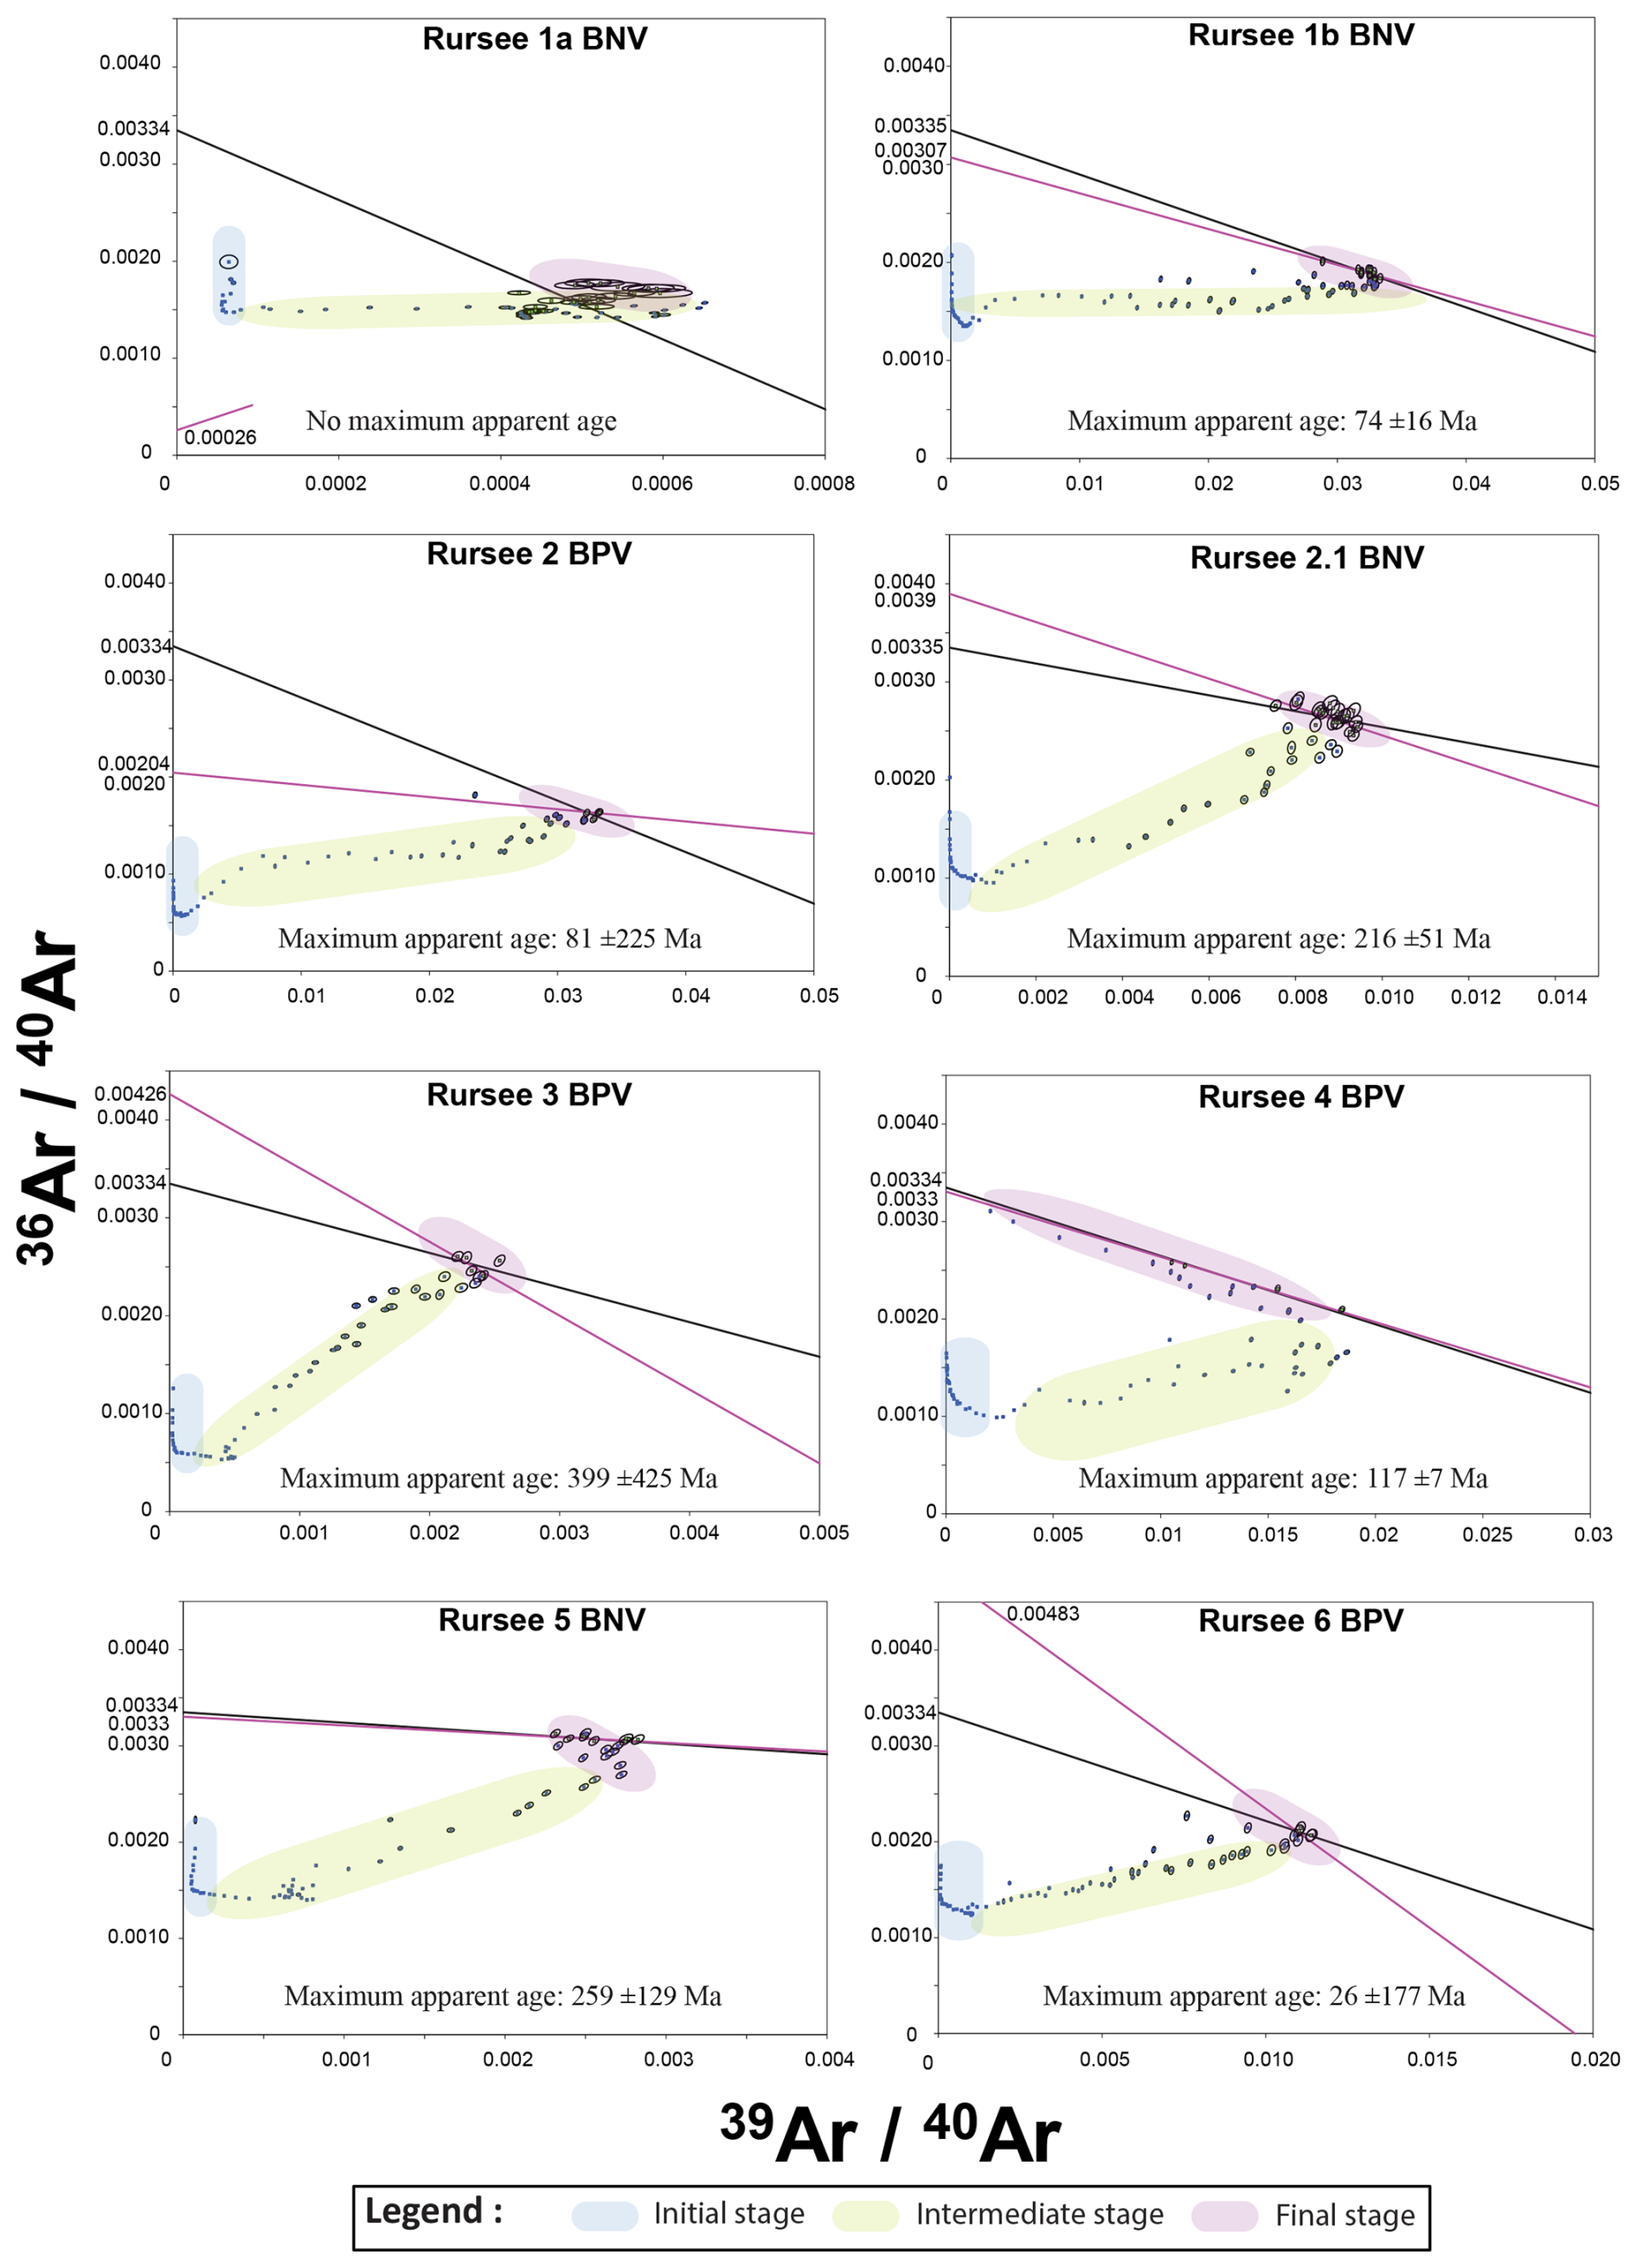
Figure 5Inverse isochrons of all quartz vein samples. The black line corresponds to a regression where the 40Ar 36Ar intercept with the vertical is fixed at the ratio of atmospheric argon, and hence its radiogenic intercept corresponds to the age obtained from a regression of the corresponding steps in the age spectrum, whereas the pink line represents a regression without this restriction, providing us with information on the actual 40Ar 36Ar ratio of non-radiogenic components in the fluid mixture.
All quartz samples release argon during in vacuo stepwise crushing with different isotopes of argon contributing to the gas release at different stages of the experiment. Figure 6 shows, for each step, the percentage (relative to the total amount) of a specific isotope released through the experiment. All quartz samples are characterized by a release of most of the 36Arair in the first 20 steps. 40Ar* and 38ArCl follow the pattern of 36Arair. The 39ArK generally increases after the first 20 analysing steps (∼ 790 pestle drops from 3 cm height). At steps 30–35, we observe fluctuations in the data. These shifts are artefacts caused by increasing the drop height (from 3 to 4 cm at ∼ step 30 and from 4 to 5 cm at ∼ step 35) and adjusting the number of pestle drops. To prevent high signals, we started with a relatively low number of pestle drops at a higher drop height, yielding low signals, as observed as two troughs at ∼ step 30 and ∼ step 35 in all experiments. All quartz samples are low in 36Arair, 38ArCl, and 40Ar* at the end of analysis compared to their total release. For 40Ar*, we still measure a small, reliable signal, but this is obscured in Fig. 6 due to the high signals in the first steps since we plot percentages of the total released 40Ar per experiment. Note that huge amounts of excess 40Ar (as part of the 40Ar* signal) are released in the initial steps of the experiment and dominate the total percentage.
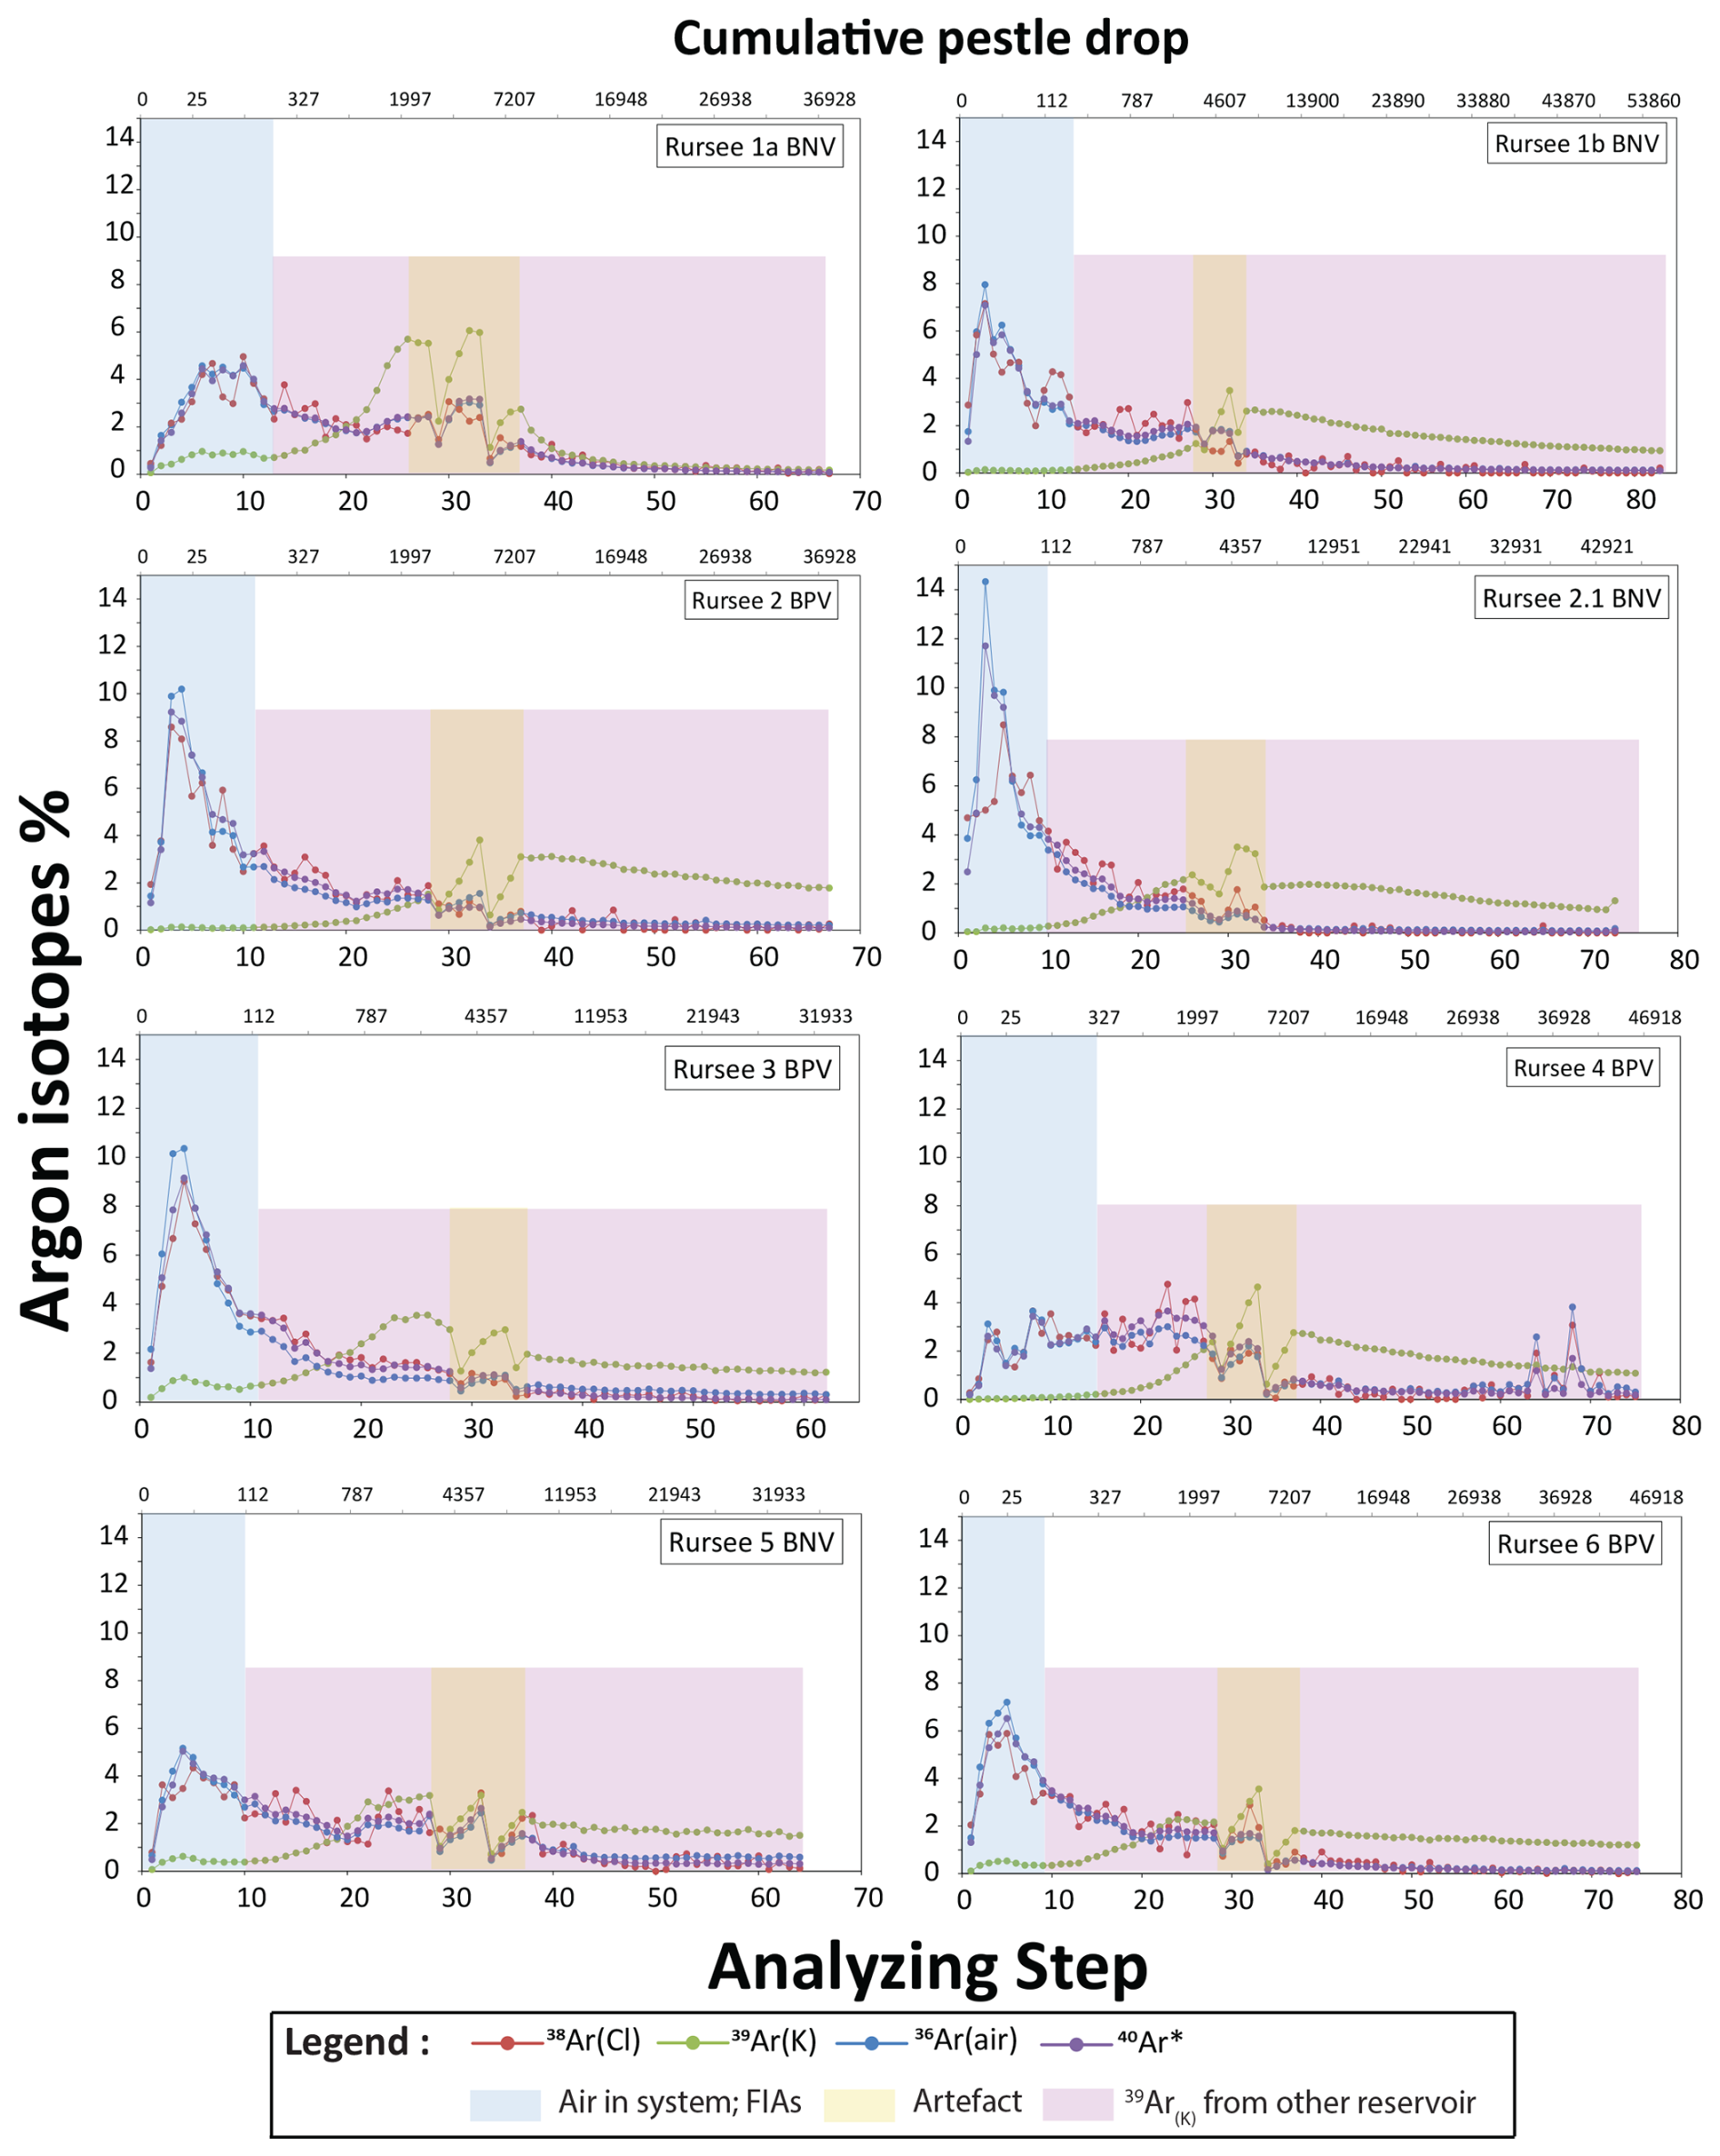
Figure 6Released argon isotopes per analysing step relative to their total release. Note that the data are expressed against the analysing steps instead of the crushing steps, and that the upper x-axis scaling (cumulative pestle drops) is neither linear nor logarithmic (non-continuous scaling).
During in vacuo stepwise crushing, the release of argon isotopes from the samples follows systematic patterns. The challenge is to link this release of argon from the samples to the different potential reservoirs of K and, as a next step, the geological meaning of the age and elemental ratios of K Cl and Ca Cl. Here, we first discuss potential issues related to the analytical quality of the data. Next, we discuss potential reservoirs of K and subsequently 40Ar* that need to be considered, evaluating the maximum apparent ages and their wider implications.
4.1 Data quality
4.1.1 Rursee 1a and 1b BNV
We speculate that for the Rursee 1a BNV experiment, we sampled a smaller part of the argon reservoirs in the quartz minerals comparable to the first 10 % of the spectrum of Rursee 1b BNV. This is corroborated by the fact that for Rursee 1a BNV, 46 mg of quartz released 12.7 fA 39ArK (0.3 fA mg−1 quartz), while for Rursee 1b BNV, 89.1 fA was released from 25 mg of quartz (3.6 fA mg−1 of quartz). We therefore do not further discuss the results of Rursee 1a BNV but note that sample heterogeneity might also have contributed to this difference.
4.1.2 Impact of blank correction
The blank correction procedure likely does not impact the weighted mean age computation; however, it does influence the 40Ar 36Ar intercept of the inverse isochron. This is only the case when the regression line has a non-radiogenic intercept that differs from the atmospheric 36Ar 40Ar. When the intercept is within the error overlapping with the atmospheric ratio, the blank correction only causes the point to move along the regression line, which comes out of the discussion below. We described our blank correction procedure in methods (Supplement file S1). The fact that we cannot mimic the dropping of the pestle when a sample is present in the tube limits how well we can determine the blank during the experiments. The blank tends to increase with a higher number of pestle drops, but the composition of this blank is atmospheric. For the test of the blank, we used quartz glass fragments to mimic zero-age minerals, as a blank determination using metal-on-metal impacts was considered to be an unrealistic scenario. As a next test, we artificially increase the 40Ar blank (and thus the 36Ar blank) assuming atmospheric composition. If the data are located on the mixing line between radiogenic and atmospheric argon, this should not affect the isochron apparent age (pink part – final stage in Figs. 5 and 11). We tested this for sample Rursee 1b BNV with an apparent age of ∼ 88 Ma. The 40Ar 36Ar intercepts increase with increasing blank values, and the weighted mean late converging section ages change with a maximum of 2.5 Ma in the chosen example. We therefore conclude that the isotopic ages remain largely unaffected by varying the amounts of atmospheric argon of the blanks. Note that if the isochron is not a mixing line between radiogenic and atmospheric argon (e.g. blue and green parts in Figs. 5 and 11), this assumption is incorrect. The 40Ar 36Ar intercept is then pulled away from the real 40Ar 36Ar composition in the direction of the atmospheric 40Ar 36Ar intercept. Consequently, the intercept with the inverse isochrons' x axis (and thus age) will also be affected.
4.1.3 Recoil artefacts
Recoil artefacts occur when 37Ar and 39Ar, which are formed from K and Ca isotopes, form with kinetic energy. As a result, they can travel from their original sites to other sites, potentially even into the adjacent phase (Turner and Cadogan, 1974; Foland, 1983; Lo and Onstott, 1989; Féraud and Courtillot, 1994; Baksi, 1994; Onstott et al., 1995; Villa, 1997). However, this phenomenon is assumed to have a smaller impact than the blank correction.
4.2 Potential reservoirs of K
To date, three main hypotheses have been debated about the origin of the released argon in a stepwise crushing experiment. The first group (Qiu and Wijbrans, 2006, 2008; Bai et al., 2019) suggests that progressive crushing releases gases mainly from fluid inclusions and therefore represents fluid inclusions maximum apparent ages. Additionally, there is a possibility of argon releasing within K minerals by prolonged crushing when the grain sizes are reduced to tens of nanometres (Bai et al., 2019).
The second group (e.g. Kendrick and Phillips, 2009) discusses the possibility of K-bearing mineral inclusions within the inclusion cavity and/or in microcracks serving as argon reservoirs in the later crushing stages. Obtained maximum apparent ages therefore represent mineral closure ages or a mixture of fluid inclusions and mineral inclusion ages. Accordingly, the gas release sequence under sufficient crushing progresses from microcracks to secondary fluid inclusions, followed by primary fluid inclusions, and finally to micro- to nanometre-sized minerals (Bai et al., 2022).
In addition, the third potential source of potassium in the minerals might be the presence of K+ in the crystal lattice, which was postulated for zeolites (Kendrick et al., 2011) but could also work for feldspars but may be less of an issue in nominally potassium-free minerals such as quartz (or garnet), which is representative of the formation age of veins. Hydrothermal quartz veins, characterized by their substitution in the crystal structure, have been studied by Weil (1984) and Götze et al. (2021). These studies indicate that Si4+ derived from hydrothermal quartz veins can be substituted by other ions such as Al3+, Ga3+, Fe3+, B3+, Ge4+, Ti4+, and P4+. Al3+ usually replaces Si4+ since it is found in significant amounts (∼ 300–700 ppm) in quartz, based on EPMA data. Additionally, small numbers of monovalent ions such as K+ may fill empty spaces in the crystal structure, serving as charge balancers for trivalent substitutional ions such as Al3+ (Bambauer, 1961; Kats, 1962; Perny et al., 1992; Stalder et al., 2017; Potrafke et al., 2019). However, Jourdan et al. (2009) postulated that substitutions of these components may be so minor that they are even undetectable using a secondary ion mass spectrometer (SIMS). Furthermore, it is important to note that not all hydrothermal sources or quartz minerals have this particular form of substitution (Jourdan et al., 2009).
Apart from these potential 39ArK reservoirs above, detrital minerals (e.g. mica present in the surrounding pelitic rock) that might be trapped by the quartz veins during the growth may also contribute to the obtained maximum apparent ages.
4.2.1 Identification of different K reservoirs in the Rursee quartz samples
During in vacuo stepwise crushing, the release of argon isotopes from the samples follows systematic patterns. In this study, we aim to connect this release to the sequential contributions of different reservoirs of K and, consequently, argon from the Rursee samples. The release patterns of 36Arair, 38ArCl, 39ArK, and 40Ar* (Fig. 6) for all quartz vein samples may originate from multiple existing argon reservoirs.
Depending on the size (< 10 µm), location, and generation of fluid inclusions, they may contribute successively to the argon release patterns in the early or middle stage of stepwise crushing. Figure 6 reveals that the concentration of 39ArK increases throughout the process of in vacuo stepwise crushing, while the concentration of other argon isotopes decreases. This suggests that K-containing reservoirs were not opened in the first part of the experiment. The release patterns of 39ArK can be categorized into two distinct groups during stepwise crushing.
The first group of samples shows a small initial release in the early stages. This is followed by a drop around the 10th step, then an increase from the ∼ 10th to ∼ 35th step, and finally a gradual decrease (Rursee 3 BPV, Rursee 5 BNV, and Rursee 6 BPV).
The second group does not have the 39ArK release in the steps 1–10 but after that it shows a similar pattern to the first group, gradually increasing until about the 35th step and then gradually decreasing (Rursee 1b BNV, Rursee 2 BPV, Rursee 2.1 BNV, and Rursee 4 BPV).
The continuous rise in 39ArK levels after ∼ 10 steps in both sample groups suggests that the gas release process can be divided into at least two phases. Initially, during the first ∼ 10 steps, 39ArK is emitted from fluid inclusions in microcracks (secondary fluid inclusions). From steps ∼ 10 to ∼ 70, the release happens as a result of the mixing of potential pseudo-secondary fluid inclusions (∼ 10th to ∼ 15th steps), mineral inclusions, and/or the crystal lattice of quartz veins. This interpretation is supported by the K Cl correlation plots (Fig. 7), which show a consistently lower K Cl ratio until the ∼ 10th step.
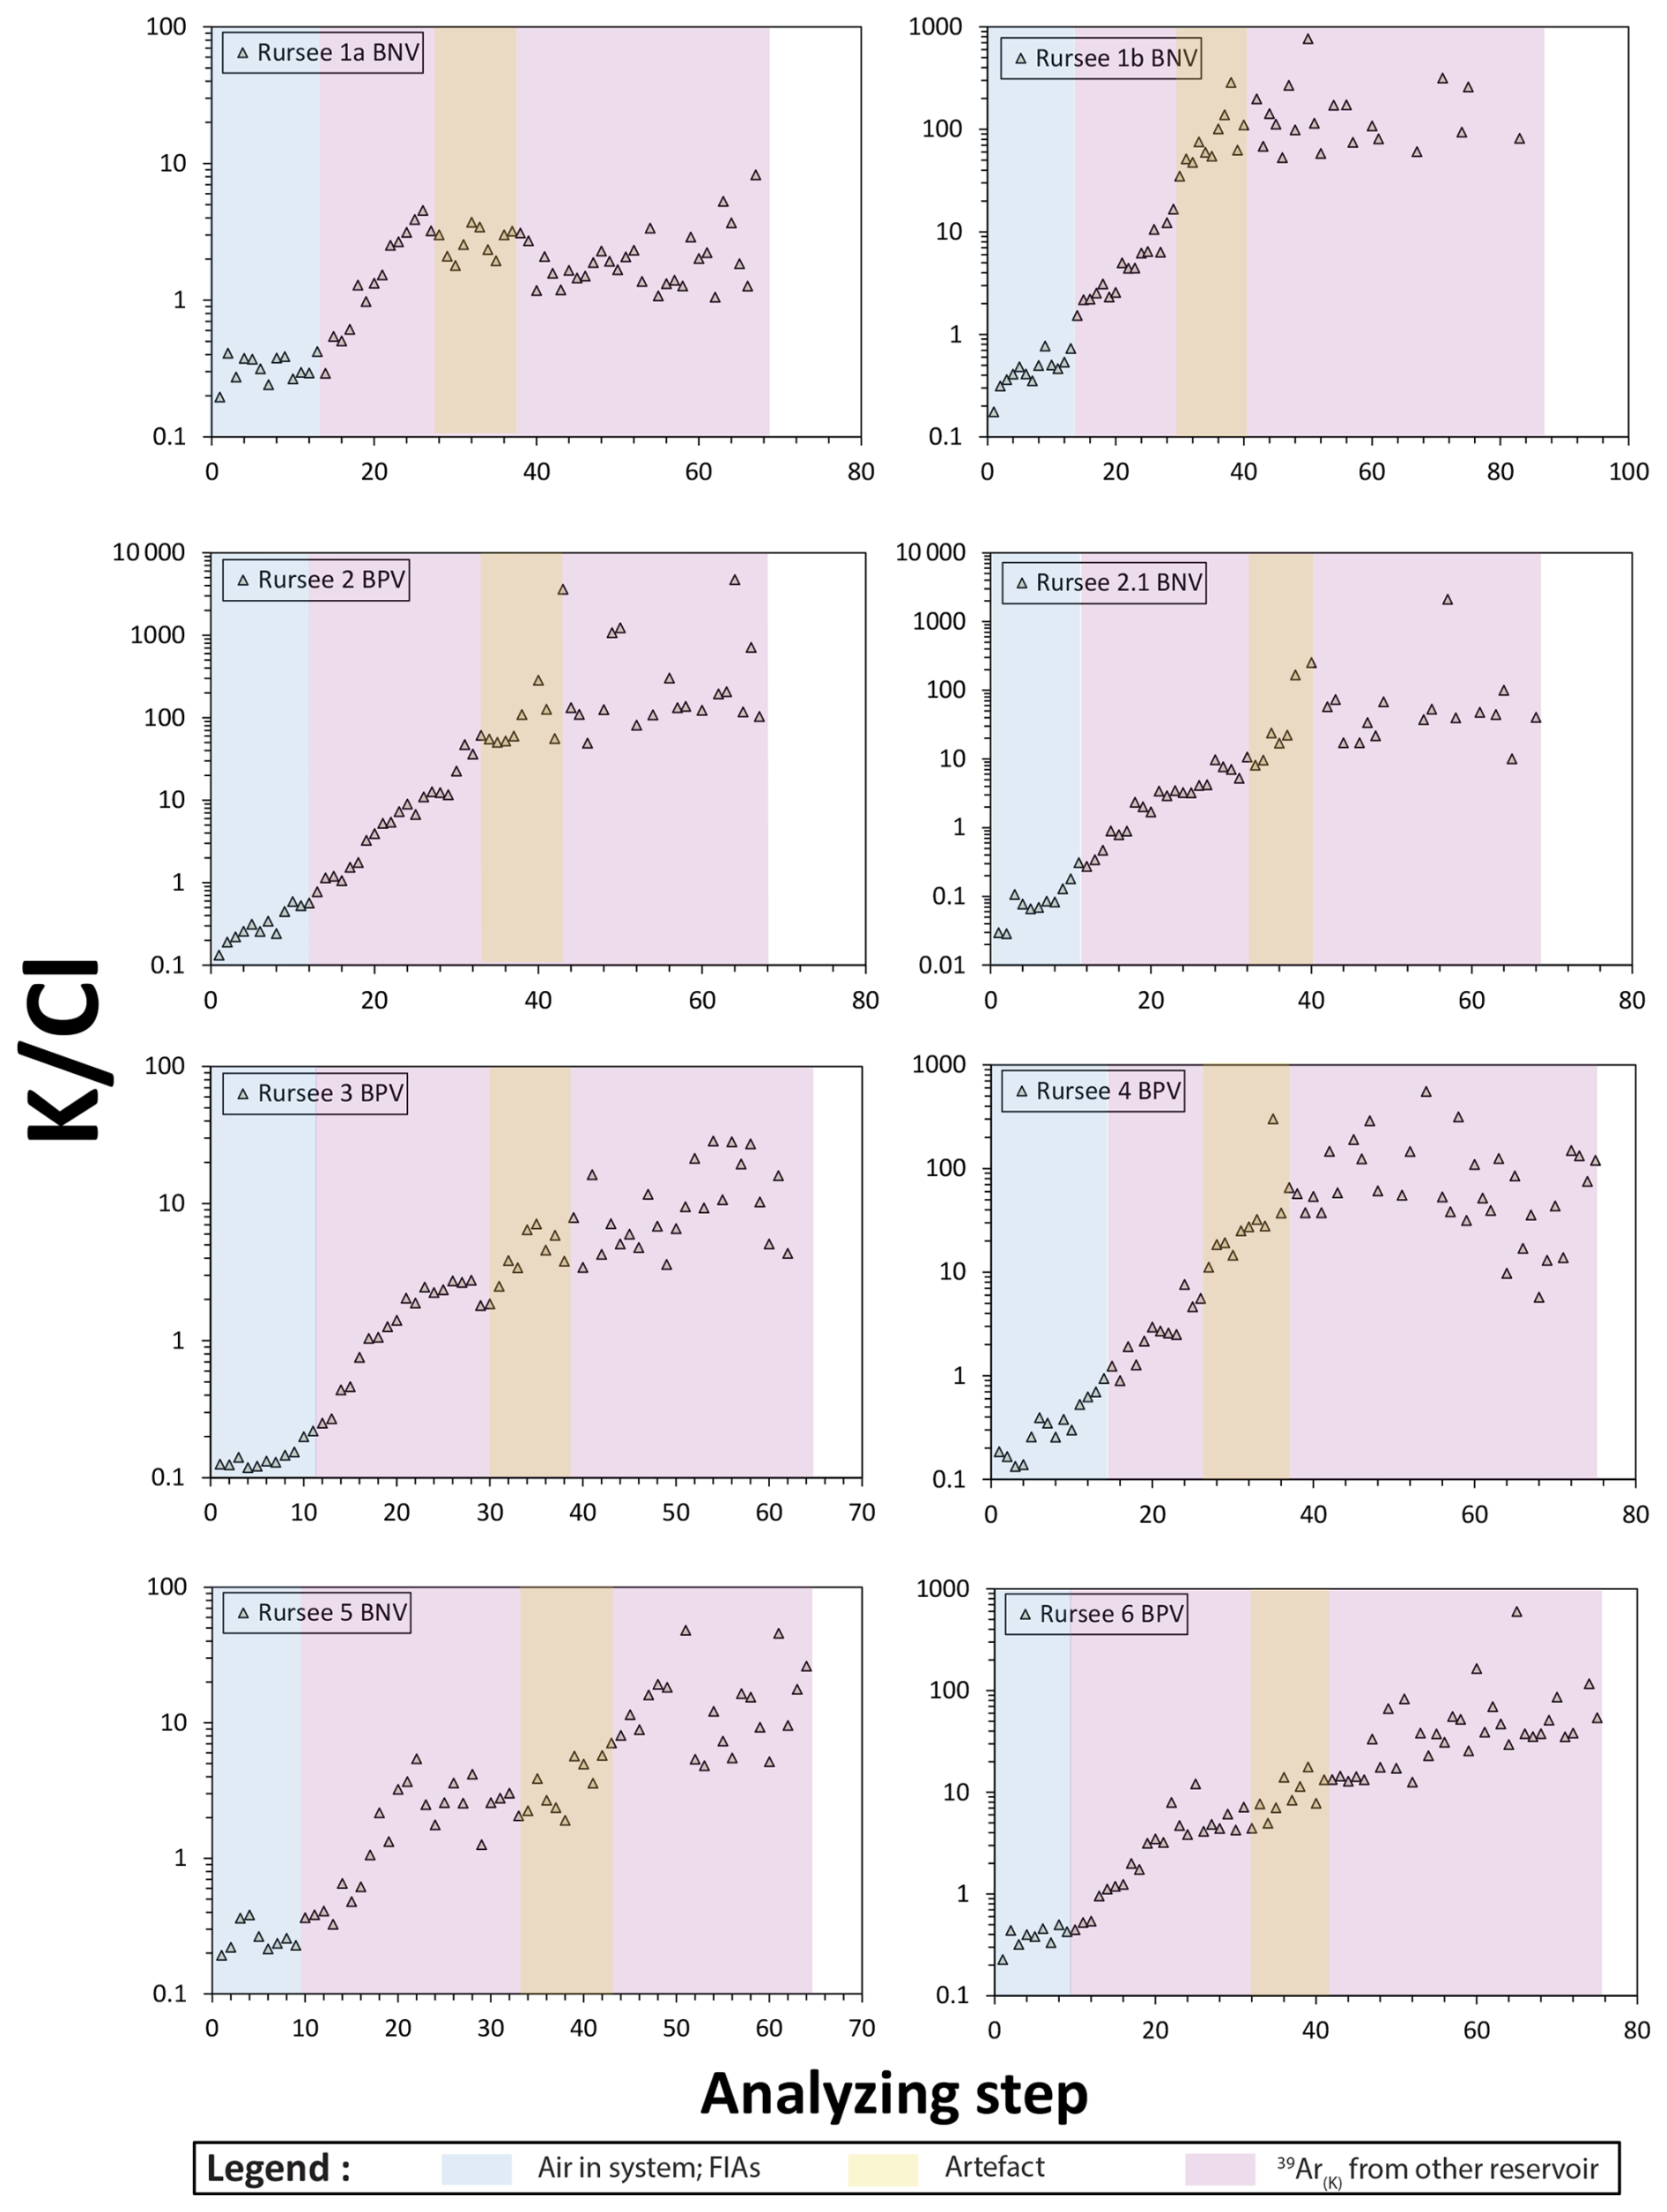
From the 10th to the 15th K Cl ratio, it reaches ∼ 1 with a steep rise for all quartz samples, and later (from the ∼ 20th step) this ratio continues to increase steeply for the second group of samples, while it shows a less pronounced increase for the first group of samples.
The lower K Cl ratio may be attributed to the presence of Cl and a lack of or limited amounts of K in combination with relatively constant low salinity levels (3.5–8 eq. wt % NaCl) inside the fluid inclusions, which are likely to be opened in the early phase. After most fluid inclusions have been mechanically opened, the subsequent rapid increase in K (reflected by the 39ArK) and the steady decline in Cl (reflected by the 38ArCl) occur throughout successive crushing steps and are reflected in the K Cl ratio. Therefore, this increase is likely due to the exhaustion of the Cl-rich fluid inclusions along with the presence of minerals containing potassium and/or potassium from the crystal lattice of quartz that release their argon in the later crushing steps.
This approach to distinguish between fluid inclusions and other K reservoirs was first suggested by Kendrick et al. (2006, 2011): K Cl ratios ≤ 1 are representative of fluid inclusions and K Cl ratios > 1 for other sources. If K Cl ≤ 1, the apparent age we measure is the oldest possible age for the fluid inclusions. In case K Cl > 1, the obtained apparent age corresponds to the maximum apparent age of the trapped K-bearing mineral and/or K from the crystal lattice (Kendrick et al., 2006, 2011). In our samples, the K Cl is greater than 1 after the first ∼ 15 ± 3 steps in all quartz vein samples, indicating the presence of major K-related reservoir(s) other than fluid inclusions. It is worth noting that this is based on the assumption that there are no other K-bearing phases, such as KNO3, K2SO4, or K2CO3, rather than KCl dissolved in aqueous fluid inclusions. This assumption may be verified by Raman analysis (see Fig. A1), which does not show significant peaks for these alternative K-bearing phases. However, the low peaks in ∼ 1080 cm−1 may be related either to K2CO3 or to interferences in relation to the epoxy background. Therefore, K Cl > 1 suggests that K is related to the salinity of the fluid inclusions along with different K components (i.e. KCl and K2CO3). Alternatively, if there is interference from the epoxy background, it suggests that there should be at least one significant additional source present, which could include the crystal lattice of quartz and/or mineral inclusions within the quartz crystals and/or even microcracks.
4.2.2 K-bearing mineral inclusions
EPMA data (Table 2) from cleaned, hand-picked fluid-rich separated quartz grains indicate the presence of sericite, chlorite–sericite, and illite–sericite in the microfractures and cavities of fluid inclusion. The presence of such minerals (or mixtures) in the inclusion cavity and microfractures is also invisible under a binocular or petrographic microscope during the mineral separation and was confirmed captured using electron-backscattered imaging (Fig. 8). In thin sections of quartz, veins with the associated host rock, illite–sericite, and white mica are abundant in the surrounding pelitic layer of the Rursee formation (Fig. 9). These minerals that contain a significant amount of K2O are also detected by an EPMA, in the separated quartz samples, especially in Rursee 2 BPV (see EPMA data, Table 2). High K concentrations (∼ 8.8 wt % K2O) are likely related to intergrowth with sericite or a closely related mineral.
Table 2Elemental analysis of quartz grain, microcracks, and mineral inclusions in quartz vein samples under an EPMA.
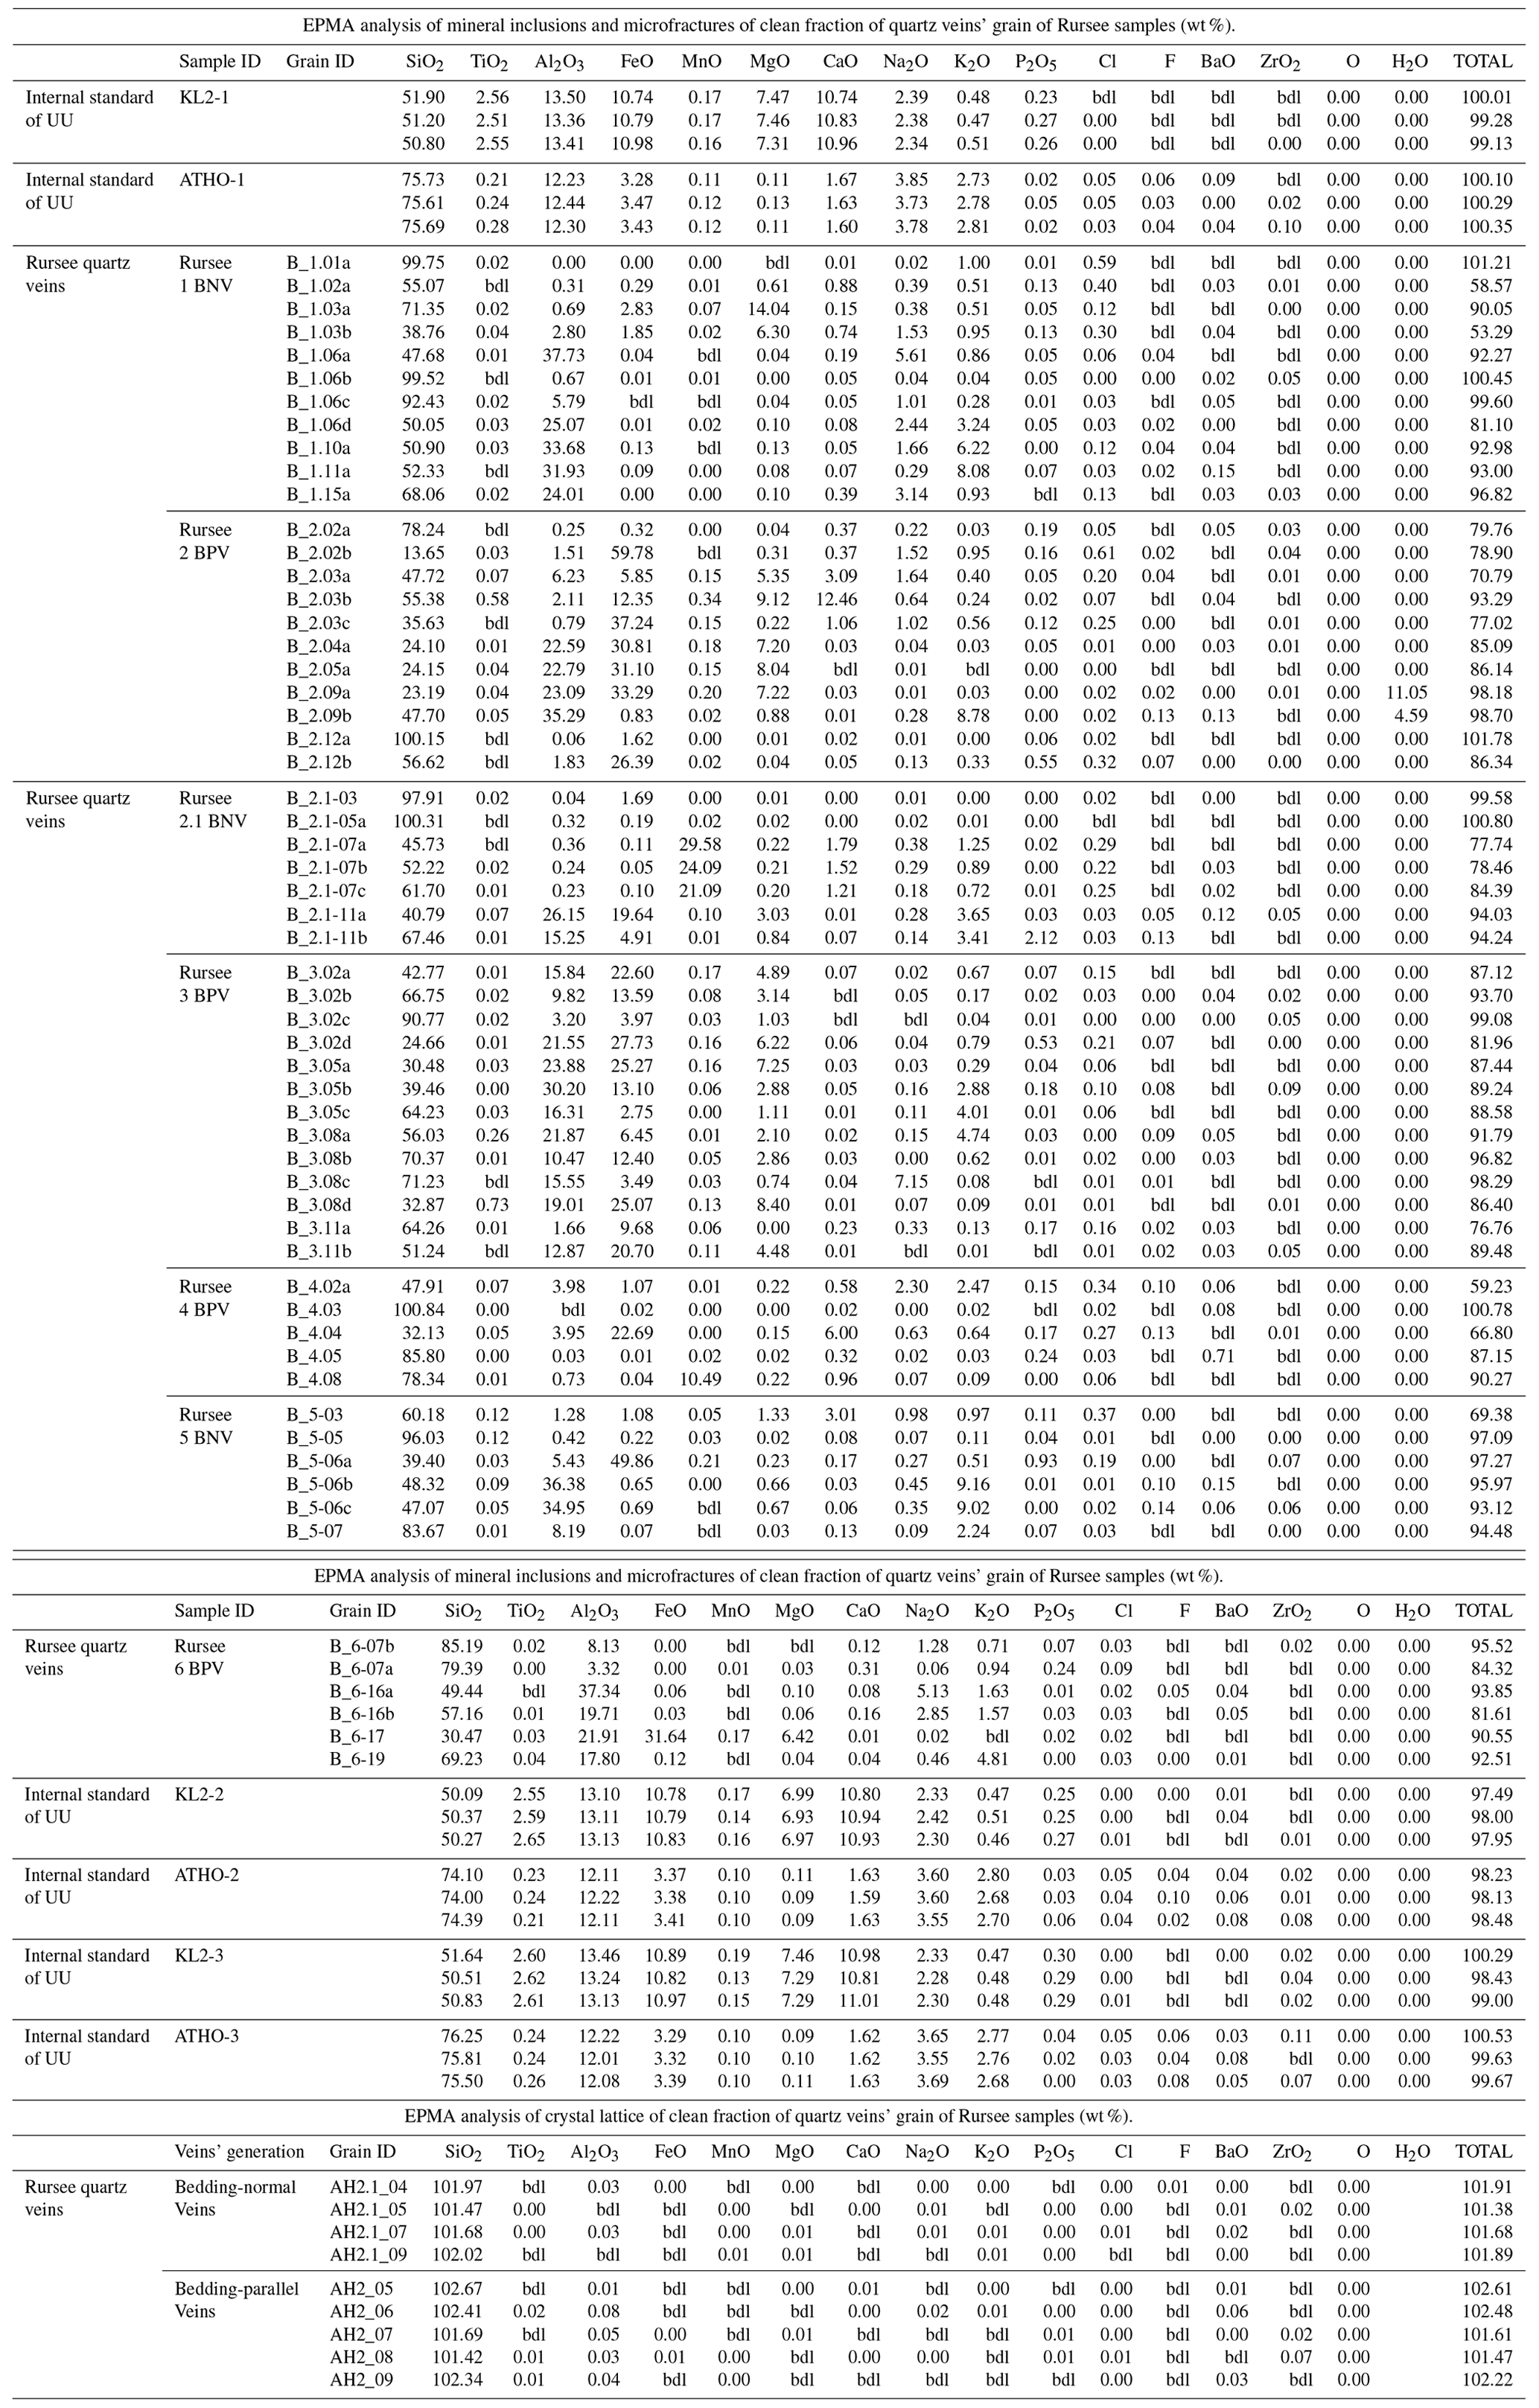
* bdl – below detection limit.
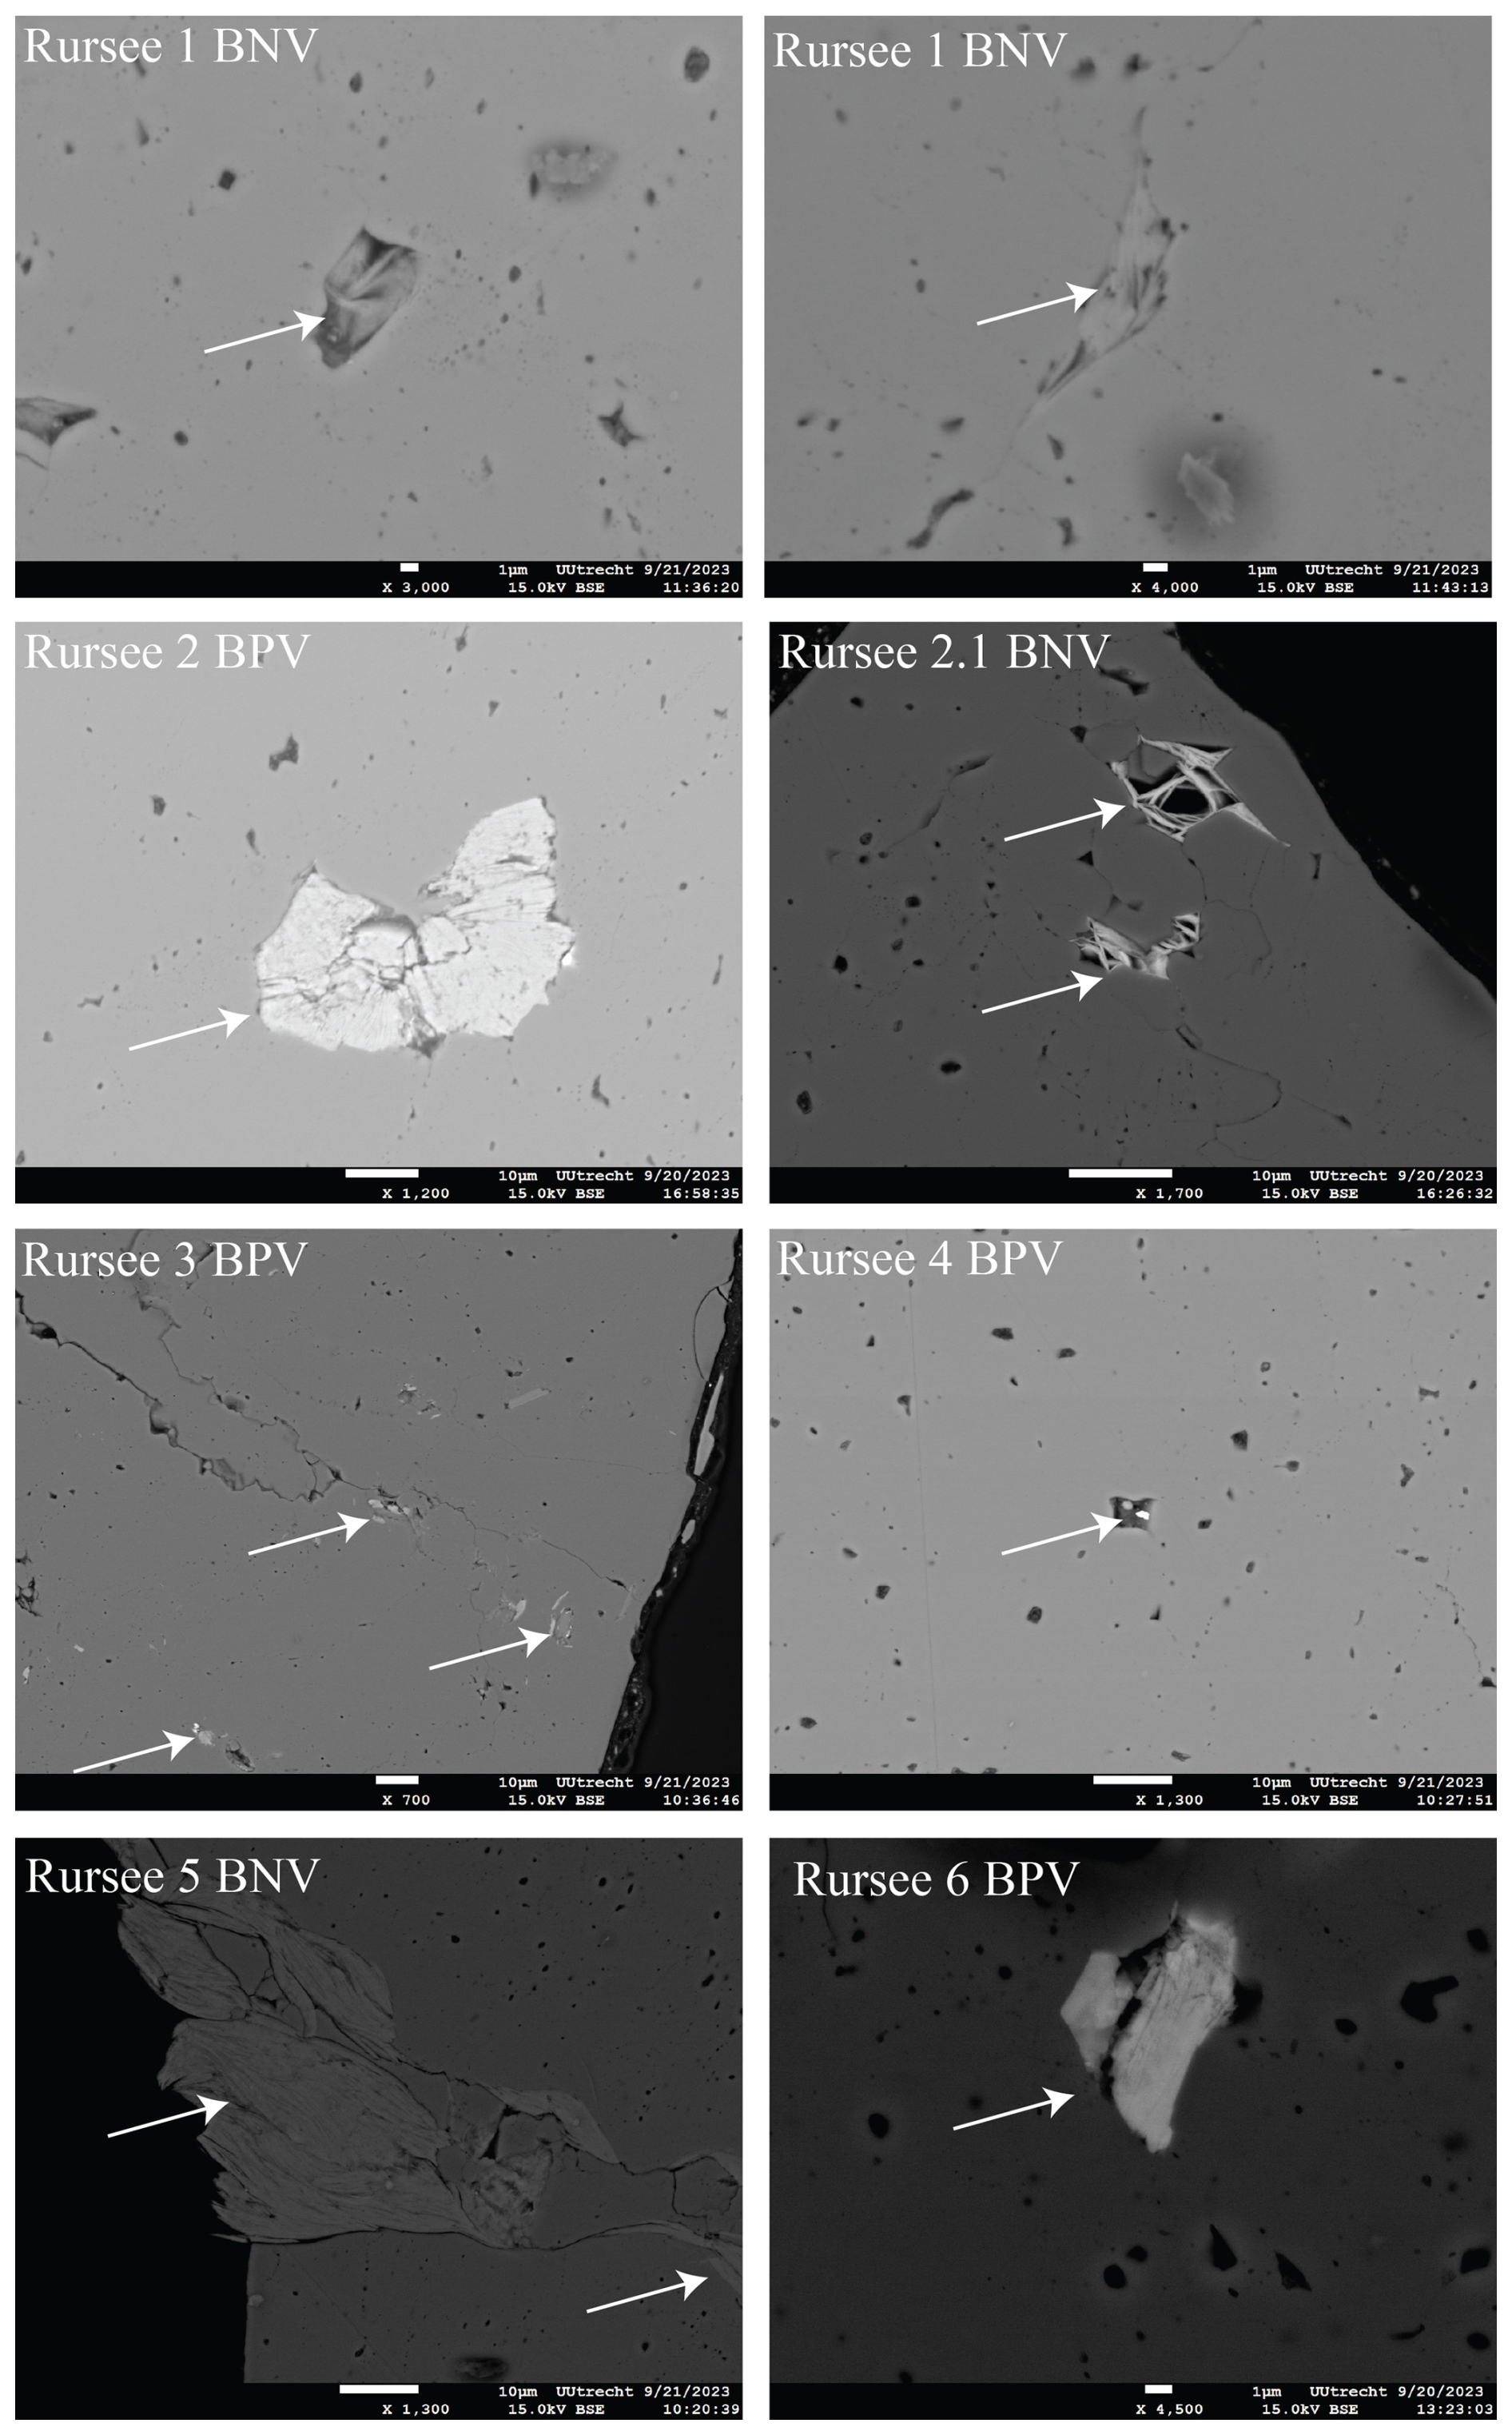
Figure 8Backscattered electron images of mineral inclusions obtained by SEM. Secondary minerals (e.g. chlorite, sericite, and white mica as determined using an EPMA) occur in cavities and microfractures (white arrow) in fluid-rich quartz.
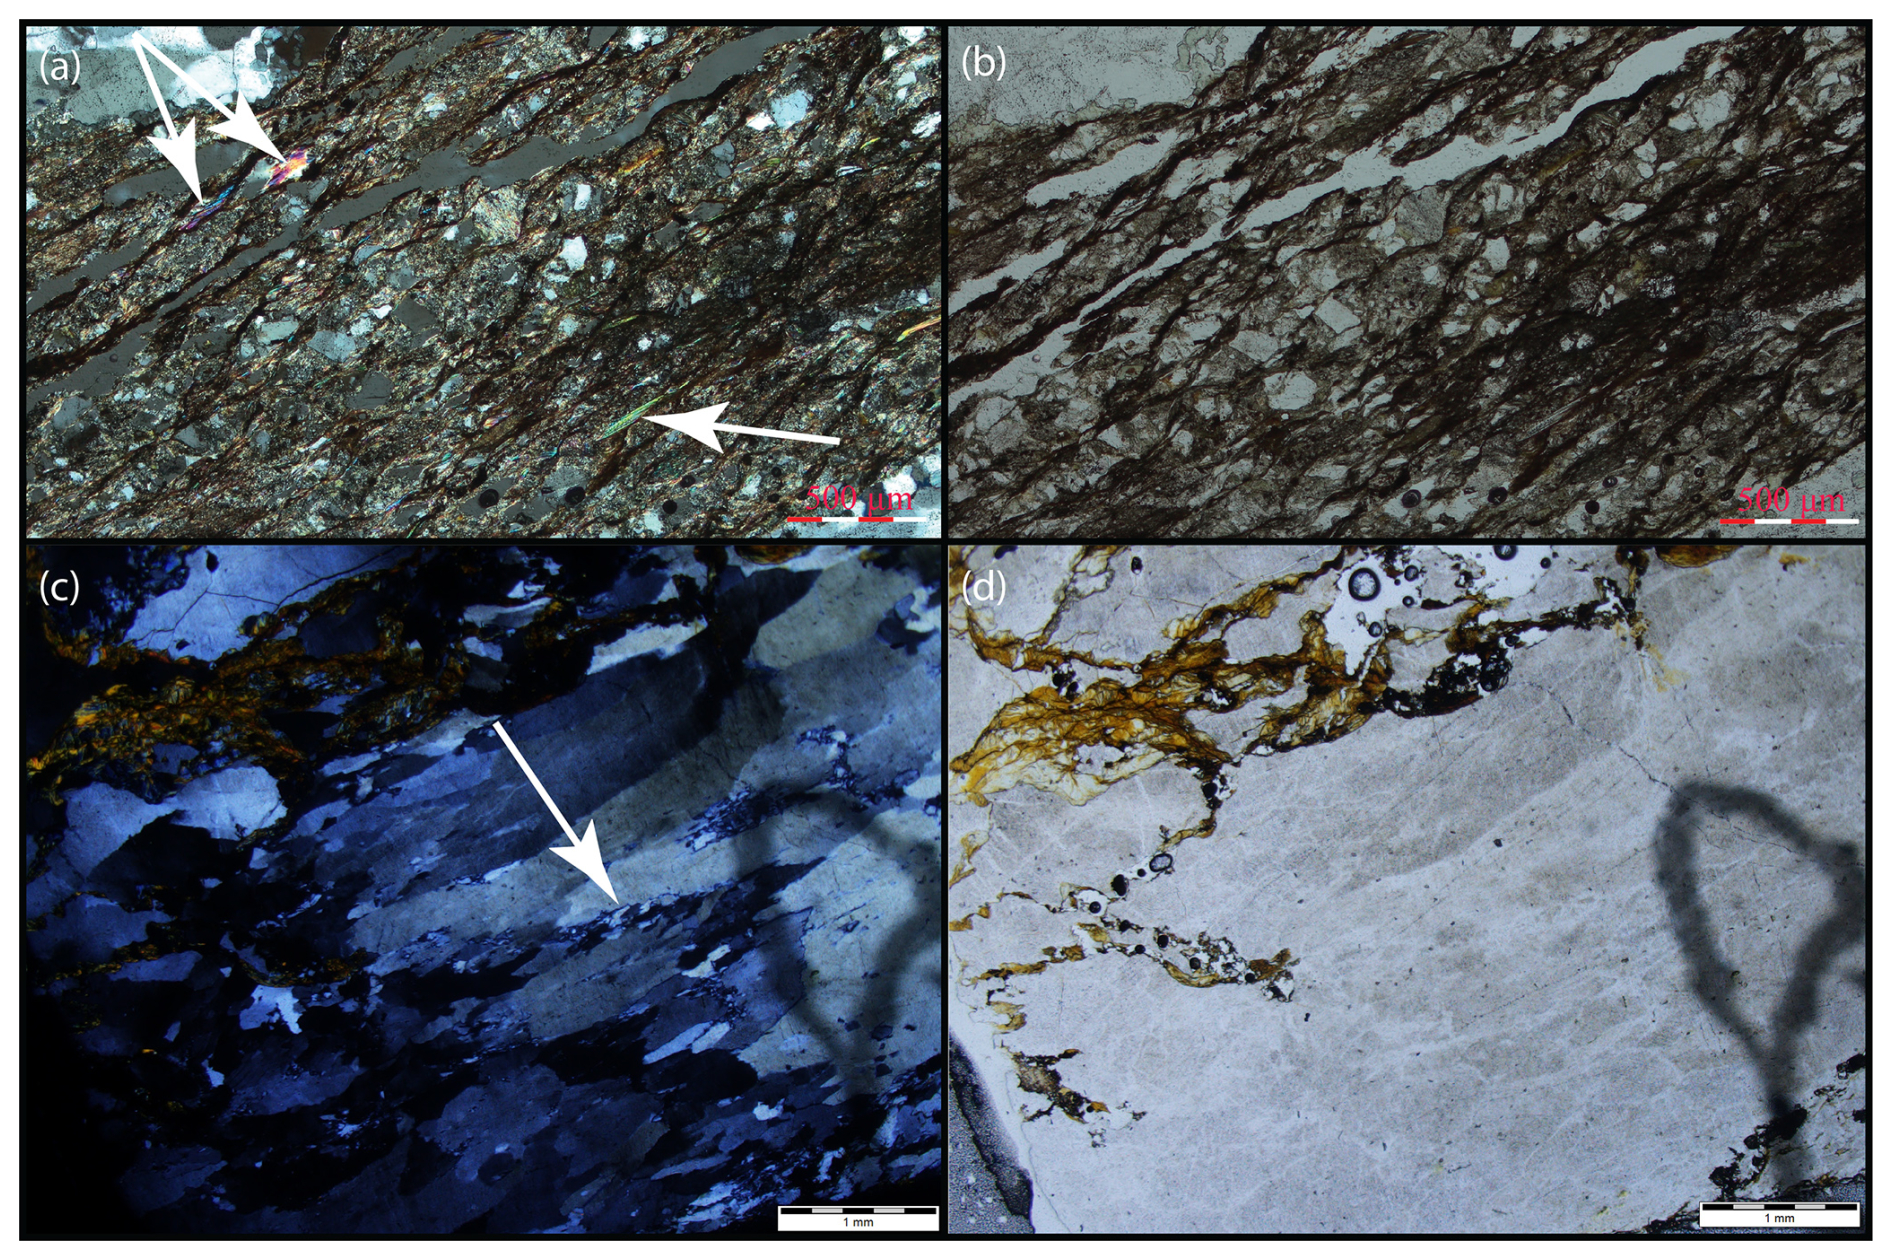
Figure 9Microscopic image of the quartz vein host rock matrix from the Rursee formation. (a) Crossed polarizer and (b) plane polarizer images of the pelitic host rock (Rursee 2 BPV). White arrows (image a) indicate the presence of the white mica and sericite in the host pelitic rock. (c) Crossed polarizer and (d) plane polarizer images of the quartz veins' matrix (Rursee 1 BNV). The white arrow (image c) shows the presence of the quartz sub-grains. Quartz sub-grains in the vein are due to the local tectonic activity, indicating that this period corresponds to tectonic activity.
Petrographic analysis of thin sections of whole rock samples representing both vein generations (BPV and BNV) reveals a significant presence of chlorite located between the vein wall and host rock, as well as in fractures (Fig. 10). Although chlorite typically lacks K in its crystal structure, previous studies have reported trace amounts of K in chlorites (Pacey et al., 2020; Li et al., 2022).
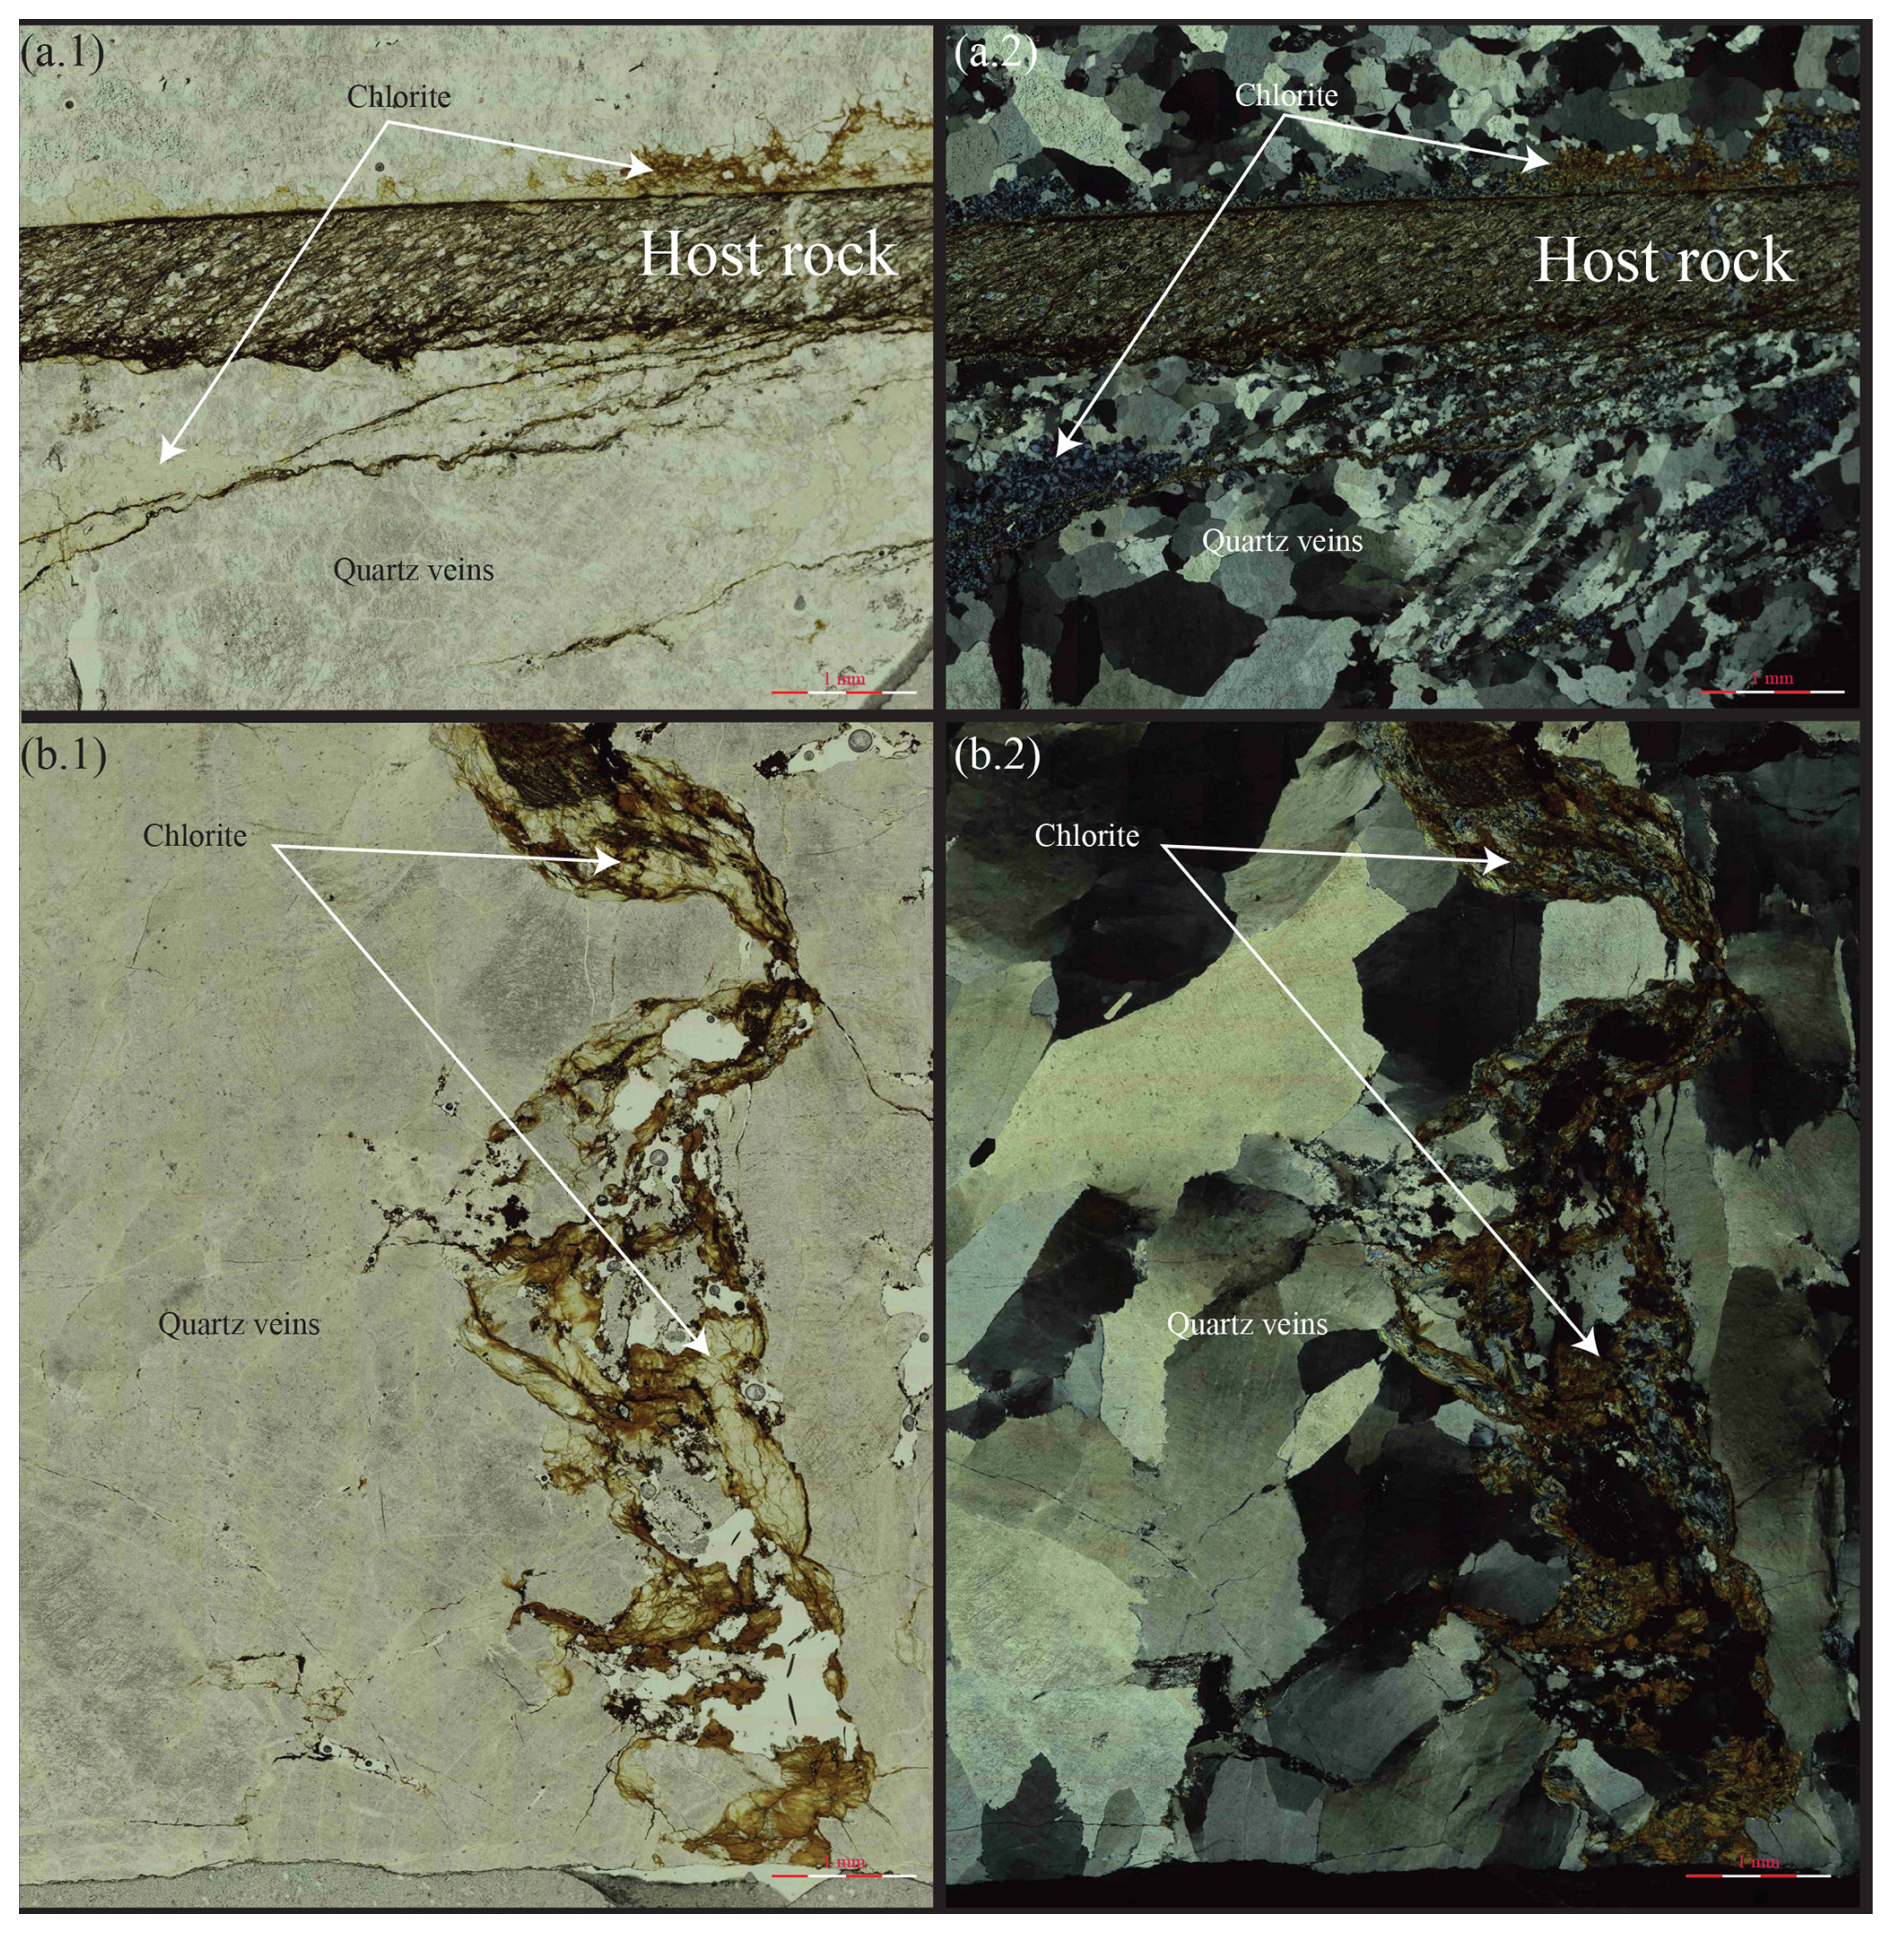
Figure 10Chloritization distribution in the vein wall and fractures for both generations of quartz veins. (a) Plane (a.1) and crossed (a.2) polarizer of bedding-parallel veins: chloritization mainly between vein wall and host rock and fractures. (b) Plane (b.1) and crossed (b.2) polarizer of bedding-normal veins: chloritization in fractures.
4.2.3 K from crystal lattice and detrital minerals
EPMA analyses of the quartz matrix indicate that K concentrations in the crystal lattice are below the detection limit of ∼ 100 ppm. A maximum K concentration of ∼ 100 ppm K (for example, 100 ppm K in Rursee 2.1 BNV) and a maximum apparent age of 144 Ma would result in ∼ 16000 fA 40Ar* when measured on our Helix MC+ mass spectrometer, which is a comparable amount of total 40Ar* released from K-bearing mineral inclusion. Given the large sample amount (∼ 30 mg), this would translate into a significant contribution of K from the crystal lattice of quartz. We therefore suggest that K in the crystal lattice may contribute to the observed 40Ar* signals (see calculation in the Supplement file S2).
In this study, argon molecules might also be derived from secondary minerals in cracks and embedded detrital minerals (e.g. mica from host rock). This interpretation aligns with the observation that the homogenization temperatures of fluid inclusions within the quartz veins are below the closure temperature for argon in detrital minerals. Under such conditions, the expected maximum apparent ages from K-bearing detrital minerals would correspond to pre-Variscan periods, reflecting the maximum apparent age of the deposits hosting the quartz veins, although the obtained maximum apparent ages are significantly younger in this study. Therefore, we infer that detrital minerals do not significantly contribute to the 40Ar* signals.
To summarize, during the first stages (until the ∼ 20th analysis steps) of the stepwise vacuo crushing, gases are likely released only from fluid inclusions (secondary and pseudo-secondary, as is also observed for fluid inclusion in garnets (Qiu and Wijbrans, 2006, 2008)). Huseynov et al. (2024) demonstrated that a significant amount of fluid inclusion water can be extracted from these samples by a single crushing step using a spindle crusher. In this study, throughout the crushing process, the total amount of argon released steadily increases (Fig. 6). In the latter stages of the experiment (from the 20th analysing steps), the substantial release of 39ArK isotopes may originate as follows:
- a.
The gas release only from the small-sized fluid inclusions (i.e. < 5 µm pseudo-secondary) until the last stage of the experiment (∼ 40–50th analysing step) and then in the last stage (after the 50th step) from solid-phase K-bearing minerals and/or crystal lattice, which corresponds to the end of the early converging section in some samples. As K Cl > 1 after (the 20th analysing step), the low peak (∼ 1080 cm−1) in Raman spectroscopy may correspond to a K-related component (e.g. K2CO3) from fluid inclusions.
- b.
The significant release of 39ArK isotopes in the middle to later stages of the experiment may be related to the presence of non-crushed, small-sized fluid inclusions (< 5 µm) together with K-bearing mineral inclusions in the samples and/or 40Ar* from the crystal lattice under the condition that the low peak in ∼ 1080 cm−1 from Raman spectroscopy belongs to the epoxy background of the quartz grain. The contribution of crushing-induced degassing K-bearing mineral inclusions is also corroborated by EPMA data, and the presence of K in the lattice cannot be ruled out for the Rursee samples.
4.3 Age spectra and isochrons
As mentioned previously, the distribution of argon isotopes (Fig. 6) indicates that 39ArK is derived from distinct sources, likely mineral inclusions and/or eventually crystal lattice rather than fluid inclusions in particular in the later phase of the experiment, which was used for the age determinations. These potential sources of K, including fluid and mineral inclusions and/or crystal lattice, may all contribute to the variability observed in the age spectra derived from the different samples. Due to the presence of 40ArE from the fluid inclusions, the initial analytical stages of the analyses yield anomalously high apparent ages in the first part of their age spectra (Fig. 4). Some samples (Rursee 3 BPV, Rursee 5 BNV, and Rursee 6 BPV) show an early converging section in the first part of the experiment. The early converging section effect occurs between the 20th and 30th analysing steps, which may be associated with sudden changes in K Cl ratios (Fig. 7). These sudden changes may be due to the sharp transition from fluid-state reservoirs (e.g. small-sized fluid inclusions) to solid-state reservoirs (e.g. K-bearing mineral inclusions). However, it does not occur in the second group of quartz samples (Rursee 1b BNV, Rursee 2 BPV, Rursee 4 BPV), revealing smooth transitions from fluid to solid states of 39ArK reservoirs. The transition for the Rursee 2.1 BNV is neither abrupt as for the first group samples nor smooth as for the second group samples; hence, the impact of the early converging section is minimal.
The transition from fluid-state reservoirs to solid-state reservoirs can be supported by grain size distribution (see Supplement file S4), indicating that fluid-state reservoirs may remain unreleased beyond around 800 crushes (around the 20th analysis step). However, the presence of small particles at the bottom of the crusher (non-recoverable size) after 800 crushes may result in the measured results not accurately representing the whole grain size distribution. As the grain size distribution depends on many factors (i.e. crushing efficiency, presence of microcracks), there may even be a factor of difference for two groups.
The impact of 40ArE results in inverse isochrons (Fig. 5) during the initial stage. The relationship between the 36Ar 40Ar and 39Ar 40Ar for all samples resulted in a decrease in the 36Ar 40Ar ratio and an increase in the 39Ar 40Ar ratio (initial stage in Fig. 11). The presence of an elevated concentration of 36Ar at the beginning of the experiment could be due to the atmospheric argon gas that is either trapped in the stainless steel crusher and/or the original fragment surfaces or perhaps released during the initial stage of crushing. Following the opening of fluid inclusions, the ratio of 36Ar 40Ar increases linearly with the ratio of 39Ar 40Ar. This is probably due to a decrease in excess argon throughout the crushing and an increase in 39ArK associated with K-bearing minerals and/or crystal lattice (intermediate stage in Fig. 11). In the last phase of 40Ar 39Ar analysis, the concentration of 39ArK decreases (final stage in Fig. 11). This last part is particularly important for determining the age of quartz vein samples.
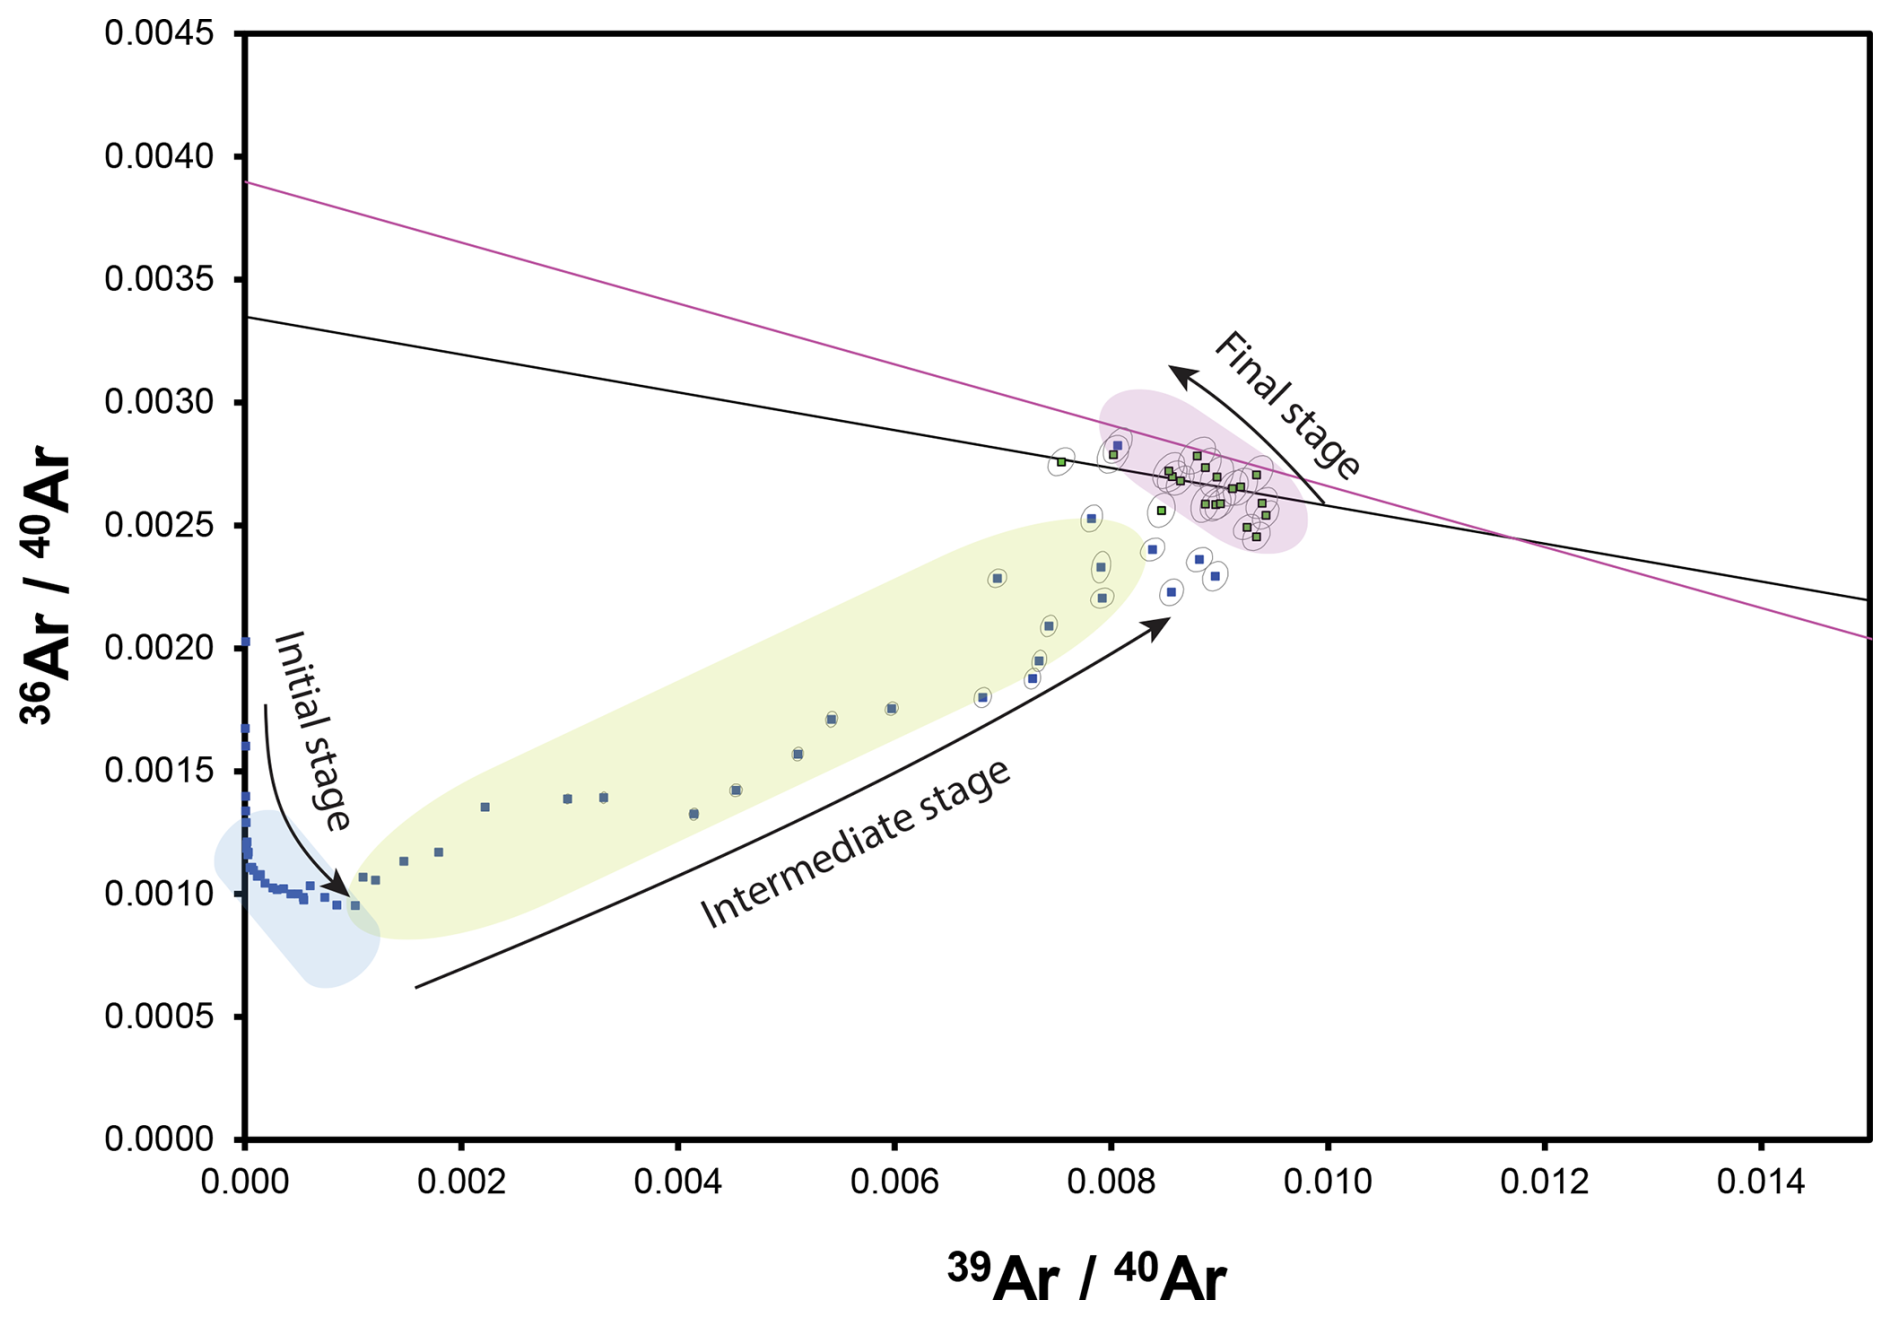
Figure 11Inverse isochron representation of quartz veins (ex: Rursee 2.1 BNV): three stages: (1) initial stage with the opening of fluid inclusions, (2) intermediate stage where argon is released from mineral inclusions or microfractures and/or crystal lattice, and (3) final stage of argon release from mineral inclusions and neglectable excess argon in samples.
Inverse isochrons may assist in determining the maximum apparent age of fluid inclusions by linear regression of the data related to fluid inclusions. However, the high amounts of excess argon in the system obscure geologically meaningful ages.
4.4 Implications
Unlike studies that obtained consistent maximum apparent ages from high-salinity (> 20 eq. wt % NaCl) primary fluid inclusions of garnet (in eclogite) and wolframite (Qiu and Wijbrans, 2006; Qiu et al., 2011; Bai et al., 2013, 2019), we were unable to date pseudo-secondary and secondary fluid inclusions in recrystallized Rursee quartz samples, likely due to high 40ArE concentrations and/or low salinity (3.5–8 eq. wt % NaCl). The reduced K concentration in the pseudo-secondary and secondary fluid inclusions, due to the loss of the primary brine and its replacement by a lower-salinity, lower-K fluid, likely led to inaccurate maximum apparent age determination. While no precise age was determined for the fluid inclusions, 40Ar 36Ar ratios (above atmospheric but below 4000) indicate a mixed metamorphic–meteoric fluid source (Ballentine et al., 2002; Ozima and Podosek, 2002). Later, during the crushing experiment, the K-bearing mineral inclusions may provide geologically meaningful ages, although the argon closure temperatures in quartz remain uncertain. For reference, the closure temperature of smaller-size sericite grains (∼ 20 µm) corresponds to temperatures (∼ 300–350 °C) (Glasmacher et al., 2001; Watson and Cherniak, 2003), while the vitrinite reflectance from psammatic and pelitic layers indicates maximum burial temperatures (220 °C) near the Carboniferous–Permian boundary, with gradual cooling thereafter (Littke et al., 2012).
Three 40Ar 39Ar maximum apparent ages ranging from 117 to 84 Ma differ from the interpretation based on structural analyses, which posit that veining occurred during the early Variscan Orogeny (Van Noten et al., 2007), possibly due to argon loss during cooling and/or recrystallization. The obtained maximum apparent ages may be influenced to some extent by the presence of neo-crystallized quartz sub-grains, although their volume appears relatively small (Fig. 9c). However, since the maximum apparent ages primarily reflect solid-phase reservoirs (i.e. K-bearing mineral inclusions) rather than fluid-phase components, likely, K-bearing solid-phase reservoirs intergrow simultaneously with the recrystallization process.
Post-Variscan tectonic activity is known for the southern Rhenish Massif due to late- and post-orogenic fault movements and coeval reactivation of Variscan structures leading to the fluids' (re)activity (Herbst and Muller, 1969; Schwab, 1987; Korsch and Schäfer, 1991; Hein and Behr, 1994; Moe, 2000; Kirnbauer et al., 2012).
Given that reactivation of existing veins could have occurred without forming new fractures (Virgo et al., 2013), this reactivation is usually associated with the infiltration of high-salinity (> 20 eq. wt % NaCl) fluids in central Europe and the Rhenish Massif (Behr et al., 1987; Redecke, 1992; Hein and Behr, 1994; Germann and Friedrich, 1999; Heijlen et al., 2001; Kuèera et al., 2010).
This saline fluid activity is at odds with the low-salinity fluid inclusions (3.5–8 eq. wt % NaCl) in the Rursee quartz veins (Van Noten et al., 2011). However, they agree with low-salinity fluid inclusions in quartz veins of the Rhenish Massif, which are attributed to upward migration of Variscan fluid remnants during Jurassic–Cretaceous reactivation (Kirnbauer et al., 2012).
Near Rursee (Stavelot inlier), low-salinity (0.2–7.2 eq. wt % NaCl) and high-temperature fluid activity (∼ 250 °C) along the Variscan front reflects warm meteoric fluid circulation (Schroyen and Muchez, 2000). Such warm, low-salinity fluids may have also contributed to the chloritization of veins in the Rursee outcrops. We propose that tectonic activity and quartz vein reactivation–recrystallization could explain the observed 40Ar 39Ar maximum apparent ages, as low-salinity Variscan fluids perhaps moved along the reactivated fractures, forming new quartz minerals within the Variscan-related veins during Jurassic–Cretaceous tectonic activity (i.e. opening of North Atlantic).
-
The analysis of argon isotope patterns and their interpretations (including K Cl and inverse isochrons) indicates that the main reservoir 39ArK for geologically meaningful ages originated from the K-bearing minerals (illite–sericite and possibly chlorite) in quartz vein microcracks and/or cavities of fluid inclusions and/or crystal lattice of quartz.
-
The determination of a primary crystallization age, i.e. Variscan age, for the quartz veins, is not feasible, owing to the low amount of K in fluid inclusions and the high amount of excess argon within the FIAs, resulting in anomalously old apparent ages in the first ∼ 20 crushing steps.
-
The reduced K concentration, due to the loss of primary fluid from inclusions and replacement by a lower-salinity, lower K fluid, led to bias in the age determination of fluid inclusions. The obtained ages potentially correspond either to the presences of a secondary generation of low-salinity fluids or to the contribution of radiogenic argon reservoirs hosted in solid phases related to intergrowth mineral inclusions during the recrystallization of quartz veins.
-
The maximum apparent ages obtained from the quartz samples span the Jurassic–Cretaceous period. The presence of neo-crystallized quartz sub-grains in the veins is due to the local tectonic activity, indicating that this period corresponds to the tectonic activity of the Rhenish Massif.
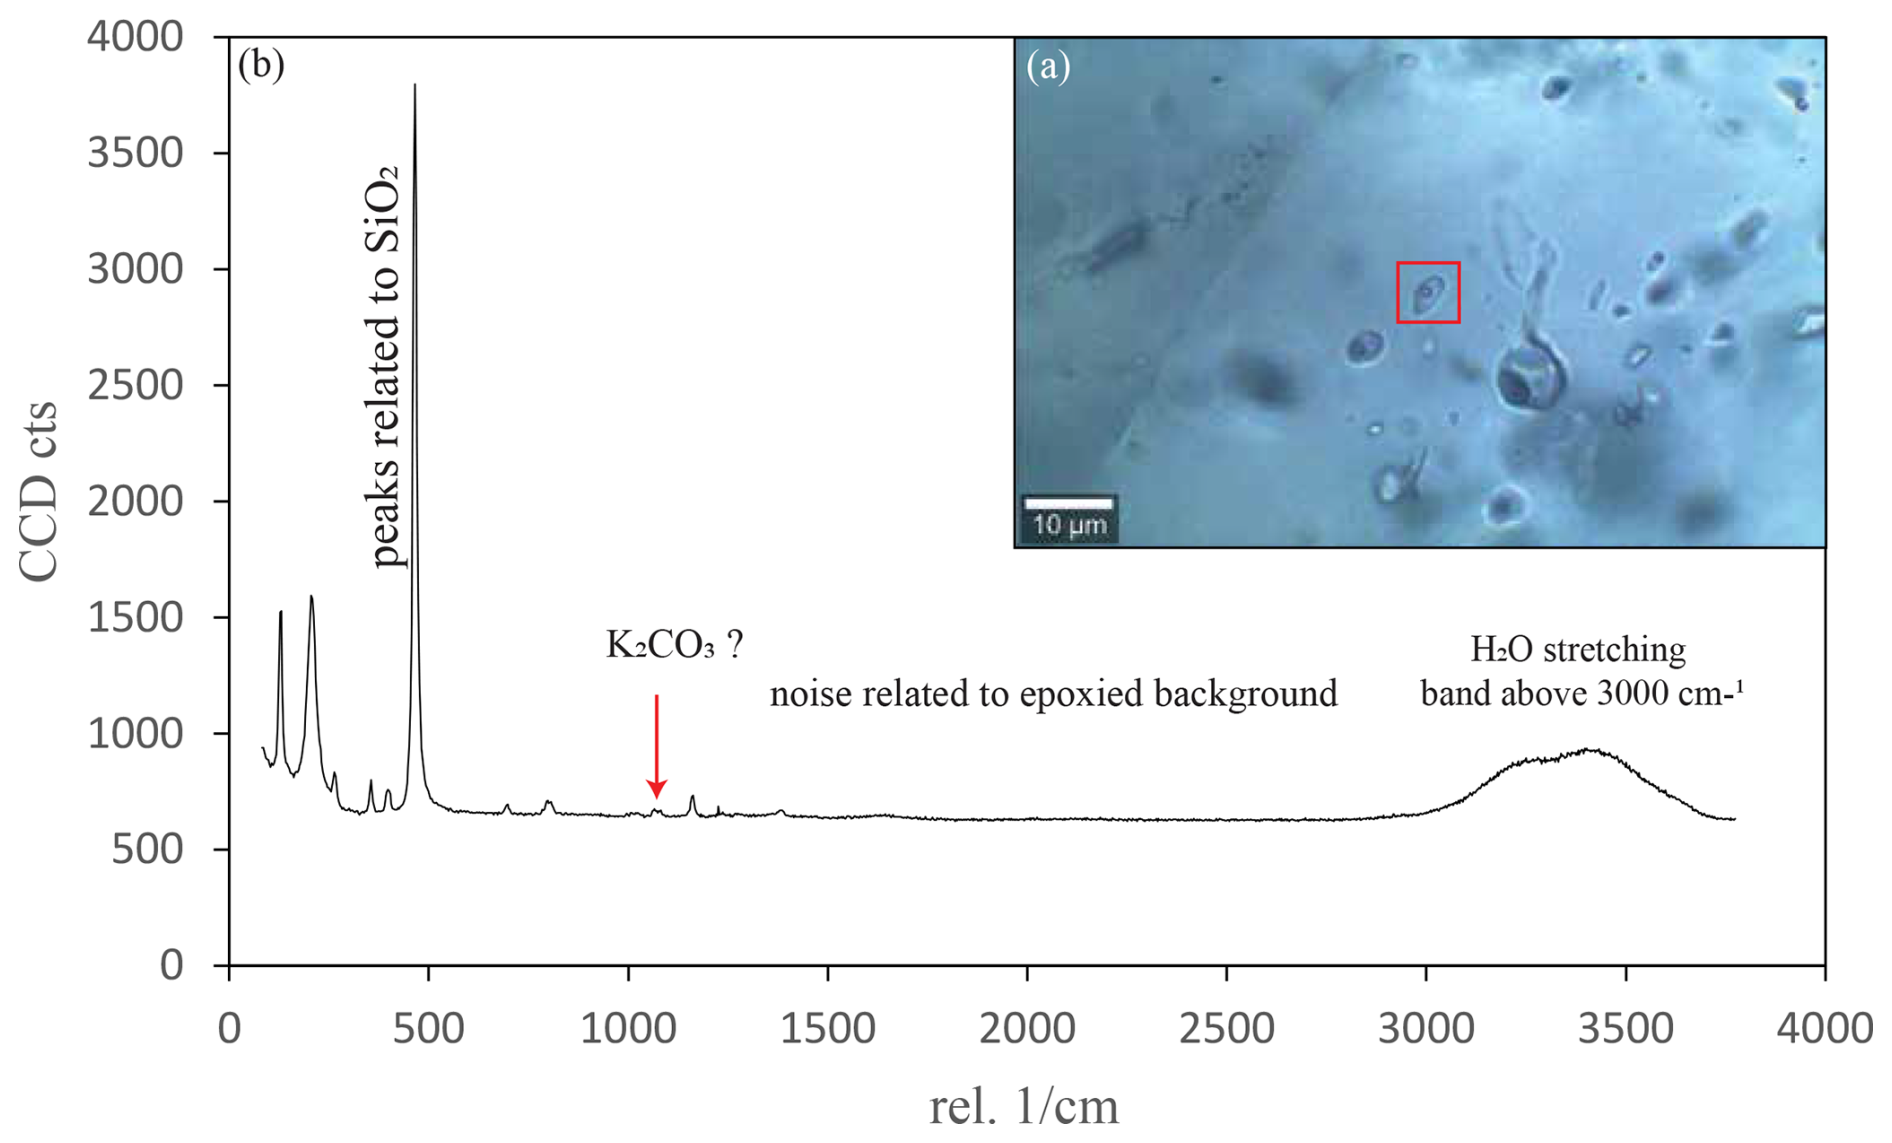
Figure A1Raman spectroscopy of fluid inclusion from Rursee quartz veins. (a) Microscopic image of an epoxied and polished fluid-rich quartz fraction. The fluid inclusion that underwent Raman analysis is represented by the red box. (b) The Raman plot is presented with the wavelength on the x axis and intensity on the y axis. The Raman spectra show a stretching band in the wavelength range of 3000 to 3700 cm−1, which indicates the presence of an aqueous system.
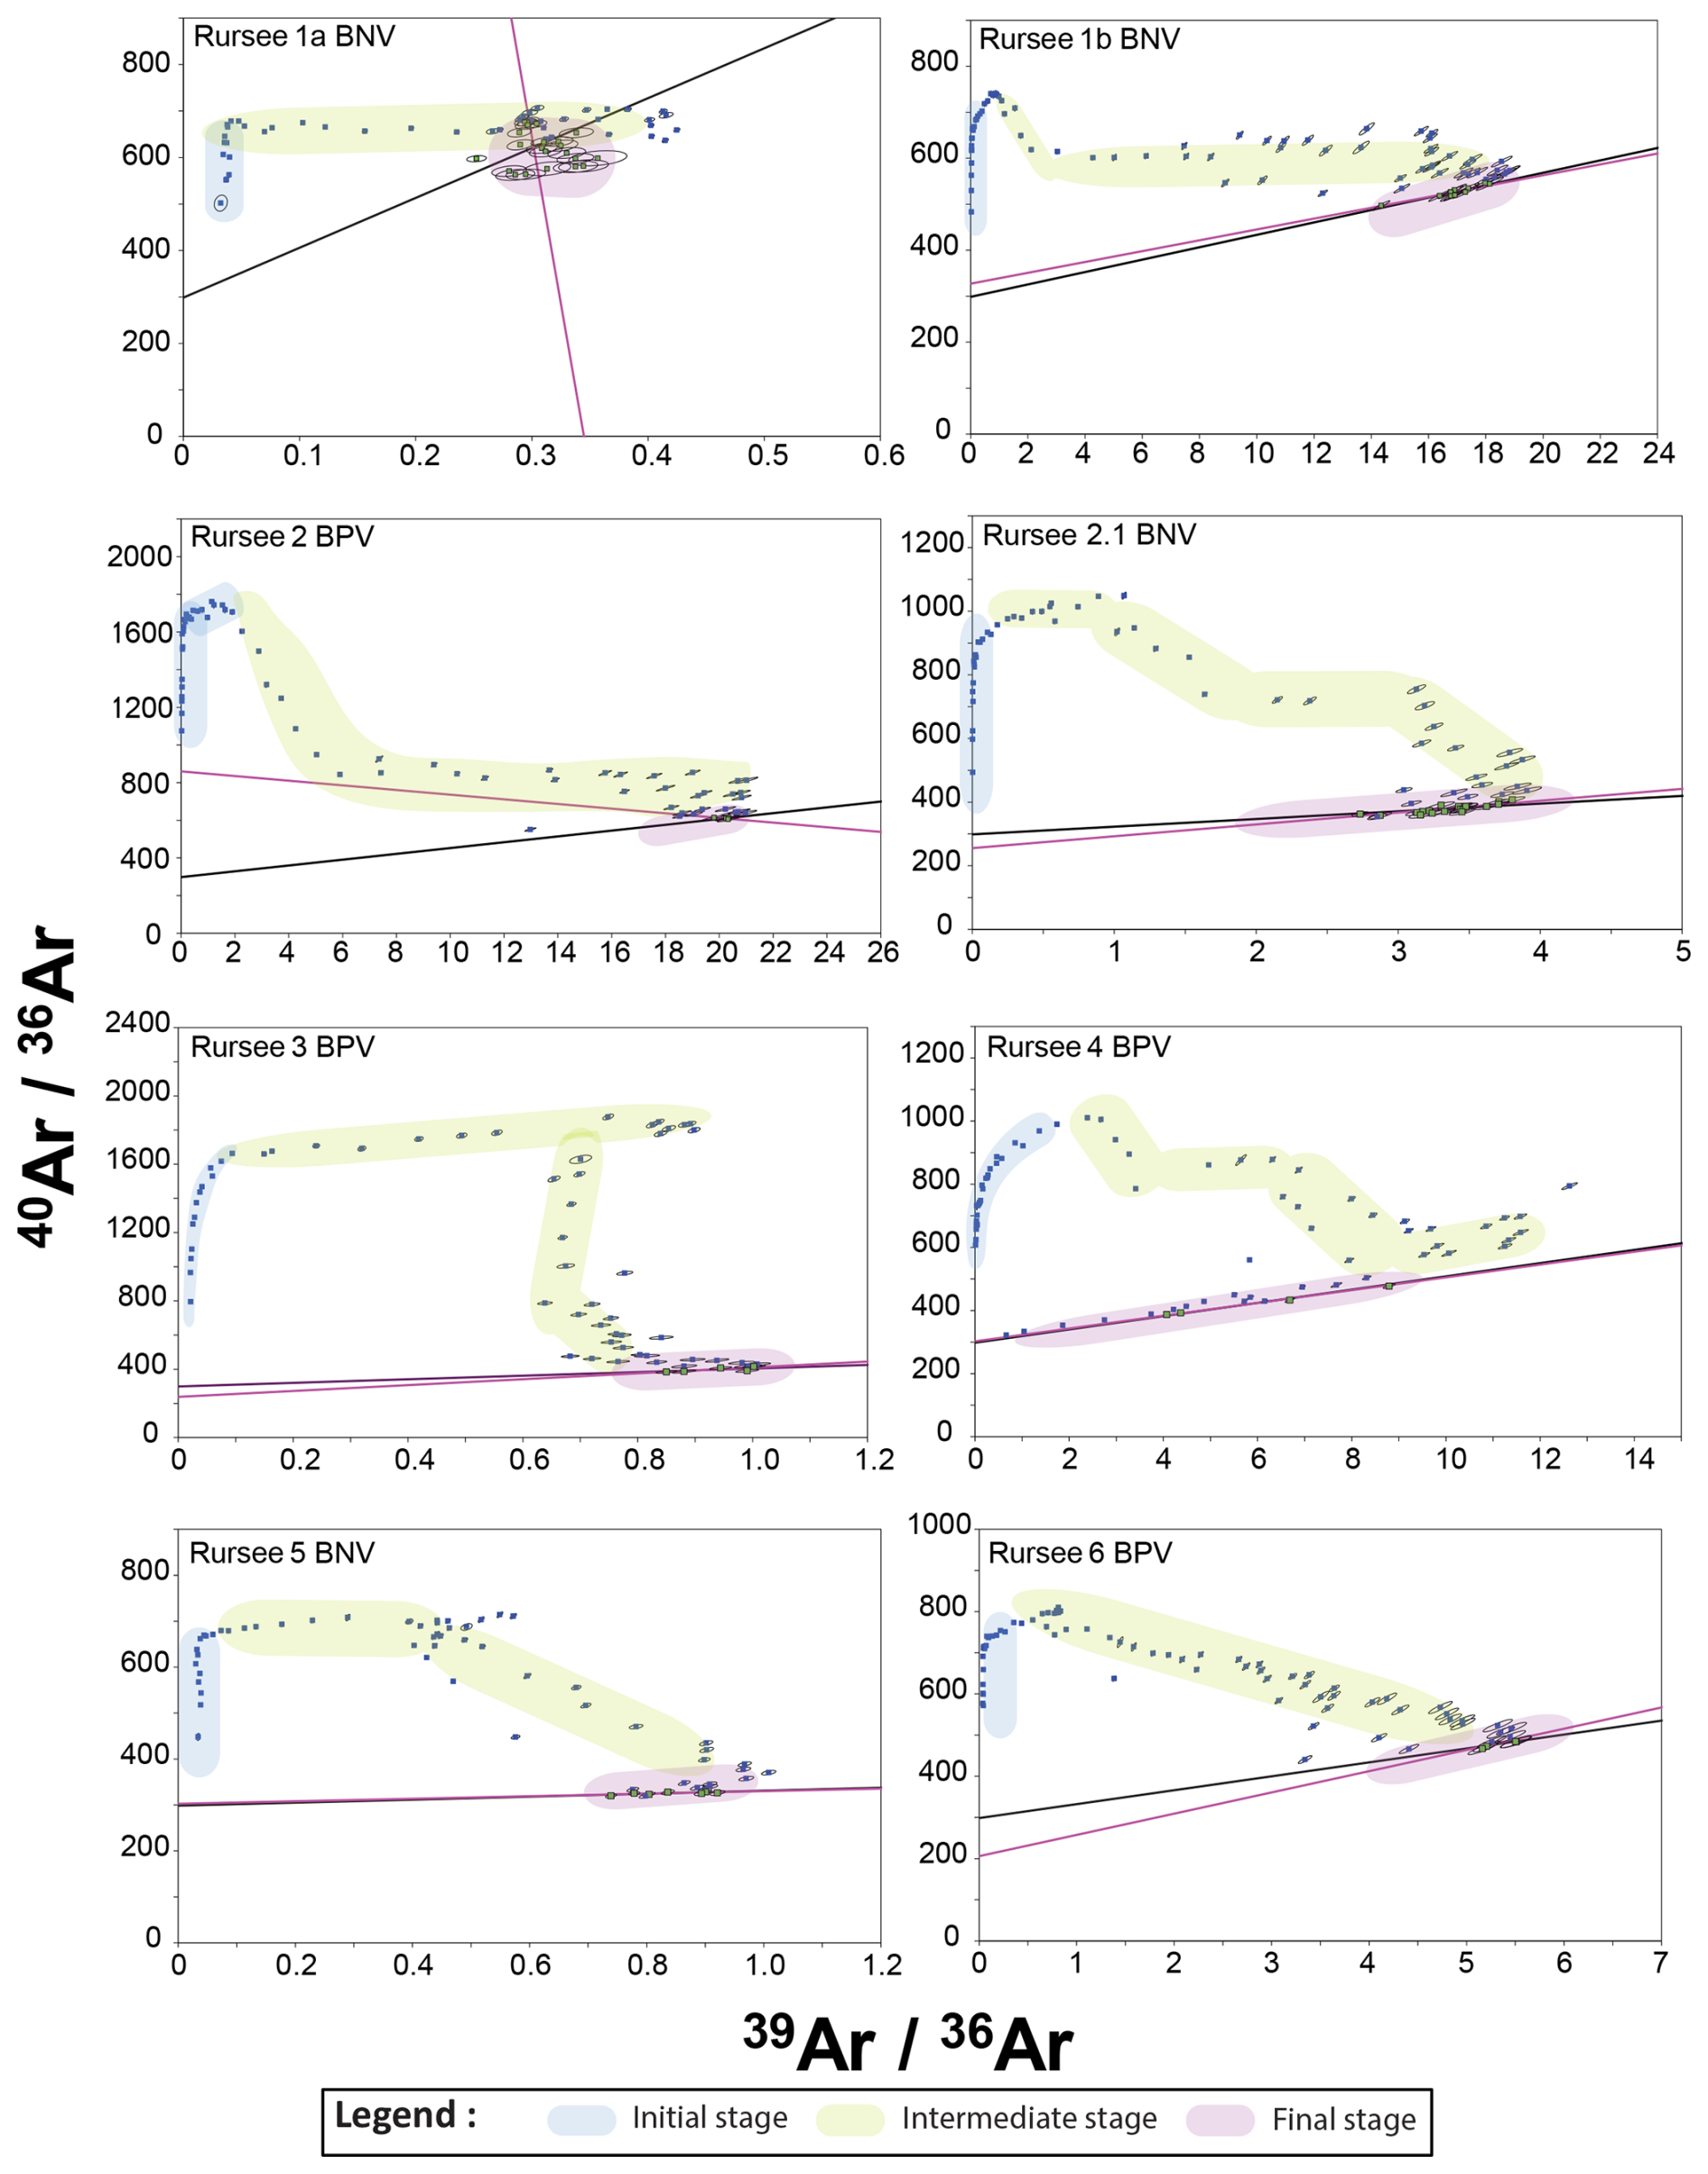
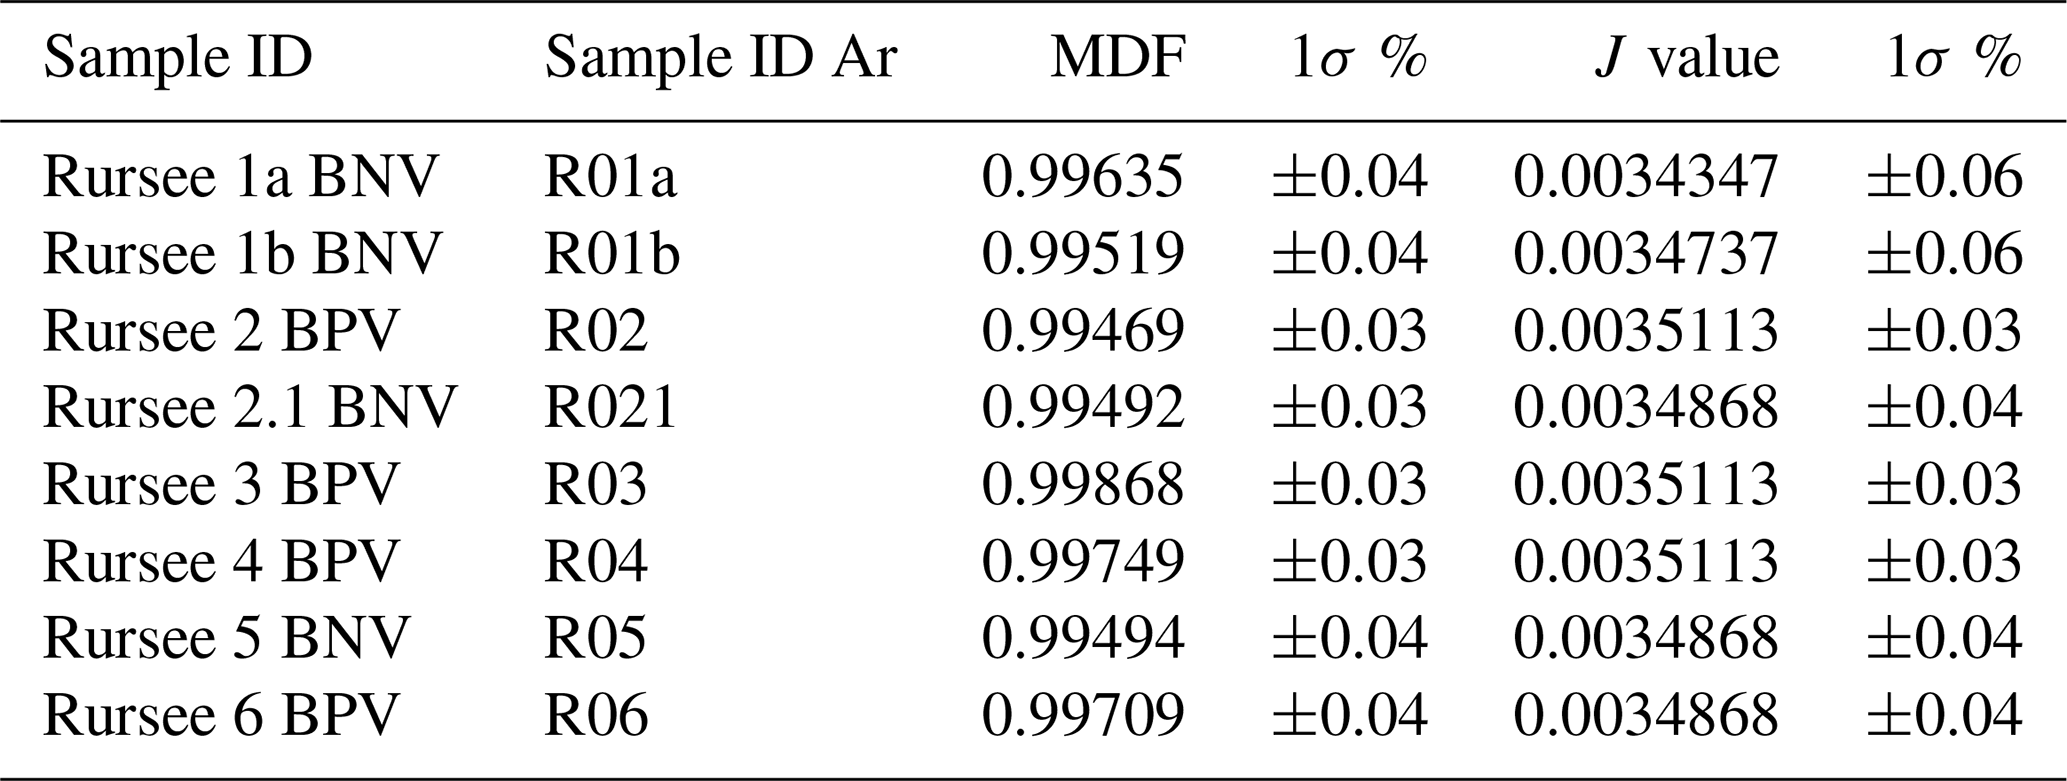
Table C1Rursee quartz vein samples' J values and mass-dependent fractionation (MDF) with analytical error.
All data are included in the tables, appendices, and the Supplement.
The supplement related to this article is available online at https://doi.org/10.5194/gchron-7-173-2025-supplement.
The paper was primarily authored by AAOH, who is the corresponding author. Co-authors KK, JW, and JvdL made substantial contributions to data interpretation and refinement of the paper, enhancing its clarity and depth.
The contact author has declared that none of the authors has any competing interests.
Publisher's note: Copernicus Publications remains neutral with regard to jurisdictional claims made in the text, published maps, institutional affiliations, or any other geographical representation in this paper. While Copernicus Publications makes every effort to include appropriate place names, the final responsibility lies with the authors.
This study has been funded by the FluidNET Consortium of the EU H2020 Marie Skłodowska-Curie Action (no. 956127). We would like to thank Stefan Groen for his assistance in data management and the 40Ar 39Ar analysis laboratory, as well as Roel van Elsas for his help in the Mineral Separation Laboratory at VU Amsterdam. We are grateful to Bouke Lacet for preparing the epoxy grain mounts and thin sections and to Eric Hellebrand and Tilly Bouten for the EPMA analysis. Finally, this study would have been impossible without the support of Janos L. Urai, who introduced us to the Rursee outcrops and unfortunately passed away. We sincerely thank the reviewers, Alexei Ivanov and Hua-Ning Qiu, for their insightful and constructive feedback, which significantly improved the quality of this article.
This research has been supported by the FluidNET Consortium of the EU H2020 Marie Skłodowska-Curie Action (grant no. 956127).
This paper was edited by Fred Jourdan and reviewed by Alexei Ivanov and Hua-Ning Qiu.
Bähr, R.: Das U Th He-System in Hämatit als Chronometer für Mineralisationen, PhD Thesis, University of Heidelberg, Vol. 245, 1–244, https://www.osti.gov/etdeweb/biblio/7007711 (last access: 12 May 2025), 1987.
Bai, X. J., Wang, M., Jiang, Y. D., and Qiu, H.-N.: Direct dating of tin–tungsten mineralization of the Piaotang tungsten deposit, South China, by 40Ar 39Ar progressive crushing, Geochim. Cosmochim. Ac., 114, 1–12, 2013.
Bai, X. J., Hu, R.-G., Jiang, Y.-D., Liu, X., Tang, B., and Qiu, H.-N.: Refined insight into 40Ar 39Ar progressive crushing technique from K–Cl–Ar correlations in fluid inclusions, Chem. Geol., 515, 37–49, https://doi.org/10.1016/j.chemgeo.2019.03.037, 2019.
Bai, X. J., Liu, M., Hu, R. G., Fang, Y., Liu, X., Tang, B., and Qiu, H. N.: Well-Constrained Mineralization Ages by Integrated 40Ar 39Ar and U-Pb Dating Techniques for the Xitian W-Sn Polymetallic Deposit, South China, Econ. Geol., 117, 833–852, https://doi.org/10.5382/econgeo.4889, 2022.
Baksi, A. K.: Geochronological studies on whole-rock basalts, Deccan Traps, India: Evaluation of the timing of volcanism relative to the K-T boundary, Earth Planet. Sc. Lett., 121, 43–56, https://doi.org/10.1016/0012-821X(94)90030-2, 1994.
Baksi, A. K.: A quantitative tool for detecting alteration in undisturbed rocks and minerals – II: Application to argon ages related to hotspots, in: Foulger, G. R. and Jurdy, D. M., Plates, Plumes and Planetary Processes Geological Society of America, https://doi.org/10.1130/2007.2430(16), 2007.
Ballentine, C. J., Burgess, R., and Marty, B.: Tracing fluid origin, transport and interaction in the crust, https://repository.geologyscience.ru/handle/123456789/29036 (last access: 14 December 2023), 2002.
Bambauer, H. U.: Spurenelementgehalte und g-Farbzentren in Quarzen aus Zerrkluften der Schweizer Alpen, Schweiz. Miner. Petrog., 41, 335–369, 1961.
Baumgartner, L. P. and Ferry, J. M.: A model for coupled fluid-flow and mixed-volatile mineral reactions with applications to regional metamorphism, Contrib. Mineral. Petr., 106, 273–285, 1991.
Behr, H.-J., Horn, E. E., Frentzel-Beyme, K., and Reutel, Chr.: Fluid inclusion characteristics of the Variscan and post-Variscan mineralizing fluids in the Federal Republic of Germany, Chem. Geol., 61, 273–285, https://doi.org/10.1016/0009-2541(87)90046-5, 1987.
Bonhomme, M. G., Bühmann, D., and Besnus, Y.: Reliability of K-Ar Dating of Clays and Silicifications Associated with vein Mineralizations in Western Europe, Geol. Rundsch., 72, 105–117, https://doi.org/10.1007/BF01765902, 1983.
Burnard, P., Graham, D., and Turner, G.: Vesicle-Specific Noble Gas Analyses of “Popping Rock”: Implications for Primordial Noble Gases in Earth, Science, 276, 568–571, https://doi.org/10.1126/science.276.5312.568, 1997.
Cartwright, I. and Buick, I. S.: Fluid generation, vein formation and the degree of fluid-rock interaction during decompression of high-pressure terranes: The Schistes Lustres, Alpine Corsica, France, J. Metamorph. Geol., 18, 607–624, https://doi.org/10.1046/j.1525-1314.2000.00280.x, 2000.
Cartwright, J. A., Gilmour, J. D., and Burgess, R.: Martian fluid and Martian weathering signatures identified in Nakhla, NWA 998 and MIL 03346 by halogen and noble gas analysis, Geochim. Cosmochim. Ac., 105, 255–293, 2013.
Chatziliadou, M. and Kramm, U.: Rb-Sr Alter und Sr-Pb Isotopencharakteristik von Gangmineralisationen in paläozoischen Gesteinen am Nordrand des linksrheinischen Schiefergebirges (Raum Stolberg-Aachen-Kelmis) und Vergleich mit den rezenten Thermalwässern von Aachen-Burtscheid (RWTH-CONV-113503, Publikationsserver der RWTH Aachen University), https://publications.rwth-aachen.de/record/51191 (last access: 23 April 2024), 2009.
Cox, S. F.: Structural and isotopic constraints on fluid flow regimes and fluid pathways during upper crustal deformation: An example from the Taemas area of the Lachlan Orogen, SE Australia, J. Geophys. Res.-Sol. Ea., 112, B08208, https://doi.org/10.1029/2006JB004734, 2007.
Féraud, G. and Courtillot, V.: Comment on: “Did Deccan volcanism pre-date the Cretaceous-Tertiary transition?”, Earth Planet, Sc. Lett., 122, 259–262, https://doi.org/10.1016/0012-821X(94)90068-X, 1994.
Fielitz, W.: Variscan transpressive inversion in the northwestern central Rhenohercynian belt of western Germany, J. Struct. Geol., 14, 547–563, https://doi.org/10.1016/0191-8141(92)90156-Q, 1992.
Fielitz, W.: Epizonal to lower mesozonal diastathermal metamorphism in the Ardennes (Rhenohercynian belt of western central Europe), Terra Nostra, 95, p. 95, 1995.
Foland, K. A.: 40Ar 39Ar incremental heating plateaus for biotites with excess argon, Chem. Geol., 41, 3–21, https://doi.org/10.1016/S0009-2541(83)80002-3, 1983.
Franzke, H. J. and Anderle, H.-J.: Metallogenesis, in: Dallmeyer, R. D., Franke, W., and Weber, K., Pre-Permian Geology of Central and Eastern Europe, Springer, 138–150, https://doi.org/10.1007/978-3-642-77518-5_13, 1995.
Germann, A. and Friedrich, G.: Strukturkontrollierte, postvariskische Buntmetallmineralisation in paläozoischen und mesozoischen Sedimentgesteinen der nordwestlichen Eifel, Zeitschrift Der Deutschen Geologischen Gesellschaft, 513–541, 1999.
Glasmacher, U., Zentilli, M., and Grist, A. M.: Apatite Fission Track Thermochronology of Paleozoic Sandstones and the Hill-Intrusion, Northern Linksrheinisches Schiefergebirge, Germany. Advances in Fission-Track Geochronology, Springer Netherlands, 151–172, https://doi.org/10.1007/978-94-015-9133-1_10, 1998.
Glasmacher, U., Tschernoster, R., Clauer, N., and Spaeth, G.: K–Ar dating of magmatic sericite crystallites for determination of cooling paths of metamorphic overprints, Chem. Geol., 175, 673–687, https://doi.org/10.1016/S0009-2541(00)00292-8, 2001.
Goemaere, E. and Dejonghe, L.: Paleoenvironmental reconstruction of the Mirwart Formation (Pragian) in the Lambert Quarry (Flamierge, Belgium), Geol. Belg., 8, 3–14, 2005.
Götze, J., Pan, Y., and Müller, A.: Mineralogy and mineral chemistry of quartz: A review, Mineral. Mag., 85, 639–664, https://doi.org/10.1180/mgm.2021.72, 2021.
Heijlen, W., Muchez, P., and Banks, D. A.: Origin and evolution of high-salinity, Zn–Pb mineralising fluids in the Variscides of Belgium, Miner. Deposita, 36, 165–176, https://doi.org/10.1007/s001260050296, 2001.
Hein, U. F. and Behr, H. J.: Zur Entwicklung von Fluidsystemen im Verlauf der Deformationsgeschichte des Rhenoherzynikums, Göttinger Arbeiten zur Geologieund Paläontologie, Sonderband 1, 191–193, 1994.
Herbst, F. and Muller, H.-G.: Raum und Bedeutung des Emser Gangzuges, Gewerkschaft Mercur, 1969.
Huseynov, A. A. O., van der Lubbe (Jeroen), H. J. L., Verdegaal-Warmerdam, S. J. A., Postma, O., Schröder, J., and Vonhof, H.: Novel Crushing Technique for Measuring δ18O and δ2H Values of Fluid Inclusions (H2O) in Quartz Mineral Veins Using Cavity Ring-Down Spectroscopy, Geofluids, 2024, 5795441, https://doi.org/10.1155/2024/5795441, 2024.
IJlst, L.: A laboratory overflow-centrifuge for heavy liquid mineral separation, Am. Mineral., 58, 1088–1093, 1973.
Jakobus, R.: Die Erzgänge des östlichen Taunus, Geol. Jahrb. Hess., 120, 145–160, 1992.
Jiang, Y. D., Qiu, H.-N., and Xu, Y. G.: Hydrothermal fluids, argon isotopes and mineralization ages of the Fankou Pb-Zn deposit in south China: Insights from sphalerite 40Ar 39Ar progressive crushing, Geochim. Cosmochim. Ac., 84, 369–379, 2012.
Jourdan, A.-L., Vennemann, T. W., Mullis, J., and Ramseyer, K.: Oxygen isotope sector zoning in natural hydrothermal quartz, Mineral. Mag., 73, 615–632, https://doi.org/10.1180/minmag.2009.073.4.615, 2009.
Kats, A.: Hydrogen in alpha-quartz, Philips Res. Rep., 17, 133–195, 1962.
Kelley, S., Turner, G., Butterfield, A. W., and Shepherd, T. J.: The source and significance of argon isotopes in fluid inclusions from areas of mineralization, Earth Planet. Sc. Lett., 79, 303–318, 1986.
Kendrick, M. A.: Comment on “Paleozoic ages and excess 40Ar in garnets from the Bixiling eclogite in Dabieshan, China: New insights from 40Ar 39Ar dating by stepwise crushing by Hua-Ning Qiu and J.R. Wijbrans”, Geochim. Cosmochim. Ac., 71, 6040–6045, https://doi.org/10.1016/j.gca.2007.01.029, 2007.
Kendrick, M. A. and Phillips, D.: Discussion of “the Paleozoic metamorphic history of the Central Orogenic Belt of China from 40Ar 39Ar geochronology of eclogite garnet fluid inclusions by Qiu Hua-Ning and Wijbrans J. R.”, Earth Planet. Sc. Lett., 279, 392–394, https://doi.org/10.1016/j.epsl.2008.12.047, 2009.
Kendrick, M. A., Burgess, R., Pattrick, R. A. D., and Turner, P. G.: Halogen and Ar–Ar age determinations of inclusions within quartz veins from porphyry copper deposits using complementary noble gas extraction techniques, Chem. Geol., 177, 351–370, 2001.
Kendrick, M. A., Miller, J. M., and Phillips, D.: Part II. Evaluation of 40Ar–39Ar quartz ages: Implications for fluid inclusion retentivity and determination of initial 40Ar 36Ar values in Proterozoic samples, Geochim. Cosmochim. Ac., 70, 2562–2576, 2006.
Kendrick, M. A., Scambelluri, M., Honda, M., and Phillips, D.: High abundances of noble gas and chlorine delivered to the mantle by serpentinite subduction, Nat. Geosci., 4, 807–812, https://doi.org/10.1038/ngeo1270, 2011.
Kirnbauer, T., Wagner, T., Taubald, H., and Bode, M.: Post-Variscan hydrothermal vein mineralization, Taunus, Rhenish Massif (Germany): Constraints from stable and radiogenic isotope data, Ore Geol. Rev., 48, 239–257, https://doi.org/10.1016/j.oregeorev.2012.03.010, 2012.
Klügel, T.: Geometrie und Kinematik einer variszischen Plattengrenze. Der Südrand des Rhenoherzynikums im Taunus, Geol. Abh. Hess., 101, 1–215, 1997.
Kötonik, K., Pisarzowska, A., Paszkowski, M., Sláma, J., Becker, R. T., Szczerba, M., Krawczyñski, W., Hartenfels, S., and Marynowski, L.: Baltic provenance of top-Famennian siliciclastic material of the northern Rhenish Massif, Rhenohercynian zone of the Variscan orogen, Int. J. Earth Sci., 107, 2645–2669, https://doi.org/10.1007/s00531-018-1628-4, 2018.
Koppers, A. A. P.: ArArCALC – software for 40Ar 39Ar age calculations, Comput. Geosci., 28, 605–619, https://doi.org/10.1016/S0098-3004(01)00095-4, 2002.
Korsch, R. J. and Schäfer, A.: Geological interpretation of DEKORP deep seismic reflection profiles 1C and 9N across the variscan Saar-Nahe Basin southwest Germany, Tectonophysics, 191, 127–146, https://doi.org/10.1016/0040-1951(91)90236-L, 1991
Kuèera, J., Muchez, P., Slobodník, M., and Prochaska, W.: Geochemistry of highly saline fluids in siliciclastic sequences: Genetic implications for post-Variscan fluid flow in the Moravosilesian Palaeozoic of the Czech Republic, Int. J. Earth Sci., 99, 269–284, https://doi.org/10.1007/s00531-008-0387-z, 2010.
Kuiper, K. F., Deino, A., Hilgen, F. J., Krijgsman, W., Renne, P. R., and Wijbrans, J. R.: Synchronizing Rock Clocks of Earth History, Science, 320, 500–504, https://doi.org/10.1126/science.1154339, 2008.
Lee, J.-Y., Marti, K., Severinghaus, J. P., Kawamura, K., Yoo, H.-S., Lee, J. B., and Kim, J. S.: A redetermination of the isotopic abundances of atmospheric Ar, Geochim. Cosmochim. Ac., 70, 4507–4512, https://doi.org/10.1016/j.gca.2006.06.1563, 2006.
Li, C., Shen, P., Li, P., Sun, J., Feng, H., and Pan, H.: Changes in the factors controlling the chlorite composition and their influence on hydrothermal deposit studies: A case study from Hongguleleng Manto-type Cu deposit, J. Geochem. Explor., 243, 107096, https://doi.org/10.1016/j.gexplo.2022.107096, 2022.
Littke, R., Urai, J. L., Uffmann, A. K., and Risvanis, F.: Reflectance of dispersed vitrinite in Palaeozoic rocks with and without cleavage: Implications for burial and thermal history modeling in the Devonian of Rursee area, northern Rhenish Massif, Germany, Int. J. Coal Geol., 89, 41–50, https://doi.org/10.1016/j.coal.2011.07.006, 2012.
Liu, J., Wu, G., Qiu, H. N., and Li, Y.: 40Ar 39Ar dating, fluid inclusions and S-Pb isotope systematics of the Shabaosi gold deposit, Heilongjiang Province, China. Geol. J., 50, 592–606, 2015.
Lo, C.-H. and Onstott, T. C.: 39Ar recoil artifacts in chloritized biotite, Geochim. Cosmochim. Ac., 53, 2697–2711, https://doi.org/10.1016/0016-7037(89)90141-5, 1989.
Lünenschloss, B., Muchez, P., and Bayer, U.: Late-Variscan fluid migration at the Variscan thrust front of Eastern Belgium: Numerical modelling of the palaeothermal and fluid flow field, Int. J. Earth Sci., 97, 1201–1212, https://doi.org/10.1007/s00531-007-0223-x, 2008.
Mansy, J. L., Everaerts, M., and De Vos, W.: Structural analysis of the adjacent Acadian and Variscan fold belts in Belgium and northern France from geophysical and geological evidence, Tectonophysics, 309, 99–116, https://doi.org/10.1016/S0040-1951(99)00134-1, 1999.
McKee, E. H., Conrad, J. E., Turrin, B. D., and Theodore, T. G.: 40Ar 39Ar studies of fluid inclusions in vein quartz from Battle Mountain, Nevada, US Geological Survey Bulletin, 2039, 155–165, https://books.google.de/books?hl=en&lr=&id=BVHIuwfhcpYC&oi=fnd&pg=PA155&dq=McKee,+E.+H.,+Conrad,+J.+E.,+Turrin,+B.+D.,+and+Theodore,+T.+G.:+50+40Ar+=+39Ar+studies+of+fluid+inclusions+in+vein+quartz+from+Battle+Mountain,+Nevada,+US+Geological+Survey+Bulletin,+2039,+155%E2%80%93+165TS6,+1993.&ots=ITb9Op0OyK&sig=GFYqiLylGNHImKEOWCZxbCc_iGA&redir_esc=y#v=onepage&q&f=false (last access: 30 November 2023), 1993.
Mertz, D. F., Lippolt, H. J., and Müller, G.: Isotopengeochemische (K–Ar, 40Ar 39Ar, Rb–Sr, 87Sr 86Sr) und mineralogische Untersuchungen zur zeitlichen und genetischen Stellung postvariscischer Mineralisationen im Raum Saar-Nahe-Pfalz, Fortschr. Mineral., 64, 116, 1986.
Min, K., Mundil, R., Renne, P. R., and Ludwig, K. R.: A test for systematic errors in 40Ar 39Ar geochronology through comparison with U/Pb analysis of a 1.1-Ga rhyolite, Geochim. Cosmochim. Ac., 64, 73–98, https://doi.org/10.1016/S0016-7037(99)00204-5, 2000.
Moe, A.: Structural development of a volcanic sequence of the Lahn area during the Variscan orogeny in the Rhenohercynian Belt (Germany), Dissertation, Heidelberg University, https://doi.org/10.11588/heidok.00001095, 2000.
Muchez, P., Sintubin, M., and Swennen, R.: Origin and migration pattern of palaeofluids during orogeny: Discussion on the Variscides of Belgium and northern France, J. Geochem. Explor., 69–70, 47–51, https://doi.org/10.1016/S0375-6742(00)00008-X, 2000.
Mullis, J., Dubessy, J., Poty, B., and O'Neil, J.: Fluid regimes during late stages of a continental collision: Physical, chemical, and stable isotope measurements of fluid inclusions in fissure quartz from a geotraverse through the Central Alps, Switzerland, Geochim. Cosmochim. Ac., 58, 2239–2267, https://doi.org/10.1016/0016-7037(94)90008-6, 1994.
Oliver, N. H. S. and Bons, P. D.: Mechanisms of fluid flow and fluid–rock interaction in fossil metamorphic hydrothermal systems inferred from vein–wallrock patterns, geometry and microstructure, Geofluids, 1, 137–162, https://doi.org/10.1046/j.1468-8123.2001.00013.x, 2001.
Oncken, O., Von Winterfeld, C., and Dittmar, U.: Accretion of a rifted passive margin: The Late Paleozoic Rhenohercynian fold and thrust belt (Middle European Variscides), Tectonics, 18, 75–91, 1999.
Onstott, T. C., Miller, M. L., Ewing, R. C., Arnold, G. W., and Walsh, D. S.: Recoil refinements: Implications for the 40Ar 39Ar dating technique, Geochim. Cosmochim. Ac., 59, 1821–1834, https://doi.org/10.1016/0016-7037(95)00085-E, 1995.
Ozima, M. and Podosek, F. A.: Noble gas geochemistry, Cambridge University Press, https://books.google.de/books?hl=en&lr=&id=TMIAfSIe428C&oi=fnd&pg=PP1&dq=Ozima+2002&ots=nf7xTAxMps&sig=eqSMMUxvP69-FZOw2nMB9lwYi6I&redir_esc=y#v=onepage&q=Ozima 2002&f=false (last access: 14 December 2024), 2002.
Pacey, A., Wilkinson, J. J., and Cooke, D. R.: Chlorite and Epidote Mineral Chemistry in Porphyry Ore Systems: A Case Study of the Northparkes District, New South Wales, Australia, Econ. Geol., 115, 701–727, https://doi.org/10.5382/econgeo.4700, 2020.
Perny, B., Eberhardt, P., Ramseyer, K., Mullis, J., and Pankrath, R.: Microdistribution of Al, Li, and Na in á quartz: Possible causes and correlation with short-lived cathodoluminescence, Am. Mineral., 77(5–6), 534–544, 1992.
Porat, N.: Use of magnetic separation for purifying quartz for luminescence dating, Ancient TL, 24, 33–36, 2006.
Potrafke, A., Stalder, R., Schmidt, B. C., and Ludwig, T.: OH defect contents in quartz in a granitic system at 1–5 kbar, Contrib. Mineral. Petr., 174, 98, https://doi.org/10.1007/s00410-019-1632-0, 2019.
Qiu, H.-N.: 40Ar–39Ar dating of the quartz samples from two mineral deposits in western Yunnan (SW China) by crushing in vacuum, Chem. Geol., 127, 211–222, 1996.
Qiu, H.-N. and Dai, T. M.: 40Ar 39Ar techniques for dating the fluid inclusions of quartz from a hydrothermal deposit, Chinese Sci. Bull., 34, 1887–1890, 1989.
Qiu, H.-N. and Jiang, Y. D.: Sphalerite 40Ar 39Ar progressive crushing and stepwise heating techniques, Earth Planet. Sc. Lett., 256, 224–232, 2007.
Qiu, H.-N. and Wijbrans, J. R.: Paleozoic ages and excess 40Ar in garnets from the Bixiling eclogite in Dabieshan, China: New insights from 40Ar 39Ar dating by stepwise crushing, Geochim. Cosmochim. Ac., 70, 2354–2370, 2006.
Qiu, H.-N. and Wijbrans, J. R.: The Paleozoic metamorphic history of the Central Orogenic Belt of China from 40Ar 39Ar geochronology of eclogite garnet fluid inclusions, Earth Planet. Sc. Lett., 268, 501–514, https://doi.org/10.1016/j.epsl.2008.01.042, 2008.
Qiu, H.-N. and Wijbrans, J. R.: Reply to comment by M. A. Kendrick and D. Phillips (2009) on “The Paleozoic metamorphic history of the Central Orogenic Belt of China from 40Ar 39Ar geochronology of eclogite garnet fluid inclusions” by Hua-Ning Qiu and J. R. Wijbrans (2008) [Earth Planet. Sci. Lett. 268 (2008) 501–514], Earth Planet. Sc. Lett., 279, 395–397, https://doi.org/10.1016/j.epsl.2009.01.012, 2009.
Qiu, H.-N., Zhu, B., and Sun, D.: Age significance interpreted from 40Ar–39Ar dating of quartz samples from the Dongchuan copper deposits, Yunnan, SW China, by crushing and heating, Geochem. J., 36, 475–491, 2002.
Qiu, H.-N., Wu, H. Y., Yun, J. B., Feng, Z. H., Xu, Y. G., Mei, L. F., and Wijbrans, J. R.: High-precision 40Ar 39Ar age of the gas emplacement into the Songliao Basin, Geology, 39, 451–454, https://doi.org/10.1130/G31885.1, 2011.
Rama, S. N. I., Hart, S. R., and Roedder, E.: Excess radiogenic argon in fluid inclusions, J. Geophys. Res., 70, 509–511, 1965.
Ramsay, J. G.: The techniques of modern structural geology. The Techniques of Modern Structural Geology, Folds and Fractures, 2, 309–700, 1986.
Rauchenstein-Martinek, K., Wagner, T., Wälle, M., and Heinrich, C. A.: Gold concentrations in metamorphic fluids: A LA-ICPMS study of fluid inclusions from the Alpine orogenic belt, Chem. Geol., 385, 70–83, https://doi.org/10.1016/j.chemgeo.2014.07.018, 2014.
Redecke, P.: Zur Geochemie und Genese variszischer und postvariszischer Buntmetallmineralisation in der Nordeifel und der Niederrheinischen Bucht, IML, 1992.
Ribbert, K.-H., Brunemann, H.-G., Jäger, B., Knapp, G., Michel, G., M. Reinhaerdt, M., Weber, M., and V. Wrede, V.,: Geologische Karte von Nordrhein-Westfalen 1 : 100 000: Erlaüterungen zu Blatt C5502 Aachen, Geologisches Landesamt Nordrhein-Westfalen, 1992.
Schneider, J. and Haack. U.: Rb Sr dating of silicified wall rocks of a giant hydrothermal quartz vein in the SE Rhenish Massif, Germany, Mineral deposits: research and exploration. Where do they meet, 971–972, 1997.
Schneider, J., Haack, U., Hein, U. F., and Germann, A.: Direct Rb Sr dating of sandstone-hosted sphalerites from stratabound Pb-Zn deposits in the northern Eifel, NW Rhenish Massif, Germany, in: Mineral Deposits: Processes to Processing. Proceedings of the 5th Biennial. SGA Meeting and the 10th Quadrennial IAGOD Symposium, edited by: Stanley, C. J., London, 22–25 August, 1287–1290, 1999.
Schroyen, K. and Muchez, Ph.: Evolution of metamorphic fluids at the Variscan fold-and-thrust belt in eastern Belgium, Sediment. Geol., 131, 3, https://doi.org/10.1016/S0037-0738(99)00133-5, 2000.
Schwab, K.: Compression and right-lateral strike-slip movement at the Southern Hunsrück Borderfault (Southwest Germany), Tectonophysics, 137, 115–126, https://doi.org/10.1016/0040-1951(87)90318-0, 1987.
Sintubin, M., Kenis, I., Schroyen, K., Muchez, P., and Burke, E.: “Boudinage” in the High-Ardenne slate belt (Belgium), reconsidered from the perspective of the “interboudin” veins, J. Geochem. Explor., 69–70, 511–516, https://doi.org/10.1016/S0375-6742(00)00034-0, 2000.
Stalder, R., Potrafke, A., Billström, K., Skogby, H., Meinhold, G., Gögele, C., and Berberich, T.: OH defects in quartz as monitor for igneous, metamorphic, and sedimentary processes, Am. Mineral., 102, 1832–1842, https://doi.org/10.2138/am-2017-6107, 2017.
Sterner, S. M., Hall, D. L., and Bodnar, R. J.: Synthetic fluid inclusions. V. Solubility relations in the system NaCl-KCl-H2O under vapor-saturated conditions, Geochim. Cosmochim. Ac., 52, 989–1005, https://doi.org/10.1016/0016-7037(88)90254-2, 1988.
Sumino, H., Dobrzhinetskaya, L. F., Burgess, R., and Kagi, H.: Deep-mantle-derived noble gases in metamorphic diamonds from the Kokchetav massif. Kazakhstan, Earth Planet. Sc. Lett., 307, 439–449, 2011.
Turner, G. and Bannon, M. P.: Argon isotope geochemistry of inclusion fluids from granite-associated mineral veins in southwest and northeast England, Geochim. Cosmochim. Ac., 56, 227–243, 1992.
Turner, G. and Cadogan, P. H.: Possible effects of 39Ar recoil in 40Ar-39Ar dating, Proceedings of the Fifth Lunar Science Conference, Vol. 2, 5, 1601–1615, https://ui.adsabs.harvard.edu/abs/1974LPSC....5.1601T/abstract (last access: 6 August 2024), 1974.
Turner, G. and Wang, S. S.: Excess argon, crustal fluids and apparent isochrons from crushing K-feldspar, Earth Planet. Sc. Lett., 110, 193–211, 1992.
Urai, J. L., Spaeth, G., van der Zee, W., and Hilgers, C.: Evolution of mullion (boudin) structures in the Variscan of the Ardennes and Eifel, Journal of the Virtual Explorer, 3, 1–16, 2001.
Van Noten, K., Kenis, I., Hilgers, C., Urai, J. L., Muchez, P., and Sintubin, M.: Early vein generations in the High-Ardenne slate belt (Belgium, Germany): The earliest manifestations of the Variscan orogeny? Géologie de France, 2007, 170, https://lirias.kuleuven.be/1929596 (last access: 6 June 2023), 2007.
Van Noten, K., Hilgers, C., Urai, J. L., and Sintubin, M.: Late burial to early tectonic quartz veins in the periphery of the High-Ardenne slate belt (Rursee, north Eifel, Germany), Geol. Belg., https://popups.uliege.be/1374-8505/index.php?id=2485 (last access: 19 January 2019), 2008.
Van Noten, K., Berwouts, I., Muchez, P., and Sintubin, M.: Evidence of pressure fluctuations recorded in crack-seal veins in low-grade metamorphic siliciclastic metasediments, Late Palaeozoic Rhenohercynian fold-and-thrust belt (Germany), J. Geochem. Explor., 101, 106, https://doi.org/10.1016/j.gexplo.2008.11.040, 2009.
Van Noten, K., Muchez, P., and Sintubin, M.: Stress-state evolution of the brittle upper crust during compressional tectonic inversion as defined by successive quartz vein types (High-Ardenne slate belt, Germany), J. Geol. Soc., 168, 2, https://doi.org/10.1144/0016-76492010-112, 2011.
Villa, I. M.: Direct determination of 39Ar recoil distance, Geochim. Cosmochim. Ac., 61, 689–691, https://doi.org/10.1016/S0016-7037(97)00002-1, 1997.
Virgo, S., Abe, S., and Urai, J. L.: Extension fracture propagation in rocks with veins: Insight into the crack-seal process using Discrete Element Method modeling, J. Geophys. Res.-Sol. Ea., 118, 5236–5251, https://doi.org/10.1002/2013JB010540, 2013.
von Winterfeld, C.-H. : Variszische Deckentektonik und devonische Beckengeometrie der Nordeifel – ein quantitatives Modell, Aachener Geowiss. Beitr., 2, 319, 1994.
Watson, E. B. and Cherniak, D. J.: Lattice diffusion of Ar in quartz, with constraints on Ar solubility and evidence of nanopores, Geochim. Cosmochim. Ac., 67, 11, https://doi.org/10.1016/S0016-7037(02)01340-6, 2003.
Weil, J. A.: A review of electron spin spectroscopy and its application to the study of paramagnetic defects in crystalline quartz, Phys. Chem. Miner., 10, 149–165, https://doi.org/10.1007/BF00311472, 1984.
Wijbrans, J. R., Pringle, M. S., Koppers, A. A. P., and Scheveers, R.: Argon geochronology of small samples using the Vulkaan argon laserprobe, Proceedings of the Royal Netherlands Academy of Arts and Sciences, 2, 185–218, 1995.
Yardley, B. W. D.: Quartz veins and devolatilization during metamorphism, J. Geol. Soc., 140, 657–663, https://doi.org/10.1144/gsjgs.140.4.0657, 1983.
Yardley, B. W. D. and Bottrell, S. H.: Post-metamorphic gold quartz veins from NW Italy – The composition and origin of the ore fluid, Mineral. Mag., 57, 407–422, 1993.
Ziegler, P. A. and Dèzes, P.: Evolution of the lithosphere in the area of the Rhine Rift System, Int. J. Earth Sci., 94, 594–614, https://doi.org/10.1007/s00531-005-0474-3, 2005.