the Creative Commons Attribution 4.0 License.
the Creative Commons Attribution 4.0 License.
 | 20 Oct 2025
How much K is OK? Evaluating different methods for K-concentration determination and the effect of the internal K concentration on feldspar luminescence dating
Svenja Riedesel
Stephan Opitz
Anja Zander
Anthony Bell
Hanna Cieszynski
Tony Reimann
For luminescence dating of potassium-rich (K) feldspars, the presence of 40K within the K-feldspar grains contributes significantly to the internal dose rate of the sample. Whilst it is common practice to determine uranium, thorium,, and potassium concentrations for external dose rate calculations, the vast majority of studies do not measure the internal K concentration. Instead, most studies apply published K concentrations of 10 ± 2 % (Smedley et al., 2012), 12.5 ± 0.5 % (Huntley and Baril, 1997), or 13 ± 1 % (Zhao and Li, 2005) to their samples. The use of these high literature-based K concentrations is usually justified by two assumptions: (i) only K-feldspar grains with high K concentrations contribute to the luminescence signal significantly, and (ii) we reliably exclude Na-feldspar luminescence signals using filters, with a narrow transmission window around the K-feldspar emission peak of ∼ 410 nm. However, these assumptions may not apply to all samples, and assuming K concentrations that are too high might result in significant dose rate overestimation.
To investigate the effect of the internal K concentration on the dose rate and the validity of the above-mentioned assumptions, we determine the K concentration of a set of 10 density-separated sand-sized K-feldspar samples of different geological origin and chemical composition using four different techniques. We quantify their K concentration on the bulk level using a wavelength-dispersive X-ray fluorescence spectrometer and a β counter and on the single-grain level using a micro X-ray fluorescence spectrometer and a scanning electron microscope (SEM) with an energy-dispersive spectroscopy (EDX) attachment. We use the SEM-EDX single-grain results to calculate two luminescence-weighted K estimates. These two estimates, effective K and luminescent grains, connect the K concentration of a grain to its luminescence signal intensity.
Our experimental results show that (1) there is a good agreement between bulk and average single-grain K-concentration measurements, (2) single-grain K concentrations within one sample can be highly variable across the entire physically possible range of K concentrations for feldspars, and (3) the blue luminescence emission is not dominated by K-rich feldspar grains. For most samples there are considerable differences between the published and the measured K concentrations. These differences result in overestimation of the total dose rate of up to 34.6 % compared to dose rates calculated using measured K concentrations. We therefore suggest routinely measuring the bulk K concentration of each sample, complemented by additional single-grain K-concentration measurements.
- Article
(2583 KB) - Full-text XML
-
Supplement
(3672 KB) - BibTeX
- EndNote


Optically stimulated luminescence (OSL) dating constrains the dose accumulated in mineral grains (in Gy) due to exposure to ionizing radiation and the rate at which this dose was received, termed dose rate (), conventionally given in Gy ka−1. The can be divided into three parts: (i) cosmic dose rate (), (ii) external sediment dose rate () and (iii) internal dose rate (). Total s may underlie changes over time and are furthermore attenuated by water and sediment (e.g. Aitken et al., 1985; Bailiff and Aitken, 1980). The is calculated based on the location of the sample (longitude and latitude, as well as altitude of the sampling location above sea level, and depth below the surface) (Prescott and Hutton, 1994). The and depend on the abundance of certain radioactive elements and factors modifying the received doses, such as the grain size (e.g. Aitken et al., 1985; Bailiff and Aitken, 1980; Durcan et al., 2015).
Most commonly, two minerals, quartz (SiO2) and K-feldspar (KAlSi3O8), are used for OSL dating (e.g. Duller, 2008; Preusser et al., 2008; Wintle, 2008). Although other minerals exhibit luminescence, these two minerals are preferred, mainly for the following reasons: (i) their abundance in various geological settings, (ii) their ability to store charge within defects in their crystal lattice, (iii) their resistance to weathering compared to other luminescent minerals, (iv) the bleachability of their luminescence signals, and (v) the stability of their luminescence signals (e.g. Preusser et al., 2008; Rhodes, 2011). While the vast majority of dating studies used quartz OSL for the past decades, the methodological development in general and the development of the post-infrared infrared stimulated luminescence (post-IR IRSL) protocol in particular (Thomsen et al., 2008) led to an increased use of feldspars also for dating studies (see Sect. 2.2). The biggest difference for the dose rate determination between these two minerals is the internal dose rate (Aitken, 1998). Whilst the in feldspars has been shown to arise from U, Th, K, and Rb within the mineral lattice (Mejdahl, 1987), in quartz, the is believed to be negligible (Aitken, 1985; Szymak et al., 2022). In particular, in K-rich feldspars the can significantly contribute to the total with internal K concentrations of up to 14.05 % (Huntley and Baril, 1997; Smedley et al., 2012). The higher the internal K concentration of a feldspar grain, the greater the (Huntley and Baril, 1997). In general, the smaller the grain size and the bigger the and , the less important the is and therefore the K concentration (Guérin et al., 2012). Especially in settings with predominantly coarse-grained (quartz-rich) sediments, can contribute more than 30 % to the total dose rate (e.g. Reimann and Tsukamoto, 2012, their Table 1) and could therefore lead to systematic errors for coarse-grain feldspar luminescence dating of the same magnitude.
It has been shown that laboratory sample preparation techniques based on density separation do not necessarily result in pure K-rich feldspar extracts in which all grains have a homogeneous K concentration of ∼ 14 % (e.g. Huntley and Baril, 1997; Woor et al., 2022). Therefore, the K concentration used for calculations of a sample should not automatically be assumed to be 14.05 %. Most of the time the K concentration used for calculations is based on literature values (see Sect. 2.2). The most cited studies measured single-grain and bulk sample K concentrations and proposed K concentrations ranging from 10 % to 13 % (Huntley and Baril, 1997; Li et al., 2008; Smedley et al., 2012; Zhao and Li, 2005). It is often assumed that there is a positive correlation between the K concentration and the signal intensity, thus suggesting that predominately grains with a high K concentration contribute to the measured luminescence signals (Huntley and Baril, 1997; Prescott and Fox, 1993; Spooner, 1992). It is further suggested that bright luminescence signals from Na-feldspars should not be transmitted by a blue filter combination, as their main emission peak is not within this region of the spectrum (Huntley and Baril, 1997). Yet, Smedley et al. (2012) found no correlation between single-grain K concentration and signal intensity. They therefore recommended a smaller mid-value of 10 % combined with an error of ± 2 % to account for grains with a lower K concentration which still emit suitable signals. Further studies did not only disagree with the correlation between the K concentration and the signal brightness but also showed that grains with K concentrations below 6 % provide suitable luminescence signals (Maßon et al., 2024; O'Gorman et al., 2021b; Zinelabedin et al., 2022). These studies also showed that in some regions of the world (e.g. Indonesian archipelago or Atacama Desert) the majority of a density-separated feldspar extract might consist of feldspars with low K concentrations and that these feldspars may even influence the bulk feldspar luminescence signal measured in the blue wavelength region. Assuming K concentrations in the range of the proposed literature values for those grains or bulk signals that are dominated by theses grains would very likely result in overestimations of the and therefore the total . This strongly suggests that calculating using K concentrations based on literature values without analysing the geochemical composition of a sample can potentially lead to inaccurate feldspar luminescence ages (O'Gorman et al., 2021b). However, it should be noted that if the internal U and Th concentrations are high, they may partially counteract the overestimation effect caused by assuming too high a K concentration (Smedley and Pearce, 2016; Zhao and Li, 2005). Nevertheless, in this study we focus on the internal K concentration.
We therefore investigate the effect of the K concentration on the and the total by exploring a suite of 10 chemically different samples. Five samples originate from the Atacama Desert, and five samples are selected from study areas from different geological environments from around the world. The K concentrations of the 10 samples are determined using four different techniques in different resolutions. We use a β counter and a wavelength-dispersive X-ray fluorescence spectrometer (WDXRF) to determine two average K concentrations for each sample. Using a scanning electron microscope (SEM) with an energy-dispersive spectroscopy (EDX) attachment and a μ-XRF device, we further determine the K concentrations on the single-grain level of grains that have previously been analysed for their luminescence (cf. Sect. 3.2). The single-grain results are used to test whether there exists a correlation between the K concentration and the brightness of a grain. Therefore, we calculate the following luminescence-weighted K estimates: average K concentration of the grains resulting in a suitable luminescence signal (Tn signal > 3σ above background) and the effective K of these grains (a signal-brightness-weighted K concentration). The single-grain data are also used to analyse the heterogeneity of the K concentration within a sample. To investigate the effect on the total and the we calculate s based on the varying measured K concentrations and luminescence-weighted K estimates. To place our results in the overall context, we conduct a literature review and compare our results with the three most frequently cited K concentrations.
2.1 Feldspar characteristics
Feldspars form a group of aluminium framework minerals with the general formula MT4O8, with T usually being Al3+ and Si4+ and M being Ca2+, Ba+, Na+, and K+ (Deer et al., 2013). However, both M and T can be replaced by, for example, Mg2+, Pb2+, or Fe2+ for M or Ti, Fe3+, or Fe2+ for T (Ribbe, 1983). Si4+ and Al3+ ions are linked by shared O2− ions and thereby form a three-dimensional network. The interstitial spaces in this network are filled with the cations (Ca2+, Ba+, Na+, K+). The feldspar group can be divided into two solid solution series: plagioclase feldspars and alkali feldspars. Each subgroup has distinct endmembers, representing the pure chemical composition at the extremes of their solid solution series. Anorthite (CaAl2Si2O8) and albite (NaAlSi3O8) are the endmembers of the plagioclase group, and albite (NaAlSi3O8), orthoclase (KAlSi3O8), and microcline (KAlSi3O8) are the endmembers of the alkali feldspars. In alkali feldspars, potassium is usually included as K+ ions. However, for dose rate calculations the elemental K concentration is commonly used. We thus refer to the K concentration as the concentration of the element K in these feldspars. The K concentration within a feldspar can range between 0 % and 14.05 % based on stoichiometric calculations and the orthoclase/microcline formula (KAlSi3O8). The maximum K concentration of 14.05 % can only be found in the alkali feldspar endmembers orthoclase or microcline. Typically, K-rich feldspars are the target mineral for feldspar luminescence dating. K-rich feldspars tend to have their emission peak at ∼ 410 nm, while Na-rich feldspars and plagioclases show a dominant emission at ∼ 570 nm (Krbetschek et al., 1996; Spooner, 1992). Filters are used to isolate the desired luminescence emission (Huntley and Baril, 1997).
2.2 Literature review
To get a more profound overview of how K concentrations for calculation in feldspar luminescence dating are usually determined, we conducted a systematic literature review. We used the search function of the Web of Science website (https://www.webofscience.com, last access: 23 January 2024). Using the keywords “luminescence” and “feldspar” together with the setting “in all fields”, we aimed to include all relevant studies. The search results totalled 1664 for the search date (23 January 2024). Since the post-IR IRSL method was first proposed in 2008 (Thomsen et al., 2008), we decided to only include studies published after 2008. The number of studies from 2009 to the search date amounted to 1076. Out of those 1076, merely 432 studies used feldspar for luminescence dating purposes. Most studies were discarded for the following three reasons: (1) the study applied rock surface, quartz, or polymineral fine grain dating; (2) the study was methodological in nature and focussed solely on equivalent dose determination or other luminescence characteristics rather than the or K concentration; and (3) the study used cathodoluminescence in order to analyse the composition of a sample and not optical luminescence dating.
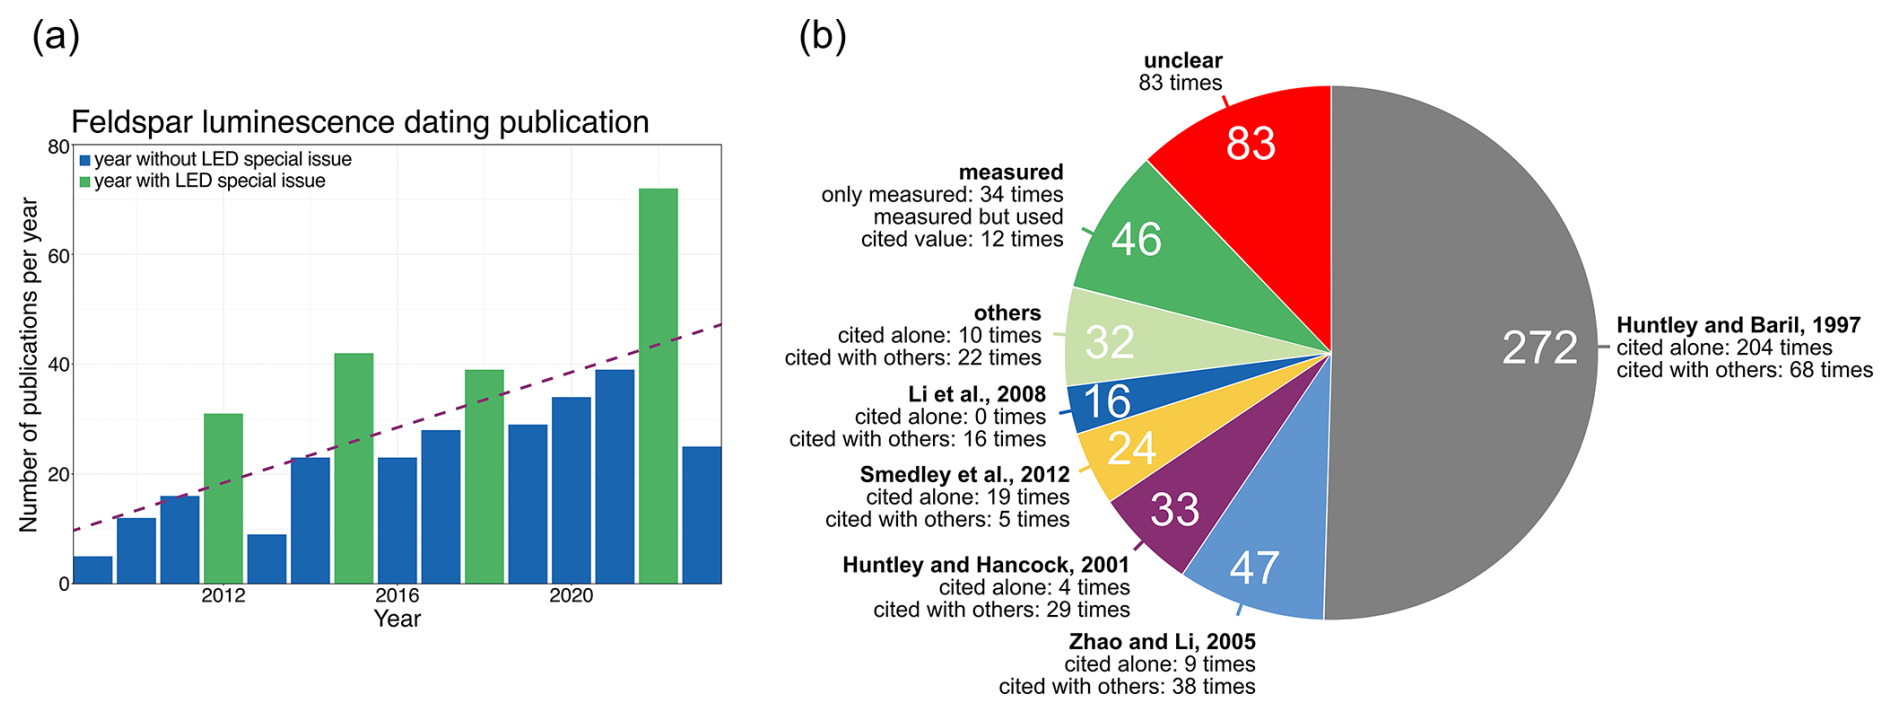
Figure 1Summary of the literature review. (a) Amount of published literature, covering the topic of dose rate determination for feldspar luminescence dating, per year from 2009 until 2023. Green bars represent years after a LED in which a LED special issue was published. The purple dashed line shows the trend of publication numbers per year over time. (b) References given for used K concentrations in the analysed 432 studies. The white numbers within the diagram show the total citation numbers. Note that the total sum exceeds the sum of 432 studies analysed since some studies cited several references. The “unclear” section is the sum of studies who did not cite or mention a K concentration, studies mentioning a value for the K concentration without a reference, and studies vaguely giving information.
Figure 1 shows the number of publications per year, filtered through our search criteria. A generally rising trend of publications can be recognized. In years following an International Luminescence and Electron Spin Resonance Dating conference (LED), a clear increase in published articles can be seen, presumably related to the LED special issues.
The 432 selected studies can be divided into four groups regarding the K concentration used for dose rate determination (cf. Table S1 and Fig. S1 in the Supplement). Group 1 used literature values, i.e. values that were measured or recommended in another publication (n = 302); group 2 measured the K concentrations of their samples yet applied literature values (n = 12); group 3 measured the K concentrations of their samples and used them subsequently for Dint calculations (n = 34); and group 4 did not provide enough information regarding the K concentrations used or if the applied K concentrations were based on literature values (n = 84) (cf. Table S1 and Fig. S1).
A total of 20 different studies were cited for nominal K-concentration values. The five most frequently cited references were Huntley and Baril (1997, n = 272), Zhao and Li (2005, n = 47), Huntley and Hancock (2001, n = 33), Smedley et al. (2012, n = 23), and Li et al. (2008, n = 16) (Fig. 1b). In group four of the selected 432 studies, 48 out of 84 papers did not mention any reference or measurement technique used and did not mention the K concentration used. 18 out of the 84 papers mentioned a K-concentration value they used but did not cite a reference or mention a measurement technique they had used to determine the K concentration. Another 11 out of the 84 papers only provided vague information, such as that the internal dose rate was “taken into account”, with 6 of them citing references which did not have any explicit information in them as well. Lastly, 7 out of the 84 papers cited a reference without specifying the K concentration they used (cf. Fig. S1).
46 studies measured the K concentration of their samples (Fig. 1b). Of those 46 studies, 5 studies did not clearly specify what K concentration they used for dose rate determination (group 3), 29 studies used the measured values (group 3), and 12 studies used literature values instead of their measured results (group 2) (cf. Table S1 and Fig. S1).
In practice, the majority (76 %) of studies based their calculations on a literature value for the K concentration; thus in this study we will compare our measured K concentrations with the above mentioned most frequently used literature K concentrations. Here we give details about the techniques employed and the results obtained by the five most cited references. Huntley and Baril (1997) measured element concentration maps for 2393 single grains from 21 samples originating from 7 geographically distinct areas using SEM. Using the element maps, they determined the proportion of K-feldspars per sample. They further analysed the K concentration of a 0.3 g subsample of each of the 21 samples with commercial atomic-absorption analysis. Combining the determined K concentration per sample with the proportion of K-feldspar per sample, they calculated the K concentration of the K-feldspar fraction per sample. While they observed a cluster around 13 % K, they argued that this value is probably too high due to their calculation methods used. Comparing their results with previous studies and assuming a correlation between the brightness of the luminescence signal and the K concentration, they recommended using a K concentration of 12.5 ± 0.5 %. Furthermore, they noted that this value might not be true for all samples since 2 out of 21 samples had lower K concentrations (8.4 ± 0.8 %, 6.5 ± 0.9 %).
Zhao and Li (2005) selected 16 grains and analysed their K concentration using an electron microprobe. They reported measured single-grain K concentrations between 13 % and 14 % and a K concentration of 9.36 % for their bulk feldspar separate sample. Based on the assumption of a correlation between the signal brightness and the K concentration and a good agreement of their results with the 12.5 ± 0.5 % from Huntley and Baril (1997), they decided to use a K concentration of 13.5 ± 0.2 %. They did not recommend a K concentration that should be used but are often cited as using 13 ± 1 % K (cf. Table S2 in the Supplement).
Smedley et al. (2012) measured single-grain K concentrations on the surface of 87 grains and in-depth profiles of 12 of the 87 grains using laser ablation inductively coupled plasma mass spectrometry. Even though they could not find a general correlation between the brightness of a signal and the K concentration of a grain, the brightest signals were emitted by grains with a K concentration of ∼ 12 %. In total, all grains with suitable luminescence signals had K concentrations between 6 % and 13 %. Therefore, they suggested a K concentration of 10 ± 2 %. The large error was suggested as it covered a wide range of their K concentrations measured within a 95 % confidence interval.
Huntley and Hancock (2001) did not measure a K concentration, nor did they recommend a specific K concentration. They measured Rb concentrations. Most of the papers citing Huntley and Hancock (2001) specify their K and Rb concentration used for calculations in the same sentence. Therefore, the references for the K and Rb concentration used end up in the same brackets at the end of the sentence. Since Huntley and Hancock (2001) are rarely cited alone and did not measure K concentrations, we exclude them for our comparison.
Li et al. (2008) measured bulk K-feldspar samples on a β counter for five different grain sizes for three different samples. They presented K concentrations between 10 % and 14 %. They stated that there might be a contamination by Na-rich feldspars, resulting in underestimation of the K concentration of their luminescent sample. They therefore used a blue filter combination to isolate luminescence signals emitted by K-rich feldspars. To correct for the contamination during calculations, they assumed a K concentration of 13 ± 1 % slightly larger than their measured minimum. Since Li et al. (2008) do not give recommendations, are never cited alone, and are mostly cited with the same K concentration as Zhao and Li (2005), Li et al. (2008) will not be used for our comparison.
Unfortunately, in many feldspar luminescence studies, the values cited for the internal K concentration used often do not match the referenced sources (cf. Table S2). This is partly due to the fact that several sources that recommend different values are cited at once. In some cases, the K concentration used does not fit any of the cited sources. It is noteworthy that most articles did not state why they used a specific value and why and how they changed the cited value. A detailed table of the five most cited sources, the K concentration recommended, and the K concentrations that other studies used despite giving a reference can be found in Table S2. Only Huntley and Baril (1997), Zhao and Li (2005), and Smedley et al. (2012) are used for benchmarking purposes in this study. And given that Zhao and Li (2005) is usually cited as 13 ± 1 % K, we also use this value for our comparisons.
3.1 Samples and sample preparation
We selected 10 samples with differing chemical compositions and varying origins for our analysis.
Table 1Sample description. Sample MBT-I-2430 was prepared in the laboratory of the University of Lausanne. Sample KTB-383-C was prepared at Risø. All other samples were prepared at the Cologne Luminescence Laboratory.
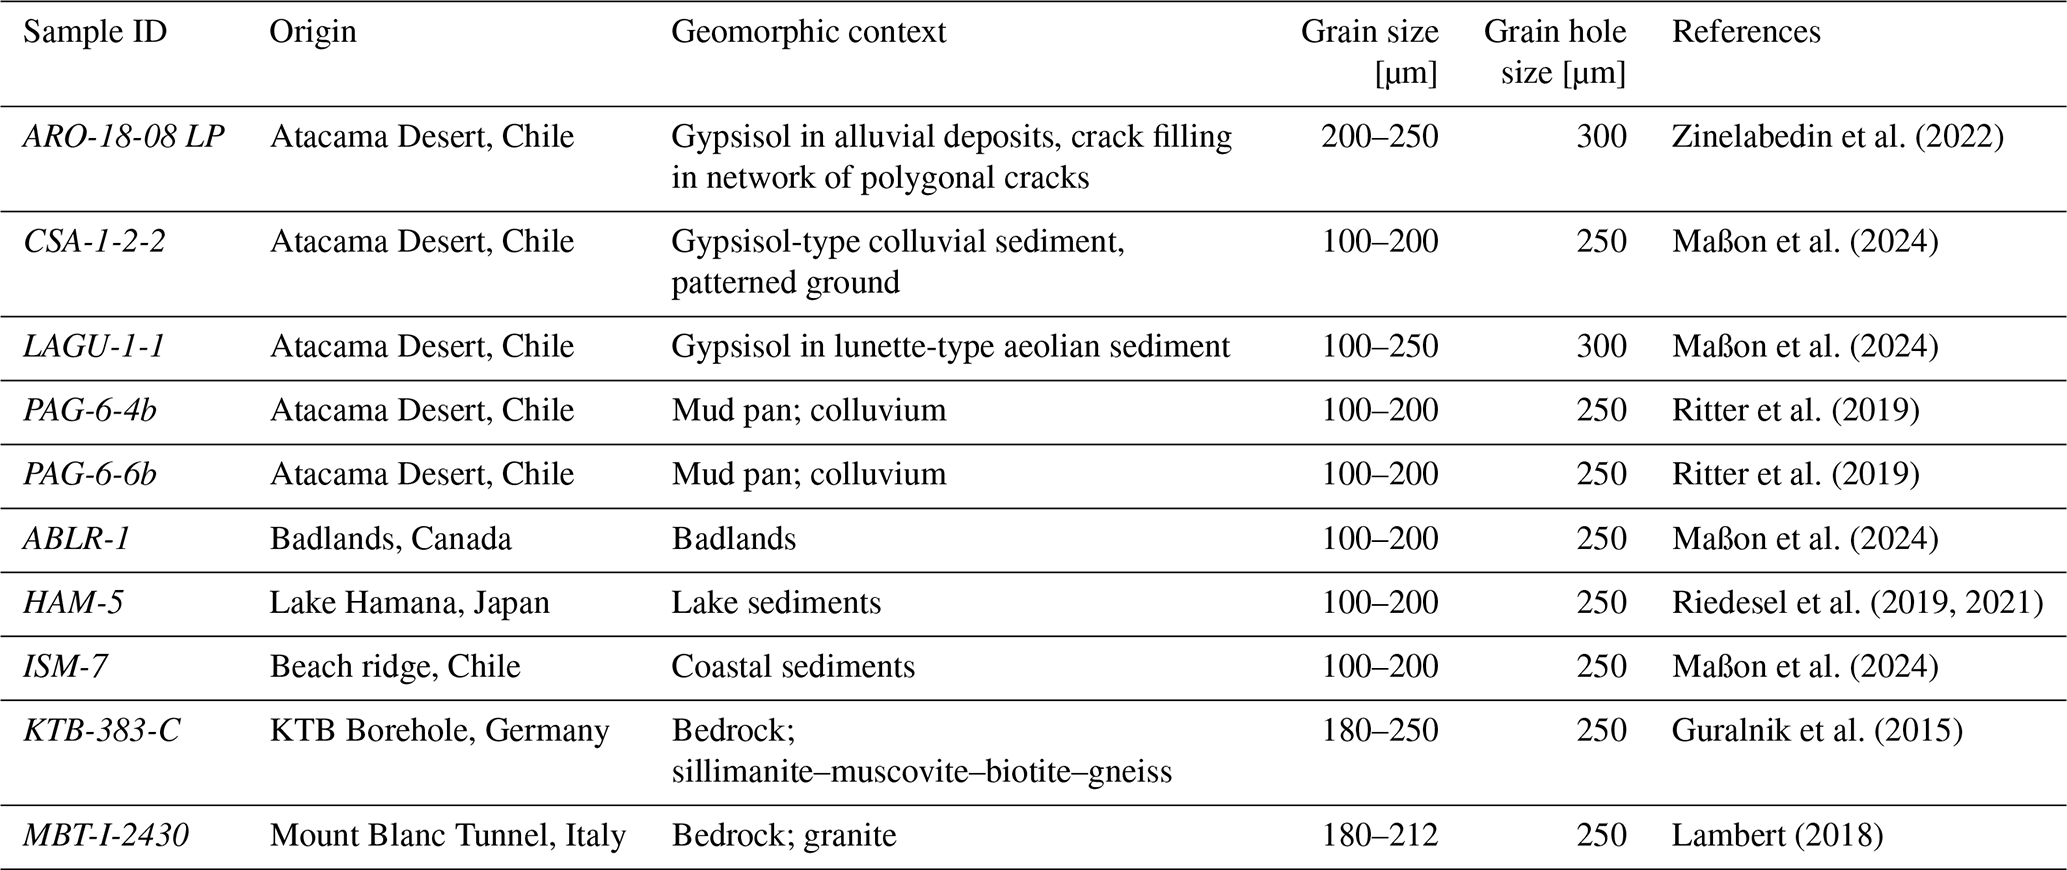
Maßon et al. (2024) previously analysed the same set of samples for their luminescence characteristics and single-grain K concentrations based on SEM-EDX measurements. The first half of the samples were collected within the Atacama Desert in Chile (ARO-18-08-LP, CSA-1-2-2, LAGU-1-1, PAG-6-4b, PAG-6-6b). The second half of the samples originate from different geological locations from around the world: badlands in Canada (ABLR-1), lake sediments in Japan (HAM-5), a beach ridge in Chile ∼ 1000 km south of the Atacama Desert (ISM-7), the Continental Deep Drilling (KTB) borehole in Germany (KTB-383-C), and the Mont-Blanc tunnel in Italy (MBT-I-2430). The non-Atacama samples were chosen to capture the wider range of chemical and structural variations of the alkali feldspar solid solution series. These variations range from very low K concentrations in sample KTB-383-C (∼ 2.5 % K, Guralnik et al., 2015) to high K concentrations in the sample MBT-I-2430 (∼ 10.8 % K, Riedesel et al., 2021). Table 1 summarizes general information on the samples
Preceding the luminescence and K-concentration measurements, the samples underwent a series of preparatory treatments. The samples were sieved a first time, to remove fine (<63 µm) and coarse (> 400 µm) material. Afterwards they were treated with HCl (10 %) to remove carbonates, with H2O2 (10 %) to dissolve organic material and with Na2C2O4 (0.01 N) to disperse the particles. Subsequently, the samples were sieved a second time to obtain the desired grain size fraction (cf. Table 1). To enrich the K-rich feldspar fraction, a heavy liquid density separation was used (ρ < 2.58 g cm−3). Sample preparation for KTB-383-C and MBT-I-2430 differed slightly (see Guralnik et al., 2015; Lambert, 2018, for further details), with the extracted feldspar fraction of KTB-383-C being etched with diluted HF. Both samples are rock samples; therefore, the light-exposed outer surface was removed prior to sample processing, and the remaining material was subsequently crushed. Neither sample was dispersed using Na2C2O4.
3.2 Luminescence measurements
The samples were brushed into standard single-grain discs (see Table 1 for grain hole size) under a microscope under white-light conditions. A single hair was used to individually place grains into each of the 100 grain holes per disc, ensuring one grain per hole. In samples CSA-1-2-2, HAM-5 and KTB-383-C, however, occasionally two grains occupied a single hole. We administered the same dose to all samples in a single-grain dose recovery test, to avoid a bias that could be attributed to a difference in the absorbed dose. Before performing single-grain dose recovery tests, all mounted grains were exposed to a SOL2 solar simulator for 24 h to reset the luminescence signal prior to administering a dose of 150 Gy. Per sample, three discs of 100 grains each were prepared and measured following the post-IR IRSL175 protocol outlined in Table S3 in the Supplement. Further details on the reader used for luminescence measurement, the measurement protocol, and the De estimation including the rejection criteria used are reported in Maßon et al. (2024).
3.3 Determination of K concentrations in feldspars
For all methods, which determined the K concentration in the oxide form (% K2O), the results need to be converted to a non-oxide element concentration (% K) to compare them to the most cited literature values. This was done by multiplying the K2O concentration results by a conversion factor of 0.830147 based on the molar masses of K (39.1 g mol−1) and O (16.0 g mol−1) (e.g. Prohaska et al., 2022). Therefore the weight of the element within the oxide (2⋅39.1 g mol−1) is divided by the weight of the oxide (2 ⋅ 39.1 g mol−1 + 16.0 g mol−1) (e.g. Al-Mishwat, 2016).
3.3.1 β counter measurements of bulk material
For bulk K-concentration determination, a low-level beta multicounter system (Risø, GM-25-5A Bøtter-Jensen and Mejdahl, 1988) with five sampling positions was used. The β counter was surrounded by lead blocks and covered with blankets to shield the samples from external irradiation and from light, respectively. Each sampling position within the β counter differs slightly in the measurement results. A position correction factor was therefore applied. For this purpose, the positions were calibrated in between measurements using a 36Cl standard. The standard was measured for 5 min on each position, and afterwards the counts per minute were normalized to position one. As the fifth position in the 36Cl measurements always deviated significantly from the other four and showed considerable fluctuations, this position was not used.
For the measurements on the β counter two sampling cups for each sample were prepared following Bøtter-Jensen and Mejdahl (1985). Only one cup of sample KTB-383-C could be prepared, as there was not enough sample material available. Under subdued red-light conditions, 100 mg of the density-separated feldspar extract (see Sect. 3.1) sample material was distributed evenly on the bottom of an upside-down β counter cup. A labelled piece of cling film was placed on top and secured with a plastic ring (cf. Fig. S2 in the Supplement). In the same way, one cup was loaded with a K-feldspar standard (FK-N bought via Service d'Analyse des Roches et des Minéraux, K2O concentration 12.81 %, Rb concentration 860 ppm) and one cup with finely ground sucrose (icing sugar from the brand Ja!) to act as blank measurement. The first four positions of the β counter were filled with two cups of a sample, one cup of the standard and one cup of finely ground sucrose. Each sample was measured for 96 h. After 48 h the position of the two cups with sampling material was switched. The counts per hour of each position were recorded. Although the β counter is surrounded by lead blocks, there is a small amount of background radiation that penetrates to the detectors inside. As sucrose does not emit beta radiation, the background radiation was measured at the position of the sucrose cup. After the position correction of the hourly counts, the measured background per hour was subtracted from the other positions. Since the K concentration of the standard is known, the counts of the sample cups were converted to K concentrations using cross-multiplication. This was based on the assumptions that the ratio of K to Rb in our samples was close to the ratio within the standard and that all the counted beta radiation emitted came from the internal K and Rb of the samples. We neglected that a small proportion of the beta radiation may be emitted by internal U and Th. We used the average of all 192 hourly K-concentration values per sample as the β counter K concentration of each sample. We added a reproducibility error to our results in terms of the standard error of all 192 measurements.
3.3.2 WDXRF of bulk material
For measurements using the wavelength-dispersive X-ray fluorescence spectrometer (WDXRF; Rigaku, ZSX Primus IV), 100 mg of each sample was ground to powder by hand in an agate mortar. A mixture of 100 mg of a cellulose binder (C6H10O5) and 100 mg of sample material was spread on top of 2000 mg of cellulose binder in aluminium sample boat. This was then pressed at 20 t using a Retsch PP40 press to make pressed pellet samples suitable for XRF. The spectrometer was equipped with a Rh anode X-ray source. The XRF spectra were measured over the element range of F to Cm. Each sample was measurement once for a duration of 17 min. The WDXRF device calculates the results without specifying a measurement uncertainty. The software calculated the elemental composition based on the assumption that all elements, except chlorine (Cl), were present in the form of oxides.
Samples KTB-383-C and MBT-I-2430 were measured on a different WDXRF device (PANalytical MagiX PRO XRF), also equipped with a Rh anode X-ray source (see Riedesel et al., 2021 for MBT-I-2430). As there was insufficient sample material available, it was not possible to perform another measurement on the same device on which the other samples were measured. For those two samples, pressed pellets were prepared as indicated above. Spectra were collected across 10 distinct energy ranges and subsequently analysed to yield semi-quantitative results.
3.3.3 Single-grain SEM-EDX measurements
After conducting the luminescence measurements, double-sided sticky tape was affixed to a glass microscope slide on one side and then placed with the other side on the upper surface of the single-grain discs (cf. Fig. S3 in the Supplement). The grains were transferred onto the tape by gently tapping the bottom side of the discs with a piezoelectric ultrasonic cleaner (vibration frequency 30 ± 3 kHz). On average, approximately 80 % of the grains were successfully extracted. Before removing the discs from the tape, the positioning holes' locations were drawn on the tape. To fixate the grains, a colourless two-component epoxy resin (Huntsman, Araldite 2020) was used. The location of the position holes was transferred onto the epoxy disc. Finally, it was ensured that no epoxy covered the grains. Therefore, the epoxy discs were sanded and polished with 1200 SiO2 sandpaper. All samples were carbon coated. For each sample, this process was applied to three single-grain discs. Only two usable epoxy discs were produced for the samples ISM-7, LAGU-1-1 and MBT-I-2430, as the grains in one disc each changed their position during the epoxy curing process.
A Zeiss Sigma 300-VP scanning electron microscope (SEM) equipped with an Oxford instruments energy-dispersive spectroscopy (EDX) detector X-MaxN 80 was used to determine the major element chemistry of the individual grains. The SEM-EDX was operated at a working distance of 8.5 mm, with an aperture diameter of 60 µm and an accelerating voltage of 20 kV, resulting in an output count rate of approximately 45 000 cps. The penetration depth of the measurements depends not only on the measurement settings but also on the material being analysed and can therefore vary. However, it is generally on the order of a few micrometres (Kanaya and Okayama, 1972). The chemical composition of individual feldspar grains was determined through stoichiometric calculations based on the elements O, Na, Mg, Al, Si, K, Ca, Ti, and Fe (see Table S4 in the Supplement for exemplary stoichiometric calculations and Fig. S4a and b in the Supplement for exemplary spectrum and fit). For this purpose, polygons were manually delineated over the individual grains, and the average composition within each polygon was subsequently calculated.
3.3.4 Single-grain μ-XRF measurements
One of the epoxy discs described in Sect. 3.3.3 per sample was also measured using an energy-dispersive μ-XRF (Bruker M4 Tornado) equipped with a Rh anode and operating at 50 kV and 300 µA and a poly-capillary optic. With a beam spot size of 20 µm and a spatial resolution of 40 µm, an element map of the whole disc was measured. Each measurement point was acquired with an integration time of 100 ms. The analyses were performed under a controlled vacuum environment maintained at 20 mbar to enhance sensitivity for light elements. Before measurement, an energy calibration for the Bruker Tornado M4 was carried out using the Mn standard. Data acquisition was facilitated by two silicon-drift detector systems, enabling high-resolution elemental mapping. The penetration depth depends on the material analysed but is generally greater than 1 mm; thus the collected signal originates from the entire grain, rather than just from its polished surface. For analysis the same elements as for the SEM-EDX measurement were selected (O, Na, Mg, Al, Si, K, Ca, Ti, and Fe). Afterwards, polygons were manually delineated over the individual grains, and the average composition within each polygon was subsequently calculated through stoichiometry (see Table S4 for exemplary stoichiometric calculations and Fig. S4c and d for exemplary spectrum and fit).
3.4 Calculations of the luminescence-weighted K estimates
It is often assumed that there is a correlation between the brightness of a grain and its K concentration (Prescott and Fox, 1993; Spooner, 1992). Therefore, the K concentration of a sample is expected to be higher for the brightest grains of a sample (Reimann et al., 2012; Smedley et al., 2012). To test this hypothesis, we calculated a luminescence-weighted K estimate for each sample: the effective K. The effective K is based on the K concentration of single grains and a weighting factor based on the signal intensity of the Tn signal of the same grains. The effective K is calculated as follows:
-
Dismiss grains from a sample without SEM-EDX values.
-
Dismiss quartz grains, e.g. grains consisting of pure SiO2 (on average a sample contained 2.6 % quartz grains).
-
Sort the grains in descending order according to their background-corrected Tn signal intensity.
-
Set negative background-corrected Tn signal values to zero.
-
Sum up the background-corrected Tn values to obtain the total background-corrected Tn signal intensity.
-
Calculate the percentage of each grain in the total background-corrected Tn signal intensity.
-
Multiply the percentage of the total background-corrected Tn signal intensity by the K concentration of the grain.
-
Sum up the results from step 7 to obtain the effective K concentration of the sample.
We also calculated the average K concentration for all “luminescent grains” per sample. We defined “luminescent grains” as grains with Tn signal intensities greater than three standard deviations above its background. For a better readability the average K concentration for all luminescent grains will be referred to as the luminescent grains.
3.5 Dose rate calculations
The dose rate and age calculator (DRAC; Durcan et al., 2015) was used for all dose rate calculations. For each sample several total s including the corresponding , , and were calculated based on the different K concentrations: one total for each of the three most cited K concentrations (10 ± 2 %, 12.5 ± 0.5 %, 13 ± 1 %), the measured WDXRF and β counter K concentrations, the average SEM-EDX and μ-XRF K concentration, the effective K, and the luminescent grains. Since we are not yet able to calculate at a single-grain level, we have not calculated at a single-grain level. Except for the K concentration, the radionuclide concentrations factor, and the grain size attenuation factors, the input values from the studies cited in Table 1 were taken. If a study did not contain all necessary input values for a sample, an attempt was made to use values that were as appropriate as possible. The accuracy of all input values except for the K concentration is of secondary importance in this study, as the influence of the K concentration on the total is mainly to be considered. For further details on individual calculation input variables, see Table S5 in the Supplement.
The sample selection of this study aimed at analysing a variety of different feldspars, with a focus on samples from the Atacama Desert in Chile. Therefore, our findings might not reflect the majority of samples analysed elsewhere. Although it has been shown that the in feldspars arises from U, Th, Rb, and K (Smedley and Pearce, 2016), we focussed on the contribution of internal K concentrations to the , thus excluding the contribution of the internal alpha to the total . This may result in an underestimation of the in grains where the internal U or Th concentrations are unexpectedly high (see Smedley and Pearce, 2016; Zhao and Li, 2005).
Each of the presented methods to determine the K concentration has its own limitations. Hence, before discussing the results, all methods need to be critically reviewed. All four methods are semi-quantitative and can therefore only result in approximate K concentrations, which should not be compared directly. The most cited literature values are based on quantitative and semi-quantitative measurements. However, the values for the K concentrations cited are in all three cases just estimates of the correct average K concentration.
The β counter method relies on the assumption that the ratio between K and Rb, Th, and U within a sample is the same as within the standard that is used for comparison. However, Buylaert et al. (2018) did not find a constant relationship between K and Rb, and Smedley and Pearce (2016) found variability in the internal U and Th concentrations. Even though the K-to-Rb ratio should be similar and the internal U and Th concentrations should be negligible for most samples, this might introduce an error (Huntley and Hancock, 2001; Smedley and Pearce, 2016). Nevertheless, the β counter method is a fast, cost-efficient, and easy way to obtain an estimate of the internal K concentration of a sample. If the measurement can be conducted in the dark, the sample material can still be used for any subsequent luminescence measurements, and no sampling material will be lost.
With the WDXRF a wider range of elements can be measured simultaneously in a short amount of time. It requires additional sample preparation steps, and thus a small proportion of the sampling material cannot be used for further luminescence measurements following WDXRF.
Incorrect estimates of the K concentration can occur with both bulk material methods if a non-representative sub-sample is measured. This can become a problem especially with heterogeneous samples. If sufficient sample material is available, several sub-samples should therefore be measured.
For SEM-EDX single-grain measurements, the grains need to be fixated in resin and polished afterwards. During this process entire grains might get lost, or polishing might result in the removal of parts of the grain. Alkali feldspars, often characterized by exsolution lamellae, can have a heterogeneous distribution of K+ ions in their lattice. Removing part of the grain through polishing might therefore influence the measured overall K concentration of the grain. Nevertheless, previous studies have shown that the outer surface of feldspar grains can differ in their elemental concentration compared to the interior of the grain (e.g. Smedley et al., 2012) as a result of weathering processes (Parish, 1994). Therefore, polishing offers the advantage of avoiding a bias from potential surface coatings. It should also be noted that, due to the shallow penetration depth of SEM-EDX (on the order of a few micrometres), only elemental concentrations of the polished surface are captured, and any heterogeneity deeper within the grain remains undetected. It is further possible that not only the grain but also parts of the surrounding resin will be measured, due to inaccurate polygon selection, which can thus influence the average K concentration of the grain. The preparation, measurement, and analysis process of SEM-EDX single-grain measurements is more time consuming and costlier than for the presented bulk measurements.
The μ-XRF method is most suitable for polished surfaces. Thus, for best results it requires the same sampling preparation steps as the SEM-EDX measurement, inducing the same limitations as mentioned above. Since the penetration depth of μ-XRF measurements exceeds the grain diameter, parts of the epoxy resin below the grains will be measured as well. The epoxy resin used consists mainly of elements that cannot be detected with the μ-XRF device (H, O, C, N). As a result, the resin does not contribute to the measured spectrum, and the relatively deep penetration depth of the method is not problematic in this context. Furthermore, for the measurements, polygons have to be drawn onto the sample area of interest to define regions of interest for the subsequent measurement. Dependent on the shape, colour, and opacity of the grain, tracing the ideal grain shape was difficult, leading to measurements of only parts of the grains in some cases or, alternatively, resulting in measuring resin in addition to the actual grain. If a measurement point within a polygon falls entirely within the epoxy resin, it will influence the average value calculated for that polygon. Particularly in the measurements of sample CSA-1-2-2, epoxy resin was included in the analysed polygons, resulting in lower total K concentrations in grains for which resin was included in the polygon shape. In all other samples the K concentration determined with the μ-XRF is higher compared to the SEM-EDX (cf. Sect. 5.2). Moreover, the embedding process is relatively time consuming. For routine applications, a direct measurement of grains without resin embedding could be a practical alternative. This approach reduces preparation time but may decrease the measurement precision. However, it must be taken into account that the material on which the grains are mounted (e.g. a single-grain disc or adhesive tape) is also included in the μ-XRF measurement due to the large penetration depth of the μ-XRF method. The potential effect of this on the measured K concentrations was not investigated in this study. Since the penetration depth of μ-XRF measurements exceeds the grain diameter, analyses of both polished, resin-embedded grains and unembedded grains can be affected by surface coatings. Nevertheless, this influence is expected to be minimal because the surface layer only constitutes a small proportion of the total irradiated volume, and the signal is largely dominated by the grain interior. The μ-XRF device we used in this study is not effective in measuring light elements, including Na. Since Na is one of the major constituents of feldspar, not determining its correct concentration might lead to the overestimation of all element concentrations measured, including K. This could explain measurements yielding K concentrations above the maximum possible K concentration of 14.05 %. Both the SEM-EDX device and the μ-XRF were not specifically calibrated with feldspar standards for the measurements. Calibration with different feldspar standards could increase the accuracy of both methods.
Both single-grain-based geochemical methods are time consuming in terms of sample preparation, measurement preparation and data processing, even if the measurements themselves can be carried out overnight. However, O'Gorman et al. (2021a) developed a fast and automated K-concentration measurement method using a quantitative evaluation of minerals using energy-dispersive spectroscopy (QEM-EDS) technique. Unfortunately, this method was not available to us. The two bulk-sample measurement methods, on the other hand, are less laborious than the single-grain methods available to us. Yet, they provide no information regarding the heterogeneity of the samples.
This section presents and evaluates results of the K-concentration determination on the bulk and average (5.1), as well as on the single-grain level (5.2). In Sect. 5.1 we compare K concentrations obtained for bulk samples with averages obtained from single-grain-based measurements and the luminescence-weighted K estimates effective K and luminescent grains. Section 5.2 gives detailed information on the variation in K concentrations found on the single-grain level using SEM-EDX and μ-XRF measurements. Finally, in Sect. 5.3 we detail practical implications of our experimental observations.
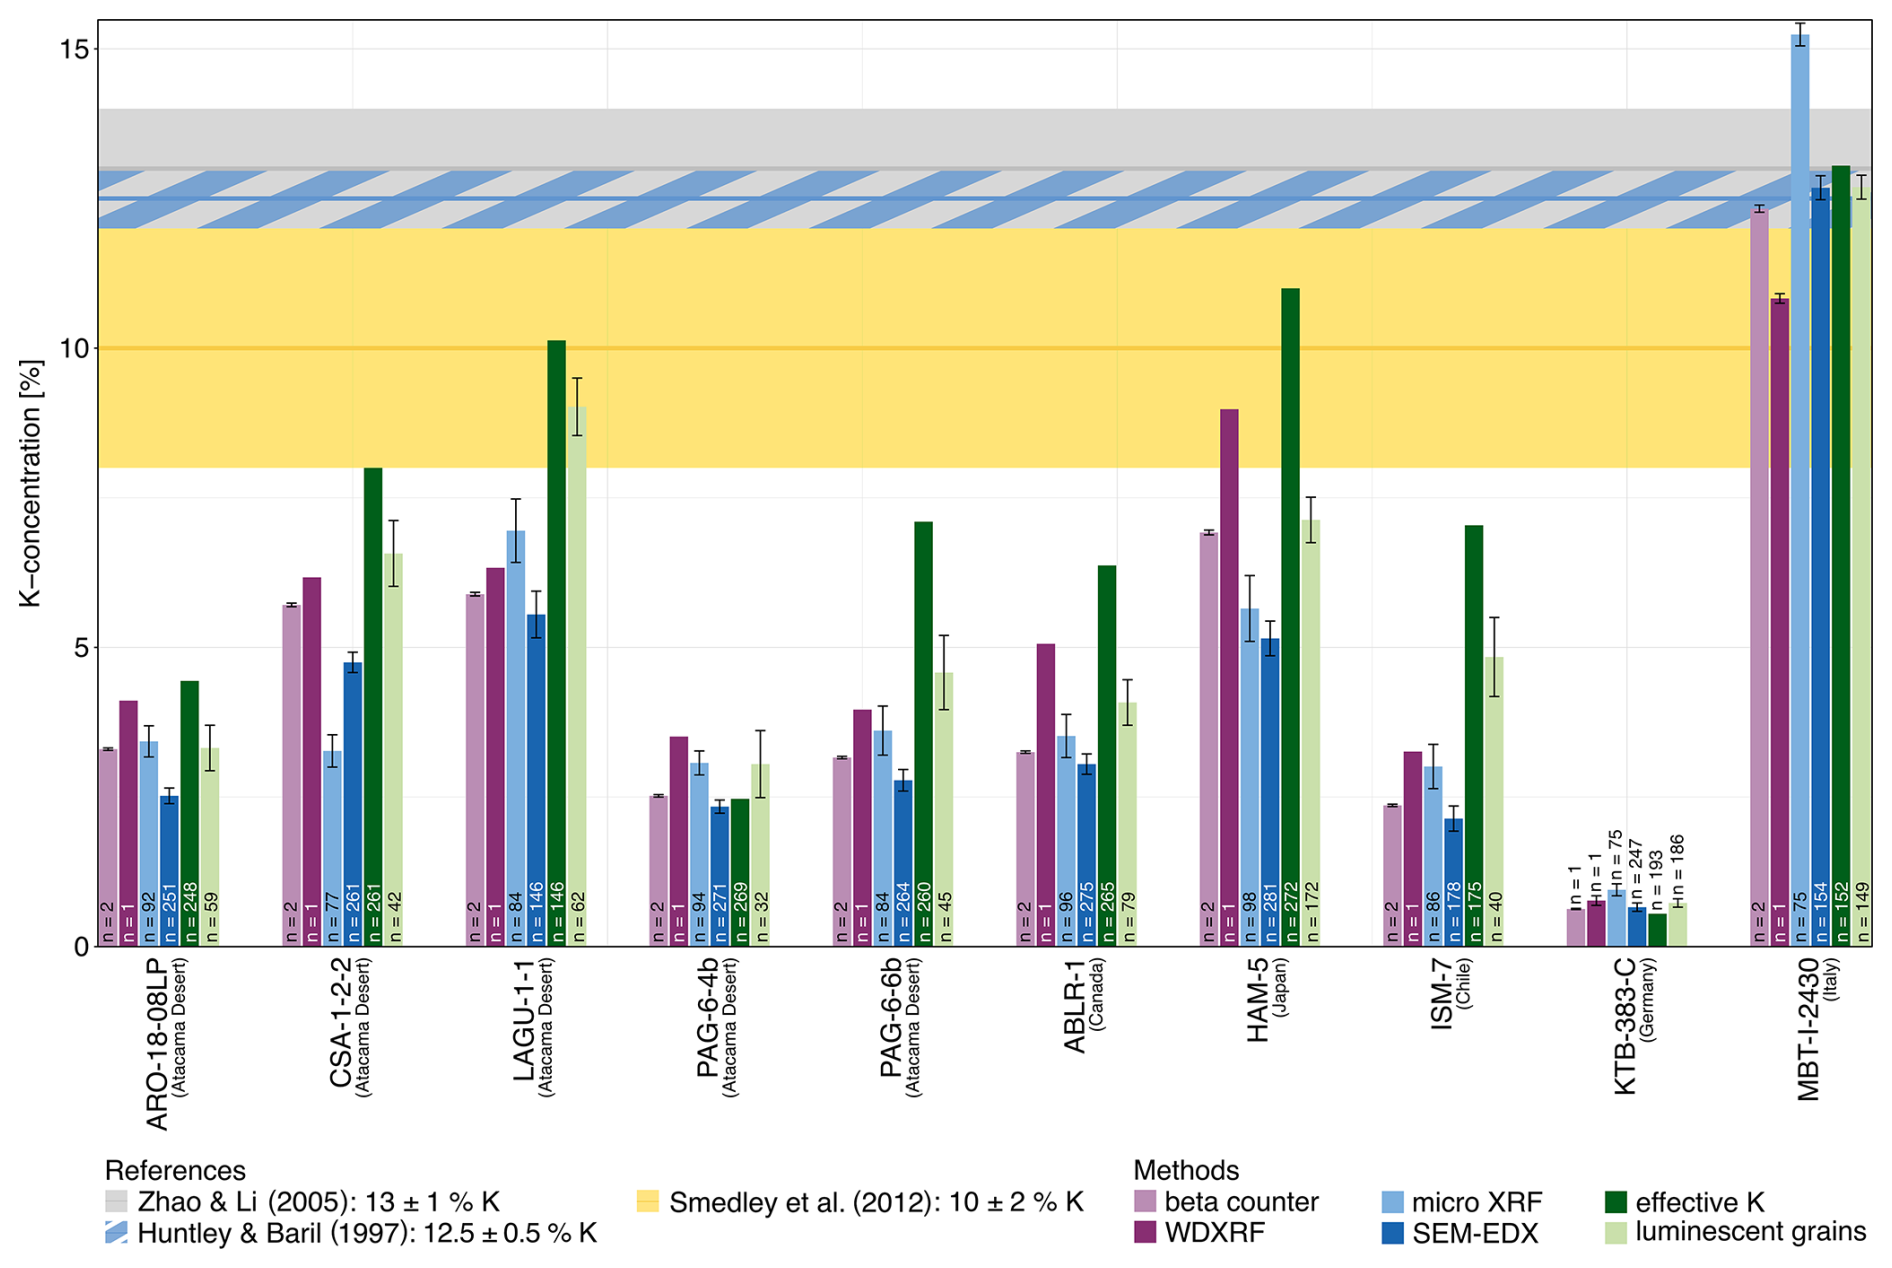
Figure 2K concentrations for each sample determined with different methods, respectively calculated from measured K concentrations. For the single-grain measurements (μ-XRF and SEM-EDX), the averages are presented. The error bars represent the standard errors. Horizontal bars represent the most frequently used literature values for the K concentration and their corresponding errors of 10 ± 2 %, 12.5 ± 0.5 %, and 13 ± 1 %.
5.1 Bulk sample measurements and sample average concentrations
Figure 2 presents all measurement results performed on bulk sample material (β counter and WDXRF), the average values for the single-grain measurements (SEM-EDX and μ-XRF), and the calculated luminescence-weighted K estimates effective K and luminescent grains and compares them to the most commonly used literature values (cf. Sect. 2.2).
Across all measurement techniques, MBT-I-2430 is the sample with the highest K concentrations (10.8 %–15.2 %) and KTB-383-C the sample with the lowest K concentrations (0.6 %%–1.0 %). Considering the uncertainties reported, the literature values suggest K concentrations from 8 % (lowest value by Smedley et al., 2012) to 14 % (highest value suggested by Zhao and Li, 2005). From our samples, measurement results of only two samples lie within this range. In the case of HAM-5 the WDXRF results (9.0 %) and in the case of MBT-I-2430 the β counter results (12.3 ± 0.1 %), WDXRF results (10.8 ± 0.1 %), and average SEM-EDX (12.7 ± 0.2 %) results are within the range of at least one of the proposed literature values. The average μ-XRF K concentration for sample MBT-I-2430 (15.2 ± 0.2 %) is the only measured value above the suggested range. Potential reasons for this K concentration being greater than the maximum possible K concentration of feldspars (14.05 %) are discussed in Sect. 4. Measurements of all other samples are on average 55.6 % below the lowest value suggested by Smedley et al. (2012). The greatest total difference is 12.4 % K between the β counter K concentration of sample KTB-383-C with 0.6 ± 0.1 % K and the literature value from Zhao and Li (2005) with 13 ± 1 % K.
In each sample a different number of grains was used for the calculation of each of the luminescence-weighted K estimates effective K and luminescent grains (cf. Fig. 2). The number of grains used ranges from 32 grains for the calculation of the luminescent grains in sample PAG-6-4b up to 272 grains for the calculation of the effective K for sample HAM-5. Comparing the 20 calculated luminescence-weighted K estimates to the three most cited K concentrations, only five of them are within the suggested range of 8 %–14 % K. The five luminescence-weighted K estimates in the range suggested by the three most cited references are the effective K and the luminescent grains for the samples LAGU-1-1 and MBT-I-2430 and the effective K for sample LAGU-1-1. For all 10 samples, apart from the sample KTB-383-C, these two luminescence-weighted K estimates, which are based on the single-grain SEM-EDX results, are greater than the average SEM-EDX results. The effective K was calculated based on the assumption that K-feldspar separates might not only contain feldspar grains with a high K concentration (Huntley and Baril, 1997; Smedley et al., 2012) but that the measured luminescence signal is dominated by grains with a high K concentration. Therefore, it has been suggested that the heterogeneity of K concentrations for a given sample is of low importance (Huntley and Baril, 1997; Prescott and Fox, 1993; Spooner, 1992). Following this assumption, the effective K for each sample should be in the range of the proposed literature values. In contrast to findings of Smedley et al. (2012), our data show that grains with a low K concentration also contribute substantially to the overall luminescence signal (cf. Fig. 2 all samples except LAGU-1-1, HAM-5, and MBT-I-2430). Therefore, the assumption that the cumulative light sum curves are anyway dominated by K-rich feldspar grains and therefore the heterogeneity of the K concentration within a sample is unimportant is not valid for the analysed samples.
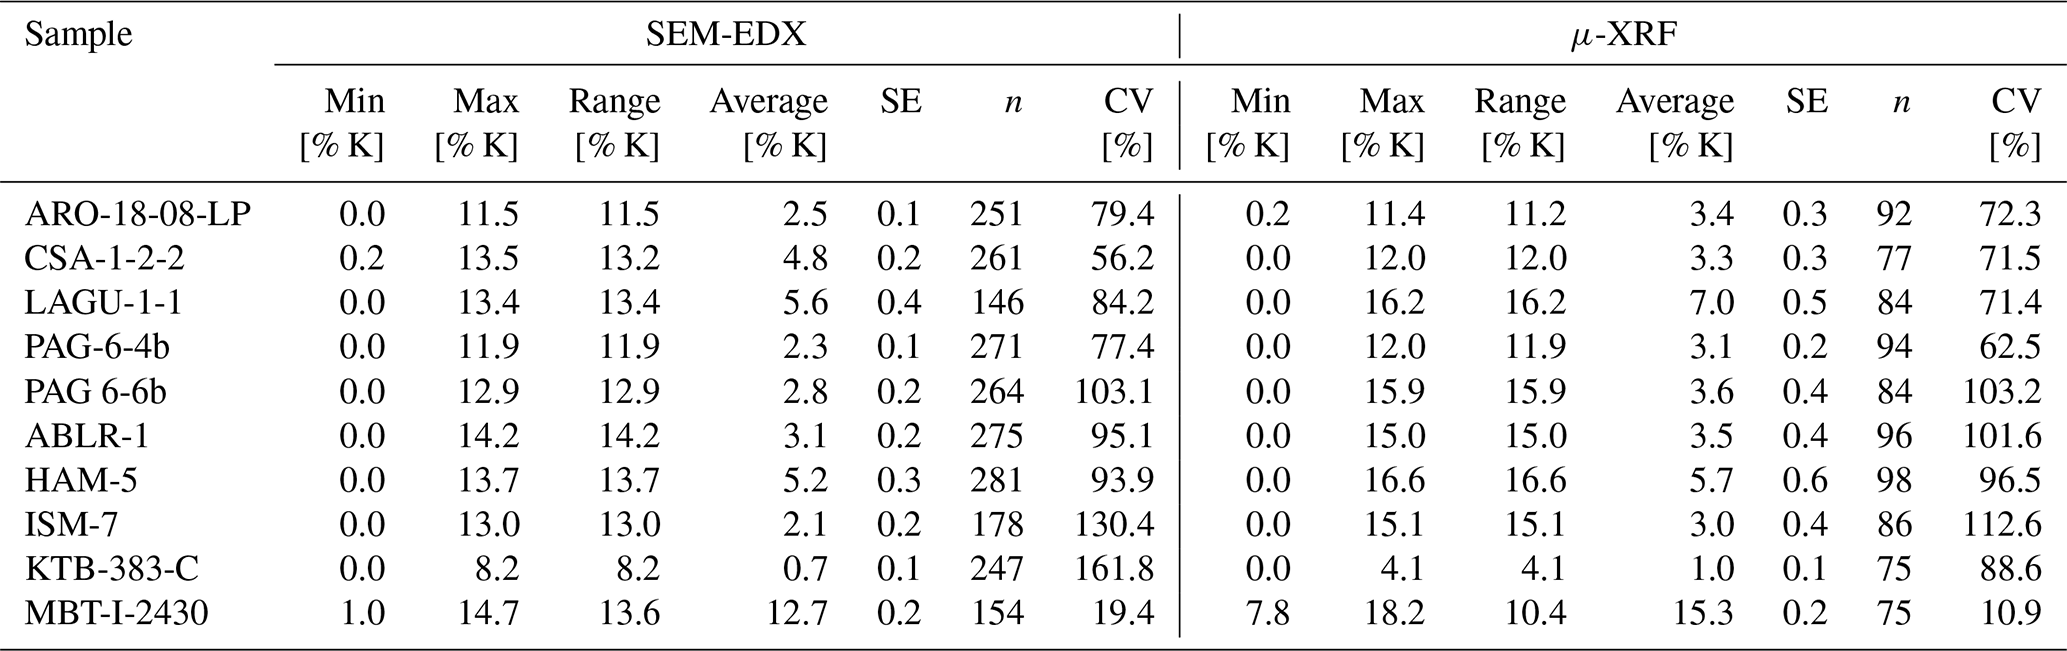
Table 2Summary of the single-grain K-concentration measurements, with CV being the coefficient of variation.
Since all our measurement techniques are semi-quantitative, it is impossible to provide an estimation of the most accurate representation of the internal K concentration of a sample. However, we found that 85 % of our measurement results and the luminescence-weighted K estimates are not within the proposed range of the literature values (8 %–14 % K). Therefore, we conclude that using an often arbitrarily chosen literature value for the K concentration (see literature review Sect. 2.2) can lead to a significant underestimation of the true sample-specific K concentration.
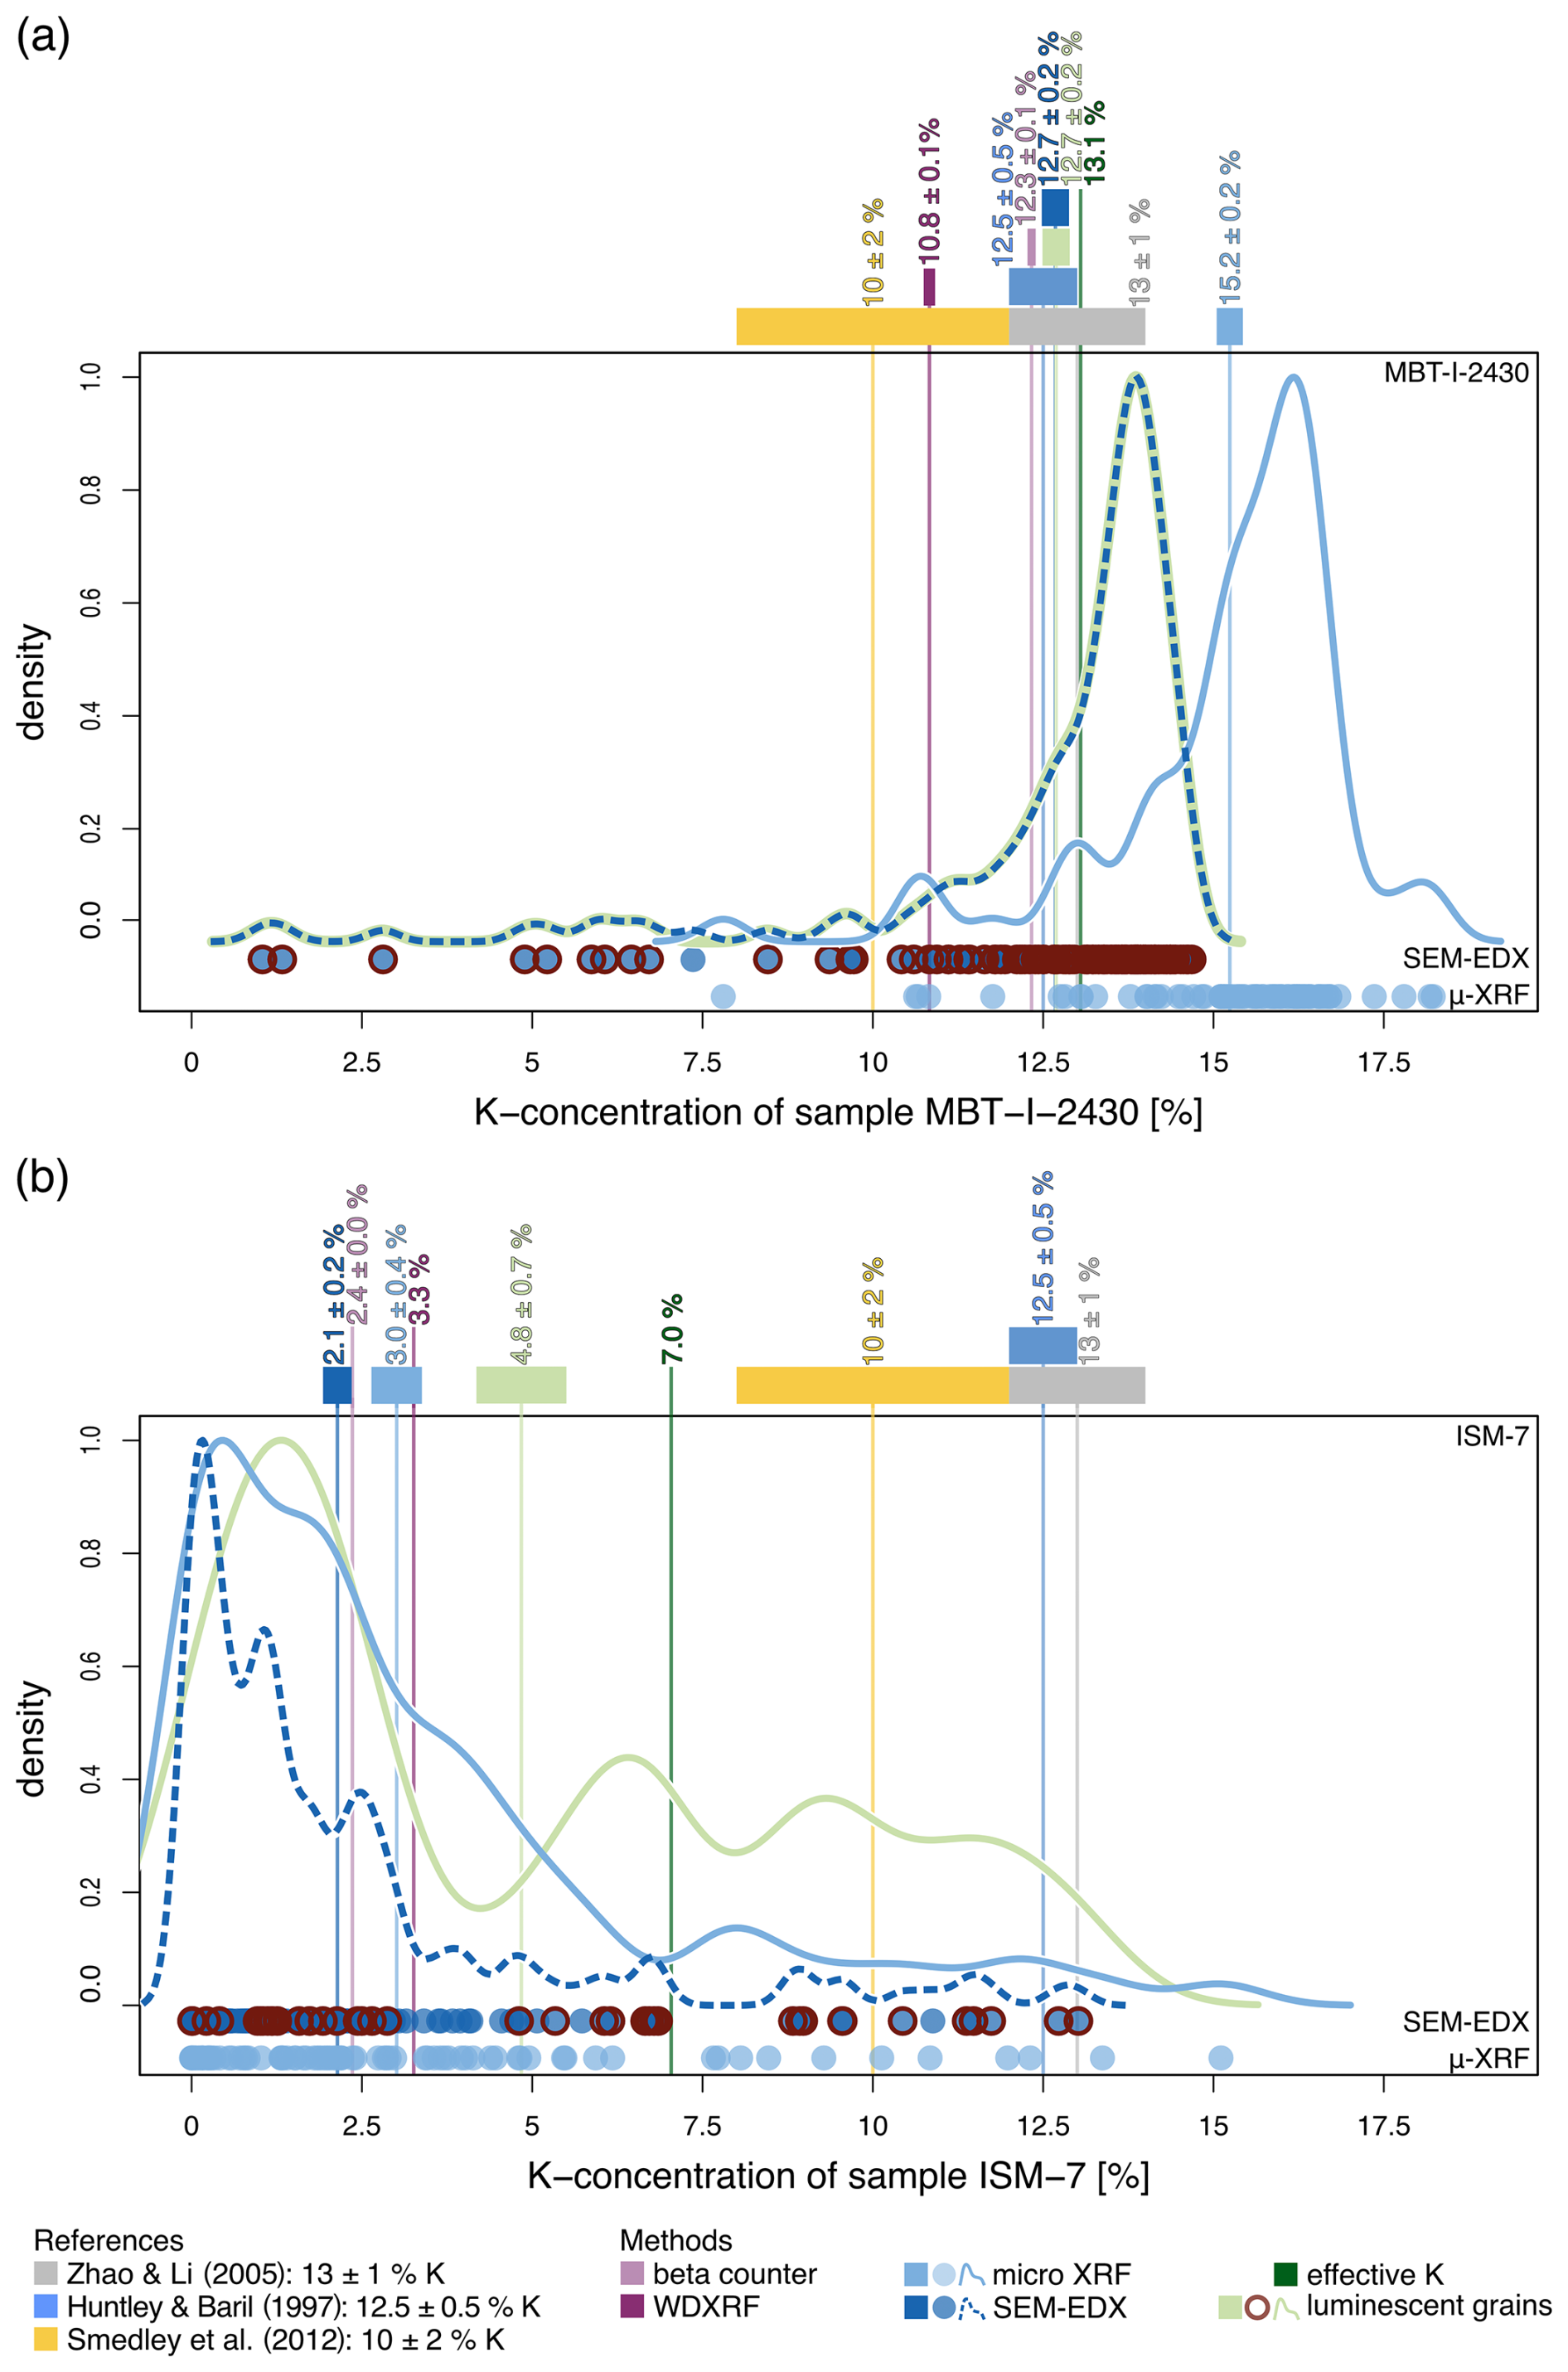
Figure 3Single-grain K concentrations for the overall most homogeneous sample MBT-I-2430 (a) and the most heterogeneous sample ISM-7 (b). The dark-blue dashed density curves and dots are based on the SEM-EDX measurements and the light-blue ones on the μ-XRF measurements. The red circles around the dark-blue dots and the light-green density curve represent the luminescent grains. The vertical lines represent the K concentrations presented in Sect. 5.1; boxes above the graph represent their errors.
5.2 Distributions of single-grain K concentrations
Across all samples the single-grain K concentrations vary from 0.0 % (8 out of 10 samples) up to 14.7 % (MBT-I-2430) measured with the SEM-EDX and from 0.0 % (8 out of 10 samples) to 18.2 % (MBT-I-2430) measured with the μ-XRF (cf. Table 2). Within each sample the K concentrations also show large ranges of up to 14.2 % K for SEM-EDX measurements (ABLR-1 0.0 %–14.2 %) and 16.6 % K for μ-XRF measurements (HAM-5 0.0 %–16.6 %). Sample MBT-I-2430 has the most homogeneous K-concentration distribution, with a coefficient of variation of 19.4 % for the SEM-EDX measurements and 10.9 % for the μ-XRF measurements. In contrast, samples KTB-383-C and ISM-7 have the most heterogeneous K-concentration distributions with coefficients of variation of 161.8 % for the SEM-EDX measurements (KTB-383-C) and 112.6 % for the μ-XRF measurements (ISM-7). Figure 3 shows the single-grain K-concentration measurement results in comparison to the literature values and the bulk measurements and the luminescence-weighted K estimates for ISM-7, one of the most heterogeneous sample, and MBT-I-2430, the most homogeneous sample. A complete comparison for all 10 samples is provided in the Supplement (cf. Fig. S5 in the Supplement).
From all grains measured with the SEM-EDX device, the K concentration of only 15 % of all grains measured is within the range of the three proposed literature values (8 %–14 % K). In the case of the K concentrations determined using the μ-XRF, only 12 % of all grains have a K concentration within the range of the three proposed literature values (8 %–14 % K). In total less than 14 % of the measured single-grain K concentrations (including their uncertainties) are in agreement with the most cited literature values (cf. Figs. 3 and S5). Moreover, fewer than 20 % of the measured single grains have K concentrations that align with any of the bulk measurements, the averaged single-grain measurements, or the luminescence-weighted K estimates (cf. Figs. 3 and S5). This demonstrates that, due to the large spread of single-grain values, it is challenging to represent a sample's internal K concentration with a single, representative value.
For the most homogenous sample MBT-I-2430, 69.1 % of the single-grain K concentrations measured with the SEM-EDX are within the range of one of the literature values. However, 85.1 % of the single-grain K concentrations determined by the μ-XRF for sample MBT-I-2430 are greater than the range covered by the literature values. Interestingly, 82.4 % of the single-grain μ-XRF K concentrations for sample MBT-I-2430 are greater than the physically possible maximum K concentration for pure feldspars of 14.05 %, which can likely be explained by limitations of the measurement procedure (cf. Sect. 4). For the heterogenous sample ISM-7 (Fig. 3b), which is representative for eight and thus the majority of the remaining samples (cf. Fig. S5), the K concentrations of most of the grains are not within the range of the most cited literature values (8 %–14 % K), and the single-grain distribution of the K concentration is considerably right-skewed.
For the luminescent grains (Tn > 3σ background; see red circles in Figs. 3 and S5) a similar picture appears: all samples exhibit luminescent grains, with K concentrations spanning the entire possible range of the respective sample. Even the most homogeneous sample MBT-I-2430 contains luminescent grains with K concentrations as low as 1.0 %. However, whilst most (71 %) of MBT-I-2430's luminescent grains are within the range of K concentrations suggested in the literature, all other samples show either right-skewed distributions of luminescent grain K concentrations (see for example ISM-7 in Fig. 3b) or multi-modal distributions, with the main peak located in the lower third of the possible K-concentration range (see for example CSA-1-2-2 in Fig. S5b). We assume that the observed right skewness in some of the distributions is primarily caused by the presence of a few luminescent grains with higher K concentrations, while the majority of luminescent grains in these samples tend to have relatively low K concentrations. This reflects the overall distribution of K concentrations within the full grain population, which is also skewed in a similar way.
The luminescent grains are calculated based on the assumption that K-feldspar separates contain some Na-feldspar grains due to incomplete sample separation using heavy liquids (e.g. Huntley and Baril, 1997). The presence of Na-feldspar grains in the separate would lead to a lower bulk K concentration. However, the luminescence signal emitted by these Na-rich feldspar grains is assumed to be removed using a blue filter combination during the luminescence measurements. Thus, the blue luminescence emission recorded should be dominated by the K-rich feldspar grains, likely with concentrations in the range of 12.5 ± 0.5 % (Huntley and Baril, 1997). However, the results presented here show that luminescent grains occur over the entire range of possible K concentrations, suggesting that (i) Na-feldspars are still present within density separated K-feldspar separates, (ii) the luminescence of Na-rich feldspars is not successfully removed using the blue filter combination, and most importantly (iii) sufficiently bright luminescent grains can be found across the entire alkali feldspar range. These observations are at odds with the current common practice of using relatively high K concentration from the literature, which is based on the assumption that the luminescence emission in the blue is dominated by K-rich feldspar grains (cf. Sect. 2.2).
5.3 Practical implications
The results presented here are applicable to both single-grain and multi-grain coarse-grain feldspar luminescence dating. An exception to this is polymineral fine-grain luminescence dating, where usually grains with a diameter of 4–11 µm are considered. According to Guérin et al. (2012), the β self-dose of the internal K concentration for this grain size fraction is as low as 0.007, which implies that the internal K concentration does not significantly contribute to the in this context. Importantly, it should be noted that none of the single-grain K-concentration distributions are normally distributed (Figs. 3a and S5), suggesting that the corresponding average value based on the arithmetic mean is not the optimal representation of the single-grain K concentration for most of our samples. Furthermore, the experimental errors of all measurement methods are relatively small, leading to small uncertainties on the experimentally obtained averaged or bulk K concentrations. This is in stark contrast to the often broad and/or skewed single-grain-based K-concentration distributions. Consequently, a single bulk or averaged measured value or one of the luminescence-weighted K estimates is therefore not representative of all grains in a sample. However, it seems impracticable to determine the K concentration of all luminescent grains individually with the methods available to us. We propose carrying out a simple bulk measurement in a first step to determine the average K concentration of the sample material. In a second step we furthermore suggest performing single-grain K-concentration measurements (using SEM-EDX or μ-XRF) on a small number of individual grains to determine the heterogeneity of the sample. Based on the single-grain data collected in this way, an error estimate for the bulk measurement could be determined. This second step becomes particularly important when the bulk K concentration is low, as single-grain measurements allow for a more informed assessment of the associated uncertainty. Either low bulk values may reflect consistently low K concentrations across grains, requiring only a small error estimate, or they may mask a wide internal variability, in which case a larger uncertainty would be more appropriate
Since the β counter is the easiest bulk measurement to implement and the μ-XRF provides the most efficient single-grain measurement, we tested this combination more in-depth. We found that 72.2 % of the K concentrations of the individual grains lie within the sample-specific range for the K concentration determined in this way (β counter result ± SD of μ-XRF results).
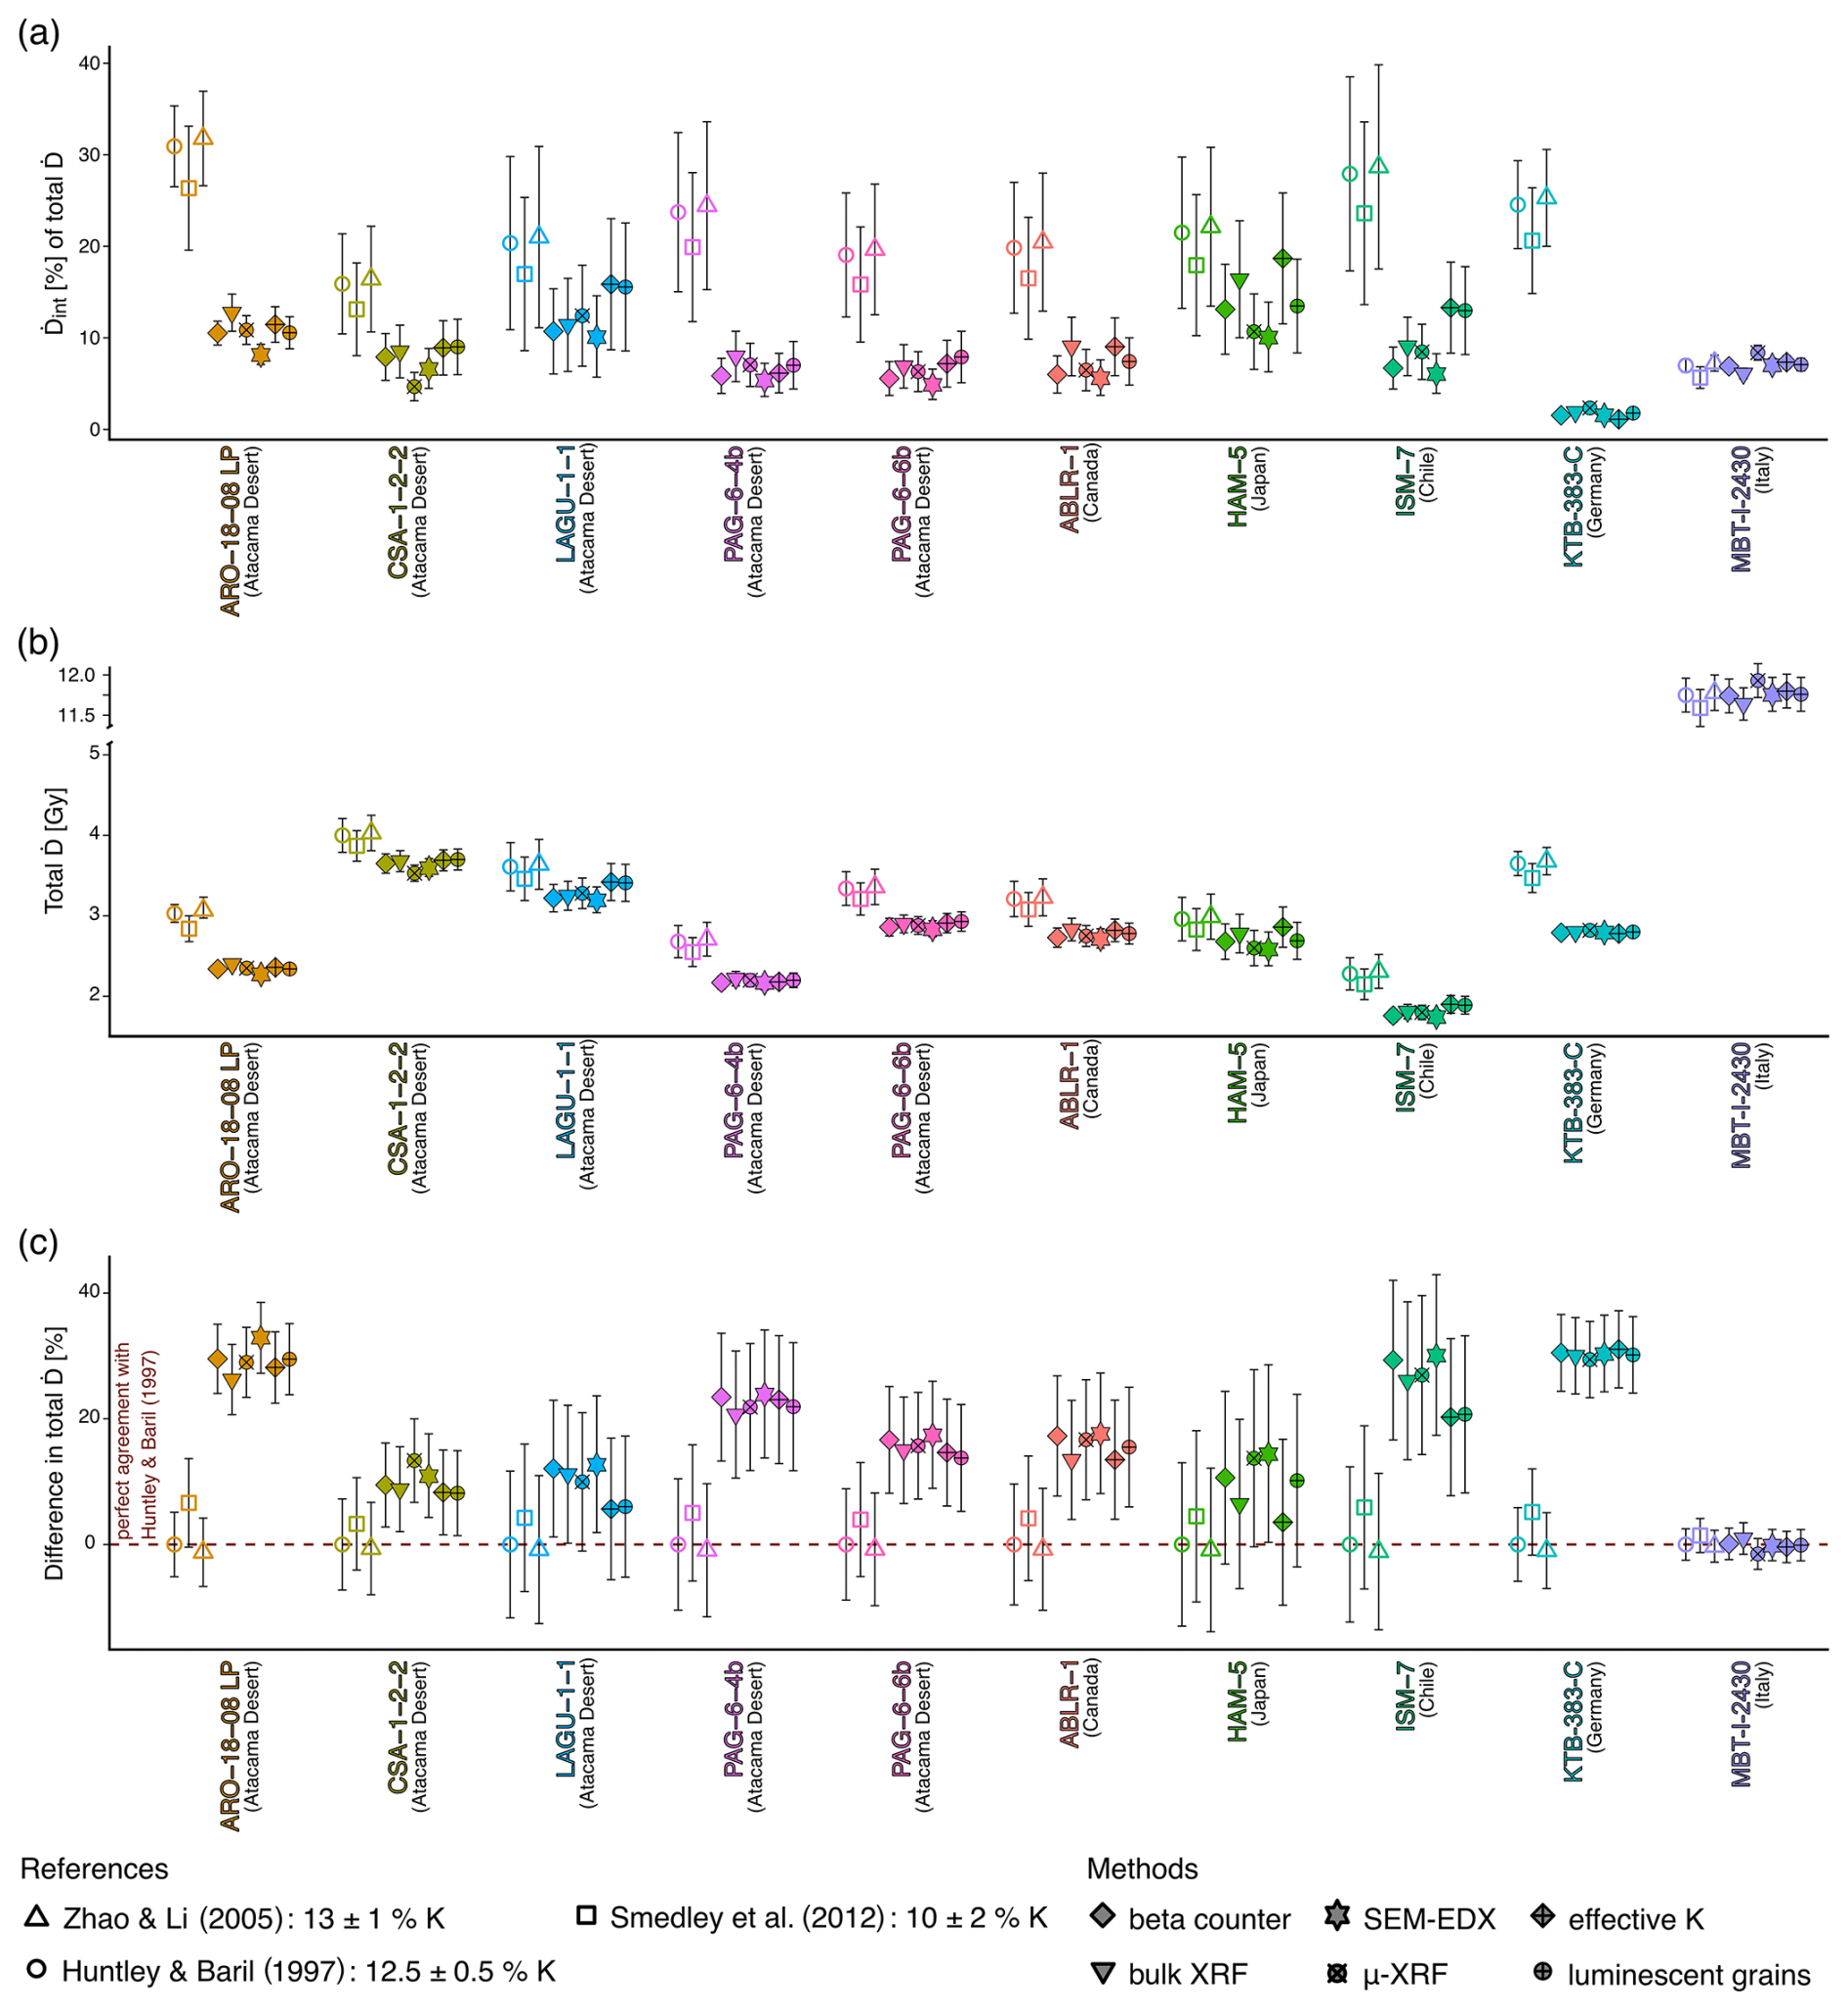
Figure 4 results, with and total calculated with DRAC (Durcan et al., 2015) based on the different K concentrations of the three most cited literature values (open symbols), the measured K concentrations (filled symbols), and luminescence-weighted K estimates (filled symbols). All other input variables are described in Sect. 3.5. (a) The proportion of the in the corresponding total . (b) The total . (c) A comparison between the total based on the K concentration of 12.5 ± 0.5 (Huntley and Baril, 1997) and the total based on the measured K concentrations and luminescence-weighted K estimates. The dashed line indicates a perfect agreement with the total based on the K concentration of 12.5 ± 0.5 (Huntley and Baril, 1997).
The internal K concentration of a sample affects the size of the . For a sample with a large , the K concentration and thus the will have a smaller effect on the total compared to a sample where is relatively large compared to . The latter is often the case for relatively quartz-rich coarse sediments where can contribute up to ∼ 50 % to the total (e.g. Reimann and Tsukamoto, 2012). Figure 4 illustrates the effect of the internal K concentration on the total of each sample, for dose rates based on the most commonly used literature K concentration values (open symbols), our measured K concentrations (filled symbols), and our luminescence-weighted K estimates (filled symbols). However, it should be noted that no measurements of internal U and Th concentrations were performed. High concentrations of U and Th could lead to an increased , which is not accounted for in our calculations (Smedley and Pearce, 2016; Zhao and Li, 2005). This may also apply to grains with elevated K concentrations (Zhao and Li, 2005).
The large discrepancy observed between the literature values and the K concentrations measured for each sample is also reflected in the proportion of the of the total dose rate (Fig. 4a). Across all samples the proportion of the in the total varies between ∼ 1 % and ∼ 32 %. KTB-383-C and ARO-18-08-LP show the largest variations in the proportion of observed within a sample, with in KTB-383-C ranging from 1.1 % (based on the effective K) to 25.3 % (based on Zhao and Li, 2005) and in ARO-18-08-LP ranging from 8.2 % (based on mean SEM-EDX measurements) to 31.8 % (based on Zhao and Li, 2005). Sample MBT-I-2430 has the smallest variations within a sample, since, except for the mean μ-XRF K concentration, all measured K concentrations and luminescence-weighted K estimates are within the range of the proposed literature K concentrations. Therefore, all , except for the based on the mean μ-XRF measurement, are also in unity with each other when considering their uncertainties.
In nearly 60 % of the cases investigated here, the estimates based on the proposed literature K concentrations are not in agreement with the calculated using measured K concentrations or luminescence-weighted K estimates within uncertainties (compare open symbols to closed symbols in Fig. 4a). As this deviation is a one-directional systematic error for 9 out of 10 samples, it will lead to an overestimation of the in most samples. This error is particularly pronounced in the samples KTB-383-C and ARO-18-08-LP.
Figure 4b shows the effect of the different K concentrations on the total . MBT-I-2430 exhibits the highest total s, ranging from 11.6 Gy ka−1 (WDXRF) to 11.9 Gy ka−1 (mean μ-XRF). Dose rates calculated for all other samples range between 1.8 and 4.0 Gy ka−1. For all 10 samples the total s based on the three proposed K concentrations from the literature are in unity within their respective uncertainties (Fig. 4b open symbols) within each individual sample. In all cases, the total s based on the measured values and the luminescence-weighted K estimates are also in agreement within their uncertainties (Fig. 4b closed symbols) for each individual sample. However, s calculated using literature K concentrations are only in agreement with total s calculated using experimentally obtained K concentrations in 39 % of the cases, and this includes their respective uncertainties.
Figure 4c illustrates the differences between the total s based on the measured K concentrations and luminescence-weighted K estimates for the K concentration and the total based on the K concentration of 12.5 ± 0.5 % from the most cited reference (Huntley and Baril, 1997). A figure displaying the results in comparison to results obtained using the values by Smedley et al. (2012) and Zhao and Li (2005) can be found in the Supplement (see Fig. S6). With the exception of sample MBT-I-2430, the total is systematically overestimated using a literature-based K concentration (cf. Figs. 4c and S6). The mean overestimation of the total across all three literature values based on the remaining nine samples is 17.2 ± 8.1 %. The maximum deviation can be found for the mean SEM-EDX result of sample ARO-18-08-LP: for Huntley and Baril (1997) the deviation is 32.9 % (Fig. 4c), for Zhao and Li (2005) the deviation is 34.6 % (Fig. S6a), and for Smedley et al. (2012) the deviation is 24.7 % (Fig. S6b).
In general, we observe a systematic one-directional deviation in the total for 9 out of 10 samples when comparing literature value-based to measurement-based , not incorporating that might arise from high internal U or Th concentrations. Assuming that measured K concentrations and calculated luminescence-weighted K estimates are more reliable than literature-based values and that we do not have unusually high internal U or Th concentrations, this systematic overestimation of the total would lead to a systematic underestimation of the luminescence age. Thus, we strongly recommend basing the decision on the K concentration for the calculation of on experimental data rather than literature values. Moreover, we find that all K concentrations based on the four experimental methods used and the luminescence-weighted K estimates resulted in sample-wise total s agreeing with each other within uncertainties (cf. Fig. 4b). Therefore, we conclude that the measurement technique for the determination of the internal K concentration is of minor importance for the total of a sample but that measuring the K concentration of each sample results in more accurate dose rates compared to using literature-based estimates.
In feldspar luminescence dating studies, the internal K concentration is often based on published K concentrations. Furthermore, it is often assumed that the luminescence of feldspars predominantly arises from K-rich feldspar grains. In this study we thoroughly tested this critical assumption regarding the accuracy of feldspar luminescence dating, and we made the following main observations:
-
Our comprehensive literature review of 432 published studies, presenting feldspar luminescence dating results since 2009, revealed that 76 % of these studies use literature-derived K concentrations. 96 % of these studies choose a literature value without any measurement of the sample-specific K concentration.
-
Our bulk sample analyses, averaged single-grain K measurements, and luminescence-weighted K estimates are, in 85 % of the cases, lower than the three most cited literature values (12.5 ± 0.5 % K, Huntley and Baril, 1997; 13 ± 1 % K, Zhao and Li, 2005; 10 ± 2 % K, Smedley et al., 2012).
-
Our effective K-concentration calculations challenge the common assumption that the majority of the feldspar luminescence signal originates from high-K feldspar grains, as this holds true in only 1 out of 10 samples investigated. Our single-grain analyses reveal that there is considerable heterogeneity in K concentrations and that the blue luminescence emission is not dominated by K-rich feldspar grains. If uncertainties are considered, only ∼ 14 % of the single-grain K concentrations are within the range of the literature values.
-
Our data further show that the overestimation of the K concentration of the three most cited literature values in 9 out of 10 samples results in systematic one-directional errors in the and therefore total calculations for these samples of up to 34.6 %.
-
Our comparison of the total derived from the different K-concentration measurements and both associated luminescence-weighted K estimates showed that they agree with each other. Our data suggest that a sufficient agreement between bulk and average single-grain K-concentration measurements is achieved, yet they are not a good representation of all single grains.
Based on our findings, we strongly recommend routinely measuring the bulk K concentration for each sample as a standard procedure of the determination protocol. If the bulk measurements indicate low K concentrations, thus potentially suggesting either heterogeneous K concentrations or overall low K concentrations, this routine should be complemented by targeted single-grain K-concentration analyses to assess intra-sample variability. This combined approach is essential for improving the accuracy of dose rate calculations and, ultimately, the accuracy of feldspar luminescence dating. Furthermore, spatially resolved luminescence measurements would be desirable to assess whether luminescence originates exclusively from K-rich domains within individual grains or from the entire grain, regardless of its K content
We also suggest that unless confirmed by measurements, future publications should refer to the dated mineral fraction as “feldspar dating” rather than “K-feldspar dating”.
Partly processed data are available on Zenodo at https://doi.org/10.5281/zenodo.15533531 (Maßon et al., 2025).
The supplement related to this article is available online at https://doi.org/10.5194/gchron-7-475-2025-supplement.
LM: conceptualization, writing (original draft), formal analysis, investigation, visualization; SR: conceptualization, writing (review and editing), supervision; SO, AZ, AB, and HC: investigation, writing (review and editing); TR: conceptualization, writing (review and editing), supervision, funding acquisition.
The contact author has declared that none of the authors has any competing interests.
Publisher's note: Copernicus Publications remains neutral with regard to jurisdictional claims made in the text, published maps, institutional affiliations, or any other geographical representation in this paper. While Copernicus Publications makes every effort to include appropriate place names, the final responsibility lies with the authors. Views expressed in the text are those of the authors and do not necessarily reflect the views of the publisher.
We would like to thank our colleagues, who kindly supplied us with sample material. We thank Georgina E. King (Université de Lausanne) for MBT-I-2430; Benny Guralnik (Technical University of Denmark) for KTB-383-C; Dominik Brill (University of Cologne) for PAG-6-4b, PAG-6-6b, and ISM-7; Simon M. May (University of Cologne) for CSA-1-2-2 and LAGU-1-1; and Aline Zinelabedin (University of Cologne) for ARO-18-08 LP. Svenja Riedesel would like to thank Ulrike Hardenbicker for guidance in the field during which sample ABLR-1 was taken and for hosting her at the University of Regina, Canada. We also thank Kathrin Jung (University of Cologne) for embedding our grains in resin. Svenja Riedesel acknowledges support by the European Union's Horizon Europe research and innovation programme under the Marie Skłodowska-Curie grant agreement (RECREATE, grant no. 101103587). The sampling campaign during which sample ABLR-1 was sampled was financially supported by a Female Research Grant from the Faculty of Mathematics and Natural Sciences, University of Cologne, awarded to Svenja Riedesel.
This research has been supported by the Deutsche Forschungsgemeinschaft (grant no. 268236062) and the European Commission, HORIZON EUROPE Framework Programme (grant no. 101103587).
This open-access publication was funded by Universität zu Köln.
This paper was edited by Julie Durcan and reviewed by Rachel Smedley and one anonymous referee.
Aitken, M. J.: Thermoluminescence Dating, Academic Press, 382 pp., ISBN 0-12-046380-6, 1985.
Aitken, M. J.: An introduction to optical dating: the dating of Quaternary sediments by the use of photon-stimulated luminescence, Oxford University Press, Oxford, New York, Tokyo, 267 pp., https://doi.org/10.1093/oso/9780198540922.001.0001, 1998.
Aitken, M. J., Clark, P. A., Gaffney, C. F., and Løvborg, L.: Beta and gamma gradients, Nuclear Tracks and Radiation Measurements (1982), 10, 647–653, https://doi.org/10.1016/0735-245X(85)90071-7, 1985.
Al-Mishwat, A. T.: OXDPPM: A Software to Convert Chemical Elements Between Oxides and Native Elements, Journal of Software Engineering and Applications, 9, 561–576, https://doi.org/10.4236/jsea.2016.911038, 2016.
Bailiff, I. K. and Aitken, M. J.: Use of thermoluminescence dosimetry for evaluation of internal beta dose-rate in archaeological dating, Nuclear Instruments and Methods, 173, 423–429, https://doi.org/10.1016/0029-554X(80)90802-2, 1980.
Bøtter-Jensen, L. and Mejdahl, V.: Determination of potassium in feldspars by beta counting using a GM multicounter system, Nuclear Tracks and Radiation Measurements (1982), 10, 663–666, https://doi.org/10.1016/0735-245X(85)90073-0, 1985.
Bøtter-Jensen, L. and Mejdahl, V.: Assessment of beta dose-rate using a GM multicounter system, International Journal of Radiation Applications and Instrumentation. Part D. Nuclear Tracks and Radiation Measurements, 14, 187–191, https://doi.org/10.1016/1359-0189(88)90062-3, 1988.
Buylaert, J.-P., Újvári, G., Murray, A. S., Smedley, R. K., and Kook, M.: On the relationship between K concentration, grain size and dose in feldspar, Radiation Measurements, 120, 181–187, https://doi.org/10.1016/j.radmeas.2018.06.003, 2018.
Deer, W. A., Howie, R. A., and Zussman, J.: An Introduction to the Rock-Forming Minerals, Mineralogical Society of Great Britain and Ireland, https://doi.org/10.1180/DHZ, 2013.
Duller, G.: Luminescence Dating: Guidelines on using luminescence dating in archaeology, English Heritage, Swindon, https://doi.org/10.5284/1000049, 2008.
Durcan, J. A., King, G. E., and Duller, G. A. T.: DRAC: Dose Rate and Age Calculator for trapped charge dating, Quaternary Geochronology, 28, 54–61, https://doi.org/10.1016/j.quageo.2015.03.012, 2015.
Guérin, G., Mercier, N., Nathan, R., Adamiec, G., and Lefrais, Y.: On the use of the infinite matrix assumption and associated concepts: A critical review, Radiation Measurements, 47, 778–785, https://doi.org/10.1016/j.radmeas.2012.04.004, 2012.
Guralnik, B., Jain, M., Herman, F., Ankjærgaard, C., Murray, A. S., Valla, P. G., Preusser, F., King, G. E., Chen, R., Lowick, S. E., Kook, M., and Rhodes, E. J.: OSL-thermochronometry of feldspar from the KTB borehole, Germany, Earth and Planetary Science Letters, 423, 232–243, https://doi.org/10.1016/j.epsl.2015.04.032, 2015.
Huntley, D. J. and Baril, M. R.: The K content of the K-feldspars being measured in optical dating or in thermoluminescence dating, Ancient TL, 15, 3, 1997.
Huntley, D. J. and Hancock, R. G. V.: The Rb contents of the K-feldspar grains being measured in optical dating, Ancient TL, 19, 43–46, 2001.
Kanaya, K. and Okayama, S.: Penetration and energy-loss theory of electrons in solid targets, J. Phys. D: Appl. Phys., 5, 43–58, https://doi.org/10.1088/0022-3727/5/1/308, 1972.
Krbetschek, M. R., Rieser, U., and Stolz, W.: Optical Dating: Some Luminescence Properties of Natural Feldspars, Radiation Protection Dosimetry, 66, 407–412, https://doi.org/10.1093/oxfordjournals.rpd.a031765, 1996.
Lambert, R.: Investigating thermal decay in K-feldspar for the application of IRSL thermochronometry on the Mont Blanc massif, University of Lausanne, Lausanne, 2018.
Li, B., Li, S.-H., Wintle, A. G., and Zhao, H.: Isochron dating of sediments using luminescence of K-feldspar grains, Journal of Geophysical Research: Earth Surface, 113, https://doi.org/10.1029/2007JF000900, 2008.
Maßon, L. A. E., Riedesel, S., Zander, A., Sontag-González, M., and Reimann, T.: Testing the applicability of standardised growth curves for chemically heterogeneous single-grain feldspars from the Atacama Desert, Chile, Quaternary Geochronology, 83, 101585, https://doi.org/10.1016/j.quageo.2024.101585, 2024.
Maßon, L., Riedesel, S., Opitz, S., Zander, A., Bell, A. M. T., Cieszynski, H., and Reimann, T.: How much K is oK? – Evaluating different methods for K-concentration determination and the effect of the internal K-concentration on feldspar luminescence dating, Zenodo [data set], https://doi.org/10.5281/zenodo.15533531, 2025.
Mejdahl, V.: Internal radioactivity in quartz and feldspar grains, Ancient TL, 5, 10–17, 1987.
O'Gorman, K., Brink, F., Tanner, D., Li, B., and Jacobs, Z.: Calibration of a QEM-EDS system for rapid determination of potassium concentrations of feldspar grains used in optical dating, Quaternary Geochronology, 61, 101123, https://doi.org/10.1016/j.quageo.2020.101123, 2021a.
O'Gorman, K., Tanner, D., Sontag-González, M., Li, B., Brink, F., Jones, B. G., Dosseto, A., Jatmiko, Roberts, R. G., and Jacobs, Z.: Composite grains from volcanic terranes: Internal dose rates of supposed `potassium-rich' feldspar grains used for optical dating at Liang Bua, Indonesia, Quaternary Geochronology, 64, 101182, https://doi.org/10.1016/j.quageo.2021.101182, 2021b.
Parish, R.: The influence of feldspar weathering on luminescence signals and the implications for luminescence dating of sediments, in: Rock Weathering and Landform Evolution, edited by: Robinson, D. A. and Williams, R. B. G., Geography Laboratory, University of Sussex, 243–258, ISBN 978-0-471-95119-3, 1994.
Prescott, J. R. and Fox, P. J.: Three-dimensional thermoluminescence spectra of feldspars, J. Phys. D: Appl. Phys., 26, 2245–2254, https://doi.org/10.1088/0022-3727/26/12/024, 1993.
Prescott, J. R. and Hutton, J. T.: Cosmic ray contributions to dose rates for luminescence and ESR dating: Large depths and long-term time variations, Radiation Measurements, 23, 497–500, https://doi.org/10.1016/1350-4487(94)90086-8, 1994.
Preusser, F., Degering, D., Fuchs, M., Hilgers, A., Kadereit, A., Klasen, N., Krbetschek, M., Richter, D., and Spencer, J. Q.: Luminescence dating: basics, methods and applications, Quaternary Science Journal, 57, 95–149, 2008.
Prohaska, T., Irrgeher, J., Benefield, J., Böhlke, J. K., Chesson, L. A., Coplen, T. B., Ding, T., Dunn, P. J. H., Gröning, M., Holden, N. E., Meijer, H. A. J., Moossen, H., Possolo, A., Takahashi, Y., Vogl, J., Walczyk, T., Wang, J., Wieser, M. E., Yoneda, S., Zhu, X.-K., and Meija, J.: Standard atomic weights of the elements 2021 (IUPAC Technical Report), Pure and Applied Chemistry, 94, 573–600, https://doi.org/10.1515/pac-2019-0603, 2022.
Reimann, T. and Tsukamoto, S.: Dating the recent past (< 500 years) by post-IR IRSL feldspar – Examples from the North Sea and Baltic Sea coast, Quaternary Geochronology, 10, 180–187, https://doi.org/10.1016/j.quageo.2012.04.011, 2012.
Reimann, T., Thomsen, K., Jain, M., Murray, A., and Frechen, M.: Single-grain dating of young sediments using the pIRIR signal from feldspar, Quaternary Geochronology, 11, 28–41, https://doi.org/10.1016/j.quageo.2012.04.016, 2012.
Rhodes, E. J.: Optically Stimulated Luminescence Dating of Sediments over the Past 200,000 Years, Annual Review of Earth and Planetary Sciences, 39, 461–488, https://doi.org/10.1146/annurev-earth-040610-133425, 2011.
Ribbe, P. H.: Feldspar mineralogy, 2nd edn., Mineralogical society of America, Washington (DC), ISBN 0-939950-14-6, 1983.
Riedesel, S., King, G. E., Prasad, A. K., Kumar, R., Finch, A. A., and Jain, M.: Optical determination of the width of the band-tail states, and the excited and ground state energies of the principal dosimetric trap in feldspar, Radiation Measurements, 125, 40–51, https://doi.org/10.1016/j.radmeas.2018.08.019, 2019.
Riedesel, S., Bell, A. M. T., Duller, G. A. T., Finch, A. A., Jain, M., King, G. E., Pearce, N. J., and Roberts, H. M.: Exploring sources of variation in thermoluminescence emissions and anomalous fading in alkali feldspars, Radiation Measurements, 141, 106541, https://doi.org/10.1016/j.radmeas.2021.106541, 2021.
Ritter, B., Wennrich, V., Medialdea, A., Brill, D., King, G., Schneiderwind, S., Niemann, K., Fernández-Galego, E., Diederich, J., Rolf, C., Bao, R., Melles, M., and Dunai, T. J.: “Climatic fluctuations in the hyperarid core of the Atacama Desert during the past 215 ka,” Sci. Rep.-UK, 9, 5270, https://doi.org/10.1038/s41598-019-41743-8, 2019.
Smedley, R. K. and Pearce, N. J. G.: Internal U, Th and Rb concentrations of alkali-feldspar grains: Implications for luminescence dating, Quaternary Geochronology, 35, 16–25, https://doi.org/10.1016/j.quageo.2016.05.002, 2016.
Smedley, R. K., Duller, G. A. T., Pearce, N. J. G., and Roberts, H. M.: Determining the K-content of single-grains of feldspar for luminescence dating, Radiation Measurements, 47, 790–796, https://doi.org/10.1016/j.radmeas.2012.01.014, 2012.
Spooner, N. A.: Optical dating: Preliminary results on the anomalous fading of luminescence from feldspars, Quaternary Science Reviews, 11, 139–145, https://doi.org/10.1016/0277-3791(92)90055-D, 1992.
Szymak, A., Moska, P., Poręba, G., Tudyka, K., and Adamiec, G.: Sciendo, Geochronometria, 49, 9–17, https://doi.org/10.2478/geochr-2022-0002, 2022.
Thomsen, K. J., Murray, A. S., Jain, M., and Bøtter-Jensen, L.: Laboratory fading rates of various luminescence signals from feldspar-rich sediment extracts, Radiation Measurements, 43, 1474–1486, https://doi.org/10.1016/j.radmeas.2008.06.002, 2008.
Wintle, A. G.: Luminescence dating of Quaternary sediments–Introduction, Boreas, 37, 469–470, 2008.
Woor, S., Durcan, J. A., Burrough, S. L., Parton, A., and Thomas, D. S. G.: Evaluating the effectiveness of heavy liquid density separation in isolating K-feldspar grains using alluvial sediments from the Hajar Mountains, Oman, Quaternary Geochronology, 72, 101368, https://doi.org/10.1016/j.quageo.2022.101368, 2022.
Zhao, H. and Li, S.-H.: Internal dose rate to K-feldspar grains from radioactive elements other than potassium, Radiation Measurements, 40, 84–93, https://doi.org/10.1016/j.radmeas.2004.11.004, 2005.
Zinelabedin, A., Riedesel, S., Reimann, T., Ritter, B., and Dunai, T. J.: Testing the potential of using coarse-grain feldspars for post-IR IRSL dating of calcium sulphate-wedge growth in the Atacama Desert, Quaternary Geochronology, 101341, https://doi.org/10.1016/j.quageo.2022.101341, 2022.
- Abstract
- Introduction
- Feldspar luminescence dating
- Sample details, instrumentation, and methods
- Limitations and practicability
- Results and discussion
- Effect of the K concentration on the dose rate
- Conclusion
- Data availability
- Author contributions
- Competing interests
- Disclaimer
- Acknowledgements
- Financial support
- Review statement
- References
- Supplement