the Creative Commons Attribution 4.0 License.
the Creative Commons Attribution 4.0 License.
 | 07 Jan 2026
Rapid dose rate estimation for trapped charge dating using pXRF measurements of potassium concentration
Sam Woor
Mitch K. D'Arcy
Olav B. Lian
Maria Schaarschmidt
Julie A. Durcan
Quantifying environmental radiation dose rates is an essential step in age calculation using trapped charge dating methods. A means of rapid dose rate estimation would therefore be useful for a variety of reasons, especially in contexts where rapid equivalent dose estimates are available. For instance, for informing sampling strategy, providing initial age estimates, or supporting portable luminescence studies. However, high-precision methods often used to calculate dose rates are typically time consuming and expensive and are impractical for such “range-finder” applications. Portable X-ray fluorescence (pXRF) offers a rapid means of measuring the potassium (K) concentration of sediment, although the other radionuclides typically used to calculate dose rates, uranium (U) and thorium (Th), fall beneath its detection limits at the quantities at which they are usually present in sediments. In this study, we investigate whether pXRF measurements of K concentration alone can be used to estimate total environmental dose rates. A large, global dataset of 1473 radionuclide samples is used to generate a set of regression relationships between (1) K concentration and external beta dose rate; (2) external beta and gamma dose rates; and (3) external gamma and alpha dose rates. We test the utility of these relationships by measuring the K contents of 67 sediment samples with independent, high-precision radionuclide data from a variety of contexts using pXRF. The resulting K concentrations are then converted to external dose rate estimates using these equations. A simplified set of attenuation parameters are used to correct infinite matrix dose rate estimates, and these are combined with cosmic ray and internal contributions to rapidly calculate total environmental dose rates for a range of theoretical, common luminescence-dating scenarios (such as 180-250 µm quartz that has undergone etching). Results show that pXRF can accurately measure K concentrations in a laboratory setting. The regression equations can predict external beta dose rates to a good degree of accuracy based on K content alone, whilst external gamma dose rates are predicted less accurately, and external alpha dose rates are predicted the least accurately. In combination, total estimated dose rates show good agreement with their counterparts calculated from high-precision methods, with 95 % of our results lying within uncertainties of ±10 % of unity for scenarios where the alpha dose rate contribution is assumed to be negligible. Whilst alpha dose rate contributions are predicted the least accurately, scenarios including an alpha component result in at least 80 % of predictions lying within uncertainties of ±10 % of unity. The use of simplified attenuation factors to correct estimated infinite matrix dose rates does not contribute significantly to resulting scatter. This study serves as a proof of concept that pXRF measurements, along with a set of regression equations and a simplified correction procedure, can be used to rapidly calculate range-finder environmental dose rates.
- Article
(2294 KB) - Full-text XML
-
Supplement
(2424 KB) - BibTeX
- EndNote


Trapped charge dating methods such as luminescence and electron-spin resonance dating can be used to determine the time since burial of mineral grains. Age calculation using these methods requires two parameters to be quantified: (1) The equivalent dose (De), the amount of radiation dose absorbed by the mineral throughout the burial period, measured in Gray (Gy); and (2) The environmental dose rate (), the rate at which environmental radiation is emitted by the surrounding sediment matrix and received from cosmic rays, measured in Gy a−1 or Gy ka−1. Time since burial is thus calculated by:
To determine , various individual dose contributions are calculated and summed:
where , and are the dose rate contributions from alpha (α) and beta (β) particles and gamma (γ) ray emissions from the sediment matrix external to the mineral grains being dated, respectively; and is the contribution from cosmic rays bombarding the Earth. The is the sum of contributions from α and β particles arising from decay processes from sources internal to the mineral grains.
The results from the decay chains of Th and U, and and from K, Th and U in the surrounding sediment matrix (Guérin et al., 2011). In most luminescence dating studies, internal α contributions are assumed to be either negligible (e.g., Duller, 1992) or an assumed value is provided (e.g., Mejdahl, 1987; Olley et al., 2004). Internal β contributions are usually calculated using assumed concentrations of the internal K contents (e.g., 12.5 ± 0.5 or 10 ± 2 %; Huntley and Baril, 1997; Smedley et al., 2012, respectively) when potassium-rich feldspar (KF) is the mineral being dated. Both the external and internal dose rate contributions are calculated using the infinite matrix (IM) assumption: that within the surrounding sediment, the rate of energy emitted over the range of interest is equal to the rate of absorption (Guérin et al., 2012). During dose rate calculation, individual IM dose rates are adjusted for a range of attenuating factors, including grain size, water content, and the effectiveness of α particles to ionize mineral crystals (e.g. Durcan et al., 2015 and references therein). The DC is calculated mathematically from the latitude, longitude, altitude, burial depth and overburden density of samples, using the equations of Prescott and Hutton (1994).
Typically, the calculation of De and require time-consuming and costly laboratory-based sample preparation and measurements. External , and contributions to are determined using either geochemical measurements of the K, Th and U concentrations within surrounding sediment, or via direct emission counting. Geochemical measurements are carried out using laboratory methods, such as inductively coupled plasma mass spectrometry (ICP-MS) or neutron activation analysis (NAA, e.g., Woor et al., 2023; Wolfe et al., 2023). Laboratory-based emission counting techniques include thick-source alpha counting (TSAC; e.g., Huntley et al., 1986; Hossain et al., 2002) but emission counting can also be carried out in the field during sample collection using equipment such as portable gamma spectrometers (e.g., Woor et al., 2023). Whilst accurate, these methods typically take hours to weeks, and time or cost restraints can limit sample throughput (e.g., in the case of sending samples to specialist laboratories for high-precision geochemistry).
The ability to rapidly and inexpensively assess is useful in a variety of contexts. Numerous studies have shown that ages can be estimated by rapidly calculating De following truncated sample processing (e.g., skipping the usual mineral separation steps) or by running smaller numbers of sub-sample aliquots than is typical (e.g., Roberts et al., 2009; Durcan et al., 2010). Such “range-finder” dating approaches enable the rapid generation of geochronological data, establishing initial age control that can help refine sampling strategy or identify samples of interest for further laboratory preparation (Roberts et al., 2009; Durcan et al., 2010; Leighton and Bailey, 2015; Alexanderson and Bernhardson, 2016). Moreover, over recent years, the use of portable optically stimulated luminescence (pOSL) readers has increased, offering rapid measurements of photon emission in response to optical stimulation in the field (Sanderson and Murphy, 2010). Signals from pOSL readers have been applied in a variety of geomorphological and archaeological studies (e.g., Bateman et al., 2015; Gray et al., 2018; Stone et al., 2019, 2024; Munyikwa et al., 2021; Rizza et al., 2024) and offer high sample throughput. Environmental dose rates are a key control on pOSL signals (Munyikwa et al., 2021) and therefore being able to rapidly estimate variability between samples and sites, at least in a relative sense, would be a significant advantage for interpreting pOSL data. Rapid and portable and determination would also help to assess dose heterogeneity during field sampling, which can arise in complex sedimentary contexts where IM assumptions do not hold, such as where samples are taken close to stratigraphic boundaries or in heterogeneous rock slices (e.g. Nathan et al., 2003; Smedley et al., 2020; Ou et al., 2022).
Although range-finder dating studies have shown promising results for the rapid determination of De, less attention has been paid to the rapid measurement of . Previous work has shown that can be determined in a matter of hours using laboratory-based emission counting methods (e.g., Ankjægaard and Murray, 2007; Durcan et al., 2010). Ou et al. (2022) also showed that the K concentrations of rock slices used in luminescence dating can be measured accurately with portable X-ray fluorescence (pXRF), and that there is a strong positive correlation between their K contents and their (measured independently using thick source β counting). Portable XRF is designed to measure the elemental concentrations of materials in the field (Lemiere, 2018), so it could have great potential for rapidly and portably estimating . However, whilst pXRF can readily determine K concentrations at magnitudes typical of sediments in luminescence dating studies with an optimized detection limit of 0.005 % (Fig. 1a; Hall et al., 2014), the normal limits of detection and quantification of U and Th (∼ 3 and 10 ppm, respectively) are typically too high for most sedimentary settings (Fig. 1b; Melquiades et al., 2024). For example, Jankowski and Jacobs (2018) used pXRF to measure K, U and Th concentrations in order to assess variability in Australian sediment samples, but U was only detectable in 4 %–16 % of sub-samples.
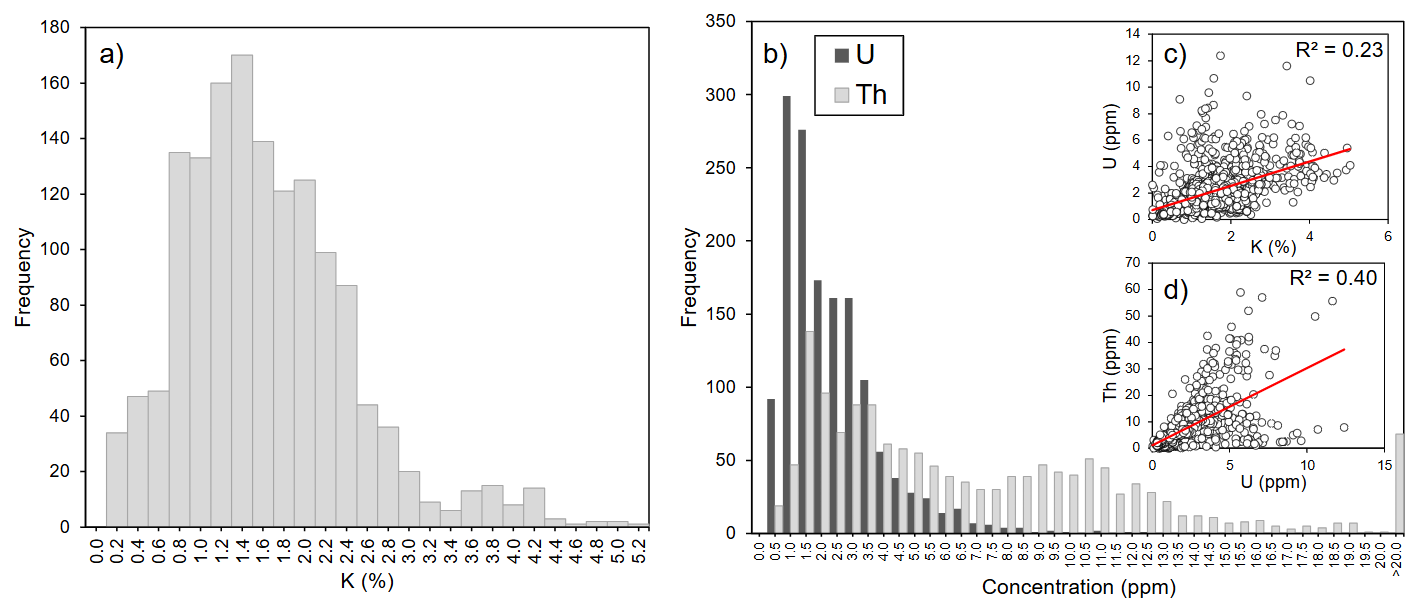
Figure 1Histograms of (a) K concentrations and (b) U and Th concentrations from sediments included in the dataset compiled for this study (n= 1473; see the Supplement to access the dataset). Insets (c) and (d) show K concentration vs U concentration and U concentration vs Th concentration, respectively, for the same samples in the dataset.
In this study, we develop a method for rapidly estimating range-finder by measuring solely the K concentration of sediments using a laboratory-based pXRF. Like the approach of Ou et al. (2022), this method is based on the relationship between K concentrations and , which is expanded upon to estimate and using a set of regression equations generated from a large, global sediment radionuclide dataset. These relationships are used to estimate IM , and contributions based on K concentrations measured using pXRF for samples with known radionuclide contents. Resulting IM dose rates are given simplified mathematical treatments for attenuation and compared with dose rates calculated based on radionuclide concentrations measured using high-precision geochemistry and corrected using typical attenuation procedures. We demonstrate that it is possible to rapidly estimate with reasonable accuracy and precision by using pXRF-derived K concentrations only, a set of simple regression equations, and a streamlined attenuation approach.
2.1 Correlations between K concentration and dose rate components
To estimate based on the K concentration alone, we first establish and test three relationships: (1) is correlated with K concentration, (2) is correlated with , and (3) is correlated with .
Various studies have demonstrated a positive correlation between IM and the K concentration of sediment (Ankjægaard and Murray, 2007; Roberts et al., 2009; Ou et al., 2022). Similarly, Ankjægaard and Murray (2007) showed that IM can be estimated from IM using either a polynomial regression relationship or a ratio of ∼ 0.50 (determined from the slope of a linear fit), from a large suite of luminescence dating samples and emission-counting methods (n= 3758). Roberts et al. (2009) produced very similar results using linear regression, with a ratio of 0.59 (n= 427). Lastly, IM should be correlated with IM because α particles are contributed from the U and Th decay chains (not K), and IM scales strongly with U and Th concentration (Fig. S1g, h in the Supplement; Guérin et al., 2011). Therefore, the greater the U and Th concentration, the greater the IM and, by extension, the IM . Using these principles, we hypothesize that it is possible to estimate IM , and , and therefore , from an initial input of the K concentration.
Radionuclide dataset
To establish regression relationships between K concentration and IM , and , we compiled a global dataset of K, U and Th concentrations from published luminescence dating studies, projects undertaken at the University of the Fraser Valley's Luminescence Dating Laboratory, Canada, and previous compilations of data (Fig. 2; Durcan et al., 2015; Woor et al., 2022; Walsh et al., 2023). The resulting dataset comprises 1473 samples from geographic locations around the world with a broad range of K, U and Th concentrations (Fig. 1, Table 1; see supplementary information for the full dataset, including information for calculating ). Infinite-matrix , and were calculated from these radionuclide data in the Dose Rate and Age Calculator (DRAC; Durcan et al., 2015), using the conversion factors of Guérin et al. (2011). Regression models were used to parameterise the relationships outlined in Sect. 2.1. We also provide regression models based on the conversion factors of Cresswell et al. (2018) in Fig. S2. However, whilst the equations of these regressions differ slightly, their predictive ability, relative to dose rates calculated from high precision methods, is the same as long as the same conversion factors used for the rapid predictions and high precision calculations are the same.
Table 1Descriptive statistics of the radionuclide concentrations included within the dataset. Concentrations are given in % for K and ppm for U and Th (n= 1473). The geographical distributions of samples can be seen in Fig. 2 and frequency distributions of radionuclide concentrations in Fig. 1.
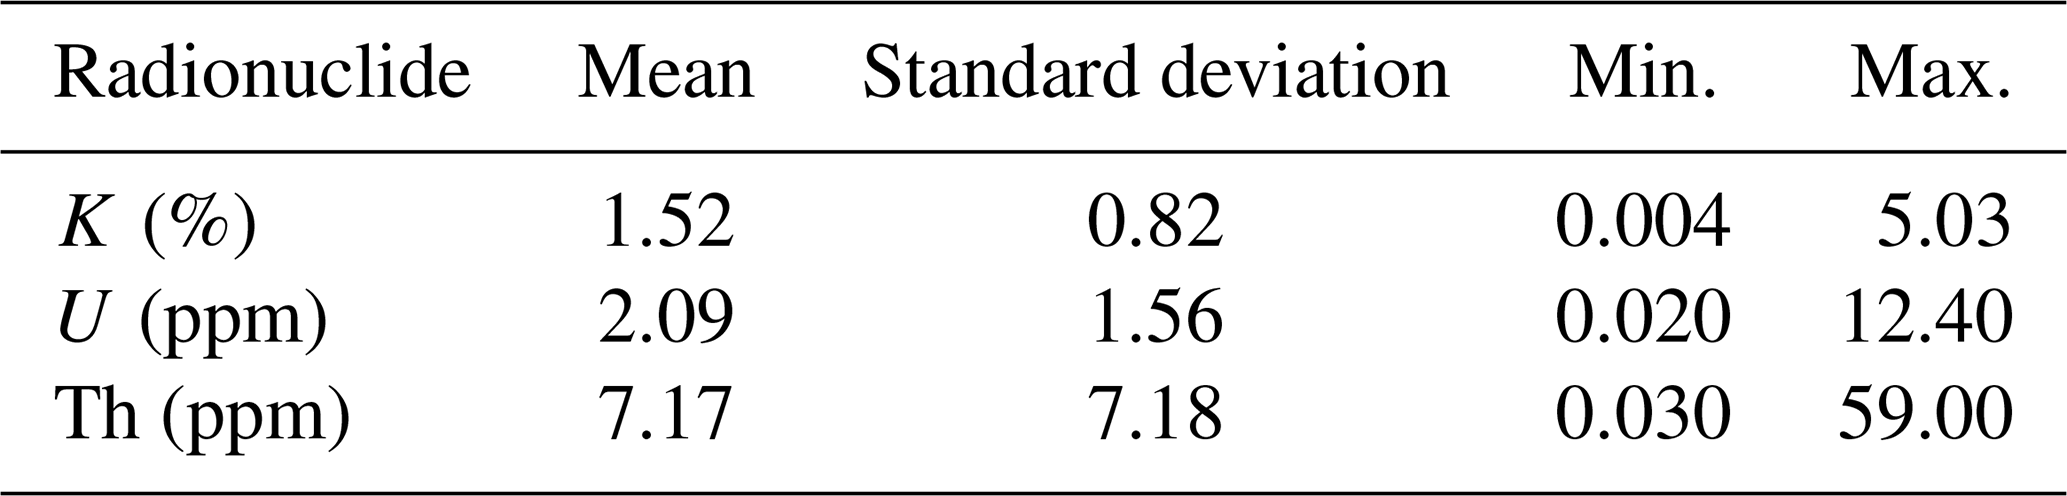
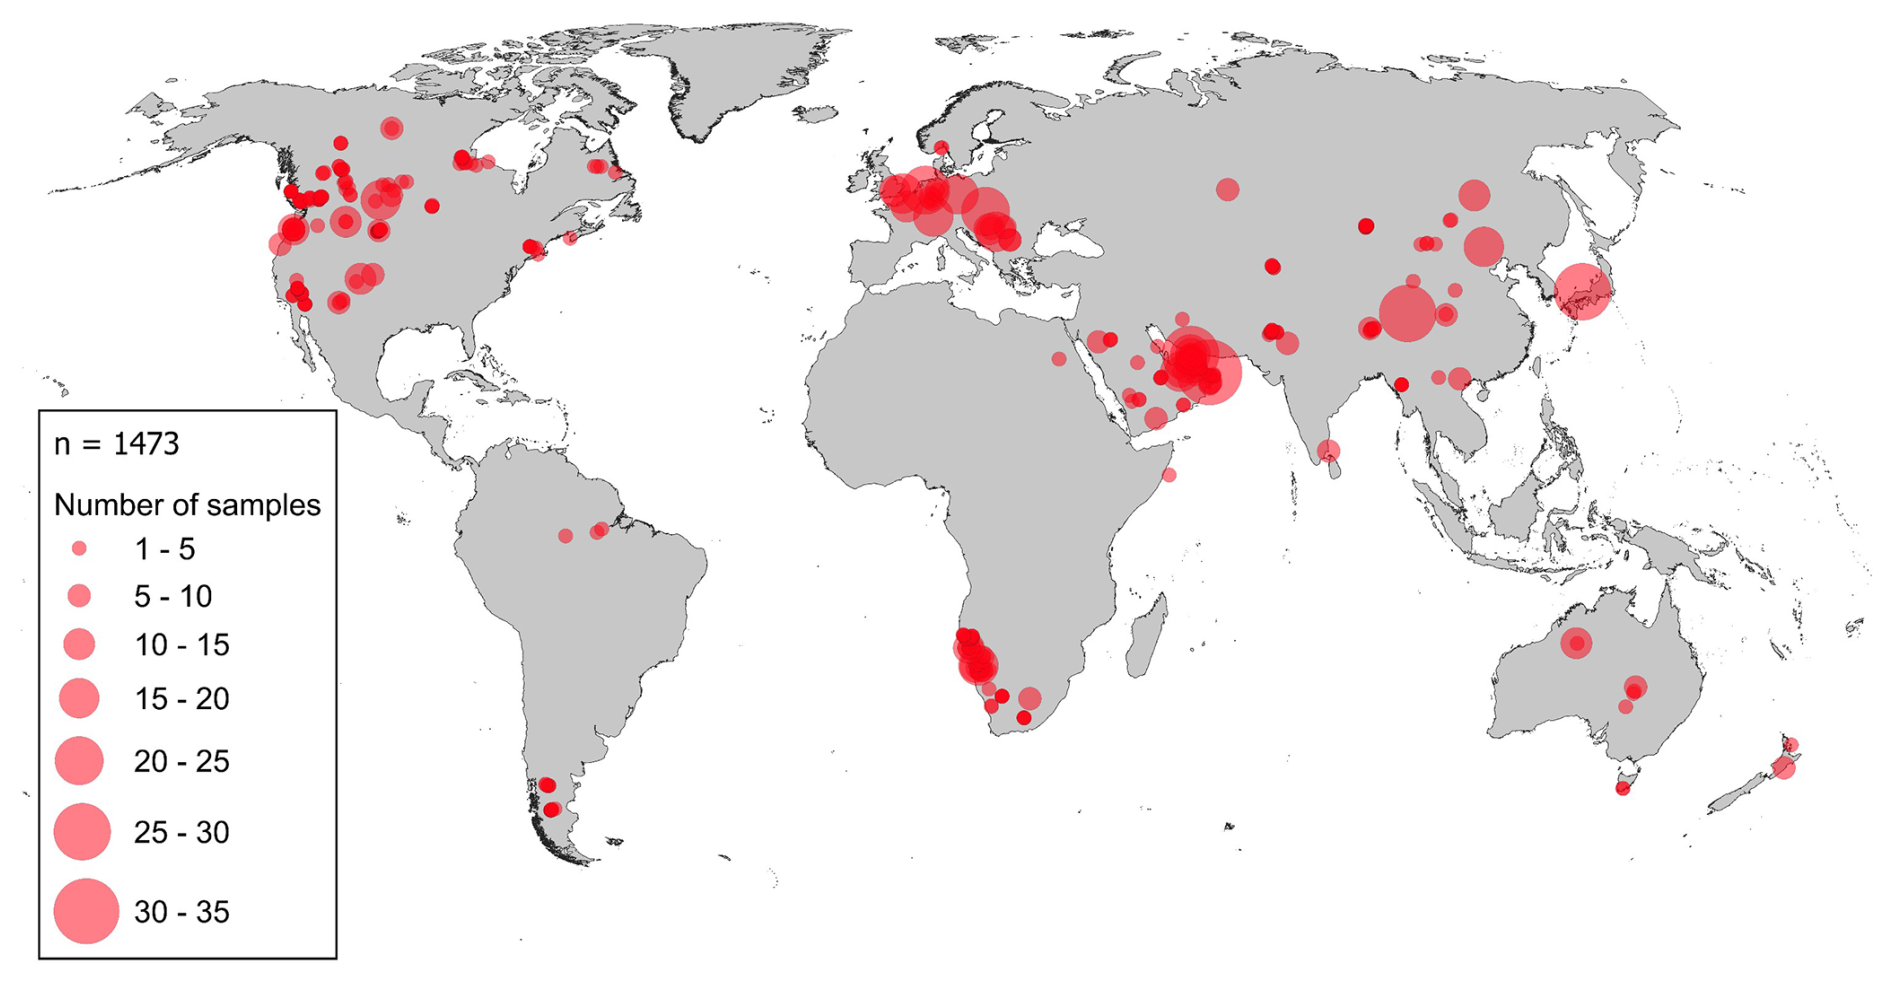
Figure 2Map of the sedimentary radionuclide samples compiled within the dataset used in this study.
2.2 pXRF measurements of K concentrations
Portable XRF was used to measure the K concentrations of 67 sediment dosimetry samples available from the University of the Fraser Valley's Luminescence Dating Laboratory, for which K, U and Th concentrations have previously been measured with NAA or ICP-MS (sample locations and radionuclide concentrations are provided in the supplementary material). Sediments were oven dried and finely milled prior to packing into cups for analysis. Measurements were carried out using a bench-mounted Olympus Vanta pXRF (Fig. 3), with each measurement taking ∼ 90 s. The pXRF system was operated in the two-beam “geochem” mode, meaning that samples were measured using two X-ray beams at 40 and 10 kV (Andrew and Barker, 2018). Each sample was measured three times with the beams hitting different areas of the sediment surface. Throughout the measurements, five certified reference materials (CRMs) with known elemental concentrations and an analytical blank were measured five times each to ensure there was no contamination in the system. The system was cleaned with an air duster between each measurement.
Figure 3(a) The pXRF in its bench mount with the X-ray shield closed during sample measurement. (b) A sample loaded into a cup for analysis placed inside the pXRF's measurement chamber. For scale, the sample is ∼ 2.5 cm in diameter.
The results of pXRF analysis were corrected using a linear calibration equation, following previous studies (e.g., Hall et al., 2014; Andrew and Barker, 2018). This calibration equation was the linear relationship between the pXRF-measured K concentrations of the five CRMs and their known K concentrations (Fig. S5). The limit of detection (LOD) and limit of quantification (LOQ) for our instrument, with respect to K concentration, were determined as three and ten times the standard deviation of repeat measurements of the CRM with the lowest K concentration, respectively (Le Vaillant et al., 2014; Andrew and Barker, 2018; Table S1). The LOD for K in our instrument is 0.015 % and the LOQ is 0.049 %. Further details of instrument calibration and LOD and LOQ determination are provided in the Supplementary Information.
Resulting pXRF K concentrations were expressed as a percentage, corrected using the calibration and averaged (n= 3) for each of the 67 samples. Uncertainties associated with K concentrations were calculated using the standard deviation of the repeat measurements, as well as the standard error associated with the calibration. The measurements were then compared with K concentrations determined using high-precision geochemistry (ICP-MS or NAA) to assess the accuracy of pXRF measurements.
2.3 Dose rate calculations
2.3.1 High-precision dose rates
To test the accuracy of the rapid, pXRF approach to estimating IM dose rates, total was calculated for the same 67 sediment samples using their high-precision radionuclide contents. Total was calculated for five common, theoretical luminescence dating targets: (1) 180–250 µm quartz (that has undergone etching, the removal of the α-irradiated outer portion of the grain with hydrofluoric acid); (2) 180–250 µm KF (etched); (3) 180–250 µm KF (not etched); (4) 4–11 µm quartz; and (5) 4–11 µm polymineral grains.
The radionuclide conversion factors used to transform radionuclide concentrations into IM dose rates, the attenuation factors used to correct the IM dose rates (grain size, etch depth, grain size, α and β attenuation, α efficiency and water content), the assumptions relating to (where applicable), and the parameters used to calculate using the equations of Prescott and Hutton (1994) are summarized in Table 2 for each of these theoretical targets. An arbitrary, theoretical water content of 5 ± 2 % was used to correct dry dose rates using the method of Zimmerman (1971). The contribution of internal α particles was assumed to be negligible in all cases. All dose rate calculations were carried out using DRAC and uncertainties propagated in quadrature (Durcan et al., 2015). All data are available in the Supplement.
2.3.2 Rapid dose rates
The statistical relationships derived from the radionuclide dataset were used to convert pXRF K measurements into IM , and , using the equations given in Fig. 4. These IM dose rates were also corrected for a water content of 5 ± 2 % (Table 2) using the equations of Zimmerman (1971). The choice of water content here is purely arbitrary for the purpose of comparison with the high-precision dose rates. In practice, users should apply their own water content estimate for rapid estimation using this approach. To rapidly generate total estimates, we followed the approach of Aitken (1985) whereby water-corrected dose rates are further corrected by multiplication with simplified attenuation factors (Table 2). This approach is in lieu of the more detailed set of attenuation parameters and calculation steps outlined in Table 2 for high precision dose rates, which are carried out by software packages like DRAC (Durcan et al., 2015). Aitken (1985) suggests that the water-corrected of coarse mineral grains that have been etched should be corrected by a factor of 0.9. For the variety of different grain sizes of the theoretical targets in this study, and , which is a contributor to the total for luminescence dating targets that have not undergone etching, similar mean attenuation factors are provided in Table 2. These mean attenuation factors were calculated using the grain size attenuation data of Brennan et al. (1991). Attenuated values were then corrected further for α efficiency using the α-values given in Table 2 for high precision dose rates. Internal β dose rates were accounted for in the case of KF or polymineral targets by treating them as constant values for given grain sizes, etch depths and an internal K concentration of 12.5 ± 0.5 % (Huntley and Baril, 1997), as calculated by DRAC using the absorption factors of Guérin et al. (2012) (Table 2). Internal α particle contributions are assumed to be negligible in all cases. The was calculated using the equations of Prescott and Hutton (1994) with the same input data as described for the high precision dose rates (Table 2).
Table 2Summary of the parameters and assumptions used to calculate high precision and rapid using the IM dose rates predicted based on pXRF K concentrations. Water contents, α-values and cosmic ray dose rate parameters are the same for both high precision and rapid dose rate calculations.
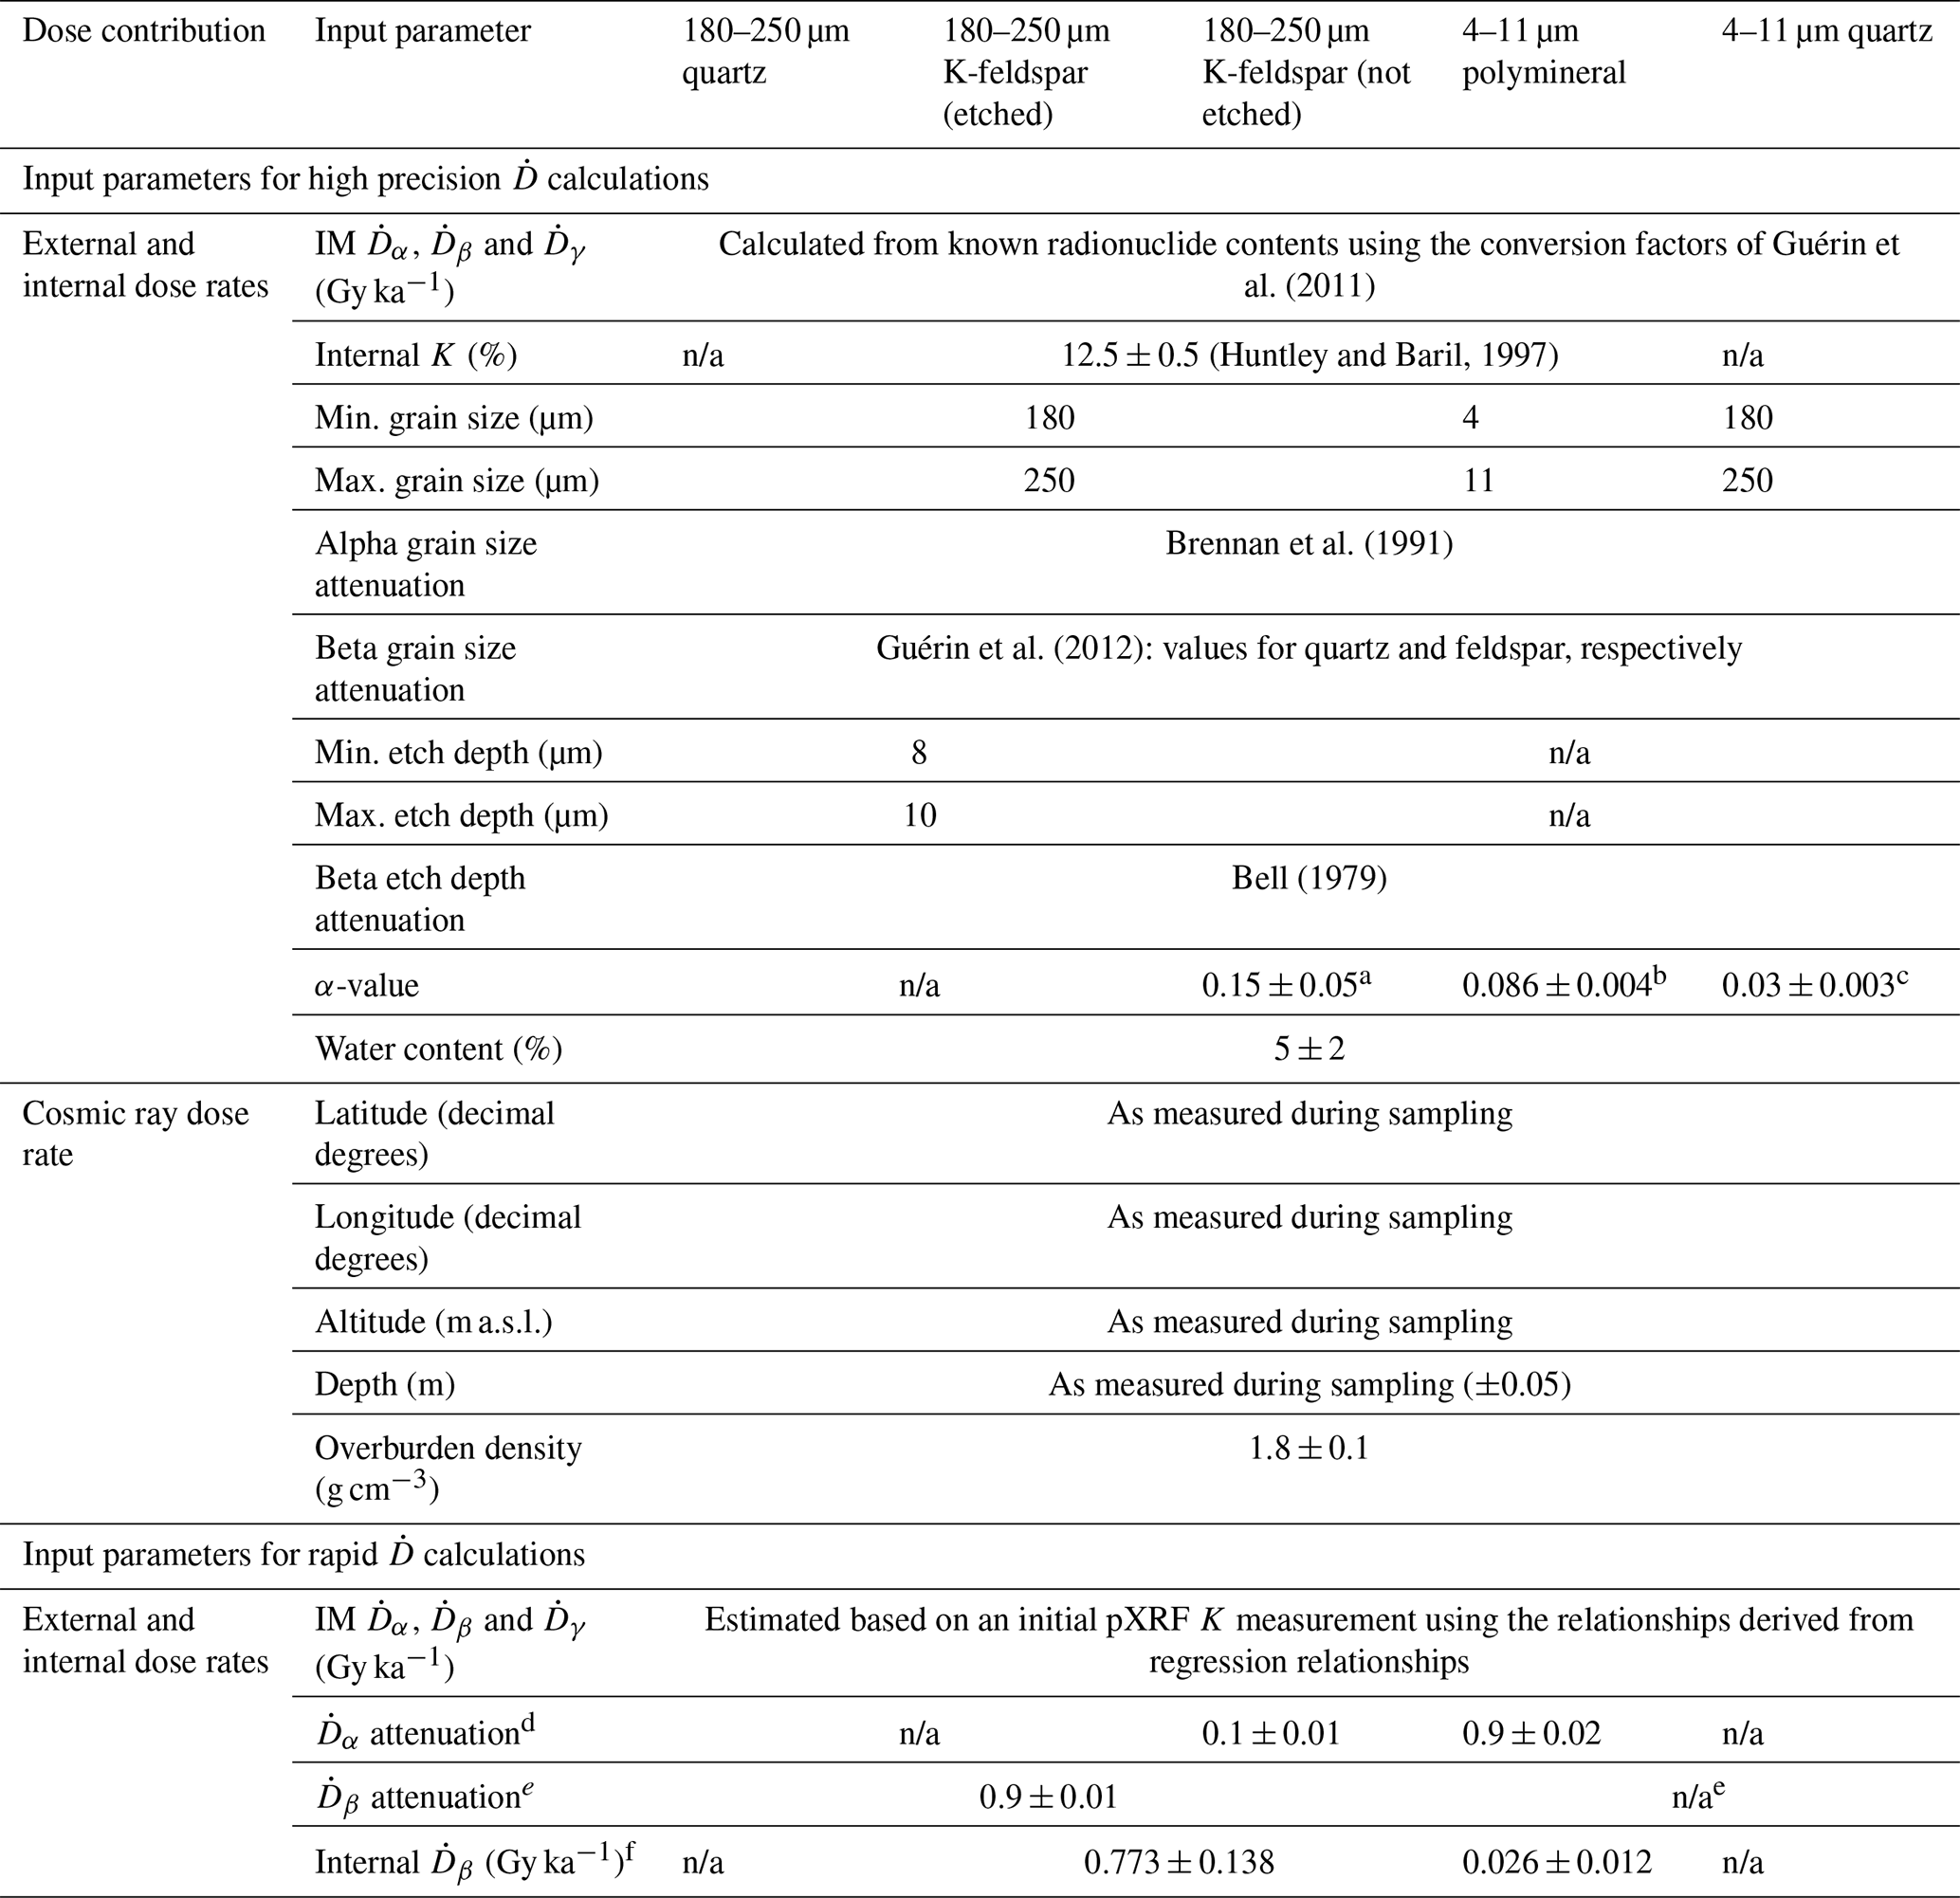
n/a: not applicable. a Value from Balescu and Lamothe (1994). b Value from Rees-Jones (1995). c Value from Mauz et al. (2006). d Mean attenuation factors were calculated using the data of Brennan et al. (1991). e Mean attenuation factors were calculated using the data of Guérin et al. (2012). A mean attenuation factor of 0.99 ± 0.003 was calculated for the 4–11 µm range, so no correction was applied. f Calculated using DRAC for the grain sizes, etch depths and an internal K concentration given in Table 2 for high precision calculations.
3.1 Radionuclide dataset and regression relationships
Figure 4a–c shows the results of IM , and calculated from the K, U and Th values comprising the 1473 sample radionuclide dataset and the conversion factors of Guérin et al. (2011). See Fig. S2 for the same equations calculated using the conversion factors of Cresswell et al. (2018), the results of which are very similar to those shown in Fig. 4. The residuals of these relationships are also shown (Fig. 4d–f), as the difference between dose rates predicted using the different regression models shown in Figure 4a-c with inputs from the high-precision dataset, and the high-precision expected values (the results are shown in Fig. S2). As expected, we find very strong positive correlations between K concentration and IM (Fig. 4a), IM and IM (Fig. 4b) and IM and IM (Fig. 4c), with Pearson's correlation coefficient (r) > 0.95 in all cases. For ease of interpretation, uncertainties are not shown in Fig. 4 as they are small relative to the dose rate values, with , and values having mean relative uncertainties of 6.8 %, 5.1 % and 5.0 %, respectively. These uncertainties are a product of the uncertainties of the K, U and Th concentrations used to calculate them, and the uncertainties associated with the radionuclide conversion factors of Guérin et al. (2011).
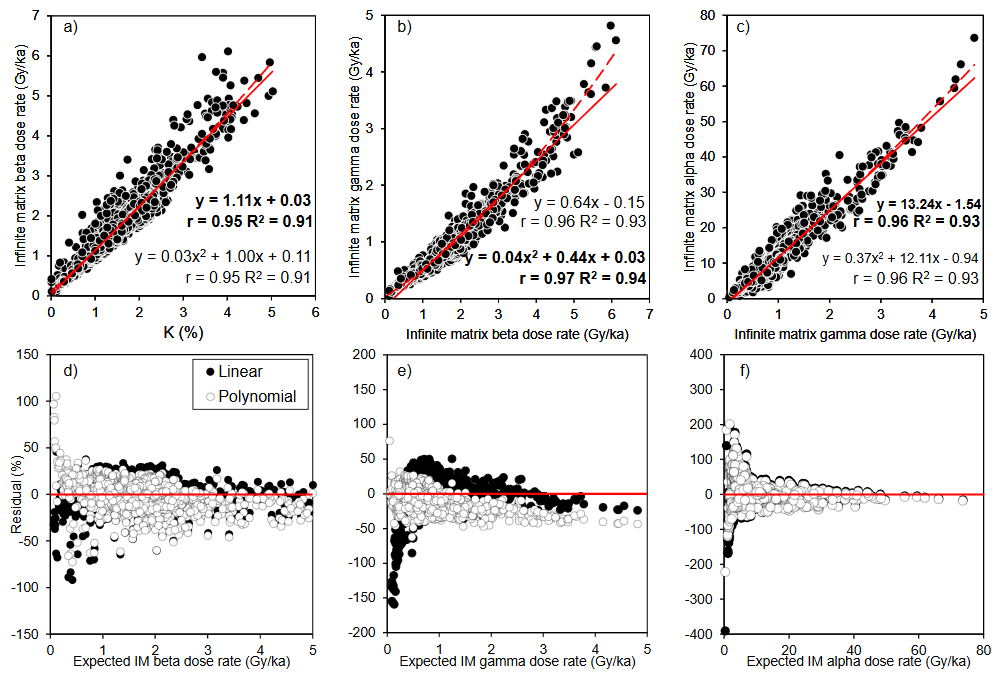
Figure 4Regression relationships for: (a) K concentration and IM , (b) IM and IM , and (c) IM and IM . Equations in bold denote the model fits selected for dose rate predictions in this study. Solid red lines denote the linear trendlines and dashed red lines denote the second order polynomial trendlines (n= 1473). Pearson's correlation coefficient (r) and R2 values are given for each relationship. The root mean squared errors (RMSEs) of the linear relationships are (a) 0.29, (b) 0.17, and (c) 2.40 Gy ka−1. The RMSEs of the polynomial relationships are (a) 0.32, (b) 0.30 and (c) 2.45 Gy ka−1. Panels (d)–(f) show the residuals of the relationships in a-c, expressed as a percentage of the expected dose rate, in each case plotted against the expected dose rate calculated with high-precision methods.
The regression models fitted between the variables are representative, with R2 values exceeding 0.90 in all cases (Fig. 4), and all models have p-values < 0.05, indicating the significance of these relationships at the 95 % confidence level. For all relationships, linear fits were compared with second order polynomials. In the case of the relationships between K concentration vs. IM (Fig. 4a) and IM vs. IM (Fig. 4c), we prefer the simpler linear models due to the R2 values being the same as using the polynomials, and their residuals producing very similar plots (Figs. 4d, f, S2a, c). A second order polynomial fit was used to describe the relationship between IM and IM as it resulted in a greater R2 value relative to the linear fit (R2= 0.94 and 0.93, respectively). The residuals of the second order polynomial relationships for IM vs. IM are also more tightly clustered around 0, avoiding the tail of underestimations for low values that is observed for the linear model (Fig. 4e). These underestimates of IM occur because the linear model has a negative intercept, which can result in negative IM estimates in scenarios where IM is < 0.23 Gy ka−1. However, it is notable that for higher dose rates (> 1 Gy ka−1), the polynomial fit results in greater underestimations than the linear fit (Fig. 4b). So, for samples with low expected gamma dose rates (< 1 Gy ka−1), it is advisable to use the polynomial fit.
The root mean squared errors (RMSEs) of each relationship were calculated by comparing the predicted variable in each case with the observed variable determined with high-precision chemistry (Fig. S2). For the chosen models, the RMSEs for the predicted IM , IM , and IM values are 0.29, 0.30 and 2.40 Gy ka−1, respectively. The regression equations shown in Fig. 4 form the basis for subsequent rapid dose rate estimation using an initial input of K concentration measured with pXRF, with their RMSEs providing uncertainties that are propagated into the final uncertainties on predicted dose rates.
3.2 Portable XRF K concentrations
Of the 67 samples analysed using pXRF, 66 gave results above the LOD of the instrument (LOD = 0.015 %). The only sample that failed to yield a detectable result had a K concentration of 0.02 ± 0.01 % as measured with NAA. Whilst this low value determined by NAA is in fact higher than the LOD, it also falls beneath the LOQ (LOQ = 0.049 %), which may explain why it was not detectable if it was not accurately quantifiable. All of the 66 samples above the LOD were also above the LOQ. Based on the dataset of natural sediment radionuclide contents compiled in this study, sediments with such low K concentrations are rare in nature (Fig. 1; Table 1). Of the 1473 samples included in the dataset, only 14 have K concentrations < 0.1 %, which represents just 1 % of the dataset. Portable XRF should, therefore, be able to provide estimates of K contents in the majority of sedimentary contexts if the LOD and LOQ values as similar to those calculated here.
Potassium concentrations determined with pXRF show a strong, positive correlation with K concentrations measured using high-precision methods (r= 0.97), with central values agreeing closely between the two datasets (R2= 0.93; Fig. 5). The pXRF data are calculated using the mean of three measurements with very small standard deviations relative to mean concentrations (0.0004 %–0.017 %), which demonstrates the consistency of the repeat measurements. Of the 66 samples that yielded detectable results, 65 % have mean pXRF K contents with central values within ±10 % of unity with their high-precision counterparts and 83 % are within ±20%. However, if uncertainties are considered, then all pXRF K concentrations lie within 20 % of unity with high-precision values. The lowest K concentration measured using pXRF was 0.22 ± 0.18 %, within uncertainties of a high-precision concentration of 0.13 ± 0.01 % measured with ICP-MS. The highest K concentration measured using pXRF was 2.93 ± 0.18 %, closely corresponding with a high-precision concentration of 2.90 ± 0.10 % measured using NAA. The regression equation, , shows that the calibrated pXRF measurements tend to slightly overestimate low K concentrations (< 1.5 %) whilst slightly underestimating higher K concentrations (> 1.5 %; Fig. 5).
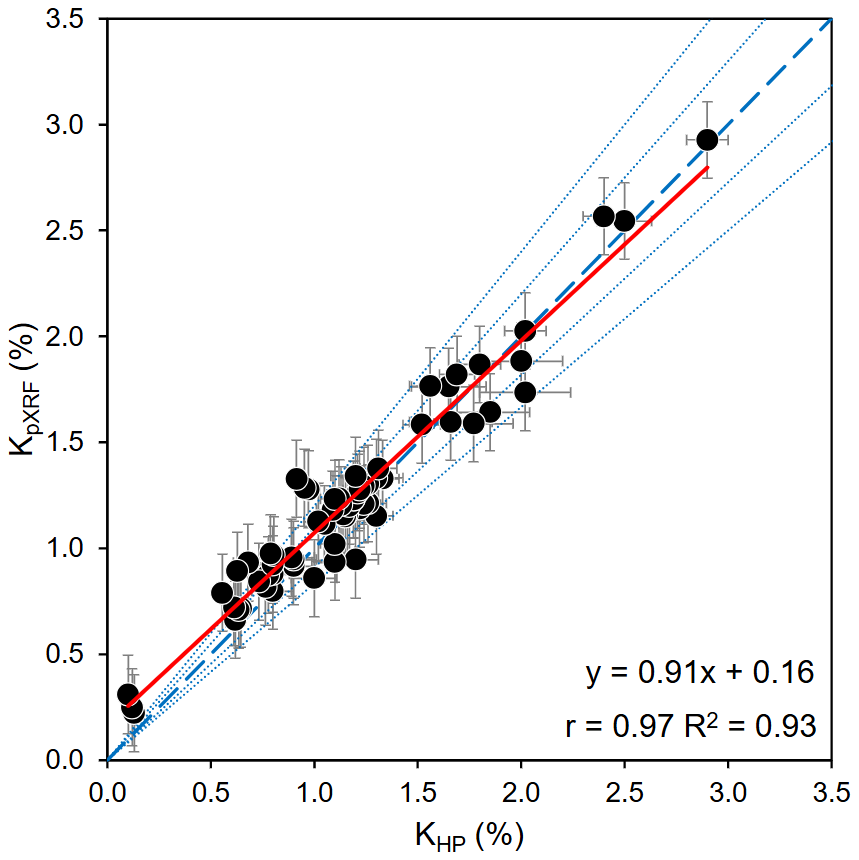
Figure 5Potassium (K) concentrations measured using pXRF (KpXRF) compared with K concentrations derived from high-precision geochemistry methods (KHP). The red line denotes the unweighted linear trendline (n = 66). Pearson's correlation coefficient (r), calculated relative to the regression line, and R2 values, calculated relative to the unity line, are shown for each dataset. The standard error of the slope and intercept of the regression equation are ±0.03 and ±0.04, respectively. The thick dashed blue line represents unity and the thinner blue lines represent ±10 % and ±20 %.
Reliable results were also obtained for the certified reference materials used for calibrating measurements (Table S1). Blank samples yielded K concentrations consistently below detection limits, indicating that no contamination was present in the pXRF system throughout the measurements.
3.3 Comparison between rapid and high precision IM and total dose rates
Figure 6 shows the results of calculating IM , and using rapid pXRF K measurements using the regression relationships derived from the radionuclide dataset (Fig. 4), in comparison to calculations based on high-precision radionuclide measurements and the conversion factors of Guérin et al. (2011). The uncertainties associated with the rapid dose rate values are similar between samples for each emission type. This is because uncertainties incorporate the RMSE of the predictive models (Fig. 4), which are the same for each sample, as well as smaller uncertainties contributed by the input K concentrations measured using the pXRF (Fig. 5). The results of calculating IM dose rates using the equations derived from the conversion factors of Cresswell et al. (2018) are shown in comparison to the results of Fig. 4 in Fig. S3 of the supplementary material. The results of both approaches are within uncertainties of each other and produce R2 values of > 0.99, signifying that both methods produce virtually indistinguishable results.
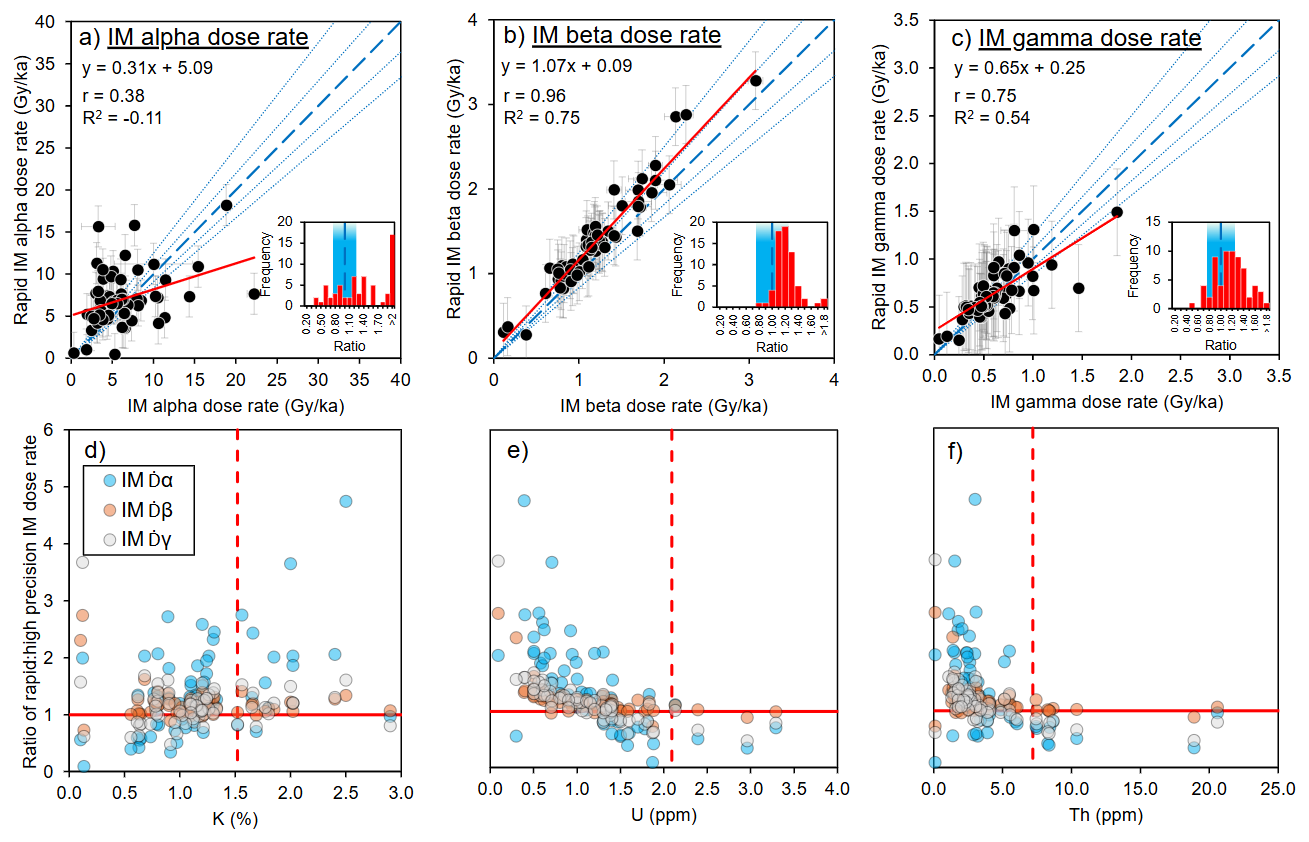
Figure 6Results of the IM external dose rates calculated using the regression relationships given in Fig. 4 based on an initial pXRF measurement of K concentration (y axes), compared with IM external dose rates calculated from K, U and Th concentrations measured using high-precision geochemistry (x axes): (a) IM results, (b) IM results, (c) IM results. Pearson's correlation coefficient (r), calculated relative to the regression line, and R2 values, calculated relative to the unity line, are shown for each dataset. Dashed thick blue lines represent unity and the thinner, dashed blue lines represent ±10 % and ±20 %. The red lines denote the linear trendline for each dataset (n = 66 in all cases). The standard errors of the regression slopes and intercepts are (a) ±0.10 and ±0.69, (b) ±0.04 and ±0.05, and (c) ±0.07 and ±0.05. The inset plots show frequency distributions of the ratios between rapid and high precision IM dose rates, with blue shaded areas representing ± 20 % unity. Panels (d), (e) and (f) show the difference between rapid IM dose rates and high precision dose rates expressed as a ratio plotted against their concentrations of K, U and Th measured with high precision methods, respectively. For ease of interpretation, samples that resulted in negative ratios due to negative dose rates have been omitted. Horizontal red lines show unity and vertical, dashed red lines show the mean concentration of radionuclides in the global dataset (Table 1).
Positive Pearson's correlation coefficients (r) are reported for the trendlines of the high-precision dose rates vs. the rapid estimates and, in all cases, show that the predictions increase with the expected values (Fig. 6a–c). Rapid estimates of IM based on pXRF K measurements show the strongest positive correlation with their high-precision counterparts (r = 0.96) and the closest agreement relative to the unity line (R2= 0.75; Fig. 6b). Calculating ratios between rapid and high-precision values shows that 95 % of central values of rapid IM results are within uncertainties of ±10 % of unity and 100 % are within uncertainties of ±20%. The regression line shows that there is a tendency for the model to consistently overestimate IM by ∼ 10 % (Fig. 6b). The predicted IM values, calculated from the predicted IM results, have a weaker, yet still good, positive relationship with high-precision IM (r = 0.76; Fig. 6c). The slope of the linear trendline for the rapid IM vs. high precision IM is lower than that of IM , showing that the rapid method generally overestimates IM for values < 0.75 Gy ka−1. Despite this, a similar proportion of central values fall within uncertainties of ±10 % and ± 20 % of unity (98 %), relative to the predicted IM (R2= 0.54). The predicted IM values show the weakest positive correlation with the high precision values (r = 0.38; Fig. 6a), with the fewest central values falling within uncertainties of ±10 % (65 %) and ±20 % (71 %) of unity, relative to the other predicted IM external dose rates. The IM trendline also has the lowest slope (0.31), showing that, generally, the regression relationship overestimates IM values < 7.5 Gy ka−1, but will underestimate those > 7.5 Gy ka−1, relative to results calculated using high-precision geochemistry (Fig. 6a). A negative R2 value, relative to the unity line, of −0.11 indicates the poor fit of the regression model between IM predictions and their high-precision counterparts.
For the predicted IM values, the use of a linear regression relationship with a negative intercept (Fig. 4c) can result in negative outputs due to low input values (Fig. 6a). Using the regression relationships, negative IM will result when input IM is < 0.12 Gy ka−1, which corresponds to an initial K concentration of < 0.15 %. However, we report no negative IM results due to all pXRF K measurements that were above the LOD in this study exceeding the threshold of 0.15 %.
Whilst IM is generally predicted accurately (within ±20 % of unity) by the rapid method, overestimations of up to ∼ 300 % are apparent for a few samples with low radionuclide concentrations (Fig. 6d–f). The IM is also overestimated at low radionuclide concentrations, by up to ∼ 400 % (Fig. 6d–f). The IM is overestimated with increasing K contents in sediments, as measured by high-precision methods (Fig. 6d). This overestimation is as much as ∼ 500 % at ∼ 2.5 % K and is explained by the fact that the rapid pXRF approach is solely based on K concentration. Overestimations in IM and IM are also apparent when sediment U and Th contents are low (< 1.5 and < 5 ppm, respectively), relative to the mean U and Th contents of sediments in the radionuclide dataset (Fig. 6e, f; Table 1), as measured by high precision methods. The IM is contributed by the decay chains of K, U and Th and there is a reasonably-strong correlation between K concentration and IM in the global radionuclide dataset (R2= 0.72, Fig. S1f). By contrast, IM only arises due to U and Th decay, explaining why IM is predicted with greater accuracy than IM by the rapid method based solely on K concentration.
Figure 7 shows the results of using the rapid pXRF method and simplified attenuation for calculating total for a suite of theoretical dating targets, compared with a standard approach based on high precision geochemistry and more detailed correction using the DRAC software (Durcan et al., 2015). The rapid approach generally provides good agreement with the high precision approach, with R2 values ranging in strength from 0.48–0.72, relative to unity (Fig. 7).
The best agreement between the rapid and high-resolution determinations is found for the coarse-grained targets, which all have R2 values > 0.67 and at least 95 % of their central rapidly-estimated total values fall within uncertainties of ±10 % of unity (Fig. 7a, b, c). Of the coarse-grained targets, the etched quartz and KF scenarios have the strongest correlations with their high-precision counterparts (r = 0.92; Fig. 7a, b) and the best agreement to the expected dose rates, with R2 values of 0.72. This result is because, due to the assumption that α-irradiated portions of grains have been etched away, the only external dose rates that comprise them are IM and IM , which have the strongest correlations with IM dose rates calculated based on high-precision geochemistry (Fig. 6b, c). For the 180–250 µm quartz example, 56 ± 7 % of the total is contributed by the , whilst the contributes 32 ± 5 % (Table 3). In the 180–250 µm KF (etched) example, the contribution from is lower as a proportion of total (22 ± 5%) due to the contribution of internal β particles (33 ± 1%) (Table 3). Internal dose rate contributions and the are the same for both rapidly-estimated and high-precision total (Tables 2, 3), meaning that the reduced accuracy in estimating using the rapid method is less important in the 180–250 µm KF (etched) scenario, relative to 180–250 µm quartz. Figure 6b also shows that the rapid method typically overestimates IM , leading to a tendency to slightly overestimate total dose rates relative to their high-precision counterparts (Fig. 7), given that makes up the largest proportion of the total dose rate in each scenario (Table 3).
Table 3Mean percentage contributions and 1σ uncertainties of each constituent external, corrected dose rate to the total environmental dose rate, for the theoretical dating targets shown in Fig. 7 (n= 66). These contributions are from the results of high-precision total calculations calculated using DRAC and the parameters in Table 2.
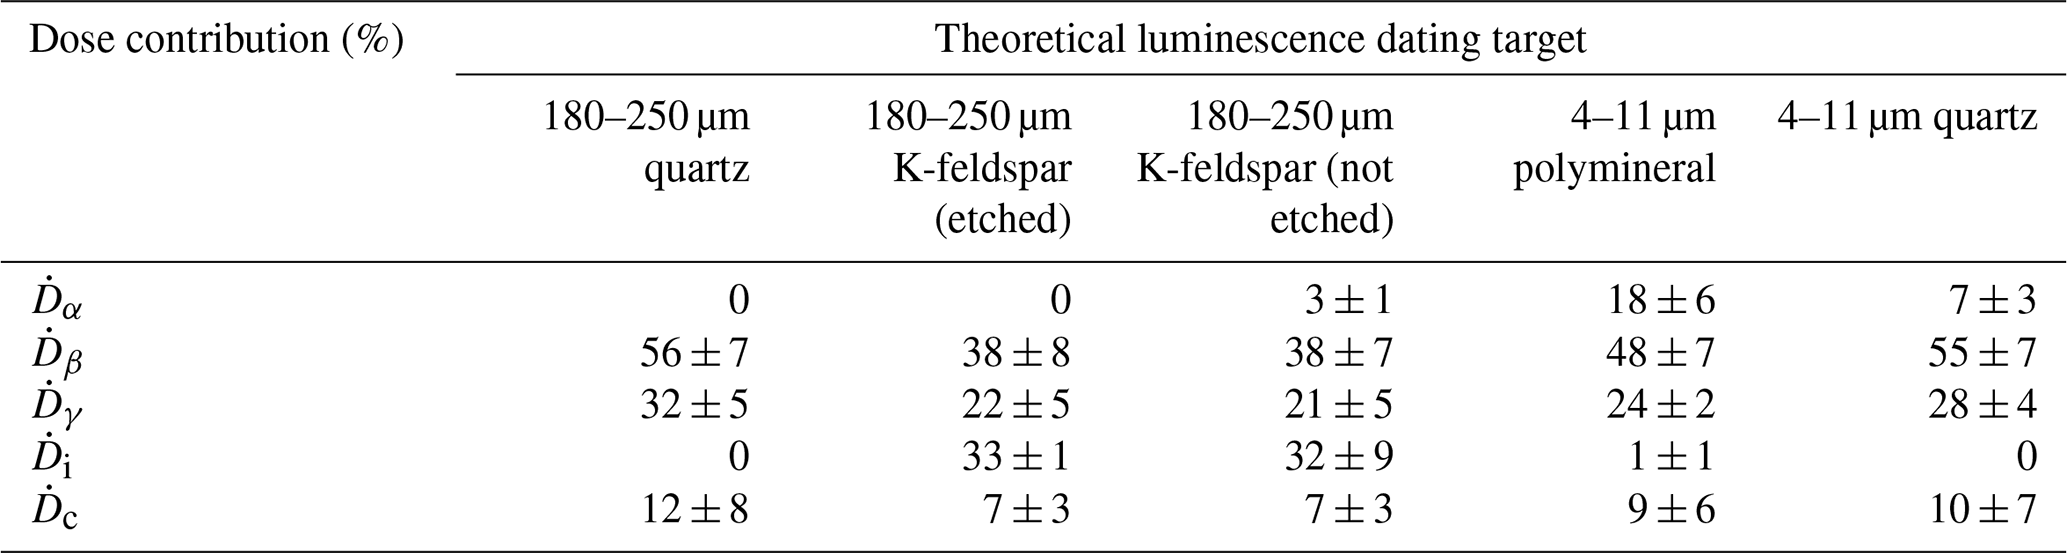
By contrast, the larger the contribution of the IM , the weaker the correlation coefficient between rapid and high-precision total values. Finer grain-size scenarios (4–11 µm polyminerals and quartz) show more scatter in comparison to high-precision data, due to the incorporation of IM into total on account of them having not been etched (Fig. 7d, e). They have weaker r values (0.81 and 0.88, respectively) and R2 values (0.48 and 0.63, respectively). However, 80 % and 91 % of rapidly estimated central values still fall within uncertainties of ±10 % of unity in both cases (Fig. 7d, e). In the case of the 4–11 µm polymineral scenario, 18 ± 6 % of the total is contributed by , as opposed to only 7 ± 3 % in the 4–11 µm quartz scenario (Table 3). Similarly, the incorporation of IM into the total of 180–250 µm KF (not etched) example likely results in the correlation with high-precision data being slightly weaker than that of the other coarse-grained scenarios that do not have IM contributions (Fig. 7c). However, the IM contribution in the 180–250 µm KF (not etched) scenario is, on average, very small (3 ± 1%), so the agreement with high-precision total is stronger than the finer-grained examples (R2= 0.67; Table 3; Fig. 7c).
In all scenarios, the rapid method typically overestimates total for instances where the high-precision calculated dose rate is < ∼ 5 Gy ka−1, as evidenced by the slopes of the regression equations being < 1 (Fig. 7). This is a product of the overestimation that generally results from overestimations of IM , as well as overestimations of low IM and IM values, as discussed above (Fig. 6). The convergence of the trendline with the unity line at ∼ 5 Gy ka−1 in each scenario suggests that higher K concentrations would result in overestimations being more likely, although beyond the range of the samples presented here. However, in all cases the slopes of the trendlines shown in Fig. 7 are within two standard errors (given in the caption of Fig. 6) of the unity line. The intercepts are more dispersed, with the coarse-grained scenarios all having intercepts either within two standard errors of the unity line or very close (within 0.01 Gy ka−1 of two standard errors), whilst the fine-grained scenarios are not within or close to two standard errors of unity.
Uncertainties are larger for the rapidly estimated total values relative to the high precision data in all scenarios (Fig. 7). The largest sources of uncertainty in the rapidly estimated data are the RMSEs associated with the regression relationships used to predict IM dose rates and the measurement uncertainties on the pXRF K concentration and its calibration. Uncertainties associated with the rapidly predicted IM dose rates are larger than the other sources of uncertainty propagated in quadrature during total calculation arising from water content, attenuation factors, and and contributions (Tables 2, 3).
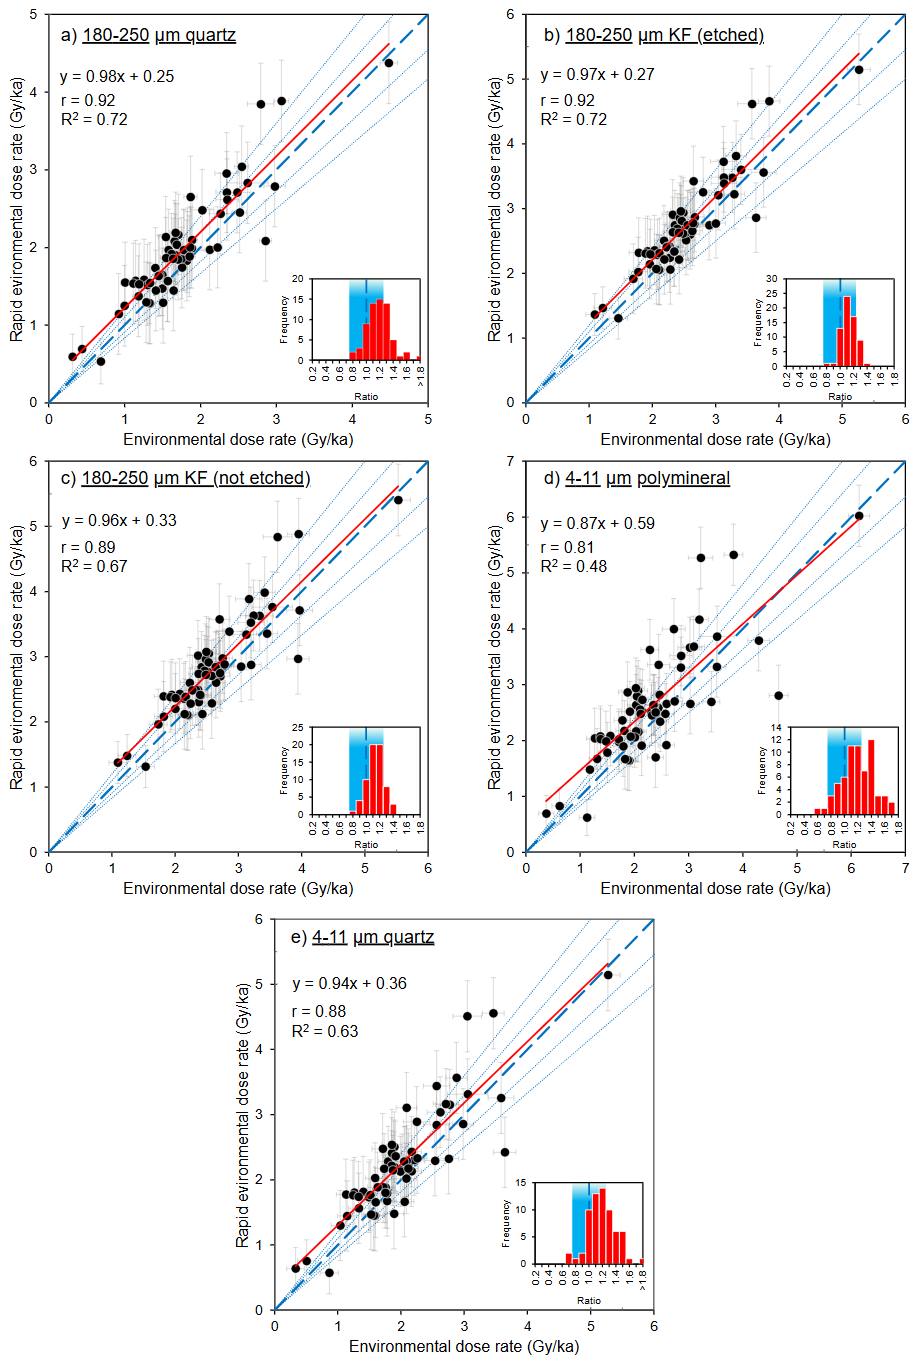
Figure 7Total dose rate predicted based on IM dose rates calculated from rapid pXRF measurements of K concentrations and regression relationships corrected with simplified attenuation factors (y axes) and total dose rates calculated using K, U and Th concentrations measured with high-precision geochemistry and full correction in the DRAC software (x axes) for: (a) 180–250 µm quartz, (b) 180–250 µm K-feldspar (etched), (c) 180–250 µm K-feldspar (not-etched), (d) 4–11 µm polyminerals and (e) 4–11 µm quartz. Pearson's correlation coefficient (r), calculated relative to the regression line, and R2 values, calculated relative to the unity line, are shown for each dataset. The thick, dashed blue line and thinner blue lines represent unity ±10 % and ±20 %, respectively. The red lines denote the linear trendline for each dataset (n= 66 in all cases). The standard errors of the regression slopes and intercepts are (a) ±0.05 and ± 0.10, (b) ±0.05 and ±0.14, (c) ±0.06 and ±0.16, (d) ±0.08 and ±0.19 and (e) ±0.06 and ±0.14. The inset plots show frequency distributions of the ratios between rapid and high precision IM dose rates, with blue shaded areas representing ±20 % unity.
Overall, the use of a simplified set of mean attenuation factors in the rapid approach does not result in a significant loss of accuracy with respect to comparing rapid total to high precision for most dating scenarios (Fig. 7). Figure S5 shows total , calculated using IM dose rates derived from high-precision K, U and Th measurements but corrected with the simplified attenuation procedure, in comparison to the more detailed correction procedure of DRAC. All regressions have an r of > 0.99 and all values are within ±10 % of unity (Fig. S5), demonstrating that the simplified attenuation procedure is contributing little to the discrepancies between rapidly predicted and high-precision (Fig. 7). Inaccuracies in rapidly estimated total are, therefore, more the product of the regression relationships derived from the large radionuclide dataset and pXRF measurement uncertainty (Figs. 4 and 5).
4.1 Determination of K concentrations using pXRF
Estimates of potassium concentration obtained using pXRF agree very well with high-precision measurements reported for the samples analyzed (Fig. 5), demonstrating both accuracy and reliability, similar to the findings of previous studies using pXRF on sediment samples (e.g., Mejía-Piña et al., 2016; Ou et al., 2022; Zhou et al., 2023). We were able to detect the K concentration of 66 out of 67 samples that had K concentrations above our LOD and LOQ of 0.015 % and 0.049 %, respectively, with 65 % of results falling within ±10 % of high-precision geochemistry measurements. This means that pXRF could be used to estimate K contents in most sedimentary contexts with a good degree of accuracy, except where K contents are exceptionally low. Even in situations with low K contents, a non-detection could still provide useful information by estimating a maximum dose rate between 0 Gy ka−1 and the beta dose rate corresponding with the K value determined to be the LOD or LOQ for the specific instrument. Given that measurements take only ∼ 90 s per sample, the speed of pXRF analysis enables rapid and large sample throughput in a laboratory setting.
Therefore, it could be possible to make in-situ estimates of K contents for rapid dose rate estimation. However, using a pXRF system in the field could mean compromising K measurement accuracy in certain scenarios, due to complicating factors like sediment moisture content and heterogeneous grain size, which cause interference (e.g., Nuchdang et al., 2018; Padilla et al., 2019; Rosin et al., 2022). For example, Padilla et al. (2019) show that pXRF underestimates multiple elemental concentrations in a variety of materials with increasing moisture content, relative to expected amounts. Moisture and grain size were controlled in our laboratory experiments by drying and milling sediments prior to analysis, although it is possible that a small pestle and mortar could be taken into the field to mill sediments in situ. Numerous studies have also developed correction factors to help reduce the influence of moisture on in-situ pXRF measurements, although very site-dependent sediment characteristics mean that the success of these approaches is mixed (e.g., Stockmann et al., 2016; Ribeiro et al., 2018). Whilst our laboratory experiment serves as a necessary first step, trialing pXRF in the field for estimating dose rates in a range of different conditions is an important future research goal.
An important caveat to these findings is that the precision and reliability of elemental measurement can vary between different pXRF instruments (Goodale et al., 2012), so it is important to ensure that instruments are calibrated using reference materials with established elemental concentrations. In this study, all 67 samples analyzed using the pXRF had K contents determined independently using high-precision methods (Fig. 5), although we additionally tested instrument accuracy and contamination using certified reference materials. However, for this approach to be useful in future applications, instrument calibration will be especially important when K concentrations are not independently known to provide greater confidence in the accuracy and reliability of pXRF measurements.
Other rapid systems for elemental analysis are also available that could be used instead of pXRF for measuring K concentrations in sediments. For instance, XRF core scanners provide rapid, highly spatially resolved K concentrations in sediment cores from a variety of environments (e.g., Rothwell and Croudace, 2015), which could be used to derive dose rates down-core. However, it is important to note that geochemical core scanning is often carried out using intense X-ray beams to provide additional proxies for sediment density and structure, which may destroy natural luminescence signals required for dating (e.g., Davids et al., 2010). Another alternative may be portable laser-induced breakdown spectrometers (pLIBS), which can accurately measure K concentrations with similar rapidity to pXRF (e.g., Lawley et al., 2021). Alternative approaches to rapidly measure K concentration mean that the approaches developed in this study could be implemented by geoscience and archaeological researchers who may be sampling for trapped charge dating studies in external laboratories, or have access to pOSL units, to help inform sampling strategy or provide range-finder age estimates.
4.2 Rapidly estimating environmental dose rates using pXRF
Our results demonstrate that it is possible to estimate a total for range-finder trapped charge dating based on IM derived from rapidly measured K concentrations alone (Figs. 6, 7). We suggest a three-step method for rapidly estimating using pXRF in a laboratory setting (Fig. 8): (1) measure the K concentration of dried, milled sediment using pXRF (or another method), taking the mean of triplicate measurements; (2) use the equations derived from the radionuclide dataset (Fig. 4) to estimate external IM dose rates from pXRF K concentrations; and (3) correct IM dose rates for water content and a simplified set of attenuation factors and add cosmic ray and internal contributions calculated using standard procedures (Table 2). Whilst this approach does not replace high-precision techniques used for accurate radionuclide and calculation, results show good agreement with based on K, U and Th concentrations measured by high-precision geochemistry and calculated using a more detailed correction procedure (Figs. 6, 7). For coarse-grained luminescence dating scenarios, at least 95 % of rapid estimates fall within uncertainties of ±10 % of unity with their high-precision counterparts, with 100 % within uncertainties of ±20 % of unity (Fig. 7a, b, c).
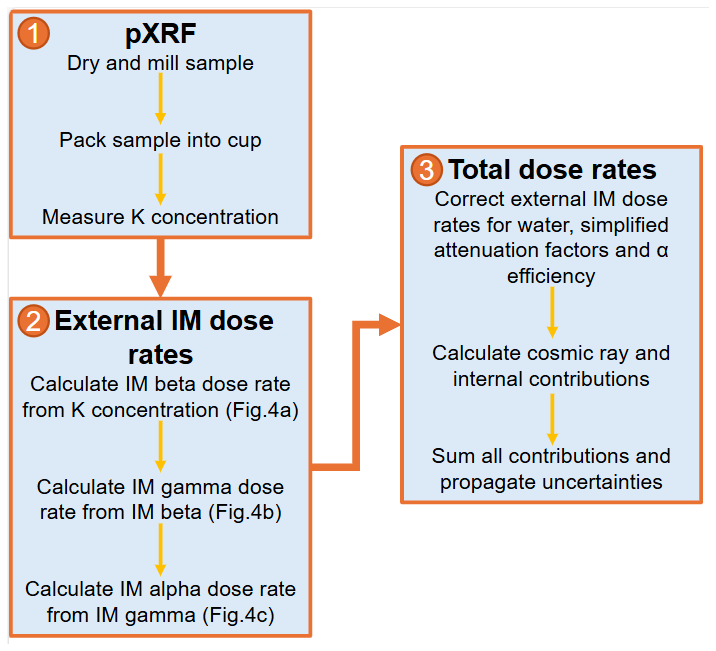
Figure 8Flowchart showing the rapid procedure for estimating total environmental dose rates based on pXRF K measurements tested in this study.
The regression models used for IM dose rate estimation agree well with previous studies. Ou et al. (2022) derived a linear relationship of IM 1.02 K + 0.50 between the K contents of 61 rock slices and their IM (measured independently with beta counting). Our relationship of IM 1.11 K + 0.03 derived from 1473 data points is very similar, except with an intercept much closer to the origin. We found that a second-order polynomial relationship between IM and IM yields a marginally higher R2 value than the linear fit (0.94 vs. 0.93, respectively) using the equation. Ankjægaard and Murray (2007) also observed a non-linear relationship from a large dataset (n = 3758) measured from emission counting but also note that a linear ratio of ∼ 0.50 offers nearly equal predictive power. Using the wider range of K concentrations provided by the large radionuclide dataset, we found that the second order polynomial fit reduces the residual scatter in predicted IM values, especially for low K concentrations (Fig. 4e). If we use a linear fit forced through the origin for these data then the ratio of IM to IM would be 0.58, which agrees very closely with previous findings of 0.50 (Ankjægaard and Murray, 2007) and 0.59 (Roberts et al., 2009). However, we find that there is a poorer agreement with unity for the relationships between the data calculated without the intercepts and high precision dose rates for both estimated IM (R2= 0.51) and IM (R2= −0.29), relative to the estimates calculated using the intercepts shown in Fig. 6, whilst the accuracy of IM estimates are the same. Ankjægaard and Murray (2007) also found that using a model fitted through the origin resulted in a slight reduction of predictive power when estimating IM . Whilst both sets of results are within uncertainties, we suggest that the intercepts be retained to maximise predictive power.
These discrepancies between fitting parameters reported in different studies may likely be explained by different sample sizes or different sampling biases, namely the geological origin of samples. In this study, the majority of the 67 samples that we tested using this rapid approach were sourced from western North America, the radionuclide contents of which will be dependent on their specific source geology. Therefore, the results we demonstrate may not be representative of samples from other parts of the world, given differences in the geological origins of sediment. Whilst beyond the scope of this study, it will be important to test the approach proposed here on samples from other locations to determine the influence of local factors on prediction uncertainties. Similarly, testing the potential sensitivity of the models used to rapidly predict dose rates (Fig. 4) to specific regions and their different ratios of radionuclide concentrations is also an important next step.
Out of the predicted IM dose rates, IM is predicted with the greatest accuracy relative to the high-precision values (Fig. 6b) and IM the least (Fig. 6a). This result is unsurprising, given that previous work has shown IM scales most strongly with K, relative to U and Th (Fig. S1; Ankjægaard and Murray, 2007), whilst IM is not physically related to the K decay chain (Guérin et al., 2011). The negative intercept in the equation relating IM to IM means that negative estimates of IM can occur at low K concentrations (< 0.15 %). Whilst negative dose rates are not physically realistic, only 1.5 % of samples in the radionuclide dataset (n = 1473) have K concentrations < 0.15 %. So, negative predictions of IM are unlikely to occur in most natural sedimentary contexts. The negative intercept we observe may be the result of the natural dispersion of radionuclides in different sedimentary contexts, as well as uncertainties in their conversion to dose rates. Given that the RMSE of the IM vs. IM relationship is 2.40 Gy ka−1 (Fig. 4c), negative estimates would likely be within uncertainties of 0 Gy ka−1 anyway.
The accuracy of rapidly measured K concentrations using pXRF and the strong relationship derived between K concentrations and IM could, theoretically, be used to quickly assess heterogeneity in un-milled sediment and rock samples (e.g., Jankowski and Jacobs, 2018; Ou et al., 2022). The significant, positive correlation between IM and IM means that this approach could also be used as a means of rapidly assessing heterogeneity (Fig. 4c). However, the weaker correlation found between rapidly estimated and high-precision IM (Fig. 6c) means, in practice, that this application would have limited accuracy beyond a rapid, relative assessment.
The total predicted using our rapid method is likely to be more accurate for coarser-grained sediments (e.g., 180–250 µm) that have been etched than for finer-grained sediments (e.g., 4–11 µm) or those that have not been etched, because there is negligible contribution from α particles in the former scenarios (Porat et al., 2015). This means that our approach is best applied to sedimentary contexts likely to yield coarser size fractions, such as aeolian dune and fluvial deposits (e.g., Wintle, 1993; Wallinga, 2002; Srivastava et al., 2019; Durcan et al., 2019; Wolfe et al., 2023). That said, our results still show reasonable agreement for finer-grained scenarios and those where etching is not assumed, with at least 80 % of rapidly estimated total values falling within uncertainties of ±10 % of unity with high-precision values and at least 91 % within uncertainties of ±20 % (Fig. 7c, d, e). So, this approach still has useful applications to sedimentary contexts that are more likely to be dated using finer grain-size fractions, such as loess and lacustrine deposits (e.g., Singhvi et al., 2001; Roberts, 2008; Fenn et al., 2020; Burrough et al., 2022), or if the laboratory does not routinely etch coarse KF grains (Porat et al., 2015). Our approach could also be adapted to different grain-size ranges by calculating mean attenuation factors specific to the desired minimum and maximum sizes using attenuation datasets (e.g., Brennan et al., 1991; Guérin et al., 2012).
Lastly, this study only considers the application of this rapid estimation approach to sediment samples as they are most commonly the target of trapped charge dating studies. However, there is growing interest in the application of these geochronological methods to dating the burial of rock surfaces (e.g., Sohbati et al., 2015; Jenkins et al., 2018). The pXRF approach to rapid estimation could be usefully applied in solid-rock contexts, especially as internal moisture content is unlikely to be important (although grain-size heterogeneity may be, e.g., Ou et al., 2022). It could offer a non-destructive approach for archaeological and culturally sensitive materials, minimizing the need for invasive sampling (e.g., Gliganic et al., 2021, 2024; Moayed et al., 2023).
This study provides a proof of concept that a total environmental dose rate, , can be estimated using a pXRF measurement of K concentration alone, regression relationships provided by a large radionuclide dataset and a simplified set of attenuation factors. This approach is rapid and does not require expensive, specialist facilities. Whilst it is not a replacement for high-precision means of determining , it could support trapped-charge dating studies by offering a means of estimating rapid, range-finder values to help inform sampling strategy and generate initial age estimates.
The radionuclide dataset utilized is comprised of 1473 sediment samples from around the world with radionuclide concentrations (K, U, Th) measured using high-precision geochemistry. These data represent a large variety of different sedimentary and dosimetry contexts and emphasize the utility of large sample analysis to trapped charge dating studies. The linear regression relationships established based on the radionuclide dataset between K concentrations and IM , IM and IM , and IM and IM provide a means of rapidly predicting IM dose rates based on an initial input of K concentration, with strong positive correlations found in all cases.
We found that pXRF provides a rapid and reasonably accurate means of measuring the initial K input to these linear equations, in a controlled laboratory context. We were able to measure K concentrations > 0.02 % for diverse sediment samples, representing 94 % of the range of K concentrations included in the global radionuclide dataset. However, questions remain about the accuracy of this method if applied in a field context where grain size and moisture may influence results. The relationships used to derive IM dose rate estimates from pXRF K measurements were able to predict IM with the greatest accuracy with respect to IM calculated using high-precision K, U and Th data, whilst IM was predicted least accurately. Despite inaccuracies in IM estimation, good agreement is demonstrated for a range of theoretical luminescence dating targets between total values calculated using rapidly estimated IM dose rates and simplified attenuation procedures, with respect to those calculated using high-precision radionuclide concentrations and more complex attenuation. Agreement between these rapidly predicted dose rates and those calculated with high-precision radionuclides is > 95 % within uncertainties of ±10 of unity for coarse-grained quartz and KF scenarios where is assumed to be negligible. Even when there are IM contributions to the overall dose rate, > 80 % and 91 % of rapidly predicted results fall within uncertainties of ±10 % and 20 % of unity with high-precision values, respectively. As such, this pXRF-based approach to rapidly estimating dose rates shows promise in a variety of sedimentary settings, even for fine-grained sediments where α particles are likely to contribute more significantly to the of dating targets.
All data are available on Zenodo at https://doi.org/10.5281/zenodo.17808545 (Woor et al., 2025).
The supplement related to this article is available online at https://doi.org/10.5194/gchron-8-1-2026-supplement.
SW was responsible for conceptualizing the project, constructing the radionuclide dataset, carrying out laboratory measurements, data analysis and the preparation of all figures and the initial draft of this manuscript, under the supervision of MD and OL and with the input of MS and JD. OL and MS provided the sediment samples analyzed in this study. MD, OL, JD and MS provided feedback on the radionuclide dataset and laboratory measurements, as well as editing the manuscript.
At least one of the (co-)authors is a member of the editorial board of Geochronology. The peer-review process was guided by an independent editor, and the authors also have no other competing interests to declare.
Publisher’s note: Copernicus Publications remains neutral with regard to jurisdictional claims made in the text, published maps, institutional affiliations, or any other geographical representation in this paper. While Copernicus Publications makes every effort to include appropriate place names, the final responsibility lies with the authors. Views expressed in the text are those of the authors and do not necessarily reflect the views of the publisher.
The authors would like to thank Shaun Barker and Farhad Bouzari at the University of British Columbia for granting access to the Mineral Deposit Research Unit’s portable X-ray fluorescence spectrometer. This manuscript has been greatly improved because of the detailed comments made by Loïc Martin, Martin Autzen, one anonymous reviewer and the Associate Editor, Sumiko Tsukamoto.
This research has been supported by the Natural Sciences and Engineering Research Council of Canada Grant “Porphyry fertility and vectoring at the belt to deposit scale in British Columbia” (Alliance grant no. 570463), Discovery grant nos. 311281 and RGPIN-2020-05365.
This paper was edited by Sumiko Tsukamoto and reviewed by Loïc Martin, Martin Autzen, and one anonymous referee.
Aitken, M. J.: Thermoluminescence dating: past progress and future trends, Nuclear Tracks and Radiation Measurements, 10, 3–6, https://doi.org/10.1016/0735-245X(85)90003-1, 1985.
Alexanderson, H. and Bernhardson, M.: OSL dating and luminescence characteristics of aeolian deposits and their source material in Dalarna, central Sweden, Boreas, 45, 876–893, https://doi.org/10.1111/bor.12197, 2016.
Andrew, B. S. and Barker, S. L.: Determination of carbonate vein chemistry using portable X-ray fluorescence and its application to mineral exploration. Geochemistry: Exploration, Environment, Analysis, 18, 85–93, https://doi.org/10.1144/geochem2016-011, 2018.
Ankjærgaard, C. and Murray, A. S.: Total beta and gamma dose rates in trapped charge dating based on beta counting, Radiation Measurements, 42, 352–359, https://doi.org/10.1016/j.radmeas.2006.12.007, 2007.
Balescu, S. and Lamothe, M.: Comparison of TL and IRSL age estimates of feldspar coarse grains from waterlain sediments, Quaternary Science Reviews, 13, 437–444, https://doi.org/10.1016/0277-3791(94)90056-6, 1994.
Bateman, M. D., Stein, S., Ashurst, R. A., and Selby, K.: Instant luminescence chronologies? High resolution luminescence profiles using a portable luminescence reader, Quaternary Geochronology, 30, 141–146, https://doi.org/10.1016/j.quageo.2014.12.007, 2015.
Bell, W. T.: Attenuation factors for the absorbed radiation dose in quartz inclusions for thermoluminescence dating, Ancient TL, 8, 12, https://doi.org/10.26034/la.atl.1979.022, 1979.
Brennan, B. J., Lyons, R. G., and Phillips, S. W.: Attenuation of alpha particle track dose for spherical grains, International Journal of Radiation Applications and Instrumentation. Part D. Nuclear Tracks and Radiation Measurements, 18, 249–253, https://doi.org/10.1016/1359-0189(91)90119-3, 1991.
Burrough, S. L., Thomas, D. S., Allin, J. R., Coulson, S. D., Mothulatshipi, S. M., Nash, D. J., and Staurset, S.: Lessons from a lakebed: unpicking hydrological change and early human landscape use in the Makgadikgadi basin, Botswana, Quaternary Science Reviews, 291, 107662, https://doi.org/10.1016/j.quascirev.2022.107662, 2022.
Cresswell, A. J., Carter, J., and Sanderson, D. C. W.: Dose rate conversion parameters: Assessment of nuclear data, Radiation Measurements, 120, 195–201, https://doi.org/10.1016/j.radmeas.2018.02.007, 2018.
Davids, F., Roberts, H. M. and Duller, G. A.: Is X-ray core scanning non-destructive? Assessing the implications for optically stimulated luminescence (OSL) dating of sediments, Journal of Quaternary Science: Published for the Quaternary Research Association, 25, 348–353, https://doi.org/10.1002/jqs.1329, 2010.
Duller, G. A. T.: Luminescence chronology of raised marine terraces, south-west North Island, New Zealand, PhD thesis, University of Wales, Aberystwyth, https://www.aber.ac.uk/en/dges/research/quaternary/luminescence-research-laboratory/ancient-tl/onlinetheses/ (last access: 3 December 2025), 1992.
Durcan, J. A., King, G. E., and Duller, G. A.: DRAC: Dose Rate and Age Calculator for trapped charge dating, Quaternary Geochronology, 28, 54–61, https://doi.org/10.1016/j.quageo.2015.03.012, 2015.
Durcan, J. A., Roberts, H. M., Duller, G. A. T., and Alizai, A. H.: Testing the use of range-finder OSL dating to inform field sampling and laboratory processing strategies, Quaternary Geochronology, 5, 86–90, https://doi.org/10.1016/j.quageo.2009.02.014, 2010.
Durcan, J. A., Thomas, D. S., Gupta, S., Pawar, V., Singh, R. N., and Petrie, C. A.: Holocene landscape dynamics in the Ghaggar-Hakra palaeochannel region at the northern edge of the Thar Desert, northwest India, Quaternary International, 501, 317–327, https://doi.org/10.1016/j.quaint.2017.10.012, 2019.
Fenn, K., Durcan, J. A., Thomas, D. S., Millar, I. L., and Marković, S. B.: Re-analysis of late Quaternary dust mass accumulation rates in Serbia using new luminescence chronology for loess–palaeosol sequence at Surduk, Boreas, 49, 634–652, https://doi.org/10.1111/bor.12445, 2020.
Gliganic, L. A., McDonald, J., and Meyer, M. C.: Luminescence rock surface exposure and burial dating: a review of an innovative new method and its applications in archaeology, Archaeological and Anthropological Sciences, 16, 17, https://doi.org/10.1007/s12520-023-01915-0, 2024.
Gliganic, L. A., Meyer, M. C., May, J. H., Aldenderfer, M. S., and Tropper, P.: Direct dating of lithic surface artifacts using luminescence, Science Advances, 7, eabb3424, https://doi.org/10.1126/sciadv.abb3424, 2021.
Goodale, N., Bailey, D. G., Jones, G. T., Prescott, C., Scholz, E., Stagliano, N., and Lewis, C.: pXRF: a study of inter-instrument performance, Journal of Archaeological Science, 39, 875–883, https://doi.org/10.1016/j.jas.2011.10.014, 2012.
Gray, H. J., Mahan, S. A., Springer, K. B., and Pigati, J. S.: Examining the relationship between portable luminescence reader measurements and depositional ages of paleowetland sediments, Las Vegas Valley, Nevada, Quaternary Geochronology, 48, 80–90, https://doi.org/10.1016/j.quageo.2018.07.006, 2018.
Guérin, G., Mercier, N., and Adamiec, G.: Dose-rate conversion factors: update, Ancient TL, 29, 5–8, 2011.
Guérin, G., Mercier, N., Nathan, R., Adamiec, G., and Lefrais, Y.: On the use of the infinite matrix assumption and associated concepts: a critical review, Radiation Measurements, 47, 778–785, https://doi.org/10.1016/j.radmeas.2012.04.004, 2012.
Hall, G. E., Bonham-Carter, G. F., and Buchar, A.: Evaluation of portable X-ray fluorescence (pXRF) in exploration and mining: Phase 1, control reference materials, Geochemistry: Exploration, Environment, Analysis, 14, 99–123, https://doi.org/10.1144/geochem2013-241, 2014.
Hossain, S. M., De Corte, F., and Vandenberghe, D.: A comparison of methods for the annual radiation dose determination in the luminescence dating of loess sediment, Nuclear Instruments and Methods in Physics Research Section A: Accelerators, Spectrometers, Detectors and Associated Equipment, 490, 598–613, https://doi.org/10.1016/S0168-9002(02)01078-1, 2002.
Huntley, D. J., Nissen, M. K., Thomson, J., and Calvert, S. E.: An improved alpha scintillation counting method for determination of Th, U, Ra-226, Th-230 excess, and Pa-231 excess in marine sediments, Canadian Journal of Earth Sciences, 23, 959–966, https://doi.org/10.1139/e86-097, 1986.
Huntley, D. J. and Baril, M. R.: The K content of the K-feldspars being measured in optical dating or in thermoluminescence dating, Ancient TL, 15, 11–13, 1997.
Jankowski, N. R. and Jacobs, Z. Beta dose variability and its spatial contextualisation in samples used for optical dating: An empirical approach to examining beta microdosimetry, Quaternary Geochronology, 44, 23–37, https://doi.org/10.1016/j.quageo.2017.08.005, 2018.
Jenkins, G. T. H., Duller, G. A. T., Roberts, H. M., Chiverrell, R. C., and Glasser, N. F.: A new approach for luminescence dating glaciofluvial deposits-High precision optical dating of cobbles, Quaternary Science Reviews, 192, 263–273, https://doi.org/10.1016/j.quascirev.2018.05.036, 2018.
Lawley, C. J., Somers, A. M., and Kjarsgaard, B. A.: Rapid geochemical imaging of rocks and minerals with handheld laser induced breakdown spectroscopy (LIBS), Journal of Geochemical Exploration, 222, 106694, https://doi.org/10.1016/j.gexplo.2020.106694, 2021.
Leighton, C. L. and Bailey, R. M.: Investigating the potential of HCl-only treated samples using range-finder OSL dating, Quaternary Geochronology, 25, 1–9, https://doi.org/10.1016/j.quageo.2014.08.002, 2015.
Lemiere, B.: A review of pXRF (field portable X-ray fluorescence) applications for applied geochemistry, Journal of Geochemical Exploration, 188, 350–363, https://doi.org/10.1016/j.gexplo.2018.02.006, 2018.
Le Vaillant, M., Barnes, S. J., Fisher, L., Fiorentini, M. L., and Caruso, S.: Use and calibration of portable X-Ray fluorescence analysers: application to lithogeochemical exploration for komatiite-hosted nickel sulphide deposits, Geochemistry: Exploration, Environment, Analysis, 14, 199–209, 2014.
Mauz, B., Packman, S., and Lang, A.: The alpha effectiveness in silt-sized quartz: new data obtained by single and multiple aliquot protocols, Ancient TL, 24, 47–52, https://doi.org/10.26034/la.atl.2006.396, 2006.
Mejdahl, V.: Internal radioactivity in quartz and feldspar grains, Ancient TL, 5, 10–17, https://doi.org/10.26034/la.atl.1987.119, 1987.
Mejía-Piña, K. G., Huerta-Diaz, M. A., and González-Yajimovich, O.: Calibration of handheld X-ray fluorescence (XRF) equipment for optimum determination of elemental concentrations in sediment samples, Talanta, 161, 359–367, https://doi.org/10.1016/j.talanta.2016.08.066, 2016.
Melquiades, F. L., Bastos, R. O., Rampim, L., Sandrino, I. I., Rodriguez, D. G., and Parreira, P. S.: Thorium and uranium rapid quantification in soil with portable X-ray fluorescence, Soil Science Society of America Journal, 88, 557–564, https://doi.org/10.1002/saj2.20639, 2024.
Moayed, N. K., Sohbati, R., Murray, A. S., Rades, E. F., Fattahi, M., and Ruiz López, J. F.: Rock surface luminescence dating of prehistoric rock art from central Iberia, Archaeometry, 65, 319–334, https://doi.org/10.1111/arcm.12826, 2023.
Munyikwa, K., Kinnaird, T. C., and Sanderson, D. C.: The potential of portable luminescence readers in geomorphological investigations: a review, Earth Surface Processes and Landforms, 46, 131–150, https://doi.org/10.1002/esp.4975, 2021.
Nathan, R. P., Thomas, P. J., Jain, M., Murray, A. S., and Rhodes, E. J.: Environmental dose rate heterogeneity of beta radiation and its implications for luminescence dating: Monte Carlo modelling and experimental validation, Radiation Measurements, 37, 305–313, https://doi.org/10.1016/S1350-4487(03)00008-8, 2003.
Nuchdang, S., Niyomsat, T., Pitiphatharabun, S., Sukhummek, B., Leelanupat, O., and Rattanaphra, D.: Effect of grain size and moisture content on major and minor elements concentrations using portable X-ray fluorescence, in: Journal of Physics: Conference Series, 1144, 012060, https://doi.org/10.1088/1742-6596/1144/1/012060, 2018.
Olley, J. M., Pietsch, T., and Roberts, R. G.: Optical dating of Holocene sediments from a variety of geomorphic settings using single grains of quartz, Geomorphology, 60, 337–358, https://doi.org/10.1016/j.geomorph.2003.09.020, 2004.
Ou, X. J., Roberts, H. M., and Duller, G. A. T.: Rapid assessment of beta dose variation inside cobbles, and implications for rock luminescence dating, Quaternary Geochronology, 72, 101349, https://doi.org/10.1016/j.quageo.2022.101349, 2022.
Padilla, J. T., Hormes, J., and Selim, H. M.: Use of portable XRF: Effect of thickness and antecedent moisture of soils on measured concentration of trace elements, Geoderma, 337, 143–149, https://doi.org/10.1016/j.geoderma.2018.09.022, 2019.
Porat, N., Faerstein, G., Medialdea, A., and Murray, A. S.: Re-examination of common extraction and purification methods of quartz and feldspar for luminescence dating, Ancient TL, 33, 22–30, 2015.
Prescott, J. R. and Hutton, J. T.: Cosmic ray contributions to dose rates for luminescence and ESR dating: large depths and long-term time variations, Radiation Measurements, 23, 497–500, https://doi.org/10.1016/1350-4487(94)90086-8, 1994.
Rees-Jones, J.: Optical dating of young sediments using fine-grain quartz, Ancient TL, 13, 9–14, 1995.
Ribeiro, B. T., Weindorf, D. C., Silva, B. M., Tassinari, D., Amarante, L. C., Curi, N., and Guimarães Guilherme, L. R.: The Influence of Soil Moisture on Oxide Determination in Tropical Soils via Portable X-ray Fluorescence, Soil Science Society of America Journal, 82, 632–644, https://doi.org/10.2136/sssaj2017.11.0380, 2018.
Rizza, M., Rixhon, G., Valla, P. G., Gairoard, S., Delanghe, D., Fleury, J., Tal, M., and Groleau, S.: Revisiting a proof of concept in quartz-OSL bleaching processes using sands from a modern-day river (the Séveraisse, French Alps), Quaternary Geochronology, 82, 101520, https://doi.org/10.1016/j.quageo.2024.101520, 2024.
Roberts, H. M.: The development and application of luminescence dating to loess deposits: a perspective on the past, present and future, Boreas, 37, 483–507, https://doi.org/10.1111/j.1502-3885.2008.00057.x, 2008.
Roberts, H. M., Durcan, J. A., and Duller, G. A.: Exploring procedures for the rapid assessment of optically stimulated luminescence range-finder ages, Radiation Measurements, 44, 582–587, https://doi.org/10.1016/j.radmeas.2009.02.006, 2009.
Rosin, N. A., Dematte, J. A., Leite, M. C. A., de Carvalho, H. W. P., Costa, A. C., Greschuk, L. T., Curi, N., and Silva, S. H. G.: The fundamental of the effects of water, organic matter, and iron forms on the pXRF information in soil analyses, Catena, 210, 105868, https://doi.org/10.1016/j.catena.2021.105868, 2022.
Rothwell, R. G. and Croudace, I. W. (Eds.): Twenty years of XRF core scanning marine sediments: what do geochemical proxies tell us?, in: 70 Micro-XRF Studies of Sediment Cores: Applications of a non-destructive tool for the environmental sciences, Springer, Dordrecht, 25–102, https://doi.org/10.1007/978-94-017-9849-5_2, 2015.
Sanderson, D. C. and Murphy, S.: Using simple portable OSL measurements and laboratory characterisation to help understand complex and heterogeneous sediment sequences for luminescence dating, Quaternary Geochronology, 5, 299–305, https://doi.org/10.1016/j.quageo.2009.02.001, 2010.
Singhvi, A. K., Bluszcz, A., Bateman, M. D., and Rao, M. S.: Luminescence dating of loess–palaeosol sequences and coversands: methodological aspects and palaeoclimatic implications, Earth-Science Reviews, 54, 193–211, https://doi.org/10.1016/S0012-8252(01)00048-4, 2001.
Smedley, R. K., Duller, G. A., Pearce, N. J. G., and Roberts, H. M.: Determining the K-content of single-grains of feldspar for luminescence dating, Radiation Measurements, 47, 790–796, https://doi.org/10.1016/j.radmeas.2012.01.014, 2012.
Smedley, R. K., Duller, G. A. T., Rufer, D., and Utley, J. E. P.: Empirical assessment of beta dose heterogeneity in sediments: Implications for luminescence dating, Quaternary Geochronology, 56, 101052, https://doi.org/10.1016/j.quageo.2020.101052, 2020.
Sohbati, R., Murray, A. S., Porat, N., Jain, M., and Avner, U.: Age of a prehistoric “Rodedian” cult site constrained by sediment and rock surface luminescence dating techniques, Quaternary Geochronology, 30, 90–99, https://doi.org/10.1016/j.quageo.2015.09.002 2015.
Srivastava, A., Durcan, J. A., and Thomas, D. S.: Analysis of late Quaternary linear dune development in the Thar Desert, India, Geomorphology, 344, 90–98, https://doi.org/10.1016/j.geomorph.2019.07.013, 2019.
Stockmann, U., Cattle, S. R., Minasny, B., and McBratney, A. B.: Utilizing portable X-ray fluorescence spectrometry for in-field investigation of pedogenesis, Catena, 139, 220–231, https://doi.org/10.1016/j.catena.2016.01.007, 2016.
Stone, A., Bateman, M. D., Burrough, S. L., Garzanti, E., Limonta, M., Radeff, G., and Telfer, M. W.: Using a portable luminescence reader for rapid age assessment of aeolian sediments for reconstructing dunefield landscape evolution in southern Africa, Quaternary Geochronology, 49, 57–64, https://doi.org/10.1016/j.quageo.2018.03.002, 2019.
Stone, A., Bateman, M. D., Sanderson, D., Burrough, S. L., Cutts, R., and Cresswell, A.: Probing sediment burial age, provenance and geomorphic processes in dryland dunes and lake shorelines using portable luminescence data, Quaternary Geochronology, 82, 101542, https://doi.org/10.1016/j.quageo.2024.101542, 2024.
Wallinga, J.: Optically stimulated luminescence dating of fluvial deposits: a review, Boreas, 31, 303–322, https://doi.org/10.1111/j.1502-3885.2002.tb01076.x, 2002.
Walsh, E. V., Burrough, S. L., and Thomas, D. S.: A chronological database assessing the late Quaternary palaeoenvironmental record from fluvial sediments in southwestern Africa, Earth-Science Reviews, 236, 104288, https://doi.org/10.1016/j.earscirev.2022.104288, 2023.
Wintle, A .G.: Luminescence dating of aeolian sands: an overview, Geological Society, London, Special Publications, 72, 49–58, https://doi.org/10.1144/GSL.SP.1993.072.01.06, 1993.
Wolfe, S. A., Demitroff, M., Neudorf, C. M., Woronko, B., Chmielowska-Michalak, D., and Lian, O. B.: Late Quaternary eolian dune-field mobilization and stabilization near the Laurentide Ice Sheet limit, New Jersey Pine Barrens, eastern USA, Aeolian Research, 62, 100877, https://doi.org/10.1016/j.aeolia.2023.100877, 2023.
Woor, S., Buckland, C., Parton, A., and Thomas, D.S.: Assessing the robustness of geochronological records from the Arabian Peninsula: A new synthesis of the last 20 ka, Global and Planetary Change, 209, 103748, https://doi.org/10.1016/j.gloplacha.2022.103748, 2022.
Woor, S., Thomas, D. S., Durcan, J. A., Burrough, S. L., and Parton, A.: The aggradation of alluvial fans in response to monsoon variability over the last 400 ka in the Hajar Mountains, south-east Arabia, Quaternary Science Reviews, 322, 108384, https://doi.org/10.1016/j.quascirev.2023.108384, 2023.
Woor, S., D'Arcy, M. K., Lian, O. B., Schaarschmidt, M., and Durcan, J. A.: Rapid dose rate estimation for trapped charge dating using pXRF measurements of potassium concentration – supplementary data, Zenodo [data set], https://doi.org/10.5281/zenodo.17808545 (last access: 16 December 2025), 2025.
Zhou, S., Wang, J., Bai, Y., Wang, W., and Wang, S.: The Application of Portable X-ray Fluorescence (pXRF) for Elemental Analysis of Sediment Samples in the Laboratory and Its Influencing Factors, Minerals, 13, 989, https://doi.org/10.3390/min13080989, 2023.
Zimmerman, D. W.: Thermoluminescent dating using fine grains from pottery, Archaeometry, 13, 29–52, https://doi.org/10.1111/j.1475-4754.1971.tb00028.x, 1971.