the Creative Commons Attribution 4.0 License.
the Creative Commons Attribution 4.0 License.
 | 27 Mar 2026
Analytical and modelling strategies for thermal histories from in situ (U-Th-Sm) ∕ He data of single apatites
Ann-Kathrin Maier
Christoph Glotzbach
Sarah Falkowski
(U-Th-Sm) He is a thermochronometric method used to reconstruct the rates and timing of geological processes. Recent developments in analytical approaches, specifically laser ablation (in situ) measurements, allow quantifying the distribution of parent isotopes (U, Th, and, in apatites, Sm) and decay products (4He) within individual mineral grains. This is particularly important to understand potential date over-dispersion, which can arise from the heterogeneous distribution of parent isotopes, and to develop thermal history modelling for single-grain (U-Th-Sm) He techniques.
We build on previous studies and combine in situ 4He concentration profile measurements with parent nuclide distribution mapping in natural apatites to explore analytical and modelling strategies for single-grain thermal history reconstructions. Specifically, we investigate the effects of laser ablation spot size, the number and location of ablation spots in a grain, and grain size on data resolution and suitability for thermal history modelling. In doing so, we introduce the calculation of Caw, which is the concentration of parent nuclides at each ablation site weighted by alpha-particle stopping distances to account for the redistribution of 4He in the crystal from high-energy alpha decay. We present stacked U, Th, and Sm maps measured at different ablation depths in two apatite grains from South Germany (one with homogeneous and one with zoned parent isotope distribution) and one apatite from the McClure Mountain Syenite age standard. Furthermore, we show in situ 4He profiles of the two South German apatites and inversions for thermal histories. Our results indicate that, for our study and instrument set-up (a RESOchron system (Applied Spectra) consisting of a He-line and an excimer laser), four to six spot measurements at various distances from the grain rim enable measuring an in situ 4He profile. We tested different laser ablation spot sizes (10–30 µm) in grains with a range of 4He concentrations and (U-Th-Sm) He dates (16 to ∼ 200 Ma) and determined that the optimal spot diameter for in situ 4He profile measurements for apatite grains with (U-Th-Sm) He dates as young as 16 Ma is 20–30 µm. Additionally, with an ablation spot diameter of 20 µm, a six-spot in situ 4He profile requires a minimum grain diameter (measured perpendicular to the c-axis) of 145 µm. Combined with information from detailed parent nuclide maps, the in situ 4He profiles offer a possibility to reconstruct the thermal histories of single grains, potentially including zoned and irregularly shaped crystals.
- Article
(12716 KB) - Full-text XML
-
Supplement
(579 KB) - BibTeX
- EndNote


Temperature-sensitive geologic processes, including mountain building, fault activity, landscape and sedimentary basin evolution, and ore deposit formation can be constrained with low-temperature thermochronology techniques such as (U-Th-Sm) He (e.g., Ehlers, 2005; McInnes et al., 2005). Due to its comparatively low nominal closure temperature of ∼ 70 °C (e.g., Wolf et al., 1996, 1998; Shuster et al., 2006), apatite (U-Th-Sm) He (AHe) is particularly well-suited for constraining the thermal history of such upper crustal processes. Fundamentally, AHe is based on the competing ingrowth and thermally activated diffusive loss of alpha-particles (4He) from the radioactive decay of the uranium and thorium decay chains and samarium in the crystal lattice. Diffusive loss occurs over a specific temperature range, the helium partial retention zone (e.g., Zeitler et al., 1987; Farley, 2002; Fitzgerald et al., 2006). Apart from apatite, other minerals incorporating significant amounts of uranium and thorium and harbouring characteristic temperature sensitivities, such as zircon, titanite, hematite and monazite, can also be used for (U-Th-Sm) He dating (e.g., Ault et al., 2019).
The amount of helium retained in a crystal is a function of the time-temperature evolution of a rock sample and the crystal-specific properties affecting the diffusivity, including (1) the grain size and geometry determining the diffusion domain and the alpha-particle ejection at the grain boundary, (2) the concentration of effective uranium (eU = U + 0.235 × Th) representative of the extent of self-irradiation-induced crystal lattice defects (i.e., radiation damage), (3) the presence of fluid and mineral inclusions and phases around the crystal contributing potential excess 4He, and (4) the distribution of parent nuclides (e.g., Farley et al., 1996, 2011; Reiners and Farley, 2001; Shuster et al., 2006; Vermeesch et al., 2007; Spiegel et al., 2009; Gautheron et al., 2012; Anderson et al., 2017). A meaningful geological interpretation of (U-Th-Sm) He dates thus requires understanding and accounting for these aspects.
Beyond that, reconstructing thermal histories from (U-Th-Sm) He data is challenging due to the inability to constrain cooling histories solely based on a single (U-Th-Sm) He date, as a date is non-unique regarding possible time-temperature paths (e.g., Shuster and Farley, 2004). Researchers thus developed different strategies, such as the use of crystals with varying kinetic properties (i.e., grains of varying sizes, radiation damage, or grain fragments), the combination of different thermochronometer systems, and the analysis of samples taken along a quasi-vertical elevation profile to overcome this limitation (e.g., Reiners and Farley, 2001; Fitzgerald et al., 2006; Flowers, 2009; Flowers and Kelley, 2011; Beucher et al., 2013; Brown et al., 2013). In addition to such approaches involving multiple mineral grains, the shape of a single grain's diffusion profile, acquired through proton irradiation and subsequent stepwise degassing, is exploited in the 4He 3He method with the rationale that a 4He profile reflects the duration of active diffusion a crystal experienced and, hence, its possible thermal history (Shuster and Farley, 2004). While, for example, a more rounded profile towards the grain rim would indicate slow cooling, a uniform 4He distribution would be produced by faster cooling (Shuster and Farley, 2004). A heterogeneous parent radionuclide distribution in a grain may complicate the interpretation of 4He concentration profiles (e.g., Farley et al., 2011).
For thermal modelling, it is essential to characterise the spatial distribution of 4He and its parent radionuclides, and to understand sources of possible (U-Th-Sm) He date dispersion, such as parent nuclide zonation (e.g., Farley et al., 2011; Vermeesch et al., 2012; Danišík et al., 2017; Idleman et al., 2018; Sousa et al., 2024). The in situ technique to determine both helium and trace element content via laser-ablation promises new insights compared to more established whole-grain protocols (e.g., Gautheron et al., 2021), where the spatial relationship between parent nuclides and decay products in single grains generally remains unquantified (Boyce et al., 2006; Vermeesch et al., 2012, 2023; Danišík et al., 2017; Glotzbach and Ehlers, 2024). Not least, in situ mapping of parent nuclides and 4He allows the determination of a single grain's possible thermal history. Danišík et al. (2017) demonstrated this by assessing the spatial relationship of uranium, thorium, and helium in zircons by µm-scale laser ablation inductively coupled plasma mass spectrometry (LA-ICP-MS) element mapping and conversion of their detailed 2D maps into 1D concentration profiles to then invert for a possible single-grain thermal history. Recently, Glotzbach and Ehlers (2024) suggested optimised strategies for the reconstruction of cooling histories from in situ measurements based on synthetic data modelling and the incorporation of in situ (U-Th-Sm) He adapted helium production-ejection-diffusion models. They suggested using either in situ measurements of multiple grains of varying size or eU, similar to the whole-grain method, or multiple in situ spot measurements along a core-to-rim profile in a single grain. However, they did not test their strategies on natural samples.
In this study, we expand on the work by Danišík et al. (2017) and Glotzbach and Ehlers (2024) and test whether it is possible to obtain reliable single-grain helium concentration profiles from in situ 4He measurements and combine them with parent nuclide maps for cooling history inversion. We explore analytical and thermal modelling strategies for best results using natural samples from South Germany with homogeneous and heterogeneous radionuclide distributions and a large and clear apatite from the McClure Mountain Syenite (Colorado, USA). Specifically, we examine the number of ablation spots needed to retrieve an interpretable 4He profile and evaluate limitations on grain size and ablation spot location and size.
This section presents our analytical workflow (Fig. 1), including the 4He profile and parent nuclide measurement protocols, data visualisation, and thermal history modelling strategy. As detailed descriptions of laser-ablation in situ (U-Th-Sm) He analyses are provided elsewhere (e.g., Boyce et al., 2006; Horne et al., 2016), we focus on the specifics of our procedure. Technical details of (U-Th-Sm) He analysis in our laboratory, error propagation and age calculation are available in the Supplement (Sect. S1).
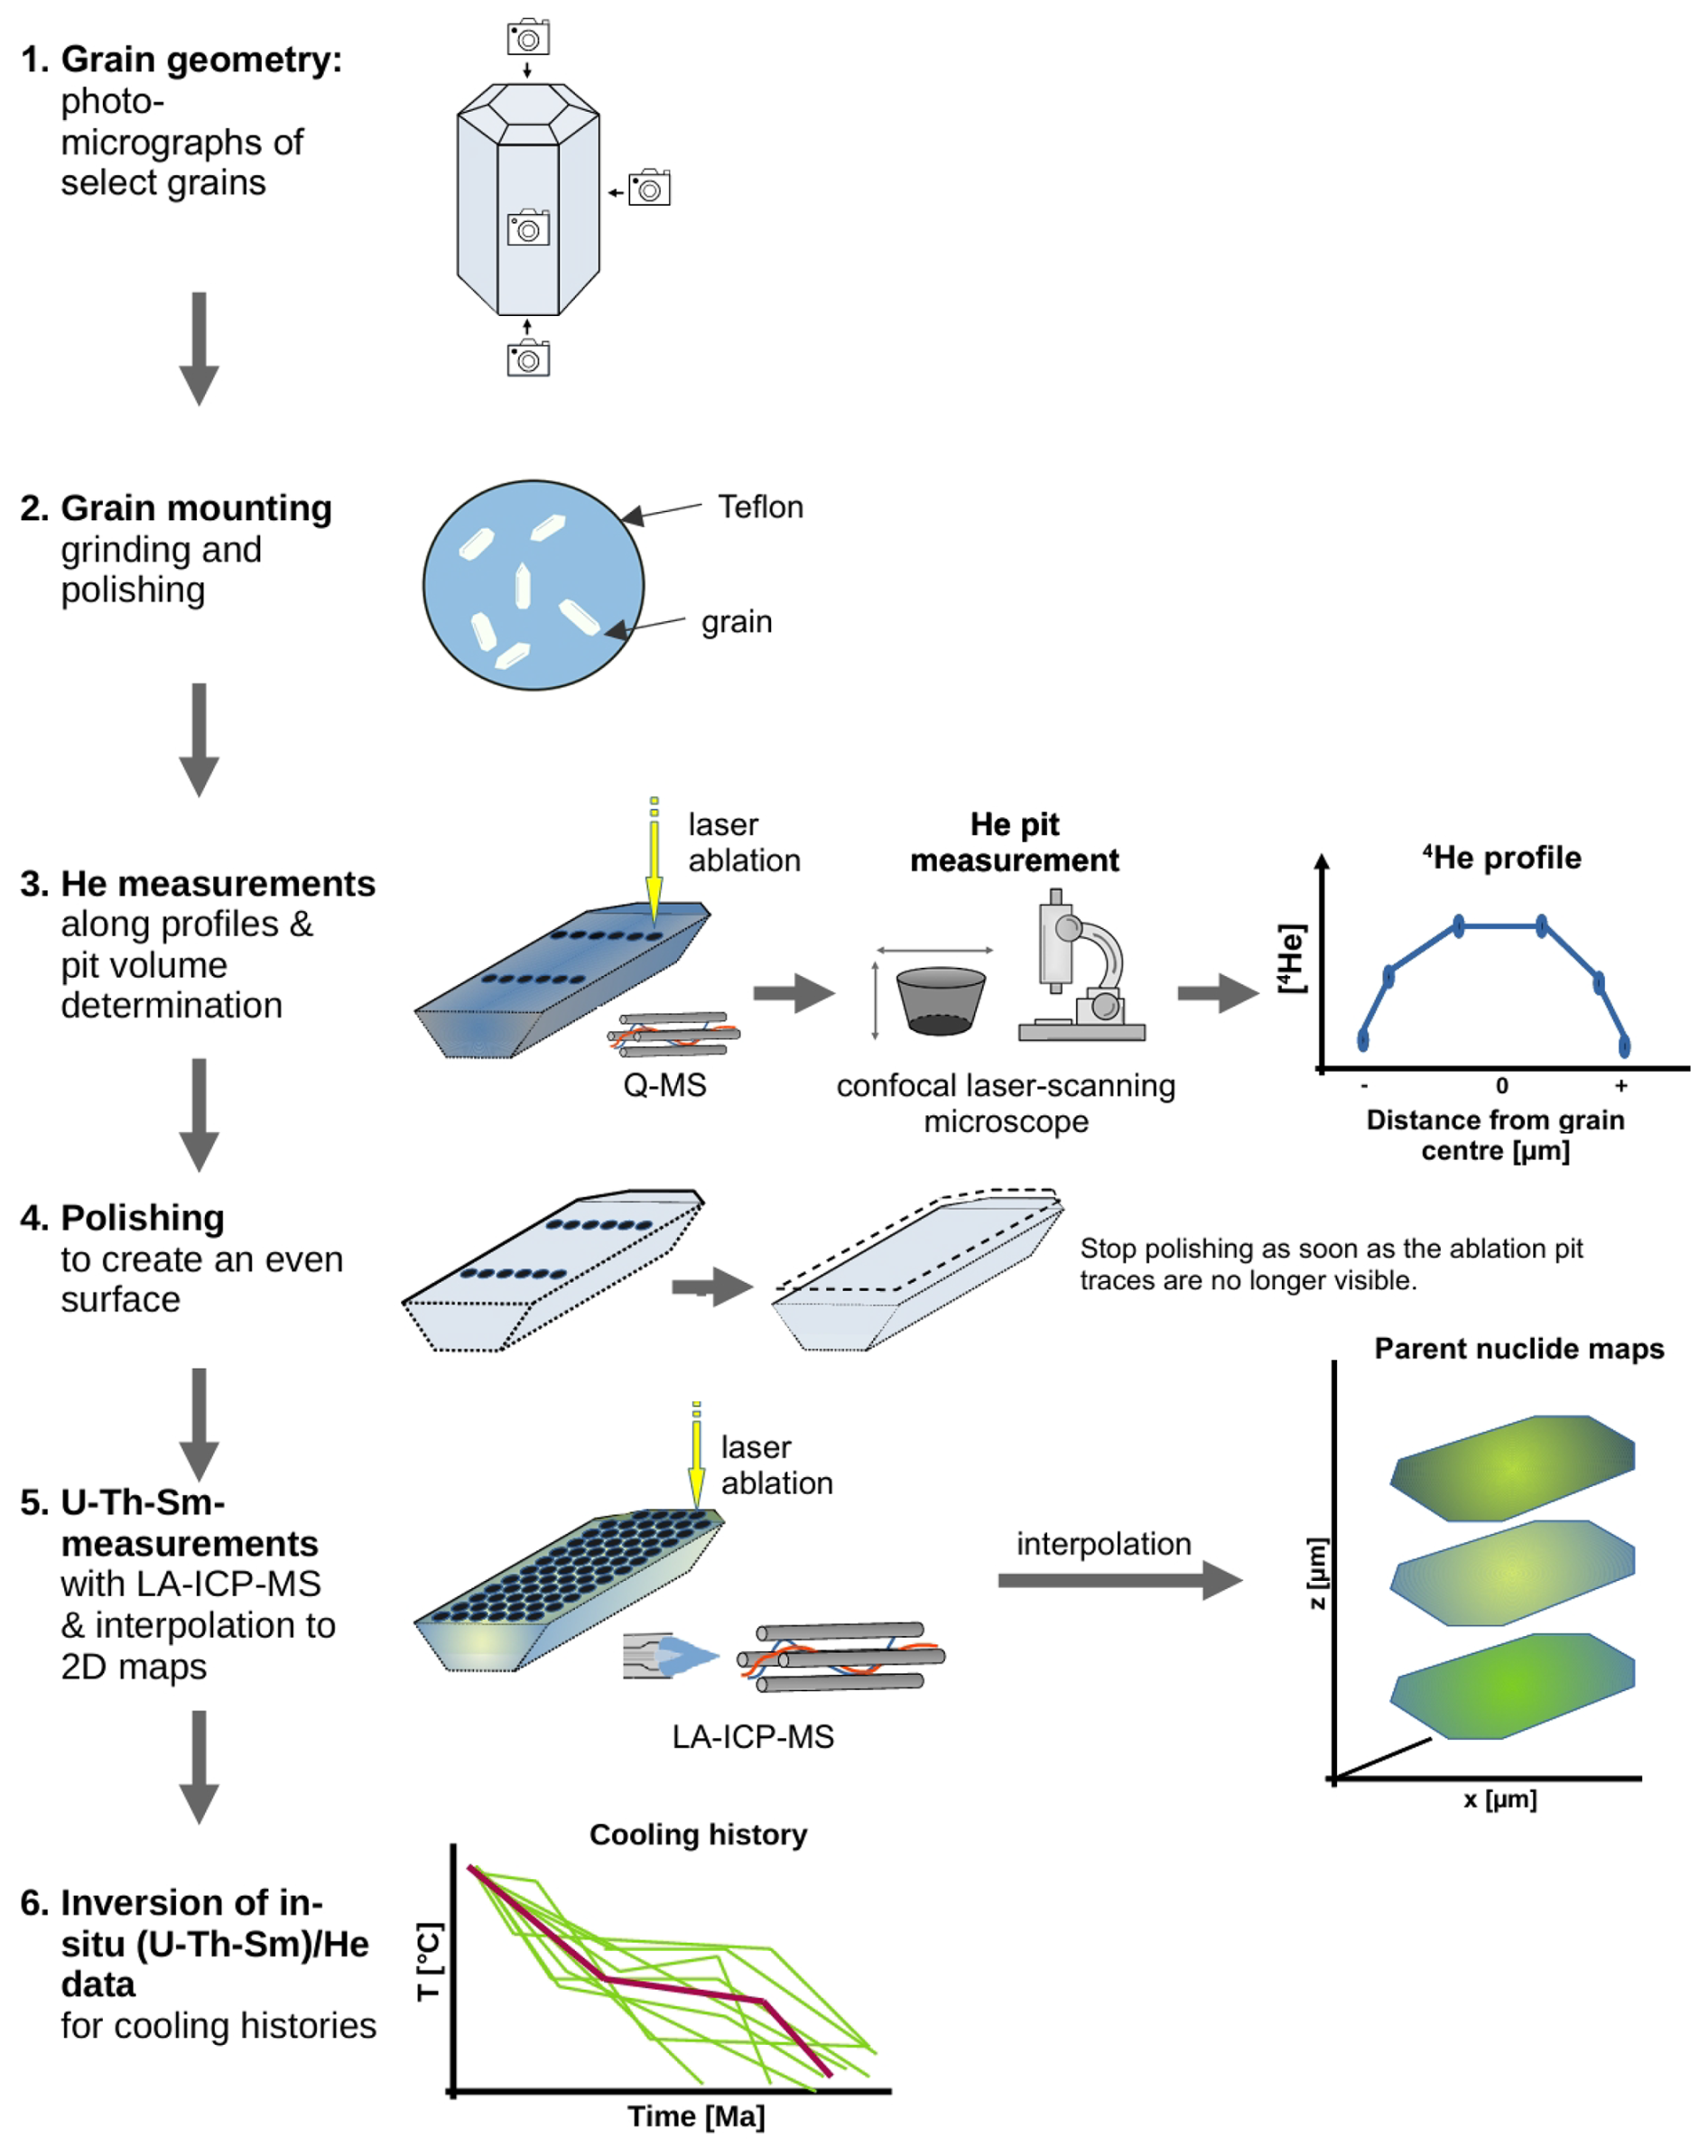
Figure 1Schematic depiction of the analytical protocol for in situ 4He profile measurements and parent nuclide mapping to reconstruct thermal histories of single grains. Q-MS: quadrupole mass spectrometer; LA-ICP-MS: laser ablation inductively coupled plasma mass spectrometry.
2.1 Sample selection
We analysed apatites extracted from different lithologies in South Germany and the McClure Mountain Syenite (U-Pb age standard 523.5 ± 1.5 Ma, Schoene and Bowring, 2006) (Table 1). The rationale for sample selection was to choose samples comprising large pristine crystals with a simple cooling history for method validation, along with a more complex sample for testing the method's limitations. The obvious choice for validation material, the Fish Canyon Tuff (FCT) and Durango standards, were not suitable for our approach as the crystals available at our laboratory were either too small (FCT) or too large (Durango) to be analysed within a reasonable investment of resources. In addition, FCT bears the risk of significant zonation (cf., Pickering et al., 2020). Hence, we substituted those standards with Apatite-URG, a sample sourced from a Miocene foiditic tuff with an independently determined U-Pb age (Table 1; Binder et al., 2023) and an abundance of reasonably large euhedral and clear crystals. Given its geological context, Apatite-URG has a simple expected cooling history, making it a good validation material. Equally, the McClure Mountain Syenite standard was chosen for its clear and euhedral crystals. The sample Apatite-BaF, on the other hand, was selected for its complexity to test the limitations of our approach.
Table 1Sample information.
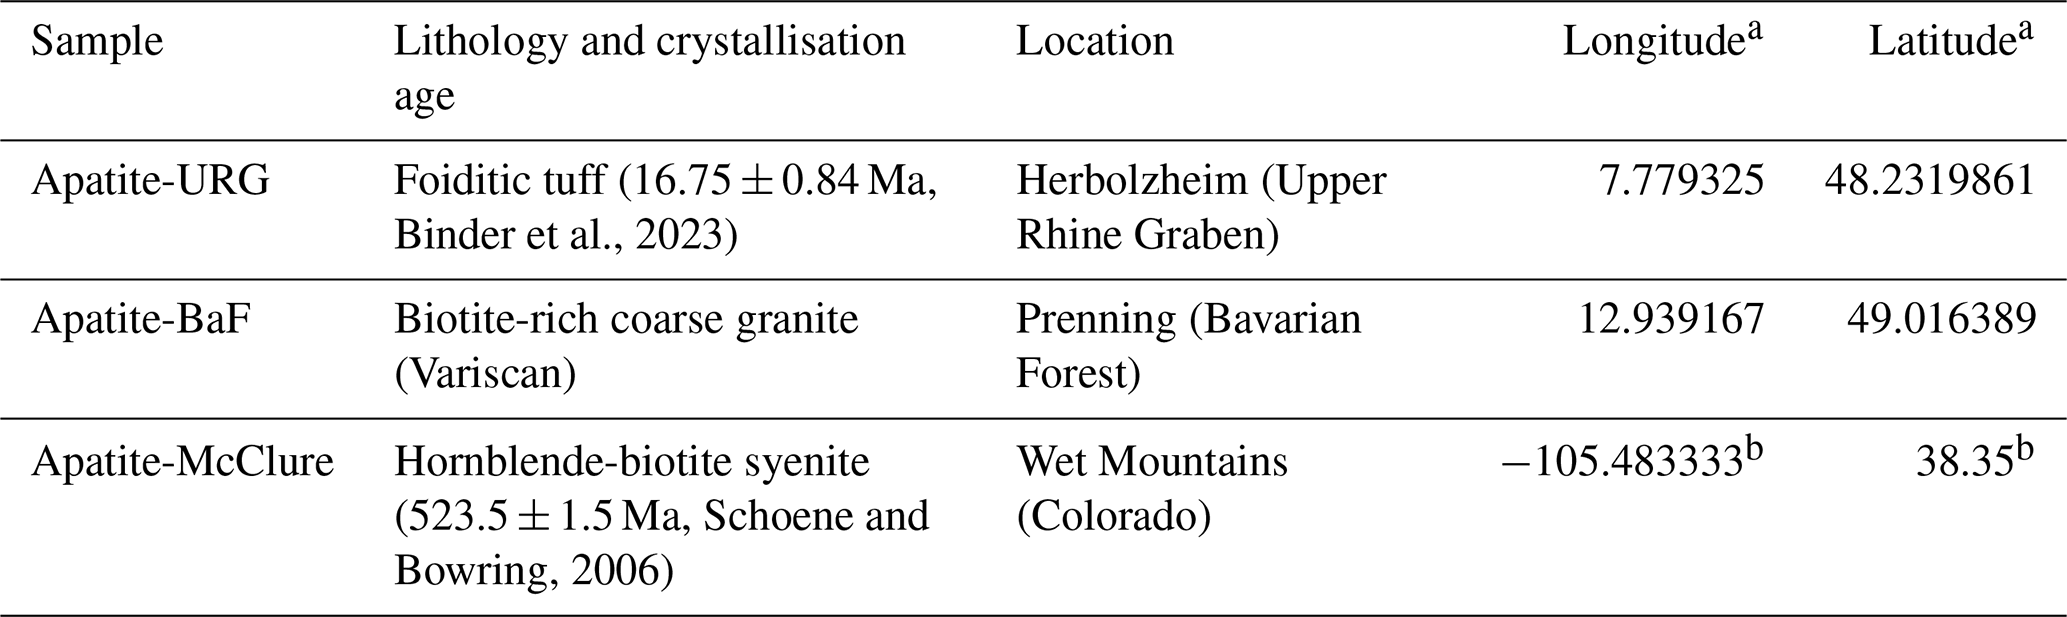
a The coordinates (in decimal degree) are referenced to WGS84. b These are approximate coordinates based on the original sample locality reported in Alexander et al. (1978).
2.2 Sample preparation
Datable crystals were selected based on the criteria for whole-grain analyses, i.e., no visible inclusions, fractures, defects, and rounded or broken edges and tips, and a diameter larger than 60 µm (e.g., Farley, 2002), and photographed parallel and perpendicular to the c-axis following the 3D-He protocol of Glotzbach et al. (2019) to record the grain geometry information needed for thermal history modelling. Afterwards, the grains were embedded in a Teflon sheet with their c-axis parallel to the mount surface. The Teflon mounting process exposed the grains to 300 °C for 2 min on a hotplate. For this heating temperature and duration, helium loss from the grains is negligible (see Supplement Sect. S1.1). After embedding, the mount was ground down and polished to expose internal grain surfaces. The amount of material removed was tracked with reference glass beads of known diameter, as described by Pickering et al. (2020). Imaging the uncoated mount with a tabletop scanning electron microscope (SEM) at a voltage of 15 kV, an emission current of 40.3 µA, filament power of 4.46 W, and a dwell time of 200 ns before laser ablation analysis did not reveal internal zonation in any of the chosen crystals (SEM images are shown in Sect. 3.2). Note that an SEM analysis with these settings is not expected to cause helium loss from the embedded and exposed grains (cf., Shan et al., 2013).
2.3 In situ helium profile measurements
We acquired 4He concentration profiles from multiple in situ 4He spot measurements along several c-axis perpendicular and one c-axis parallel traverses through single crystals (Fig. 1) to evaluate the influence of the measurement location, the consistency of the results, and potential effects of parent nuclide heterogeneities. This resulted in 28–38 individual ablation sites per crystal (Table 2). While the c-axis perpendicular profiles were acquired for thermal modelling, the c-axis parallel profiles were measured to verify the 4He concentration's consistency in the grain along this direction.
Table 24He- and trace element measurement details.
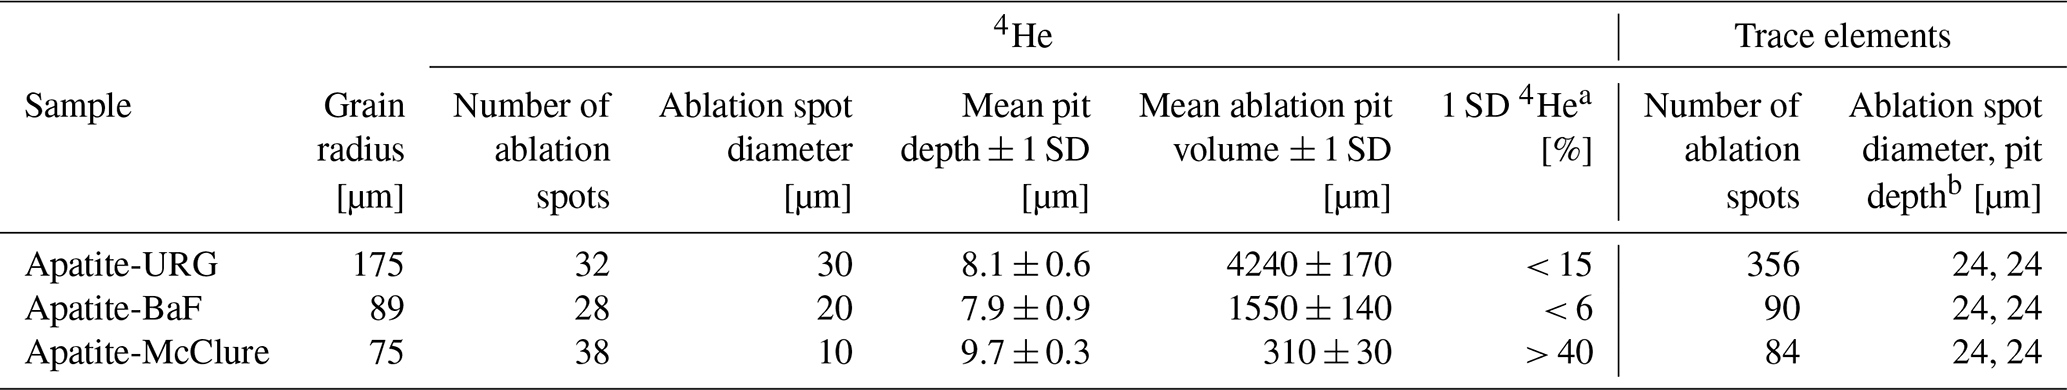
a This is the 4He measurement uncertainty after blank correction. b Pit depths for trace element measurements are calculated values derived from the established ablation-time-depth relationship (Sect. 2.6). SD stands for standard deviation.
The in situ 4He measurements were conducted with a RESOchron system (Applied Spectra) consisting of a He-line and an excimer laser at the University of Tübingen, Germany. All analysed grains were ablated for 8 s with a laser pulse frequency of 10 Hz and a laser fluence of 2 J cm−2. The laser ablation spots, sized 10–30 µm in diameter, were spaced 3–5 µm apart to avoid signal smearing and mixing (Fox et al., 2017). The laser spot sizes were chosen individually for each grain and set as small as possible to ensure acceptable helium signals of three standard deviations above the blank level (Table 2). Line blanks were recorded regularly in the ablation sequence and were in the order of 2E7 atoms (∼ 0.0007 ncc). Blank correction, Q-shot interpolation to account for instrumental drift, and 4He content calculation (Supplement Sect. S1.2) were performed using in-house software.
For successful 4He measurements, standard deviations after blank correction ranged from 6 %–15 % (Table 2). After 4He measurements, the surface topography of the analysed grains was imaged using a confocal laser-scanning microscope (Zeiss LSM 900) to determine the ablation pit dimensions. Based thereon, the ablation pit volumes were obtained in the Zeiss Confomap software and used to calculate pit-volume normalised 4He concentrations. For Apatite-BaF and Apatite-McClure, we used the mean pit volume to calculate the 4He concentrations due to a large spread in measured pit volumes (see Sect. 4.3 for limitations of pit volume measurements). Detailed pit volumes for individual ablation spots are listed in Table 3. Mean pit volumes in the analysed apatites ranged from 310 µm3 ± 10 % to 4240 µm3 ± 4 % (1 SD; Table 2).
Table 34He and alpha-stopping distance weighted parent nuclide concentrations (Caw).
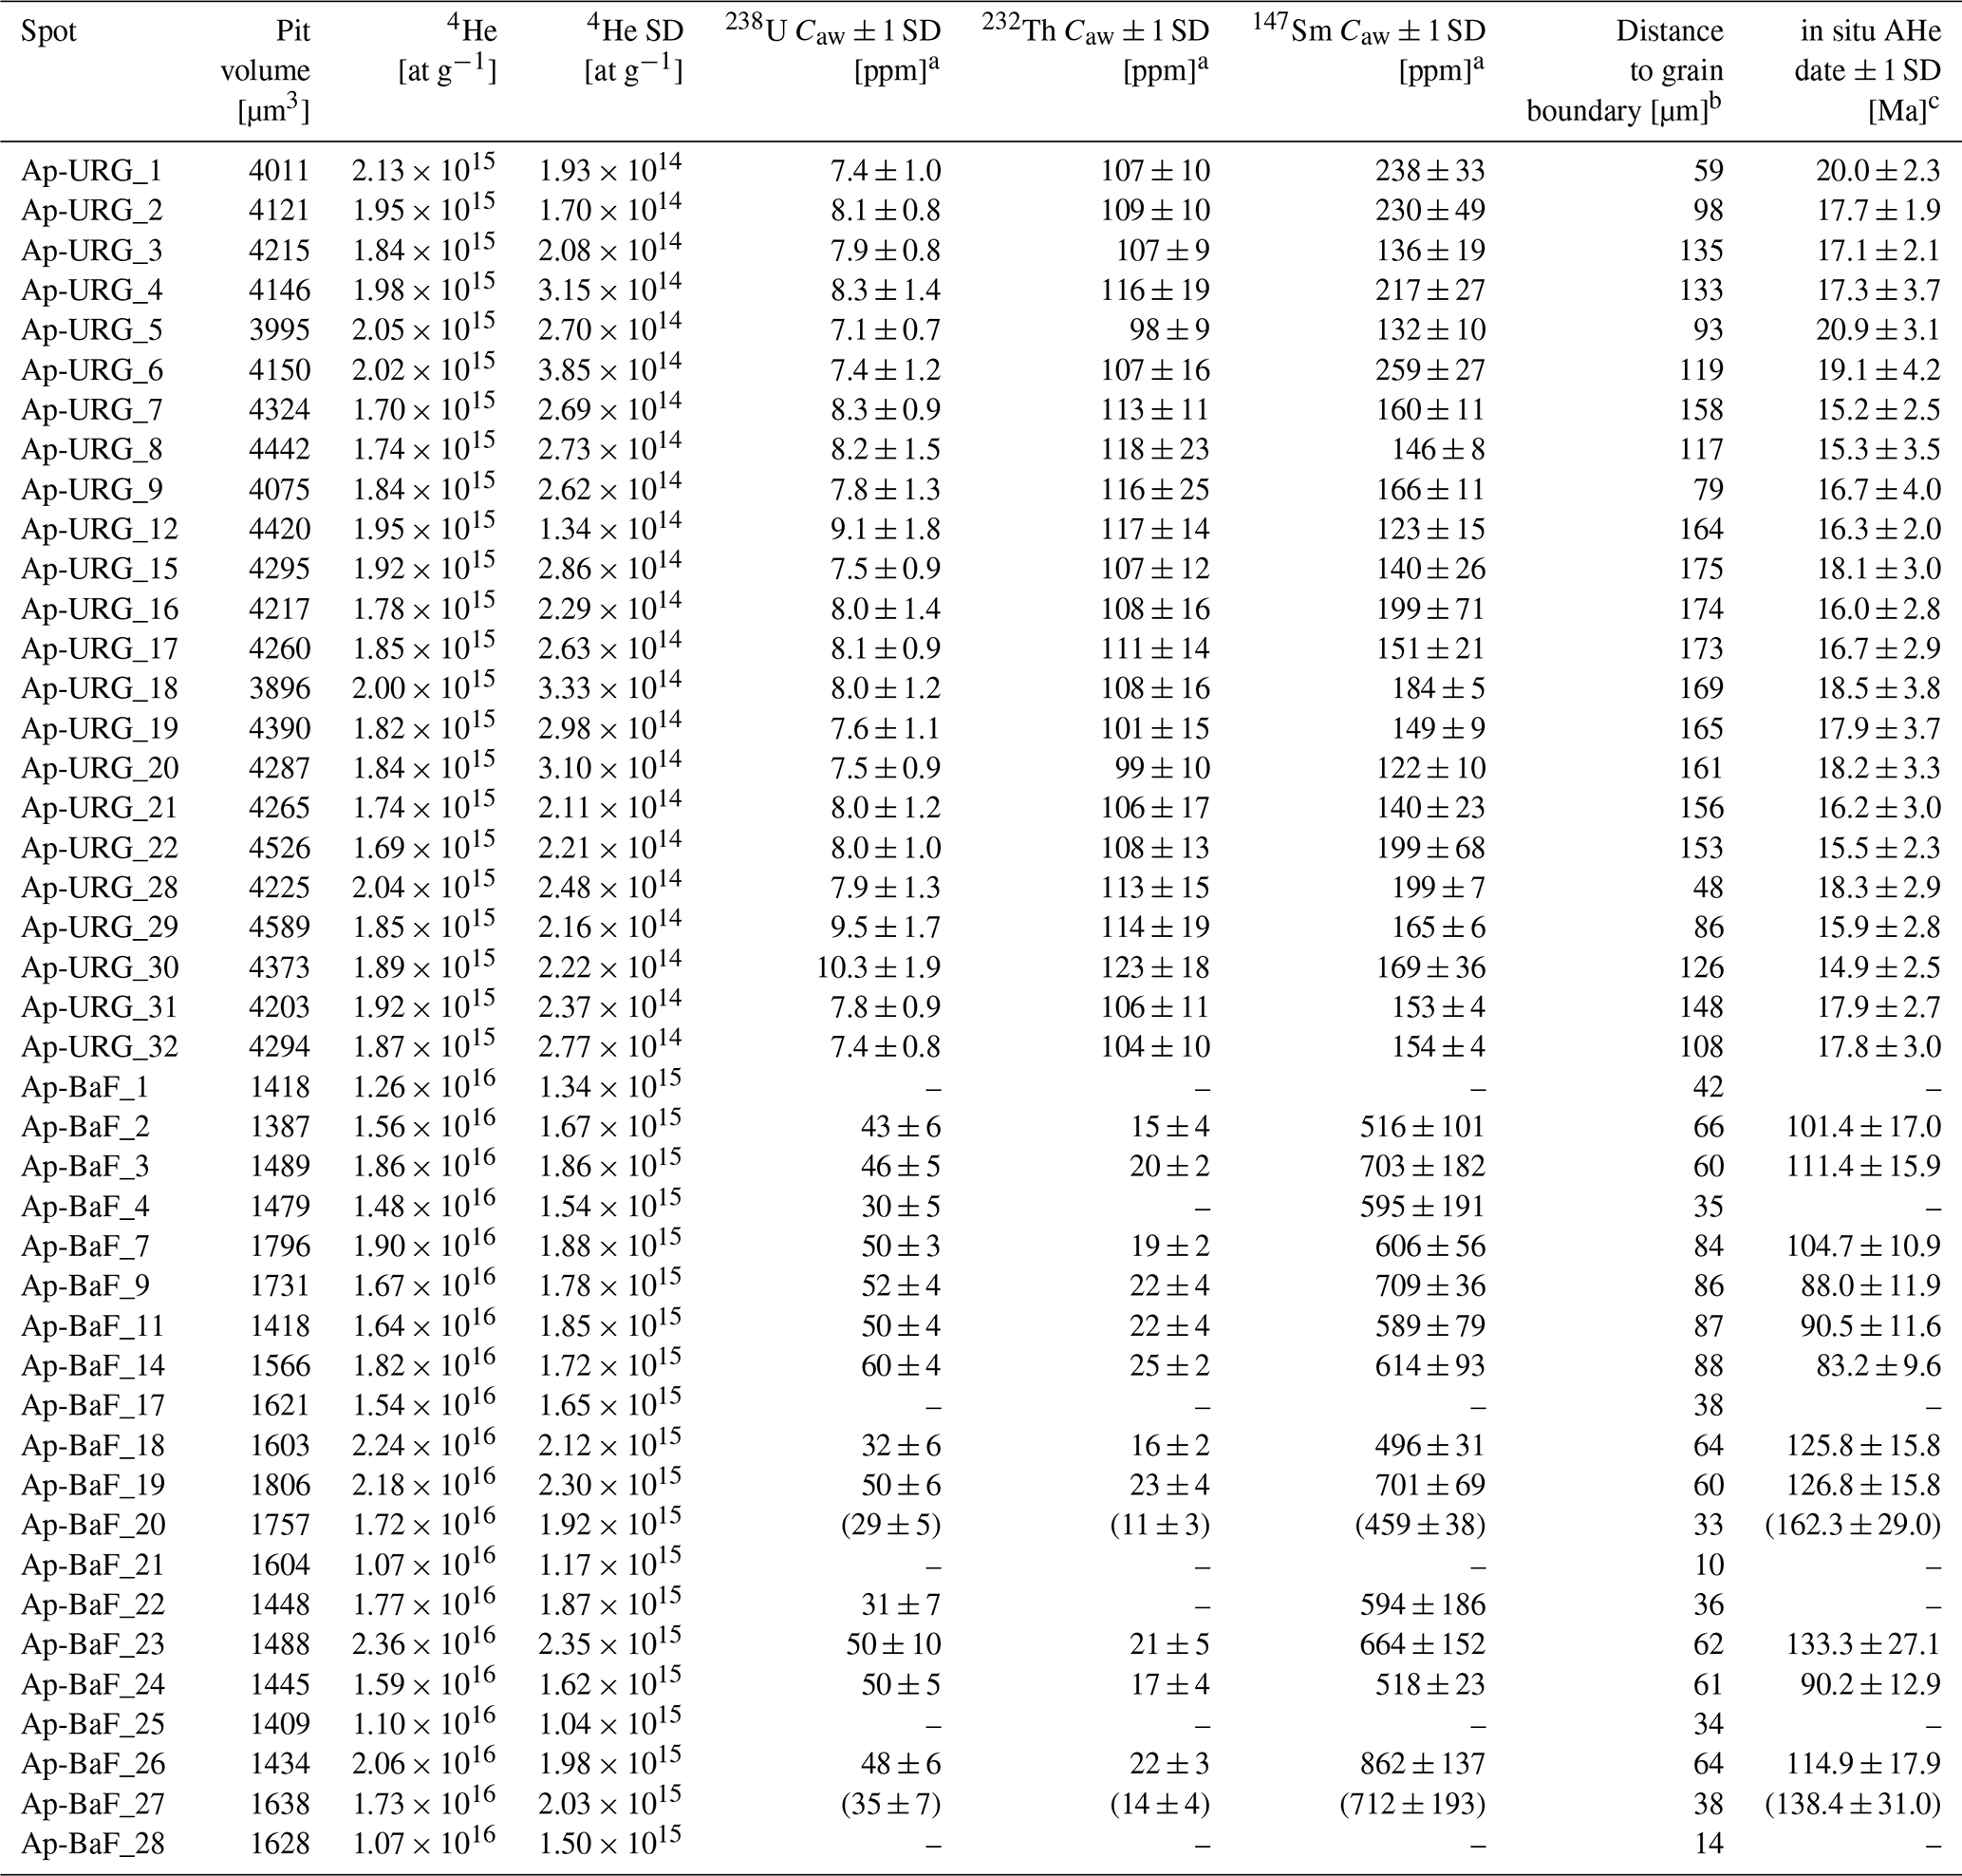
a For Ap-BaF, the alpha-stopping distance weighted parent nuclide concentrations (Caw; see Sect. 2.5) listed were calculated based on the interpolated 5×5 µm parent nuclide maps (see Sect. 2.4). If the distance of the 4He ablation spot to the grain boundary on the interpolated map is less than the maximum alpha-stopping distance for the specific element, Caw is not calculated (e.g., Ap-BaF_4; see Sect. 2.5). Note that locating the 4He spots on the parent nuclide map is subject to uncertainty, especially for non-straight grain boundaries. The undulating grain boundaries of Apatite-BaF are not accurately replicated on the interpolated map, leading to a discrepancy between the true grain boundary and the grain boundary as drawn in the interpolation. Thus, the Caw calculation for spots close to the grain rim needs to be treated with caution. Where the interpolation adds area to the grain, Caw values are reported in round brackets. Where the interpolated grain extent is smaller than the true grain, no Caw is calculated, even though the 4He spot's distance from the true grain boundary would permit it (e.g., Ap-BaF_1). We did not include affected spots for either case in the thermal modelling. b c-axis orthogonal distance from the 4He-measurement spot centre to the nearest grain rim. c AHe is apatite (U-Th-Sm) He. SD is standard deviation.
2.4 Parent nuclide mapping
Following ablation for 4He measurements, we performed detailed parent nuclide mapping to garner the necessary information for thermal modelling and to assess the possible effect of U, Th, and Sm heterogeneities on the measured 4He distribution following the example of Danišík et al. (2017).
Prior to parent nuclide measurements, the grains were re-polished for 3.5 h on a polishing machine at intervals of 4 to 20 min, with a decreasing force from 20 to 10 N, to remove the helium ablation pits and create an even surface for U, Th, and Sm distribution mapping. Starting with an even surface makes spatially correlating measurements at different recorded horizontal locations in the grain easier, as the depth component can be assumed to be consistent. To avoid polishing more than necessary, the state of removal was checked multiple times during the process, and polishing was stopped when visible pit traces had been completely removed. Based on the measured 4He ablation pit depths, repolishing removed a maximum of 10 µm.
The LA-ICP-MS measurements were conducted on an evenly spaced grid of non-overlapping spots (Fox et al., 2017) across the smoothly re-polished grain surfaces, following ablation for 4He measurements, with a spot diameter of 24 µm and a spot depth of approximately 24 µm. The ablation time was 12 s with a laser fluence of 3 J cm−2 and a pulse frequency of 20 Hz. We used NIST612 and the Durango apatite age standard (AHe age 31.02 ± 1.01 Ma, McDowell et al., 2005) as reference material for apatite in the standard bracketing approach to estimate trace element concentrations (Paton et al., 2010). Removal of outliers (per default all measured counts per second (CPS) more than three standard deviations away from a running mean), background correction, and trace element concentration calculation were performed with an in-house MATLAB app (ESD-U-Pb).
To construct stacked 2D maps of parent nuclide distributions from deep ablation spots on just one internal surface, we used the “downhole” time-resolved measurements and the approximate ablation time-depth relationship. The latter was determined by measuring pit depths corresponding to 2–18 s ablation times in spare apatite grains of the same samples. The resulting time-depth relationship was approximately linear, with an ablation rate of ∼ 2 µm s−1.
Finally, we computed sub-ablation-spot resolution U, Th, and Sm distribution maps from neighbouring spot measurements using the regularised linear least squares MATLAB code by Fox et al. (2017). Such a regularised inversion requires balancing model smoothness and complexity by choosing an adequate regularisation parameter or smoothness constraint λ. The smoothness constraint controls the influence the penalty term for model complexity has on the inversion result. A too-large smoothness constraint leads to retrieving parent nuclide maps that are too smooth and do not capture the underlying true concentration variations. Conversely, if the regularisation parameter is too small, the inversion solution will be dominated by data errors, and every small concentration change (noise) will be matched. Following Fox et al. (2017), we chose the smoothness constraint based on qualitative information from SEM and the L-curve criterion (e.g., Hansen and O'Leary, 1993). The L-curve is a log-log plot of the residual against the norm of the regularised solution parameterised by the smoothness constraint, which is often L-shaped. The idea is to choose the smoothness constraint that corresponds to the corner of the “L”. In this way, we computed 2D parent nuclide distribution maps with a resolution of 10×10 µm (Apatite-URG) and 5×5 µm (Apatite-BaF, Apatite-McClure) for each recorded laser penetration depth. We stacked those map slices to display a pseudo-3D section through the analysed part of the grain (Sect. 3.3).
2.5 Alpha-stopping distance weighted parent nuclide concentration Caw
As the in situ 4He (spots along profiles) and parent nuclide measurements (spots for 2D maps) do not correspond to the same location in the grain in our procedure (Fig. 1), we had to match the separate U, Th, Sm, and 4He measurements for thermal modelling. For this purpose, we determined an alpha-stopping distance weighted parent nuclide concentration (Caw, Concentration alpha-weighted) at each helium ablation site. Although other options to make information from 2D parent nuclide maps usable for thermal modelling already exist, for example, calculating 1D equivalent-sphere geometry concentration profiles (e.g., Farley et al., 2011; Danišík et al., 2017), we introduce this alpha-stopping distance weighted parent nuclide concentration because it allows us to account for the emission and redistribution of 4He (alpha particles) from the decay site during high-energy decay. Since 4He measured in a spot is the result of the parent nuclides that surround it within the alpha-stopping distance reach (e.g., Farley et al., 2010), we determined Caw from the distribution of parent nuclides in each 4He spot's periphery. First, we calculated the mean U, Th, and Sm concentrations around the centre point of each 4He measurement spot for spheres with radii corresponding to all possible alpha-stopping distances (between ∼ 6 and 40 µm, Ketcham et al., 2011). Then, we summed the mean parent nuclide concentration for each stopping distance weighted by its contribution to 4He production.
In Eq. (1), c is the parent nuclide concentration within a certain stopping distance, n is the number of concentration measurements, m is the number of stopping distances, and f is the weight for the contribution to the production of 4He.
The Caw calculation is based on the available 3D information on the parent nuclide distribution and is, hence, constrained by the resolution and accuracy of the measured parent nuclide maps. It thus depends on the number of mapped grain slices, the accuracy of the ablation time-depth relationship (Sect. 2.4), and the fact that information of the top half of the grain is inevitably lost from grinding it down. Due to the latter, we made the following simplifying assumptions. (1) Grains are mirror-symmetrical about the polished internal grain surface, (2) helium and trace elements were measured in the same plane, and (3) where there is a lack of 3D data, we assume the same concentration as for the closest measurement (interpolation) point. Finally, we chose not to calculate Caw for 4He ablation spots with centres < 40 µm to the grain rim (maximum alpha-stopping distance; Ketcham et al., 2011) because at the grain rim, 4He is not only redistributed, but can also be ejected and lost or implanted (e.g., Farley et al., 1996). This restricts the ablation spots usable for thermal history inversion to those > 40 µm from the grain rim. However, it does not imply that spots < 40 µm from the grain rim should not be measured. On the contrary, they provide crucial information about the 4He profile's shape, and they are a vital part in assessing the quality of the inversion results through misfit calculation between the modelled and measured 4He profiles.
2.6 Thermal history modelling
The shape of a 4He concentration profile in a grain is largely a function of the duration of active diffusion and, thus, thermal history (Shuster and Farley, 2004). We can, therefore, reconstruct thermal histories by inverting the in situ 4He profile measurements and the corresponding alpha-stopping distance weighted parent nuclide concentrations (Caw). We applied the modelling technique outlined by Glotzbach and Ehlers (2024), which allows predicting the 4He concentrations at specific locations in a c-axis symmetric grain, assuming a cylindrical grain geometry and considering the full range of alpha-stopping distances. Glotzbach and Ehlers's (2024) MATLAB code is an adjustment of the radiation damage accumulation and annealing models (RDAAM, Flowers et al., 2009, and ZrDAAM, Guenthner et al., 2013) implemented in HeFTy (Ketcham, 2005; Ketcham et al., 2018; Ketcham, 2024). The RDAAM (apatite) and ZrDAAM (zircon) models treat 4He diffusion in a grain as a function of accumulated self-irradiation damage and related diffusivity variations over the grains' thermal evolution (Flowers et al., 2009; Guenthner et al., 2013). Using the approach of Glotzbach and Ehlers (2024), helium production and diffusion was calculated for 5000 (Apatite-URG) and 10 000 (Apatite-BaF) random time-temperature paths based on the horizontal and vertical distance of a 4He ablation spot centre to the grain rims, the 4He pit depth, the grain radius, and the U, Th, Sm, and 4He concentrations. Each path's goodness of fit (GOF) was evaluated as in HeFTy, where a GOF of 0.05 corresponds to acceptable time-temperature paths passing the 95 % confidence test and a GOF of 0.5 (statistical precision limit) to good paths (Ketcham, 2005; Ketcham, 2024).
The paths with the highest GOF were selected to forward-model the corresponding 4He profiles. Our forward models merge two core-rim profiles to avoid information loss for heterogeneous grains with asymmetric 4He profiles. The profile merging expresses itself in a small 4He concentration jump at the centre of the grain that arises from the exclusion of the centre-most point from one of the two merged core-rim profiles, to prevent it from being defined twice.
The misfit m between modelled and measured 4He profiles was calculated as
with ri being the residual between measured and modelled concentration at the ith 4He spot and σi being the measurement uncertainty, to narrow down the possible time-temperature paths and to assess the quality of the inversion results. This way, a limited number of plausible cooling histories is computed for a grain, which can be interpreted in the geological context.
3.1 In situ 4He concentrations and uncertainties
The grains examined in this study span a broad range of 4He concentrations and associated uncertainties, highlighting differences in parent nuclide concentration and cooling history. In situ 4He concentrations range from 1.7 × 10¹⁵ ± 2.2 × 10¹⁴ at g−1 to 2.1 × 10¹⁵ ± 3.0 × 10¹⁴ at g−1 for Apatite-URG and 1.1 × 10¹⁶ ± 1.2 × 10¹⁵ at g−1 to 2.4 × 10¹⁶ ± 2.4 × 10¹⁵ at g−1 for Apatite-BaF. Corresponding uncertainties after blank correction and pit volume determination are < 15 % and < 10 %, respectively (Table 2). The Apatite-McClure sample with 4He concentrations of 2.8 × 10¹⁵ ± 5.0 × 10¹⁵ at g−1 to 8.5 × 10¹⁵ ± 2.5 × 10¹⁵ at g−1 has a comparatively high uncertainty of > 40 % after blank correction stemming from a too low ablated volume and 4He signal.
3.2 In situ measured helium profiles
In the following, we describe the c-axis-perpendicular profiles used for thermal modelling. Data pertaining to the c-axis parallel profiles is not included here, as it does not provide any additional insights beyond what can be gained from comparing the c-axis-perpendicular profiles. The c-axis parallel data is available in the corresponding Zenodo repository (https://doi.org/10.5281/zenodo.15856623, Maier et al., 2025).
The 4He concentration profiles measured perpendicular to the crystallographic c-axis in Apatite-URG and Apatite-BaF depict two distinct 4He patterns (Fig. 2). The three 4He profiles acquired in Apatite-URG are indistinguishable within measurement uncertainty and display an overall flat shape. Two of the three profiles (Ap-URG-P1 and Ap-URG-P2) may show a subtle trend of higher 4He concentrations towards the grain rim (Fig. 2a). In contrast, the four Apatite-BaF 4He profiles are concave-down with a significantly higher 4He concentration near the grain centre and lower concentrations at the rims (Fig. 2b), a typical shape expected for slowly cooled grains (Shuster and Farley, 2004). The profiles are inconspicuous and agree within measurement uncertainty, except for Ap-BaF-P3, which displays significantly higher 4He concentrations in one half of the grain compared to the other profiles. Notably, peak 4He concentrations for Ap-BaF-P2, Ap-BaF-P3 and Ap-BaF-P4 were measured ca. 30 µm off-centre. We did not analyse the profiles of Apatite-McClure due to high uncertainties in the 4He measurements (Sect. 3.1), limiting their meaningfulness. The 4He measurement details for Apatite-McClure are listed in Table B1.
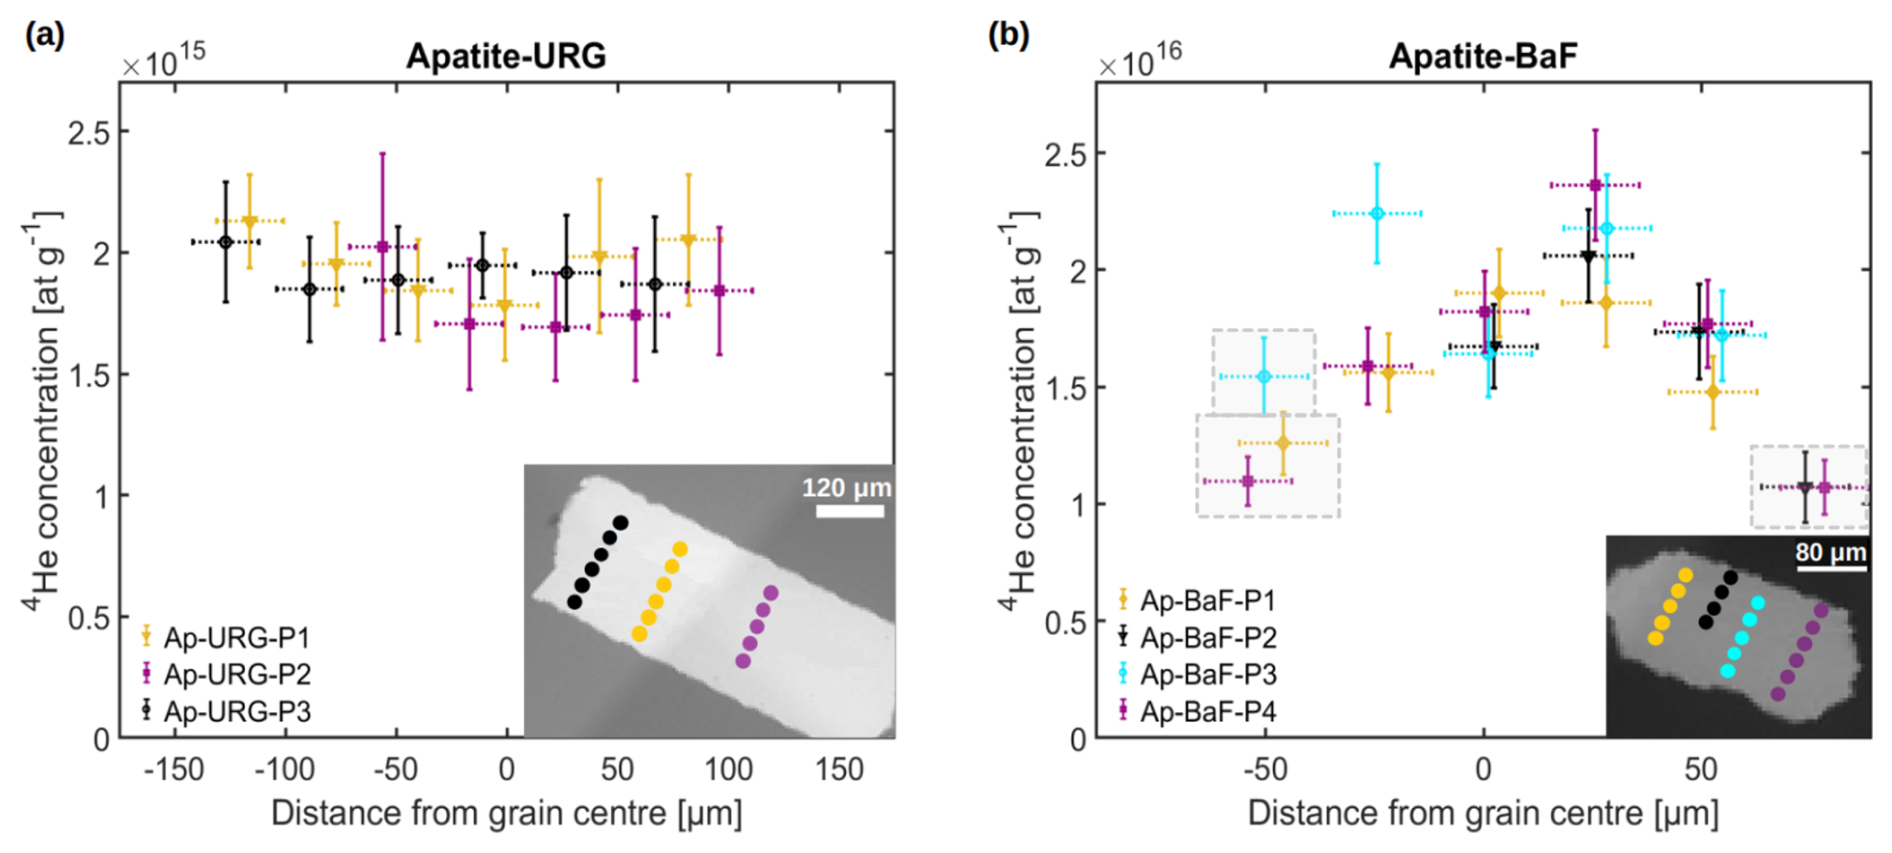
Figure 2Measured in situ 4He concentrations along c-axis-perpendicular rim-to-rim profiles in Apatite-URG (a) and Apatite-BaF (b). The coloured spots in the SEM images indicate the location of the corresponding 4He measurements in each grain. The laser spot diameter was 30 µm for measurements in Apatite-URG and 20 µm for measurements in Apatite-BaF, indicated by the dashed horizontal error bars. Spots that are within 40 µm from the grain boundary are marked with grey boxes. These spots were excluded from inverse thermal history modelling (see Sect. 2.5).
3.3 Spatial variations in parent nuclide concentrations
Trace element mapping offers insight into the relationship between measured 4He profiles and parent nuclide distribution. Figure 3 shows the uppermost U, Th, and Sm maps of Apatite-URG and Apatite-BaF, overlaid with alpha-stopping distance weighted parent nuclide concentrations Caw for the 4He ablation spots. Appendix Fig. A3 presents the same for Apatite-McClure. In addition, Fig. 4 displays all interpolated map slices of Apatite-BaF. Appendix Figs. A1 and A2 show all map slices for Apatite-URG and Apatite-McClure.
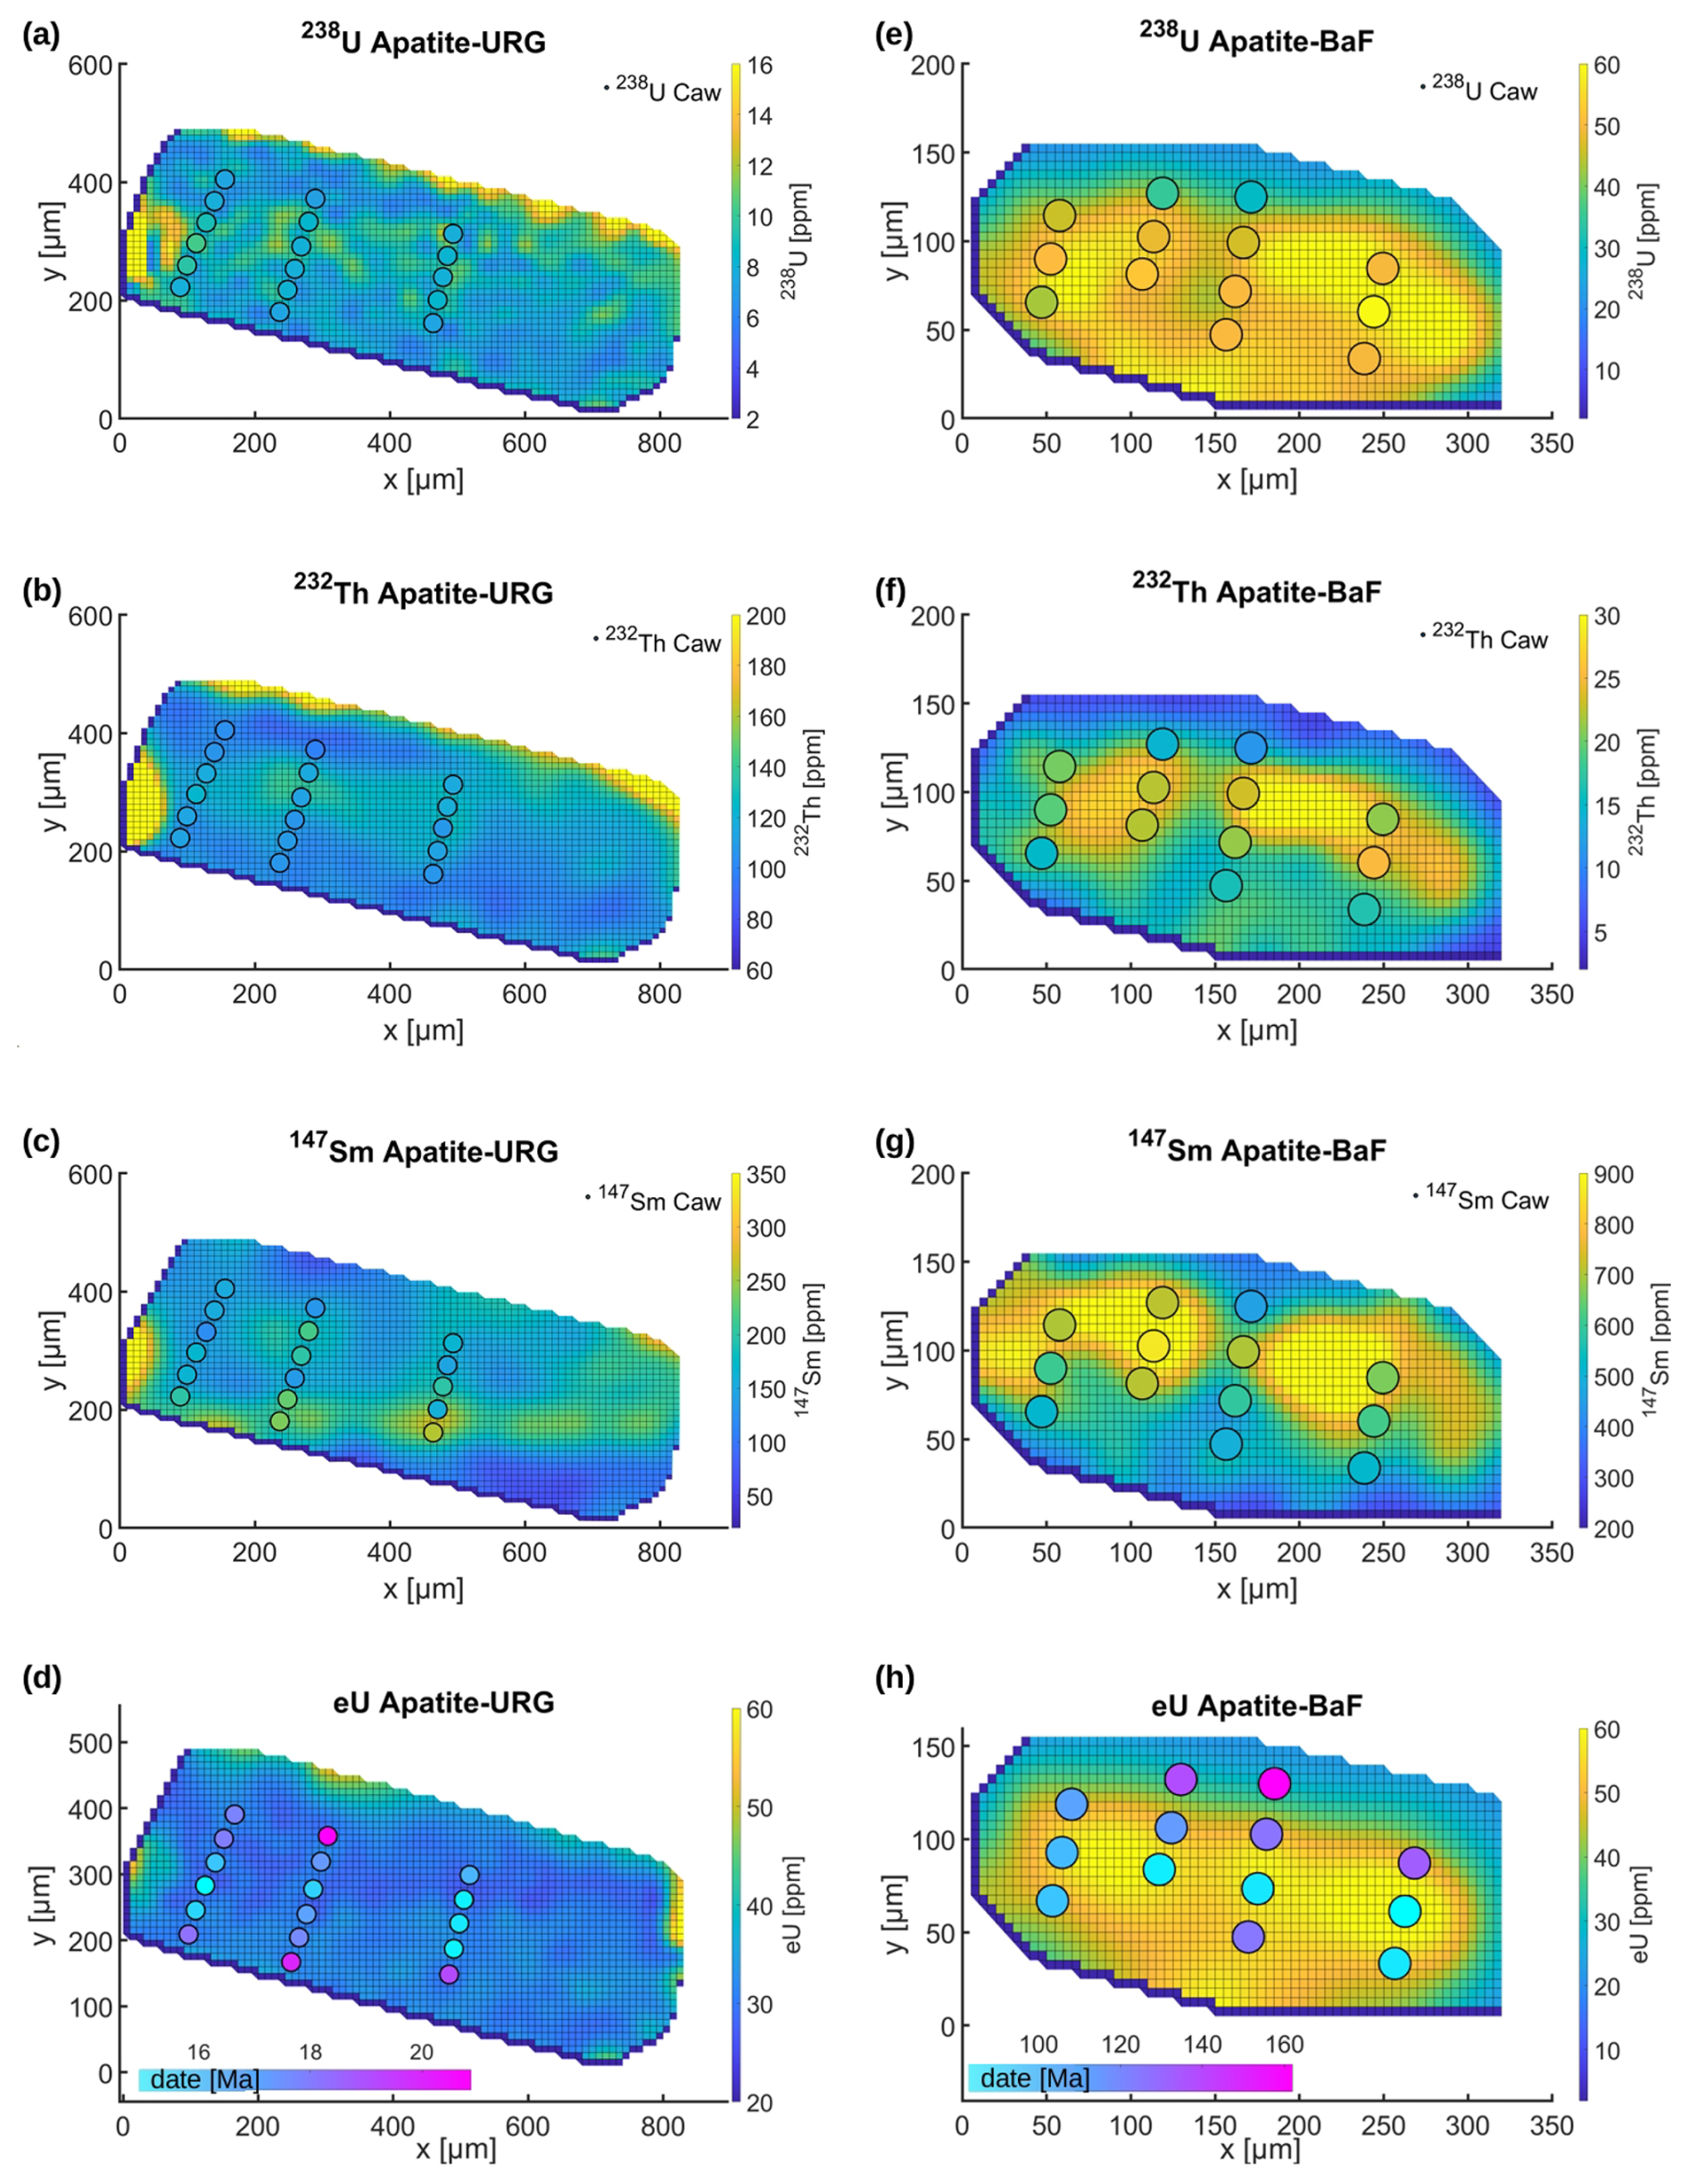
Figure 3Interpolated parent nuclide (uppermost map slice) and eU maps (averaged over all slices) of the Apatite-URG (a–d) and Apatite-BaF (e–h) grains. The smoothness constraints (see Sect. 2.4) for Apatite-URG were λ=0.1 (U, Th) and 0.01 (Sm), and for Apatite-BaF λ=0.175 (U, Th) and λ=0.01 (Sm). Circles represent ablation spots for 4He. Their size reflects the laser spot size, and colours reflect the calculated alpha-stopping-distance weighted parent nuclide concentration (Caw) (upper three rows) and the calculated in situ date based on Caw and 4He concentration (d, h). Spots for which Caw was not calculated (see Sect. 2.5) are not displayed.
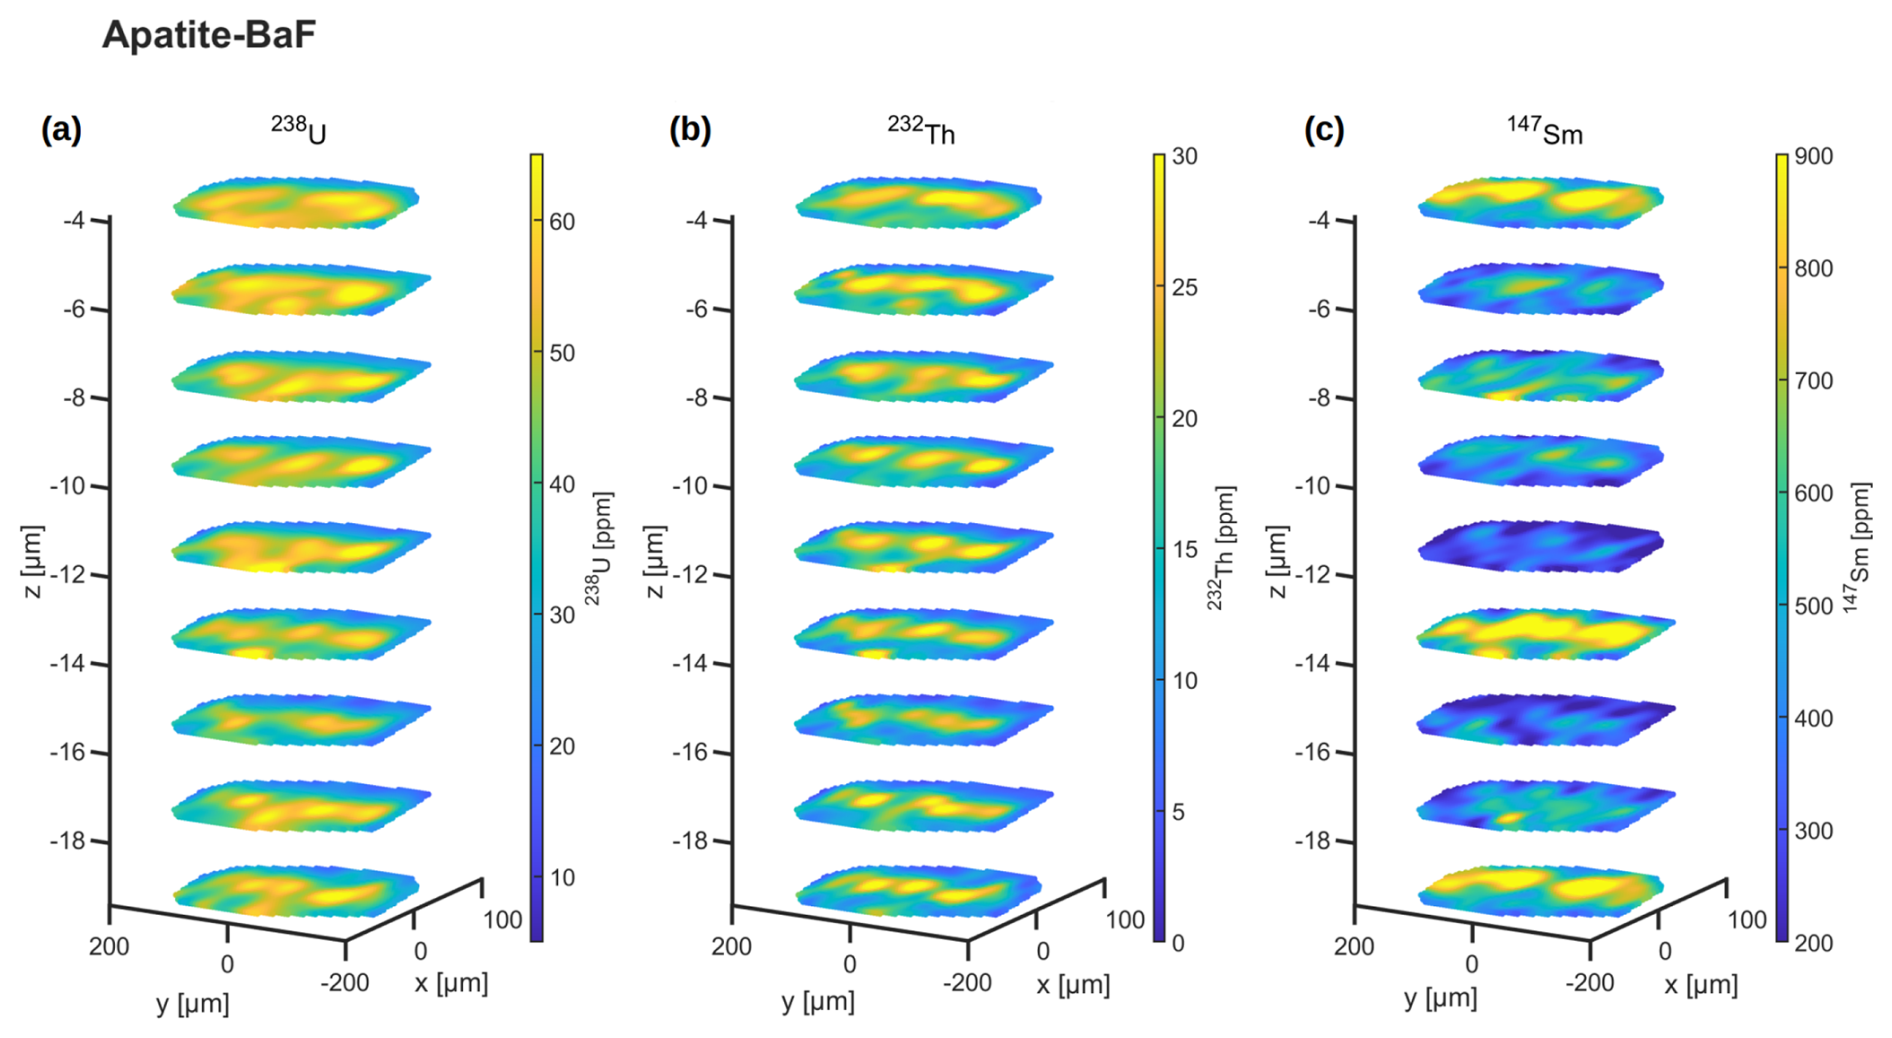
Figure 4Interpolated parent nuclide distribution maps (5×5 µm horizontal resolution) of Apatite-BaF. Vertically, the parent nuclide concentrations were mapped approximately every 2 µm for a 20 µm deep section through the grain (parallel to the c-axis). The uppermost slice mapped at 2 µm depth is not displayed due to a large number of outlier measurements (Sect. 2.4). Parent nuclide maps were interpolated with a smoothness constraint (see Sect. 2.4) of λ=0.175 for the 238U (a) and 232Th (b) maps and λ=0.01 for the 147Sm maps (c).
Apatite-URG shows low 238U concentrations (5–17 ppm), except for enriched grain rims and tips (Fig. 3a). 232Th and 147Sm span larger concentration ranges (86–234 and 20–310 ppm, respectively) and variation compared to 238U but do not show discernible zonation patterns in either map slice (Fig. 3b, c). For each element, Caw does not deviate significantly from the concentrations seen in the uppermost parent nuclide map slice (Fig. 3a–c).
In contrast, Apatite-BaF has a heterogeneous parent nuclide distribution, with overall depth-consistent zonation in the 238U (19–62 ppm), 232Th (4–29 ppm), and 147Sm (124–609 ppm) concentrations (Fig. 4). One side of the grain is enriched in parent nuclides compared to the other (Figs. 3e–h, 4). This matches the shapes of the measured 4He concentration profiles that also display 4He enrichment in one half of the grain compared to the other. While Caw at each 4He spot match the element distribution patterns of the uppermost map slice, 238U Caw, 232Th Caw and 147Sm Caw are overall slightly lower than in the uppermost map slice (Fig. 3e–g).
3.4 Spatial variation of in situ dates
In situ AHe dates are calculated from the 4He concentration and Caw and vary with the spot location in the grain (Fig. 3d, h). In Apatite-URG, the in situ dates are the same within error, ranging from 15.2 ± 2.5 to 20.9 ± 3.1 Ma (1 SD). There is a trend of older in situ AHe dates closer to the grain rim, but a spatial correlation between the date pattern and eU is not evident (Fig. 3d). The weighted mean in situ AHe date of 17.2 ± 1.6 Ma is within the apatite U-Pb date of 16.75 ± 0.84 Ma, determined by Binder et al. (2023), for this sample.
The in situ AHe dates in Apatite-BaF show a larger range (83.2 ± 9.6 to 162.3 ± 29.0 Ma, with a weighted mean date of 98.3 ± 41.8 Ma) and tend to be older towards the grain rims. Except for two anomalously old dates of spots closest to the grain boundary (Fig. 3h), in situ dates with a similar distance to the grain rim agree within measurement uncertainty. It appears that the youngest in situ dates are closest to the grain centre and in areas of the highest eU.
3.5 Cooling histories of two natural apatite crystals
3.5.1 Thermal histories from in situ helium profiles
In situ 4He profiles and their corresponding Caw can be inverted for cooling history reconstructions of single grains, which we tested for grains Apatite-URG (homogeneous) and Apatite-BaF (zoned).
We inverted the three 4He profiles measured in Apatite-URG for time-temperature paths with the present-day mean annual temperature of 10 °C for Germany (German Weather Service DWD) as an endpoint constraint and allowing a deviation of ± 5 °C. The model starting point was 20 Ma and 550 °C based on the independently determined apatite U-Pb date of 16.75 ± 0.84 Ma (Binder et al., 2023). Due to the overlap in (U-Th-Sm) He and U-Pb dates, we chose to widen the exploration space to 20 Ma instead of using the U-Pb age to avoid the starting point dictating the inversion results. Using these two constraints resulted in models with a large number of acceptable paths (i.e., GOF > 5 %) for all input 4He profiles, but no good paths (i.e., GOF > 50 %) were retrieved (Fig. 5). Further, the 4He profiles, forward-modelled based on the acceptable paths, align with the measured 4He profiles within measurement uncertainty. The best-fitting cooling paths have misfits (Eq. 2, cf., Sect. 2.6) of m=1.37 (Ap-URG-P1), m=0.84 (Ap-URG-P2) and m=1.77 (Ap-URG-P3). All 4He profile inversions and the corresponding best-fit forward models (Fig. 5a–c) indicate rapid cooling through the He PRZ between 15 and 20 Ma, which is both compatible with the volcanic nature of the sample (tuff) and the timing of magmatism inferred for the southern Upper Rhine Graben (Binder et al., 2023).
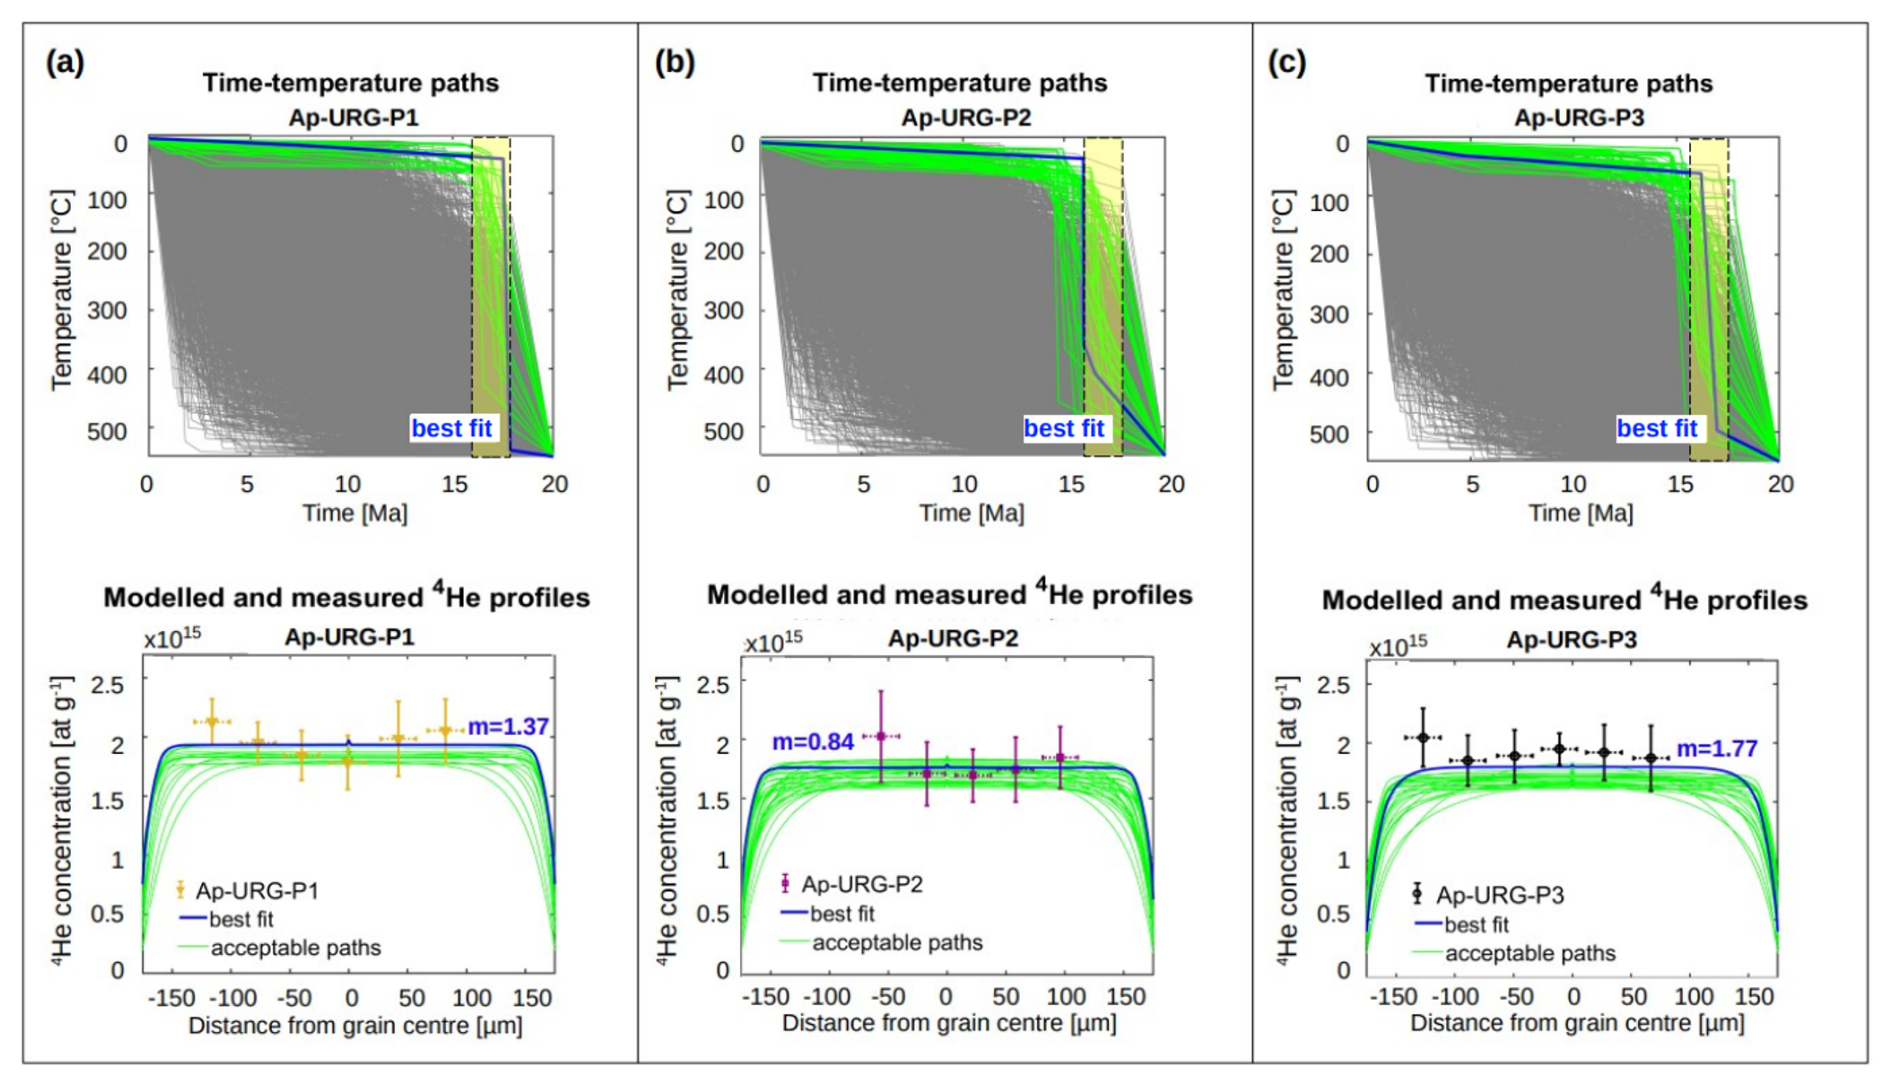
Figure 5Cooling history reconstruction of grain Apatite-URG. The time-temperature (t–T) paths were retrieved by inverting the 4He profile measurements (upper panels). Based on the acceptable t–T paths, the 4He profiles were forward-modelled, assuming a homogeneous parent nuclide distribution (lower panels). The forward models combine two core-rim profiles, leading to a small jump in the modelled 4He concentration in the centre of the grain (Sect. 2.6). Acceptable paths (in green) represent a GOF > 5 %. t–T paths and corresponding 4He profiles with the lowest misfit m (Sect. 2.6, Eq. 2) are highlighted in blue. The crystallisation date (apatite U-Pb date ± 1 standard deviation) of Apatite-URG as determined by Binder et al. (2023) is indicated by a yellow bar in the upper panels.
The in situ 4He profile inversion for zoned Apatite-BaF only produced acceptable time-temperature paths for one of the four measured 4He profiles (Ap-BaF-P1) (Fig. 6). Note that we only included 4He spots for which Caw could be calculated (Fig. 2, Table 3) in the inverse modelling. We used the same endpoint constraint for the time-temperature paths as for Apatite-URG, setting the temperature at 10 ± 5 °C for t=0 Ma. The starting point was set to a temperature of 570 °C at a time of 320 Ma, based on the weighted mean apatite U-Pb date derived from trace element measurements in Apatite-BaF (available in the associated Zenodo repository https://doi.org/10.5281/zenodo.15856623, Maier et al., 2025). Further, we used a study by Vamvaka et al. (2014) conducted near the sample location of Apatite-BaF in the Bavarian Forest (approximately 5–10 km from our sample location, same rock type), to assess the plausibility of our inversion results for Apatite-BaF. Based on their findings, we explored a cooling-only scenario (scenario 1) with the above start- and endpoint constraints (Fig. 6a, c) and an exhumation-and-reheating scenario (scenario 2, Fig. 6b, d). Specifically, Vamvaka et al. (2014) suggested possible reheating (re-burial) in the Bavarian Forest near the Apatite-BaF sample location during the Jurassic or Lower Cretaceous followed by exhumation in the Upper Cretaceous. To test whether this is plausible for our Apatite-BaF, we set model constraints for scenario 2 such that Jurassic and Cretaceous reburial is permitted but not required (Fig. 6b, d), with the additional limitation that temperatures in the Upper Cretaceous cannot exceed 120 °C (based on apatite fission track data by Vamvaka et al., 2014). Moreover, we repeated both inversions with Caw calculated from parent nuclide maps with different resolutions for sensitivity testing (cf., Sect. 3.5.2). The inversions for Ap-BaF-P1 resulted in a large number of acceptable time-temperature paths for both the cooling-only scenario and the reburial-and-exhumation scenario. However, good paths were only resolved in the latter and when using Caw calculated from a high-resolution parent nuclide map (Fig. 6d).
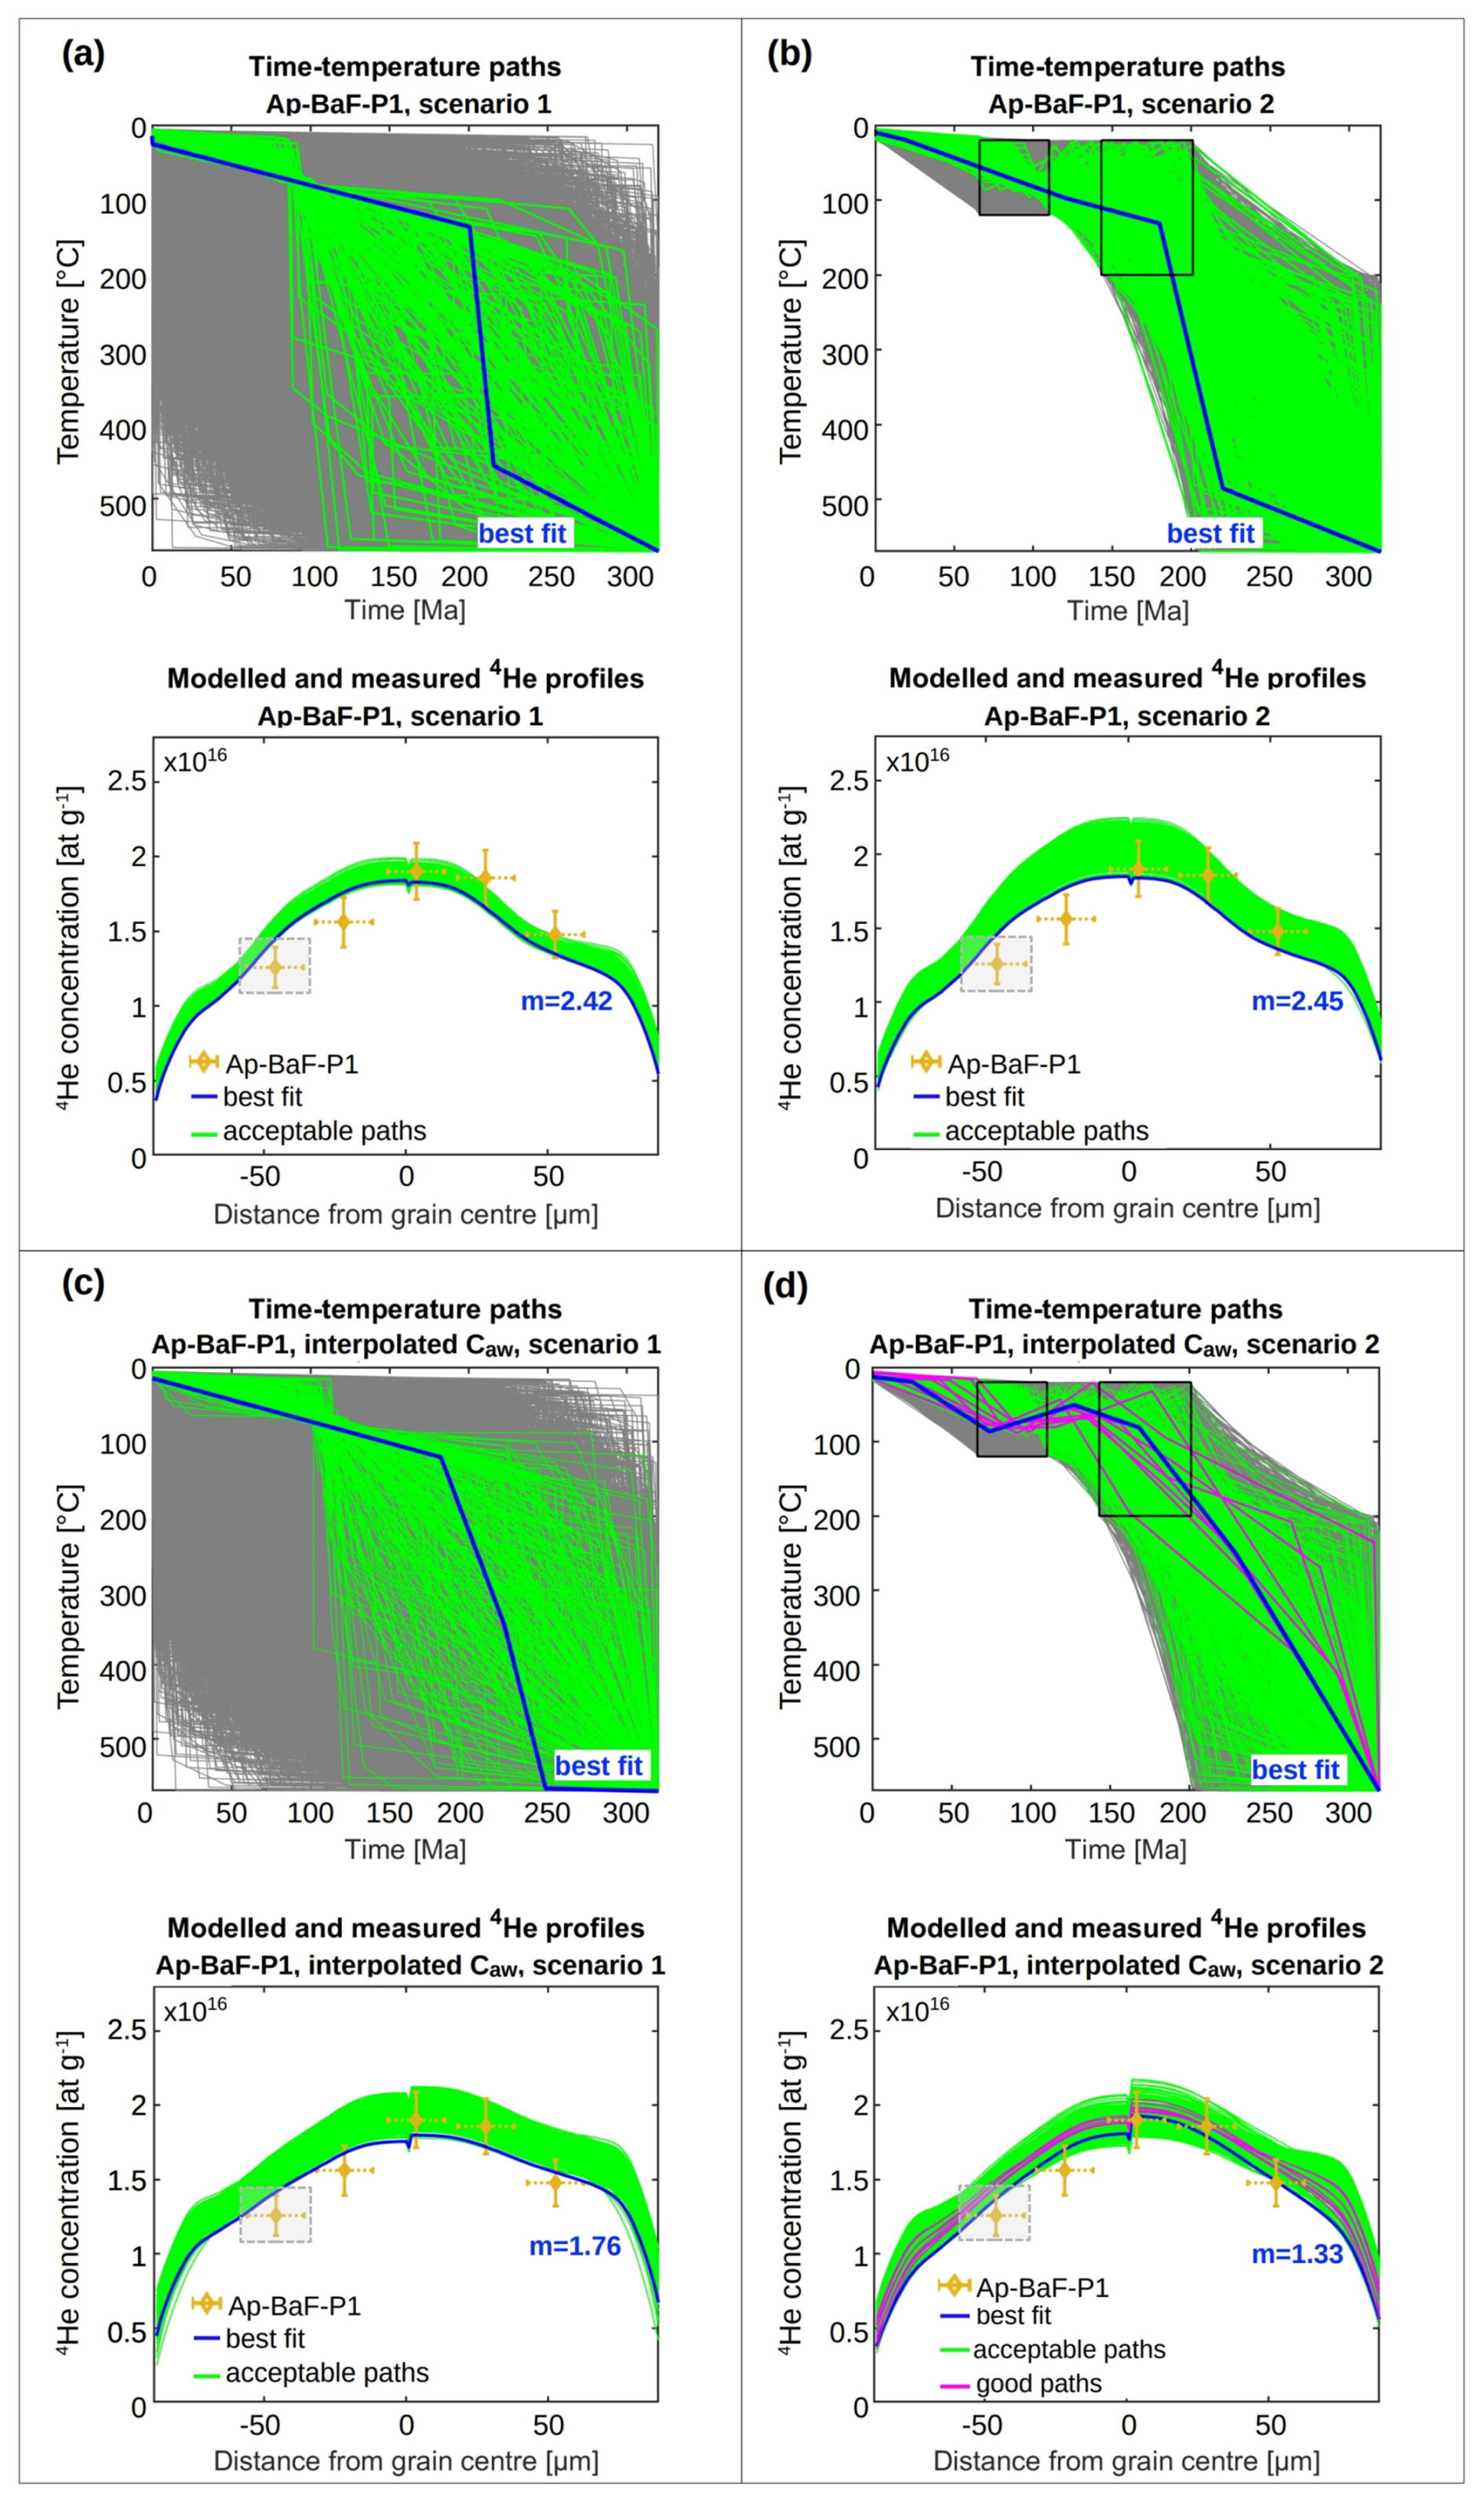
Figure 6Cooling history reconstruction of grain Apatite-BaF testing a cooling-only scenario (scenario 1; a, c) and a reburial-and-exhumation scenario (scenario 2; b, d). The time-temperature (t–T) paths were retrieved by inverting the 4He profile measurements and using alpha-stopping-distance weighted parent nuclide concentrations (Caw) calculated based on the original 24×24 µm resolution measurements (a, b) and on the interpolated 5×5 µm resolution parent nuclide distributions (c, d). The different resolutions were used to assess the effect of parent nuclide map resolution on thermal modelling. Based on the acceptable t–T paths, the 4He profiles were forward-modelled, assuming a heterogeneous parent nuclide distribution. The forward models combine two core-rim profiles, leading to a small jump in the modelled 4He concentration in the centre of the grain (Sect. 2.6). Acceptable paths (in green) represent a GOF > 5 % and good paths (in magenta) represent a GOF > 50 %. t–T paths and corresponding 4He profiles with the lowest misfit m (Sect. 2.6, Eq. 2) are highlighted in blue. The black boxes indicate t–T constraints. Spots that are within 40 µm from the grain boundary are marked with grey boxes. These spots were excluded from inverse thermal history modelling but used for misfit calculation of the measured and forward-modelled 4He profiles.
3.5.2 Sensitivity of the thermal models to parent nuclide map resolution
We repeated the inversion for Ap-BaF-P1 for the cooling-only (scenario 1) and for the reburial-and-exhumation scenario (scenario 2) twice to test the sensitivity of the inversion results to the parent nuclide map resolution. The first inversion used Caw calculated from the initial 24×24 µm resolution parent nuclide map, while the second inversion utilised higher-resolution Caw derived from the interpolated 5×5 µm resolution parent nuclide maps. As mentioned in Sect. 3.5.1, all four inversions produced acceptable paths. Notably, the misfit between the measured 4He profile and the forward-modelled 4He profile based on the best-fitting time-temperature path is lower for the models using 5×5 µm resolution Caw (Fig. 6c, d) than for the models using 24×24 µm resolution Caw (Fig. 6a, b) across both scenario 1 and scenario 2. Further, for the models using 24×24 µm resolution Caw (Fig. 6a, b), the best-fit paths retrieved in scenario 1 and scenario 2 are very similar with misfits of m=2.42 (scenario 1, Fig. 6a) and m=2.45 (scenario 2, Fig. 6b). In contrast, when using the high-resolution Caw, the misfit for the best-fit path in scenario 2 (with reheating, m=1.33, Fig. 6d) is distinctly lower than in scenario 1 (cooling only, m=1.76, Fig. 6c). Additionally, using high-resolution Caw, the misfits for the best-fit paths are in the same range as for the homogeneous Apatite-URG.
3.6 Summary of the main results
The preceding paragraphs present the results of in situ 4He profile measurements, parent nuclide mapping and thermal history modelling performed on two apatites from samples in South Germany (Apatite-URG and Apatite-BaF). We attained 4He profiles with 4He measurement uncertainties of less than 10 % for Apatite-BaF (ablation spot diameter 20 µm) and less than 15 % for Apatite-URG (ablation spot diameter 30 µm). Apatite-URG with a homogeneous parent nuclide distribution shows a redundancy between the three measured in situ 4He profiles and in situ (U-Th-Sm) He dates that are generally consistent within measurement uncertainty and overlap with the independently determined apatite U-Pb date of this sample (Binder et al., 2023). Thermal modelling for all 4He profiles suggests that Apatite-URG underwent rapid cooling between 15 and 20 Ma.
In contrast, Apatite-BaF with a heterogeneous parent nuclide distribution displays a strong variation in in situ AHe dates from the core (younger) to the rim (older), with the youngest in situ dates corresponding to the areas of highest eU. Only one profile, Ap-BaF-P1, could be inverted to yield acceptable cooling paths. We tested a cooling-only scenario against a scenario of potential Jurassic or Lower Cretaceous reburial followed by Upper Cretaceous cooling as proposed by Vamvaka et al. (2014) for areas near Apatite-BaF's sample location. While the 4He profile inversion for both scenarios yielded acceptable time-temperature paths, good paths were only achieved for the reburial-and-exhumation case, suggesting this to be the more fitting thermal history.
Sensitivity testing with Caw calculated from different resolution parent nuclide maps indicates that inverse and forward models using Caw calculated from high-resolution parent nuclide maps produce better results, i.e., a lower misfit between modelled and measured 4He profiles, than models using Caw from lower-resolution parent nuclide maps.
We make the following general observations that will be further discussed below. (1) There is a strong relation between 4He measurement uncertainty and ablation spot size (volume), which needs to be selected to be large enough to reduce analytical uncertainty and small enough to increase spatial resolution. (2) In situ measured 4He concentrations and corresponding in situ dates vary with the spot location in the grain and with eU. (3) In situ 4He profiles can be inverted for cooling histories of homogeneous and, even though more challenging, heterogeneous grains.
4.1 Grain size
The direct measurement of (in situ) 4He profiles requires comparatively large grains, at least 145 µm in diameter in our case. There are two main controls on the minimum analysable grain size: the minimum number of spots needed for a reliable 4He concentration profile (Sect. 4.2) and the minimum ablation spot diameter to reach the required ablation volume (Sect. 4.3). Regarding the former, our data suggest that at least four evenly spaced measurements (3–5 µm distance from rim to rim of the ablation spot) along a c-axis perpendicular half-profile (core to rim) or six along a rim-to-rim profile are necessary for a reliable 4He concentration profile. With respect to the latter, we determined, for our laboratory set-up at the University of Tübingen, an ablation spot diameter of 20 µm as ideal for apatite (Sect. 4.3). Taken together, for a full profile of six spots with a spot size of 20 µm, a spot spacing of 5 µm and a zero distance between the edge of the outermost ablation spot and the grain rim, the minimum grain diameter is 145 µm. Grains with a low 4He content (< 2.1 × 10¹⁵ at g−1 in this study), requiring larger ablation spots, can only be analysed if a medium sand-sized fraction is available. This requirement limits the applicability of the single-grain in situ approach for thermal history modelling, especially for small apatites with low parent nuclide concentrations. In such cases where the grain size is small or the required spot size is large (or both), single in situ spots in several grains would have to be used (e.g., Glotzbach and Ehlers, 2024).
4.2 Number of ablation spots in a profile
The minimum number of 4He spots needed for a profile measurement is crucial in assessing whether a grain is sufficiently large for in situ 4He profile measurements. However, determining the minimum number of ablation spots in a profile is not trivial, as it depends on the complexity of the 4He profile, which is unknown beforehand.
For a first estimate, we liken the minimum number of spots in a profile to the mathematical problem of finding the minimum number of unique points needed to define a curve. It is evident that two points define a straight line, and given any two distinct points, there is only one unique line fitting through them. The minimum number of points required to describe a curve, on the other hand, depends on its complexity. The simplest assumption is that if the definition of a straight line requires two points, a simple curve should require at least three. This assumption is valid for a simple quadratic function of the form f(x) = , representing a parabola. Thus, if we approximate the 4He profile within a homogeneous grain as a parabola, then three points from the core to the rim, or six from rim to rim, are necessary to measure the 4He profile. In the case of a parabolic 4He profile that is symmetric about the c-axis (with the vertex of the parabola located at the centre of the grain), measuring five spots with the middle spot exactly at the grain centre may also be sufficient. We advise against using fewer spots in a rim-rim profile, as less than three measurements per grain half increases the risk of under-defining a core-rim section.
For the grains in this study, we achieved good results using five to six spots in a rim-rim profile and four in a core-rim profile. Thus, based on the mathematical thought experiment and our measurements, we conclude that starting with at least six spots in a rim-rim profile is appropriate. However, this is a minimum estimate, and we generally recommend using as many spots as possible to measure a 4He profile for best results.
4.3 Laser ablation spot diameter and pit depth
The choice of ablation spot diameter and pit depth is a compromise between the accuracy of the 4He concentration profile, which benefits from a smaller spot size and shallower pit, and the analytical uncertainty, which increases with decreasing ablated volume, i.e., decreasing amount of 4He measured. Generally, the lower the difference between the 4He signal and the blank level, the higher the associated measurement uncertainty. This is illustrated by the measurements in Apatite-URG and Apatite-McClure. The uncertainty in the 4He measurement for Apatite-McClure is more than four times greater than for Apatite-URG despite the similar 4He concentrations. The reason for this significant difference lies in the ablation spot diameter. Measurements in Apatite-McClure had an ablation spot diameter of 10 µm, resulting in an ablated volume that is only about 7 % of that in Apatite-URG, which had an ablation spot diameter of 30 µm. As a result, the 4He signal for Apatite-McClure was too low to yield precise measurement results. The lower limit of the ablated volume depends on the 4He concentration in the grain and the specific blank levels and criteria for acceptable analytical uncertainty of the analysing laboratory. In our laboratory, 4He measurements are considered ideal when they exceed three times the standard deviation of our line blank measurements and have a standard deviation (SD) of < 5 %. While slightly lower 4He signals are not ideal, they can still be used, with the caveat that their measurement uncertainties will increase when approaching blank levels. In this study, both Apatite-URG and Apatite-BaF have measurement uncertainties of > 5 %. We report the quality assessment for each measurement in the associated repository.
Another trade-off exists between smaller-diameter and deeper ablation pits and larger-diameter and shallower ablation pits. The uncertainty introduced by pit volume measurements is one of the limiting factors for the minimum ablation spot size. We determined pit volumes via confocal laser scanning microscopy, which is constrained by the maximum resolvable pit depth at small pit diameter-to-depth ratios. The difficulty with mapping the topography of increasingly narrow and deep pits is illustrated by the progressively higher standard deviations from the mean pit volume in our measurements at lower diameter-to-depth ratios (Table 2). Pickering et al. (2020) found the same type of limitations when using optical interferometry, which demonstrates the need for further development in determining pit volumes. An additional constraint on spot diameter vs. pit depth is a potential parent nuclide zonation. While a small-diameter but deep ablation pit reduces lateral averaging of the helium concentration, it exacerbates the effects of potential “downhole” parent nuclide zonation and inclusions.
For this study, which includes 98 individual measurements with ablation spot sizes of 10–30 µm and corresponding average depths of 7.9–9.7 µm (Tables 2 and B1), a pit diameter of at least 20 µm and depth < 8 µm was optimal. Likewise, Pickering et al. (2020) used 20 µm pit diameters with depths of < 10 µm for their in situ AHe analysis. For zircons, Danišík et al. (2017) achieved reliable 4He measurements for square spots with diameters of < 10 µm and pit depths of ∼ 2 µm. However, due to the above factors, we recommend that users conduct test measurements with different ablation pit geometries to determine what suits each sample best before measuring 4He concentration profiles.
4.4 Laser ablation spot locations in the grain
The placement of 4He ablation spots to measure an accurate in situ 4He concentration profile for thermal history reconstruction mainly depends on two aspects: the distance to inclusions and fractures, and the distance of the outermost individual spots to the grain rim. Concerning the former, the distance to inclusions is critical, because mineral inclusions with a potentially many times higher parent nuclide concentration compared to the host crystal may implant foreign helium and lead to excess 4He, not directly related to the cooling history, in the surrounding grain (e.g., Vermeesch et al., 2007). Furthermore, fractures or voids can trap 4He and locally affect the 4He diffusion kinetics (e.g., Zeitler et al., 2017). As these phenomena complicate cooling history reconstructions, their periphery should be avoided. When selecting 4He ablation spots, a minimum distance of 20 µm from inclusions or fractures (for average alpha-stopping distances, e.g., Pickering et al., 2020) should be maintained. Still, if possible, grains with these features should not be analysed. We discuss the effect of grain heterogeneities further in Sect. 4.6.
More crucial for 4He profile measurements is the distance of a 4He ablation spot to the grain rim, provided an adequate grain is selected. Close to the grain rim, 4He measurements will average concentrations across a steep gradient (depending on the spot size) due to alpha-ejection at the grain boundary (e.g., Farley et al., 1996; Farley, 2002). This leads to a decreased accuracy of the measurements near the rim. To avoid grain rim effects and to account for the full range of alpha-stopping distances, an ablation spot would need to be at least 40 µm away from the grain boundary (distance from the ablation spot centre to the grain rim). However, this poses a problem since the shape of the helium profile near the grain rim is diagnostic for differentiation between slow and fast cooling. Ultimately, the difference between a flat (fast-cooled) 4He profile and a rounded (slow-cooled) 4He profile is best observed at the grain rim (Shuster and Farley, 2004). Not measuring 4He within 40 µm of the grain rim would thus exclude characteristic information. In this exploratory study, we measured 4He closer than 40 µm to the grain rim (Fig. 2) but did not calculate alpha-stopping distance weighted parent nuclide concentrations (Caw) for those spots or use them for the 4He profile inversion. Nevertheless, we included those measurements for comparisons between the measured and forward-modelled 4He profiles. Further studies are needed to determine best practices concerning the 4He spot placement and measurements near the grain rim.
Furthermore, our results for Apatite-URG (Fig. 2a) suggest that in homogeneous grains, the placement of the profile closer to the grain tips or middle does not influence the in situ 4He profile's shape. Information gathered from multiple profiles in such cases is expected to be redundant, as demonstrated in all Ap-URG profiles (Fig. 2a) and in three of four Ap-BaF profiles that are indistinguishable within measurement error (Fig. 2b). Hence, for homogeneous or concentrically zoned grains, it may suffice to measure a half-profile. However, we still recommend analysing 2–3 rim-to-rim profiles because the likelihood of detecting anomalies in parent nuclide and 4He distribution, e.g., due to inclusions, is higher.
4.5 Spatial variation of in situ dates in a grain
Apatite-BaF displays a strong variation of in situ AHe dates from core to rim, with a trend of older dates towards the grain rim and younger dates towards the grain centre (Fig. 3h). The pattern of older dates at the grain rim is the most pronounced in the profiles Ap-BaF-P2 and Ap-BaF-P3, where the dates at the rim are up to twice as old as the dates in the centre (Fig. 3h). Notably, profile Ap-BaF-P1, which we successfully inverted for thermal histories, does not show this trend.
The observed date distribution within Apatite-BaF is counterintuitive. In theory, uniform Arrhenius-type diffusion results in a relative depletion of 4He at the rims compared to the core and a distribution of the oldest (U-Th-Sm) He dates in the grain centre with progressively younger dates towards the grain rims (Glotzbach and Ehlers, 2024). A pattern of younger dates nearer to the rim would also be logical for a heterogeneous grain like Apatite-BaF, where the parent nuclides are relatively enriched in the core compared to the rim (Fig. 3e–h). Here, the rims should be depleted in 4He compared to the core, even when considering radiation damage effects (e.g., Shuster et al., 2006) and hence yield younger in situ dates. From our data, we cannot decipher the reason for the observed inverted in situ date pattern. It is unclear whether the oldest dates near the grain rims are outlier measurements or if they result from undetected local grain heterogeneities. Possible reasons for the old dates at the rim include a locally high alpha-particle production in the portion of the grain that was lost during the initial grinding and polishing after the grain was embedded in Teflon, or from deeper in the remaining unanalysed grain fraction. Additionally, there could be a higher local 4He retentivity in the crystal lattice from variations in major element composition (e.g., Djimbi et al., 2015) or variations in vacancy damage (e.g., Gerin et al., 2017). Another factor to consider is an external source for high 4He, such as the potential 4He implantation from a neighbouring crystal. However, this is unlikely to have had an impact on the dates in Apatite-BaF as we only calculated in situ AHe dates for spots more than 40 µm from the grain rim, whereas the common assumption is that the outer 20 µm are the most affected by 4He implantation (e.g., Spiegel et al., 2009; Gautheron et al., 2012). Moreover, Apatite-BaF does not show a 4He concentration pattern indicative of 4He implantation, which would be a significant peak in 4He concentration at the grain rim facing the external 4He source (cf., Gautheron et al., 2012). Thus, 4He implantation is an unlikely reason for the date pattern in Apatite-BaF. Even so, the slightly older dates in Apatite-URG nearest to the grain rim in Ap-URG-P2 and Ap-URG-P3 (Fig. 3d), even though within measurement uncertainty, might be a result of 4He implantation, as they do correspond with higher 4He concentrations.
Regardless, in our modelling approach, we can only account for the redistribution of 4He from the radioactive decay event via Caw calculation. Any other processes that could locally deplete or enrich 4He and lead to older in situ dates (e.g., lattice defects trapping 4He) and alter the diffusive behaviour are not considered. Imaging techniques such as Raman spectroscopy would be necessary for further investigation and refinement.
4.6 Parent nuclide heterogeneity
Previous studies have evaluated the influence of parent nuclide zonation on 4He profile thermal modelling in the context of whole grain 4He 3He analyses. They demonstrated that undetected and unquantified zonation of parent nuclides can result in retrieving incorrect cooling histories since parent nuclide heterogeneities do not always visibly manifest in the shape of the measured 4He profile but still affect the 4He concentration and distribution in the grain (e.g., Shuster and Farley, 2004; Farley et al., 2010). Hence, mapping the parent nuclide distribution of exposed internal grain surfaces is crucial in assessing the extent of parent nuclide heterogeneity influencing the 4He distribution (e.g., Farley et al., 2011; Danišík et al., 2017).
In this study, Apatite-BaF exemplifies a case where the impact of parent nuclide zonation is not apparent from the measured 4He profiles' shapes. The profiles Ap-BaF-P1, Ap-BaF-P2 and Ap-BaF-P4 (Fig. 2b) display an inconspicuous shape with a smooth decrease in 4He concentration from the grain centre to the rim, typical for slowly cooled grains (Shuster and Farley, 2004), save for a slight skewing of the maximum concentration off-centre for Ap-BaF-P2 and Ap-BaF-P4. Even so, the comparison of measured and modelled 4He profiles (Figs. 6a, b, 7) indicates that the 4He gradient measured near the grain rim is not achievable solely by finding fitting time-temperature paths. The apparent discrepancy between measured and modelled 4He profiles near the grain rim, more so in the left side than the right (Figs. 6a, b, 7), suggests a significant influence of parent nuclide heterogeneity (Figs. 2 and 3e–h) and associated variations in the 4He production and diffusion in the crystal (e.g., Farley et al., 2010). This underlines that determining the parent nuclide distribution is a necessary step in interpreting in situ 4He concentration profiles (e.g., Farley et al., 2011; Danišík et al., 2017; Fox et al., 2017).
4.7 Influence of parent nuclide map resolution on thermal modelling
Mapping the parent nuclide concentration on the exposed internal grain surface via LA-ICP-MS allows treating the in situ 4He concentration as a function of the surrounding parent nuclide distribution to achieve more accurate 4He profile-parent nuclide relationships for heterogeneous grains (e.g., Farley et al., 2010; Danišík et al., 2017). By using the alpha-stopping distance weighted parent nuclide concentration Caw derived from such parent nuclide maps for 4He profile thermal modelling, we can also account for the redistribution of 4He from high-energy alpha decay (Sect. 2.5).
To illustrate the effect of parent nuclide heterogeneity on in situ 4He profiles and as a first assessment of the thermal models' sensitivity to the parent nuclide map resolution, we compare forward-modelled 4He profiles based on the same time-temperature path but assuming different parent nuclide distributions in Fig. 7. As an example for a homogeneous grain, we compare the forward model results for Apatite-URG using a uniform parent nuclide distribution calculated as an average of all parent nuclide measurements (red curve, Fig. 7a), and using Caw calculated from the 24×24 µm resolution parent nuclide map (blue curve, Fig. 7a). For the heterogeneous Apatite-BaF, we added a forward model using Caw calculated from the higher-resolution, 5×5 µm, interpolated parent nuclide map (black line, Fig. 7b). We arbitrarily chose the best-fit time-temperature path retrieved by the respective inverse models in Fig. 5a (Apatite-URG) and Fig. 6c (Apatite-BaF) as a fixed input cooling history for the forward model tests. Figure 7a shows that for the mostly homogeneous Apatite-URG, the forward-modelled 4He concentration profile using Caw (blue curve, misfit = 1.30; Fig. 7a) does not differ much from the forward-modelled 4He profile based on an averaged, uniform parent nuclide distribution (red curve, misfit = 1.37; Fig. 7a). The slight concave-up pattern of the measured 4He profile (yellow data points, Fig. 7a), however, can solely be modelled with Caw. Given that both models are indistinguishable within measurement uncertainty, we did not generate finer resolution models. In contrast, for the asymmetrically-zoned grain Apatite-BaF the shapes of the forward-modelled 4He profiles differ significantly for the different parent nuclide distributions (Fig. 7b). Here, the forward-modelled 4He profile based on the parent nuclide concentration measured closest to each in situ 4He measurement location (red curve, m=4.19; Fig. 7b) is too steep and does not match the measured 4He profile (yellow data points, Fig. 7b) towards the grain rim. The forward model with Caw calculated from the measured 24×24 µm resolution parent nuclide map (blue curve, m=4.31; Fig. 7b) shows a comparable misfit. Although it captures the measured 4He profile's shape, it overestimates the 4He concentration in the left side of the grain. The smallest misfit between the measured and modelled 4He profiles is achieved when using Caw from the interpolated 5×5 µm resolution parent nuclide maps (black curve, m=1.76; Fig. 7b). This is consistent with observations from the thermal modelling results shown in Fig. 6, where the best results were achieved with the 5×5 µm resolution-based Caw (Figs. 6c, d, 7).
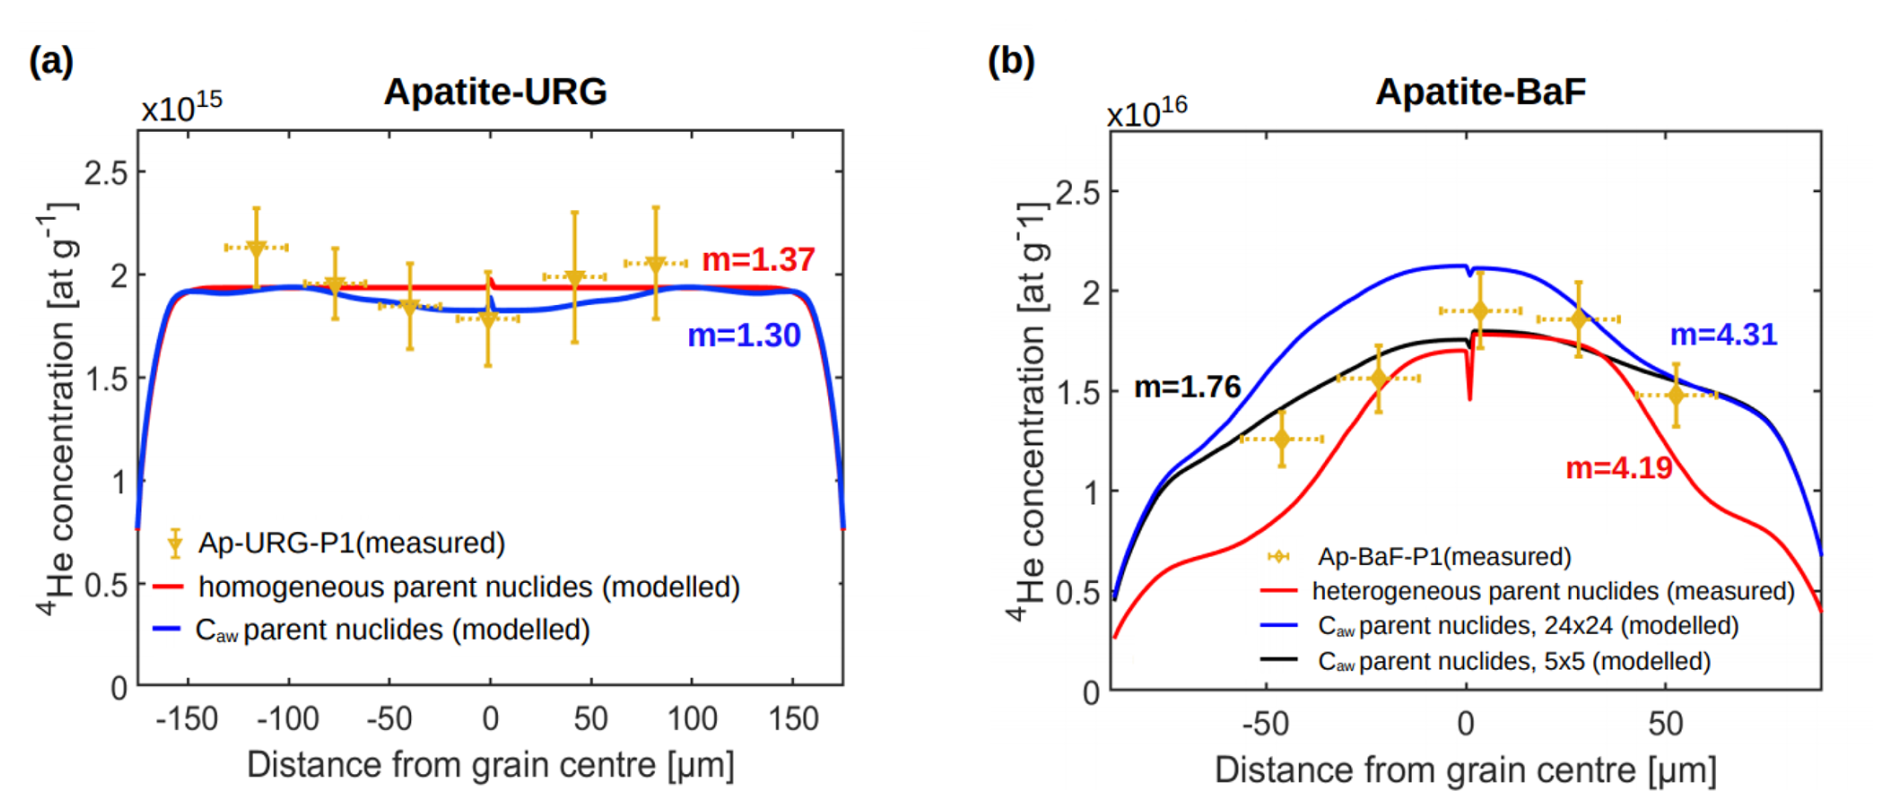
Figure 7Influence of parent nuclide zonation on forward-modelled 4He profiles. The profiles in (a) were forward-modelled based on the best-fit-path of profile Ap-URG-P1 (Fig. 5a), and the profiles in (b) were forward-modelled based on the best-fit path of Ap-BaF-P1 that resulted from the thermal history inversion in Fig. 6c. The red curve in (a) is the forward-modelled 4He profile assuming a grain-averaged homogeneous parent nuclide concentration, and the red curve in (b) is modelled using the parent nuclide concentration measured closest to each in situ 4He measurement location in Ap-BaF-P1. The blue curves are forward-modelled 4He profiles using the alpha-stopping distance weighted parent nuclide concentration Caw calculated from the uninterpolated parent nuclide maps in both grains, and the black curve in (b) is the forward-modelled 4He profile for Ap-BaF-P1 with Caw based on the interpolated, higher resolution 5×5 µm element maps. m denotes the misfit between modelled and measured 4He profiles (Sect. 2.6, Eq. 2). The forward models combine two core-rim profiles, leading to a small jump in the modelled 4He concentration in the centre of the grain (Sect. 2.6).
In summary, while for homogeneous grains the difference in modelling results assuming a uniform parent nuclide distribution or Caw is small, the parent nuclide distribution has a significant influence on the 4He profile in heterogeneous grains. Further, it appears that models with Caw from higher-resolution maps yield better results than models with Caw from lower-resolution maps. However, evidence from one grain is limited and only a first step towards a systematic investigation into the optimal resolution for parent nuclide measurement and interpolation. Moreover, parent nuclide concentration interpolation and assumptions made in the calculation of Caw (Sect. 2.5) introduce uncertainties, whose influence needs to be tested in future studies. To calculate Caw, we assume that the grain's parent nuclide distributions are mirror-symmetric about the exposed internal surface due to half of the grain being lost during the grinding and polishing steps of sample preparation. Second, we assume that our determined ablation time-depth relationship holds (Sect. 2.4). Further uncertainty is introduced when localising the 4He ablation spot centres on the LA-ICP-MS element maps, which is particularly critical for spots near the grain rim, where the interpolated grain boundary of the parent nuclide map does not always accurately capture the real grain boundary. Further studies are also required to test the optimal interpolation grid resolution in combination with the ablation spot size and the necessity of element maps of the entire grain. Regarding the latter, it might suffice to map the 40 µm proximity of the 4He profile, covering the full alpha-stopping distance range. This would account for heterogeneities more efficiently, although information on potential element zonations of the entire grain surface would then not be available. This approach could be augmented using other imaging techniques, such as cathodoluminescence, and Raman spectroscopy, to detect factors potentially affecting the 4He diffusivity (e.g., Ault and Flowers, 2012; Danišík et al., 2017).
4.8 Cooling history reconstruction from single grains
We demonstrated through analyses of a homogenous apatite (Apatite-URG) and a heterogeneous apatite (Apatite-BaF) that the combination of situ 4He measurements and Caw calculated from element maps can be inverted for cooling histories of single grains. The example of Apatite-URG shows that the 4He profile of a fast-cooled homogeneous grain as young as 16 Ma can be retrieved from six in situ spot measurements, and its cooling history can be accurately determined based thereon (Fig. 5). The example of Apatite-BaF shows that 4He profiles of heterogeneous grains are more challenging to invert. Here, only one out of four 4He profiles (Ap-BaF-P1, Fig. 2) could be successfully inverted for potential cooling histories. Even so, the inversion of Ap-BaF-P1 with high-resolution Caw (Fig. 6d) resulted in a misfit between the forward-modelled and measured 4He profiles comparable to results from the homogeneous Ap-URG. This suggests a potential for routine analysis of heterogeneous grains with the in situ method, pending further refinement. It is promising that although the profiles Ap-BaF-P2 to Ap-BaF-P4 could not be inverted for thermal histories, the acceptable cooling histories obtained from Ap-BaF-P1 align reasonably well with these profiles in forward models (Fig. C1, Appendix C).
One important development to be made in further studies is adjusting the modelling approach. Currently, the model is optimised for homogeneous grains, and a c-axis symmetric profile is assumed (Glotzbach and Ehlers, 2024). Apatite-BaF-P1 fulfils this symmetry assumption and thus could be inverted for cooling histories, while Apatite-BaF-P2 to Ap-BaF-P4 do not, and the inversion most likely fails for this reason.
While the forward models combine two core-rim profiles into a fully asymmetric rim-rim profile, we did not implement this approach in the inverse model; however, this could be a starting point for future studies. Additionally, further studies are needed to examine the effects of local changes in diffusivity mentioned in Sect. 4.5, such as the impact of radiation damage and whether this inhibits the modelling of heterogeneous grains.
4.9 Comparison with other single-grain thermal history reconstruction approaches
Our in situ 4He profile approach is conceptually similar to the whole-grain 4He 3He method by Shuster and Farley (2004) and the in situ element-maps to 1D-profile method by Danišík et al. (2017). A key difference between the 4He 3He approach and the in situ methods is that the in situ approaches enable direct measurements of 4He profiles. In contrast, the 4He 3He method requires proton irradiation of the samples to create a synthetic uniform 3He distribution before helium measurement by step-wise degassing (cf., Shuster and Farley, 2004). This difference is crucial because the need for proton irradiation currently limits the accessibility of 4He 3He analyses (e.g., Colleps et al., 2024).
Danišík et al. (2017), who pioneered the concept of cooling history inversion from an in situ measured 4He profile in zircon, illustrated that another advantage of in situ mapping of 4He and parent nuclides compared to the whole-grain 4He 3He measurement lies in the ability to analyse the spatial relationship between parent and daughter isotopes, as failing to account for the effect of grain heterogeneities on 4He profiles can lead to inaccurate thermal models (Danišík et al., 2017).
Our approach differs from the protocol of Danišík et al. (2017) in that we do not perform 4He and parent nuclide concentration mapping across the entire grain surface and convert those maps into 1D equivalent-sphere profiles. Instead, we directly obtain the 4He profiles from spot measurements along c-axis-perpendicular transects through the grain and combine them with parent nuclide mapping. This method requires fewer individual 4He analyses, improving efficiency. Furthermore, by integrating the 4He profiles with Caw from the element maps recorded at different “downhole” ablation depths, we can better understand the three-dimensional redistribution of 4He and account for long alpha-stopping distances.
Even though further studies are needed to test the reliability of the in situ profile method, for example, by comparing results from different grains of the same sample, we suggest it provides a useful additional tool for cooling history reconstruction, especially for samples where grains of variable kinetics (i.e., grain sizes or eU) are not available to constrain possible time-temperature paths (for whole grain (U-Th-Sm) He analyses) and where intracrystalline heterogeneities are prevalent.
In this exploratory study, we tested a new approach to obtain 4He profiles in apatite from in situ measurements and model the cooling histories of single apatite grains. We examined the limitations regarding the location, size, and number of ablation spots, as well as the grain size needed to measure an interpretable in situ 4He profile for our laboratory set-up at the University of Tübingen. Further, we introduced Caw, an alpha-stopping distance weighted parent nuclide concentration at each ablation site, calculated from 2D trace element maps, to allow for thermal modelling from in situ 4He measurements. We demonstrated the feasibility of our new approach on two natural apatite grains (one homogeneous, one zoned) from South Germany. From these results, we conclude the following:
-
The measurement of reliable 4He profiles using the in situ (U-Th-Sm) He approach is limited by minimum requirements on grain size and ablated volume. For our laboratory set-up in Tübingen, we find apatites that are larger than 145 µm and have with 4He concentrations greater than 1 × 10¹⁶ at g−1 are most suitable to achieve satisfactory results. These dimensions may vary among different laboratories.
-
Our data indicate that obtaining a 4He concentration profile requires at least four measurements from the grain core to the rim or six from rim to rim.
-
LA-ICP-MS parent nuclide mapping helps detect intracrystalline heterogeneities. The calculation of Caw is crucial in analysing heterogeneous grains, but may be unnecessary in homogeneous grains where the benefit of Caw calculations compared to using an averaged homogeneous parent nuclide concentration is marginal. This is important since parent nuclide mapping, inversion for 2D maps, and Caw calculation can be time-consuming. To improve efficiency, one possibility is to map the 40 µm perimeter surrounding the 4He spots for parent nuclides instead of the entire grain surface. This approach would suffice for the calculation of Caw. However, it limits the information available on grain zonation patterns and crystal lattice heterogeneities, which could be vital for interpreting asymmetric 4He profiles. Therefore, the trade-off between efficiency and potential information loss needs to be systematically tested.
-
Cooling histories can be inverted from in situ 4He profiles and parent nuclide maps. While the method is readily applicable to homogeneous grains, the inversion of asymmetric 4He profiles (heterogeneous grains) would benefit from further studies and is thus not yet recommended for routine analysis.
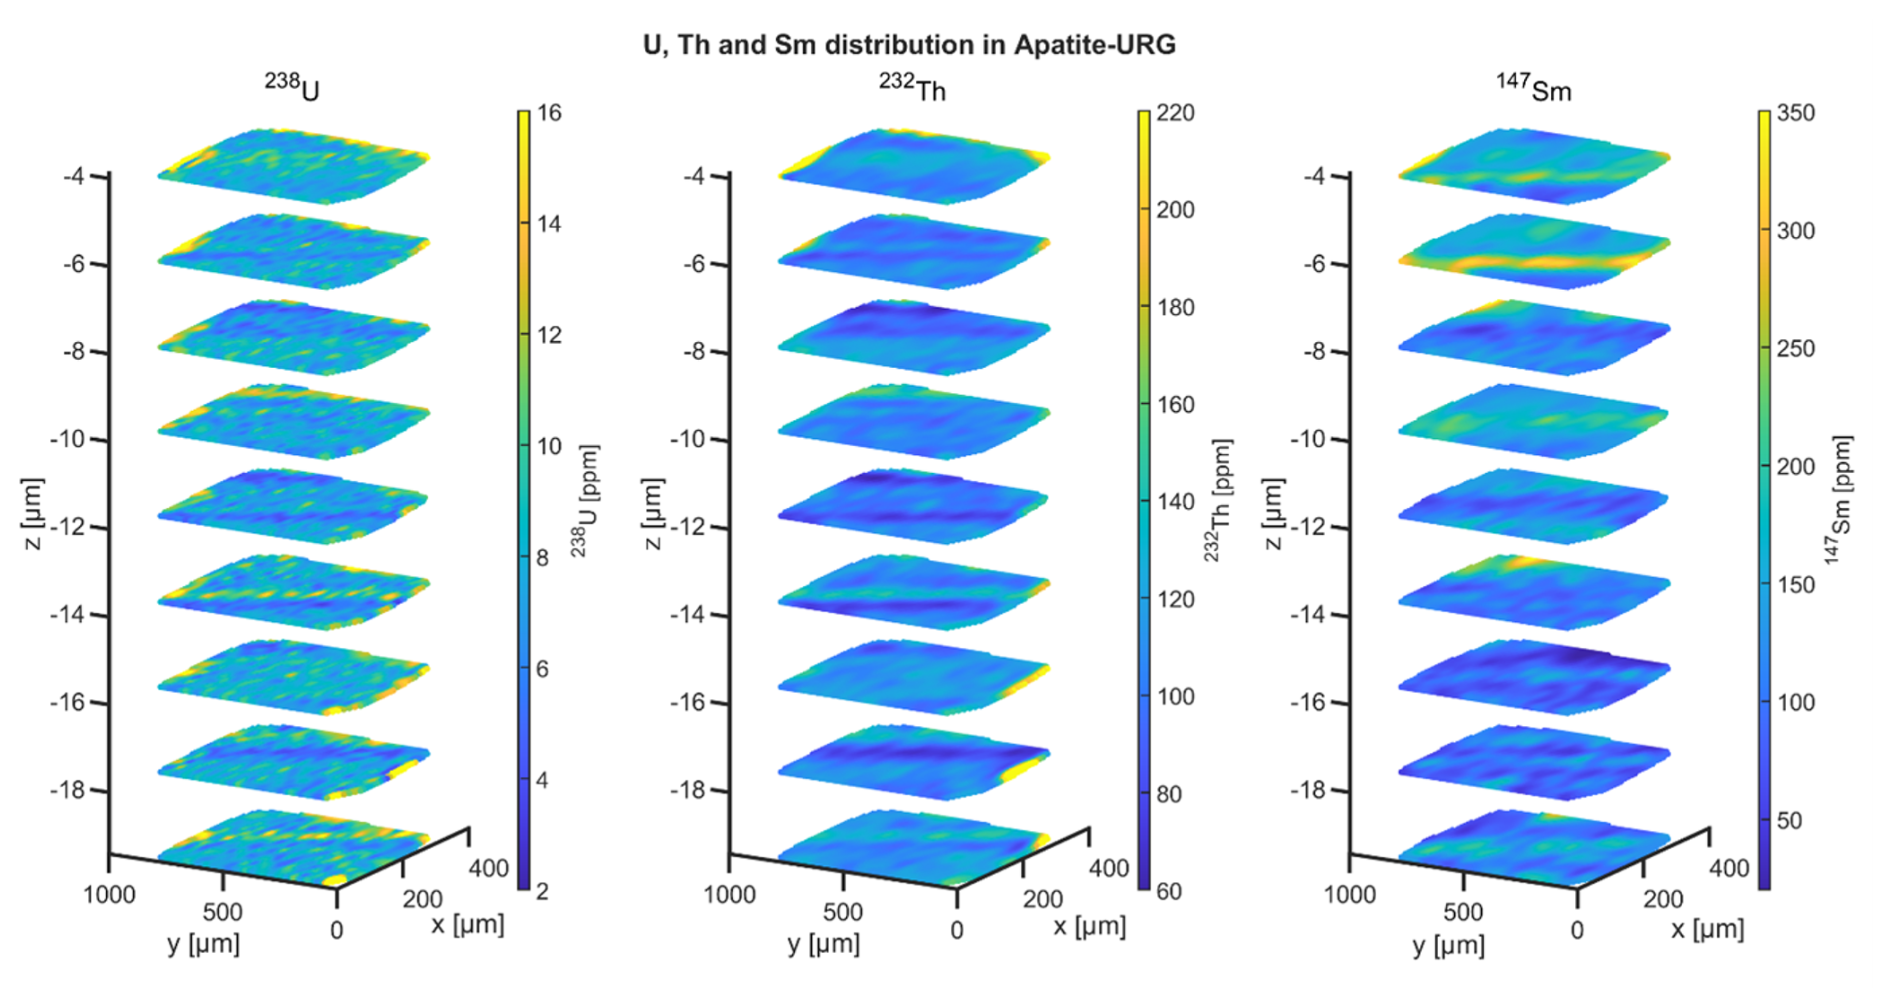
Figure A1Interpolated parent nuclide distribution maps (10×10 µm horizontal resolution) of Apatite-URG. Vertically, the parent nuclide concentrations were recorded approximately every 2 µm for a 20 µm deep section in the grain. Parent nuclide maps were interpolated with a smoothness constraint of λ=0.1 for the 238U and 232Th and λ=0.01 for the 147Sm maps.
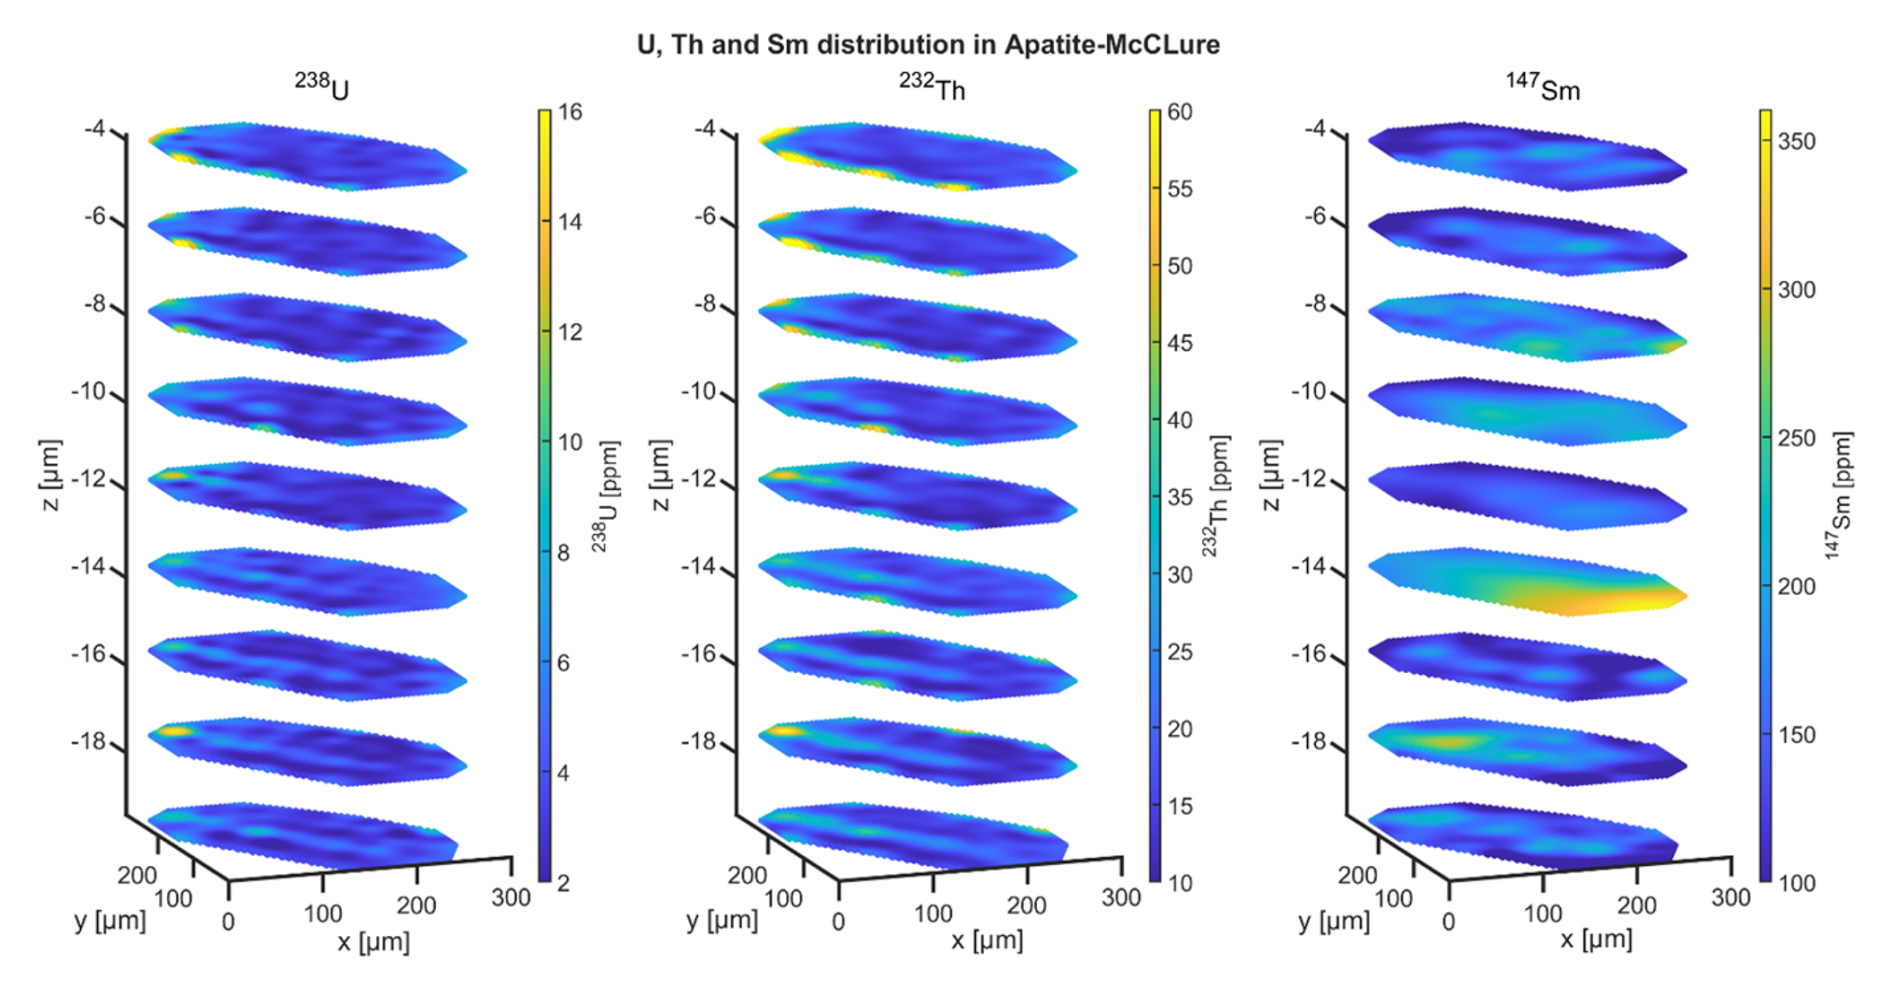
Figure A2Interpolated parent nuclide distribution maps (5×5 µm horizontal resolution) of Apatite-McClure. Vertically, the parent nuclide concentrations were recorded approximately every 2 µm for a 20 µm deep section in the grain. Parent nuclide maps were interpolated with a smoothness constraint of λ=0.3 for the 238U and 232Th and λ=0.01 for the 147Sm maps.
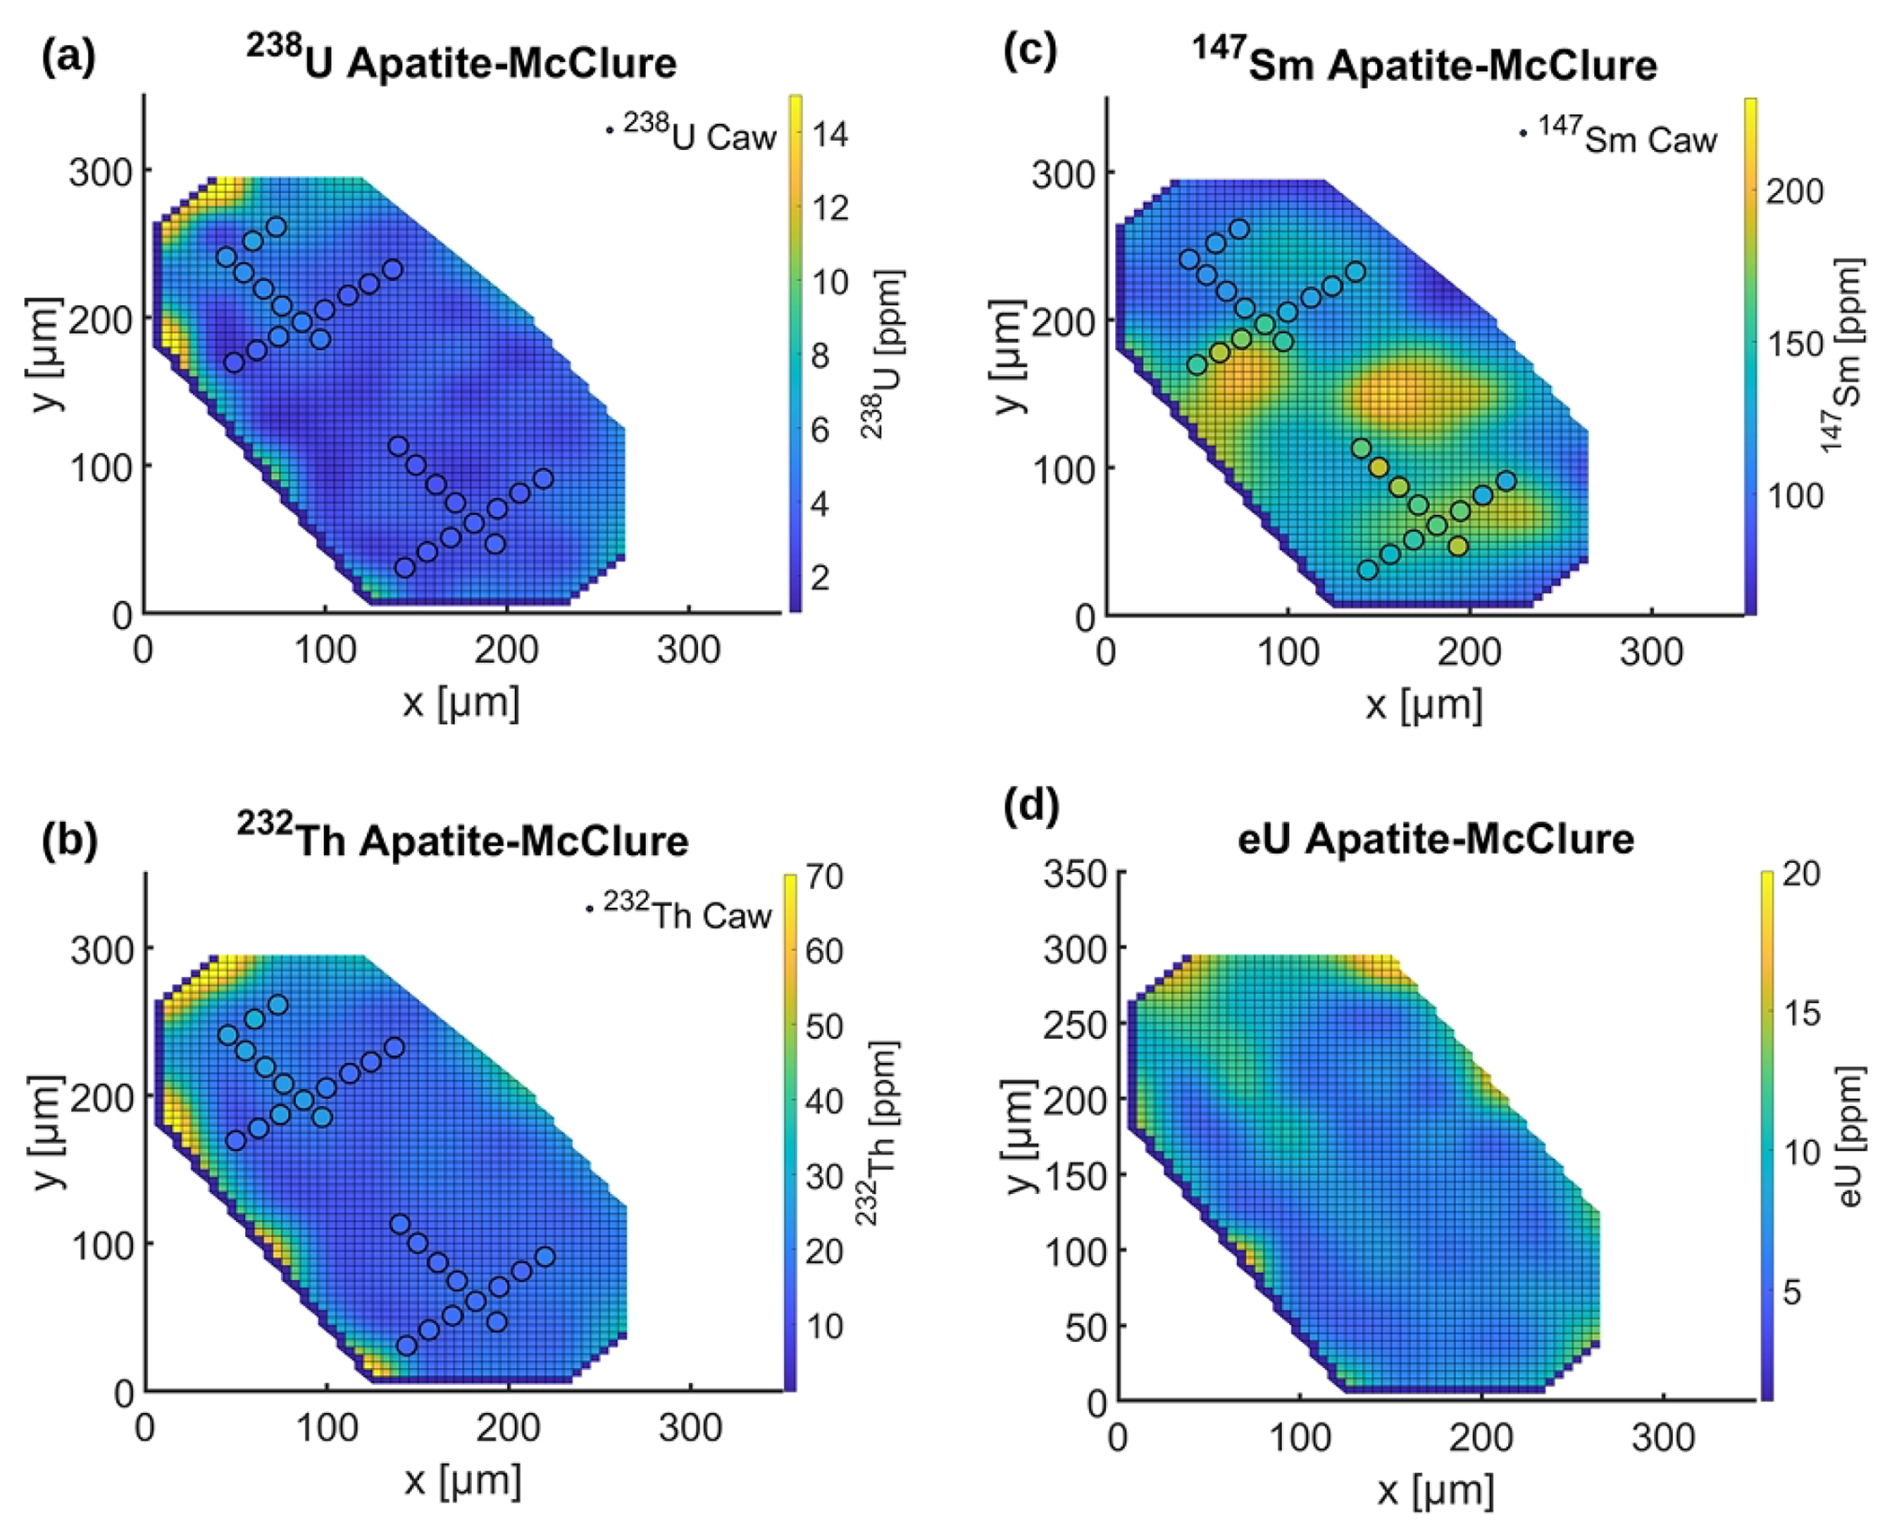
Figure A3Interpolated parent nuclide (uppermost map slice) and eU maps (averaged over all slices) of Apatite-McClure. The smoothness constraints (see Sect. 2.4) were λ=0.3 (U, Th) and 0.1 (Sm). Circles represent ablation spots for 4He. Their size reflects the laser spot size, and colours reflect the calculated alpha-stopping-distance weighted parent nuclide concentration (Caw).
Table B1Apatite-McClure 4He data and alpha-stopping distance weighted parent nuclide concentrations (Caw).
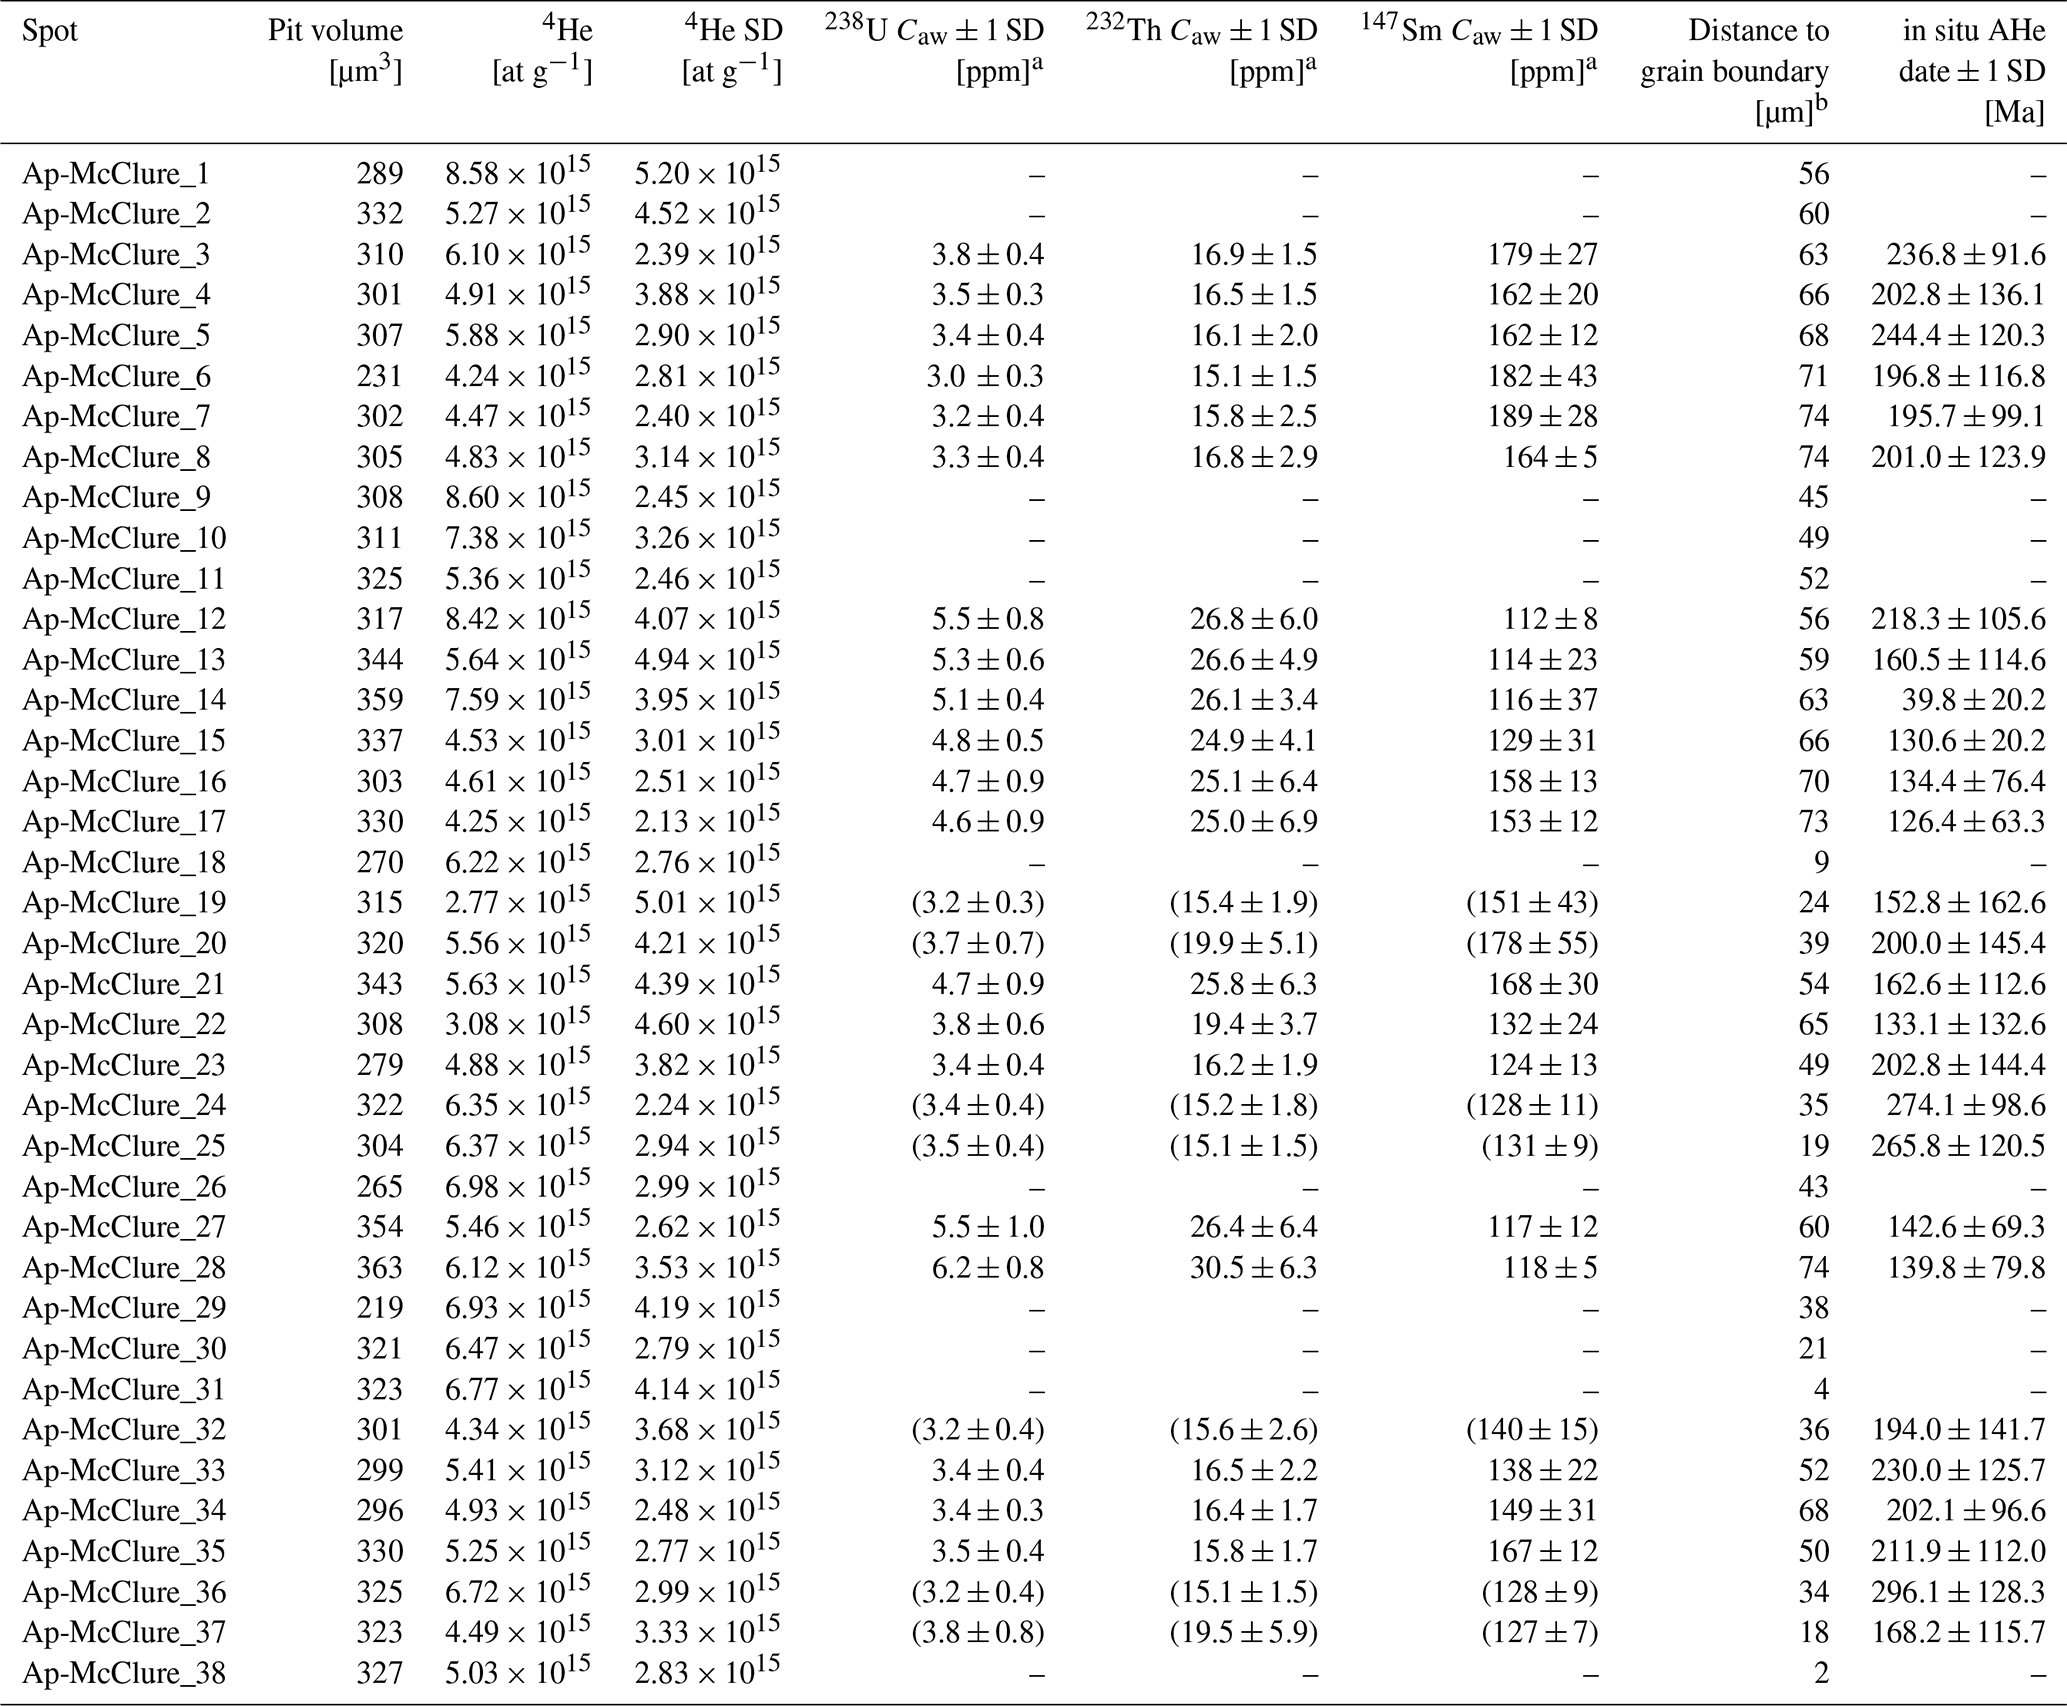
a Alpha-stopping distance weighted parent nuclide concentrations (Caw; see Sect. 2.5) were not calculated for spots less than the maximum alpha-stopping distance of 40 µm away from the grain boundary, and for spots that were measured along a c-axis parallel traverse (Sect. 2.5). Note that locating the 4He spots on the parent nuclide map is subject to uncertainty, especially for non-straight grain boundaries. Thus, the Caw calculation for spots close to the grain rim needs to be treated with caution. Where the interpolated parent nuclide map adds area to the grain, Caw values are reported in round brackets. b c-axis orthogonal distance from the He-measurement spot centre to the nearest grain rim. For Apatite-McClure in situ 4He profiles are not displayed due to the 4He measurements' high standard deviation (SD).
To assess how well the thermal history retrieved for Ap-BaF-P1 (Fig. 6) fits the entire grain Apatite-BaF, we forward-modelled the measured 4He profiles that could not be inverted for thermal histories (Ap-BaF-P2 to Ap-BaF-P4) using the acceptable paths and best-fit path from Ap-BaF-P1 shown in Fig. 6d (Fig. C1). For Ap-BaF-P2, only a core-rim profile was measured. For display purposes, we modelled it as a c-axis symmetric profile (Fig. C1a). Ap-BaF-P4 is strongly asymmetric. We merge two core-rim profiles for forward-modelling at the grain centre (Sect. 2.6), leading to a significant jump in concentration (Fig. C1c).
Overall, the forward-modelled 4He profiles based on results from Ap-BaF-P1 fit the measured profiles Ap-BaF-P2 to Ap-BaF-P4 reasonably well. The best-fit cooling history for Ap-BaF-P1 results in a misfit between the forward modelled and measured 4He profiles of m=2.86 for Ap-BaF-P2, m=4.51 for Ap-BaF-P3, and m=4.27 for Ap-BaF-P4. The best-fit modelled profiles for each measured 4He profile have misfits of m=2.32 (Ap-BaF-P2), m=4.13 (Ap-BaF-P3) and m=3.32 (Ap-BaF-P4). When the centre measurement is excluded from the misfit calculation for Ap-BaF-P2 and Ap-BaF-P4, the misfits improve to m=1.89 and m=1.77, respectively.
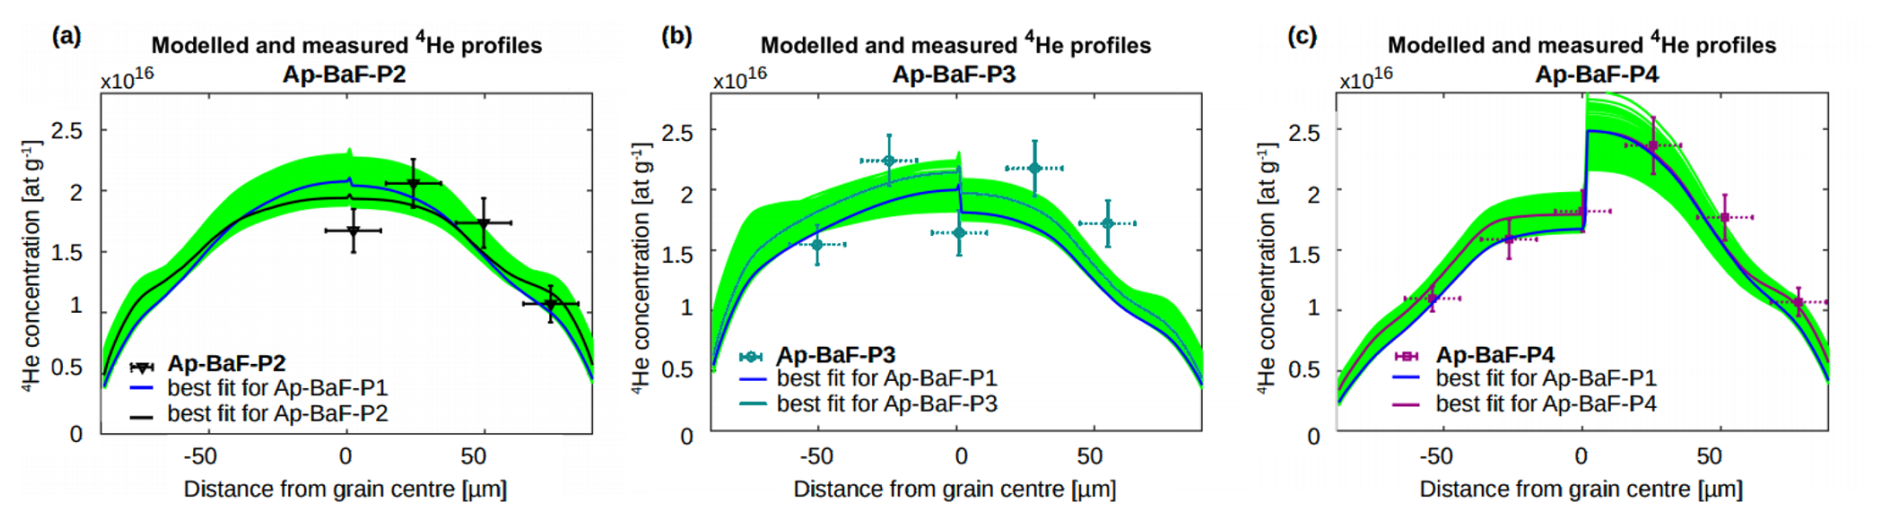
Figure C1Forward models for Ap-BaF-P2 to Ap-BaF-P4. The 4He profiles were forward-modelled based on the acceptable t–T paths of Ap-BaF-P1 (Fig. 6d). The modelled 4He concentration in the centre of the grain jumps because the forward models merge two core-rim profiles (Sect. 2.6). Green profiles are based on acceptable paths that represent a GOF > 5 % (Fig. 6). The 4He profiles with the lowest misfit m (Sect. 2.6, Eq. 2) are highlighted in the respective measured profile's colour. The profile in dark blue is based on the best-fit path of Ap-BaF-P1 (see Fig. 6d).
The code to calculate Caw, along with a test file, and supplementary data including all grain photomicrographs, He measurement details, and all U, Th, and Sm measurements, can be found here: https://doi.org/10.5281/zenodo.15856623 (Maier et al., 2025).
The supplement related to this article is available online at https://doi.org/10.5194/gchron-8-165-2026-supplement.
AKM: data curation, formal analysis, investigation, methodology, software, visualisation, writing – original draft; CG: conceptualisation, methodology, funding acquisition, resources, software, supervision, validation, writing – review and editing; SF: supervision, writing – review and editing.
The contact author has declared that none of the authors has any competing interests.
Publisher's note: Copernicus Publications remains neutral with regard to jurisdictional claims made in the text, published maps, institutional affiliations, or any other geographical representation in this paper. The authors bear the ultimate responsibility for providing appropriate place names. Views expressed in the text are those of the authors and do not necessarily reflect the views of the publisher.
We thank Dominic Raisch from the Petrology and Mineral Resources Research Group at the University of Tübingen for SEM imaging.
We thank Olga Yakubovich and Julien Amalberti for their detailed and constructive reviews, and Cécile Gautheron for editorial handling.
This study was supported by a grant from the Bundesgesellschaft für Endlagerung to Christoph Glotzbach (BGE – STAFuE-21-12-Klei), and funding for large equipment from the DFG (INST 37/1041-1 and 37/1207-1 FUGG).
Open-access funding was provided by the Helsinki University Library.
This paper was edited by Cecile Gautheron and reviewed by Olga Yakubovich and Julien Amalberti.
Alexander, E., Mickelson, G., and Lanphere, M.: MMhb-1: a new 40Ar-39Ar dating standard, Short Papers of the Fourth International Conference, Geochronology, Cosmochronology, and Isotope Geology, U.S. Geological Survey, 78, 6–8, 1978.
Anderson, A. J., Hodges, K. V., and van Soest, M. C.: Empirical constraints on the effects of radiation damage on helium diffusion in zircon, Geochimica et Cosmochimica Acta, 218, 308–322, https://doi.org/10.1016/j.gca.2017.09.006, 2017.
Ault, A. K. and Flowers, R. M.: Is apatite U-Th zonation information necessary for accurate interpretation of apatite (U-Th) He thermochronometry data?, Geochimica et Cosmochimica Acta, 79, 60–78, https://doi.org/10.1016/j.gca.2011.11.037, 2012.
Ault, A. K., Gautheron, C., and King, G. E.: Innovations in (U-Th) He, Fission Track, and Trapped Charge Thermochronometry with Applications to Earthquakes, Weathering, Surface-Mantle Connections, and the Growth and Decay of Mountains, Tectonics, 38, 3705–3739, https://doi.org/10.1029/2018TC005312, 2019.
Beucher, R., Brown, R. W., Roper, S., Stuart, F., and Persano, C.: Natural age dispersion arising from the analysis of broken crystals: Part II. Practical application to apatite (U-Th) He thermochronometry, Geochimica et Cosmochimica Acta, 120, 395–416, https://doi.org/10.1016/j.gca.2013.05.042, 2013.
Binder, T., Marks, M. A. W., Gerdes, A., Walter, B. F., Grimmer, J., Beranoaguirre, A., Wenzel, T., and Markl, G.: Two distinct age groups of melilitites, foidites, and basanites from the southern Central European Volcanic Province reflect lithospheric heterogeneity, International Journal of Earth Sciences, 112, 881–905, https://doi.org/10.1007/s00531-022-02278-y, 2023.
Boyce, J. W., Hodges, K. V., Olszewski, W. J., Jercinovic, M. J., Carpenter, B. D., and Reiners, P. W.: Laser microprobe (U-Th) He geochronology, Geochimica et Cosmochimica Acta, 70, 3031–3039, https://doi.org/10.1016/j.gca.2006.03.019, 2006.
Brown, R. W., Beucher, R., Roper, S., Persano, C., Stuart, F., and Fitzgerald, P.: Natural age dispersion arising from the analysis of broken crystals, Part I: Theoretical basis and implications for the apatite (U-Th) He Thermochronometer, Geochimica et Cosmochimica Acta, 122, 478–497, https://doi.org/10.1016/j.gca.2013.05.041, 2013.
Colleps, C. L., van der Beek, P. A., Amalberti, J., Denker, A., Tremblay, M. M., Bernard, M., Dittwald, A. H., and Bundesmann, J.: Improving the Accessibility and Efficiency of Proton Irradiations for 4He 3He Thermochronology, Geochemistry, Geophysics, Geosystems, 25, https://doi.org/10.1029/2023GC011334, 2024
Danišík, M., McInnes, B. I. A., Kirkland, C. L., McDonald, B. J., Evans, N. J., and Becker, T.: Seeing is believing: Visualization of He distribution in zircon and implications for thermal history reconstruction on single crystals, Science Advances, 3, 1–10, https://doi.org/10.1126/sciadv.1601121, 2017.
Djimbi, D. M., Gautheron, C., Roques, J., Tassan-Got, L., Gerin, C., and Simoni, E.: Impact of apatite chemical composition on (U-Th) He thermochronometry: An atomistic point of view, Geochimica et Cosmochimica Acta, 167, 162–176, https://doi.org/10.1016/j.gca.2015.06.017, 2015.
Ehlers, T. A.: Crustal Thermal Processes and the Interpretation of Thermochronometer Data, Reviews in Mineralogy and Geochemistry; 58, 315–350, https://doi.org/10.2138/rmg.2005.58.12, 2005.
Farley, K. A., Wolf, R. A., and Silver, L. T.: The effects of long alpha-stopping distances on (U-Th) He ages, Geochimica et Cosmochimica Acta, 60, 4223–4229, https://doi.org/10.1016/S0016-7037(96)00193-7, 1996.
Farley, K. A.: (U-Th) He Dating: Techniques, Calibrations, and Applications, Mineralogy and Geochemistry, 47, 819–844, https://doi.org/10.2138/rmg.2002.47.18, 2002.
Farley, K. A., Shuster, D. L., Watson, E. B., Wanser, K. H., and Balco, G.: Numerical investigations of apatite 4He 3He thermochronometry, Geochemistry, Geophysics, Geosystems, 11, 1–18, https://doi.org/10.1029/2010GC003243, 2010.
Farley, K. A., Shuster, D. L., and Ketcham, R. A.: U and Th zonation in apatite observed by laser ablation ICPMS, and implications for the (U-Th) He system, Geochimica et Cosmochimica Acta, 75, 4515–4530, https://doi.org/10.1016/j.gca.2011.05.020, 2011.
Fitzgerald, P. G., Baldwin, S. L., Webb, L. E., and O'Sullivan, P. B.: Interpretation of (U-Th) He single grain ages from slowly cooled crustal terranes: A case study from the Transantarctic Mountains of southern Victoria Land, Chemical Geology, 225, 91–120, https://doi.org/10.1016/j.chemgeo.2005.09.001, 2006.
Flowers, R. M.: Exploiting radiation damage control on apatite (U-Th) He dates in cratonic regions, Earth and Planetary Science Letters, 277, 148–155, https://doi.org/10.1016/j.epsl.2008.10.005, 2009.
Flowers, R. M., and Kelley, S. A.: Interpreting data dispersion and “inverted” dates in apatite (U-Th) He and fission-track datasets: An example from the US midcontinent, Geochimica et Cosmochimica Acta, 75, 5169–5186, https://doi.org/10.1016/j.gca.2011.06.016, 2011.
Flowers, R. M., Ketcham, R. A., Shuster, D. L., and Farley, K. A.: Apatite (U-Th) He thermochronometry using a radiation damage accumulation and annealing model, Geochimica et Cosmochimica Acta, 73, 2347–2365, https://doi.org/10.1016/j.gca.2009.01.015, 2009.
Fox, M., Tripathy-Lang, A., and Shuster, D. L.: Improved spatial resolution of elemental maps through inversion of LA-ICP-MS data, Chemical Geology, 467, 30–4, https://doi.org/10.1016/j.chemgeo.2017.07.001, 2017.
Gautheron, C., Tassan-Got, L., Ketcham, R. A., and Dobson, K. J.: Accounting for long alpha-particle stopping distances in (U–Th–Sm) He geochronology: 3D modeling of diffusion, zoning, implantation, and abrasion, Geochimica et Cosmochimica Acta, 96, 44–56, https://doi.org/10.1016/j.gca.2012.08.016, 2012.
Gautheron, C., Pinna-Jamme, R., Derycke, A., Ahadi, F., Sanchez, C., Haurine, F., Monvoisin, G., Barbosa, D., Delpech, G., Maltese, J., Sarda, P., and Tassan-Got, L.: Technical note: Analytical protocols and performance for apatite and zircon (U–Th) He analysis on quadrupole and magnetic sector mass spectrometer systems between 2007 and 2020, Geochronology, 3, 351–370, https://doi.org/10.5194/gchron-3-351-2021, 2021.
Gerin, C., Gautheron, C., Oliviero, E., Bachelet, C., Mbongo Djimbi, D., Seydoux-Guillaume, A. M., Tassan-Got, L., Sarda, P., Roques, J., and Garrido, F.: Influence of vacancy damage on He diffusion in apatite, investigated at atomic to mineralogical scales, Geochimica et Cosmochimica Acta, 197, 87–103, https://doi.org/10.1016/j.gca.2016.10.018, 2017.
Glotzbach, C. and Ehlers, T. A.: Interpreting cooling dates and histories from laser ablation in situ (U–Th–Sm) He thermochronometry: a modelling perspective, Geochronology, 6, 697–717, https://doi.org/10.5194/gchron-6-697-2024, 2024.
Glotzbach, C., Lang, K. A., Avdievitch, N. N., and Ehlers, T. A.: Increasing the accuracy of (U-Th(Sm)) He dating with 3D grain modelling, Chemical Geology, 506, 113–125, https://doi.org/10.1016/j.chemgeo.2018.12.032, 2019.
Guenthner, W. R., Reiners, P. W., Ketcham, R. A., Nasdala, L., and Giester, G.: Helium diffusion in natural zircon: radiation damage, anisotropy, and the interpretation of zircon (U-TH) He thermochronology, American Journal of Science, 313, 145–198, https://doi.org/10.2475/03.2013.01, 2013.
Hansen, P. C. and O'Leary, D. P.: The Use of the L-Curve in the Regularization of Discrete Ill-Posed Problems, SIAM Journal on Scientific Computing, 14, 1487–1503, https://doi.org/10.1137/0914086, 1993.
Horne, A. M., van Soest, M. C., Hodges, K. V., Tripathy-Lang, A., and Hourigan, J. K.: Integrated single crystal laser ablation U Pb and (U-Th) He dating of detrital accessory minerals - Proof-of concept studies of titanites and zircons from the Fish Canyon tuff, Geochimica et Cosmochimica Acta, 178, 106–123, https://doi.org/10.1016/j.gca.2015.11.044, 2016.
Idleman, B. D., Zeitler, P. K., and McDannell, K. T.: Characterization of helium release from apatite by continuous ramped heating, Chemical Geology, 476, 223–232, https://doi.org/10.1016/j.chemgeo.2017.11.019, 2018.
Ketcham, R. A.: Forward and inverse modeling of low-temperature thermochronometry data, Reviews in Mineralogy and Geochemistry, 58, 275–314, https://doi.org/10.2138/rmg.2005.58.11, 2005.
Ketcham, R. A.: Thermal history inversion from thermochronometric data and complementary information: New methods and recommended practices, Chemical Geology, 653, 122042, https://doi.org/10.1016/j.chemgeo.2024.122042, 2024.
Ketcham, R. A., Gautheron, C., and Tassan-Got, L.: Accounting for long alpha-particle stopping distances in (U-Th-Sm) He geochronology: Refinement of the baseline case, Geochimica et Cosmochimica Acta, 75, 7779–7791, https://doi.org/10.1016/j.gca.2011.10.011, 2011.
Ketcham, R. A., Mora, A., and Parra, M.: Deciphering exhumation and burial history with multi-sample down-well thermochronometric inverse modelling, Basin Research, 30, 48–64, https://doi.org/10.1111/bre.12207, 2018.
Maier, A.-K., Glotzbach, C., and Falkowski, S.: Code and data supplement: Analytical and modelling strategies for thermal histories from in situ (U-Th-Sm) He data of single apatites, Zenodo [data set], https://doi.org/10.5281/zenodo.15856623, 2025.
McDowell, F. W., Mcintosh, W. C., and Farley, K. A.: A precise 40Ar–39Ar reference age for the Durango apatite (U–Th) He and fission-track dating standard, Chemical Geology, 214, 249–263, https://doi.org/10.1016/j.chemgeo.2004.10.002, 2005.
McInnes, B. I. A., Evans, N. J., Fu, F. Q., and Garwin, S.: Application of thermochronology to hydrothermal ore deposits, Reviews in Mineralogy and Geochemistry, 58, 467–498, https://doi.org/10.2138/rmg.2005.58.18, 2005.
Paton, C., Woodhead, J. D., Hellstrom, J. C., Hergt, J. M., Greig, A., and Maas, R.: Improved laser ablation U-Pb zircon geochronology through robust downhole fractionation correction, Geochemistry, Geophysics, Geosystems, 11, Q0AA06, https://doi.org/10.1029/2009GC002618, 2010.
Pickering, J., Matthews, W., Enkelmann, E., Guest, B., Sykes, C., and Koblinger, B. M.: Laser ablation (U-Th-Sm) He dating of detrital apatite, Chemical Geology, 548, 119683, https://doi.org/10.1016/j.chemgeo.2020.119683, 2020.
Reiners, P. W. and Farley, K. A.: Influence of crystal size on apatite (U-Th) He thermochronology: An example from the Bighorn Mountains, Wyoming, Earth and Planetary Science Letters, 188, 413–420, https://doi.org/10.1016/S0012-821X(01)00341-7, 2001.
Schoene, B. and Bowring, S. A.: U-Pb systematics of the McClure Mountain syenite: Thermochronological constraints on the age of the 40Ar 39Ar standard MMhb, Contributions to Mineralogy and Petrology, 151, 615–630, https://doi.org/10.1007/s00410-006-0077-4, 2006.
Shan, J., Min, K., and Nouiri, A.: Thermal effects of scanning electron microscopy on He diffusion in apatite : Implications for (U-Th)He dating. Chemical Geology, 345, 113–118, https://doi.org/10.1016/j.chemgeo.2013.03.001, 2013.
Shuster, D. L. and Farley, K. A.: 4He 3He thermochronometry, Earth and Planetary Science Letters, 217, 1–17, https://doi.org/10.1016/S0012-821X(03)00595-8, 2004.
Shuster, D. L., Flowers, R. M., and Farley, K. A.: The influence of natural radiation damage on helium diffusion kinetics in apatite, Earth and Planetary Science Letters, 249, 148–161, https://doi.org/10.1016/j.epsl.2006.07.028, 2006.
Sousa, F. J., Cox, S. E., Rasbury, E. T., Hemming, S. R., Lanzirotti, A., and Newville, M.: U and Th zonation in apatite observed by synchrotron X-ray fluorescence tomography and implications for the (U–Th) He system, Geochronology, 6, 553–570, https://doi.org/10.5194/gchron-6-553-2024, 2024.
Spiegel, C., Kohn, B., Belton, D., Berner, Z., and Gleadow, A.: Apatite (U-Th-Sm) He thermochronology of rapidly cooled samples: The effect of He implantation, Earth and Planetary Science Letters, 285, 105–114, https://doi.org/10.1016/j.epsl.2009.05.045, 2009.
Vamvaka, A., Siebel, W., Chen, F., and Rohrmüller, J.: Apatite fission-track dating and low temperature history of the Bavarian Forest (southern Bohemian Massif), International Journal of Earth Sciences, 103, 103–119, https://doi.org/10.1007/s00531-013-0945-x, 2014.
Vermeesch, P., Seward, D., Latkoczy, C., Wipf, M., Günther, D., and Baur, H.: α-Emitting mineral inclusions in apatite, their effect on (U-Th) He ages, and how to reduce it, Geochimica et Cosmochimica Acta, 71, 1737–1746, https://doi.org/10.1016/j.gca.2006.09.020, 2007.
Vermeesch, P., Sherlock, S. C., Roberts, N. M. W., and Carter, A.: A simple method for in-situ U-Th-He dating, Geochimica et Cosmochimica Acta, 79, 140–147, https://doi.org/10.1016/j.gca.2011.11.042, 2012.
Vermeesch, P., Tian, Y., Schwanethal, J., and Buret, Y.: Technical note: In situ U–Th–He dating by 4He 3He laser microprobe analysis, Geochronology, 5, 323–332, https://doi.org/10.5194/gchron-5-323-2023, 2023.
Wolf, R. A., Farley, K. A., and Silver, L. T.: Helium diffusion and low-temperature thermochronometry of apatite, Geochimica et Cosmochimica Acta, 60, 4231–4240, https://doi.org/10.1016/S0016-7037(96)00192-5, 1996.
Wolf, R. A., Farley, K. A., and Kass, D. M.: Modeling of the temperature sensitivity of the apatite (U-Th) He thermochronometer, Chemical Geology, 148, 105–114, https://doi.org/10.1016/S0009-2541(98)00024-2, 1998.
Zeitler, P. K., Herczeg, A. L., McDougall, I., and Honda, M.: U-Th-He dating of apatite: A potential Thermochronometer, Geochimica et Cosmochimica Acta, 51, 2865–2868, https://doi.org/10.1016/0016-7037(87)90164-5, 1987.
Zeitler, P. K., Enkelmann, E., Thomas, J. B., Watson, E. B., Ancuta, L. D., and Idleman, B. D.: Solubility and trapping of helium in apatite, Geochimica et Cosmochimica Acta, 209, 1–8, https://doi.org/10.1016/j.gca.2017.03.041, 2017
- Abstract
- Introduction
- Methods
- Results
- Discussion
- Conclusions
- Appendix A: Additional interpolated parent nuclide maps of Apatite-URG and Apatite-McClure
- Appendix B: Apatite in situ 4He measurements
- Appendix C: Apatite-BaF forward-modelled 4He profiles
- Code and data availability
- Author contributions
- Competing interests
- Disclaimer
- Acknowledgements
- Financial support
- Review statement
- References
- Supplement