the Creative Commons Attribution 4.0 License.
the Creative Commons Attribution 4.0 License.
 | 16 Jan 2026
Cosmogenic 3He exposure dating in mafic rocks by “Virtual mineral separation” of pyroxene
Greg Balco
Richard A. Ketcham
We describe a “virtual mineral separation” method for measuring the cosmogenic 3He concentration in pyroxene in mafic rocks that consist mainly of plagioclase and pyroxene, without physically separating the minerals. This approach is significantly faster and more cost-effective than the conventional method, which requires physical separation and purification of pyroxene grains by time-consuming and labor-intensive crushing, acid cleaning, magnetic separation, HF etching, and handpicking under a microscope. The premise of the method is that helium diffusivity is much higher in plagioclase than in pyroxene, so controlled preheating of a mixed whole-rock sample can degas 3He from plagioclase while retaining all 3He in pyroxene. A second heating step releases all 3He from pyroxene for measurement. To then obtain a 3He concentration in pyroxene rather than the whole rock, we determine the pyroxene weight fraction in the sample using X-ray computed tomography (CT). A comparison of 3He concentrations in pyroxene measured using virtual mineral separation with those measured in the same samples by physical mineral separation in previous work shows no evidence of systematic bias between the methods. Virtual mineral separation greatly simplifies the workflow for 3He exposure-dating of mafic rocks, reduces time, effort, and cost, and permits measurements on very small samples. This enables new emerging applications of exposure dating, such as quantifying stochastic surface processes, ecosystem studies, and potential subglacial bedrock exposure dating.
- Article
(2378 KB) - Full-text XML
- Companion paper
-
Supplement
(405 KB) - BibTeX
- EndNote


In this paper we develop a method for measuring the cosmogenic 3He concentration in pyroxene in mafic rocks without physically separating the pyroxene. The stable cosmogenic nuclide 3He is commonly used in mafic rocks for exposure dating, as it is retained in pyroxene and easily measured using a noble gas mass spectrometer (e.g. Kurz, 1986; Cerling, 1990; Balter-Kennedy et al., 2020). This makes cosmogenic 3He exposure dating more economical compared to other costlier nuclides relying on accelerator mass spectrometry (such as cosmogenic 10Be, 26Al, and 36Cl). However, the sample preparation to obtain pure pyroxene separates is time-consuming and tedious, and often results in under-constrained inclusion of impurities (Bromley et al., 2014).
At present, the procedure for measuring cosmogenic 3He in pyroxene has two steps: separation and purification of pyroxene separates, followed by heating of the pyroxene separates under vacuum and analysis of the released helium in a noble gas mass spectrometer. The second step of this process (vacuum degassing and mass spectrometry) is rapid, efficient, and fully automated at many laboratories. For example, the system in use at Berkeley Geochronology Center (BGC) has a typical continuous throughput of 10–12 samples d−1, with approximately 1 h d−1 of operator time needed for sample changes, for a two-heating-step 3He analysis with associated standards and blanks.
In contrast, the first step of pyroxene separation is time-consuming and labor-intensive, and requires crushing and sieving of a rock sample, acid cleaning of the crushed rock, heavy liquid and/or magnetic separation to concentrate pyroxene, and HF etching to remove adhering plagioclase. Pyroxene purification is typically finalized by additional magnetic separation and hand-picking (e.g. Kurz, 1986; Brook et al., 1995; Bruno et al., 1997; Licciardi et al., 1999; Schäfer et al., 1999; Blard et al., 2009; Bromley et al., 2014), making the resulting purity subjective and difficult to quantify. This is critical as the presence of non-helium-retentive impurities such as plagioclase (Cerling, 1990) can lead to an overestimation of sample mass and, consequently, an underestimation of measured 3He concentration. The process becomes inherently more tedious in fine-grained rocks where monocrystalline grains are difficult to obtain. None of these pyroxene separation steps are automated; several require hazardous chemicals, and some require a trained technician. Therefore, the primary limitation in collecting large data sets of 3He concentrations in pyroxene is the process of mineral separation.
Plagioclase, commonly found with pyroxene as the major constituents of many mafic rocks, was first determined by Cerling (1990) to be non-retentive of 3He, noting that this potentially causes problems for 3He exposure dating in whole rock. However, in a mafic rock that predominantly consists of pyroxene and plagioclase, the contrast in 3He retentivity could be advantageous. In recent work, Bergelin et al. (2025) quantified the observation that 3He is poorly retained in plagioclase by measuring diffusion kinetics of helium in both plagioclase and pyroxene. This result can be used to develop a method for degassing 3He from plagioclase in a single heating step, without degassing the 3He retained in the pyroxene, prior to cosmogenic 3He analysis, leading to what we refer to as a “virtual mineral separation”. The required temperature and duration for such a separation can be determined using the measured diffusion kinetics (Bergelin et al., 2025) of both minerals and forward calculation of the fraction release (Fechtig and Kalbitzer, 1966).
A virtual mineral separation method would eliminate the initial labor-intensive step of physically isolating pyroxene from whole-rock samples. Instead, 3He is measured directly in pyroxene within a whole rock sample following a preheating which degasses 3He from the less retentive plagioclase. However, doing so results in a 3He concentration which has units of [atoms 3He in pyroxene] [g rock]−1. Therefore, to use the virtual mineral separation method for an exposure dating application, it is necessary to convert this measurement to a 3He concentration in pyroxene ([atoms 3He in pyroxene] [g pyroxene]−1). This requires independent determination of the pyroxene weight fraction ([g pyroxene] [g rock]−1). To preserve the efficiency of the virtual mineral separation, this procedure must also be rapid and efficient. X-ray computed tomography (CT) is advantageous for this purpose as it can identify mineral grains and quantify shape and volume separately or within aggregates (Cooperdock et al., 2022; e.g. Hofmann et al., 2021). A key advantage is that CT scanning can be applied directly to the same 100 mg-scale aliquot degassed for 3He measurements, and many aliquots can be scanned simultaneously, making it a cost-effective and high-throughput step. Although CT scanning has not been used for this specific purpose before, the difference in density between pyroxene (3.2–3.5 g cm−3) and plagioclase (2.6–2.8 g cm−3) indicates that they should be easily differentiable.
This project has multiple components to it, which we have divided into three separate sections that describe methods and process validation results for each component. First, we use diffusion kinetics of He in pyroxene and plagioclase recently measured by Bergelin et al. (2025) to design a heating schedule that separates 3He in plagioclase from that in pyroxene and perform experiments to show that it is effective. Second, we determine the weight fraction of pyroxene in the whole-rock sample through CT scanning. And third, we apply the virtual mineral separation method to a large set of exposure-dating samples and compare the results to existing 3He measurements in pyroxene separates (Balter-Kennedy et al., 2020).
The main objective of this study is to make measurements of 3He in pyroxene from mafic rock faster and more efficient by a virtual mineral separation method. For this purpose, we focus on the Ferrar Dolerite, an intrusive gabbroic rock found throughout the Transantarctic Mountains (TAM) in Antarctica that predominantly consists of subequal parts of plagioclase and pyroxene, with minor contributions from other mineral phases (Elliot and Fleming, 2021). Its commonly fine-grained texture makes physical pyroxene separation challenging, making it an ideal candidate for the virtual mineral separation approach. Due to its resistance to weathering, the Ferrar dolerite is one of the most common surface lithologies in Antarctica, and therefore commonly used for exposure-dating studies. The success of this study could enable applications in quantifying stochastic surface processes, ecosystem studies, and potential subglacial bedrock exposure dating. Further, it could be relevant to various other lithologies in Antarctica and elsewhere and potentially transformative for science applications that require large data sets of exposure ages. It would not be as transformative as in-situ exposure dating in the field (Farley et al., 2014), but it would be a step in the same direction.
2.1 Diffusion kinetics of pyroxene and plagioclase
The diffusion kinetics of noble gases in a mineral can be determined through stepwise degassing of a single grain irradiated with neutrons or protons to produce an initial homogeneous distribution of gas. In a recent study, Bergelin et al. (2025) found the diffusion kinetics of 3He in irradiated plagioclase and pyroxene grains from the Ferrar Dolerite to be vastly different, as expected from previous observations of missing 3He in plagioclase (Eberhardt et al., 1966; Cerling, 1990). Here, we perform an additional experiment to show how this difference in diffusion kinetics between plagioclase and pyroxene causes the minerals to degas 3He separately. We conducted prograde step-heating experiments on (i) individual proton-irradiated plagioclase (LABCO-Plag) and pyroxene (LABCO-Px) grains obtained from the same sample set analysed in Bergelin et al. (2025), and (ii) a crushed whole-rock sample of Ferrar Dolerite (15-OTW-049-CHA, described by Bromley et al., 2025), that contains a mixture of pyroxene and plagioclase grains, and has an apparent 3He exposure age of 8.4 Ma, making the naturally produced 3He concentration adequate for a step-degassing experiment. The whole-rock sample was crushed and sieved to a grain size of 100–160 µm, then washed in water and leached in 10 % HCl overnight at room temperature. Once dried, 7.06 mg of bulk sample grains were packed into a small (∼5 mm) Pt-Ir alloy package. For all three experiments, we used a consistent heating schedule and the exact experimental setup and measurement procedure described in Bergelin et al. (2025; see Table S1).
In Fig. 1, we show the fractional release of 3He during the three step-heating experiments, emphasizing the distinctive difference in gas release between plagioclase and pyroxene. At 260 °C (step 29), the plagioclase sample had released 97 % of its 3He, compared to only 2 % from the pyroxene sample and 3 % from the bulk whole-rock sample. Interestingly, the naturally irradiated bulk whole-rock grains (15-OTW-049-CHA) display a 3He release pattern similar to that of pyroxene, despite consisting of subequal parts of plagioclase and pyroxene. Given that 3He is incompletely retained in plagioclase at Earth surface temperatures, and the extended exposure time of this particular sample, most of the 3He produced in plagioclase appears to have been lost during surface exposure (Bergelin et al., 2025).
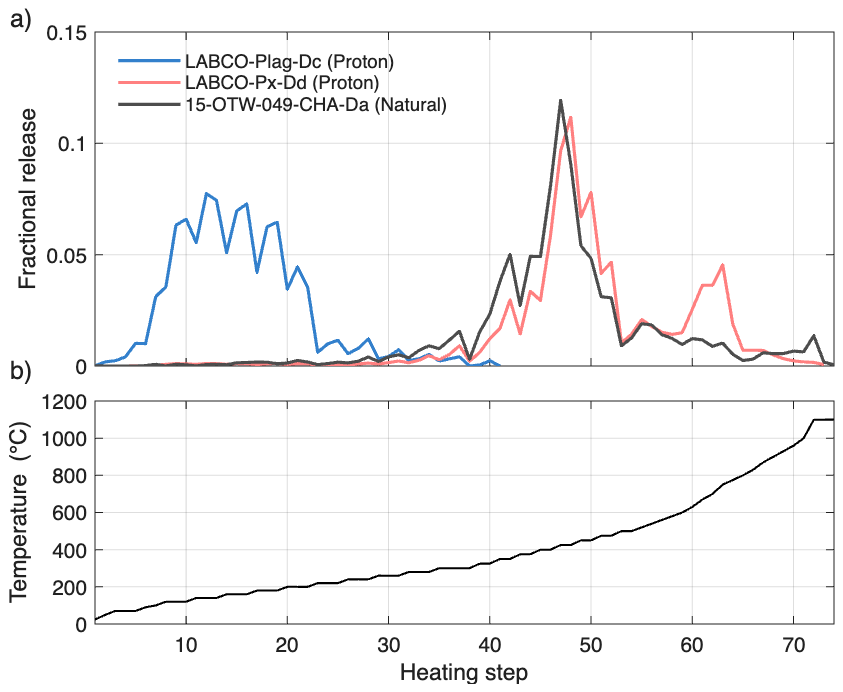
Figure 1Step heating analysis of proton-irradiated, single grains of Ferrar dolerite plagioclase (blue), pyroxene (red), and naturally cosmic-ray irradiated, crushed Ferrar dolerite containing a mixture of plagioclase and pyroxene grains (black). Each of the three degassing experiments experienced the same heating schedule. (a) shows the fractional release of 3He atoms, and (b) shows the temperature reached during each heating step. Note that the duration of each step varies, which is not shown in this figure (Table S1).
We use the diffusion kinetics for plagioclase and pyroxene, as determined by Bergelin et al. (2025), to model the predicted fractional release of 3He from these minerals during a single heating step (Fig. 2). The fractional gas release is calculated using a Multiple Diffusion Domain (MDD) model (Lovera et al., 1989; Lovera et al., 1997), following the fractional loss equations of Fechtig and Kalbitzer (1966, Eq. 4a–c). While there is a large difference between 3He diffusion kinetics for plagioclase and pyroxene, there are also smaller variations in diffusivity within each mineral group due to compositional differences (Tremblay et al., 2017; Bergelin et al., 2025). Given that the single-step heating schedule is intended for bulk samples, where individual mineral grains may exhibit compositional heterogeneity, we evaluate the effective temperature and time ranges by considering both the highest and lowest diffusivities determined from each mineral group. The fractional release of 3He from plagioclase and pyroxene during a single-step heating schedule is then estimated based on the most diffusive pyroxene and most retentive plagioclase kinetics, which represents a least-effective-case scenario for designing the separation procedure. For plagioclase, this estimation uses the diffusion kinetics determined from grains of Ferrar Dolerite (ROB-plag; see discussion in Bergelin et al., 2025). However, for pyroxene, this includes diffusion kinetics obtained from grains of Ferrar dolerite pyroxene (LABCO-Px and ROB-Px) and gem-quality pyroxene grains (Bergelin et al., 2025).
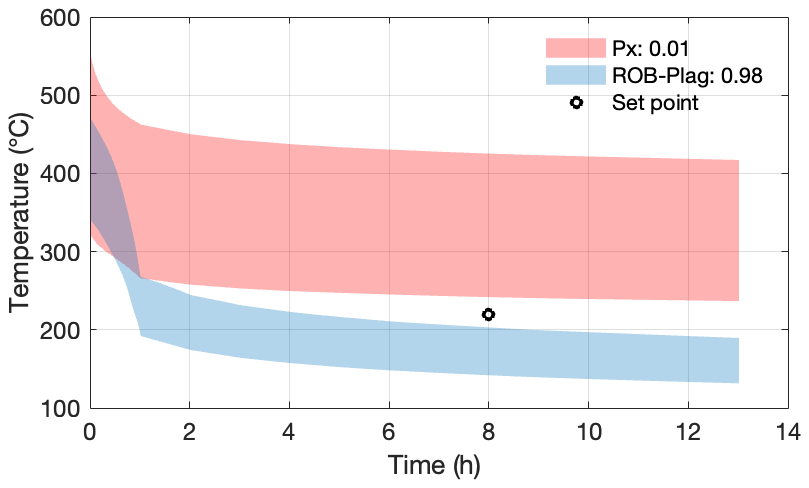
Figure 2Area of temperature and time combination between the most and least retentive 3He mineral phases within pyroxene (red) and plagioclase (blue) for a fractional gas loss of 0.01 and 0.98, respectively. For plagioclase, the temperature-time range is based on the diffusion kinetics determined from grains of the Ferrar Dolerite, ROB-plag (Bergelin et al., 2025). For pyroxene, the range includes diffusion kinetics obtained for grains of Ferrar dolerite pyroxene (LABCO-Px and ROB-Px) and gem-quality pyroxene (GEM-Px) grains (Bergelin et al., 2025). The grain size radius used to determine the diffusion kinetics range from 108–168 µm. Any temperature-time combinations above the blue shade are expected to degas >0.98, and any combinations below the red shade are expected to degas <0.01 of the total 3He in each mineral phase. The area below the red shade and above the blue shade represents the temperature and time field to separate 3He released from plagioclase, without releasing 3He from pyroxene. The black dot shows the temperature and time combination that we use in this experiment, and is suitable for a standard vacuum oven.
Figure 2 shows that a single heating step at 220 °C for a duration of 8 h is theoretically sufficient to degas more than 98 % of 3He from plagioclase while retaining over 99 % of 3He in pyroxene, even for the least-effective case represented by the least retentive pyroxene and most retentive plagioclase. This results in an effective separation of 3He between the two minerals. Although comparable separation efficiency can be achieved by, e.g. increasing the temperature and reducing the duration, the maximum temperature is constrained by the operational limit of standard vacuum ovens (<250 °C).
2.2 Validation of established single-step heating schedule
To assess whether a single heating step effectively separates 3He released from plagioclase and pyroxene, we compared 3He concentration from multiple preheated and un-preheated individual grains of each mineral from the Ferrar Dolerite (ROB, Bergelin et al., 2025). These grains were proton-irradiated, resulting in an elevated 3He concentration detectable within single grains, and immediately frozen post-irradiation until analysis to prevent gas loss (the purpose of this procedure is described in Bergelin et al., 2025). The 3He concentrations from equivalent un-preheated grains of proton-irradiated plagioclase and pyroxene were obtained from degassing experiments already described in Bergelin et al. (2025). Here, we subjected similar grains from the same sample set to a single-preheating step prior to analysis for comparison, as described below.
The set of four preheated samples consists of two ROB-plagioclase grains and two ROB-pyroxene grains. Each grain was weighed before analysis, packed into a small Ta package, and placed in an AccuTemp 0.9 cft (AT09) vacuum oven. The oven was then put under vacuum at torr to prevent oxidation of the sample and package or diffusion of atmospheric gases into the sample. In addition to the oven's built-in temperature monitoring, two type-K thermocouples were installed inside: One was affixed to the oven shelf surface, while the other was placed inside a blank Ta package positioned adjacent to the samples. Both thermocouples were wired through the oven door and sealed with self-fusing silicone tape. The four samples were heated at 220 °C for 8 h as established above.
The total 3He concentration in all four preheated sample grains was then measured using the BGC “Ohio” noble gas mass spectrometer following the procedure described in Balter-Kennedy et al. (2020). The total 3He concentration in the un-preheated plagioclase and pyroxene grains was calculated from the total amount of 3He measured during the step-heating diffusion experiment conducted by Bergelin et al. (2025; Supplement). As the irradiation-induced 3He production is likely to vary among the grains because of spatial variability in the proton flux, we do not expect identical 3He concentrations in all sample grains. However, this assessment is meant to provide preliminary evidence of the effectiveness of the single-step heating schedule.
Table 1Measured 3He in proton-irradiated plagioclase and pyroxene grains from Ferrar Dolerite sample ROB (Bergelin et al., 2025).
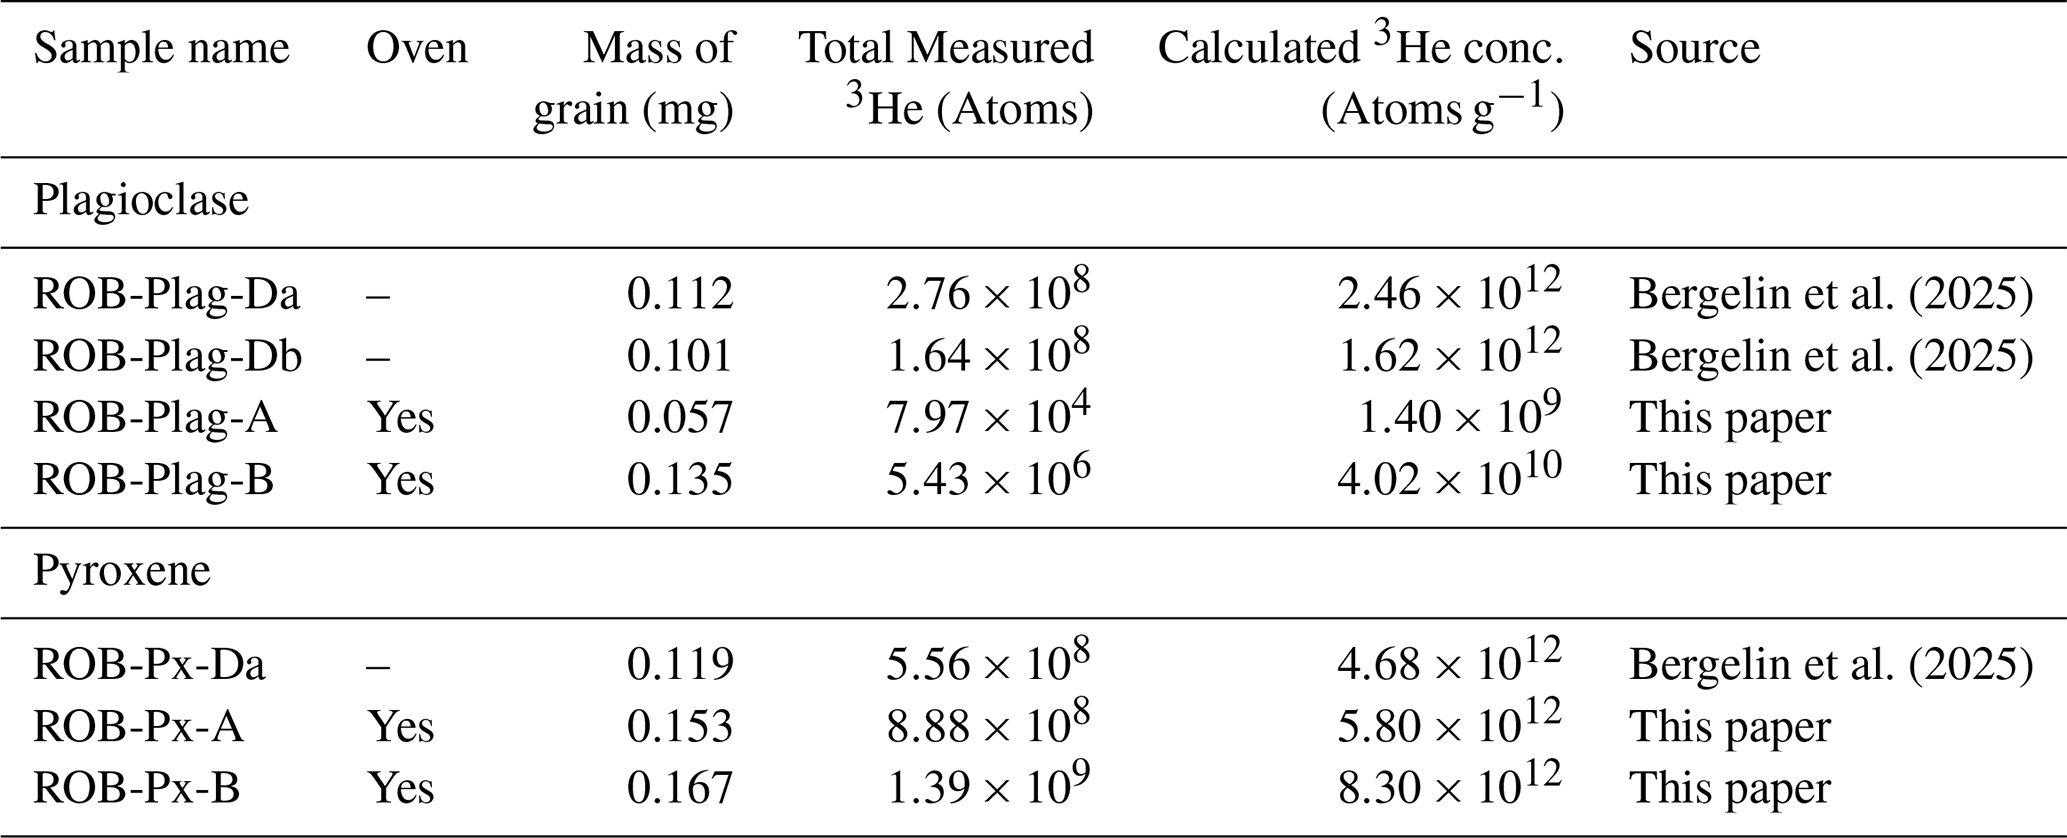
Table 1 shows the amount of 3He measured in all seven sample grains. Preheating plagioclase grains prior to analysis decreases the 3He concentration by at least two orders of magnitude, indicating a gas loss of more than 98 %. In contrast, we find that pyroxene grains that were subjected to the same preheating had equivalent to slightly higher concentrations than the grains that were not preheated. These results are consistent with predictions in Fig. 2, confirming that a single 8 h heating at 220 °C effectively degasses 3He from plagioclase while retaining it in pyroxene. When applied to bulk whole-rock material, this established single-step heating schedule provides the basis for the virtual mineral separation of 3He in pyroxene from mafic rocks without physically having to separate and isolate pyroxene grains.
3.1 Sample description and preparation
We apply the virtual mineral separation method to a total of 36 samples that have known concentrations of 3He in pyroxene from previous measurements in pyroxene separates (Balter-Kennedy et al., 2020; Bromley et al., 2025). All samples belong to the Ferrar dolerite, a mafic intrusive rock consisting primarily of calcic plagioclase and several orthopyroxenes and clinopyroxenes (Elliot and Fleming, 2021). These samples are from high-elevation surface boulders collected from various moraines near Roberts (ROB) and Otway (OTW) Massif in the central Transantarctic Mountains (TAM), and have apparent 3He-in-pyroxene exposure ages ranging from 1 to 11 Ma (see Balter-Kennedy et al., 2020; Bromley et al., 2025, for details).
Sample preparation for previously published 3He measurements on pyroxene separates from these rocks (Balter-Kennedy et al., 2020; Bromley et al., 2025) involved the following steps: Crushed rock samples were sieved to a 125–250 µm grain size fraction, and boiled for 2 h in 10 % HNO3. Pyroxene grains were then separated from plagioclase using a water-based heavy liquid, followed by etching in 5 % HF to dissolve any adhering plagioclase and remove the outer surface of the pyroxene grain. The etched pyroxene grains were passed through a magnetic separator and handpicked under a binocular microscope to remove any remaining contaminants. Finally, pyroxene grains were packed into Ta packages for cosmogenic 3He analysis.
In contrast, the virtual mineral separation method does not require physical separation and purification of the pyroxene grains. Instead, we hand-crushed and sieved a small rock sample to a 90–150 µm grain size fraction. This smaller grain size fraction maximizes monocrystalline grains and is advantageous for CT scanning, as each grain is more likely to consist of only plagioclase or pyroxene. The grains were then rinsed and sonicated in water for 1 h to remove any dust particles from crushing. After drying, 40–80 mg of the bulk whole-rock grains were directly packed into 1 mL vials for X-ray CT scanning. The sample mass was selected based on prior measurements of 4He in pyroxene separates to yield a total 4He abundance within the pressure range of the gas standards used to calibrate the mass spectrometer (Balter-Kennedy et al., 2020; Bromley et al., 2025).
In addition to these 36 samples, we included several supplementary samples to evaluate the efficacy and limitations of the virtual mineral separation method. (i) To assess reproducibility, we prepared multiple aliquots from two whole-rock samples: 15-OTW-21-DUT and 15-OTW-47-CHA. (ii) To test whether crushing is necessary, we packaged aliquots of a whole rock chip (<100 mg) directly into a 1 mL vial from sample 16-ROB-052-BAS. This represents minimal sample processing and eliminates crushing. (iii) To validate the CT-based image processing workflow and the weight percent calculation, we included a set of control samples derived from 15-ROB-56-NAC and 16-ROB-72-MNM, having known proportions of plagioclase and pyroxene grains. These control samples were prepared by crushing whole-rock material, followed by sieving, sonication in water, and leaching in 10 % HCl. Mineral separation was then achieved by repeated passes through a magnetic separator. Pyroxene separates were subsequently etched in 5 % HF and 1 % HNO3 to remove any adhering plagioclase. Final purification involved handpicking under a binocular microscope to remove any remaining impurities. Each control sample consisted of 100 mg of precisely weighed mineral separates, containing a known amount between 30 %–45 % plagioclase.
3.2 CT scan
The sample vials were CT scanned in batches of 7–8 samples at the University of Texas High-Resolution X-ray Computed Tomography Facility (UTCT) in Austin, TX, using the Zeiss Xradia 620 Versa system. Scans were performed with the X-ray source set to 80 kV and 10 W and utilizing a low-energy beam filter, collecting 3201 projections through a 360° rotation with an acquisition time of 0.3 s per projection and stage motion between projections (dithering) to reduce ring artifacts, with a total scan time of 56 min per batch. A beam-hardening correction was applied during reconstruction with Zeiss software, which provided stacks of up to 1200 16 bit TIFF images with a voxel resolution of 7.99 µm. Each voxel value reflects the X-ray attenuation, which is a function of density, atomic number, and the X-ray energy spectrum, and is represented in a greyscale ranging from 0 to 65,535. From each image stack, each sample was individually cropped and processed (Fig. 3).

Figure 3Computed tomography (CT) image and voxel classification of whole rock grain sample of Ferrar dolerite, 15-ROB-028-COL (Z). CT images (a) and (b) show the vertical and horizontal scans of the sample packed in a 1 mL vial. These grey-scale CT images show the three mineral phases: oxides (white), pyroxene (light grey), and plagioclase (dark grey), surrounded by air (black). The histogram from a representative subvolume (c) shows the distribution of CT number and the classification of each mineral phase determined and highlighted in red for (d) oxides, (e) pyroxene, and (f) plagioclase. The workflow outlined represents the workflow applied to all samples.
For each sample, we observe a frequency distribution of CT numbers with multiple characteristic peaks of distinct X-ray attenuation (Fig. 3c), that we interpret as air, plagioclase (plag), and pyroxene (px), with a tail of high-density minerals (ox; interpreted as oxides). Although distinct CT number variations were observed within individual mineral groups (suggesting potential sub-classification), we did not attempt to differentiate between mineral phases beyond the three primary groups, as this was mostly manifested by a wider peak in the histogram (e.g., pyroxene phase in Fig. 3c), rather than two separate peaks.
We created a workflow using the freely distributed software Blob3D, which was written for CT data processing (Ketcham, 2005; Ketcham and Mote, 2019). The segmentation of the CT data to differentiate pyroxene, plagioclase, and other phases is not straightforward, and cannot be done accurately utilizing simple histogram analysis. Although the voxel size is ∼8 µm, the boundary between any two phases, or a phase and air, spans multiple voxels due to the finite resolution of the data; for the data in this study, the point-spread function (PSF) width was measured to be ∼3.5 voxels, meaning that it takes 3.5 voxels to span 95 % of the transition between adjacent phases (Ketcham et al., 2010). Thus, for example, a 120 µm grain of pyroxene has a 3.5-voxel (28 µm) transition to adjacent air, spanning the outer 23 % of the grain radially and 40 % of its volume, as well as a region beyond the grain that corresponds to 50 % of its volume. Averaging between a high-attenuation phase and air in this region produces CT numbers overlapping those of lower-attenuation phases; for example, assigning one range of CT numbers to pyroxene and a lower range to plagioclase would produce volumetrically significant shells or atolls of voxels misclassified as plagioclase surrounding pyroxene grains.
We thus utilize a segmentation strategy based on selecting grains based on the CT numbers of their centers, and then expanding the selections to capture the inner part of their blurred region, or a threshold and expand operation (Ketcham, 2005). Working from highest-attenuation to lowest-attenuation phase, a CT number range is defined that encompasses the end-member CT numbers found in the grain cores, which is broadened to include lower CT numbers that remain unique to that phase to also capture the initial part of the transition region. To capture the transition region to its midpoint, the selections are then expanded by 1 voxel to a limit defined by the average core value and air. After each phase is captured, its voxels are removed from further consideration, and an additional region beyond the grain boundary is also removed to eliminate atolls. The removed voxels are given a temporary CT number that will not be captured during the initial threshold step during segmentation of the next-lower-attenuation phase, but can be captured in the expansion step. A final remove islands operation is used to eliminate remaining isolated voxels and stringers. Each segmentation was verified visually, and the parameters of each step were adjusted as necessary to optimize grain differentiation.
For the two whole rock chips (16-ROB-052-BASb,c), boundaries were assumed to be rock rather than air, therefore, CT number thresholds were defined midway between the mineral of interest and that of the lower-attenuation mineral class value. When identifying lower-attenuation phases, voxels assigned to higher-attenuation mineral classes were excluded, and their two-voxel radius values were replaced with transitional voxel values, ensuring these were treated as boundary voxels rather than misclassified mineral phases (see details of segmentation in Fig. 3d–f).
The range in CT numbers, which is dependent on the scan parameters and energies, was consistent within each batch. To evaluate whether threshold values from one batch could be applied across others, sample 15-ROB-056-NACb (VV) was scanned in three different batches for intercomparison of CT numbers. By applying the same established image processing workflow, we achieve a standard deviation of 0.27 wt % for both pyroxene and plagioclase and <0.01 wt % for oxide. This reproducibility supports the use of a single threshold for each mineral classification across all samples, with minor modifications as needed (see details for each sample in Table S2).
We also did a higher-resolution scan (4 µm voxel size, only one vial in field of view, duration 36 min) of a single test specimen to estimate resolution effects. While the resulting data were clearer, similar processing achieved results within 0.7 wt % of the 8 µm scan data.
3.3 Pyroxene weight percent estimation
The CT image processing yields voxel percentages for each mineral phase, which are converted to weight percent using mineral-specific densities. For the plagioclase group, we apply a density of 2.73 g cm−3, which is that of anorthite (An85) and characteristic of the Ferrar dolerite plagioclase. For the oxide phases, we use the density of ilmenite (4.72 g cm−3), a common accessory mineral in Ferrar Dolerite (Elliot and Fleming, 2021). Although pyroxene composition varies between clinopyroxene and orthopyroxene within individual samples, previous work (Bergelin et al., 2024) shows minimal variability in bulk pyroxene chemistry among Ferrar Dolerite samples collected from similar localities. We show this with the mineral composition of pyroxene separates determined from XRF analysis from samples collected from Roberts and Otway Massif (Bergelin et al., 2024, Table 4) in Fig. 4. For the pyroxene phases, we therefore apply the average density for these samples of 3.45 g cm−3. Even if endmember densities were used, the resulting variation would be less than 5 %, which falls within the typical uncertainty range for cosmogenic nuclide dating.
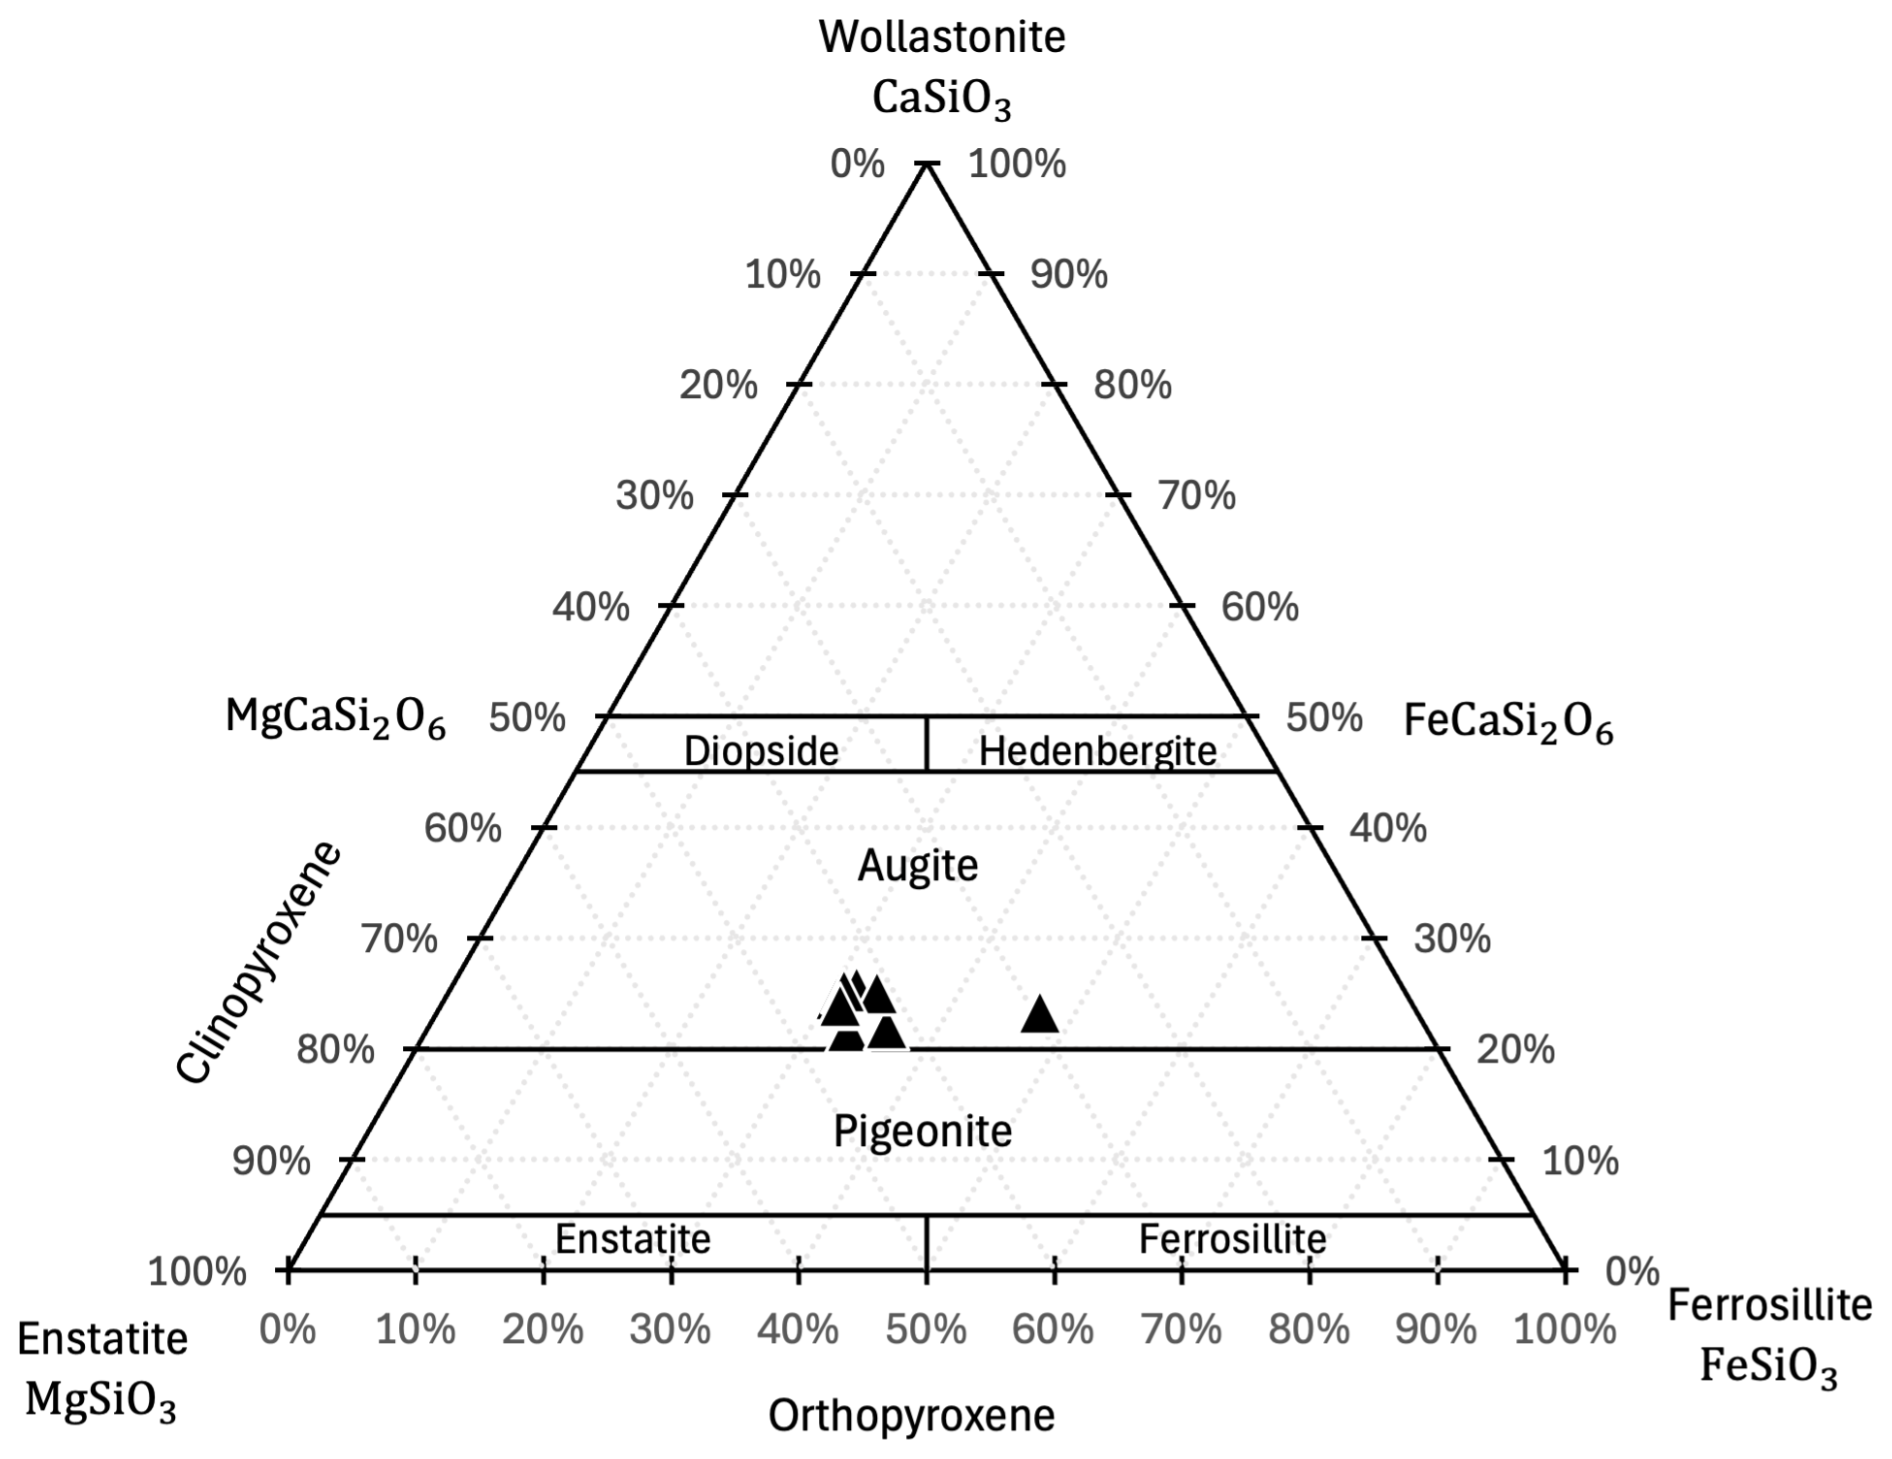
Figure 4Ternary diagram of wollastonite-ferrosilite-enstatite showing the pyroxene composition from 10 Ferrar dolerite samples obtained from Roberts and Otway Massif in Antarctica by Balter-Kennedy et al. (2020) and analyzed for XRF by Bergelin et al. (2024). The XRF analysis was done on bulk samples of pyroxene separates and, therefore, most likely includes multiple pyroxene phases.
3.4 Validation of weight percent estimation
The initial workflow method for the image processing was developed using the control samples 15-ROB-056-NACa and b, yielding <1.1 wt % deviations between known and estimated values (Table 2). Thresholds were then further adjusted to fit the samples having unknown mass percent. To validate the adjusted workflow, we applied it to two known ratio samples from 15-ROB-072-MNM (a and b) and repeated scans of 15-ROB-056-NACb, achieving <1.0 wt % variation in mass estimation.
Table 2Estimated mineral phase fraction in control samples of mixed pyroxene and plagioclase of known mass ratio for establishing and updating the CT scan voxel classification workflow.
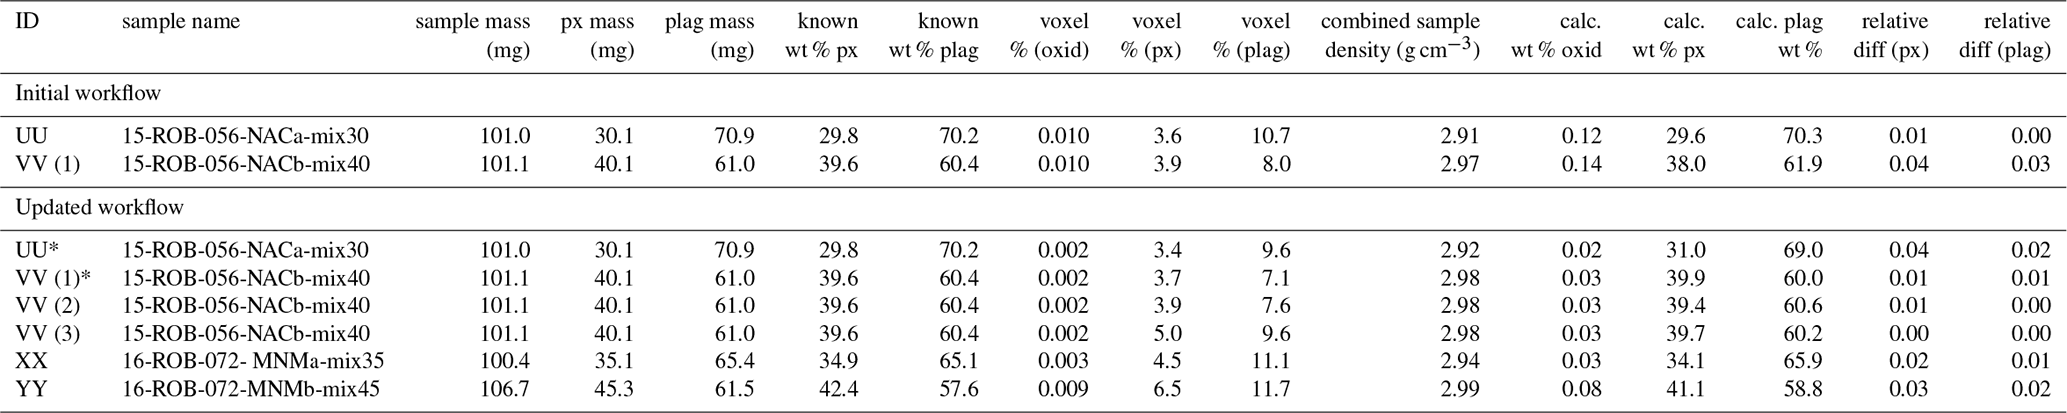
* Sample re-evaluated using updated workflow
4.1 Cosmogenic 3He analysis
We measured cosmogenic 3He abundances in whole-rock samples of Ferrar dolerite. Following CT scanning, samples were carefully transferred from small 1 mL vials to Ta packets and weighed. On average, >99.5 wt % of the sample grains were successfully recovered. The samples were then placed centrally on a shelf within the vacuum oven, pumped down to T, and heated at 220 °C for 8 h to degas 3He from plagioclase (see Sect. 2.2 for details). After cooling, the samples were loaded in batches of 12–14 into the sample chamber attached to the “Ohio” noble gas mass spectrometer at BGC, and pumped down to high vacuum ( Torr) for analysis.
Helium extraction and analysis follow the procedure used for separated pyroxene grains, as described by Balter-Kennedy et al. (2020). Because the whole-rock samples were not HF-etched, 4He concentrations are expected to be approximately 60 % higher (Bromley et al., 2025). To keep total 4He pressure within the range of available calibration standards, we used three heating steps to completely degas helium, rather than the standard two-step procedure. We included an initial 3 min heating at 600 °C, releasing roughly 50 % of the retained helium, followed by a 12 min heating at 1200 °C and a final heating of 15 min at 1300 °C. The last heating step typically contains 1 %–5 % of the total helium released and ensures complete extraction.
Process blanks measured on empty Ta packets within each batch were <105 atoms of 3He and <1010 atoms of 4He, corresponding to less than 0.8 % and 0.1 % of that measured in the samples, respectively. Replicate measurements of the CRONUS-P intercomparison standard (Blard et al., 2015) during analysis yielded an average 3He concentration of atoms g−1. This is slightly lower than that measured during the previous study of 3He in pyroxene separates ( atoms g−1: Balter-Kennedy et al., 2020). For comparison, all data sets are normalized to the accepted CRONUS-P value of 5.02×10⁹ atoms g−1 (Blard et al., 2015).
4.2 Results
Cosmogenic 3He concentrations in pyroxene measured by whole-rock degassing, coupled with estimation of the pyroxene fractions from CT analysis, are shown in Tables 3 and S2. We find that measured cosmogenic 3He concentration between the pyroxene-separated (Balter-Kennedy et al., 2020; Bromley et al., 2025) and the virtual-separated method used in this study is in agreement (Fig. 5). Although differences between concentrations measured by the two methods on the same samples commonly differ by more than the nominal measured uncertainty (see discussion below), there is no systematic bias between the two sets of measurements.
Table 3Measured 3He concentration in whole-rock Ferrar dolerite samples. Columns show the sample ID used in CT scanning, sample name, sample mass, CT scanned voxel percentage determined from the workflow detailed in Fig. 3, calculated weight percentage for each mineral phase based on mineral density, and the measured cosmogenic 3He concentration in virtually-separated (this study) and pyroxene-separated (Balter-Kennedy et al., 2020; Bromley et al., 2025) samples. All 3He measurements are corrected to CRONUS-P atoms g−1.
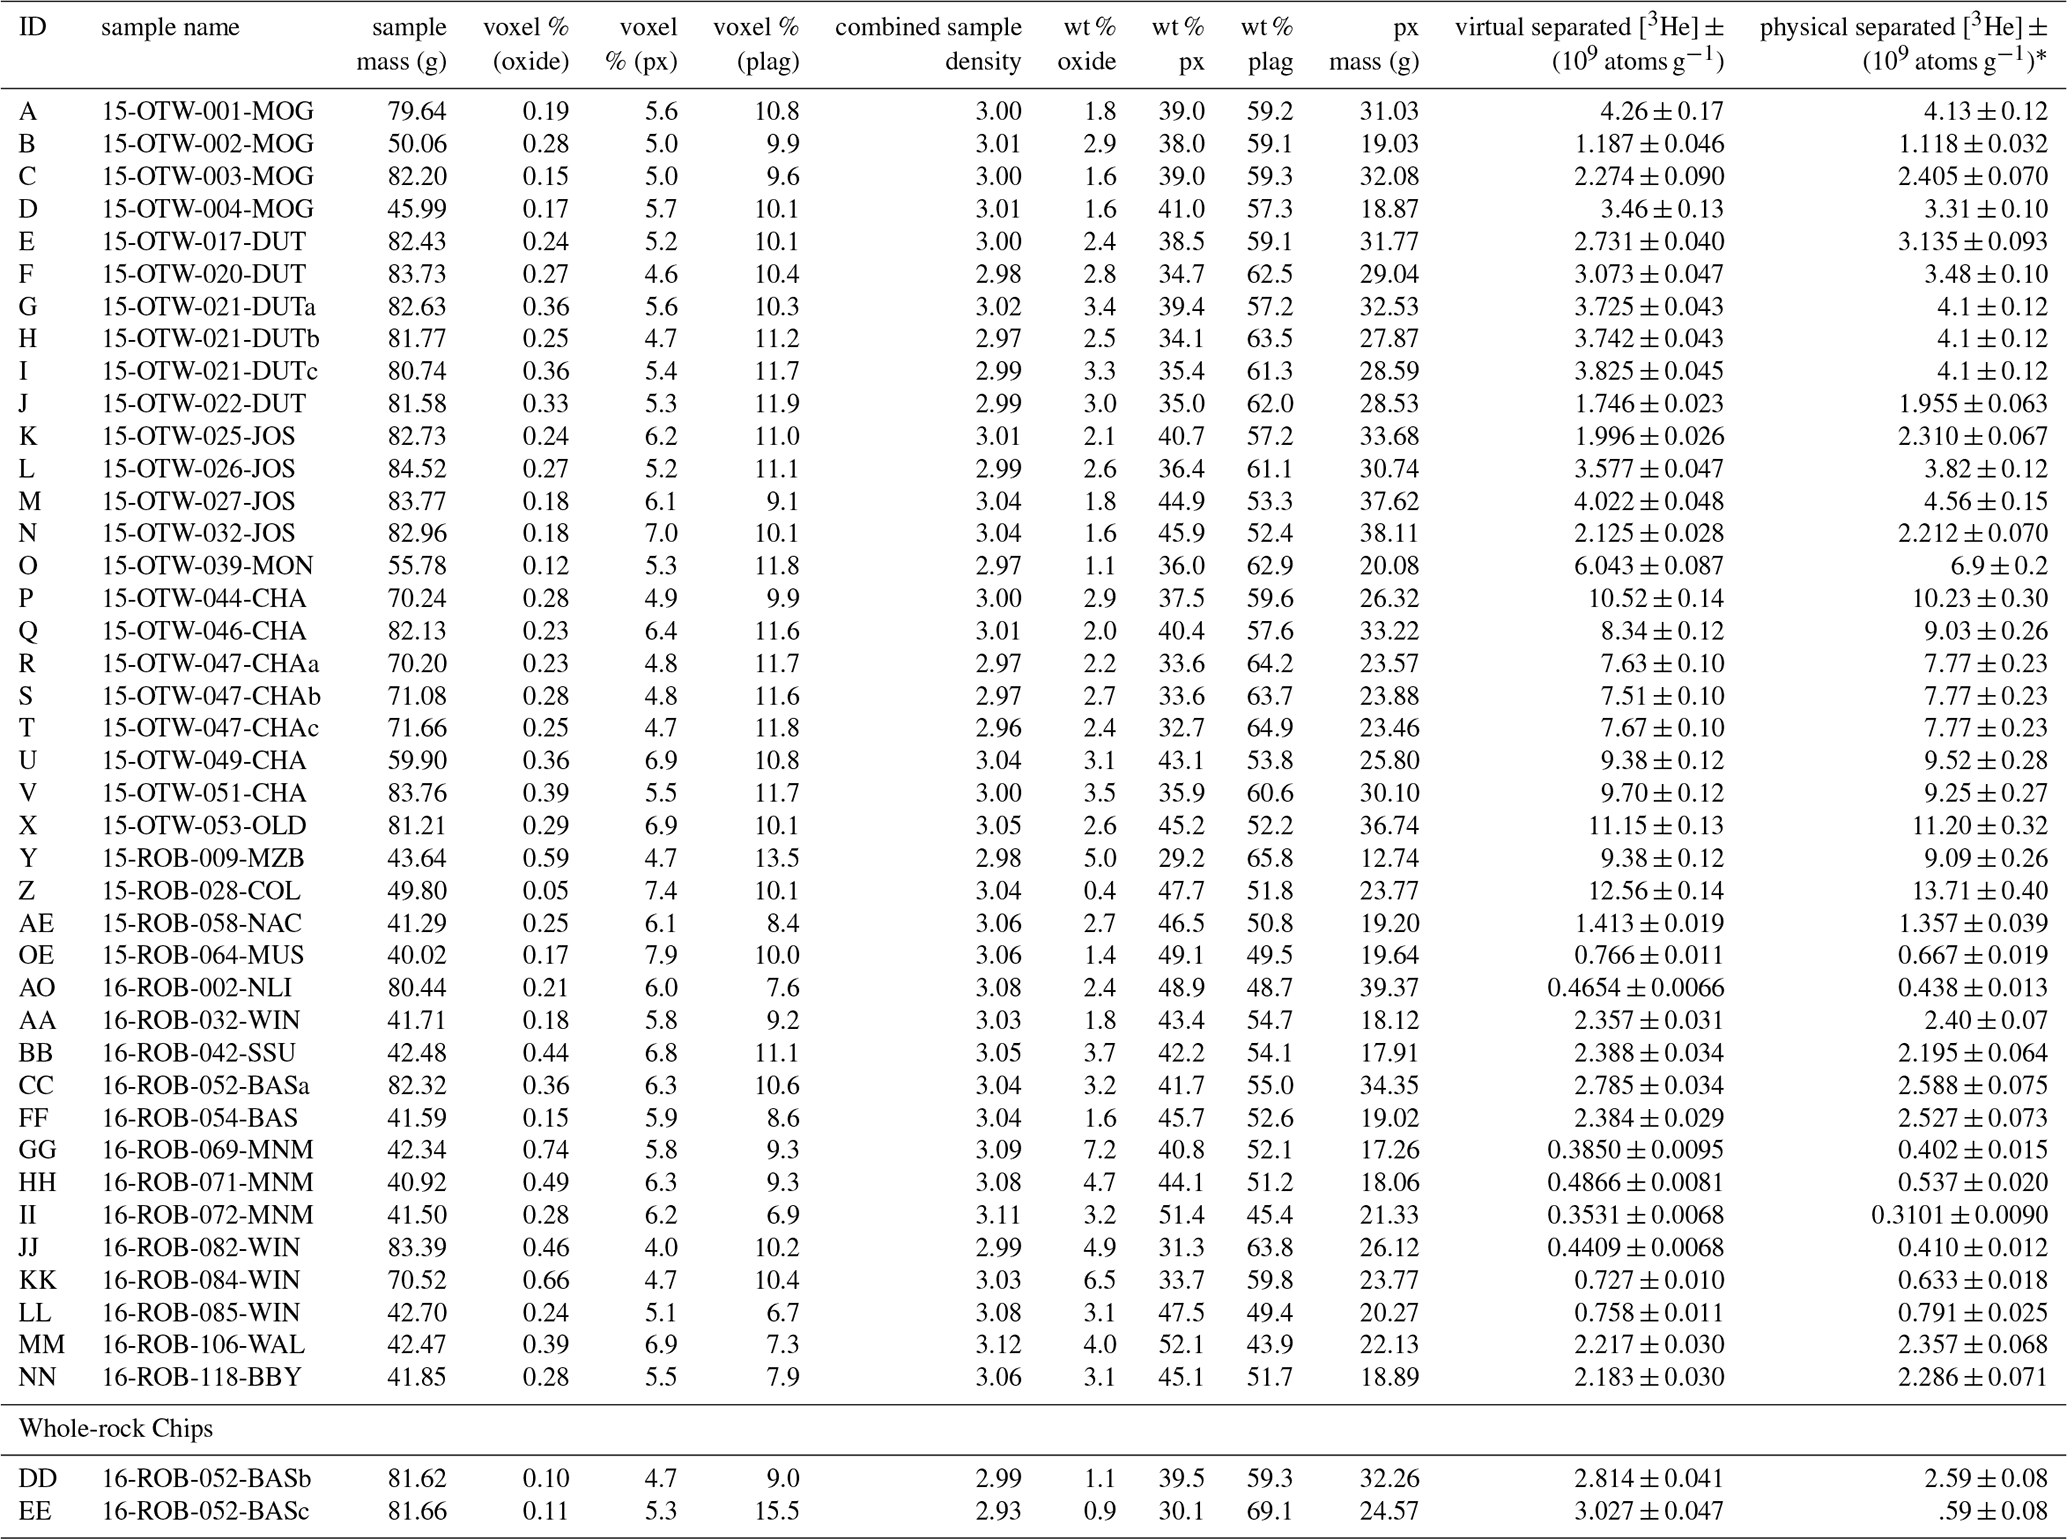
∗ For samples with more than one measurement, the concentration represents the error-weighted mean and the standard error.
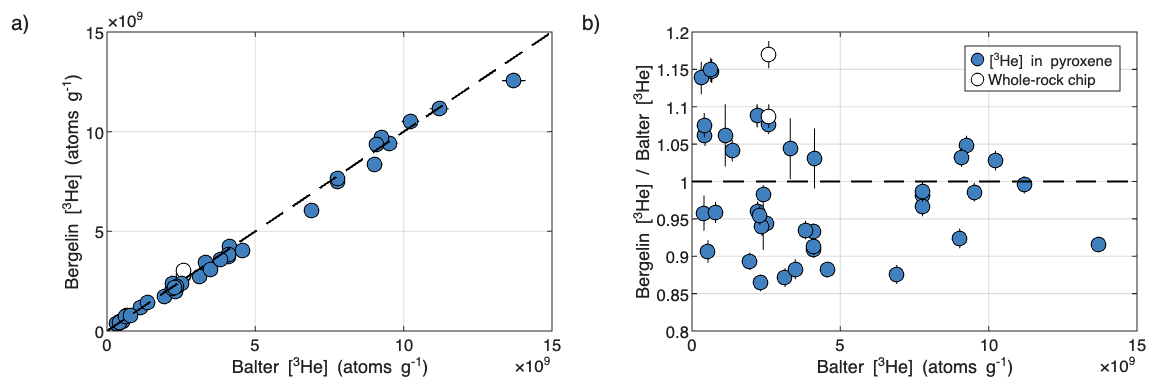
Figure 5Comparison of cosmogenic 3He concentration measured in virtual-separated pyroxene samples (Bergelin: this study) and pyroxene-separated samples (Balter: Balter-Kennedy et al., 2020). (a) compares the measured cosmogenic 3He concentration in pyroxene and (b) shows the relative difference between the two methods. Error bars show 1σ uncertainties. Note that both data sets have been normalized to CRONUS-P (Blard et al., 2015) as described in Sect. 4.1.
5.1 Reproducibility
We analyzed multiple aliquots from two samples to evaluate both the homogeneity of pyroxene fractionation within a sample and the reproducibility of measured 3He concentration. Aliquots of 15-OTW-047-CHA show consistent pyroxene content, varying less than 1 % by weight, indicating homogeneity between aliquots. In contrast, aliquots from sample 15-OTW-021-DUT exhibit greater variability and heterogeneity, with pyroxene content differing up to 5 % by weight.
Additionally, aliquots b and c of sample 16-ROB-052-BAS are small rock chips, where aliquot a is a crushed, mixed grain sample. While aliquot a contains 42 % pyroxene by weight, the rock chips showed both lower and more variable pyroxene content. Notably, aliquot 16-ROB-052-BASc displayed only 30 % pyroxene, and is among the lowest percentages measured (Table 3).
The combined sample density computed from the CT-estimated mineral composition for each sample ranges between 2.93–3.13 g cm−3 with an average and standard deviation of 3.02±0.05, which is in agreement with previously reported density for Ferrar dolerite (2.96–3.06 g cm−3: Margerison et al., 2005). However, the observed variability in pyroxene percentage between aliquots and range in combined density among samples does not exclude a potential systematic density segregation of plagioclase and pyroxene grains during crushing, sieving, washing, and handling of the samples, leading to a likely enrichment of heavier pyroxene grains and, consequently, an increased density. This highlights the importance of performing CT scans for each sample aliquot prior to cosmogenic 3He analysis, as we cannot assume uniformity across aliquots of either rock chips or crushed grain samples. That is, the sample being CT scanned must be the exact same sample that is analyzed in the mass spectrometer.
In Fig. 6, we show variability in replicate 3He measurements obtained from (i) the two pyroxene-separated and virtually-separated methods, and (ii) multiple aliquots of the same sample measured using the same method. The scatter between the pyroxene-separated and virtually-separated 3He measurements exceeds the internal scatter observed for the pyroxene-separated method only (Fig. 2b in Balter-Kennedy et al., 2020). However, despite the limited number of virtually-separated replicates available, this method tends to display low internal scatter and reproducibility compared to that of the pyroxene-separated method. This suggests that the scatter observed in Fig. 5 is related to sample-specific differences between the material analyzed using the two methods, rather than internal methodological inconsistency.
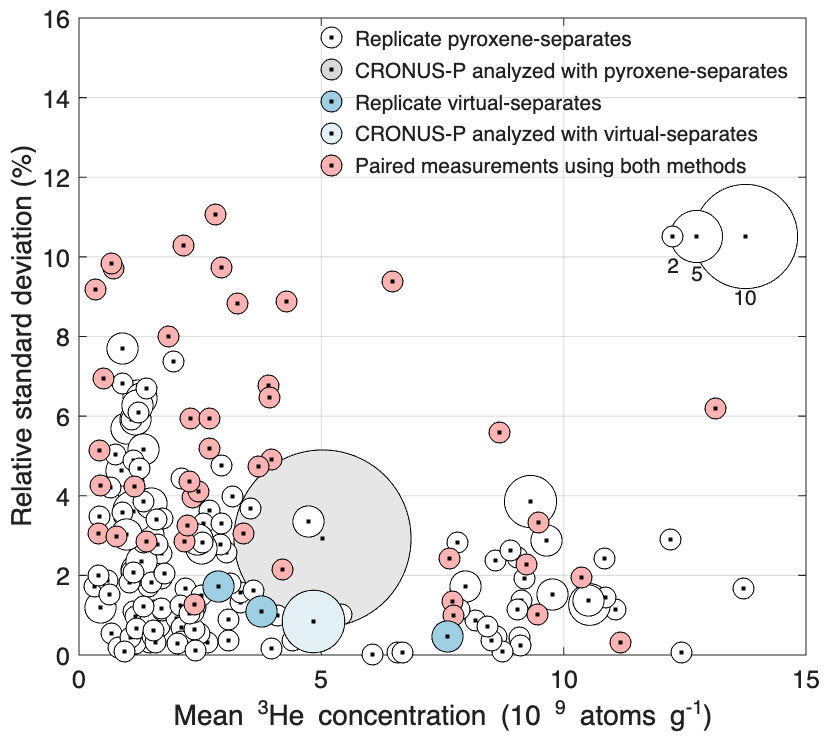
Figure 6Relative standard deviation of replicated cosmogenic 3He analysis for the pyroxene-separated and virtual-separated method. White dots show replicated measurements on pyroxene-separated samples obtained from Balter-Kennedy et al. (2020, Fig. 2b), where the grey dot shows the replicated CRONUS-P measurement analyzed with the pyroxene-separated samples. Blue dots show the replicated measurement on aliquots of virtual-separated samples from this study, where the light blue dot shows the replicated CRONUS-P measurements analyzed with the virtual-separated samples. The red dots show the relative standard deviation of the paired measurements from the two methods on the same sample. The size of the circle indicates the number of samples used in the calculated relative standard deviation. To summarize, both methods have better internal replicability than the replicability between the two methods.
5.2 Inclusion of ilmenite as a trace mineral
Ferrar dolerite is known to contain trace amounts of oxide minerals, most commonly ilmenite (TiFeO3) (Elliot and Fleming, 2021). During pyroxene separation, most iron oxides readily dissolve in HCl. However, ilmenite, like pyroxene, is less soluble in HCl and more resistant to HF etching, and may remain present in the pyroxene-separated samples despite additional purification steps such as handpicking under a binocular microscope or further magnetic separation following HF etching. If not properly accounted for, its persistence can influence the measured cosmogenic 3He concentration.
Ilmenite exhibits similar or potentially greater helium retentivity compared to pyroxene, but is mostly, if not completely, degassed at temperatures used for the extraction of helium in pyroxene. We show this through a simple experiment involving sample 16-ROB-069-MNM. We prepared two aliquots from purified pyroxene separates, and two aliquots from the magnetic fraction (estimated by eye to contain 25 %–35 % ilmenite) and analyzed the 3He and 4He concentration across the three heating steps used for complete degassing analysis (Table 4). We find that measured 3He concentrations in samples with high ilmenite concentrations were lower than those in pure pyroxene separates, which is in agreement with that observed by Margerison et al. (2005).
Table 4Measured 3He and 4He concentration in aliquots from the pyroxene separated and magnetic separated (containing pyroxene and oxides) fraction of sample 16-ROB-69, and the fractional release from each analytical heating step.
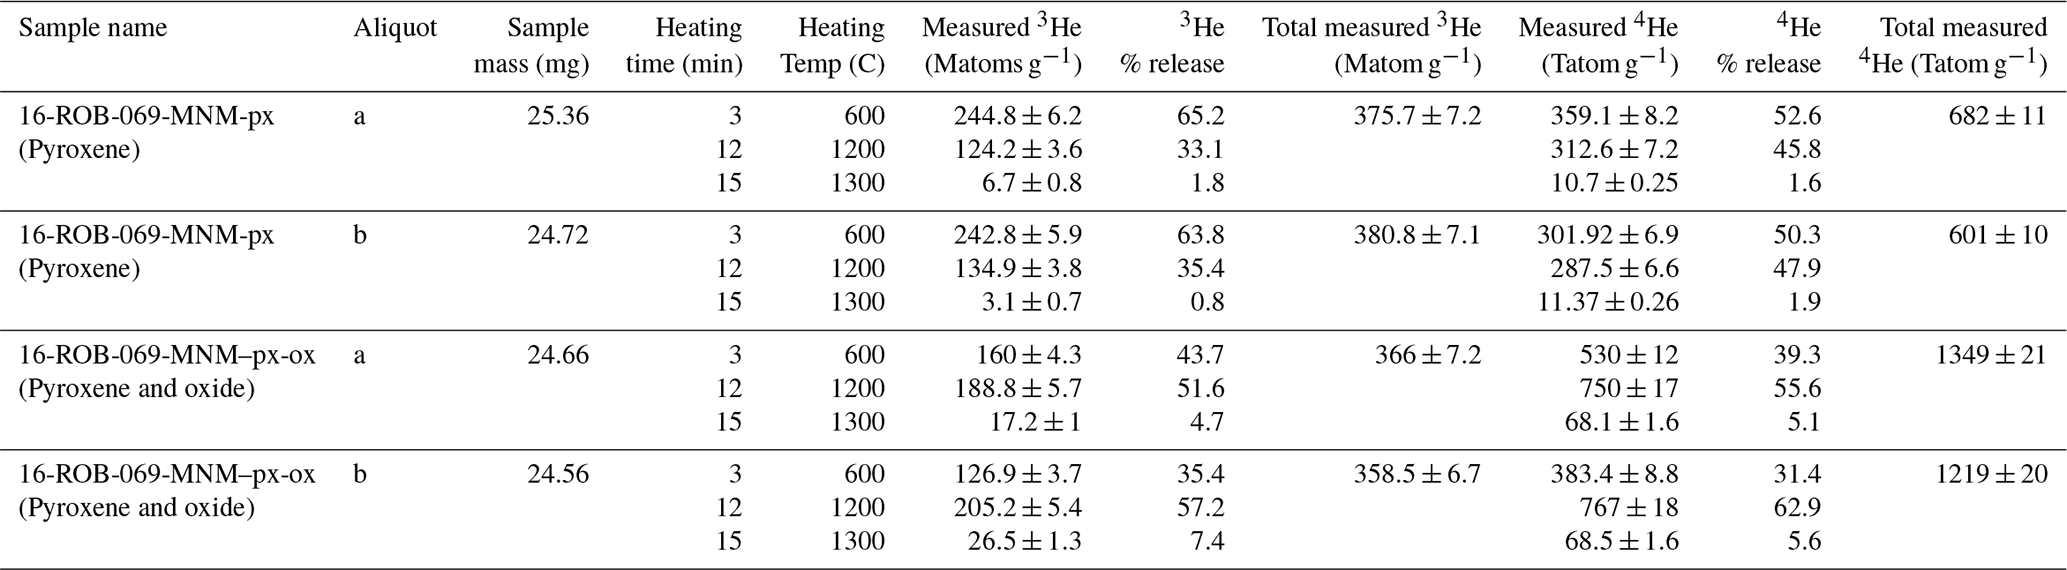
The apparent cosmogenic 3He production rate in ilmenite is 93.6 atoms g−1 yr−1, corresponding to a production ratio of 0.78 relative to pyroxene (Larsen et al., 2019). That means, for samples with, e.g., 30 % ilmenite content, we would expect to measure a concentration that is about 7 % less than that of pure pyroxene-separates. This is generally in agreement with that observed (Table 4), suggesting that 3He in ilmenite does completely degas during analysis. However, the increased release of helium at higher temperature heating steps indicates that ilmenite retains helium more effectively than pyroxene, which is in agreement with limited diffusion data for 4He in pyroxene and ilmenite (Futagami et al., 1993). As a result, failing to recognize ilmenite contamination of a supposed pyroxene sample may lead to an underestimation of the cosmogenic 3He concentration in pyroxene, due to the lower production rate in ilmenite, or, potentially, a heating schedule sufficient for degassing pyroxene but not ilmenite.
In the virtual mineral separation method, we can correct for the presence of ilmenite using the high-attenuation phase (oxide) in the CT scans. That is, of course, based on the assumption that the high-density oxide content is all presumed to be ilmenite. In Fig. 7a, we compare the measured 3He concentrations between the pyroxene-separated and virtual-separated methods, where we correct the mass to include the oxide weight fraction and account for the difference in cosmogenic 3He production rate (Larsen et al., 2019). When considering the pyroxene weight percent only, we get a mean ratio (Bergelin [3He] Balter [3He]) and standard deviation of 0.99±0.08, compared to 0.94±0.08 if we assume that the oxides are part of the 3He contributing mass. This apparent systematic underestimation is not completely consistent with the results above, but it is evident that marginally better agreement is obtained by assuming that the oxide fraction does not contribute 3He. Regardless, we find no correlation between the oxide phase weight percentage from the CT scan and the measured 3He concentration ratio (Fig. 7b). This indicates that accounting for the oxide phase contamination, such as ilmenite, does not improve the agreement between the two methods, and ilmenite is therefore not the primary source of the scatter observed in Figs. 6 and 7b.
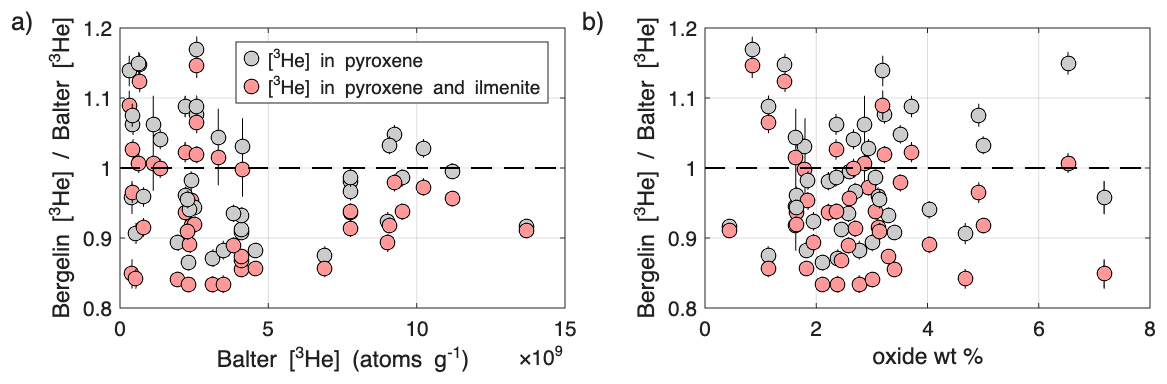
Figure 7The relative difference between measured cosmogenic 3He concentration in virtual-separated pyroxene (Bergelin: this study) and pyroxene separates (Balter: Balter-Kennedy et al., 2020), compared to (a) measured cosmogenic 3He concentration in pyroxene, and (b) oxide weight percentage. Grey data show the ratio where virtual-separated 3He concentrations are determined from the pyroxene weight as indicated in Fig. 5, where the concentration is simply N/wpx, and where N is the 3He amount (atoms), and wpx is the pyroxene weight. The red data show the virtual-separated 3He concentration determined from the weight of pyroxene and ilmenite and corrected for the difference in production rate, such that the concentration is ), and where wox is the oxide weight.
5.3 Sources of scatter in the data set
We see more scatter between the pyroxene-separated and virtual-separated methods than expected from measurement uncertainty. This is evident in Fig. 5b (the relative difference is indistinguishable from 1) and Fig. 6, which show no systematic bias, but do show scatter exceeding measurement uncertainty. Assuming that the mass-spectrometric 3He measurements themselves are unbiased, the difference in apparent 3He concentration in pyroxene in the same sample obtained by physical and virtual mineral separation must stem from either incomplete purification of pyroxene in the physical case, or incorrect quantifications of pyroxene weight in the virtual case. As both are possible and difficulties in pyroxene purification are routinely observed (Bromley et al., 2014), we do not know a priori which value is more accurate.
In addition to ilmenite, other mineral inclusions can contribute to variability in the measured 3He concentration. Due to the fine-grained, microcrystalline texture of Ferrar dolerite, physical separation of pure pyroxene grains is challenging, often resulting in pyroxene separates including accessory minerals such as plagioclase, ilmenite, and other minor phases. These inclusions affect cosmogenic 3He exposure dating: plagioclase contributes to mass but without hosting 3He atoms, while oxides such as ilmenite contribute helium but at a lower production rate, both leading to scatter and a systematic underestimation of 3He concentration in pyroxene separates. Such bias would result in a ratio systematically >1 in Fig. 5b, which is not the case.
The CT-based virtual mineral separation method can resolve these issues by identifying and excluding non-pyroxene minerals, which would be expected to improve analytical accuracy. However, some minor uncertainties and potential sources of scatter remain due to misclassification of CT voxels and/or varying diffusivity behavior in bulk sample grains. For example, when determining the workflow for identifying the mineral phases in the CT image analyses, the estimated mineral abundance deviated by up to 4 % from the known value (Table 2), indicating occasional voxel misclassification, but also perhaps reflecting that the separates used to construct the control samples were themselves not perfect. We note that a perfect segmentation is not possible, due to both the resolution limitations of the data and the simplified 3-phase model we assume. Further, the degassing process is sensitive to mineral composition and grain size. We account for this by applying the highest determined retentivity for 3He in plagioclase and the lowest in pyroxene when determining the oven heating schedule. However, inter-grain variability may still result in percent-level 3He loss from pyroxene and retention in plagioclase during oven degassing and before 3He analysis, resulting in internal scatter in the data. Further, both the CT segmentation method and conversion of voxel volume to mass are affected by the compositional variability for each mineral phase, adding to the internal scatter.
Other potential sources of discrepancy between the pyroxene-separation and virtually-separation methods, related to the sample-specific scatter observed in Fig. 6, include heterogeneous distribution of 3He within a sample and the presence of noncosmogenic 3He from nucleogenic production. While heterogeneity of 3He in a sample arises from the decrease in production rate with sample thickness, crushing and sample preparation should assure thorough mixing. However, the virtual mineral separation process involves limited sample processing of very small aliquots (<100 mg), so this could result in some variability. The noncosmogenic component of 3He in pyroxene has been estimated in various studies to be less than 107 atoms g−1 (Margerison et al., 2005; Kaplan et al., 2017; Eaves et al., 2018). However, for samples exposed for more than a million years, this contribution is less than 3 % of the total 3He concentrations in samples, so we see no means by which variability in noncosmogenic 3He could significantly affect our results.
Most errors we envision for the two methods would lead to a systematic bias one way or the other, including contamination in pyroxene-separates, and incorrect estimation of pyroxene weight percent in virtual-separates. As we do not see a systematic bias, no single one of these possibilities can explain the scatter, but we cannot exclude that one or more of them is present. To summarize, we are not able to attribute percent-level variability between the two separation methods to a specific cause, and furthermore are not able to assess whether the physically- or virtually-separated results are more accurate, but this does not affect the conclusion that no systematic bias between the two methods is evident.
5.4 Advantages and disadvantages of “virtual mineral separation”
The virtual-mineral-separation method significantly reduces sample processing time by eliminating labor-intensive steps such as extensive crushing, sieving, magnetic separation, acid leaching, and etching. However, the exact processing time and efficiency highly depend on the number of samples processed in parallel and the specific arrangement of a particular laboratory. In general, hand-crushing, sieving, and rinsing of multiple small (<1 g) samples, followed by drying and packaging, takes roughly several hours of effort over 2 to 3 d. The needed time for the CT scan of a batch of 7–8 samples and subsequent image processing takes roughly 3–4 h, given that the workflow for uniquely classifying each mineral phase using Blob 3D software has already been established. Degassing helium from plagioclase in the vacuum oven for 8 h at 220 °C prior to analysis in the mass spectrometer takes 1 d. However, besides loading and unloading the oven, this process is hands-free.
To further enhance the efficiency of this method, we directly packaged and analyzed aliquots of whole rock chips collected directly in the field, omitting any physical processing. However, some analytical limitations arise from minimizing the sample processing to this extent.
The concentration of 4He in a sample is largely influenced by its nucleogenic production through the decay of uranium (U) and thorium (Th). For the Ferrar Dolerite, dated to 183 Ma (Burgess et al., 2015), this results in a ratio ranging from 2.6×10⁴ to 2.2×10⁶. During standard pyroxene separation, HF leaching removes the surface-implanted 4He from the grain boundary, significantly reducing the total 4He concentration (Bromley et al., 2014). In the virtual-separation method, where HF leaching is omitted, we therefore observe an increase in 4He concentration (Fig. 8 and Table S3). An increased 4He concentration, in turn, limits the 3He signal available for analysis because of the need to adjust sample sizes such that the total helium pressures remain within a calibrated range. Although there exist strategies to improve 3He measurements at very low ratios (Amidon and Farley, 2010), they are not routinely used. However, this issue is also somewhat specific to the Ferrar Dolerite and would most likely be less relevant for rocks with a younger crystallization age.
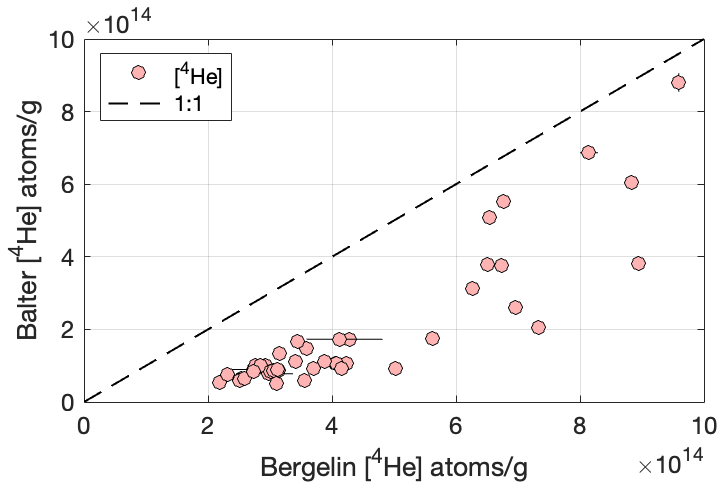
Figure 8Comparison of cosmogenic 4He concentration measured in virtual-separated pyroxene samples (Bergelin: this study) and pyroxene-separated samples (Balter: Balter-Kennedy et al., 2020).
The analysis of whole rock chip aliquots (16-ROB-052-BASb,c) presents additional challenges when both crushing and HF leaching are omitted from the sample preparation. We found that gas cleanup and helium purification were more challenging for measurement on rock chips, most likely because unprocessed rock chips contain higher concentrations of hydrated and/or volatile-containing minerals or weathering products that were apparently removed during crushing and rinsing. Thus, developing a routine analytical workflow for whole rock chips, limiting the sample processing to only involve collecting and packaging a single <100 mg rock chip into 1 mL vials, would most likely require additional cleaning measures for released gas, such as attaching a liquid nitrogen cold trap or incorporating additional getters to absorb CO2 and H2O.
However, the CT data of the whole-rock chips does provide additional context that is lost when the sample is crushed, which may help with both understanding the material and improving the segmentation (Fig. 9). The pyroxene is clearly zoned, predominantly consisting of a brightening toward grain rims or relict grain boundaries most likely reflecting exchange of Mg for Fe or Ca, and explaining the breadth of the pyroxene histogram peak (Fig. 3c). Multiple high-attenuation phases are evident, and grain attenuation and/or morphology could help differentiate them. Multiple low-attenuation phases are also evident, with the darker regions possibly reflecting alkali feldspar amidst the slightly brighter plagioclase. Rock chips may also be easier to collect and transport, and can record a better-constrained depth interval than crushed larger samples. Finally, segmentation of rock-chip data is more straightforward than for crushed grains, as the extensive blurring between small fragments and air is avoided.
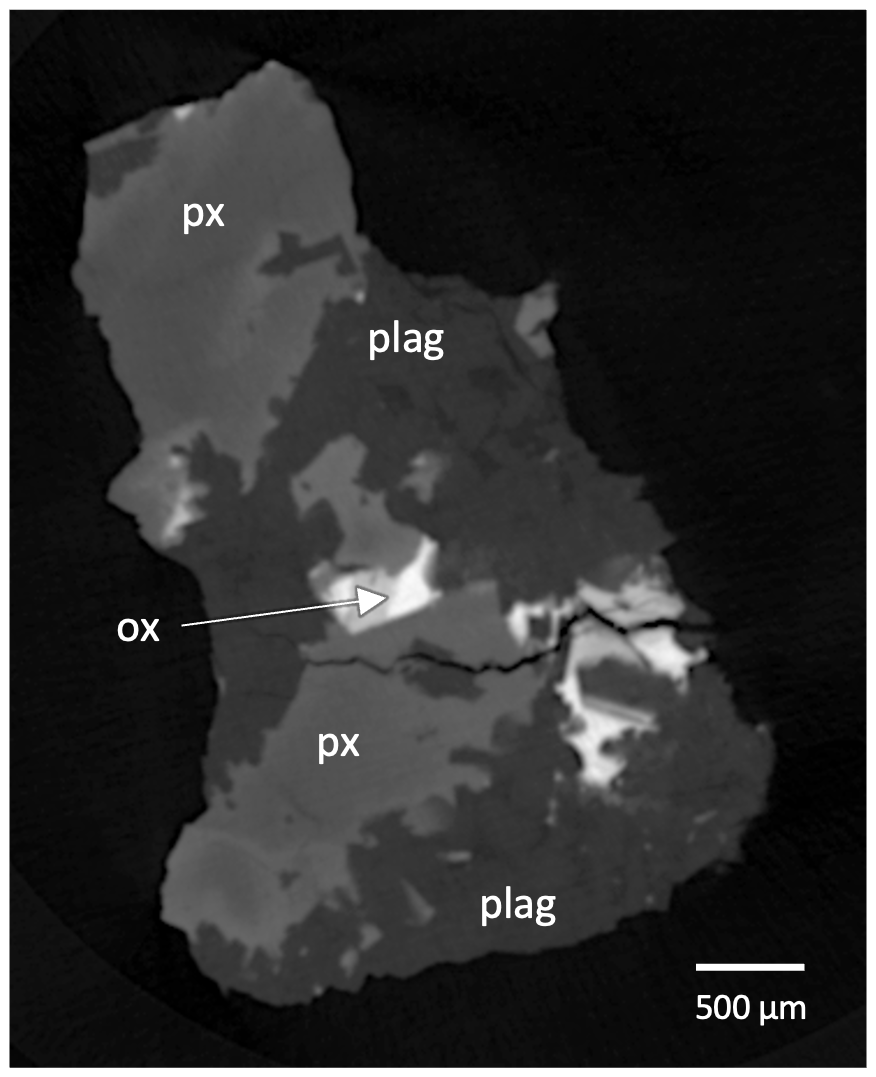
Figure 9CT image of whole-rock chip 16-ROB-52-BASb (DD; image slice 358). The rock chip measures ∼4 mm in diameter. Pyroxene (px) shows zoning consisting of brightening towards the grain boundary. Multiple high-attenuation phases are observed for oxides (ox), as well as multiple low-attenuation phases are observed for plagioclase (plag).
5.5 Implications of virtual mineral separation for cosmogenic nuclide applications
Virtual mineral separation greatly simplifies the workflow for 3He measurements in mafic lithologies, and, therefore, has the potential to enable several new Earth science applications as follows.
Exposure-dating of surface features typically involves single boulders or clasts, where many of the processes that affect the exposure ages are inherently stochastic and quantized. For example, a boulder has either tipped over or cracked after it was emplaced, or it has not. Therefore, accurately dating a landform subjected to stochastic disturbance requires comparing an observed distribution of exposure ages to that predicted by a process model (e.g. Balco, 2011, 2020; Applegate et al., 2010, 2012). The greater the number of exposure ages that can be obtained from a single landform and used in such a comparison, the more robust the age estimate. In Antarctica, Ferrar Dolerite is one of the most dominant surface lithologies in ice-free areas due to its resistance to weathering, so is commonly extremely abundant on glacial moraines, drift surfaces, colluvial aprons, and other surface features whose age is of interest and that are subject to stochastic processes of both cosmogenic-nuclide inheritance and postdepositional disturbance. The virtual mineral separation method of exposure dating applied to these features would enable faster, more efficient, and more complete characterization of frequency distributions of apparent exposure ages, which in turn would improve understanding of inheritance distributions, quantification of postdepositional disturbance frequency, and better estimates of the true ages of these features.
The virtual mineral separation method allows collection of extremely small (<1 g) sample mass, rather than the conventional size of hundreds of grams. That is, a single rock chip (100 mg) can be collected from boulders across a field and directly packaged into 1 mL vials for analysis, given that the specific requirements for the lithology are met as described below. This improves speed in the field, reduces visual impacts, and reduces logistical requirements, especially for Antarctic applications or for remote sites where samples are often carried out by foot. In addition, minimizing sample size is important for sample-limited applications such as subglacial bedrock exposure dating. For example, small clasts of a lithology presumed to be Ferrar dolerite were collected from the base of the Taylor Dome ice core in 1994 (Grootes et al., 1994; Steig et al., 2000). If this material had not been subsequently lost, the virtual mineral separation method could have allowed detection and quantification of surface exposure in these clasts with minimal consumption of the samples.
Measuring multiple cosmogenic nuclides in a single sample is valuable for various applications of exposure dating. Multiple-nuclide systematics (e.g., ratios in pyroxene) allow corrections for surface weathering and erosion, as well as quantifying when and how often a surface has experienced burial. However, measurement of 10Be and 36Cl in Ferrar Dolerite pyroxenes (Bergelin et al., 2024; Swanger et al., 2025) is costly and labor-intensive, requiring extensive mineral separation and chemical extraction. As a screening tool, virtual mineral separation enables large quantities of cosmogenic 3He measurements across a landscape and identifies an optimal subset of sample candidates for multiple-nuclide studies.
Finally, cost, speed, and efficiency are critical limits for emerging applications of exposure dating in Antarctic surface process studies. Recent research on dispersal and succession in Antarctic terrestrial ecosystems has focused on the importance of surface disturbance by past glaciation of currently ice-free areas (Lyons et al., 2016; Diaz et al., 2020, and references therein), and on the use of exposure-dating to quantify the timing and frequency of glacial (and other) disturbance as a means of understanding ecosystem dynamics. Since these landscape disturbance properties are, again, inherently stochastic in nature, large quantities of data are needed to characterize the large-scale relationship of surface disturbance to species dispersal and diversity. Virtual mineral separation would permit collection of such large data sets of exposure ages of surface clasts, or, potentially, could be applied to soils or sediments derived from weathering of Ferrar dolerite to collect depth-profile data needed to quantify subsurface mixing of soils (Diaz et al., 2020; Putkonen et al., 2008; Schaller et al., 2009).
In this study, we specifically choose to focus on Ferrar dolerite because it presents a simple case for which (i) the mineralogy predominantly comprises of a non-helium-retentive plagioclase and helium-retentive pyroxene with minor other mineral constituents, and (ii) a large data set of 3He measurements on pyroxene separates already exists. In addition, the ubiquity of Ferrar dolerite surface clasts throughout the Transantarctic Mountains provides numerous potential field applications. However, other mafic lithologies, such as gabbroic rocks or potentially fine-grained basalts where mineral separation is near impossible, may also be suitable, providing they share similar mineralogical characteristics. The key requirement is that the rock be composed of minerals with strongly contrasting helium retentivity, such that any minerals that do not completely retain helium over geologic time scales of interest can be degassed without degassing the retentive minerals. It must also be possible to identify the retentive minerals accurately enough to determine their proportion in the rock and calculate an appropriate 3He production rate. Thus, rocks that include relatively retentive, high-density minerals such as pyroxene, olivine (Trull et al., 1991; Shuster et al., 2004), or oxides (Futagami et al., 1993) with relatively diffusive, low-density minerals such as quartz (Shuster and Farley, 2005; Tremblay et al., 2014) or most feldspars (Bergelin et al., 2025) are likely suitable for virtual mineral separation. On the other hand, lithologies containing significant amounts of magmatic helium (which is not significant in the Ferrar dolerite) may present complications requiring additional processing steps (e.g., crushing operations to degas gas or fluid inclusions) and limiting the advantages of virtual separation.
We have shown that the cosmogenic 3He concentration in pyroxene in mafic rocks can be measured without physically separating the pyroxene. First, we explored the diffusion kinetics of 3He in plagioclase and pyroxene to establish that a single heating step of 220 °C for 8 h is sufficient to reach complete separation between 3He released from plagioclase and that retained in pyroxene. Second, we determined the weight percentage fraction of pyroxene in crushed whole-rock samples through CT scanning. This step is important for all samples, as we cannot assume homogeneity between aliquots, and to apply the virtual mineral separation to exposure dating applications. Third, we compared the virtual mineral separation approach with existing 3He measurements in pyroxene separates (Balter-Kennedy et al., 2020).
We find that virtual mineral separation yields 3He concentrations in pyroxene that are indistinguishable from those derived from physical mineral separation, with no evidence of systematic bias. While observed differences between the results of the two methods exceed estimated analytical uncertainty, these discrepancies appear to be stochastic rather than systematic. This makes it difficult to assess which method is preferable, as both include unquantified uncertainties that can either under- or overestimate the measured nuclide concentration. However, a lack of systematic bias between the methods combined with percent-level differences, even if the latter are poorly explained, leads us to conclude that the virtual mineral separation method is accurate for cosmogenic 3He exposure dating.
The virtual mineral separation method offers a more efficient approach to measure the cosmogenic 3He concentration in pyroxene in mafic rocks, requiring limited physical processing time. This makes collection of large quantities of cosmogenic 3He data for exposure dating relatively easy, fast, and cost-effective, which in turn enables new emerging applications of exposure dating, such as quantifying stochastic surface processes, ecosystem studies, and potential subglacial bedrock exposure dating.
All data described in the paper are included in the Supplement.
The supplement related to this article is available online at https://doi.org/10.5194/gchron-8-19-2026-supplement.
MB carried out the experiments and measurements, with assistance from GB and RAK in experimental design and data reduction. MB led the data interpretation and prepared the manuscript with contributions from all authors.
At least one of the (co-)authors is a member of the editorial board of Geochronology. The peer-review process was guided by an independent editor, and the authors also have no other competing interests to declare.
Publisher's note: Copernicus Publications remains neutral with regard to jurisdictional claims made in the text, published maps, institutional affiliations, or any other geographical representation in this paper. While Copernicus Publications makes every effort to include appropriate place names, the final responsibility lies with the authors. Views expressed in the text are those of the authors and do not necessarily reflect the views of the publisher.
The LLNL portion of this work was carried out under Contract DE-AC52-07NA27344; this is LLNL-JRNL-2007614.
This research has been supported by the National Science Foundation (grant no. 2139497) and by the Ann and Gordon Getty Foundation.
This paper was edited by Hella Wittmann and reviewed by two anonymous referees.
Amidon, W. H. and Farley, K. A.: Mass spectrometric 3He measurement in 4He-rich phases: Techniques and limitations for cosmogenic 3He dating of zircon, apatite, and titanite, Geochemistry, Geophysics, Geosystems, 11, https://doi.org/10.1029/2010gc003178, 2010.
Applegate, P. J., Urban, N. M., Laabs, B. J. C., Keller, K., and Alley, R. B.: Modeling the statistical distributions of cosmogenic exposure dates from moraines, Geosci. Model Dev., 3, 293–307, https://doi.org/10.5194/gmd-3-293-2010, 2010.
Applegate, P. J., Urban, N. M., Keller, K., Lowell, T. V., Laabs, B. J. C., Kelly, M. A., and Alley, R. B.: Improved moraine age interpretations through explicit matching of geomorphic process models to cosmogenic nuclide measurements from single landforms, Quaternary Research, 77, 293–304, https://doi.org/10.1016/j.yqres.2011.12.002, 2012.
Balco, G.: Contributions and unrealized potential contributions of cosmogenic-nuclide exposure dating to glacier chronology, 1990–2010, Quaternary Science Reviews, 30, 3–27, https://doi.org/10.1016/j.quascirev.2010.11.003, 2011.
Balco, G.: Glacier Change and Paleoclimate Applications of Cosmogenic-Nuclide Exposure Dating, Annual Review of Earth and Planetary Sciences, 48, 21–48, https://doi.org/10.1146/annurev-earth-081619-052609, 2020.
Balter-Kennedy, A., Bromley, G., Balco, G., Thomas, H., and Jackson, M. S.: A 14.5-million-year record of East Antarctic Ice Sheet fluctuations from the central Transantarctic Mountains, constrained with cosmogenic 3He, 10Be, 21Ne, and 26Al, The Cryosphere, 14, 2647–2672, https://doi.org/10.5194/tc-14-2647-2020, 2020.
Bergelin, M., Balco, G., Corbett, L. B., and Bierman, P. R.: Production rate calibration for cosmogenic 10Be in pyroxene by applying a rapid fusion method to 10Be-saturated samples from the Transantarctic Mountains, Antarctica, Geochronology, 6, 491–502, https://doi.org/10.5194/gchron-6-491-2024, 2024.
Bergelin, M., Gorin, A. L., Balco, G., and Cassata, W. S.: Diffusion kinetics of 3He in pyroxene and plagioclase and applications to cosmogenic exposure dating and paleothermometry in mafic rocks, Geochronology, 7, 493–511, https://doi.org/10.5194/gchron-7-493-2025, 2025.
Blard, P. H., Lavé, J., Farley, K. A., Fornari, M., Jiménez, N., and Ramirez, V.: Late local glacial maximum in the Central Altiplano triggered by cold and locally-wet conditions during the paleolake Tauca episode (17–15 ka, Heinrich 1), Quaternary Science Reviews, 28, 3414–3427, https://doi.org/10.1016/j.quascirev.2009.09.025, 2009.
Blard, P. H., Balco, G., Burnard, P. G., Farley, K. A., Fenton, C. R., Friedrich, R., Jull, A. J. T., Niedermann, S., Pik, R., Schaefer, J. M., Scott, E. M., Shuster, D. L., Stuart, F. M., Stute, M., Tibari, B., Winckler, G., and Zimmermann, L.: An inter-laboratory comparison of cosmogenic 3He and radiogenic 4He in the CRONUS-P pyroxene standard, Quat. Geochronol., 26, 11–19, https://doi.org/10.1016/j.quageo.2014.08.004, 2015.
Bromley, G. R. M., Winckler, G., Schaefer, J. M., Kaplan, M. R., Licht, K. J., and Hall, B. L.: Pyroxene separation by HF leaching and its impact on helium surface-exposure dating, Quat. Geochronol., 23, 1–8, https://doi.org/10.1016/j.quageo.2014.04.003, 2014.
Bromley, G. R. M., Balco, G., Jackson, M. S., Balter-Kennedy, A., and Thomas, H.: East Antarctic Ice Sheet variability in the central Transantarctic Mountains since the mid Miocene, Clim. Past, 21, 145–160, https://doi.org/10.5194/cp-21-145-2025, 2025.
Brook, E. J., Brown, E. T., Kurz, M. D., Ackert, R. P., Raisbeck, G. M., and Yiou, F.: Constraints on age, erosion, and uplift of Neogene glacial deposits in the Transantarctic Mountains determined from in situ cosmogenic 10Be and 26Al, Geology, 23, 1063–1066, https://doi.org/10.1130/0091-7613(1995)023<1063:Coaeau>2.3.Co;2, 1995.
Bruno, L. A., Baur, H., Graf, T., Schlu, C., Signer, P., and Wieler, R.: Dating of Sirius Group tillites in the Antarctic Dry Valleys with cosmogenic 3He and 21Ne, Earth and Planetary Science Letters, 147, 37–54, 1997.
Burgess, S. D., Bowring, S. A., Fleming, T. H., and Elliot, D. H.: High-precision geochronology links the Ferrar large igneous province with early-Jurassic ocean anoxia and biotic crisis, Earth and Planetary Science Letters, 415, 90–99, https://doi.org/10.1016/j.epsl.2015.01.037, 2015.
Cerling, T. E.: Dating Geomorphologic Surfaces Using Cosmogenic 3He, Quaternary Research, 33, 148–156, https://doi.org/10.1016/0033-5894(90)90015-d, 1990.
Cooperdock, E. H. G., Hofmann, F., Tibbetts, R. M. C., Carrera, A., Takase, A., and Celestian, A. J.: Technical note: Rapid phase identification of apatite and zircon grains for geochronology using X-ray micro-computed tomography, Geochronology, 4, 501–515, https://doi.org/10.5194/gchron-4-501-2022, 2022.
Diaz, M. A., Li, J., Michalski, G., Darrah, T. H., Adams, B. J., Wall, D. H., Hogg, I. D., Fierer, N., Welch, S. A., Gardner, C. B., and Lyons, W. B.: Stable Isotopes of Nitrate, Sulfate, and Carbonate in Soils From the Transantarctic Mountains, Antarctica: A Record of Atmospheric Deposition and Chemical Weathering, Frontiers in Earth Science, 8, https://doi.org/10.3389/feart.2020.00341, 2020.
Eaves, S. R., Collins, J. A., Jones, R. S., Norton, K. P., Tims, S. G., and Mackintosh, A. N.: Further constraint of the in situ cosmogenic 10Be production rate in pyroxene and a viability test for late Quaternary exposure dating, Quat. Geochronol., 48, 121–132, https://doi.org/10.1016/j.quageo.2018.09.006, 2018.
Eberhardt, P., Geiss, J., and Grögler, N.: Distribution of rare gases in the pyroxene and feldspar of the Khor Temiki meteorite, Earth and Planetary Science Letters, 1, 7–12, https://doi.org/10.1016/0012-821x(66)90096-3, 1966.
Elliot, D. H. and Fleming, T. H.: Chapter 2.1b Ferrar Large Igneous Province: petrology, Geological Society, London, Memoirs, 55, 93–119, https://doi.org/10.1144/m55-2018-39, 2021.
Farley, K. A., Malespin, C., Mahaffy, P., Grotzinger, J. P., Vasconcelos, P. M., Milliken, R. E., Malin, M., Edgett, K. S., Pavlov, A. A., Hurowitz, J. A., Grant, J. A., Miller, H. B., Arvidson, R., Beegle, L., Calef, F., Conrad, P. G., Dietrich, W. E., Eigenbrode, J., Gellert, R., Gupta, S., Hamilton, V., Hassler, D. M., Lewis, K. W., McLennan, S. M., Ming, D., Navarro-Gonzalez, R., Schwenzer, S. P., Steele, A., Stolper, E. M., Sumner, D. Y., Vaniman, D., Vasavada, A., Williford, K., Wimmer-Schweingruber, R. F., and Team, M. S. L. S.: In situ radiometric and exposure age dating of the martian surface, Science, 343, 1247166, https://doi.org/10.1126/science.1247166, 2014.
Fechtig, H. and Kalbitzer, S.: The diffusion of argon in potassium-bearing solids, in: Potassium–Argon Dating, edited by: Schaeffer, O. A., and Zahringer, J., Heidelberg, Spinger, 68–106, https://doi.org/10.1007/978-3-642-87895-4_4, 1966.
Futagami, T., Ozima, M., Nagal, S., and Aoki, Y.: Experiments on thermal release of implanted noble gases from minerals and their implications for noble gases in lunar soil grains, Geochimica et Cosmochimica Acta, 57, 3177–3194, https://doi.org/10.1016/0016-7037(93)90302-d, 1993.
Grootes, P. M., Steig, E. J., and Stuwer, M.: Taylor Ice Dome study 1993–1994: An ice core to bedrock, Antarctic Journal of the United States, 29, 79–81, 1994.
Hofmann, F., Cooperdock, E. H. G., West, A. J., Hildebrandt, D., Strößner, K., and Farley, K. A.: Exposure dating of detrital magnetite using 3He enabled by microCT and calibration of the cosmogenic 3He production rate in magnetite, Geochronology, 3, 395–414, https://doi.org/10.5194/gchron-3-395-2021, 2021.
Kaplan, M. R., Licht, K. J., Winckler, G., Schaefer, J. M., Bader, N., Mathieson, C., Roberts, M., Kassab, C. M., Schwartz, R., and Graly, J. A.: Middle to Late Pleistocene stability of the central East Antarctic Ice Sheet at the head of Law Glacier, Geology, 45, 963–966, https://doi.org/10.1130/g39189.1, 2017.
Ketcham, R. A.: Computational methods for quantitative analysis of three-dimensional features in geological specimens, Geosphere, 1, https://doi.org/10.1130/ges00001.1, 2005.
Ketcham, R. A. and Mote, A. S.: Accurate Measurement of Small Features in X-Ray CT Data Volumes, Demonstrated Using Gold Grains, Journal of Geophysical Research: Solid Earth, 124, 3508–3529, https://doi.org/10.1029/2018jb017083, 2019.
Ketcham, R. A., Slottke, D. T., and Sharp, J. M.: Three-dimensional measurement of fractures in heterogeneous materials using high-resolution X-ray computed tomography, Geosphere, 6, 499–514, https://doi.org/10.1130/ges00552.1, 2010.
Kurz, M. D.: In situ production of terrestrial cosmogenic helium and some applications to geochronology, Geochimica et Cosmochimica Acta, 50, 2855–2862, https://doi.org/10.1016/0016-7037(86)90232-2, 1986.
Larsen, I. J., Farley, K. A., and Lamb, M. P.: Cosmogenic 3He production rate in ilmenite and the redistribution of spallation 3He in fine-grained minerals, Geochimica et Cosmochimica Acta, 265, 19–31, https://doi.org/10.1016/j.gca.2019.08.025, 2019.
Licciardi, J. M., Kurz, M. D., Clark, P. U., and Brook, E. J.: Calibration of cosmogenic 3He production rates from Holocene lava flows in Oregon, USA, and effects of the Earth's magnetic field, Earth and Planetary Science Letters, 172, 261–271, https://doi.org/10.1016/s0012-821x(99)00204-6, 1999.
Lovera, O. M., Richter, F. M., and Harrison, T. M.: The thermochronometry for slowly cooled samples having a distribution of diffusion domain sizes, Journal of Geophysical Research: Solid Earth, 94, 17917–17935, https://doi.org/10.1029/JB094iB12p17917, 1989.
Lovera, O. M., Grove, M., Mark Harrison, T., and Mahon, K. I.: Systematic analysis of K-feldspar step heating results: I. Significance of activation energy determinations, Geochimica et Cosmochimica Acta, 61, 3171–3192, https://doi.org/10.1016/s0016-7037(97)00147-6, 1997.
Lyons, W. B., Deuerling, K., Welch, K. A., Welch, S. A., Michalski, G., Walters, W. W., Nielsen, U., Wall, D. H., Hogg, I., and Adams, B. J.: The Soil Geochemistry in the Beardmore Glacier Region, Antarctica: Implications for Terrestrial Ecosystem History, Sci. Rep., 6, 26189, https://doi.org/10.1038/srep26189, 2016.
Margerison, H. R., Phillips, W. M., Stuart, F. M., and Sugden, D. E.: Cosmogenic 3He concentrations in ancient flood deposits from the Coombs Hills, northern Dry Valleys, East Antarctica: interpreting exposure ages and erosion rates, Earth and Planetary Science Letters, 230, 163–175, https://doi.org/10.1016/j.epsl.2004.11.007, 2005.
Putkonen, J., Balco, G., and Morgan, D.: Slow regolith degradation without creep determined by cosmogenic nuclide measurements in Arena Valley, Antarctica, Quaternary Research, 69, 242–249, https://doi.org/10.1016/j.yqres.2007.12.004, 2008.
Schäfer, J. M., Ivy-Ochs, S., Wieler, R., Leya, I., Baur, H., Denton, G. H., and Schlüchter, C.: Cosmogenic noble gas studies in the oldest landscape on earth: surface exposure ages of the Dry Valleys, Antarctica, Earth and Planetary Science Letters, 167, 215–226, https://doi.org/10.1016/s0012-821x(99)00029-1, 1999.
Schaller, M., Ehlers, T. A., Blum, J. D., and Kallenberg, M. A.: Quantifying glacial moraine age, denudation, and soil mixing with cosmogenic nuclide depth profiles, Journal of Geophysical Research, 114, https://doi.org/10.1029/2007jf000921, 2009.
Shuster, D. L. and Farley, K. A.: Diffusion kinetics of proton-induced 21Ne, 3He, and 4He in quartz, Geochimica et Cosmochimica Acta, 69, 2349–2359, https://doi.org/10.1016/j.gca.2004.11.002, 2005.
Shuster, D. L., Farley, K. A., Sisterson, J. M., and Burnett, D. S.: Quantifying the diffusion kinetics and spatial distributions of radiogenic 4He in minerals containing proton-induced 3He, Earth and Planetary Science Letters, 217, 19–32, https://doi.org/10.1016/s0012-821x(03)00594-6, 2004.
Steig, E. J., Morse, D. L., Waddington, E. D., Stuiver, M., Grootes, P. M., Mayewski, P. A., Twickler, M. S., and Whitlow, S. I.: Wisconsinan and holocene climate history from an ice core at taylor dome, western ross embayment, Antarctica, Geografiska Annaler: Series A, 82, 213–235, https://doi.org/10.1111/j.0435-3676.2000.00122.x, 2000.
Swanger, K. M., Babcock, E., Winsor, K., Lamp, J. L., and Winckler, G.: Moraines and dead ice in Taylor Valley, Antarctica, record retreat of alpine and outlet glaciers from Marine Isotope Stage 5 to 4, Arctic, Antarctic, and Alpine Research, 57, https://doi.org/10.1080/15230430.2025.2478696, 2025.
Tremblay, M. M., Shuster, D. L., and Balco, G.: Diffusion kinetics of 3He and 21Ne in quartz and implications for cosmogenic noble gas paleothermometry, Geochimica et Cosmochimica Acta, 142, 186–204, https://doi.org/10.1016/j.gca.2014.08.010, 2014.
Tremblay, M. M., Shuster, D. L., Balco, G., and Cassata, W. S.: Neon diffusion kinetics and implications for cosmogenic neon paleothermometry in feldspars, Geochimica et Cosmochimica Acta, 205, 14–30, https://doi.org/10.1016/j.gca.2017.02.013, 2017.
Trull, T. W., Kurz, M. D., and Jenkins, W. J.: Diffusion of cosmogenic 3He in olivine and quartz: implications for surface exposure dating, Earth and Planetary Science Letters, 103, 241–256, https://doi.org/10.1016/0012-821x(91)90164-d, 1991.
- Abstract
- Introduction
- Method 1: Experimental design
- Method 2: Pyroxene fraction estimation
- Method 3: Cosmogenic 3He measurements
- Discussion
- Conclusion
- Code and data availability
- Author contributions
- Competing interests
- Disclaimer
- Acknowledgements
- Financial support
- Review statement
- References
- Supplement