the Creative Commons Attribution 4.0 License.
the Creative Commons Attribution 4.0 License.
 | 05 Jun 2026
Testing current estimates of the in situ cosmogenic 10Be production rate in the north-western British Isles, with implications for ice sheet behaviour during Termination 1
Gordon R. M. Bromley
Brenda L. Hall
Aaron E. Putnam
Thomas V. Lowell
Cosmogenic nuclide surface-exposure dating (SED) is a rapidly growing tool in geoscience owing to its unrivalled potential for directly dating rock surfaces and thus the geomorphic and climatic events they represent. Fundamental to the efficacy of the SED method is reliable constraint of the in situ production rate, which is typically calculated via calibration experiments: cosmogenic nuclide concentrations are measured in surfaces for which the true exposure age is known independently, allowing the production rate to be derived (in atoms g−1 yr−1) for the specific calibration site. This value can then be extrapolated to distal field sites using numerical scaling methods designed to account for spatial and elevational differences in geomagnetic and atmospheric shielding. Thanks to successive and increasingly co-ordinated calibration efforts, production rate estimates for the most widely used cosmogenic nuclide, beryllium-10 (10Be), have improved in recent decades, with the majority converging on sea-level high-latitude (SLHL) values of ∼ 3.8–4.1 atoms g−1 yr−1 (“St” scaling). Nonetheless, there remains sufficient variability among production rates to undermine the reliability of derived surface-exposure ages, particularly for applications to short-lived events such as the abrupt climate shifts of the last glacial termination. To help address this uncertainty, this paper reports new 10Be concentrations from deglacial surfaces on the Redpoint Peninsula in north-west Scotland that were exposed during retreat of the last British ice sheet. By comparing the surface-exposure results from eight current 10Be production rates to local radiocarbon constraint for deglaciation, we (1) evaluate the viability of each production rate for this site and (2) report a maximum SLHL value of 3.925 ± 0.07 atoms g−1 yr−1 (“St” scaling), above which resulting surface-exposure ages will be too young with respect to the Redpoint radiocarbon chronology. This study also demonstrates that the Rannoch Moor 10Be production rate, calibrated against independently dated glacial landforms in the central Scottish Highlands, gives the best match with the 14C control and thus is appropriate for Late Pleistocene applications at these geomagnetic latitudes.
- Article
(9538 KB) - Full-text XML
-
Supplement
(2114 KB) - BibTeX
- EndNote


Cosmogenic nuclide surface-exposure dating (SED) has revolutionised our understanding of Earth-surface processes, permitting the detailed reconstruction of geomorphological events and the processes driving them. From a palaeoclimatic vantage, the timing of past glacier–and therefore climate–fluctuations is now measurable from the exposure ages of relict moraines, which, in addition to traditional dating methods (e.g., 14C, OSL, dendrochronology), is providing glacier-derived climate records of sufficient resolution to be comparable globally and with potential climate forcers (Balco, 2020a; Putnam et al., 2023). As with all cosmogenic-nuclide geochronology tools, the SED method relies on quantification of nuclide production rates (in atoms g−1 yr−1) both for the period and location of study. The site-specific production rate is typically calculated by comparing the nuclide concentration in a rock surface for which the duration of exposure is known via independent means (Licciardi et al., 2006; Putnam et al., 2010; Kaplan et al., 2011; Kelly et al., 2015; Martin et al., 2015; Fenton et al., 2019). That site-specific value can, in principle, be extrapolated to any point on Earth's surface using numerical scaling models to account for geomagnetic and atmospheric variance (Balco et al., 2008; Lifton et al., 2014; Balco, 2020a). Over the last two decades, production rate estimates for commonly used nuclides such as beryllium-10 (10Be) and helium-3 have improved thanks to multiple calibration studies working to refine the accuracy and precision of exposure age calculations (see Borchers et al., 2016; Phillips et al., 2016; Schaefer et al., 2022). Nonetheless, for SED applications pertaining to relatively discrete Earth-surface processes and events, such as the abrupt climate shifts of the last glacial termination [“Termination 1”], the degree of production-rate uncertainty remains high: apparent exposure ages for a target landform can vary by > 10 % depending on the production rate calibration data set used (Putnam et al., 2019; Bromley et al., 2026). Given the crucial role of palaeoclimate reconstructions in projecting future climate, minimising age uncertainty due to production-rate choice remains essential.
While specific approaches to calibrating in situ cosmogenic nuclide production rates are numerous, independent age estimates for calibration surfaces are derived either directly or indirectly. In the former, the nuclide concentration in a target rock surface is compared to the duration of exposure of that surface, which is known independently via another dating technique (e.g., 14C, U Th, 40Ar 39Ar). One recent example from Scotland is the Rannoch Moor calibration dataset of Putnam et al. (2019), who measured 10Be in boulders on recessional moraines of the West Highland icefield, the deposition of which is bracketed chronologically by maximum- and minimum-limiting radiocarbon ages of marine shells and terrestrial plant macrofossils (Bromley et al., 2014, 2018), respectively. Beyond Scotland, similar calibrations based on glacial surfaces with direct independent age control exist for tropical South America (Farber et al., 2005; Kelly et al., 2015), Patagonia (Kaplan et al., 2011), North America (Swanson and Caffee, 2001), Greenland (Young et al., 2013, 2014), and Europe (Hofmann et al., 2024). In contrast, a number of studies have sought to quantify production rates by measuring nuclide concentrations in surfaces for which the exposure duration has been estimated indirectly, via correlation either with specific past climate events or with distal stratigraphies. Examples of this indirect approach include the first calibration experiments made in Scotland (Evans et al., 1997; Stone et al., 1998; Ballantyne and Stone, 2012), each of which employed assumed ages for the deglaciation of cirques to calibrate production rates from nuclide concentrations in cirque-floor glacial boulders. Whether calibrated against directly or indirectly dated surfaces, the accuracy of any production rate relies on our confidence in the true exposure age of the calibration surface and, fundamentally, the stratigraphic principles used to obtain that value. Discrepancies among current production-rate estimates, therefore, might reflect different approaches to deriving calibration age control as much as they do analytical and geomorphic variability (Swanson and Caffee, 2001).
Here, we employ the stratigraphic relationship between local deglaciation and the onset of lacustrine sedimentation at a site on the Redpoint Peninsula, north-west Scotland, to explore the viability of eight currently available 10Be production rates archived in the ICE-D: Production Rate Calibration Data database (Balco, 2020b; https://version2.ice-d.org/, last access: 15 March 2026) and applied to mid-latitude settings. While our evaluation focuses specifically on production rates calibrated in the Northern Hemisphere, and includes rates based on calibration surfaces with both direct and indirect age control, the results are relevant to cosmogenic geochronology more broadly and thus we discuss them in a global context. Having demonstrated the suitability of our preferred production rate for Late Pleistocene applications in the British Isles, we then provide an updated 10Be chronology for the Redpoint moraines, which are correlated with a key glaciological event – the Wester Ross Readvance – that punctuated retreat of the last British ice sheet (BIS) during Termination 1.
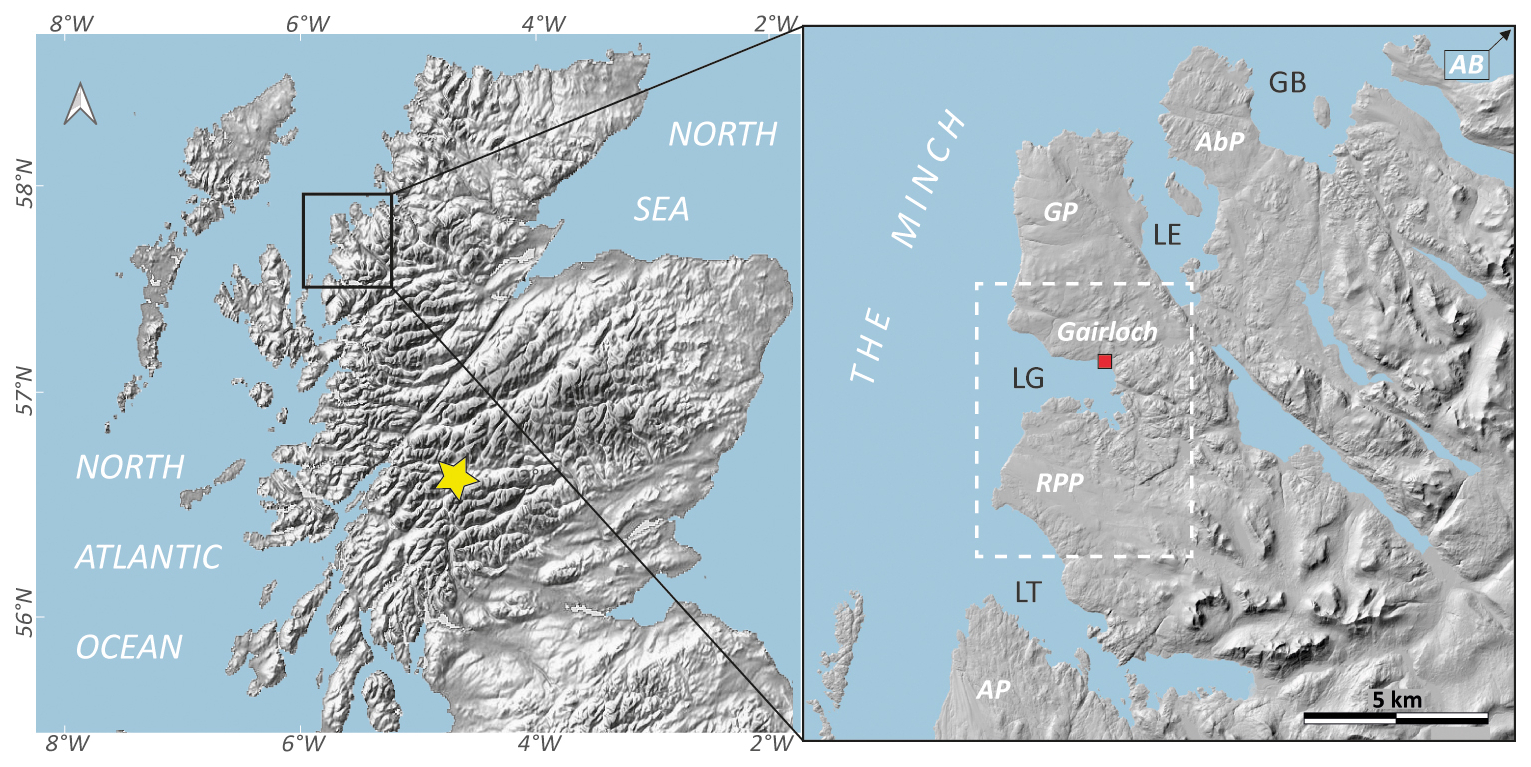
Figure 1Location of the Redpoint Peninsula (RPP) study area in north-west Scotland, along with the respective locations of sites mentioned in the text: LG – Loch Gairloch; LT – Loch Torridon; LE – Loch Ewe; GB – Gruinard Bay; AP – Applecross Peninsula; GP – Gairloch Peninsula; AbP – Aultbea Peninsula; AB – Achiltibuie; yellow star – Rannoch Moor. The white dashed rectangle denotes the area covered in Fig. 2.
2.1 Redpoint Peninsula
Situated between Loch Torridon to the south and Loch Gairloch to the north (Fig. 1), the Redpoint Peninsula comprises a low-relief glaciated landscape of shallow lake basins and ice-moulded bedrock hills largely underlain by arkosic sandstones and conglomerates of the Neoproterozoic Torridonian Group. Today, the Redpoint Peninsula is mantled by extensive blanket-peat cover and thin till-based soils. Climatically, the site's coastal setting means it experiences strongly maritime conditions, with abundant year-round rainfall (∼ 1450 mm), relatively mild temperatures (mean annual max. temp. 12 °C), and limited thermal seasonality (∼ 6 °C) (ECMWF Data). According to regional reconstructions, Late Pleistocene ice-flow across the peninsula would have been in a predominantly westerly to north-westerly direction (Charlesworth, 1956; Hughes et al., 2014; Merritt et al., 2019), with the most recent valley glaciers nourished in the high-relief Torridon mountains south-east of the peninsula (Sissons, 1977; Bickerdike et al., 2016). The most conspicuous and best-studied glacial deposits in the vicinity are those comprising the Redpoint moraine system, which can be traced for ∼ 12 km from the northern slope of Beinn Bhreac in the Shieldaig Forest to the coast at Opinan (Figs. 2 and 3). Together, this system of moraines describes an ice lobe flowing north-west out of the mountainous interior and discharging into Loch Gairloch. First described by Robinson and Ballantyne (1979), the Redpoint moraines occupy a stratigraphic position between the offshore LGM limits of the ice sheet (see Stoker et al., 1994; Bradwell and Stoker, 2015) and those of a small late-glacial icefield that accumulated in the Torridon uplands during the Loch Lomond Readvance (LLR) (Sissons, 1977; Bickerdike et al., 2016). Accordingly, the Redpoint moraines are interpreted as reflecting an episode of stabilisation or readvance of the decaying ice sheet during Termination 1 that is known as the Wester Ross Readvance (Robinson and Ballantyne, 1979; Sissons and Dawson, 1981; Sutherland, 1984).
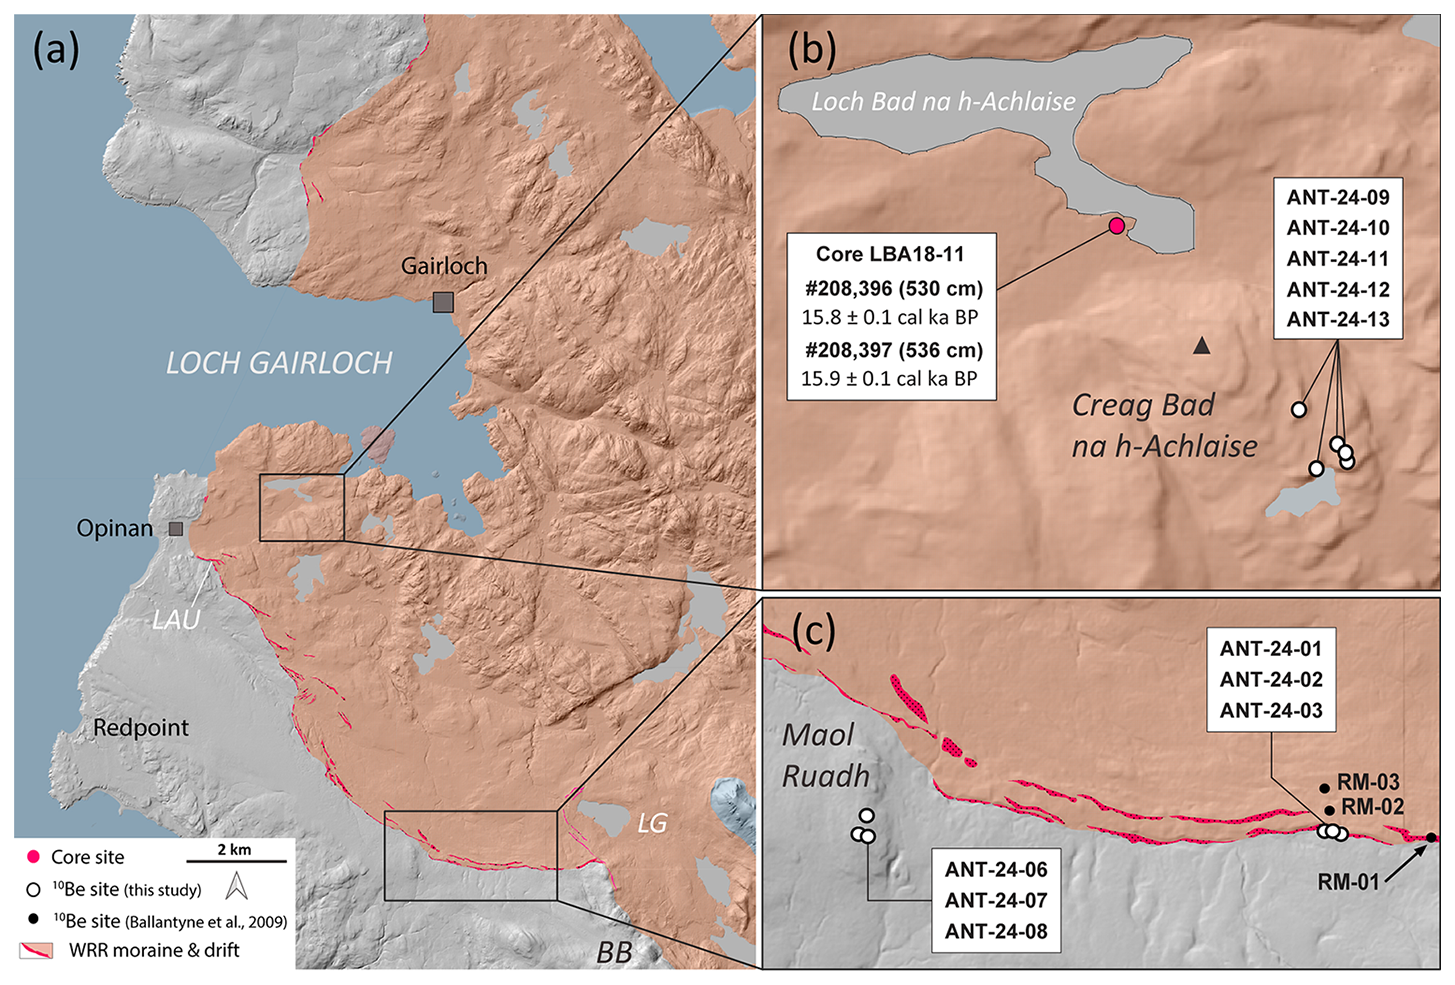
Figure 2(a) Distribution of glacial deposits corresponding to the Wester Ross Readvance on the Redpoint Peninsula and southern Gairloch Peninsula, showing sites mentioned in the text: LAU – Loch Airigh Uilleim; LG – Loch Gaineamhach; BB – Beinn Bhreac. (b) Locations of Loch Bad na h-Achlaise, core site LBA18-11 (Simms et al., 2022), and 10Be samples on Creag Bad na h-Achlaise. (c) Locations of 10Be samples on Maol Ruadh and the outer Redpoint moraine, including samples reported by Ballantyne et al. (2009) based on co-ordinates provided in that publication.
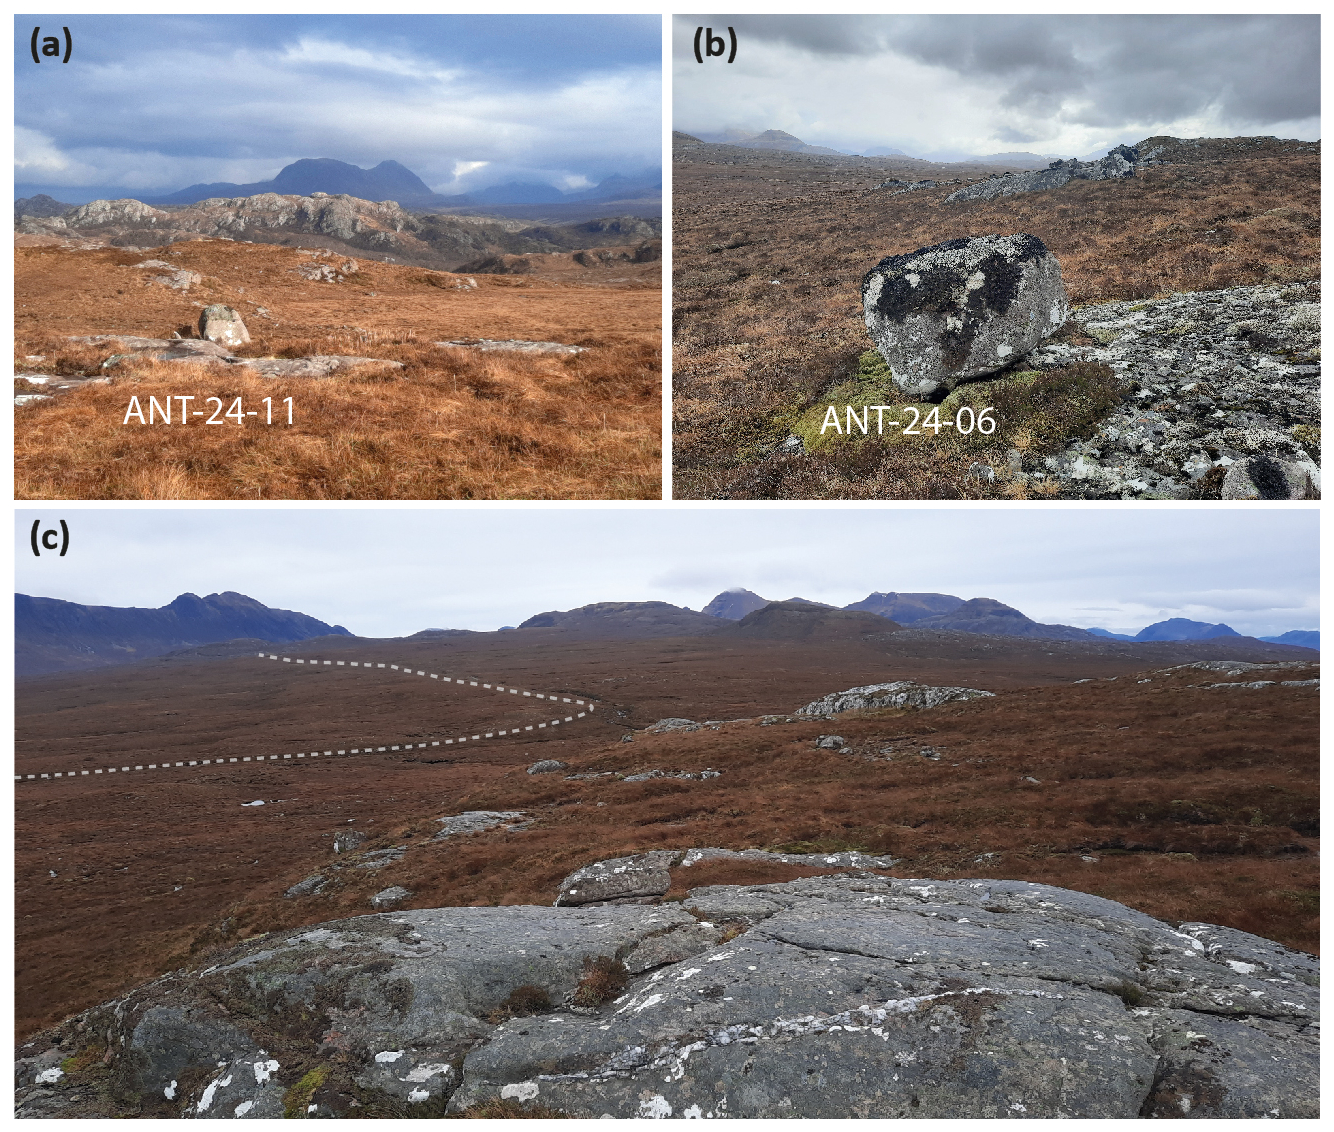
Figure 3Ice-moulded landscapes of the Redpoint Peninsula. (a) View to the south-east from Creag Bad na h-Achlaise, with boulder sampled for ANT-24-11 in the foreground. (b) Perched glacial boulder (ANT-24-06) on ice-moulded bedrock, Maol Ruadh. (c) View east from Maol Ruadh, towards the Torridon hills; position of the outer Redpoint moraine ridge is denoted by the dashed white line, the former ice margin having lain to the left (north) of the moraine.
2.2 The Wester Ross Readvance
Correlating the Redpoint moraines with stratigraphically and morphologically similar deposits on the neighbouring Applecross, Gairloch, and Aultbea Peninsulas (Fig. 1), Robinson and Ballantyne (1979) described a resurgent ice margin ∼ 30 km in length and concluded that the Wester Ross Readvance was of at least regional significance. Subsequent studies have sought to establish both the spatial continuation of the complex (Sissons and Dawson, 1981; Sutherland, 1984; Ballantyne et al., 1987; Bradwell et al., 2008) and, crucially, its age. In their original paper, Robinson and Ballantyne (1979) cited a radiocarbon date of 12 810 ± 155 14C years (15.3 ± 0.3 cal ka BP (before 1950): Q. 457) on post-glacial sediments at Loch Droma, approximately 40 km inland of the mapped Wester Ross Readvance limits (Kirk and Godwin, 1963), as minimum-limiting age control for the readvance. More recently, Everest et al. (2006) reported six 10Be surface-exposure ages from boulders on Gairloch sector of the Wester Ross Readvance moraine system; pruned of three outliers, the remaining three ages gave a mean of 16.3 ± 1.6 ka (1σ) with St scaling and assuming zero erosion (Everest et al., 2006). In contrast, Ballantyne et al. (2009) reported 14 10Be ages from Wester Ross Readvance moraines spanning the Applecross Peninsula to Achiltibuie (Fig. 1) and reported mean ages of 13.5 ± 1.2 ka (Lm scaling, zero erosion) and 14.0 ± 1.7 ka (De scaling; Desilets et al., 2006; 1 mm kyr−1 erosion). Citing broad agreement between their data and eight 10Be ages published by Bradwell et al. (2008) from apparently correlative landforms, Ballantyne et al. (2009) attributed the Wester Ross Readvance to the “Older Dryas” event (∼ 13.9–13.7 ka: Björck et al., 1998). Subsequent revisions of the Bradwell et al. (2008) and Ballantyne et al. (2009) data using lower production rates have produced progressively older ages for the readvance: Ballantyne and Stone (2012) reported revised mean ages of 14.3 ± 0.1 ka (1σ) to 15.1 ± 0.1 ka (1σ), reflecting a range of CRONUS-Earth production rates, while Ballantyne and Small (2019) derived a mean of 15.3 ± 0.7 ka (1σ) via an unpublished production rate value attributed to Fabel et al. (2012).
Approximately 2.5 km inside the Redpoint moraines mapped by Robinson and Ballantyne (1979), minimum-limiting age control for deglaciation from the Wester Ross Readvance limits is afforded by the Loch Bad na h-Achlaise sedimentary record (Simms et al., 2022) (Fig. 2). Part of a broader investigation of post-glacial relative sea-level and environmental change (Simms et al., 2022; Taylor et al., 2026), that study reported seven stratigraphically consistent 14C ages from core LBA18-11 (57.695° N, 5.741° W; Table S1 in the Supplement), which was extracted from the southern margin of the lake (∼ 13 m a.s.l.). The lowermost two 14C ages record organic sedimentation in the Loch Bad na h-Achlaise basin following the transition from marine to freshwater conditions (Simms et al., 2022): a 14C date of 13 185 ± 45 14C yr BP from 530 cm depth gives a calibrated age of 15.8 ± 0.1 ka BP (sample 208 396) with IntCal20 (Reimer et al., 2020), while a date of 13 240 ± 50 14C yr BP from 536 cm depth gives a calibrated age of 15.9 ± 0.1 ka BP (sample 208 397) (Fig. 2; Table S1). Both AMS measurements were made on plant fibres (Simms et al., 2022), the authors noting that they specifically avoided incorporating material that might introduce hardwater effects (e.g., aquatic algae, fine organic detritus, bulk sediment). Five additional 14C ages located at shallower depths in that same core exhibit strong stratigraphic consistency. Since organic sedimentation could only begin upon deglaciation, the Loch Bad na h-Achlaise 14C chronology indicates that coastal portions of the Redpoint Peninsula were ice free by at least ∼ 15.9 ka and that, due to the basin's position proximal to the Redpoint moraines, the Wester Ross Readvance culminated prior to that time. Central to our study, the basal 14C ages from Loch Bad na h-Achlaise also provide minimum-limiting age constraint for the true exposure ages of the boulders sampled for cosmogenic 10Be assay, all of which are situated above the ∼ 20 m marine limit reported by Simms et al. (2022).
A growing body of chronological evidence suggests that the Wester Ross Readvance occurred during Heinrich Stadial 1 (∼ 17.8–14.6 ka: NGRIP Members, 2004; WAIS Divide Project Members, 2015), though exactly when, for how long, and under what climate conditions remains unclear. At face value, the published 10Be moraine dates (Ballantyne and Small, 2019) are marginally younger than the minimum-limiting 14C ages from Loch Bad na h-Achlaise (Simms et al., 2022). Although relatively minor, this discrepancy might reflect real temporal variability along the length of the Wester Ross Readvance moraine system, or it might stem from methodological factors, such as the choice of 10Be production rate. In this study, we report new 10Be ages from the Redpoint Peninsula that document local ice sheet behaviour during Termination 1. Comparison of these 10Be data with the Loch Bad na h-Achlaise 14C chronology not only affords an upper bound on possible 10Be production rate values, it also provides a means for assessing the suitability of currently available 10Be production rate calibration datasets for calculating surface-exposure ages that are compatible with independent age controls. Finally, our dataset constitutes new constraint on the timing and duration of the Wester Ross Readvance, thereby helping place this event within a wider glaciological context.
3.1 Field Methods
We mapped the distribution of moraine ridges on the Redpoint Peninsula from satellite imagery and subsequent ground survey in 2024, using the prior mapping work of Robinson and Ballantyne (1979) as a guide, after which we drafted geomorphic maps onto Landmap imagery (2014) in QGIS (3.22.3) (Fig. 2). During fieldwork, we also identified glacial boulders suitable for 10Be surface-exposure dating, including boulders perched on bedrock surfaces at Creag Bad na h-Achlaise (Fig. 2b) and Maol Ruadh (Fig. 2c), and boulders embedded in the crest of the outermost Redpoint moraine immediately west of Beinn Bhreac (Fig. 4). The latter sampling site coincides broadly with that of Ballantyne et al. (2009) (see Fig. 2 and Sect. 5.3). Because surface-exposure dating relies on uninterrupted exposure of the rock surface, we targeted boulders in apparently stable positions that exhibit no indication of post-depositional movement or burial (e.g., by snow, peat, or vegetation). All samples comprise the upper few centimetres (< 5 cm depth) of material from the top surfaces of arkosic sandstone boulders and were collected using a hammer and carbide-tipped chisel. Sample location and elevation data were recorded with a differential GPS, while the topographic shielding for each boulder was recorded with a clinometer.
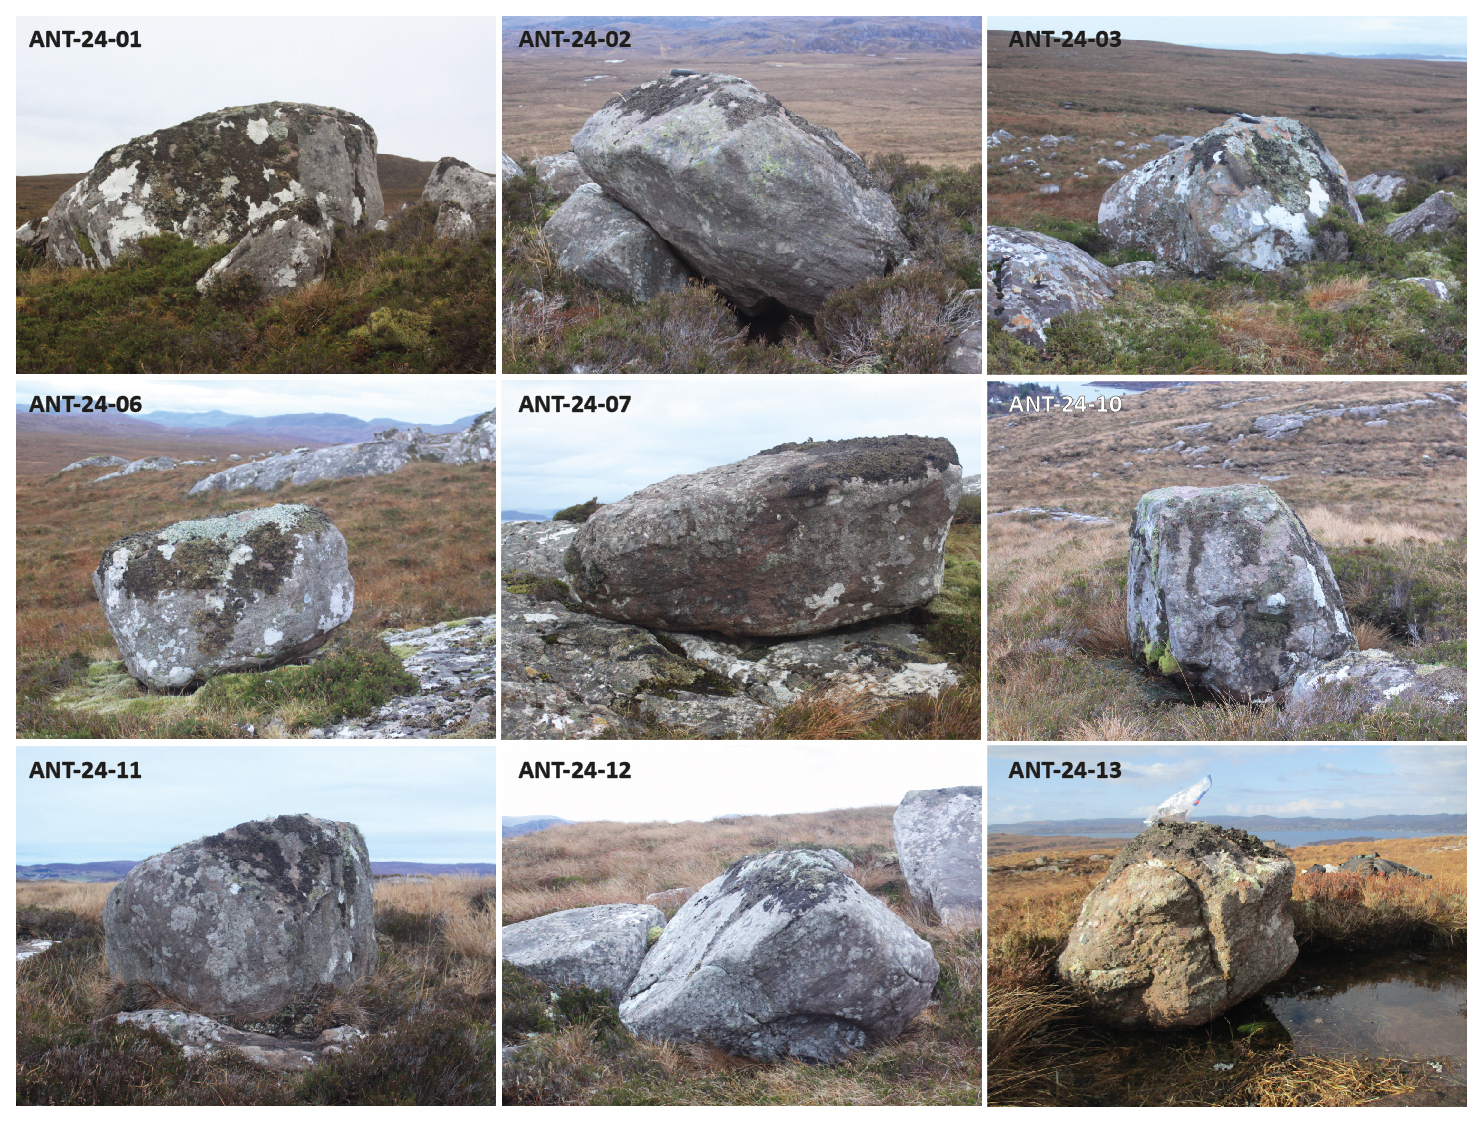
Figure 4Nine of the 11 Redpoint Peninsula glacial boulders targeted for cosmogenic 10Be measurement.
3.2 Laboratory Methods
All samples were prepared for 10Be chemistry in the Palaeoenvironmental Research Unit, University of Galway. Following crushing, we boiled the 250–850 µm fraction in 6M HCl to remove metal oxides and NaOH to remove silica cement, after which quartz was isolated via froth flotation. Quartz material was then purified via successive leaching in 2 % hydrofluoric acid (Kohl and Nishiizumi, 1992) and electromagnetic separation; purity of quartz aliquots was verified by inductively coupled plasma optical emission spectrometry (ICP-OES). Beryllium was isolated via a standardised ion-chromatography methodology at the Irish Cosmogenic Nuclide Facility, University of Galway (samples ANT-24-01-03, 06-09, and 13), and the University of Maine Cosmogenic Isotope Lab (samples ANT-24-10-12). Each sample was spiked with a custom-made, low-background phenakite 9Be carrier: samples prepared in Galway received the Dartmouth phenakite PK2 carrier (1005 ± 9 ppm) and those prepared in Maine the Phena7 carrier (940 ± 10 ppm). Carrier concentrations are measured repeatedly by ICP-OES to quantify any evaporation effects over time. Finally, BeO was combined with niobium powder and packed into stainless steel targets for accelerator mass spectrometry. Beryllium ratios were measured over four runs between 2024 and 2026 at the Center for Accelerator Mass Spectrometry (CAMS), Lawrence Livermore National Laboratory, relative to the 07KNSTD3110 standard (10Be 9Be = 2.85 × 10⁻¹²). Procedural blanks have 10Be concentrations of 8800–16 000 10Be atoms per blank (mean 12,759 ± 3778 atoms), representing ∼ 1 % of the 10Be concentration of a typical sample. All sample and procedural blank beryllium concentration data are reported in Tables 1 and 2, respectively.
Table 110Be sample details and nuclide data for eleven arkosic boulder samples. All measurements were made relative to the 07KNSTD AMS standard (ratio 2850 × 10−15). Sample density values and shielding corrections (calculated via the UW topographic shielding calculator; https://stoneage.ice-d.org/math/skyline/skyline_in.html, last access: 15 March 2026) for all samples are 2.7 g cm−2 and 0.999, respectively.
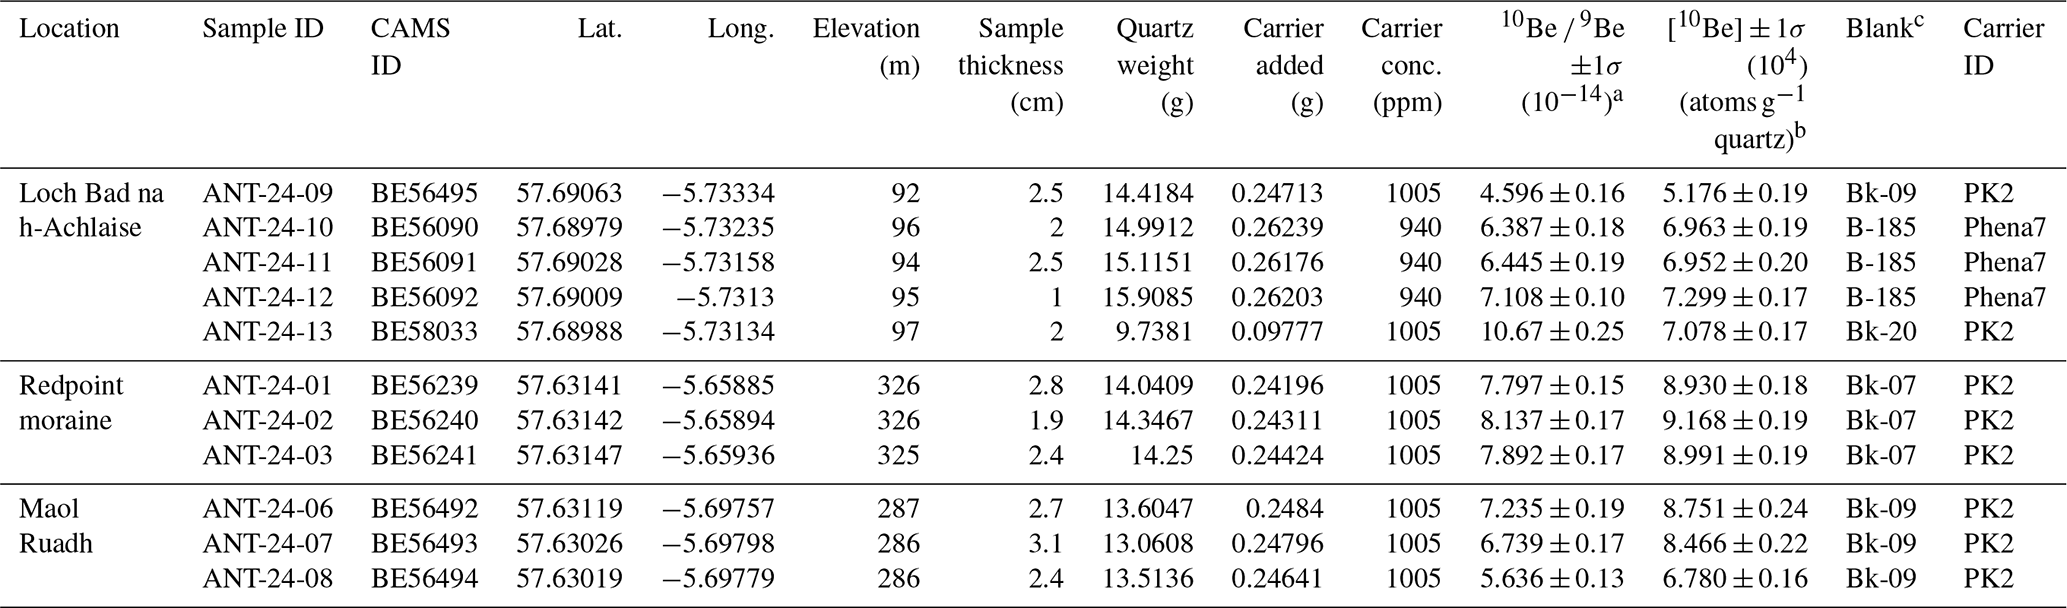
a Beryllium ratios reported with no blank correction. b Sample concentrations reported with blank correction. c Procedural blanks used to correct sample concentrations. Blank numbers refer to those given in Table 2.
Table 2Procedural blank 10Be data. All measurements were made relative to the 07KNSTD AMS standard.
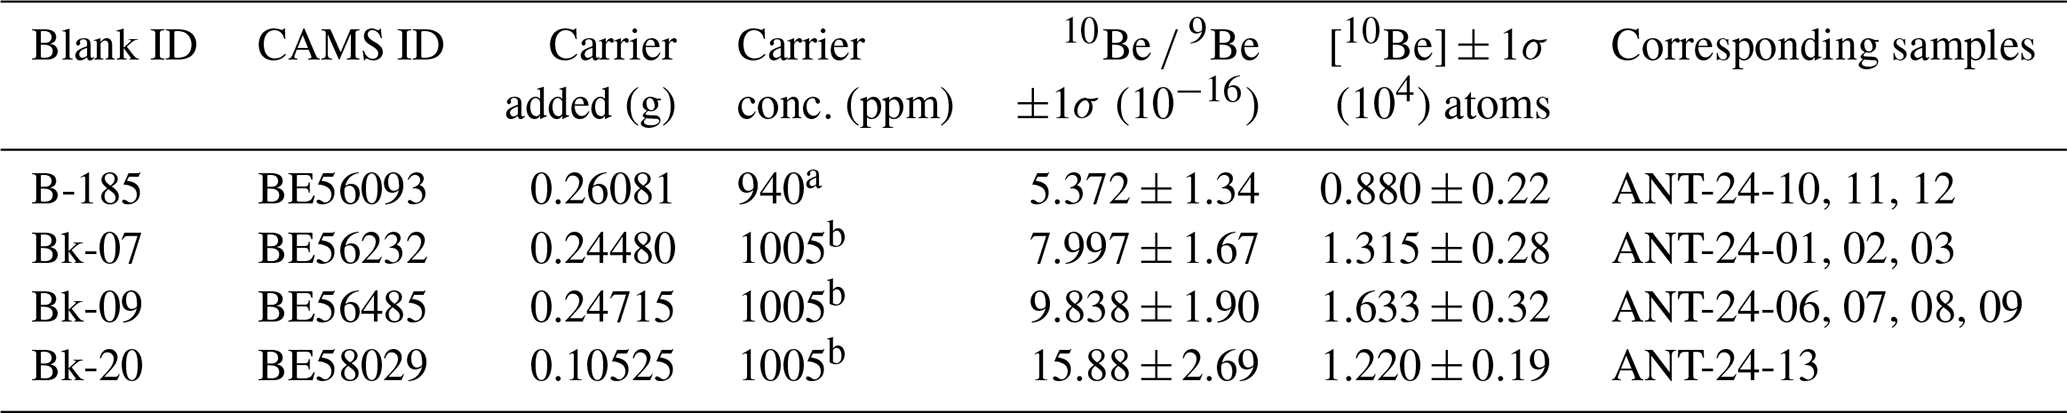
a University of Maine phenakite carrier Phena7. b Dartmouth phenakite carrier PK2.
3.3 Surface-exposure age calculation & production rate evaluation
Our assessment of current 10Be production rates is based on the direct and statistical comparison of apparent surface-exposure ages from the Redpoint Peninsula against the independent minimum age for local deglaciation provided by the basal radiocarbon ages from Loch Bad na h-Achlaise (Simms et al., 2022), situated proximal to the 10Be sample sites (Fig. 2). Recognising that the Loch Bad na h-Achlaise sedimentary record spans the transition from marine to lacustrine conditions, we used the Northern Hemisphere IntCal20 curve (Reimer et al., 2020) to derive calibrated ages due to strong stratigraphic and biological evidence for all dated organic material being of freshwater (rather than marine) origin. Stratigraphically, basal samples 208 396 (530 cm depth) and 208 397 (536 cm depth) are both derived from green-brown organic muds that are compositionally different from the underlying grey, marine-diatom-dominated minerogenic silts (Simms et al., 2022). The higher of the two samples (208 396) is from a layer characterised by 100 % freshwater diatom species (see Fig. S5 of Simms et al., 2022); the absence of salt-tolerant diatoms and the abundance of halophobe species indicate there was minimal, if any, marine input during deposition of this sedimentary unit (Alexander Simms, personal communication, 21 April 2026). The lower sample (208 397), which is indistinguishable in age from 208 396 (Table S1), is from the same sedimentological unit and also strongly dominated by freshwater diatom species (> 90 %), with only trace numbers of salt-tolerant species. Given these diatom assemblages and the strong stratigraphic and chronologic concordance of the two 14C ages, we conclude it is highly unlikely that the plant fibres dated by Simms et al. (2022) comprised marine carbon, thus justifying our use of the terrestrial calibration curve.
We employed the “R_Combine” function in OxCal 4.4 (version 177), in conjunction with IntCal20 (Reimer et al., 2020), to erive an average calibrated age of 15.9 ± 0.1 cal ka before 1950 (cal ka BP) for samples 208 396 and 208 397 (Table S1; Fig. S1); this corresponds to a 95 % range of 15.7–16.0 cal ka BP. Adjusted for the 1950-sampling age offset (samples were collected in CE 2024), this gives a conservative minimum age of 15 932 ± 72 years (15.9 ± 0.1 cal ka) for the onset of 10Be accumulation in all our sampled surfaces. Recent age-depth modelling by Taylor et al. (2026) suggests an earlier (∼ 16.7 ka) onset for sedimentation, and thus ice-free conditions, at Loch Bad na h-Achlaise. However, as that is an extrapolated estimate, and given the potential for variable sedimentation rates, we focus our assessment on the absolute age control afforded by the replicable basal ages of Simms et al. (2022).
For this assessment, we compared apparent 10Be surface-exposure ages calculated via eight production rate calibration data sets developed for boreal mid-latitude settings: the Rannoch Moor (Putnam et al., 2019), Glen Roy (Small and Fabel, 2015), and Isle of Skye & Highlands (Ballantyne and Stone, 2012; Borchers et al., 2016) sites from Scotland; the Chironico site from Switzerland (Claude et al., 2014); the Mount Billingen site from southern Sweden (Stroeven et al., 2015); the western Norway (Goehring et al., 2012) and north-eastern North America (NENA) (Balco et al., 2009) sites; and the primary production rate calibration dataset of Borchers et al. (2016) (hereafter the “Borchers calibration dataset”), which was developed for global applications. Data for each production rate calibration data set were extracted from the ICE-D: Production Rate Calibration Data online database (https://version2.ice-d.org/production%20rate%20calibration%20data/, last access: 15 March 2026); we note that we did not include any samples identified by the original authors as outliers. A ninth production rate calibration, known as the Loch Lomond production rate (LLPR), is currently used in the British Isles. However, at the time of writing the calibration process underlying the LLPR remains unpublished beyond an early reference to an “in prep” study (Fabel et al., 2012) and so we cannot consider it in our assessment. For each production rate calibration data set listed above, we calculated apparent surface-exposure ages with version 3 (v.3) of the University of Washington (UW) online calculator (https://hess.ess.washington.edu, last access: 15 March 2026), which incorporates site-specific air pressure values derived from the ERA-40 Reanalysis (Uppala et al., 2005). Calculated ages are scaled according to the three standard scaling methods employed therein, specifically, the time-independent (“St”) Lal (1991)/Stone (2000) method and the time-dependent Lal/Stone (“Lm”) and “LSDn” (Lifton et al., 2014) methods. We corrected beryllium concentrations for horizon shielding using the UW online topographic shielding calculator (https://stoneage.ice-d.org/math/skyline/skyline_in.html, last access: 15 March 2026). The UW online calculator employs summary statistics to identify likely outliers, specifically by computing the P-value of χ2 value of a population's mean and incrementally removing samples with the highest χ2 values (relative to that mean) until the population's P-value is > 0.01 (https://sites.google.com/a/bgc.org/v3docs/, last access: 15 March 2026).
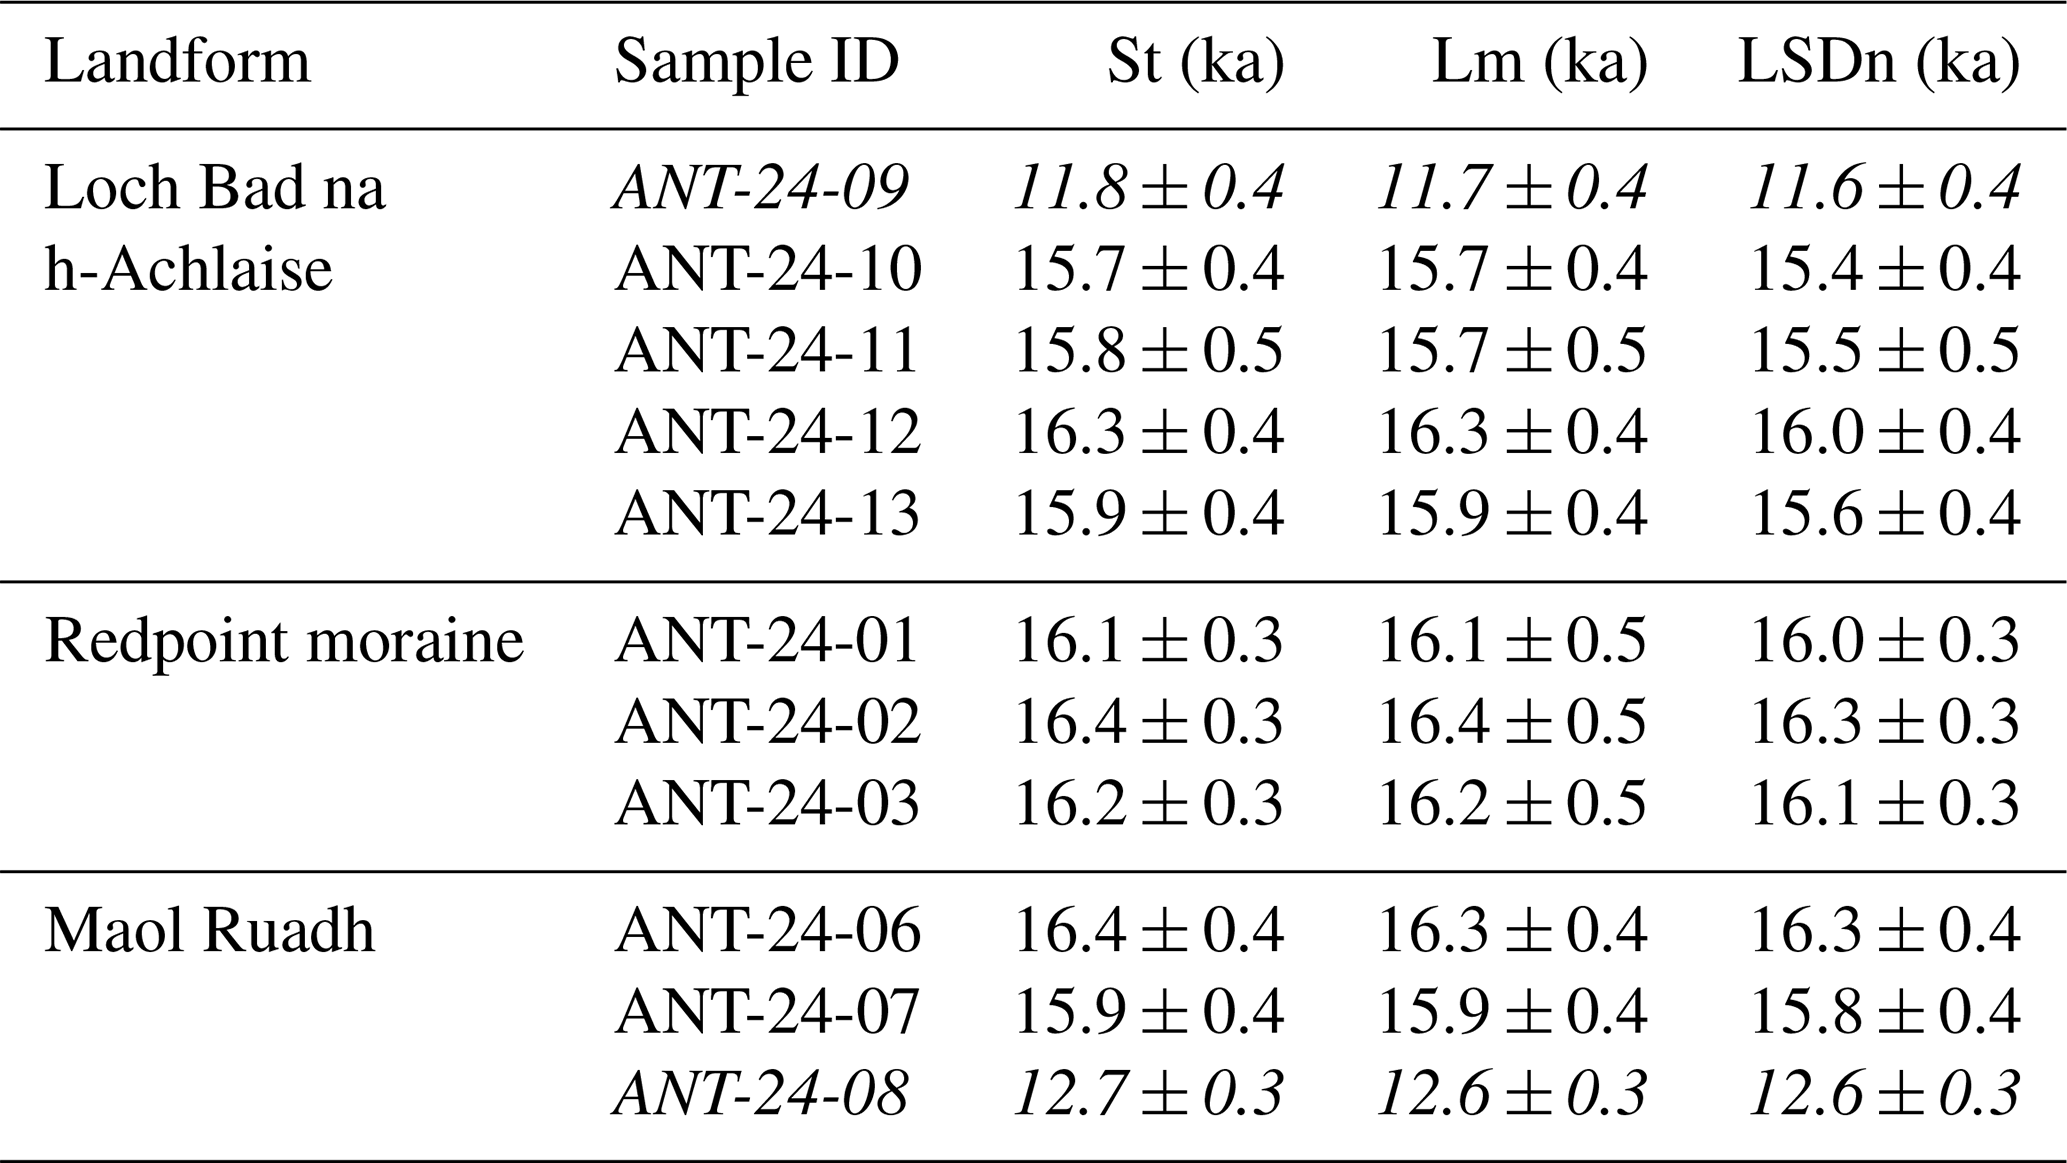
Table 3Beryllium-10 surface-exposure ages for eleven boulder samples calculated with the Rannoch Moor production rate (Putnam et al., 2019) and scaled via the three default models in the UW online calculator v.3. Ages are reported with individual internal uncertainties, which include the reported analytical uncertainty (1σ) propagated with machine background, procedural blank, and boron correction uncertainties. Italics denote outliers.
The rough appearance of rock surfaces in our study area, including the abundance of quartz pebbles protruding 2–3 cm, indicates that post-depositional weathering has occurred throughout our study area. Given the likelihood of variable (and unquantifiable) erosion rates among the eleven target boulders, and given that the resistant mineral is quartz (i.e., the target mineral for 10Be analysis), we do not correct nuclide age calculations for erosion. We note that the production rate calibration data sets evaluated here also do not include corrections for erosion. Therefore, any common effects of erosion between the boulders sampled here and those sampled for production-rate calibration are inherently incorporated into the reported surface-exposure age calculations. Similarly, we assume that shielding of boulders by snow has been minimal due to (1) the characteristically low winter snow depths experienced on Scotland's west coast and (2) the exposure of this open landscape to strong winds, which typically preclude significant snow accumulation. We do not apply any correction for post-depositional uplift in our exposure-age or production rate calculations. All apparent surface-exposure ages given in Table 3 and Fig. 5 are reported with internal uncertainties that incorporate the analytical error, propagated with machine background, procedural blank, and boron correction uncertainties (where applicable). Site-specific and cumulative age populations depicted in Fig. 5 are reported with both the standard error of the mean (SEM) and external uncertainty (SEM propagated with the 2.7 % Rannoch Moor production rate uncertainty).
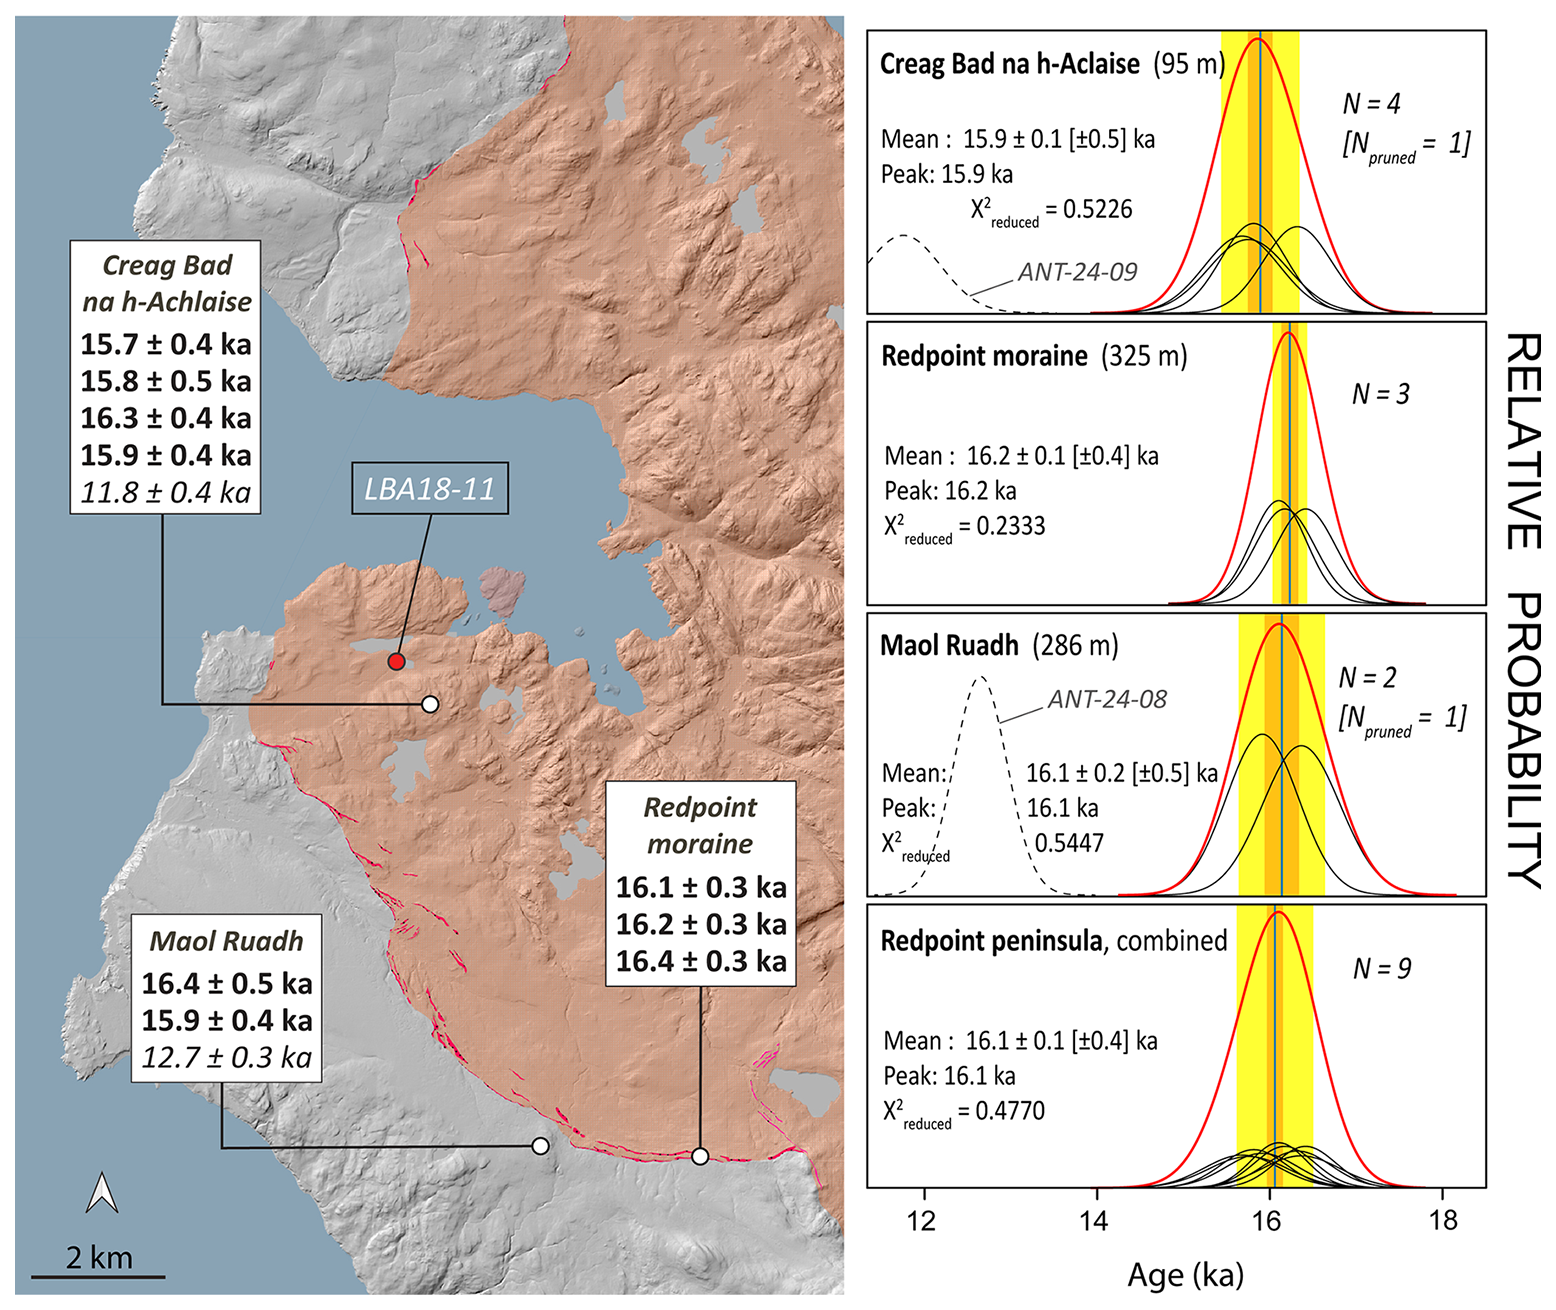
Figure 510Be surface-exposure ages (left) calculated using the Rannoch Moor production rate and time-independent “St” scaling, reported with internal uncertainties. Normal kernal density plots (right) and statistics for site-specific populations and the cumulative age population; the latter highlights the internal consistency among the three datasets and confirms that they are indistinguishable within the resolution of the method. Mean ages reported with SEM [external] uncertainty. Thin black curves are Gaussian approximations of individual 10Be measurements, while thick red lines represent the summed probability for each distribution. Dashed black lines at Maol Ruadh and Creag Bad na ha-Achlaise are outlier samples ANT-24-08 and ANT-24-13 (italics on map), respectively. Vertical bluelines denote the mean; vertical orange and yellow shading denote the SEM and external uncertainty (SEM propagated with 2.7 % production rate uncertainty), respectively, of each population.
4.1 Moraine distribution and character
The Redpoint moraine system comprises a suite of lateral ridges that, together, describe successive positions of the left margin of a NW-flowing ice lobe. At its seaward end, the moraine complex descends towards the west immediately north of Loch Airigh Uilleim, becoming indistinct at ∼ 30 m elevation above the settlement of Opinan. At its inland extremity, the outer moraine of the complex abuts the north-west ridge of Beinn Bhreac at ∼ 350 m elevation (Fig. 2), less than 100 m west of a separate and stratigraphically younger moraine complex that descends from the same hillside towards the foot of Loch Gaineamhach (Fig. 2). Individual ridges comprising the Redpoint moraine system range from < 1 to 3 m in relief and are typically mantled with sandstone cobbles and boulders (Fig. 6). The few exposures we observed in the moraine ridges revealed a clast-supported matrix dominated by boulders. Both distal to and proximal to the Redpoint moraines, the land surface is extensively peat-covered. Our Maol Ruadh and Creag Bad na h-Achlaise sampling sites both form prominent topographic highpoints underlain by ice-moulded bedrock and mantled with perched glacial boulders (Fig. 3); Maol Ruadh rises ∼ 15 m above the surrounding landscape, while the summit of Creag Bad na h-Achlaise is ∼ 80 m above Loch Bad na h-Achlaise to the north (Fig. 2).
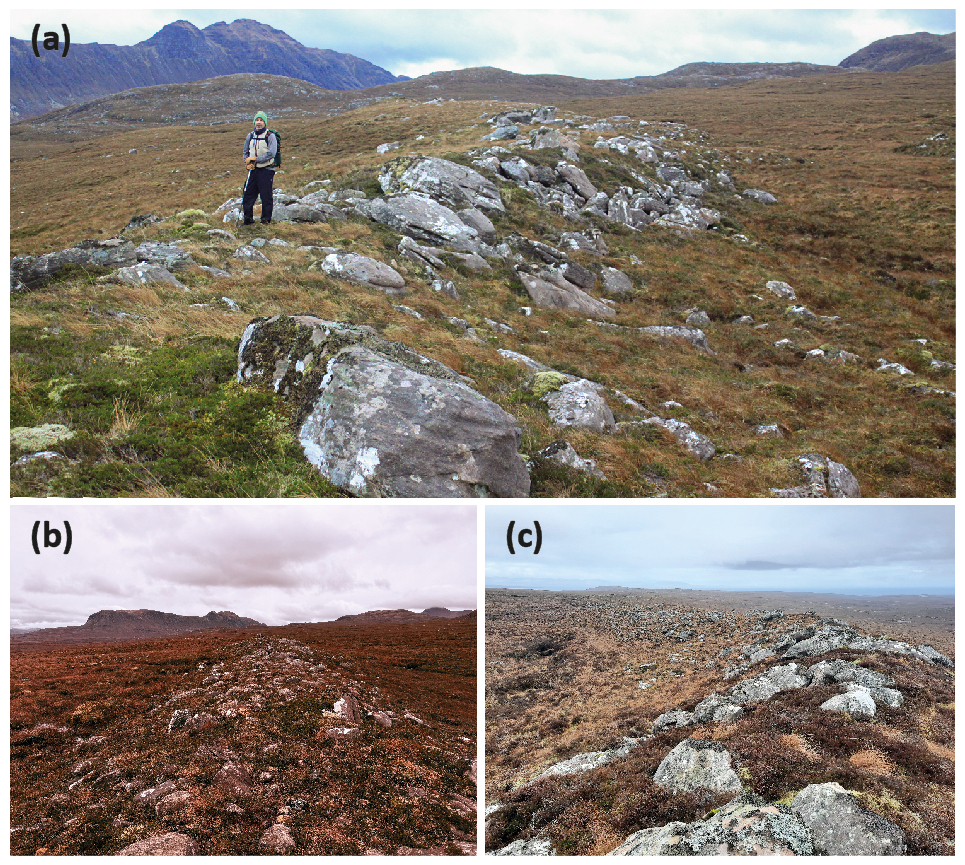
Figure 6Southern portion of the outer Redpoint moraine, in the vicinity of samples ANT-24-01, 02, and 03 viewed (a, b) from the west and (b) from the east.
4.2 Beryllium concentration data and surface-exposure ages
Among their respective site groups, the measured 10Be concentrations exhibit a high degree of internal consistency. Four samples from Creag Bad na h-Achlaise have concentrations ranging from 6.95 ± 0.20 (× 104) to 7.30 ± 0.17 (× 104) atoms g−1; three samples from the outer Redpoint moraine crest have concentrations ranging from 8.93 ± 0.18 (× 104) to 9.17 ± 0.19 (× 104) atoms g−1 (Table 1); and two samples from Maol Ruadh, outboard of the moraine, have concentrations of 8.47 ± 0.22 (× 104) and 8.75 ± 0.24 (× 104) atoms g−1 (Table 1). Two samples (ANT-24-08 and 09) returned concentrations that are significantly lower than their neighbours (Table 1) and thus were identified by the UW online calculator as statistical outliers; we do not consider those measurements further in this paper. Treated as surface-exposure ages so as to normalise 10Be measurements for differences in sample elevation, thickness, and horizon shielding, the nine remaining samples (shown in Fig. 5 calculated with the Rannoch Moor production rate) together form a tight normal age distribution with a low reduced chi-squared value (Fig. 5), confirming a degree of variability that, statistically, can be explained by analytical uncertainty alone. Consequently, we can evaluate the eight 10Be production rates by comparing the composite Redpoint Peninsula population (n = 9) to the minimum-limiting 14C basal ages from Loch Bad na h-Achlaise. The uncertainties reported for each 10Be population discussed in Sect. 4.3 include both the standard error of the mean (SEM) and the external uncertainty, the latter being the SEM propagated with the uncertainty of each respective production rate.
4.3 Comparison of apparent exposure age with minimum-limiting 14C control
Figure 7a depicts the age-depth profile from Loch Bad na h-Achlaise, based on the 14C dataset of Simms et al. (2022) and described in Sect. 3.3; the combined calibrated age of samples 208 396 and 208 397 (15.9 ± 0.1 ka) is represented by the vertical shaded bars (Fig. 7) and is taken as minimum-limiting 14C control for deglaciation. Figure 7b illustrates the population of new Redpoint Peninsula exposure ages (n = 9), calculated using the Rannoch Moor production rate calibration data set and the time-independent “St” scaling, relative to the 14C control. We employ the St method because it exhibited the closest agreement among reference production rates determined from Rannoch Moor and other calibration sites from around the world based on independent chronologies (Putnam et al., 2019); we note, however, that, owing to the proximity of the Redpoint Peninsula to Rannoch Moor, the three default scaling methods used in v.3 of the UW online calculator give results that agree closely with one another. We employ the same approach in Fig. 8, which demonstrates how apparent exposure ages derived from all eight 10Be production rates (Sect. 3.3) relate to the 14C control and to one another. All individual 10Be exposure ages resulting from the various production rates are reported in Table S2. In this assessment, we deliberately included production rates employed in the circum-North Atlantic region that have been calibrated either (i) against independently dated landforms (blue boxes in Fig. 8) or (ii) against surfaces for which the exposure age has been inferred from indirect sources (pink boxes in Fig. 8). Given its broad application as the default production rate in the UW online calculator, we also assessed the output of the Borchers calibration dataset (black box in Fig. 8). With the Loch Bad na h-Achlaise record as an independent geologic benchmark, we consider a production rate to be in stratigraphic accord with the local stratigraphy (i.e., viable) if the derived 10Be surface-exposure ages are older than or statistically indistinguishable from (within analytical uncertainties) the minimum-limiting 14C age for deglaciation (15.9 ± 0.1 ka). Where a production rate results in exposure ages that are young relative to the onset of organic sedimentation, this constitutes a poor fit with the local chrono-stratigraphy and identifies the production rate as unrealistically high.
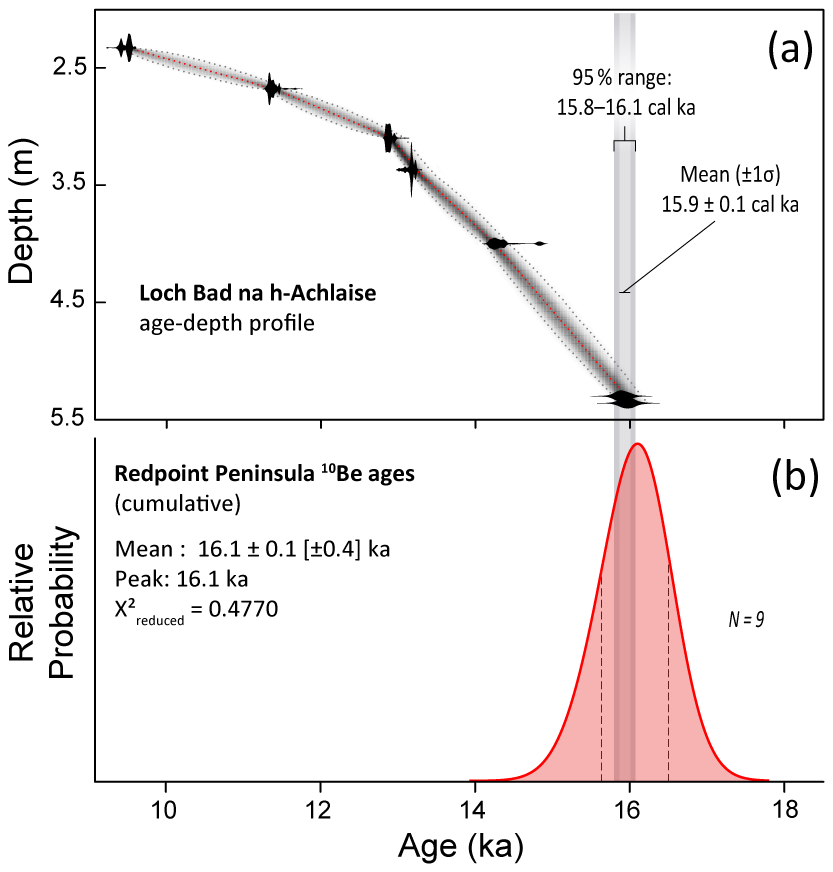
Figure 7(a) Bayesian age-depth model for the LB18-11 14C dataset created using R Bacon (Blaauw and Christen, 2011). Vertical grey bars denote the 1σ and 95 % confidence values for the lower two 14C samples, which have been adjusted for the 1950–present offset. (b) Summed probability for the cumulative Redpoint age population (dashed vertical lines denote external uncertainty) relative to the minimum-limiting 14C age control (vertical grey bars) from Loch Bad na h-Achlaise core LB18-11.
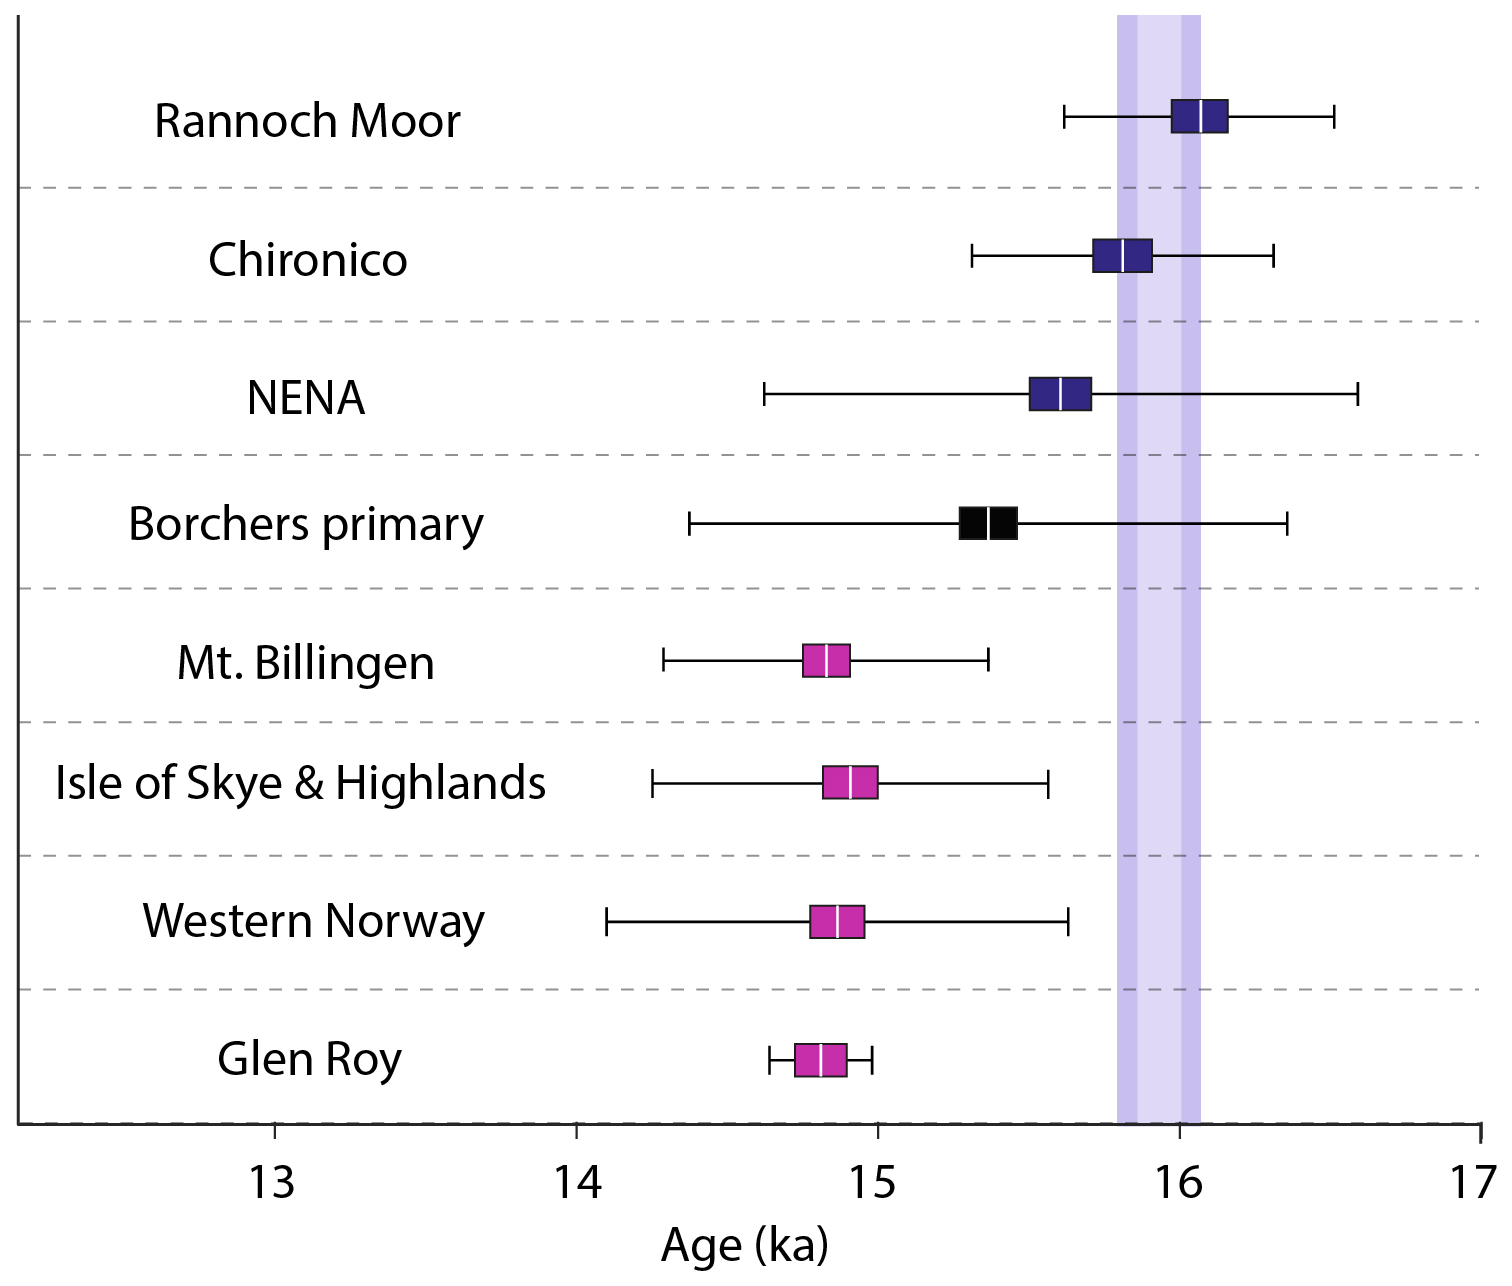
Figure 8Redpoint 10Be ages calculated with eight current production rate calibration datasets used in the northern middle latitudes: (1) Rannoch Moor (Putnam et al., 2019); (2) Chironico (Claude et al., 2014); (3) NE North America (NENA: Balco et al., 2009); (4) Borchers primary dataset (Borchers et al., 2016); (5) Mount Billingen (Stroeven et al., 2015: this dataset comprises the five bedrock samples identified by those authors as giving the most reliable exposure histories); (6) Isle of Skye & Highlands dataset (Ballantyne and Stone, 2012; Borchers et al., 2016); (7) western Norway (Goehring et al., 2012); and (8) Glen Roy (Small and Fabel, 2015). All ages were calculated with the UW online calculator (v.3) and “St” scaling. Blue and pink boxes denote the standard error of the mean (SEM) for populations calculated with production rates based on directly and indirectly dated calibration surfaces, respectively, while the black box represents the same for the Borchers calibration dataset; vertical white stripes in each box denote the mean; horizontal black whiskers are the external uncertainties (SEM propagated with production rate uncertainty) from Fig. 5. Light and dark vertical blue/grey bands are the combined calibrated LB18-11 basal 14C ages (adjusted for 1950–present offset) at 1σ and 95 % probability, respectively.
5.1 Performance and refinement of existing production rate calibration data sets
The sedimentary stratigraphy from Loch Bad na h-Achlaise suggests that the two bottommost 14C ages, although replicable (Fig. S1), probably underestimate the true age of deglaciation; sufficient time had already elapsed for the basin to have transitioned from a marine to freshwater system via glacio-isostatic rebound (Simms et al., 2022; Taylor et al., 2026) and for vegetation to have migrated into the catchment. Therefore, we take the combined basal date of 15.9 ± 0.1 ka as a minimum-limiting benchmark for locally ice-free conditions. Against this benchmark, two of the eight production rate calibrations evaluated (Rannoch Moor and Chironico) produce mean exposure-age values that overlap with the 14C age control within 1σ (Fig. 8). Of these, only the Rannoch Moor-derived mean age (16.1 ± 0.1 ka) predates the onset of lacustrine sedimentation in Loch Bad na h-Achlaise (15.9 ± 0.1 ka), suggesting that this production rate gives the closest fit with the Redpoint chrono-stratigraphy (Figs. 7 and 8). The remaining six production rates give mean exposure-age values that are younger than the radiocarbon control and thus underpredict the age of deglaciation at this site by varying durations (Fig. 8). Furthermore, although two of the remaining six exposure-age calculations result in some statistical overlap between the 10Be ages and the 14C target when considering the outer limits of respective external uncertainties, that overlap primarily reflects the large external uncertainties associated with those particular calibration datasets (Fig. 8). Use of these rates would still produce mean exposure ages that are significantly and systematically younger than the minimum-limiting age of deglaciation determined by independent means. The results depicted in Fig. 8 are corroborated by Welch's unequal-variance t-test statistics (Table S3): the Rannoch Moor, Chironico, and NENA datasets yield mean values that are indistinguishable statistically from the mean 14C age, as does the Borchers dataset due to its relatively large uncertainties; in contrast, mean ages derived from the Mt. Billingen, Isle of Skye & Highlands, Glen Roy, and Western Norway datasets are statistically different from the 14C.
The largest 10Be 14C age offsets arise from the Isle of Skye & Highlands primary dataset (Ballantyne and Stone, 2012; Borchers et al., 2016), the Glen Roy dataset (Small and Fabel, 2015), the Mount Billingen dataset (Stroeven et al., 2015), and the Western Norway dataset (Goehring et al., 2012); these give mean exposure-age values 7 %–8 % younger than the basal 14C control (Fig. 8). One possible cause of this disagreement is the lack of independent, quantitative age control for the calibration surfaces used in those studies. For example, the Isle of Skye & Highlands primary dataset (Ballantyne and Stone, 2012; Borchers et al., 2016) is calibrated against the presumed age of deglaciation of selected cirques following the Loch Lomond Readvance; those authors cited well-dated shifts in distal palaeoecological and Greenland oxygen isotope records as correlatives for cirque deglaciation, yet no direct age control for cirque deglaciation exists (Ballantyne and Stone, 2012). Similarly, the Glen Roy calibration was determined by correlating the 325 m wave-cut shoreline with a varve sequence located ∼ 25 km distant (Small and Fabel, 2015), for which unequivocal age control is absent (see Putnam et al., 2019), while the western Norway calibration dataset relies upon assumed correlation of the timing of moraine-ridge construction and sedimentation changes in a lake that is not associated with the sampled landform. Finally, the Mount Billingen calibration assumes bedrock erosional features correspond to the indirectly dated drainage of the Baltic Ice Lake (Stroeven et al., 2015).
The sub-optimal performance in our study of production rates calibrated against indirectly dated surfaces (Fig. 8) has ramifications for surface-exposure dating generally. Both the UW (v.3) and CREp (https://crep.otelo.univ-lorraine.fr/#/, last access: 15 March 2026) online calculators employ the Borchers primary dataset as the “global” default; yet that compilation incorporates production rates calibrated against both directly and indirectly dated rock surfaces, including one site we have shown to produce exposure ages that are untenably young (Isle of Skye & Highlands). Although the Borchers primary dataset does technically pass the t-test, as noted above, this is on account of the relatively large total scatter of that calibration dataset (6.9 %); our findings suggest that using the Borchers primary dataset will also result in exposure ages that are too young stratigraphically if not statistically (Fig. 8). Confirming that the latter is not a function of geomagnetic distance from our field site (e.g., scaling effects), Fig. S3 and Table S3 show how exposure ages yielded by independently dated calibration datasets from the Southern Hemisphere (Putnam et al., 2010; Kaplan et al., 2011; Kelly et al., 2015) also agree statistically with the minimum-limiting 14C control. Indeed, the choice of scaling model does not impact the overall relative performance of the eight production rates evaluated with respect to the 14C benchmark (Table S2), though we do observe that St generally gives the closer fit. In summary, of the eight production rate datasets assessed, the Rannoch Moor dataset gives the best fit between apparent 10Be ages and 14C control on the Redpoint Peninsula.
Recognising the potential lag between deglaciation and deposition of organic-bearing lacustrine sediments (see above), we do not attempt to use the Loch Bad na h-Achlaise radiocarbon data as the basis for calibrating a new absolute 10Be production rate. Instead, the basal 14C chronology permits us to derive an upper limiting production rate, which is beneficial given that the Rannoch Moor dataset delivers a range of possible values (3.88–3.95 atoms g−1 yr−1) (Putnam et al., 2019), with the “mid-point” rate (3.912 ± 0.106 atoms g−1 yr−1) serving as a convenient reference rate for exposure-age calculation. Employing the nine new 10Be measurements in Table 1, we used the production rate calibration tool in the UW online calculator (v.3) (https://hess.ess.washington.edu/math/v3/v3_cal_in.html, last access: 15 March 2026) to derive a maximum-limiting production rate for Scotland; all input data for this calculation are provided in Table S4. According to the default scaling models utilised in the online calculator, this approach yields maximum reference sea-level high-latitude (SLHL) production rates of 3.928 ± 0.067 atoms g−1 yr−1 (1.7 %) with St scaling (Lal, 1991; Stone, 2000) and 3.930 ± 0.068 atoms g−1 yr−1 (1.7 %) with Lm scaling (Balco et al., 2008), and a non-dimensional correction factor of 0.774 ± 0.017 (2.2 %) using the LSDn model (Lifton et al., 2014). Use of a production rate higher than this maximum-limiting value will result in surface-exposure ages that are too young with respect to minimum-limiting 14C dates of deglaciation from Loch Bad na h-Achlaise.
5.2 Revisiting the Rannoch Moor calibration site
The results presented above confirm that the Rannoch Moor calibration dataset produces surface-exposure ages that are consistent with independently dated Late Pleistocene surfaces in NW Scotland. This production rate is underpinned by 10Be measurements from 11 boulders located on the crests of recessional moraines of the late-glacial West Highland ice field (WHIF) on Rannoch Moor, central Scottish Highlands (56.63° N, 4.77° W; ∼310–330 m a.s.l.), the age of which is bracketed by 14C ages (Putnam et al., 2019). Following the pioneering work of Lowe and Walker (1976) and Walker and Lowe (1979), who provided the first radiocarbon evidence for ice-free conditions on Rannoch Moor, Bromley et al. (2014) reported 20 AMS 14C ages of plant macrofossils (and one beetle) from the basal sections of 13 cores extracted from seven moraine-dammed basins (Fig. 9). Together, the cores cover ∼ 12 km2 of the moor's western margin, in which recessional moraines of the decaying WHIF are abundant. Each core comprised a minerogenic basal unit, indicating early postglacial sedimentation, overlain by increasingly organic units and peat (Bromley et al., 2014). Plant remains in the basal clays were interpreted as indicating migration of vegetation into the Rannoch Moor basin. Acknowledging that the process of plant colonisation is neither spatially nor temporally uniform, that study reported 14C ages ranging from 10 320 ± 270 to 12 480 ± 100 cal yr BP when calibrated with the IntCal13 curve (Reimer et al., 2009) (note: using IntCal20 impacts this calibrated age and the resulting 10Be production rate calculation by < 1 %). To identify the earliest onset of plant growth, and thus ice-free conditions, Bromley et al. (2014) used three methods: the first takes the single oldest sample in the dataset as representing colonisation; sample OS-99685 (10 550 ± 65 14C yr) from core RM-12-3A gave a calibrated age of 12 480 ± 100 cal yr BP and an earliest likely (upper bound of 90 % confidence interval) age of 12 580 cal yr BP (Bromley et al., 2014). The second method takes the oldest replicable 14C ages as a conservative date for colonisation; samples OS-99977 (10 400 ± 45 14C yr), OS-99978 (10 350 ± 40 14C yr), OS-89841 (10 300 ± 70 14C yr), and OS-89842 (10 500 ± 50 14C yr), all from core RM-10-3A, gave an error-weighted mean calibrated age of 12 262 ± 85 cal yr BP and an earliest likely (upper bound of 90 % confidence interval) age of 12 493 cal yr BP (Bromley et al., 2014). Finally, the upper bound of the 90 % confidence interval for all 20 14C ages returned a calibrated age of 12 371 cal yr BP for colonisation (Bromley et al., 2014). All of these 14C dates, regardless of the method of interpretation, yield minimum ages for plant colonisation and thus for deglaciation.
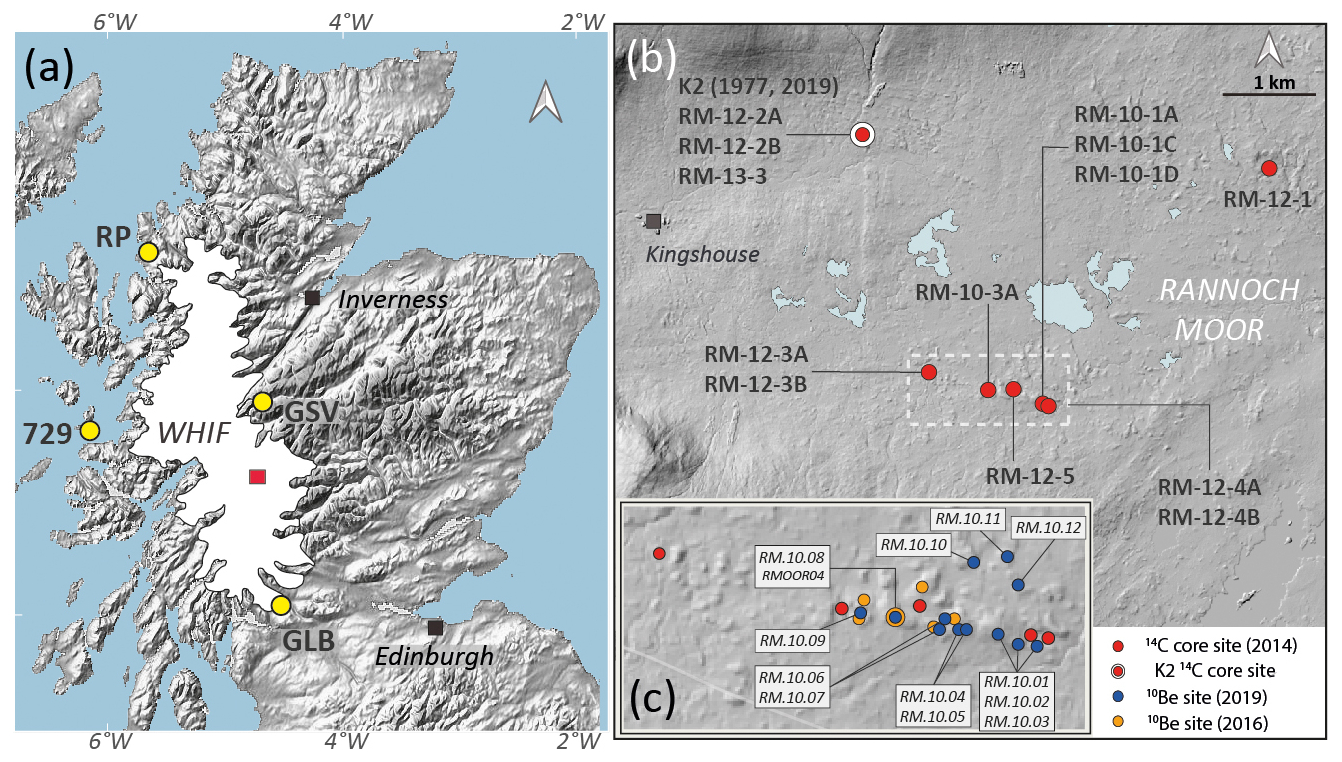
Figure 9(a) Approximate extent of the late-glacial West Highland ice field (WHIF) relative to sites discussed in Sect. 5.2: RP – Redpoint Peninsula; GSV – Glen Spean varve chronology; GLB – Glacial Lake Blane; 729 – core 729, Hebridean Sea. Red rectangle depicts the western section of Rannoch Moor covered in panel (b). (b) Locations of Rannoch Moor sediment cores upon which the 14C of Bromley et al. (2014) is based, including the K2 site (Walker and Lowe, 1977; Lowe et al., 2019). White dashed rectangle depicts area shown in panel (c). (c) Distribution of granite boulders sampled for the 10Be production rate calibration dataset (Putnam et al., 2019) (blue circles) and the 10Be SED dataset of Small and Fabel (2016) (orange circles), relative to 14C coring sites. Samples RM.10.08 (Putnam et al., 2019) and RMOOR04 (Small and Fabel, 2016) are from the same boulder.
To calculate a 10Be production rate for Rannoch Moor, Putnam et al. (2019) took 12 480 ± 100 cal yr BP as the minimum-limiting age for the target moraine belt, which is located immediately adjacent to five of the seven core sites of Bromley et al. (2014) (Fig. 9). We note that, regardless of which of the three methods is used to derive a minimum-limiting age, the resultant production rate does not vary by more than 1 %. For a maximum-limiting age, they employed the probable age of 12 700 ± 100 cal yr BP for culmination of the WHIF reported by Bromley et al. (2018) and based on 27 shell 14C dates from terminal moraines. The derived production rate was reported as a range (Sect. 5.1), with a mid-point value of 3.912 ± 0.106 atoms g−1 yr−1 (Putnam et al., 2019). In a later study, however, Lowe et al. (2019) questioned the original chronologic foundation for the Rannoch Moor calibration. They proposed that the minimum-limiting 14C ages reported by Bromley et al. (2014) are erroneously old, thereby making the production rate calculated from that site (Putnam et al., 2019) unrealistically low (Lowe et al., 2019). To test that claim, Lowe et al. (2019) revisited Rannoch Moor with a view to evaluating the reproducibility of Bromley et al. (2014)'s dataset.
Of the seven sites investigated by Bromley et al. (2014), Lowe et al. (2019) elected to re-sample the K2 kettle hole that was first investigated by Walker and Lowe (1977) (Fig. 9). Lowe et al. (2019) reported eight new 14C dates from K2, the lowest of which (OxA-32471) gives a calibrated age ∼ 1 kyr younger than the oldest basal ages of Bromley et al. (2014) from cores RM-10-3A and RM-12-3A, situated 2–3 km south-east of K2. Highlighting the age difference, Lowe et al. (2019) then presented reasons why the latter must be incorrect (see below). We observe, however, that their dating campaign was restricted to a single site and that Lowe et al. (2019) did not attempt to re-sample those core sites from which Bromley et al. (2014) derived their oldest 14C ages (RM-10-3A and RM-12-3A). We also note that the newer K2 basal 14C ages of Lowe et al. (2019), which are supported by their pollen and tephra data, are virtually indistinguishable from those reported by Bromley et al. (2014) from the same K2 site, suggesting a high degree of reproducibility between the two datasets.
Highlighting that the five oldest 14C dates in the Rannoch Moor dataset of Bromley et al. (2014) include Rhacomitrium, Pogonatum, and Sphagnum material, Lowe et al. (2019) questioned the suitability of moss remains for radiocarbon dating. Despite being considered terrestrial species, Lowe et al. (2019) speculated that mosses might still be subject to “inbuilt age errors” due either to some degree of uptake of aquatic carbon or the inclusion of fine-grained carbonate detritus in measured material. Those authors then proposed that their own moss-derived samples from K2 exhibit δ13C values that are “divergent from average values expected from terrestrial land plants” (p. 180; Lowe et al., 2019) and thus are likely contaminated. Citing an apparent age disparity between moss-bearing samples and those comprising angiosperms (Table 1 of Lowe et al., 2019), they concluded that the former are as much as 100 14C older than the latter and potentially suspect. We do not consider this a statistically robust experiment, however, being based on only two sets of paired samples. Nor is the apparent age offset significant, being 95 14C years in one pairing (OxA-35410 and OxA-35411) but only 55 14C years in the other (OxA-35408 and OxA-35409) (Lowe et al., 2019); much greater variability is a common feature of radiocarbon (indeed, of any) chronologies with multiple samples from the same horizon (e.g., MacLeod et al., 2011; Walker et al., 2012).
The δ13C values for samples underpinning the Rannoch Moor record range from −19.8 to −28.0, with those containing moss fragments spanning −20.0 to −26.8 (Bromley et al., 2018). Such values are consistent with other radiocarbon datasets incorporating moss fragments, including several from the British Isles (MacLeod et al., 2011; Walker et al., 2012; Turner et al., 2015). Ultimately, heath mosses are common targets for 14C dating Quaternary sequences (e.g., Ellis and Tallis, 2000; Ellis, 2008; Blundell et al., 2008; MacLeod et al., 2011; Matthews et al., 2011; Walker et al., 2012; Turner et al., 2015) that, thus far, have not been shown to exhibit species-specific age bias (Humlum et al., 2005; Holmquist et al., 2016). Furthermore, while we agree with Lowe et al. (2019) that detrital carbonate poses a real risk to accurate 14C measurement, we reiterate that such material is highly unlikely to be a significant constituent of glacial tills underlying Rannoch Moor (p. 180; Lowe et al., 2019); the few calcite-bearing veins reported by Smith and Marsden (1977) south of the moor are highly localised and on a scale dwarfed by the Rannoch Moor granite pluton. There is no documented evidence of such veins anywhere near, or “up-ice” of, the coring sites of Bromley et al. (2014).
The 14C chronologies underpinning the Rannoch Moor 10Be production rate imply deglaciation of the WHIF during the early Younger Dryas (12.8–11.6 ka: NGRIP Members, 2004; WAIS Divide Project Members, 2015) (Bromley et al., 2014, 2018), a scenario that is at odds with those studies advocating late-stadial culmination of the LLR. In their examination of the Rannoch Moor 14C dataset (Bromley et al., 2014), Lowe et al. (2019) cited four works favouring late-stadial deglaciation. First, the 10Be surface-exposure dataset of Small and Fabel (2016) purportedly records deglaciation of western Rannoch Moor (Fig. 9) no earlier than 11.5 ± 0.6 ka. As discussed by Bromley et al. (2016a) and Putnam et al. (2019), those 10Be ages were calculated with two problematic production rates: the Glen Roy rate (Small and Fabel, 2015), which lacks independent age control (Sect. 5.1) and which is shown above to produce ages that are incompatible with limiting 14C ages on the Redpoint Peninsula (Fig. 8), and the unpublished LLPR attributed to Fabel et al. (2012). Second, the Glacial Lake Blane 14C record from Loch Lomond (Fig. 9) was originally interpreted as indicating maximum extent of the WHIF after ∼ 12 ka (MacLeod et al., 2011). While the geological basis for Glacial Lake Blane is unequivocal, the case for 14C-dated varves at Croftamie as maximum-limiting age control for the LLR (Rose et al., 1988; MacLeod et al., 2011) is not. Noting (i) the lack of age control for the basal “Wilderness till”, (ii) the dearth of evidence for glacial overriding of the varves, and (iii) the conspicuous absence of the marine “Clyde Beds” (a prominent local indicator of post-LGM marine transgression), Bromley et al. (2018) queried the traditional view of the Croftamie stratigraphy and suggested that the 14C data of MacLeod et al. (2011) instead constitute minimum-limiting ages WHIF retreat. Third, the Glen Roy-Spean varve database from sites north of Rannoch Moor (Palmer et al., 2010, 2012; Palmer and Lowe, 2017) was invoked by Lowe et al. (2019) as supporting late-stadial deglaciation (Fig. 9). Yet this varve record has also raised questions over absolute age control; Putnam et al. (2019) highlighted its reliance on undated and chemically ambiguous correlations with distal tephras such as the Vedde Ash, which cannot be distinguished compositionally from other late-glacial Katla eruptions (Lane et al., 2012). Fourth, Lowe et al. (2019) cited a marine-geologic record from the Hebridean Sea (Fig. 9), in which the basal unit (MCU6) of core 729 contains cold-water foraminifera and clastic material interpreted as ice-rafted debris (Arosio and Howe, 2018). From this, Arosio and Howe (2018) invoked WHIF tidewater outlets terminating in the Hebridean Sea until ∼ 11.7 ka, a scenario that is hard to reconcile with ice free conditions at the ice field's centre (c.f. Bromley et al., 2014). Acknowledging the value of offshore records for helping elucidate onshore processes, we caution that unit MCU6, which is central to their argument for late-Younger Dryas deglaciation, lacks direct age control. Two AMS 14C dates on bivalves from the overlying unit MCU7 afford minimum-limiting ages only (Arosio and Howe, 2018); even assuming accurate estimation of the marine reservoir effect and ΔR, the dearth of dates from MCU6 precludes meaningful correlation between core 729 and events at Rannoch Moor, > 90 km to the east. The proposed glacial occupation of the Arisaig coast until ∼ 11.7 ka (Arosio and Howe, 2018) is also inconsistent with replicated 14C evidence for coastal deglaciation by ∼ 16 ka (Best and Shennan, 2025).
The reappraisal of the Rannoch Moor deglacial record proffered by Lowe et al. (2019) refutes neither the original conclusions of Bromley et al. (2014) nor, by extension, the production rate of Putnam et al. (2019). Further, the results presented here from Loch Bad na h-Achlaise reinforce the validity of the Rannoch Moor production-rate calibration data set. In light of our new results from the Redpoint Peninsula, we stress that choosing any production rate calibration dataset that favours a late-Younger Dryas deglaciation of Rannoch Moor will produce 10Be ages that are much younger than, and therefore incongruent with, the independent 14C chronology at Loch Bad na h-Achlaise (Fig. 8).
5.3 Glaciological and climatic ramifications
The Redpoint 10Be dataset in Fig. 5 includes three samples from the crest of the outer moraine, close to the locations of three samples reported by Ballantyne et al. (2009) (Fig. 2). Recalculated in the same way as our ages, and utilising updated elevations from the Landmap digital terrain model (Landmap, 2014), their samples RM-01, 02, and 03 give revised exposure ages ranging from 15.5 ± 0.6 to 16.4 ± 0.6 ka (mean: 15.8 ± 0.3 ka), in broad agreement with our moraine samples. The published coordinates for a fourth sample, RM-04, are inconsistent with a position on the moraine and so we did not calculate a revised age. While we did not include these recalculated ages in our evaluation of production rates, the agreement between our 10Be concentrations and those of Ballantyne et al. (2009) (Fig. S2) reinforces the pattern of deglaciation in NW Scotland during Termination 1.
As highlighted in Sect. 4.2, the tight internal consistency among the nine new 10Be ages confirms that, regardless of production rate choice, the target landforms were all exposed within a very narrow window of time (and within the analytical uncertainty of the data). Since our dataset includes samples from outboard and inboard of the Redpoint moraines – as well as from the moraines themselves – that outcome indicates that the episode of ice-marginal stability represented by the Redpoint moraines was brief relative to the overall span of our chronology (i.e., within the ∼ 200-year standard error of the dataset). Viewed in the broader climatic context of Termination 1, the timing and brevity of the Redpoint moraine-building episode suggests that the Wester Ross Readvance was a prominent yet short-lived interruption to overall ice sheet collapse during Heinrich Stadial 1; there appears to have been insufficient time to accommodate the spatially extensive resurgence of ice envisaged by some prior studies (Robinson and Ballantyne, 1979; Ballantyne et al., 2009; Bradwell et al., 2021). Further dating work on other sections of the complex will establish the validity of this hypothesis.
Our revised chronology for the Wester Ross Readvance supports the conclusions of Simms et al. (2022) that this pause in deglaciation occurred at least ∼ 500 years earlier than previous estimates (Ballantyne and Small, 2019; Bradwell et al., 2021). While it is beyond the scope of this paper to synthesise well-dated moraine chronologies spanning Termination 1, we note that brief yet prominent moraine-building events around the time of the Wester Ross Readvance are salient features of deglacial records from elsewhere in Britain and Ireland (McCabe et al., 2007; Small et al., 2012; Hall et al., 2016; Foreman et al., 2025, 2026), as well as from sites farther afield (Putnam et al., 2013; Bromley et al., 2016b; Hall et al., 2017).
Nine new 10Be measurements from glacial boulders on the Redpoint Peninsula, NW Scotland, together afford a tightly spaced age population and indicate statistically instantaneous deposition during Termination 1. Calculated with the Rannoch Moor production rate and “St” scaling, the mean surface-exposure age of this population suggests deglacial exposure approximately 16.1 ± 0.1 ka, during Heinrich Stadial 1.
Comparison of this age population with minimum-limiting radiocarbon ages from the Loch Bad na h-Achlaise isolation basin provides a stratigraphic test of production rates currently used in the Northern hemisphere. Of eight mid-latitude production rates evaluated, the Rannoch Moor rate gives the best fit with the 14C control, confirming that this production rate is effective for calculating exposure ages in the British Isles and similar geomagnetic latitudes. Many of the remaining rates, including the Borchers primary dataset, give 10Be ages that are incompatible with the local 14C control and thus unrealistically high.
Using the Loch Bad na h-Achlaise 14C control as an independent minimum-limiting age for local deglaciation, the maximum-limiting 10Be production rate for this site (scaled to SLHL using St scaling) is 3.925 ± 0.070 atoms g−1 yr−1. Production rates exceeding this value will result in surface-exposure ages that are unrealistically young.
Our examination of the critique by Lowe et al. (2019) revealed several fundamental shortcomings. We conclude that their new data and analysis do not constitute a rigorous test of the Rannoch Moor 14C record and fail to refute the basis for the Rannoch Moor production rate. The new results presented here for the Redpoint moraine, on the other hand, reinforce the validity of the Rannoch Moor production-rate calibration dataset and hence its underlying 14C chronology.
The high degree of internal consistency among the nine new 10Be exposure ages, including ages from deglacial terrain outboard and inboard of the Redpoint moraines, indicates that the so-called Wester Ross Readvance was brief (i.e., within the limits of our dating uncertainties). Viewed in broader temporal and climatic contexts, we posit that the Wester Ross Readvance corresponds to a short-lived interruption of the large-scale retreat of the British ice sheet during Heinrich Stadial 1. The full climatic implications of this and similar glaciologic events can only be explored with robustly calibrated cosmogenic nuclide production rates.
All data reported here that are not already published elsewhere are available in the Supplement.
The supplement related to this article is available online at https://doi.org/10.5194/gchron-8-329-2026-supplement.
GB, AP, and BH designed the research. GB led fieldwork and sample collection. BH and GB prepared and analysed samples. TL and GB evaluated radiocarbon data. GB and AP evaluated production rates. GB and AP wrote the paper with input from all co-authors.
The contact author has declared that none of the authors has any competing interests.
Publisher's note: Copernicus Publications remains neutral with regard to jurisdictional claims made in the text, published maps, institutional affiliations, or any other geographical representation in this paper. The authors bear the ultimate responsibility for providing appropriate place names. Views expressed in the text are those of the authors and do not necessarily reflect the views of the publisher.
We thank Liam Carr for his tireless assistance with field work and Jacob Nguyen for age-depth modelling. Becky Hedderman helped with sample preparation at the University of Galway. All 10Be AMS measurements were made by Alan Hidy, Center for Accelerator Mass Spectrometry, Lawrence Livermore National Laboratory. We are particularly grateful to Alex Simms, UC Santa Barbara, for sharing details of the Loch Bad na h-Achlaise sedimentary record and providing invaluable context. We thank the editor, Greg Balco, as well as two anonymous reviewers and Alastair Curry for constructive feedback on an earlier version of the paper.
This research has been supported by the Geological Survey of Ireland (grant no. 2022-SC-006), Research Ireland (grant no. 21/FFP-P/10129), and the Global Climate Change Foundation.
This paper was edited by Greg Balco and reviewed by two anonymous referees.
Arosio, R. and Howe, J. A.: Lateglacial to Holocene palaeoenvironmental change in the Muck Deep, offshore western Scotland, Scott. J. Geol., 54, 99–114, https://doi.org/10.1144/sjg2017-014, 2018.
Balco, G.: Glacier change and paleoclimate applications of cosmogenic-nuclide exposure dating, Ann. Rev. Earth Plan. Sci., 48, 21–48, https://doi.org/10.1146/annurev-earth-081619-052609, 2020a.
Balco, G.: Technical note: A prototype transparent-middle-layer data management and analysis infrastructure for cosmogenic-nuclide exposure dating, Geochronology, 2, 169–175, https://doi.org/10.5194/gchron-2-169-2020, 2020b.
Balco, G., Stone, J. O., Lifton, N. A., and Dunai, T. J.: A complete and easily accessible means of calculating surface exposure ages or erosion rates from 10Be and 26Al measurements, Quat. Geochronol. 3, 174–195, https://doi.org/10.1016/j.quageo.2007.12.001, 2008.
Balco, G., Briner, J. P., Finkel, R., Rayburn, J. A., Ridge, J. C., and Schaefer, J. M.: Regional beryllium-10 production rate calibration for late-glacial northeastern North America, Quat. Geochronol. 4, 93–107, https://doi.org/10.1016/j.quageo.2008.09.001, 2009.
Ballantyne, C. K. and Small, D.: The last Scottish ice sheet, Earth Env. Sci. Trans. Royal Soc. Edinburgh, 110, 93–131, https://doi.org/10.1017/S1755691018000038, 2019.
Ballantyne, C. K. and Stone, J. O.: Did large ice caps persist on low ground in north-west Scotland during the Lateglacial Interstade?, J. Quat. Sci., 27, 297–306, https://doi.org/10.1002/jqs.1544, 2012.
Ballantyne, C. K., Sutherland, D. G., and Reed, W. J.: Introduction, in: Wester Ross: Field Guide, edited by: Ballantyne, C. K. and Sutherland, D. G., Quaternary Research Association, Cambridge, 1–63, https://research-portal.st-andrews.ac.uk/en/publications/wester-ross-field-guide/ (last access: 15 March 2026), 1987.
Ballantyne, C. K., Schnabel, C., and Xu, S.: Readvance of the last British Irish Ice Sheet during Greenland Interstade 1 (GI-1): the Wester Ross Readvance, NW Scotland, Quat. Sci. Rev., 28, 783–789, https://doi.org/10.1016/j.quascirev.2009.01.011, 2009.
Best, L. and Shennan, I.: Scottish landform example no. 47: isolation basins of Arisaig, Scot. Geogr. J., 141, 18–37, https://doi.org/10.1080/14702541.2024.2401166, 2025.
Bickerdike, H. L., Evans, D. J. A., O Cofaigh, C. O., and Stokes, C. R.: The glacial geo morphology of the Loch Lomond Stadial in Britain: a map and geographic information system resource of published evidence, J. Maps, 12, https://doi.org/10.1080/17445647.2016.1145149, 2016.
Björck, S., Walker, M. J., Cwynar, L. C., Johnsen, S., Knudsen, K. L., Lowe, J. J., and Wohlfarth, B.: An event stratigraphy for the Last Termination in the North Atlantic region based on the Greenland ice-core record: a proposal by the INTIMATE group, J. Quat. Sci., 13, 283–292, https://doi.org/10.1002/(SICI)1099-1417(199807/08)13:4<283::AID-JQS386>3.0.CO;2-A, 1998.
Blaauw, M. and Christen, J. A.: Flexible paleoclimate age-depth models using an autoregressive gamma process, Bayesian Anal., 6, 457–474, https://doi.org/10.1214/11-BA618, 2011.
Blundell, A., Charman, D. J., and Barber, K.: Multiproxy late Holocene peat records from Ireland: towards a regional palaeoclimate curve, J. Quat. Sci., 23, 59–71, https://doi.org/10.1002/jqs.1115, 2008.
Borchers, B., Marrero, S., Balco, G., Caffee, M., Goehring, B., Lifton, N., Nishiizumi, K., Phillips, F., Schaefer, J., and Stone, J.: Geological calibration of spallation production rates in the CRONUS-Earth project, Quat. Geochronol., 31, 188–198, https://doi.org/10.1016/j.quageo.2015.01.009, 2016.
Bradwell, T. and Stoker, M. S.: Submarine sediment and landform record of a palaeo-ice stream within the British-Irish Ice Sheet, Boreas, 44, 255–276, https://doi.org/10.1111/bor.12111, 2015.
Bradwell, T., Fabel, D., Stoker, M., Mathers, H., McHargue, L., and Howe, J. Ice caps existed throughout the Lateglacial Interstadial in northern Scotland, J. Quat. Sci., 23, 401–407, https://doi.org/10.1002/jqs.1181, 2008.
Bradwell, T., Fabel, D., Clark, C. D., Chiverrell, R. C., Small, D., Smedley, R. K., Saher, M. H., Moreton, S. G., Dove, D., Callard, S. L., and Duller, G. A.: Pattern, style and timing of British–Irish Ice Sheet advance and retreat over the last 45 000 years: evidence from NW Scotland and the adjacent continental shelf, J. Quat. Sci., 35, 871–933, https://doi.org/10.1002/jqs.3296, 2021.
Bromley, G. R. M., Putnam, A. E., Rademaker, K. M., Lowell, T. V., Schaefer, J. M., Hall, B. L., Winckler, G., Birkel, S. D., and Borns, H. W.: Younger Dryas deglaciation of Scotland driven by warming summers, Proc. Natl. Acad. Sci. USA, 111, 6215–6219, https://doi.org/10.1073/pnas.1321122111, 2014.
Bromley, G. R. M., Putnam, A. E., Lowell, T. V., Hall, B. L., and Schaefer, J. M.: Comment on “was Scotland deglaciated during the Younger Dryas?” by Small and Fabel (2016), Quat. Sci. Rev., 152, 203–206, https://doi.org/10.1016/j.quascirev.2016.09.025, 2016a.
Bromley, G. R. M., Schaefer, J. M., Hall, B. L., Rademaker, K. M., Putnam, A. E., Todd, C. E., Hegland, M., Winckler, G., Jackson, M. S., and Strand, P. D.: A cosmogenic 10Be chronology for the local last glacial maximum and termination in the Cordillera Oriental, southern Peruvian Andes: implications for the tropical role in global climate, Quat. Sci. Rev., 148, 54–67, https://doi.org/10.1016/j.quascirev.2016.07.010, 2016b.
Bromley, G., Putnam, A., Borns, H., Lowell, T., Sandford, T., and Barrell, D.: Interstadial rise and Younger Dryas demise of Scotland's last ice fields, Paleocean. Paleoclim., 33, 412–429, https://doi.org/10.1002/2018PA003341, 2018.
Bromley, G., Bunce, C., Hall, B., Putnam, A. and McDermott, F.: Deglaciation of the Burren glacio‐karst, western Ireland, during Termination 1: Implications for North Atlantic climate and karstification, J. Quat. Sci., https://doi.org/10.1002/jqs.70068, online first, 2026.
Charlesworth, J. K.: The Lateglacial history of the Highlands and Islands of Scotland, Trans. Royal Soc. Edinburgh, 62, 769–929, https://doi.org/10.2307/1790579, 1956.
Claude, A., Ivy-Ochs, S., Kober, F., Antognini, M., Salcher, B., and Kubik, P. W.: The Chironico Landslide (Valle Leventina, southern Swiss Alps): age and evolution, Swiss J. Geosci., https://doi.org/10.1007/s00015-014-0170-z, 2014.
Desilets, D., Zreda, M., and Prabu, T.: Extended scaling factors for in situ cosmogenic nuclides: new measurements at low latitude, Earth Planet. Sci. Lett., 246, 265–276, https://doi.org/10.1016/j.epsl.2006.03.051, 2006.
Ellis, C. J.: Interactions between hydrology, burning and contrasting plant groups during the millennial-scale development of sub-montane wet heath, J. Veg. Sci., 19, 693–704, https://doi.org/10.3170/2008-8-18439, 2008.
Ellis, C. J. and Tallis, J. H.: Climatic control of blanket mire development at Kentra Moss, north-west Scotland, J. Ecol., 88, 869–889, https://doi.org/10.1046/j.1365-2745.2000.00495.x, 2000.
Evans, J. M., Stone, J. O. H., Fifield, L. K., and Cresswell, R. G.: Cosmogenic chlorine-36 production in K-feldspar, Nucl. Instrum. Meth. B, 123, 334–340, https://doi.org/10.1016/S0168-583X(96)00714-8, 1997.
Everest, J. D., Bradwell, T., Fogwill, C. J., and Kubik, P. W.: Cosmogenic 10-Be constraints for the Wester Ross Readvance moraine: insights into British ice-sheet behaviour, Geog. Ann., 88A, 9–17, https://doi.org/10.1111/j.0435-3676.2006.00279.x, 2006.
Fabel, D., Ballantyne, C. K., and Xu, S.: Trimlines, blockfields, mountain-top erratics and the vertical dimensions of the last British-Irish Ice Sheet in NW Scotland, Quat. Sci. Rev., 55, 91–102, https://doi.org/10.1016/j.quascirev.2012.09.002, 2012.
Farber, D. L., Hancock, G. S., Finkel, R. C., and Rodbell, D. T.: The age and extent of tropical alpine glaciation in the Cordillera Blanca, Peru, J. Quat. Sci., 20, 759–776, https://doi.org/10.1002/jqs.994, 2005.
Fenton, C. R., Niedermann, S., Dunai, T., and Binnie, S. A.: The SPICE project: Production rates of cosmogenic 21Ne, 10Be, and 14C in quartz from the 72 ka SP basalt flow, Arizona, USA, Quat. Geochron., 54, 101019, https://doi.org/10.1016/j.quageo.2019.101019, 2019.
Foreman, A. C., Bromley, G. R., Hall, B. L., and Rodríguez, P. C.: Thinning and retreat of the temperate Connemara ice centre, Ireland, during Heinrich Stadial 1 constrained with cosmogenic 10Be dating, Geomorph., 109661, https://doi.org/10.1016/j.geomorph.2025.109661, 2025.
Foreman, A. C., Bromley, G. R., and Hall, B. L.: The West Corrib moraine system as evidence for a brief glacial readvance in Ireland during overall Heinrich Stadial 1 deglaciation, Quat. Res., in press, 2026.
Goehring, B. M., Lohne, Ø.S., Mangerud, J., Svendsen, J. I., Gyllencreutz, R., Schaefer, J. M., and Finkel, R.: Late Glacial and Holocene 10Be production rates for western Norway, J. Quat. Sci., 27, 89–96, https://doi.org/10.1002/jqs.1517, 2012.
Hall, A. M., Binnie, S. A., Sugden, D., Dunai, T. J., and Wood, C.: Late readvance and rapid final deglaciation of the last ice sheet in the Grampian Mountains, Scotland, J. Quat. Sci., 31, 869–878, https://doi.org/10.1002/jqs.2911, 2016.
Hall, B. L., Borns Jr., H. W., Bromley, G. R., and Lowell, T. V.: Age of the Pineo Ridge System: Implications for behavior of the Laurentide Ice Sheet in eastern Maine, USA, during the last deglaciation, Quat. Sci. Rev., 169, 344–356, https://doi.org/10.1016/j.quascirev.2017.06.011, 2017.
Hofmann, F. M., Rambeau, C., Gegg, L., Schulz, M., Steiner, M., Fülling, A., Léanni, L., Preusser, F., and ASTER Team: Regional beryllium-10 production rate for the mid-elevation mountainous regions in central Europe, deduced from a multi-method study of moraines and lake sediments in the Black Forest, Geochronology, 6, 147–174, https://doi.org/10.5194/gchron-6-147-2024, 2024.
Holmquist, J. R., Finkelstein, S. A., Garneau, M., Massa, C., Yu, Z., and MacDonald, G. M.: A comparison of radiocarbon ages derived from bulk peat and selected plant macrofossils in basal peat cores from circum-arctic peatlands, Quat. Geochronol., 31, 53–61, https://doi.org/10.1016/j.quageo.2015.10.003, 2016.
Hughes, A. L., Clark, C. D., and Jordan, C. J.: Flow-pattern evolution of the last British Ice Sheet, Quat. Sci. Rev., 89, 148–168, https://doi.org/10.1016/j.quascirev.2014.02.002, 2014.
Humlum, O., Elberling, B., Hormes, A., Fjordheim, K., Hansen, O. H., and Heinemeier, J.: Late-Holocene glacier growth in Svalbard, documented by subglacial relict vegetation and living soil microbes, Holocene, 15, 396–407, https://doi.org/10.1191/0959683605hl817rp, 2005.
Kaplan, M. R., Strelin, J. A., Schaefer, J. M., Denton, G. H., Finkel, R. C., Schwartz, R., Putnam, A. E., Vandergoes, M. J., Goehring, B. M., and Travis, S. G.: In-situ cosmo genic 10Be production rate at Lago Argentino, Patagonia: implications for late-glacial climate chronology, Earth Planet. Sci. Lett., 309, 21–32, https://doi.org/10.1016/j.epsl.2011.06.018, 2011.
Kelly, M. A., Lowell, T. V., Applegate, P. J., Phillips, F. M., Schaefer, J. M., Smith, C. A., Kim, H., Leonard, K. C., and Hudson, A. M.: A locally calibrated, late glacial 10Be production rate from a low-latitude, high-altitude site in the Peruvian Andes, Quat. Geochronol., 26, 70–85, https://doi.org/10.1016/j.quageo.2013.10.007, 2015.
Kirk, W. and Godwin, H.: A Late-glacial site at Loch Droma, Ross and Cromarty, Trans. Royal Soc. Edinburgh, 65, 225–48, https://doi.org/10.1017/S0080456800038394, 1963.
Kohl, C. P. and Nishiizumi, K.: Chemical isolation of quartz for measurement of in-situ-produced cosmogenic nuclides, Geochem. Cosmochim. Ac., 56, 3583–3587, https://doi.org/10.1016/0016-7037(92)90401-4, 1992.
Lal, D.: Cosmic-ray labeling of erosion surfaces: in situ nuclide production rates and erosion models, Earth Planet. Sci. Lett., 104, 424–439, https://doi.org/10.1016/0012-821X(91)90220-C, 1991.
Landmap: Elevation Earth observation collection, NERC Earth Observation Data Centre, http://catalogue.ceda.ac.uk/uuid/f5d48fb0372be25b737f92976e386f53 (last access: 15 March 2026), 2014.
Lane, C. S., Blockley, S. P., Mangerud, J. A. N., Smith, V. C., Lohne, Ø. S., Tomlinson, E. L., Matthews, I. P., and Lotter, A. F.: Was the 12.1 ka Icelandic Vedde Ash one of a kind?, Quat. Sci. Rev., 33, 87–99, https://doi.org/10.1016/j.quascirev.2011.11.011, 2012.
Licciardi, J. M., Kurz, M. D., and Curtice, J. M.: Cosmogenic 3He production rates from Holocene lava flows in Iceland, Earth Planet. Sci. Lett., 246, 251–264, https://doi.org/10.1016/j.epsl.2006.03.016, 2006.
Lifton, N., Sato, T., and Dunai, T. J.: Scaling in situ cosmogenic nuclide production rates using analytical approximations to atmospheric cosmic-ray fluxes, Earth Planet. Sci. Lett., 386, 149–160, https://doi.org/10.1016/j.epsl.2013.10.052, 2014.
Lowe, J. J. and Walker, M. J. C.: Radiocarbon-dates and deglaciation of Rannoch Moor, Scotland, Nature, 264, 632–633, https://doi.org/10.1038/264632a0, 1976.
Lowe, J., Matthews, I., Mayfield, R., Lincoln, P., Palmer, A., Staff, R., and Timms, R.: On the timing of retreat of the Loch Lomond (“Younger Dryas”) Readvance icefield in the SW Scottish Highlands and its wider significance, Quat. Sci. Rev., 219, 171–186, https://doi.org/10.1016/j.quascirev.2019.06.034, 2019.
MacLeod, A., Palmer, A., Lowe, J., Rose, J., Bryant, C., and Merritt, J.: Timing of glacier response to Younger Dryas climatic cooling in Scotland, Global Planet. Change, 79, 264–274, https://doi.org/10.1016/j.gloplacha.2010.07.006, 2011.
Martin, L. C. P., Blard, P.-H., Lavé, J., Braucher, R., Lupker, M., Condom, T., Charreau, J., Mariotti, V., Team, A. S. T. E. R., and Davy, E.: In situ 10Be production rate in the High Tropical Andes, Quat. Geochronol., 30A, 54–68, https://doi.org/10.1016/j.quageo.2015.06.012, 2015.
Matthews, I. P., Birks, H. H., Bourne, A. J., Brooks, S. J., Lowe, J. J., MacLeod, A., and Pyne-O'Donnell, S. D. F.: New age estimates and climatostratigraphic correlations for the Borrobol and Penifiler Tephras: evidence from Abernethy Forest, Scotland, J. Quat. Sci., 26, 247–252, https://doi.org/10.1002/jqs.1498, 2011.
McCabe, A. M., Clark, P. U., Clark, J., and Dunlop, P.: Radiocarbon constraints on readvances of the British-Irish Ice Sheet in the northern Irish Sea Basin during the last deglaciation, Quat. Sci. Rev., 26, 1204–1211, https://doi.org/10.1016/j.quascirev.2007.01.010, 2007.
Merritt, J. W., Gordon, J. E., and Connell, E. R.: Late Pleistocene sediments, landforms and events in Scotland: a review of the terrestrial stratigraphic record, Earth Env. Sci., Trans. Royal Soc. Edinburgh, 110, 39–91, https://doi.org/10.1017/S1755691018000890, 2019.
NGRIP Members: High-resolution record of Northern Hemisphere climate extending into the last interglacial period, Nature, 431, 147–151, https://doi.org/10.1038/nature02805, 2004.
Palmer, A. P. and Lowe, J. J.: Dynamic landscape changes in Glen Roy and vicinity, west Highland Scotland, during the Younger Dryas and early Holocene: a synthesis, Proc. Geol. Assoc., 128, 2–25, https://doi.org/10.1016/j.pgeola.2017.01.003, 2017.
Palmer, A. P., Rose, J., Lowe, J. J., and MacLeod, A.: Annually resolved events of Younger Dryas glaciation in Lochaber (Glen Roy and Glen Spean), western Scottish Highlands, J. Quat. Sci., 25, 581–596, https://doi.org/10.1002/jqs.1370, 2010.
Palmer, A. P., Rose, J., and Rasmussen, S. O.: Evidence for phase-locked changes in climate between Scotland and Greenland during GS-1 (Younger Dryas) using micromorphology of glaciolacustrine varves from Glen Roy, Quat. Sci. Rev., 36, 114–123, https://doi.org/10.1016/j.quascirev.2011.12.003, 2012.
Phillips, F. M., Argento, D. C., Balco, G., Caffee, M. W., Clem, J., Dunai, T. J., Finkel, R., Goehring, B., Gosse, J. C., Hudson, A. M., Jull, A. J. T., Kelly, M. A., Kurz, M., Lal, D., Lifton, N., Marrero, S. M., Nishiizumi, K., Reedy, R. C., Schaefer, J., Stone, J. O. H., Swanson, T., and Zreda, M. G.: The CRONUS-Earth Project: a synthesis, Quat. Geochronol., 31, 119–154, https://doi.org/10.1016/j.quageo.2015.09.006, 2016.
Putnam, A. E., Schaefer, J. M., Barrell, D. J. A., Vandergoes, M., Denton, G. H., Kaplan, M. R., Schwartz, R., Finkel, R. C., Goehring, B. M., and Kelley, S. E.: In situ cosmogenic 10Be production-rate calibration from the Southern Alps, New Zealand, Quat. Geochronol., 5, 392–409, https://doi.org/10.1016/j.quageo.2009.12.001, 2010.
Putnam, A. E., Schaefer, J. M., Denton, G. H., Barrell, D. J. A., Andersen, B. G., Koffman, T. N. B., Rowan, A. V., Finkel, R. C., Rood, D. H., Schwartz, R., Vandergoes, M. J., Plummer, M. A., Brocklehurst, S. H., Kelley, S. E., and Ladig, K. L.: Warming and glacier recession in the Rakaia valley, Southern Alps of New Zealand, during Heinrich Stadial 1, Earth Planet. Sci. Lett., 382, 98–110, https://doi.org/10.1016/j.epsl.2013.09.005, 2013.
Putnam, A. E., Bromley, G. R., Rademaker, K., and Schaefer, J. M.: In situ 10Be production-rate calibration from a 14C-dated late-glacial moraine belt in Rannoch Moor, central Scottish Highlands, Quat. Geochronol., 50, 109–125, https://doi.org/10.1016/j.quageo.2018.11.006, 2019.
Putnam, A. E., Denton, G. H., and Schaefer, J. M.: A 10Be chronology of the Esmark Moraine and Lysefjorden region, southwestern Norway: Evidence for coeval glacier resurgence in both polar hemispheres during the Antarctic Cold Reversal, Quat. Sci. Rev., 316, 108259, https://doi.org/10.1016/j.quascirev.2023.108259, 2023.
Reimer, P. J., Baillie, M. G., Bard, E., Bayliss, A., Beck, J. W., Blackwell, P. G., Ramsey, C. B., Buck, C. E., Burr, G. S., Edwards, R. L., and Friedrich, M.: IntCal09 and Marine09 radiocarbon age calibration curves, 0–50 000 years cal BP, Radiocarbon, 51, 1111–1150, https://doi.org/10.1017/S0033822200034202, 2009.
Reimer, P. J., Austin, W. E., Bard, E., Bayliss, A., Blackwell, P. G., Ramsey, C. B., Butzin, M., Cheng, H., Edwards, R. L., Friedrich, M., and Grootes, P. M.: The IntCal20 Northern Hemisphere radiocarbon age calibration curve (0–55 cal kBP), Radiocarbon, 62, 725–757, https://doi.org/10.1017/RDC.2020.41, 2020.
Robinson, M. and Ballantyne, C. K.: Evidence for a glacial readvance pre-dating the Loch Lomond advance in Wester Ross, Scott. J. Geol., 15, 271–277, https://doi.org/10.1144/sjg15040271, 1979.
Rose, J., Lowe, J. J., and Switsur, R. V.: A radiocarbon date on plant detritus beneath till from the type area of the Loch Lomond Readvance, Scott. J. Geol., 24, 113–124, https://doi.org/10.1144/sjg24020113, 1988.
Schaefer, J. M., Codilean, A. T., Willenbring, J. K., Lu, Z. T., Keisling, B., Fülöp, R. H., and Val, P.: Cosmogenic nuclide techniques, Nat. Rev. Methods Primers, 2, 18, https://doi.org/10.1038/s43586-022-00096-9, 2022.
Simms, A. R., Best, L., Shennan, I., Bradley, S. L., Small, D., Bustamante, E., Lightowler, A., Osleger, D., and Sefton, J.: Investigating the roles of relative sea-level change and glacio-isostatic adjustment on the retreat of a marine based ice stream in NW Scotland, Quat. Sci. Rev., 2777, 107366, https://doi.org/10.1016/j.quascirev.2021.107366, 2022.
Sissons, J. B.: The Loch Lomond readvance in the northern mainland of Scot land, in: Studies in the Scottish Lateglacial Environment, edited by: Gray, J. M. and Lowe, J. J., Pergamon, Oxford, 45–59, https://doi.org/10.1016/B978-0-08-020498-7.50009-1, 1977.
Sissons, J. B. and Dawson, A. G.: Former sea-levels and ice limits in part of Wester Ross, northwest Scotland, Proc. Geol. Assoc., 92, 115–124, https://doi.org/10.1016/S0016-7878(81)80012-0, 1981.
Small, D. and Fabel, D.: A Lateglacial 10Be production rate from glacial lake shorelines in Scotland, J. Quat. Sci., 30, 509–513, https://doi.org/10.1002/jqs.2804, 2015.
Small, D. and Fabel, D.: Was Scotland deglaciated during the Younger Dryas? Quat. Sci. Rev., 145, 259–263, https://doi.org/10.1016/j.quascirev.2016.05.031, 2016.
Small, D., Rinterknecht, V., Austin, W., Fabel, D., Miguens-Rodriguez, M., and Xu, S.: In situ cosmogenic exposure ages from the Isle of Skye, northwest Scotland: implications for the timing of deglaciation and readvance from 15 to 11 ka, J. Quat. Sci., 27, 150–158, https://doi.org/10.1002/jqs.1522, 2012.
Smith, C. G. and Marsden, G. R.: Report on Geophysical and Geological Survey at Blackmount, Argyllshire, Mineral Reconnaissance Progress Report No. 16, Natural Environment Research Council, UK, URI, p. 10, https://nora.nerc.ac.uk/id/eprint/10670 (last access: 15 March 2026), 1977.
Stoker, M. S., Leslie, A. B., Scott, W. D., Briden, J. C., Hine, N. M., Harland, R., Wilkinson, I. P., Evans, D., and Ardus, D. A.: A record of late Cenozoic stratigraphy, sedimentation and climate change from the Hebrides Slope, North-East Atlantic Ocean, J. Geol. Soc. London, 151, 235–249, https://doi.org/10.1144/gsjgs.151.2.0235, 1994.
Stone, J. O.: Air pressure and cosmogenic isotope production, J. Geophys. Res., 105, 23753–23759, https://doi.org/10.1029/2000JB900181, 2000.
Stone, J. O., Ballantyne, C. K., and Fifield, K. L.: Exposure dating and validation of periglacial weathering limits, northwest Scotland, Geology, 26, 587–590, https://doi.org/10.1130/0091-7613(1998)026<0587:EDAVOP>2.3.CO;2, 1998.
Stroeven, A. P., Heyman, J., Fabel, D., Björck, S., Caffee, M. W., Fredin, O., and Harbor, J. M.: A new Scandinavian reference 10Be production rate, Quat. Geochronol., 29, 104–115, https://doi.org/10.1016/j.quageo.2015.06.011, 2015.
Sutherland, D. G.: The Quaternary deposits and landforms of Scotland and the neighbouring shelves: a review, Quat. Sci. Rev., 3, 157–254, https://doi.org/10.1016/0277-3791(84)90017-9, 1984.
Swanson, T. W. and Caffee, M. L.: Determination of 36Cl production rates derived from the well-dated deglaciation surfaces of Whidbey and Fidalgo Islands, Washington, Quat. Res., 56, 366–382, https://doi.org/10.1006/qres.2001.2278, 2001.
Taylor, J., Selby, D., Loyd, J. M., Best, L., Podrecca, L., Sageman, B. B., and Simms, A. R.: From Ice to Isolation: A geochemical reconstruction of the palaeoenvironmental evolution of Gairloch, NW Scotland (UK), since the Last Glacial Maximum, J. Quat. Sci., https://doi.org/10.1002/jqs.70057, 2026.
Turner, J. N., Holmes, N., Davis, S. R., Leng, M. J., Langdon, C., and Scaife, R. G.: A multiproxy (micro-XRF, pollen, chironomid and stable isotope) lake sediment record for the Lateglacial to Holocene transition from Thomastown Bog, Ireland, J. Quat. Sci., 30, 514–528, https://doi.org/10.1002/jqs.2796, 2015.
Uppala, S. M., KÅllberg, P. W., Simmons, A. J., Andrae, U., Bechtold, V. D. C., Fiorino, M., Gibson, J. K., Haseler, J., Hernandez, A., Kelly, G. A., Li, X., Onogi, K., Saarinen, S., Sokka, N., Allan, R. P., Andersson, E., Arpe, K., Balmaseda, M. A., Beljaars, A. C. M., Berg, L. V. D., Bidlot, J., Bormann, N., Caires, S., Chevallier, F., Dethof, A., Dragosavac, M., Fisher, M., Fuentes, M., Hagemann, S., Hólm, E., Hoskins, B. J., Isaksen, L., Janssen, P. A. E. M., Jenne, R., Mcnally, A. P., Mahfouf, J. F., Morcrette, J. J., Rayner, N. A., Saunders, R. W., Simon, P., Sterl, A., Trenberth, K. E., Untch, A., Vasiljevic, D., Viterbo, P., and Woollen, J.: The ERA-40 re-analysis, Q. J. R. Meteorol. Soc., 131, 2961–3012, https://doi.org/10.1256/qj.04.176, 2005.
WAIS Divide Project Members: Precise interpolar phasing of abrupt climate change during the last ice age, Nature, 520, 661–665, https://doi.org/10.1038/nature14401, 2015.
Walker, M., Lowe, J., Blockley, S. P., Bryant, C., Coombes, P., Davies, S., Hardiman, M., Turney, C. S., and Watson, J.: Lateglacial and early Holocene palaeoenvironmental “events” in Sluggan Bog, Northern Ireland: comparisons with the Greenland NGRIP GICC05 event stratigraphy, Quat. Sci. Rev., 36, 124–138, https://doi.org/10.1016/j.quascirev.2011.09.008, 2012.
Walker, M. J. C. and Lowe, J. J.: Postglacial environmental history of Rannoch Moor, Scotland. I. Three pollen diagrams from the Kingshouse area, J. Biogeog., 4, 333–351, https://doi.org/10.2307/3038192, 1977.
Walker, M. J. C. and Lowe, J. J.: Postglacial environmental history of Rannoch Moor, Scotland. II. Pollen diagrams and radiocarbon dates from the Rannoch Station and Corrour areas, J. Biogeog., 6, 349–362, https://doi.org/10.2307/3038087, 1979.
Young, N. E., Schaefer, J. M., Briner, J. P., and Goehring, B. M.: A 10Be production-rate calibration for the Arctic, J. Quat. Sci., 28, 515–526, https://doi.org/10.1002/jqs.2642, 2013.
Young, N. E., Schaefer, J. M., Goehring, B., Lifton, N., Schimmelpfennig, I., and Briner, J. P.: West Greenland and global in situ 14C production-rate calibrations, J. Quat. Sci., 29, 401–406, https://doi.org/10.1002/jqs.2717, 2014.