the Creative Commons Attribution 4.0 License.
the Creative Commons Attribution 4.0 License.
 | 19 Jan 2026
Exploring the relationships between Electron Spin Resonance (ESR)/Luminescence (OSL/TL) properties and trace element composition from quartz in various bedrocks (Strengbach catchment, Vosges)
Magali Rizza
Claire Aupart
Gilles Rixhon
Pierre G. Valla
Manon Boulay
Philippe Lach
Pierre Voinchet
Quartz Thermoluminescence (TL), Optically Stimulated Luminescence (OSL) and Electron Spin Resonance (ESR) offer valuable quantitative tools both for understanding sediment provenance and surface processes. However, the variability of quartz sensitivity remains an issue, attributed either to the intrinsic properties of source bedrock, to processes during sediment transport and deposition, or to both. This study addresses these questions by investigating quartz from magmatic, metamorphic, and sedimentary formations in the Strengbach catchment (Vosges Massif, France). Using a combination of ESR, TL, OSL, and LA-ICPMS (Laser-Ablation Inductively Coupled Plasma Mass Spectrometry) trace element analyses, our study reveals significant relationships between quartz TL-OSL/ESR sensitivities and source bedrock characteristics, such as lithology, crystallization conditions, and deformation histories. ESR Ti-centre and TL-OSL signals are notably influenced by trace elements like Al, Li, and Ti. Quartz that underwent high pressure during metamorphism along with those located in the tectonic shear zone show both lowest TL-OSL and ESR intensities, while higher sensitivities are observed in quartz from plutonic rocks and sandstones. This suggests that (i) pressure can be one of the prevailing factors driving changes in quartz TL-OSL/ESR sensitivities (ii) enhanced quartz TL-OSL sensitivity in mature and recycled sediments (sandstones) highlight the importance of sedimentary transport and reworking on TL-OSL and ESR signals.
Our results highlight the need for careful interpretation of ESR and TL-OSL signals, both for dating or sourcing, particularly in sediments derived from metamorphic terrains.
- Article
(7508 KB) - Full-text XML
- BibTeX
- EndNote


Sediment routing systems in fluvial catchments are primarily governed by intertwined climatic, tectonic and man-induced drivers that operate at centennial or millennial timescales (Allen, 2017). Among the various geomorphological and geochemical approaches developed to trace sediment provenance and dynamics, the potential of (palaeo-)dosimetric or trapped-charge methods, such as Electronic Spin Resonance (ESR) and Thermoluminescence (TL) or Optically Stimulated Luminescence (OSL), has been recently explored (e.g. Gray et al., 2019). While both are extensively used to date Quaternary alluvial environments for instance (e.g. Rixhon et al., 2017), properties of quartz-luminescence signals have also gained vivid interest for deciphering sediment provenance and sediment transport/mobility in space and time (Tsukamoto et al., 2011; Gray et al., 2017, 2019; Sawakuchi et al., 2018; Mineli et al., 2021; Capaldi et al., 2022; Fitzsimmons et al., 2022; Nelson et al., 2022; Souza et al., 2023; Goswami et al., 2024). This is particularly true for quartz TL-OSL sensitivity (i.e. the light emitted per unit mass per radiation dose; see e.g. Pietsch et al., 2008; Sawakuchi et al., 2011a; Fitzsimmons, 2011; Gliganic et al., 2017) which can be acquired using relatively rapid and low-cost measurements compared to conventional provenance-analysis methods (e.g. Gray et al., 2019; Sawakuchi et al., 2020). Similarly, ESR sensitivity (i.e. amount of signal growth per unit dose, can be used to understand the quartz grain history (Liu et al 2022).
Two competing assumptions, however, can explain the variability of quartz sensitivity, making it a matter of current scientific debate. While some argue that it depends on various factors, it is, on the one hand, influenced by the nature and thermal history of the source rock material, making it an intrinsic property of quartz (e.g. Sharma et al., 2017; Capaldi et al., 2022). On the other hand, it would be induced by surface processes and transport distances, i.e. cycles of erosion-transport-deposition during source-to-sink sediment routing (e.g. Pietsch et al., 2008; Sawakuchi et al., 2011a, 2018; Fitzsimmons, 2011; Gliganic et al., 2017; del Río et al., 2021). In this case, heat, high pressure, daylight exposure and irradiation during burial can thus all be involved in quartz sensitivity. This hypothesis is tempered by three main complications. First, laboratory experiments based on repeated irradiations (i.e. trap filling) and bleaching through light exposure (i.e. charge removal) showed somewhat contrasting results for both trapped-charge methods. Whereas TL-OSL sensitisation of quartz occurs over multiple irradiation/bleaching cycles (Moska and Murray, 2006; Pietsch et al., 2008), possible ESR sensitivity changes under multiple cycles are still debated (Beerten and Stesmans, 2006a; Tissoux et al., 2008; Toyoda et al., 2009). Second, low-sensitivity luminescence and ESR signals differs between bedrock types and sediment transport history (e.g. Duttine et al., 2002; Sawakuchi et al., 2011a, b). Third, quartz-luminescence and ESR analysis for sediment provenance can also be challenging because alluvial sediments typically consist in mixtures of countless individual quartz grains and each of them has its own bedrock origin and has undergone its own complex history in a particular catchment area (e.g. Gray et al., 2019). For this reason, the response of the paramagnetic quartz centres (ESR) or the luminescence sensitivity (TL-OSL) can greatly vary in complex geological settings with contrasting natures of quartz-bearing bedrock.
Given our insufficient knowledge on the variability of TL-OSL/ESR sensitivities in quartz, one must primarily discriminate whether signal variations are predominantly linked either to the nature of the bedrock material (provenance) or to the sediment history within the catchment (sediment dynamics). First, we argue that, before using signals from trapped-charge methods as tracers for sediment dynamics within fluvial routing systems, ESR and OSL signals from source bedrocks must be thoroughly investigated. Except a handful of studies over the two last decades (Sawakuchi et al., 2011a; Jeong and Choi, 2012; Zular et al., 2015; Guralnik et al., 2015), this key part of the question was clearly disregarded. This is all the more problematic as quartz formed under distinct conditions (e.g. plutonic versus metamorphic processes or magma of various compositions) will contain different number and nature of luminescent and/or paramagnetic centres, leading to distinct ESR and TL-OSL responses. Second, if a correlation between the ESR/TL-OSL sensitivity and trace-element contents in quartz was suggested, only few studies quantitatively explored these potential chemical/physical relationships (e.g. Shimada et al., 2016). Third, physical relationships between ESR paramagnetic centres and OSL luminescent centres were proposed (e.g. Preusser et al., 2009) yet insufficiently explored.
Against this background, this study primarily aims to understand how each quartz grain/aliquot holds a source-specific signature by investigating variability in primary ESR and TL-OSL characteristics related to different bedrock nature, composition and history. We thus focus on quartz grains originating from magmatic, metamorphic and sedimentary formations occurring in a small-sized catchment (the so-called Strengbach) draining the Variscan Vosges Massif located in easternmost France. Both ESR and TL-OSL measurements are performed alongside with trace element determination by Laser-Ablation Inductively Coupled Plasma Mass Spectrometry (LA-ICPMS). We specifically emphasise on Al, Li, and Ti contents because they are (i) some of the most common trace elements in quartz, (ii) the primary paramagnetic centres used in ESR dating, and (iii) suspected to closely control TL-OSL signal sensitivity. Such systematic comparison between ESR and TL-OSL luminescence characteristics, in relation to trace element content in quartz, is unique and our results highlight the potential of combining physical and chemical quantitative approaches to assess sediment provenance in natural geological systems.
2.1 TL-OSL sensitivity on primary source bedrocks
Some variability of OSL sensitivity in magmatic and metamorphic quartz was observed and linked to magma-crystallisation processes and/or pressure-temperature conditions during metamorphism (Lukas et al., 2007; Sawakuchi et al., 2011a, b; Jeong and Choi, 2012; Zular et al., 2015; Guralnik et al., 2015). Higher TL-OSL sensitivity observed in quartz from bedrock formed at high temperatures probably results from crystallization temperature on the production of intrinsic or extrinsic defects in quartz (Sawakuchi et al., 2011b). Higher crystallization temperature favours both key processes at the heart of the luminescence phenomenon in quartz by increasing the occurrence of Si- and O-vacancies (Preusser et al., 2009) and the substitution of Si4+ cations by Al3+ and Ti4+ (Dennen et al., 1970; Götze et al., 2001; Wark and Watson, 2006). Laboratory experiments also report increasing luminescence sensitivity in quartz with heating (Bøtter-Jensen et al., 1995; David and Sunta, 1981; Koul, 2006; Polymeris et al., 2007; Poolton et al., 2000; Rink et al., 1993).
Reported values of TL-OSL sensitivity in quartz range from two to five orders of magnitude between crystalline rocks (magmatic and metamorphic) and sedimentary rocks (Alexanderson, 2022; Mineli et al., 2021; Sawakuchi et al., 2011a, 2020; Souza et al., 2023). Indeed, both sensitisation of quartz luminescence and growing contribution of a fast component signal are supposed to be linked with sediment transport distance and the number of burial-exposure cycles (Pietsch et al., 2008; Fitzsimmons, 2011; Rhodes and Pownall, 1994; Preusser et al., 2006; Lukas et al., 2007; Gray et al., 2019), as documented by laboratory experiments with repetitive irradiation-bleaching treatments (McKeever et al., 1996; Li, 2002; Moska and Murray, 2006; Koul and Chougaonkar, 2007). Thus, low sensitivity of quartz grains is commonly attributed to minimal transport distance and/or young sedimentary history. However, the downstream increase in quartz TL-OSL sensitivity is not always documented in natural environments (Sawakuchi et al., 2018; Capaldi et al., 2022; Magyar et al., 2024; Parida et al., 2025) and the role of transport in quartz OSL sensitization remains source of discussion. By contrast with bright TL-OSL signals measured in highly reworked sediments, primary source bedrocks contain dim quartz grains characterised by low OSL sensitivities and reduced fast component, making them very difficult to use as only few grains provide a luminescence signal (Sawakuchi et al., 2011a; Jeong and Choi, 2012; Guralnik et al., 2015; Mineli et al., 2021).
It may be also indicative of different intrinsic concentration of holes at certain light-sensitive recombination centres and types of impurities and defects in the mineral structure, which control the main luminescence traps and centres (Preusser et al., 2006, 2009).
2.2 ESR characteristics on primary source bedrocks
ESR spectra linked to Al and Ti paramagnetic centres traditionally measured in quartz aliquots for dating studies (Ikeya, 1993) document large variabilities related to the saturation value or the Ti Al intensities ratios. Interestingly, geographical provenance of quartz, likely in relation with the regional bedrock geological nature, seems playing a key role here with variable configurations: high intensities for both centres (e.g. USA, Indonesia, Toyoda and Ikeya, 1994; Fig. A1) or high intensity for one centre only, including (very) high Al versus weak (or even absent) Ti intensity in the Pyrenees foreland (Delmas et al., 2018) and Chinese lœss (Toyoda, 2015), or the opposite (e.g. Philippines; Ingicco et al., 2024). Moreover, the very few existing studies on primary source bedrocks mainly focused on the non-radiosensitive E1' centre of quartz (i.e. O-vacancy electron centre). As it may act as a non-radiative centre competing with the recombination process (Poolton et al., 2000), it is not used for dating applications (e.g. Jani et al., 1983; Toyoda and Ikeya, 1991, 1994; Ono et al., 1998; Toyoda et al., 2016). However, Duttine et al. (2002) and Kotova et al. (2008) highlighted some differences between the relative intensities of Ge, Al and Ti paramagnetic centres in different bedrocks ([GeO4 Na+]°, [GeO4 Li+]°, [AlO4 h]° [TiO4 H+]°, [TiO4 Li+]°, [TiO4 Na+]°). Moreover, Shimada et al.'s (2013) study on the E1' centres in relation to signal intensity of Al and Ti-Li in quartz from various Japanese bedrocks and sedimentary deposits showed distinctions between volcanic and granitic sources, thereby suggesting that ESR signals in quartz may be used as a source tracer. In addition, intensity ratios of Al, Ti-Li or Ti-H centres in quartz grains from various river sediments can be related to provenance in the catchment (Tissoux et al., 2015; Shimada et al., 2016). Whilst the influence of grain-size on the ESR response of quartz was thoroughly studied (Timar-Gabor, 2018), comparable results can only be obtained using samples of similar grain-size fractions (Shimada et al., 2016).
The Strengbach catchment is located in easternmost France and drains the western flank of the Vosges Massif (Fig. 1a). This low mountain range is part of the Variscan orogen that formed during the subduction and subsequent collision of the Saxothuringian plate below the Moldanubian plate during the second half of the Palaeozoic (Schulmann et al., 2014). This specific catchment was selected because of two main reasons. First, hydrological, hydrogeological and (hydro-)geochemical monitoring has been continuously achieved in the catchment's headwaters over more than 30 years with quantitative data on in situ silicate dissolution (e.g. Wild et al., 2019), including quartz, together with regolith evolution on millennial timescale (Ackerer et al., 2016). Second, despite the catchment's small size (< 40 km2), it hosts various quartz-bearing lithologies, including Palaeozoic metamorphic and plutonic rocks and Mesozoic sedimentary rocks (Fig. 1b). All of them were sampled and are presented hereinafter in detail in chronological order.
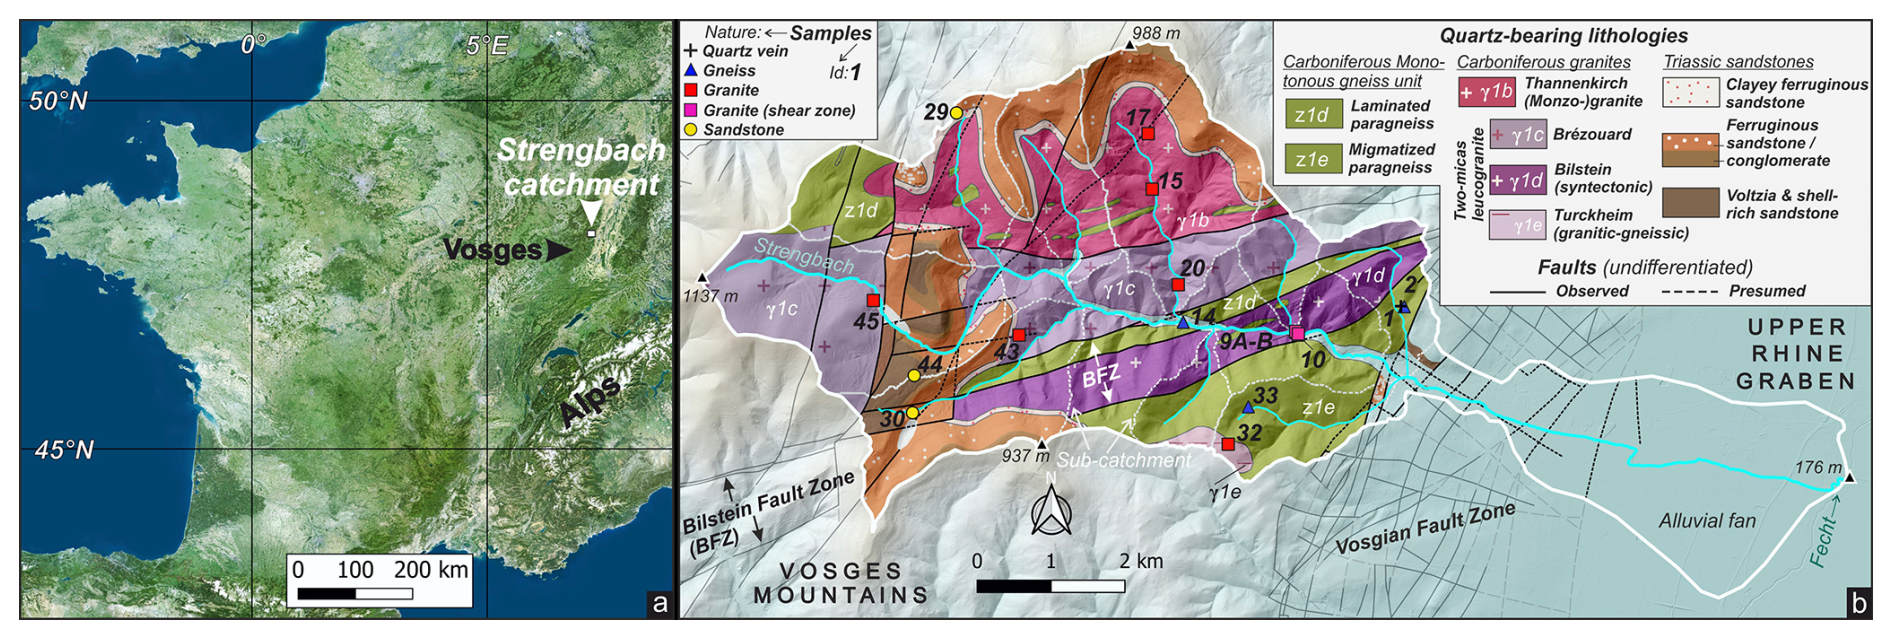
Figure 1(a) Location of the study area in the Vosges; (b) geological map of the Strengbach catchment, adapted and simplified from the French Geological Survey's (BRGM) geological map.
3.1 Metamorphic basement
The metamorphic basement covers ca. 20 % of the drainage area. It is composed of sillimanite paragneiss from the so-called Monotonous Gneiss Unit (von Eller, 1961). The latter formed during the Carboniferous from late Cambrian-early Ordovician sediments (Skrzypek et al., 2012) under a medium pressure and temperature conditions prograde metamorphism (see Table 1, z1d and z1e) followed by a near isothermal decompression associated with rapid exhumation (Latouche et al., 1992; Rey et al., 1992; Schulmann, 2002). Spatial variations occur within the Monotonous gneiss facies linked to the gneiss protolith and later evolution involving fracturing, magmatic and hydrothermal activity. In particular, gneissic units to the South of the Bilstein fault zone are affected by an increasing degree of partial melting materialised by the transition to migmatitic domains to the south of the watershed (z1e, Fig. 1b; Fluck et al., 1991; von Eller, 1961).
Table 1Main characteristics of rock formations sampled for ESR and TL-OSL analysis in the Strengbach catchment.
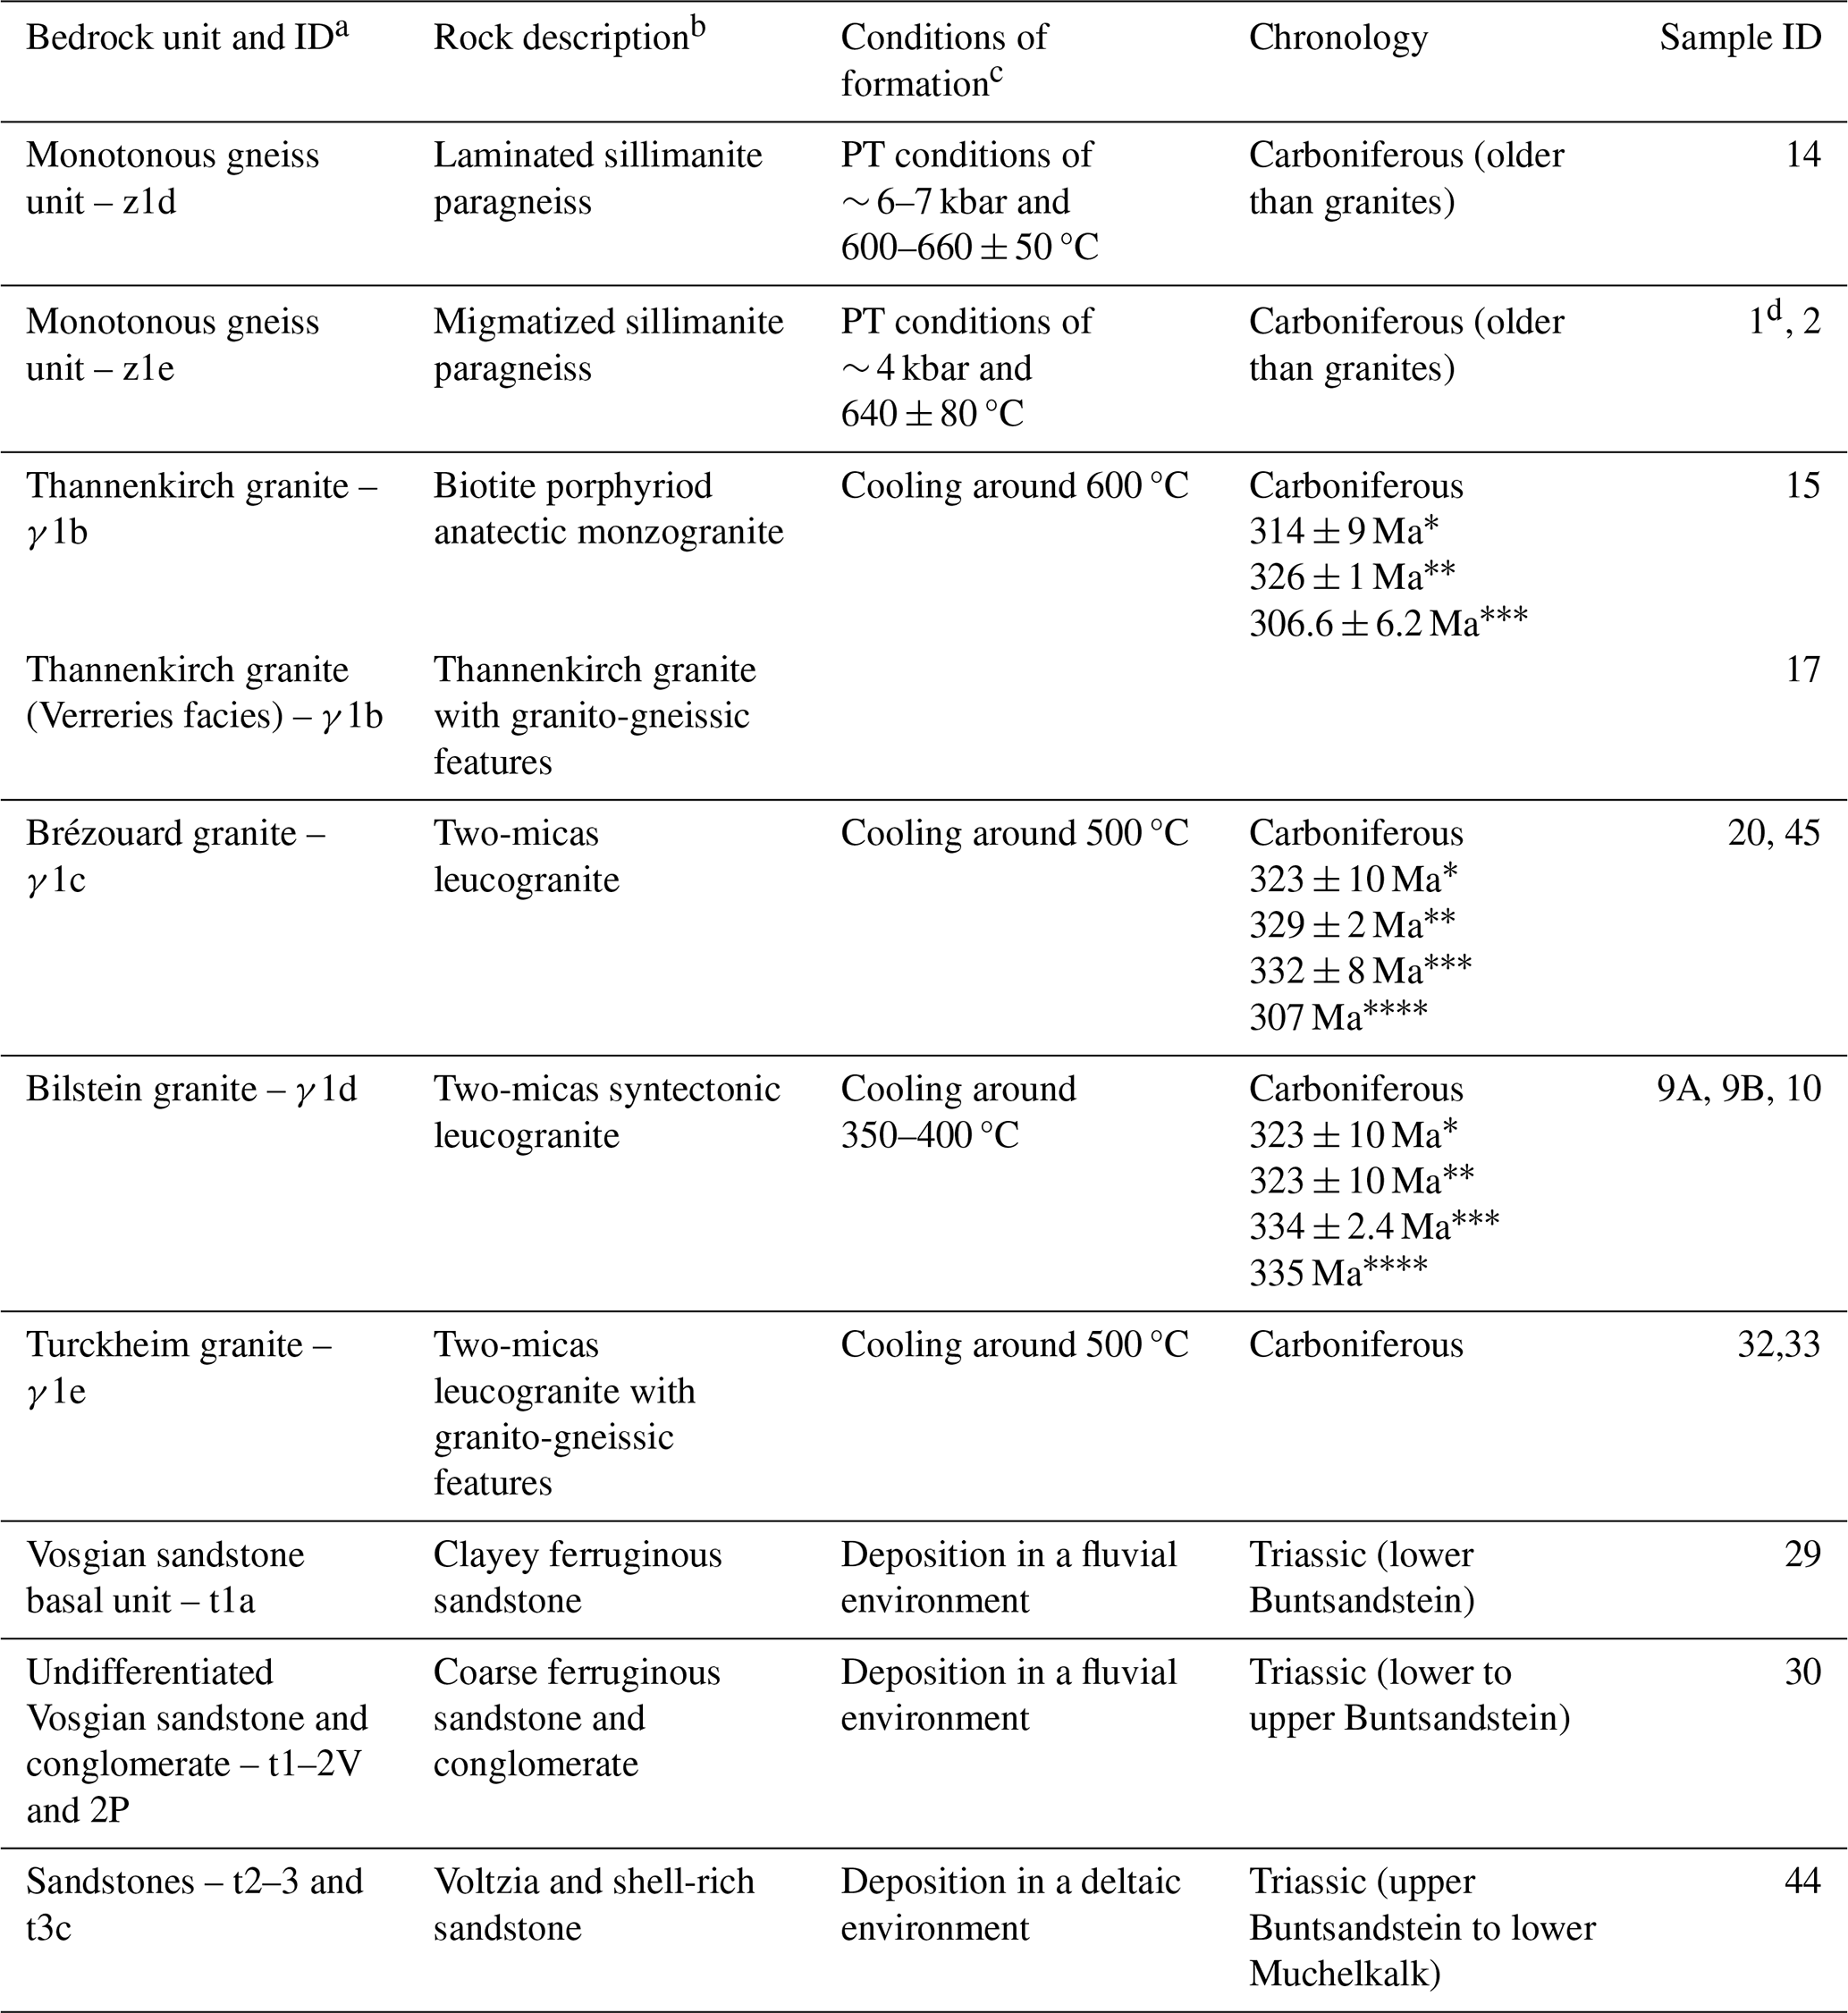
a Referring to BRGM 1:50 000 map and notice; b after von Eller (1961), Fluck (1980), and Saavedra et al. (1973); c Metamorphic PT conditions and depositional environments; d quartz vein sampled in metamorphic rock formations Dating methods: * K-Ar – chlorite or muscovite (data from Boutin et al., 1995); U-Pb – zircon (data from Kratinova et al., 2007 and Schulmann et al., 2002); Ar-Ar – muscovite or amphibole (data from Boutin et al., 1995); Rb-Sr – muscovite and bulk (data from Bonhomme, 1967).
3.2 Granitic intrusions
Four different Carboniferous leucogranites cover ca. 50 % of the drainage area and intrude the metamorphic basement along major faults, such as the Bilstein fault zone (BFZ) in the Strengbach catchment (Fig. 1b; Fluck et al., 1991; Skrzypek et al., 2014). They match one of the latest magmatic events during the Vosges Massif's formation which occurred during a phase of N-S extensional subsidence of the orogen ca. 10–15 Ma after the metamorphic basement's rapid exhumation (Skrzypek et al., 2014; Tabaud et al., 2014). The so-called Thannenkirch granite (γ1b) first intruded the basement (Kratinova et al., 2007). It is a porphyroid, biotite-rich anatectic monzogranite that formed from the melting of the surrounding gneiss (von Eller, 1961). The so-called Brézouard (γ1c), Bilstein (γ1d) and Turckheim (γ1e) granites subsequently formed from melting of deeper crustal material (Fluck et al., 1991; von Eller, 1961). The Brézouard granite was second to intrude the basement, followed by the syntectonic Bilstein granite (Kratinova et al., 2007). The Bilstein granite formed while the BFZ was active and deformed following a ca. N70 senestral motion (von Eller, 1961). Such deformation can also be found in the southern part of the Brézouard pluton and within the Thannenkirch pluton (Fluck et al., 1991; Kratinova et al., 2007). Within the Thannenkirch pluton, the so-called Verreries facies hosts granito-gneissic features as the anatectic fusion remained in an early stage (von Eller, 1961). The Turckheim granite only marginally intrudes the Monotonous Gneiss Unit to the south of the Strengbach catchment. While its relative formation timing remains unknown, it locally evidences granito-gneissic characteristics (Blanat et al., 1972).
3.3 Sedimentary cover
Triassic Buntsandstein units (mostly sandstones) are deposited on top of crystalline rock formations, following the intrusion of various leucogranites during the Carboniferous and a long-lasting erosional episode materialised by a ca. 50 Ma hiatus in the geological record. Three preserved units cover ca. 25 % of the Strengbach's drainage area (Fig. 1b). The lower one is the Vosgian basal unit (t1a) made of clayey ferruginous sandstone (lower Buntsandstein). The intermediate and main one (t1–2V and 2P) matches undifferentiated Vosgian sandstone and conglomerate (lower to upper Buntsandstein). The upper one (t2–3 and t3c) is made of Voltzia and shell-rich sandstone (upper Buntsandstein to lower Muchelkalk). Whereas fluvial depositional environments are traditionally attributed to the two lower units, the upper one is related to a deltaic environment (Gall, 2006). The subsidence of the Upper Rhine Graben (mostly Cenozoic) led to the formation of major N-S oriented faults that crosscut the westernmost part of the Strengbach catchment (von Eller, 1961).
3.4 Sampling strategy
The Strengbach catchment's small size (ca. 40 km2) and easy access to source material both enabled systematic sampling of all quartz-bearing rock formations. Altogether, fifteen bedrock samples were collected throughout the catchment (Fig. 1b, Table 1, Fig. B1). Three of them were collected from the Monotonous gneiss unit: one in each facies that are laminated (Z1d, #14) and migmatized (z1e, #02) paragneisses (i.e. “Gneiss”) along with one metamorphic quartz vein sample (#01; i.e. “Vein”). Nine granitic samples form the bulk of our dataset as this lithology roughly constitutes the half of the drainage area: Three samples were collected in the Bilstein granite (γ1d, #9A, 9B and 10) close to a shear zone (i.e. “Deformed granite”). Six granites were collected from intrusions (γ1b and γ1c #15, 17, 20, 45; i.e. “Granite”) and (γ1e, #32, 33; i.e. “Altered granite”). The remaining three samples (#29, 30, 44) were collected from the Triassic Buntsandstein formations, i.e. one sample per sedimentary unit (t1a, t1–2V and 2P and t2–3 and t3c; i.e. “Sandstone”). Table 1 summarises the sampled rock formations with labels, ages and a short description of lithology and conditions of formation.
4.1 Sample preparation
Bedrock samples were prepared and processed at the OSL laboratory of the Centre de Recherche et d'Enseignement des Géosciences de l'Environnement (CEREGE, Aix en Provence, France). For each bedrock sample, between ∼ 1 and 4 kg of rocks were gently crushed and sieved to isolate the 180–250 µm grain-size fraction, followed by a first chemical bath with 37 % HCl to remove potential surface carbonates, followed by magnetic separation with a Frantz magnetic separator (two steps at 10°–0.5A and 10°–1.5A) to remove magnetic and/or heavy minerals. Following this separation, ∼ 50 to 70 g of the remaining material undergone chemical treatment for a week with a slight stirring in a solution of of HCl and of H2SiF6 to remove a large part of the feldspar grains. Density separation using lithium heteropolytungstate (LST) heavy liquid at 2.62 g cm−3 density was performed to further isolate quartz from feldspar. If feldspar grains were still detected under the binocular magnifier, we performed a second magnetic separation with addition of magnetite powder, followed by a rinsing step in a solution of 10 % of HCl. No HF treatment was performed for preserving as much as possible the quartz-grain structure and surface for future analyses such as trace-element distribution with Laser Induced Breakdown Spectroscopy (LIBS). This step was replaced by a second treatment for a week in a solution of of HCl and of H2SiF6 to remove any remaining feldspar inclusions. Finally, the prepared samples were separated into two batches to be measured by ESR and OSL. In parallel, 100 µm thick sections of each rock were created for analysis by Laser ablation inductively coupled mass spectrometry (LA-ICPMS).
4.2 OSL and TL measurements for sensitivity analysis
Aliquots of ∼ 100–300 quartz grains were mounted in stainless discs using silicon oil, and a first evaluation of feldspar contamination was performed using infrared (IR) stimulation at 60 °C before further analysis. Luminescence signals were measured on stainless plates using a Lexsygsmart reader equipped with a beta radiation source delivering a dose rate of ∼ 0.124 Gy s−1, with blue (458 nm, maximum power of 100 mW cm−2) and infrared (850 nm, maximum power of 200 mW cm−2) LEDs for stimulations and filters (Hoya-U340 + Delta-BP 365/50) for light detection in the ultraviolet band (380 nm). For all TL steps, the heating rate was 5 °C s−1.
Luminescence measurements for OSL at 125 °C and TL sensitivities were carried out following the protocols modified from Sawakuchi et al. (2020) or Mineli et al. (2021), which are presented in Table 2. For each bedrock sample, three aliquots were measured and subsequently weighted for mass normalisation.
Table 2Analytical protocol to measure the TL peak sensitivity at 110 °C and BOSL at 125 °C (columns A), adapted from Mineli et al. (2021) and to measure the BOSL sensitivity at 25 °C (columns B), adapted from Sawakuchi et al. (2020). Data considered in this article are shown in bold.
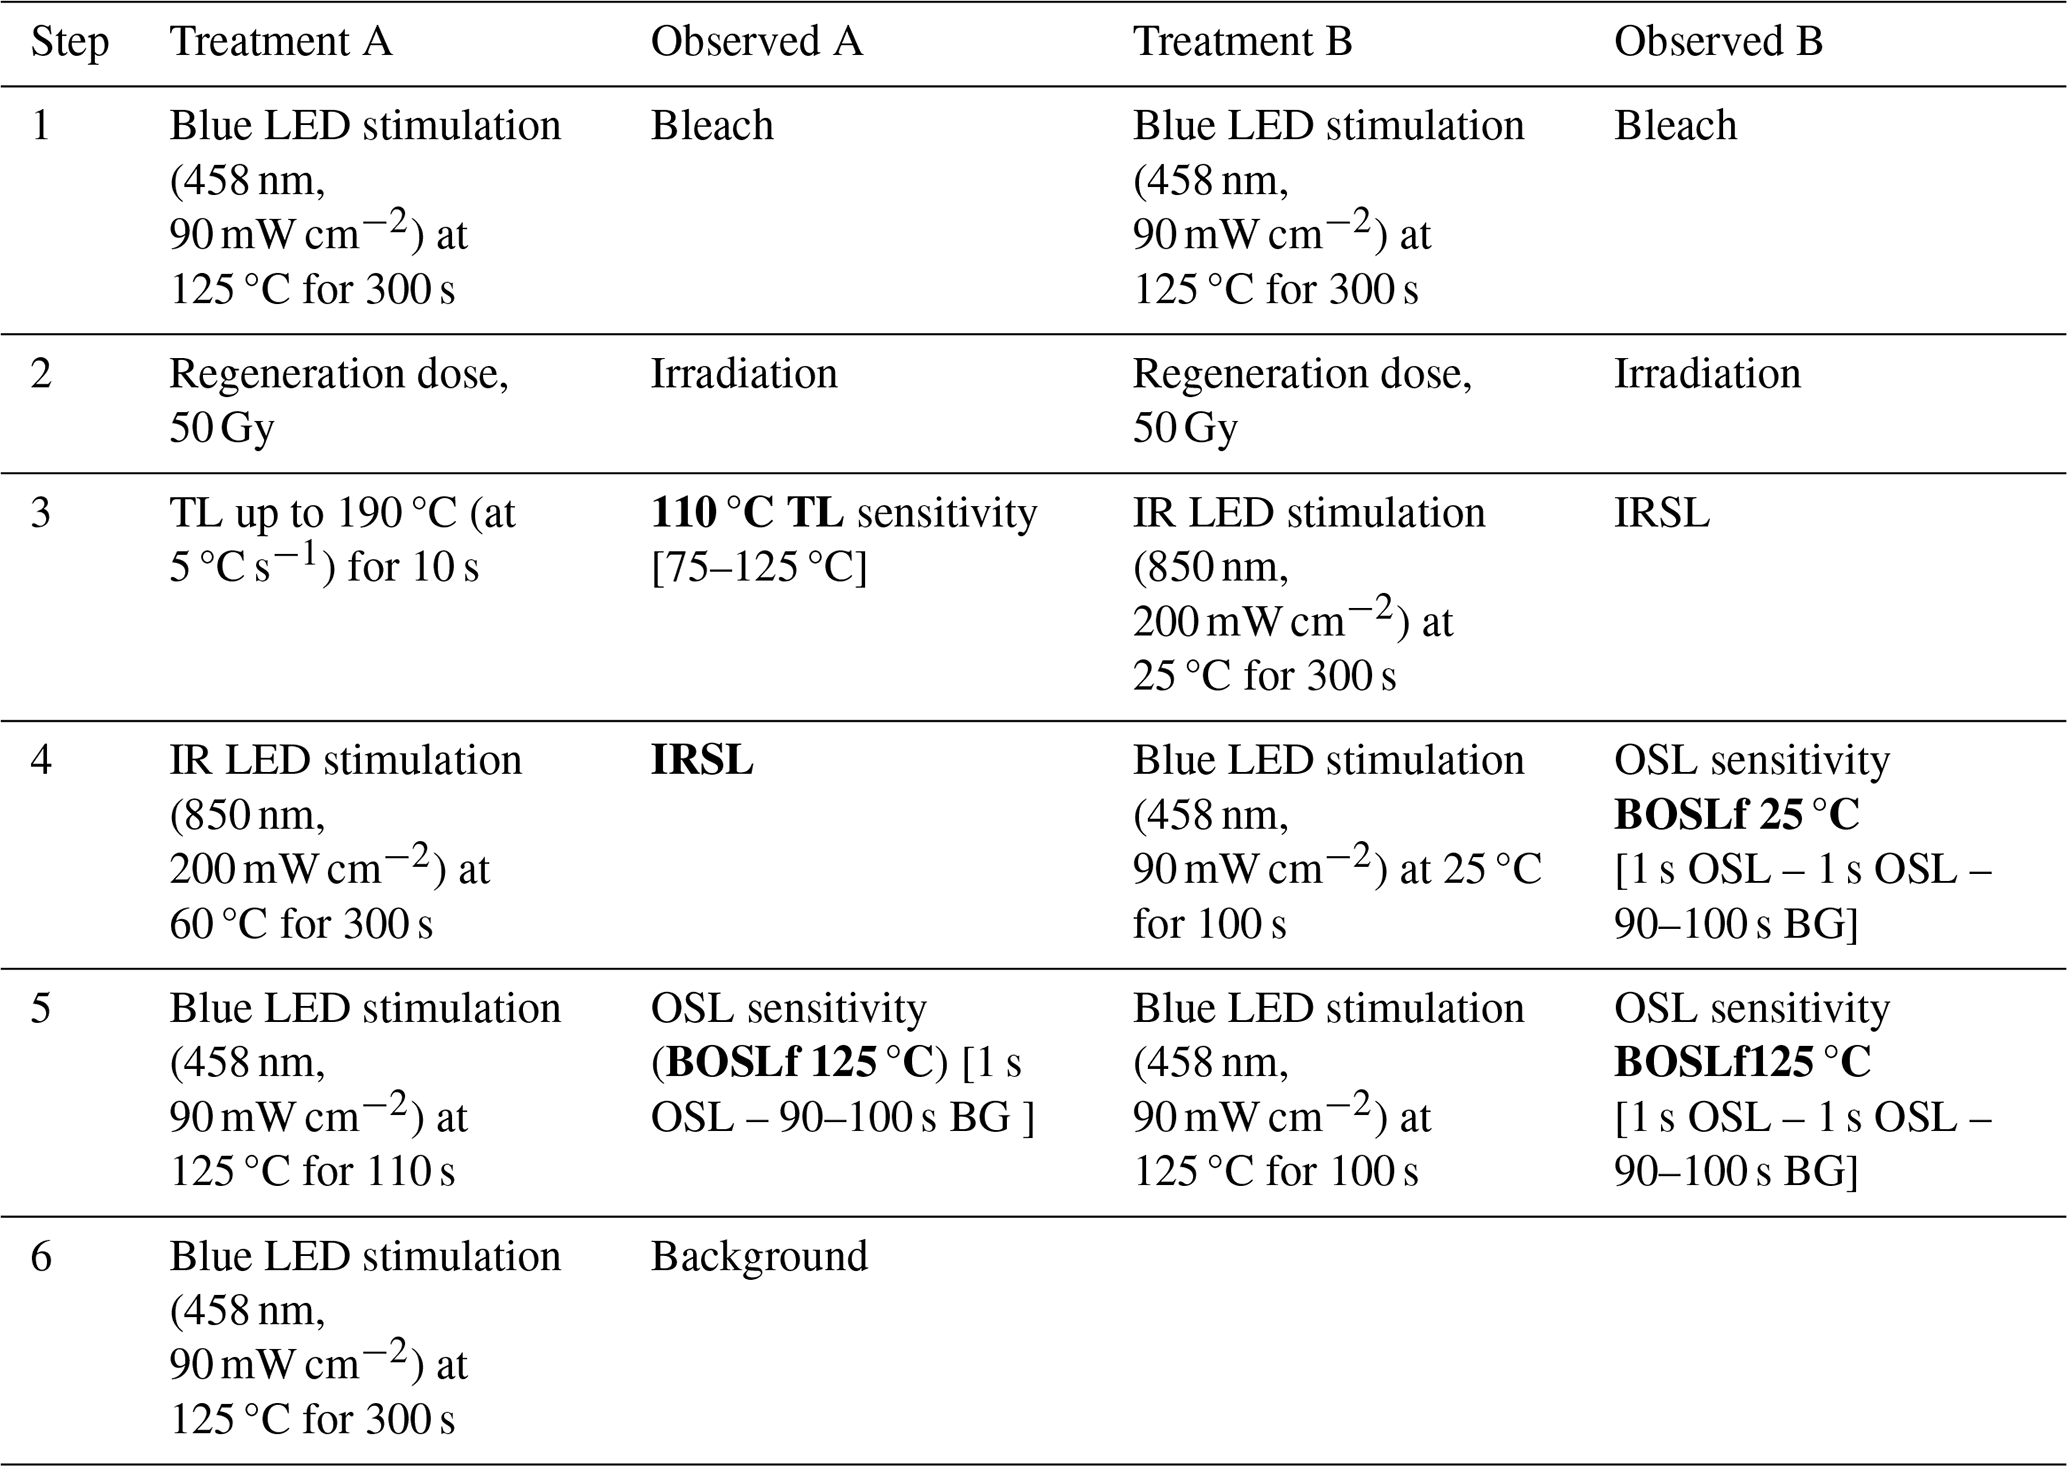
The aliquots were first bleached for 300 s at 90 mW cm−2and 125 °C before any regeneration dose. Then, a regeneration dose of 50 Gy was given to all aliquots to allow, along with mass normalisation, uniform inter-comparisons of the measured luminescence signals among samples. In a first experiment, the TL peak of quartz at 110 °C (Murray and Roberts, 1998) is investigated to evaluate its regenerated sensitivity and possible correlation with the OSL sensitivity. The TL peak sensitivity is calculated by integrating the TL signal between 75 and 125 °C (TL110 °C), normalized by the regeneration dose and the aliquot mass (photon cts Gy−1 mg−1). After IR stimulation at 60 °C to confirm the quartz purity of the aliquot, the OSL sensitivity is measured using blue light stimulation at 125 °C (BOSL125 °C) and corresponds to the counts integrated over the first second of light emission, minus the normalised background from the last 10 s of the OSL decay curve (Fig. C1). In a second experiment (treatment B in Table 2), we evaluate the quartz OSL sensitivity after a second similar irradiation dose but measured at room temperature (BOSLf25 °C), which corresponds to the integral of the first second of light emission, minus the late background. Both signals are also normalized by the regeneration dose and the aliquot mass (photon cts Gy−1 mg−1).
4.3 ESR measurements
Measurements by ESR spectrometry imply the separation of all samples into two aliquots weighing ∼ 100 mg each. One aliquot of each sample was exposed to light (SOL2 solar simulator – HONLE) for 2000 h (Toyoda et al., 2000) to achieve maximum bleaching of Al and Ti ESR centres. Both bleached and natural (non-bleached) aliquots were then measured in an EMX Brucker ESR spectrometer located in the laboratory of Histoire Naturelle de l'Homme Préhistorique (Paris, France) using following parameters: 5 mW microwave power; temperature of 90 °K; 1024 point resolution; 20 mT sweep width; 100 kHz modulation frequency; 0.1 mT modulation amplitude; 40 ms conversion time – 20 ms time constant. The Al, Ti-Li and Ti-H centres were measured simultaneously following Toyoda and Falguères's (2003) recommendations for the Al centre and those of Toyoda et al. (2000) for Ti centres. ESR intensities were measured for all centres and provided following information: (i) the total intensity of the Al centre from the natural aliquot (Al), (ii) the optically non-bleachable intensity of the Al centre (DAT) corresponding to the intensity of the bleached aliquot; (iii) the OBAT: Optically bleachable intensity of the Al centre (OBAT) obtained by (Al) – (DAT), (iv) the bleaching percentage of the Al centre (Bl %) obtained by ((Al − DAT) Al) × 100, the Ti-Li intensity (Ti-Li) and the Ti-H intensity (Ti-H). We reasonably assume that both Al and Ti centres are in saturation before sample processing and measurements. Indeed, according to single exponential dose response curves, the saturation dose of the Al centre is reported in literature from 3000 to 6000 Gy, and that of the Ti centre was between 2700 and 4700 Gy for quartz (Rink et al., 2007; Duval, 2012). Fitted with a single saturating plus linear function (Duval 2012) the saturation dose of the Al centre range between 1900 and 6500 Gy). In our samples, annual doses were calculated from laboratory gamma-ray spectrometry measurements on rocks sampled in the Strenghbach basin (Ortec HPGe spectrometer, MNHN, France). Average annual doses on granites are of the order of 4000 µGy yr−1 (4 Gy/1000 years). Because source bedrocks are older than 250 Ma, the dose received is estimated at around min. 1 000 000 Gy. For gneiss, annual doses are a about 3000–3500 µGy yr−1, and doses received are therefore higher than 1 000 000 Gy. For sandstones, the calculated annual dose is around 1000 µGy yr−1. Considering the Triassic age of the deposits, the total dose received is higher than of 300 000 Gy. This implies that all of our samples, regardless of their own saturation value, received a radiation dose greater than this value.
4.4 LA-ICPMS analyses
LA-ICPMS analyses were performed in the laboratories of the French Geological Survey (BRGM, Orléans, France) on an Agilent 8900 Triple Quadrupole ICP-MS coupled to a 193 nm Teledyne CETAC Technologies Photon-Machine Excite Excimer laser equipped with a HelEx 2 laser-ablation cell. The laser was run at a shot frequency of 8 Hz, energy was set to 6 mJ, and a spot size of 50 µm was used. The acquisition of each spot lasted 60 s with 20 s of background before the start of the 30-second-long ablation. To prevent quartz from breaking under the laser beam, analyses were carried out on thick sections made from whole rock samples from bedrocks. A total of fifteen samples were analysed for trace elements in quartz (including Al, Li, and Ti) with between 28 and 60 spots on the various quartz grains present on the thick section. On each section, the quartz grains present were located and targeted beforehand by microscopy. All quartz grain types of sufficient size and comparable to those extracted for ESR and OSL were analysed. No matrix or other mineral were targeted by the laser. Element concentrations were obtained from the raw data using the software Glitter. Nist 612 was used as external standard (Pearce et al., 1997) and a concentration of 99.9 % SiO2 was used as internal standard for quantification. Data are based on a background-substracted-signal. Signal smaller than three times the background noise standard deviation was excluded, and detection limits were calculated based on these criteria for each analysis. Commonly, the highest calculated detection limit of each analysed element is selected and used to further exclude any data lower than these values. This is done so that the dataset is consistent and comparable. However, in our case, this implies the exclusion of an important number of otherwise reliable data (i.e. all Li concentrations of sample STR22-33). We decided instead to keep values for all the analyses that were above their associated limit of detection and to provide the maximum Limit Of Detection (LOD) for each sample as an indicator. Values below or close to the maximum LOD of each sample should be considered as indicative values rather than exact values. The median concentration for each considered element was calculated for each sample to allow comparisons with ESR and OSL data (i.e. aliquots with several hundreds of grains). The estimation error is defined as the half of the interquartile range. Tables with detection limits and median values per sample are provided in the supplementary information (Table D1) .
5.1 OSL, TL and ESR measurements
- i.
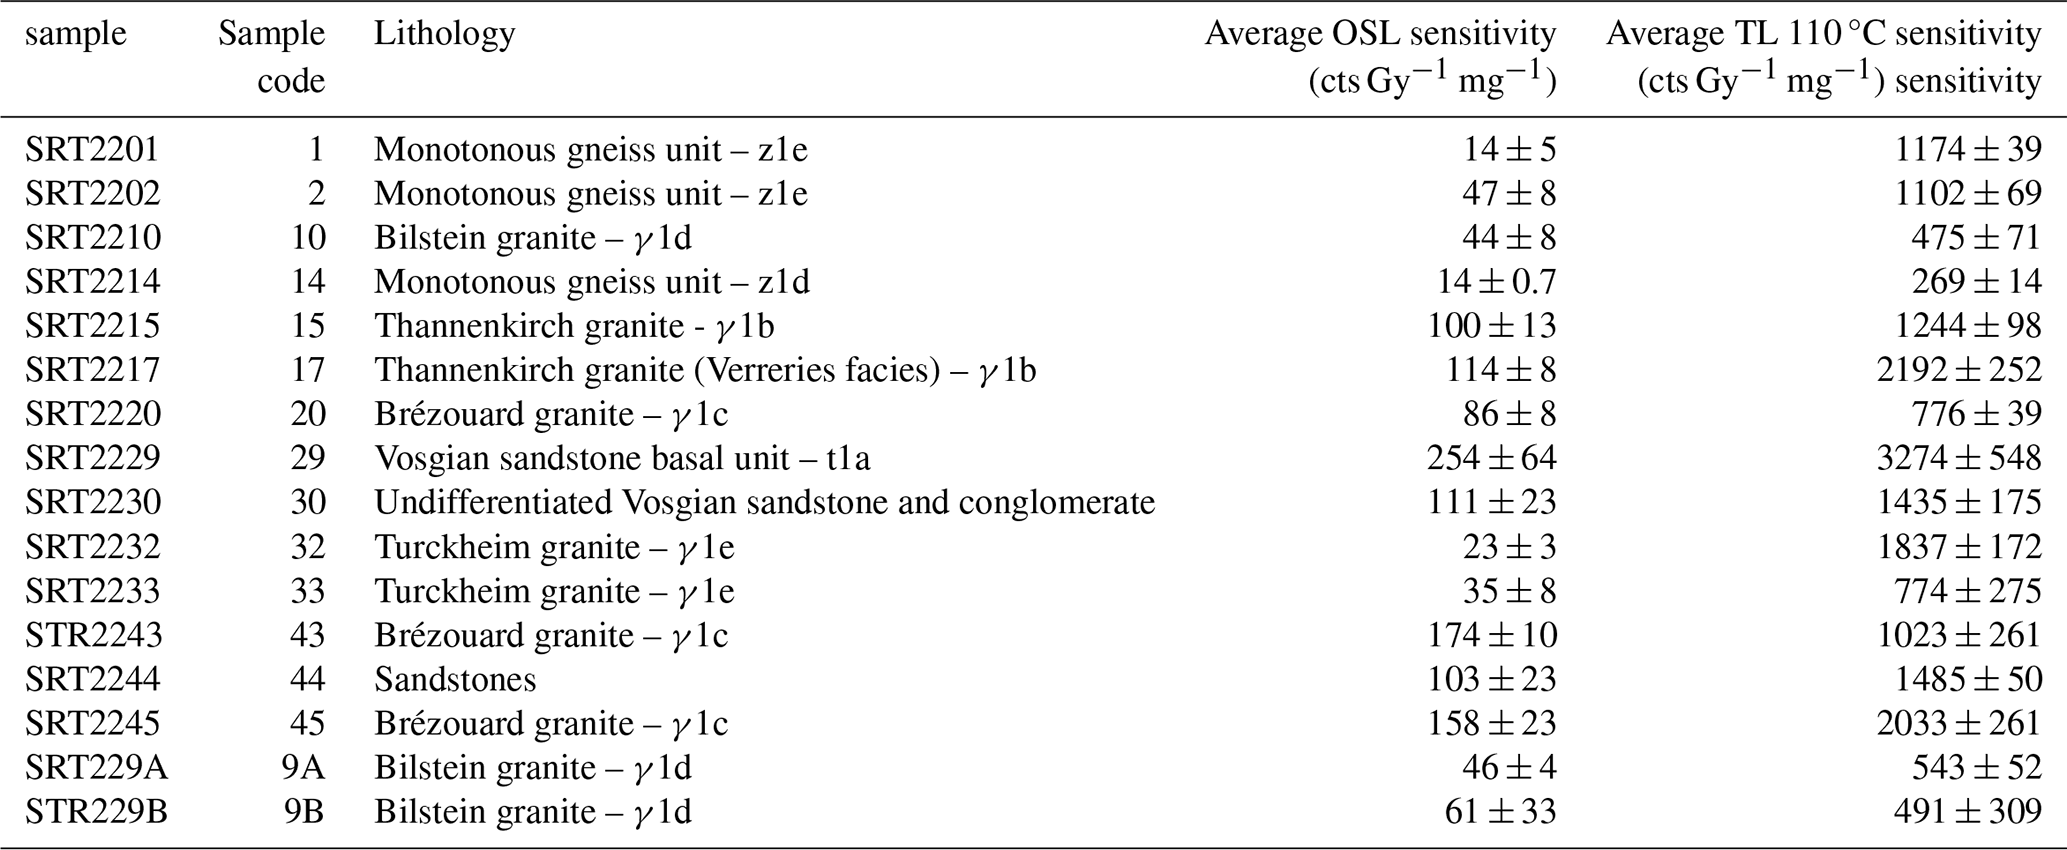
sensitivity values related to BOSL125 °C measurements range from ∼ 10 to ∼ 250 cts Gy−1 mg−1. This variability together with an OSL sensitivity gradient allow distinguishing two categories of bedrocks including eight and seven samples, respectively. On the one hand, low sensitivities ranging from 10 to 60 cts Gy−1 mg−1 are found in the quartz vein (z1d; #01), both gneisses (z1d–e; #02, 14) and the syntectonic Bilstein granite (γ1d; #9A–B, 10) along with the gneissic Turckheim granite (γ1f; #32, 33) (Table 3, Fig. C1). On the other hand, both remaining granites (γ1b; #15, 17 and γ1c; #20, 45) along with all Triassic sandstones (t1a, t1–2 and t2–3; #29,30, 44) present much brighter signals comprised between 100 and 250 cts Gy−1 mg−1. The highest sensitivity is observed in the lower Triassic sandstone (#29), which also shows a higher variability in measured aliquots.
- ii.
TL110 °C peak sensitivities present a pattern similar to that observed for the BOSL125 °C, with values ranging from ∼ 270 to 3300 cts Gy−1 mg−1
The highest TL110 °C sensitivity values are documented for granites and sandstones, the same sandstone sample (#29) as before showing much higher values than other bedrock samples (Fig. C1).
- iii.
sensitivity values related to BOSL25 °C measurements follow the same pattern with two groups of low and high BOSL25 °C intensities including the same lithologies as before. Comparison between BOSL25 °C and BOSL125 °C signals show an excellent linear correlation (R2=0.896) so that the different bedrock types plot along this linear fitting trend (Fig. 2a). A good linear correlation is also observed between TL110 °C and BOSL125 °C (R2=0.647, R2=0.804 without #32 outlier; Fig. 2b).
Table 3TL110 °C and BOSL125 °C measurements for samples presented in the manuscript.
Optically unbleachable (DAT) and Optically bleachable (OBAT) intensities of the Al centres along with Ti-Li and Ti-H intensities of each sample were measured on the same aliquot. The OBAT vs. DAT (Fig. 2c) are extremely variable between bedrock. First, main bedrock types (i.e. plutonic, metamorphic and sedimentary) clearly cluster into sub-groups, with the quartz vein (#01) clearly plotting apart (Fig. 2c). The latter also shows the lowest DAT intensities whereas the highest values are reported in the Bilstein deformed granites(#09A, 09B, 10). OBAT intensities display similar results: lowest value for the quartz vein vs. highest values for all types of granites. Second, the comparison between Ti-Li and Ti-H intensities shows a linear correlation (R2=0.721; Fig. 2d). It allows distinguishing two groups of bedrocks, similar to those based on BOSL125 °C measurements: low Ti-Li and Ti-H intensities for the quartz vein, gneisses and the Bilstein granite vs. high Ti-Li and Ti-H intensities for all remaining granites and sandstones. Given this excellent correlation between Ti-Li and Ti-H intensities, only the former will be discussed in the following since our conclusions made on Ti-Li are considered as effective also for Ti-H. Third, intensity comparison of Al vs. Ti-Li shows no linear correlation. Whereas most of the Al values cluster around ∼ 600 a.u., Ti-Li intensities scatter between 0 and 60 a.u. (Fig. 2e).
The comparison between BOSL125 °C sensitivities and Ti-Li intensities highlights two distinct groups: low sensitivities/intensities for the quartz vein, gneisses and Turckheim and Bilstein granites vs. high sensitivities/intensities for the remaining granites and sandstones (Fig. 2f) However no significant relationship can be calculated (R2 < 0.5). Sample #32 plots apart. By contrast, comparison of BOSL125 °C sensitivities with Al intensities shows no linear correlation as the latter cluster around 600 a.u. and 900 a.u. (Fig. 2g). We noticed that depending on the type of measurements, sample #32 shifts within bedrock groups: its BOSL125 °C sensitivity and ESR-Al intensity are similar to gneisses, while its ESR Ti-H and Ti-Li intensities place it in the granites/sandstones group. This sample was taken in granitic intrusions (γ1e, Table 1) into gneisses (z1e, Table 1), right at the boundary between granite and gneiss. It has acquired characteristics specific to both formations, as all the quartz grains were not recrystallized.
5.2 Trace element content
Al, Ti and Li concentrations are in the order of a hundred ppm for Al and around ten ppm for Ti and Li (Fig. 3).
Al contents do not discriminate between bedrock types, but median values seem slightly increasing from the quartz vein, gneisses and altered and deformed granites to those of granites. Li contents are scattered with different concentrations related to bedrock types: very low (< ∼ 5 ppm) in quartz veins/gneisses/altered granites (Turckheim), fairly homogeneous (∼ 15 ppm) in deformed (Bilstein) granites, and high (∼ 35 ppm) but with large scatter in granites (except #17) and sandstones. Ti content does not seem to discriminate between bedrock types. Gneisses and Altered granites showing a wide dispersion between samples from the same rock type whereas Ti content values for granites and sandstones are less scattered. The ratio between the median Al and Li contents shows a strong positive correlation (R2=0.891; Fig. 4a). In addition, two groups of samples can be distinguished here: one with low Li and Al contents and another with higher contents (Fig. 4a). These two groups of bedrocks were those previously reported with the trapped-charge methods (ESR/OSL) (Fig. 2a, d and g).
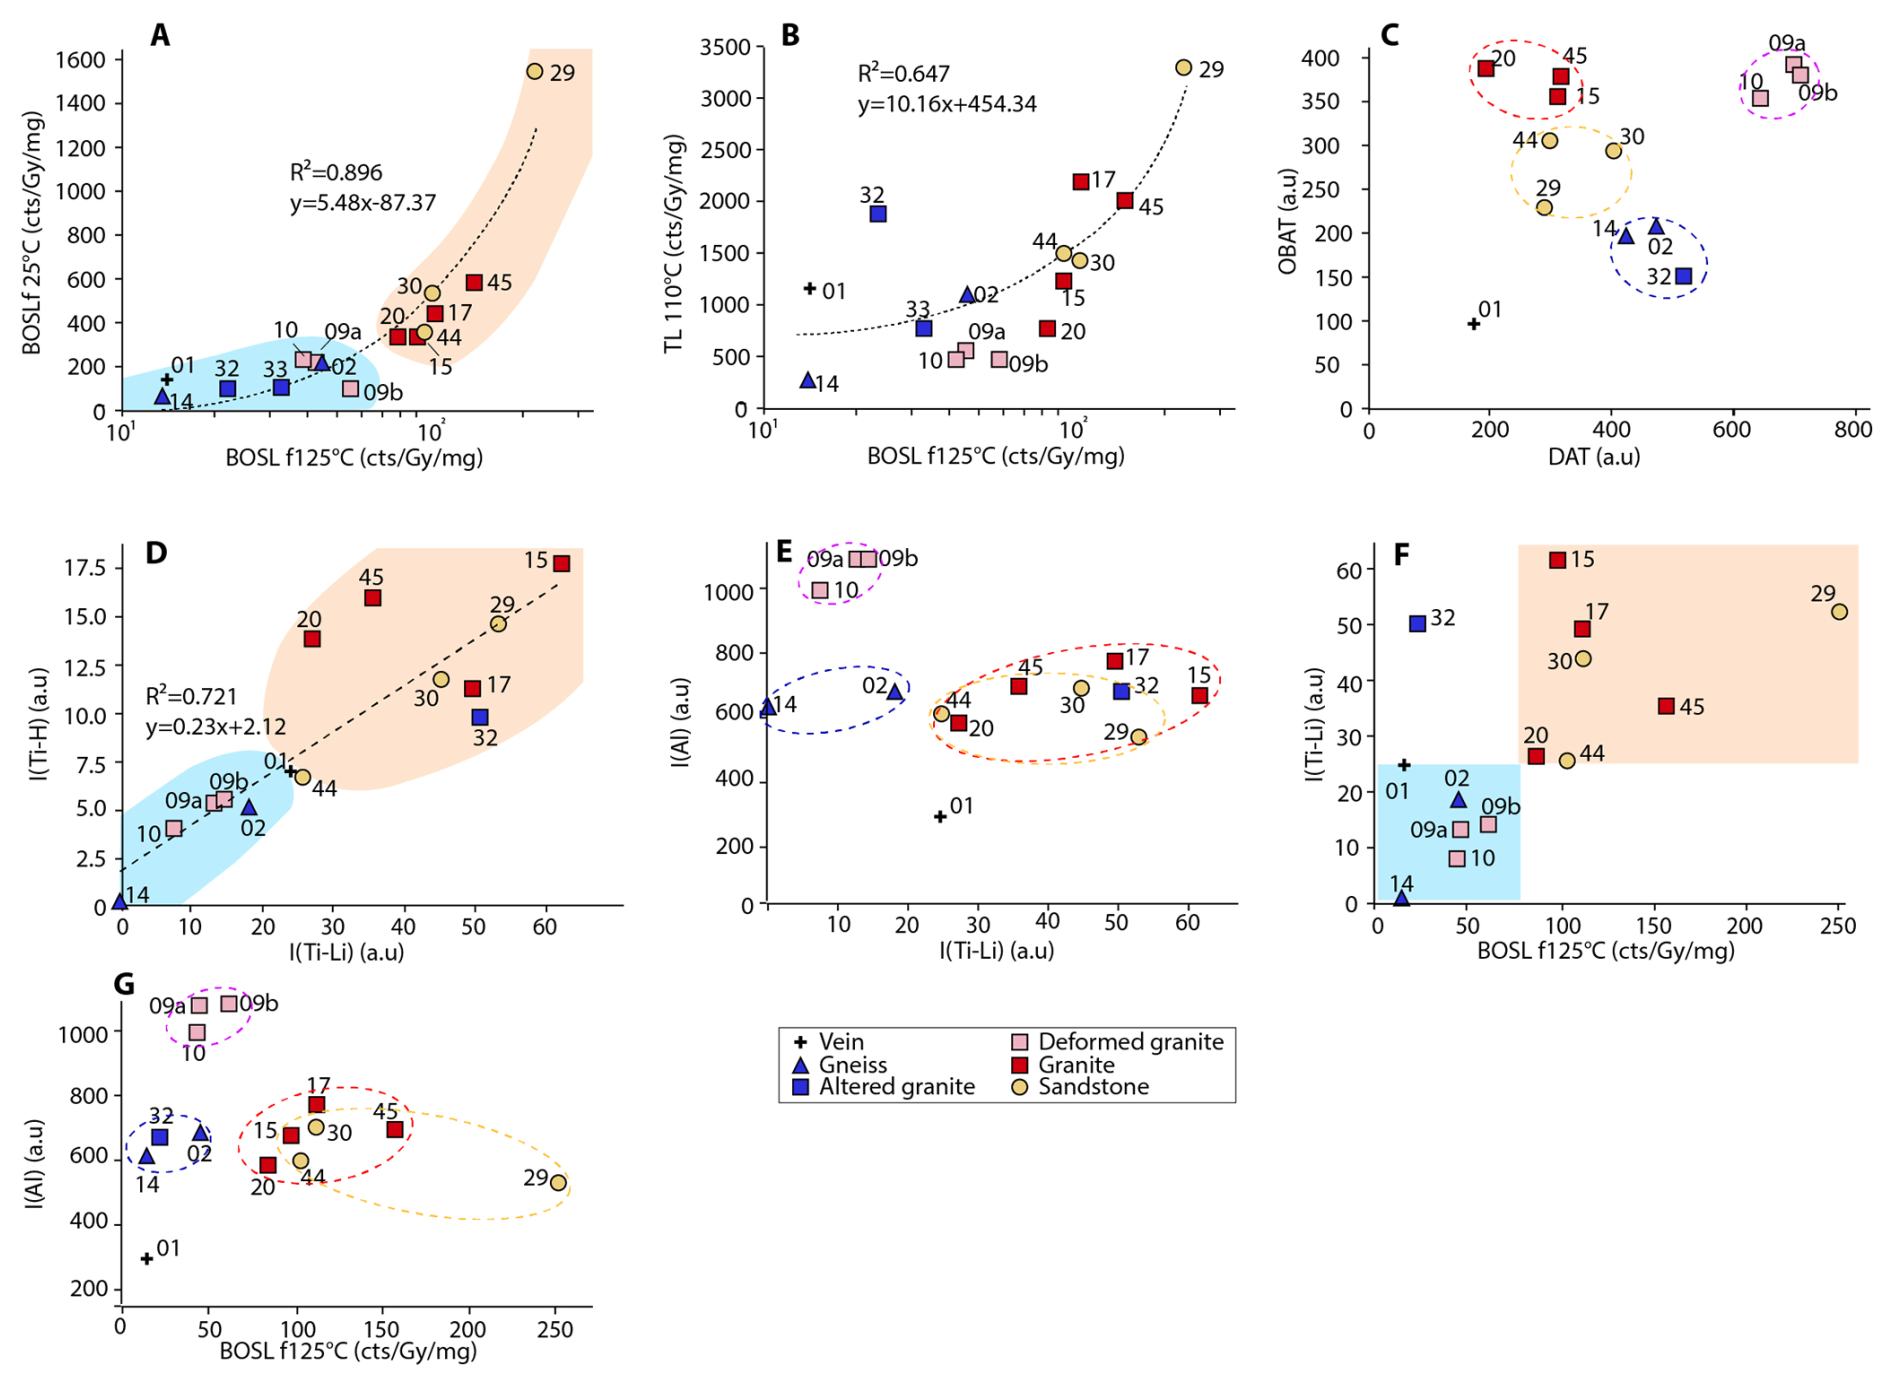
Figure 2Graphical representations of the data obtained by ESR, OSL on quartz grains extracted from magmatic, metamorphic and sedimentary rocks in the Strengbach basin. ESR Intensities or OSL sensitivities plotted: (a) BOSL25 °C vs. BOSL125 °C ; (b) TL110 °C vs. BOSL125 °C (c) ESR Al OBAT vs. ESR Al DAT; (d) ESR Ti-H vis ESR Ti-Li; (e) ESR Al vs. ESR Ti-Li; (f) ESR Ti-Li vs. BOSL125 °C; (g) ESR Al vs. BOSL125 °C.
5.3 Relation between OSL sensitivities/ESR intensities and Al, Ti, Li concentrations
First, comparison between Al contents and BOSLf125 °C sensitivities show a R2 of 0.514. Despite precautions to be taken on this R2 due to clustering of data points, it nevertheless indicates a rather good correlation (Fig. 4b). Again, it highlights the two usual groups: i.e. low sensitivity and low Al content for the quartz vein, gneisses, Turckheim and Bilstein altered granites vs. high sensitivity and high Al contents for the remaining granites and sandstones, except for granite sample #17 showing rather low Al content. Second – and interestingly – no linear correlation is observed between Al contents and ESR Al intensities (Fig. 4c). Third – by contrast – Ti contents correlate fairly well with ESR Ti-Li intensities (Fig. 4d, R2=0.398), with the same two groups as above except the sample #32 (gneiss) which includes the granite/sandstone group (Fig. 4d). Fourth, comparison between Li contents with ESR Ti-Li intensities do not allow to derive any correlation but highlight the same dichotomy, with samples #17 and 32 plotting as outliers (Fig. 4e) similar to Al contents vs. IRSL sensitivity (Fig. 4f).
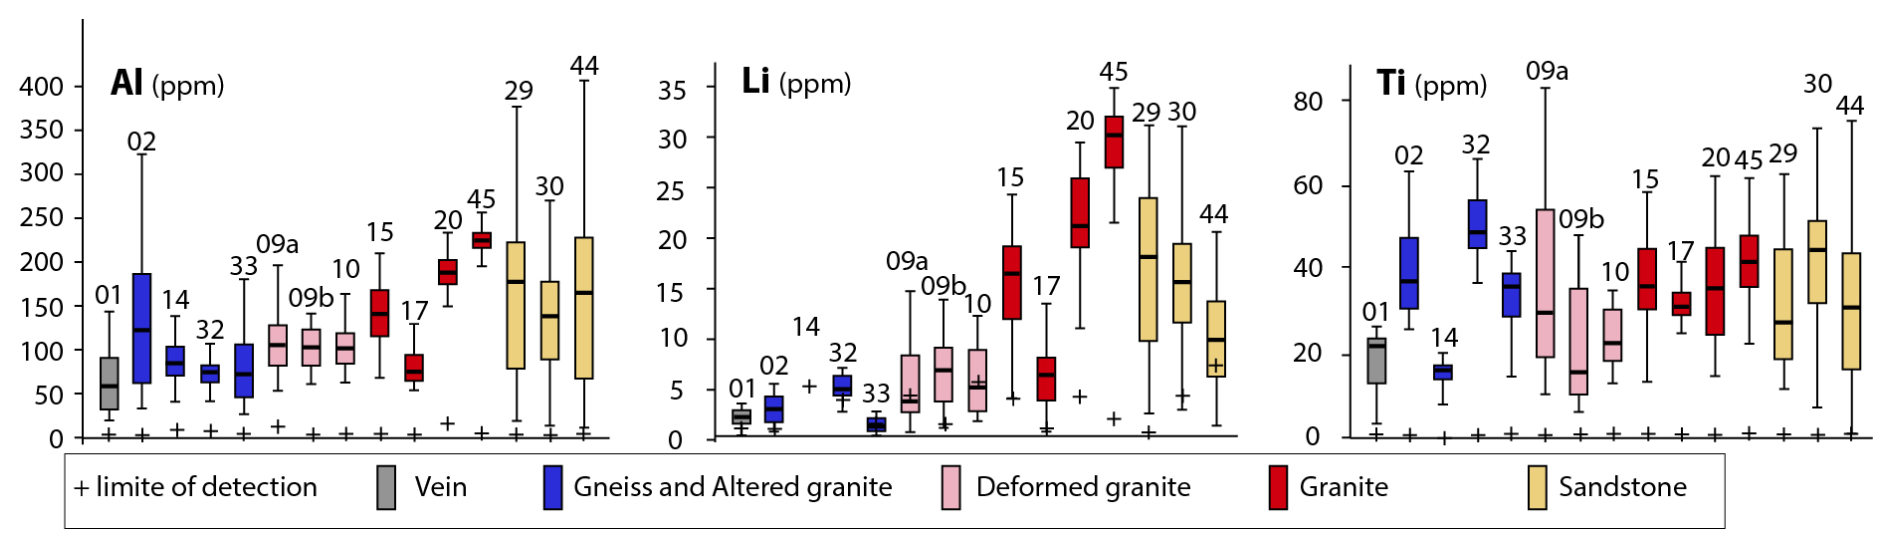
Figure 3Graphical representations of the Al, Li and Ti contents (ppm) obtained by La-ICPMS on quartz grains extracted from magmatic, metamorphic and sedimentary rocks in the Strengbach basin.
6.1 Quartz OSL/TL sensitivities and ESR intensities in source bedrocks
Quartz aliquots with low OSL sensitivity signals are documented in plutonic or metamorphic bedrocks and the reported values generally fall within the following range between ∼ 10 to 500 counts Gy−1 or slightly higher values for siliciclastic rocks (Sawakuchi et al., 2011a; Chithambo et al., 2007; Capaldi et al., 2022; Niyonzima et al., 2020; Mineli et al., 2021; Alexanderson, 2022, Constantin et al., 2025).
Our dataset also exhibits low quartz OSL sensitivities (i.e. ∼ 10 to ∼ 250 cts Gy−1 mg−1 or 15 to 615 cts Gy−1, Table 3) which fall into the previous range. We also notice a strong correlation (R2 = 0.647, R2 = 0.804 without #32 outlier, Fig. 2b) between the TL110 °C peak and the first second of the OSL signal (BOSLf125 °C) sensitivities, a laboratory observation widely acknowledged in the literature (Murray and Wintle, 2000; Jain et al., 2003; Mineli et al., 2021). The sensitivity present characteristics which seem correlating with the lithologies of source bedrocks, also reported with ESR intensities derived from Ti-Li, Ti-H, OBAT and DAT centres (Fig. 2c, d and e). Importantly, our results indicate that ESR and OSL sensitivities may depend on intrinsic properties of the source bedrock, as already pointed out by other studies (Duttine et al, 2003, Lutoev, 2005; Kotova et al., 2007, 2008; Shimada et al., 2013; Sawakuchi et al., 2011a; Capaldi et al. 2022; Niyonzima et al., 2020). In this respect, quartz extracted from a quartz vein and metamorphic bedrocks record the lowest ESR and OSL sensitivities values, as well as plutonic samples collected within a shear zone (i.e. samples #9A and 9B in the Bilstein fault zone). Intermediate ESR and OSL sensitivities values are observed in quartz collescted from plutonic rocks and sandstones. So once again, our results thus clearly indicate that (i) inter-sample variability is characteristic of the geological origin, and that (ii) two main groups can be obviously distinguished in our present dataset based on the analysis of different measured signals.
The Ti-Li ESR and BOSLf125 °C sensitivities appear to correlate (Fig 2F) but no correlation was observed between ESR-Al and BOSLf125 °C sensitivities (Fig. 2g), which would indicate that different centres may be involved in ESR and OSL signals.
6.2 Relation in ESR and TL-OSL sensitivities and trace element composition
The potential relationship between quartz OSL/ESR sensitivities and geological sources in relation to different natures and concentrations of impurities (trace elements) and/or vacancies within the crystal lattice responsible for OSL emission centres and/or traps was preliminary discussed in Preusser et al. (2006). We thus aim to further explore this relationship by specifically looking at the type and the concentration of impurities using trace element contents in our samples. Trace elements are preferentially incorporated into the quartz lattice on substitutional (i.e. Al, Ti, Ge) or interstitial (i.e. Li, Na, K) positions. First, we report a significant linear correlation (R2=0.789) between quartz's Al and Li contents so that two groups of quartz-bearing bedrocks can be distinguished in the Strengbach catchment (Fig. 4a). Interestingly, this relation may be explained if Li is mostly structurally incorporated for compensating Al in the quartz structure. Our data also agree with previous results showing that Li may be exclusively incorporated into the structural channels parallel to the c-axis of the quartz lattice as charge balancing cation for Al in granite and pegmatite (Stavrov, 1978; Götze et al., 2004).
6.2.1 OSL/TL
A good correlation is observed between Al contents and BOSLf125 °C (Fig. 4b, R2=0.514), as already reported in Alonso et al. (1983) and Preusser et al. (2009), whereas it is much weaker between Al contents and TL110 °C (Fig. 4f R2=0.139) signals. Considering the excellent correlation between TL (at 110 °C) and OSL (R2=0.647), the apparent discrepancy between the Al–TL and Al–OSL correlations likely arises from statistical and sampling issues. On the one hand, as Al3+ substitutes to Si4+ in the quartz crystalline lattice, increasing Al contents are generally well correlated with the compensating alkali ions (Li + Na + K). On the other hand, Godfrey-Smith and Cada (1996) and Guralnik et al. (2015) reported IRSL signals resulting from feldspar impurities with Al3+ (Alkali)+ complex in the quartz lattice itself. OSL data from the Strengbach's quartz-bearing bedrocks do not evidence the second correlation (Fig. 4g), thereby excluding Al enrichment by feldspar impurities. OSL data are instead consistent with Itoh et al.'s (2002) model for which the TL110 °C peak intensity is linked to the concentration of alkali-compensated Al centres (also determined by ICP-MS, Vartanian et al., 2000). We note that if a good correlation is observed between Al contents and BOSLf125 °C (Fig. 4b R2=0.514), it is much weaker between Al contents and TL110 °C (Fig. 4f R2=0.139) signals. Considering the excellent correlation between TL (at 110 °C) and OSL (R2=0.647), the apparent discrepancy between the Al–TL and Al–OSL correlations likely arises from statistical and sampling issues.
The relationship between luminescence models and sensitization processes remains poorly understood, due to the complex interplay between impurities, electron/hole traps, and luminescent charge recombination (Bailey, 2001).
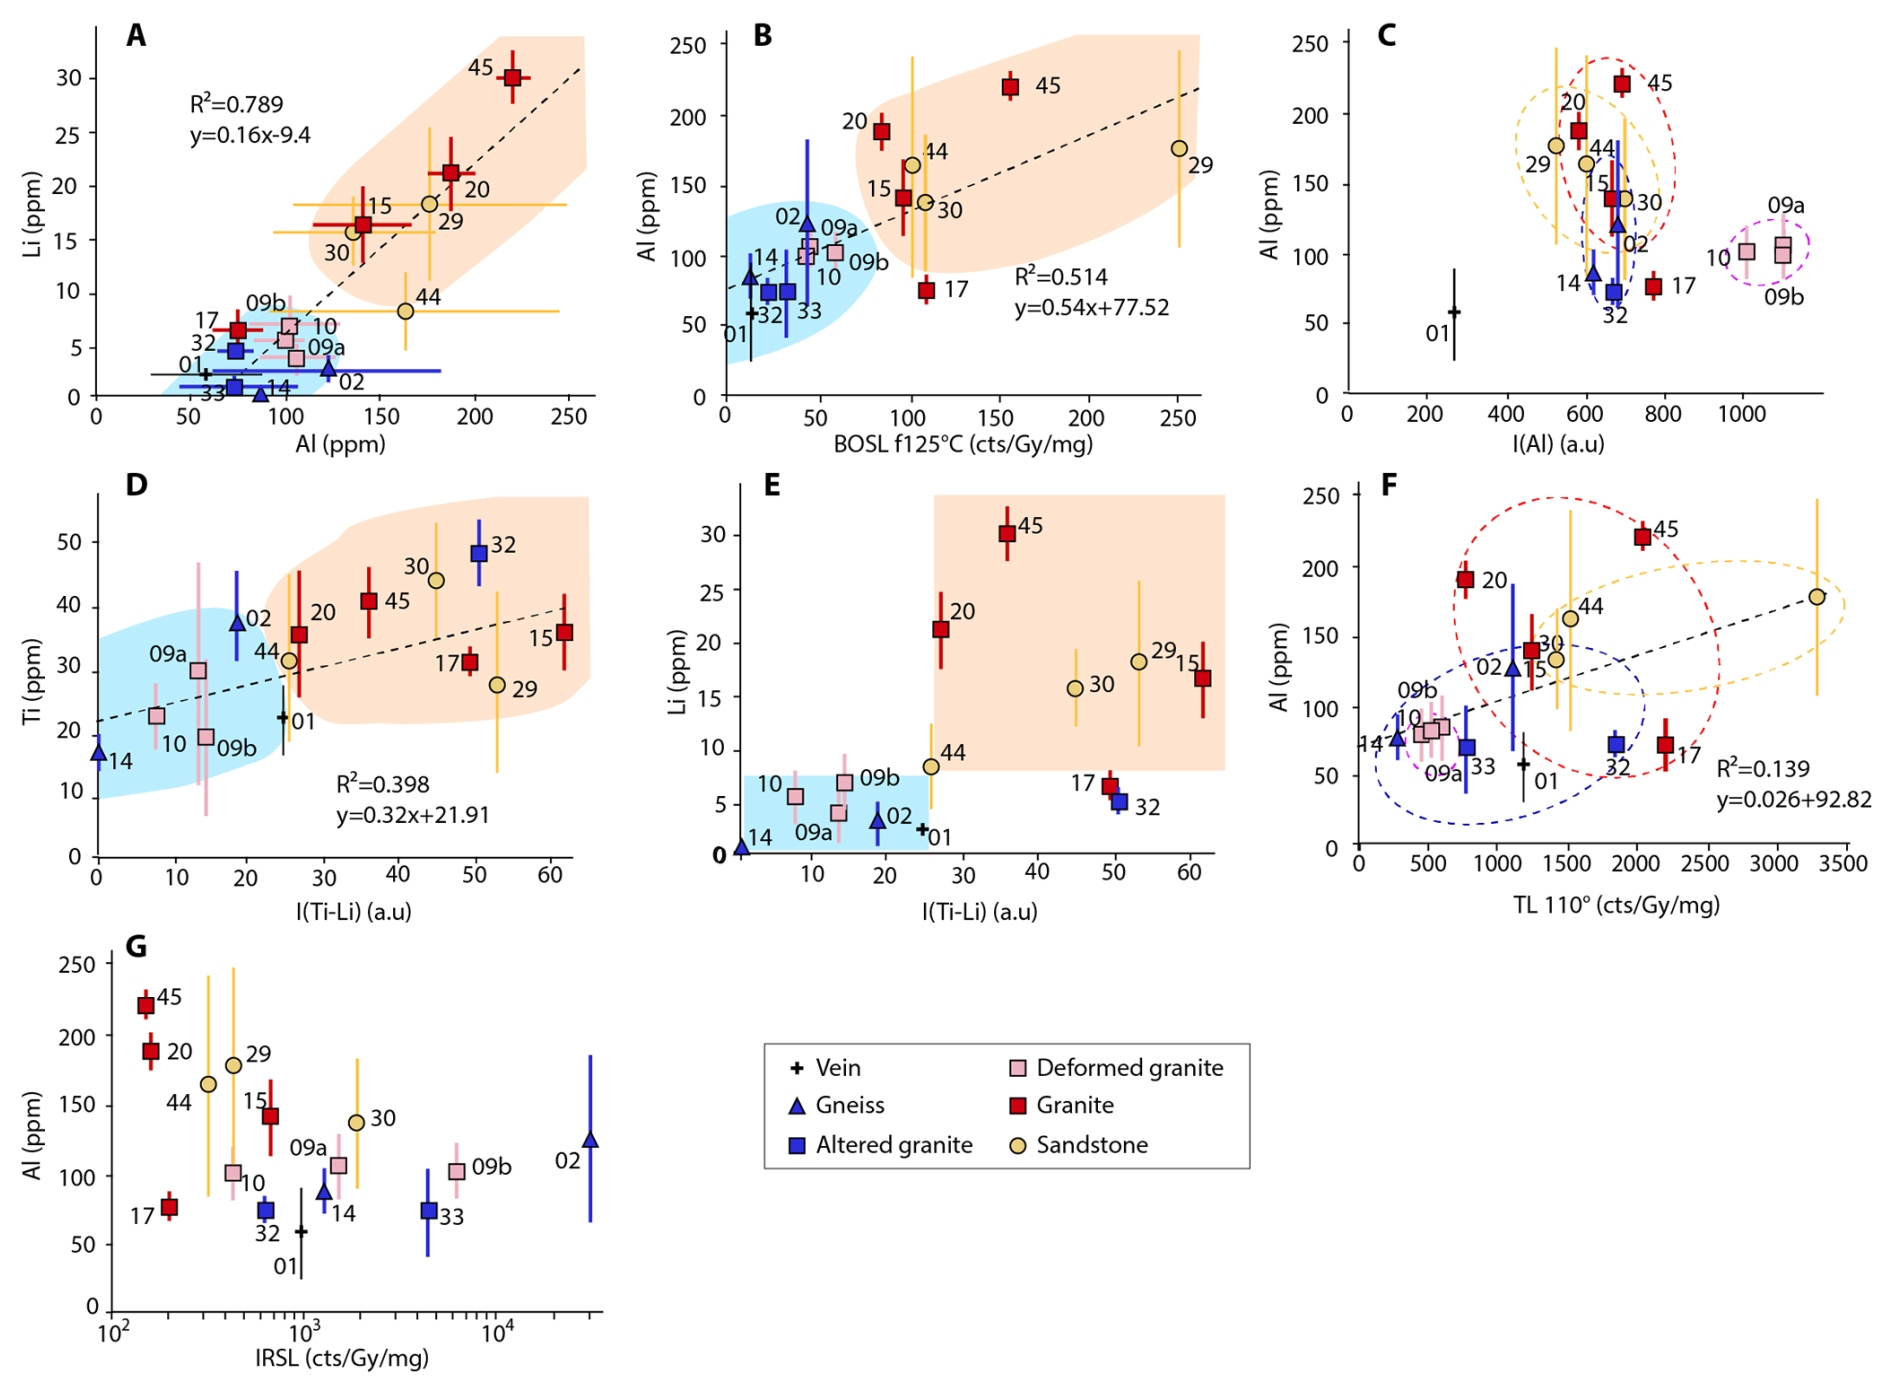
Figure 4Graphical representations of data obtained by ESR, OSL and La-ICPMS on quartz grains extracted from magmatic, metamorphic and sedimentary rocks in the Strengbach basin. (a) Li (ppm) vs. Al (ppm); (b) Al (ppm) vs. BOSL125 °C; (c) Al (ppm) vs. ESR Al; (d) Ti (ppm) vs. ESR Ti-Li; (e) Li (ppm) vs. ESR Ti-Li; (f) Al (ppm) vs. TL110 °C; (g) Al (ppm) vs. IRSL.
6.2.2 ESR
First, no correlation is observed when we compare ESR-Al intensities with Al contents (Fig. 4c), contrary to what was reported by Usami (2010 in Shimada et al., 2016). However, Götze et al. (2004) obtained similar results as those presented here; the absence of such correlation was assumed to be caused by the fact that not all substitutional Al atoms are present in the form of paramagnetic centres. This phenomenon occurs when the radiation dose is too low to transform trace element defects from the non-paramagnetic precursor state into paramagnetic centres (Götze et al., 2004). Second, if no statistical correlation between ESR-Ti-Li intensities and Li trace contents is observed at first glance, the latter are systematically lower in the gneisses/deformed granites (Bilstein) group than in the granites/sandstones group (Fig. 4e). Note also that the gneiss sample #14 void of Li content (Fig. 3) shows neither Ti-Li intensity nor Ti-H intensity accordingly (Fig. 2d). This potential relation between Li content and Ti-Li ESR intensity was already mentioned by Rink et al. (1993), who reported high electron paramagnetic resonance (EPR) in quartz extracted from Li-rich pegmatite. In the same way, Liu et al. (2022) concluded that ESR sensitivity increase is rather linked to a greater mobility of Li+ and H+ ions than Al with temperature. This high mobility of Li+ and H+ probably leads to Li loss from the quartz lattice in gneisses and deformed Bilstein granites. Although this leakage of Li during modification of the quartz lattice by temperature and/or pressure remains hypothetical at this stage, we argue that this potential significant finding should be further investigated in future studies.
Third, Ti trace content alone does not discriminate source bedrocks (Fig. 3). However, the significant correlation (R2=0.398) between ESR-Ti-Li intensity and Ti contents (Fig. 4d) allows distinguishing, anew, the two usual groups of source bedrock. The increasing amount of Ti content may cause a general increase of the Ti-Li ESR signal, and an increase of substitution of Si by Ti. The non-zero intercept of our data on the Ti axis (Fig. 4d) may also suggest the occurrence of inherited non-structurally incorporated Ti (Götze et al., 2004). It may also be related to a lack of Li compensator (see for instance #14 in Fig. 4e) and this should be further investigated.
6.3 Relation between ESR/OSL sensitivity and conditions of crystallization and deformation
Because we assume that Al and Ti ESR centres from all treated samples have reached their own saturation level as crystallisation/diagenesis of all quartz-bearing bedrocks took place > 200 millions of years ago, we can compare measured ESR intensities with OSL sensitivities. One generally acknowledges that the large variability reported in bedrock OSL sensitivities is mainly linked to temperature and pressure conditions during metamorphism or magmatic crystallization (e.g. Sawakuchi et al., 2011b): quartz with low OSL sensitivity signals were detected in deformed plutonic or metamorphic bedrocks that have experienced high temperature and pressure conditions (Lukas et al., 2007; Jeong and Choi, 2012; Zular et al., 2015; Guralnik et al., 2015). Variability in ESR sensitivities for different bedrock types was likewise pointed out in different settings: Duttine et al. (2003) (Al, Ti-Li, Ti-H intensities); Kotova et al. (2008) (Al intensities); Shimada et al. (2013) (Al and Ti-Li intensities).
In this respect, two outcomes of this study well match previous observations. First, our observations in general agree with Kotova et al. (2008)'s suggestion: lower number ESR-Al and ESR-Ge defects (i.e. Ge and Ti defects being similarly ion compensated defects) are caused either by quartz vein crystallization from highly oversaturated silicium solutions or from solutions with low contents of Al or Ge, possibly reflecting the initial fluid composition. Second, similarly to Duttine et al. (2003), our quartz vein sample (#1) displays both (i) low ESR and OSL sensitivities and (ii) low Al and Li trace contents (Figs. 3, 4a, b, c).
6.3.1 Effect of temperature
According to Preusser et al. (2009), higher crystallization temperature may increase the concentration of Si- and O-vacancies and also favour the substitution of Si4+ by Al3+ and Ti4+ ions, which produce the defects underpinning luminescence in quartz (Dennen et al., 1970; Götze et al., 2001; Wark and Watson, 2006). Ti4+ can substitute to Si4+ but only at high temperature, resulting in exsolution during cooling (Götze et al., 2004), while [TiO4 Li+]0 and [TiO4 H+]0 populations are significantly increased by heating (Poolton et al., 2000). Also, sensitivity change to irradiation is contrasted between Al Ti-Li centres (i.e. steady increase with heating) and Ti-H (i.e. increase up to ∼ 500 °C and decrease > 500 °C; Liu et al. (2022). However, Schilles et al. (2001) observed an increase in both Ti-H and Ti-Li intensities up to 700 °C before the former reduce and the latter stabilise at higher temperatures.
Importantly, these observations are somehow inconsistent with each other (e.g. contrasting behaviour, different threshold temperatures …). In our study, the crystallization or metamorphic temperature of all sampled plutonic or metamorphic bedrocks ranges between 350 and 660 °C (Table 1). This falls into the aforementioned temperature ranges for which changes in intrinsic OSL and ESR sensitivity characteristics were reported in laboratory, which would mimic bedrock metamorphism. In particular, all sampled gneisses underwent the highest temperatures (600–660 °C; Table 1) during their metamorphic event(s). If one would have expected the highest increase in Ti-Li and Ti-H ESR sensitivities for these metamorphic rocks, we observe the contrary as granitic bedrocks (i.e. samples #15, 17, 20, 45; the “undeformed” granites) have higher ESR sensitivities than the gneissic samples (Fig. 2e). Temperature alone does not determine the defect composition of a crystal; the cooling rate governs also the extent of defect trapping. Rapid quenching promotes the incorporation of impurities, whereas slow cooling results in a purer crystal structure. Moreover other external parameters than temperature could play a role, for instance pressure (see sections below). On the other hand, Al intensities do not display the same pattern (Fig. 2f, g), suggesting that they behave differently, and this observation agrees with those of Fukushi (1989), Poolton (2000), Schilles et al. (2001), who demonstrated that heating does not alter the sensitivity of the Al centre in quartz.
Finally, we observed low OSL sensitivities not only for the gneisses but also in granitic bedrock which undergone deformation (Bilstein Fault zone for samples #9A, 9B, 10). This agrees with previous observations (Sawakuchi et al., 2011b, 2020; Gulnarik et al., 2015), suggesting that heating does not favour OSL sensitisation and may therefore reset the sensitivity.
As the initial (i.e. pre-heating/pre-deformation) OSL and ESR characteristics of the metamorphic and deformed bedrocks in the Strengbach catchment are unknown, whether the measured sensitivities have been modified – or not – over time remains an open question. However, both metamorphic rocks are paragneisses (Table 1) and are thereby meta-sediments formed from recycled quartz grains (i.e. somehow similar to the sandstone bedrocks). One can thus expect that these bedrocks (sedimentary parental material of the paragneisses) exhibited higher the sensitivity (sediment sensitivity e.g. Pietsch et al., 2008) than current paragneisses, and this would confirm our hypothesis that temperature and/or pressure lead to a decrease of OSL and ESR Ti sensitivity.
Finally, note that samples #15, 17, 20, 45 (i.e. undeformed granites) present the highest ESR and OSL signal sensitivities as well as the highest Al, Ti and Li trace contents, and were not affected by metamorphism nor by tectonic deformation.
These observations seem to indicate that trace element composition may influence the ESR and TL-OSL sensitivities of quartz, but also that geological processes (recrystallization, metamorphism, anatexis …) affect ESR Ti-Li and Ti-H centre intensities as well as BOSLf125 °C signals.
6.3.2 Possible effect of pressure?
Pressure is the other parameter that could explain luminescence variations and sensitivities in the investigated bedrocks. In this respect, all samples that underwent high pressure during metamorphism (4–7 kbar; Table 1) along with those located in the tectonic shear zone (Fig. 1) show both lowest OSL and ESR intensities. This suggests that pressure could be one of the prevailing factors driving changes in OSL/ESR sensitivities. Odlum et al. (2022) and Hu et al. (2024) already reported decrease of OSL sensitivities and signal resetting within a fault zone: fault slip and fluids present during deformation would reduce the grain size and impact the crystallinity of the quartz minerals, affecting the nature and concentration of luminescence traps. As for ESR sensitivity, if pressure does not seem to be a prevailing factor concerning the ESR-Al centre (Fukushi, 1989), no information is found concerning its role on the sensitivity of the Ti-Li and Ti-H centres in the litterature.
6.3.3 Combined effects
We notice that heat and pressure, contrary to their effect on Ti-Li and Ti-H centres, do not substantially modify the paramagnetic capacity of the Al centres in quartz. This observation probably also applies to quartz veins: whereas ESR-Al intensities in hyaline quartz from vein do not differ from those of the bedrock, ESR-Ti centres do (Duttine et al., 2003). In conclusion, ESR-Al intensities are less discriminant than ESR-Ti intensities between different quartz rocks and sources, unless the photosensitivity of the ESR-Al centre is also considered (Fig. 2c). In this case, this could suggest that the ESR-Al intensities are more related to the initial conditions of mineral formation in relation to the fluid composition (see Sect. 5.3). Additionally, the significance of hydrogen content (see Sharma et al., 2017; Stalder et al., 2025) is undetectable by ICP and currently being determined by other means, warrants further investigation.
6.4 Quartz sensitization in recycled and mature sediments
Pietsch et al. (2008) showed that mature and recycled quartz presents higher OSL sensitivity values than parent bedrocks, which suggests that surficial transport processes produce sensitisation in quartz grains. However, this is still largely debated with contradictory observations on the sensitization of luminescence signals with transport distances (Sawakuchi et al., 2018; Capaldi et al., 2022; Magyar et al., 2024; Parida et al., 2025). In this respect, we can assume that the sandy sediments that later formed the Triassic sandstones in the Strengbach catchment are sensitive due do previous sedimentary cycles. Indeed, the sediments that make up the sandstones were deposited in a fluvial context (Bofill et al., 2024). The source of these sandstones is unknown, but the shapes of the grains and sorting of grains sizes indicate a long transport distance and therefore quartz grains underwent one or more cycles of exposure to light and natural irradiation when they were buried. Whilst the highest OSL sensitivity found in the sandstone sample #29 seems matching this assumption (Fig. 2a), the two other sandstone samples (#30 and 44) present similar OSL sensitivities than those of the granites. Reason may be either the quartz grains that make up the sandstones (#30 and #44) initially had very low sensitivity (comparable, for example, to that of gneisses), or these quartz grains underwent few regeneration cycles during transportation before diagenesis (unlikely), or the sandstones underwent (post-)diagenetic phenomena that caused a loss of sensitivity in the quartz. We have no evidence to support this last hypothesis. The sensitisation of ESR centres with optical bleaching-irradiation cycles is currently unknown. Our data show that none of the sandstone samples have higher ESR-Al sensitivities than granite and gneiss samples (Fig. 2g). The Ti-Li and Ti-H centres show ESR sensitivities for sandstones that are in the higher value of our dataset, but that remain within the range of undeformed granites. In fact, the latter are mostly indistinguishable from sandstones except for their bleaching rate (Fig. 2c).
This study provides valuable insights into the TL-OSL and ESR sensitivities of quartz extracted from diverse geological settings. Our findings demonstrate that these sensitivities are strongly influenced by the intrinsic properties of the source bedrock, including its lithology, crystallization conditions, and deformation history.
A significant relationship between source rock characteristics and (palaeo)dosimetric intensities for both TL-OSL and ESR was identified, particularly for Ti centres in ESR. Quartz from deformed plutonic and from metamorphic bedrocks consistently shows low TL-OSL sensitivity and ESR Ti-centers intenties, while intermediate sensitivity and intensities values are observed in quartz from plutonic rocks and sandstones.
Ti and Li trace element composition appears to influence the ESR and TL-OSL sensitivities of quartz. indeed, ESR-Ti-Li intensities and Li trace contents are systematically lower in the gneisses/deformed granites (Bilstein) group than in the granites/sandstones group and especially the absence of Li content in gneiss sample #14 leads to the absence of Ti-Li nor Ti-H ESR signal. if the increasing amount of Ti content may cause a general increase of the Ti-Li ESR signal, and an increase of substitution of Si by Ti, we concluded that not all Ti atoms of the quartz grains are not involved in paramagnetic centres. ESR Al-center is not related to Al trace element composition
Furthermore, geological processes such as recrystallization, metamorphism, and anatexis significantly affect ESR Ti-Li and Ti-H centre intensities as well as BOSLf125 °C signals, especially, the pressure could be one of the prevailing factors driving changes in TL-OSL/ESR sensitivities. Conversely, ESR-Al centre intensities appear to be governed by the initial fluid composition and crystallization environment. Enhanced TL-OSL sensitivity in mature and recycled sediments (sandstones) confirms the influence of sedimentary transport and reworking on TL-OSL sensitivity but have to be investigated for ESR.
These insights have significant implications for geochronology and sediment provenance analysis, where precise interpretations of luminescence and ESR signals are essential. More specifically, caution is advised when dating non-mature sediment, i.e. sampled close to sources of metamorphic bedrocks, due to the potential absence or weakness of ESR Ti-Li and Ti-H signals, which can pose challenges for reliable ESR analysis.
Finally, future studies should investigate whether these patterns are consistent across different geological catchments and explore their manifestation in sediments derived from these source rocks. Future research should explore whether these findings are consistent across different catchments and if these signatures are present in sediments draining these source rocks.
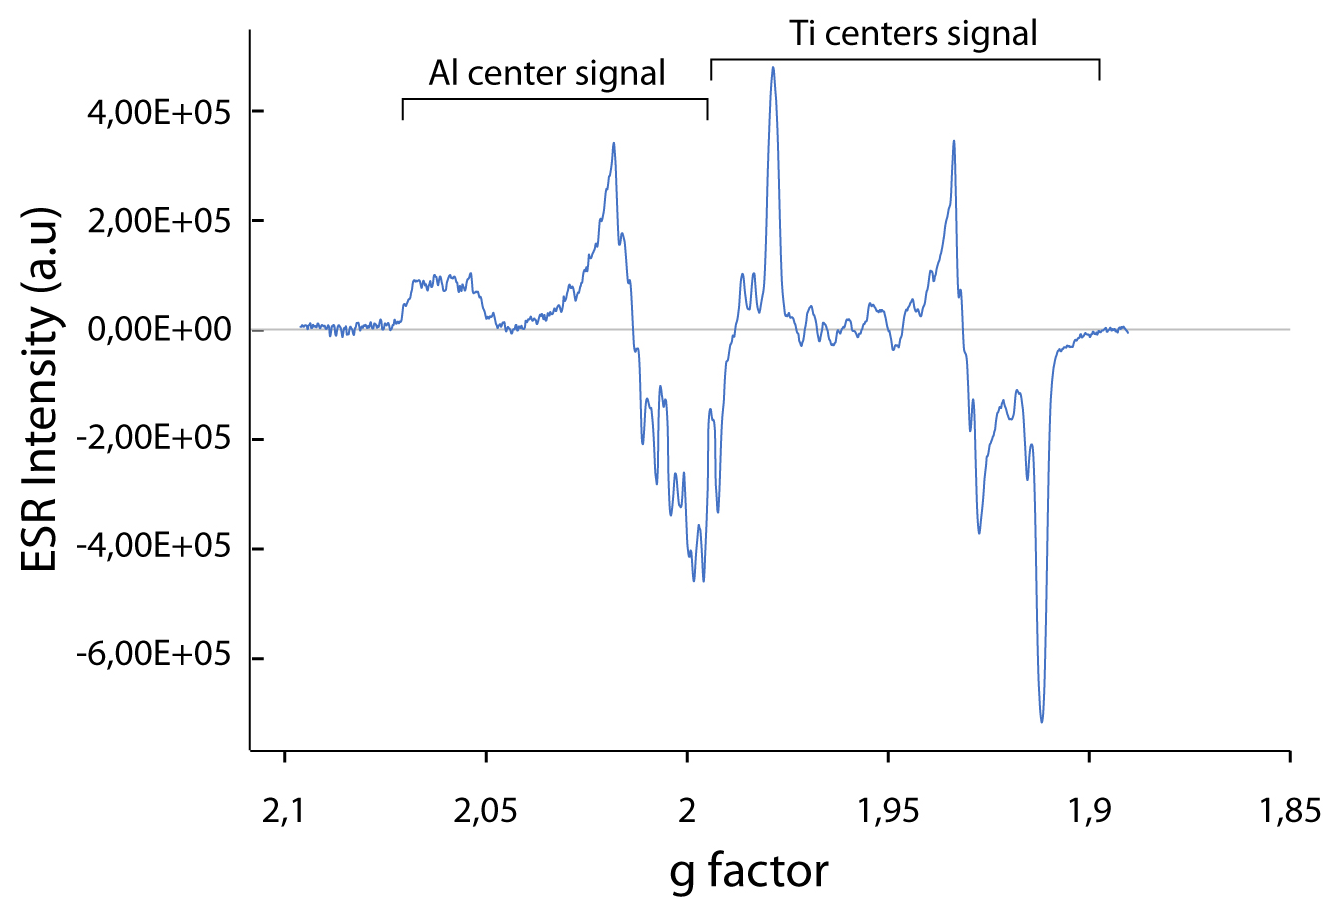
Figure A1Indonesian natural Quartz ESR spectra with similar Ti centers intensities (a.u.) higher than Al centers intensities (HNHP data, 2019).
Table D1Li, Ti and Al mean content (ppm) with maximal limit of detection (LOD) obtained by LA-ICP-MS for the rocks of the Strengbach catchment (France). Values in italics are below the detection limit.
All data generated during this study are presented in the main paper and appendix. The complete analyzed dataset will be made publicly available upon the conclusion of the ANR project at https://data.geoscience.fr/entrepot/public/home (last access: 22 December 2025).
HT, MR, PVo and CA designed the experiments. All the authors performed field work and sampling. MB made the samples physical and chemical preparation. Geological setting was established by GR and CA PVo carried out ESR measurements. MR carried out OSL measurements CA carried out LA-ICPMS measurements. PVo and HT analysed the ESR data. MR, PVa and GR analysed the OSL data. CA and PL analysed the LA-ICPMS data. HT and PVo prepared the manuscript with contributions from all co-authors.
The contact author has declared that none of the authors has any competing interests.
Publisher’s note: Copernicus Publications remains neutral with regard to jurisdictional claims made in the text, published maps, institutional affiliations, or any other geographical representation in this paper. While Copernicus Publications makes every effort to include appropriate place names, the final responsibility lies with the authors. Views expressed in the text are those of the authors and do not necessarily reflect the views of the publisher.
The authors acknowledge the ANR – FRANCE (French National Research Agency) for its financial support of the QUARTZ project No. ANR-21-CE01-0014. The ESR spectrometer of the Muséum nationale d'Histoire naturelle, France was bought with the financial support of the `DIM MAP Île-de-France' program. The authors would like to thank Catherine Lerouge (BRGM) for her scientific expertise in trace element analysis and for the fruitful discussions.
This research has been supported by the Agence Nationale de la Recherche (grant no. ANR-21-CE01-0014).
This paper was edited by Julie Durcan and reviewed by André Sawakuchi and one anonymous referee.
Ackerer, J., Chabaux, F., Van der Woerd, J., Viville, D., Pelt, E., Kali, E., Lerouge, C., Ackerer, P., di Chiara Roupert, R., and Négrel, P.: Regolith evolution on the millennial timescale from combined U-Th-Ra isotopes and in situ cosmogenic 10Be analysis in a weathering profile (Strengbach catchment, France), Earth Planet. Sci. Lett., 453, 33–43, https://doi.org/10.1016/j.epsl.2016.08.005, 2016.
Alexanderson, H.: Luminescence characteristics of Scandinavian quartz, their connection to bedrock provenance and influence on dating results, Quaternary Geochronology, 69, 101272, https://doi.org/10.1016/j.quageo.2022.101272, 2022.
Allen, P. A.: Sediment Routing Systems: The Fate of Sediment from Source to Sink, Cambridge Core, https://doi.org/10.1017/9781316135754, 2017.
Alonso, P. J., Halliburton, L. E., Kohnke, E. E., and Bossoli, R. B.: X-ray induced luminescence in crystalline SiO2, J. Appl. Phys., 54, 5369–5375, 1983.
Bailey, R. M.: Towards a general kinetic model for optically and thermally stimulated luminescence of quartz, Radiation Measurements, 33, 17–45, https://doi.org/10.1016/S1350-4487(00)00100-1, 2001.
Beerten, K. and Stesmans, A.: Some properties of Ti-related paramagnetic centres relevant for electron spin resonance dating of single sedimentary quartz grains, Applied Radiation and Isotopes, 64, 594–602, https://doi.org/10.1016/j.apradiso.2005.12.001, 2006a.
Beerten, K. and Stesmans, A.: The use of Ti centers for estimating burial doses of single quartz grains: A case study from an aeolian deposit Ma old, Radiation Measurements, 41, 418–424, https://doi.org/10.1016/j.radmeas.2005.10.004, 2006b.
Blanalt, J.-G., von Eller, J.-P., Fluck, P., Geffroy, J., Hirlemann, G., Jehl, M., Bonnet, C., Schreiner, J., Sittler, C., Schwoerer, P., Tricart, J., Hirth, C., and Weil, R.: Notice explicative, Carte géol. France, feuille COLMAR-ARTOLSHEIM (342), Orléans: Bureau de recherches géologiques et minières, 55 pp., 1972.
Bofill, L., Bozetti, G., Schäfer, G., Ghienne, J.-F., Schuster, M., Scherer, C., and De Souza, E.: Quantitative facies analysis of a fluvio-aeolian system: Lower Triassic Buntsandstein Group, eastern France, Sedimentary Geology, 465, 106634, https://doi.org/10.1016/j.sedgeo.2024.106634, 2024.
Bonhomme, M.: Ages radiométriques de quelques granites de Vosges moyennes, Bull. Serv. Carte géol. Als. Lorr., 20, 101–106, 1967.
Bøtter-Jensen, L., Agersnap Larsen, N., Mejdahl, V., Poolton, N. R. J., Morris, M. F., and McKeever, S. W. S.: Luminescence sensitivity changes in quartz as a result of annealing, Radiation Measurements, 24, 535–541, 1995.
Boutin, R., Montigny, R., and Thuizat, R.: Chronologie K-Ar et 39Ar-40Ar du métamorphisme et du magmatisme des Vosges, Géologie de la France, 1, 3–25, 1995.
Capaldi, T. N., Rittenour, T. M., and Nelson, M. S.: Downstream changes in quartz OSL sensitivity in modern river sand reflects sediment source variability: Case studies from Rocky Mountain and Andean rivers, Quaternary Geochronology, 71, 101317, https://doi.org/10.1016/j.quageo.2022.101317, 2022.
Chithambo, M. L., Preusser, F., Ramseyer, K., and Ogundare, F. O.: Time-resolved luminescence of low sensitivity quartz from crystalline rocks, Radiat. Meas., 42, 205–212, https://doi.org/10.1016/j.radmeas.2006.07.005, 2007.
Constantin, D., Dave, A. K., Grecu, Ş., Kabacińska, Z., Antuzevics, A., Barla, A., Urdea, P., Ducea, M. N., and Timar-Gabor, A.: Tracing quartz provenance: A multi-method investigation of luminescence sensitisation mechanisms of quartz from granite source rocks and derived sediments, Chemical Geology, 683, https://doi.org/10.1016/j.chemgeo.2025.122774, 2025.
David, M. and Sunta, C. M.: Thermoluminescence of quartz – part VIII: estimation of firing temperature in ancient pottery samples, Indian Journal of Pure and Applied Physics, 19, 1054–1056, 1981.
Delmas, M., Calvet, M., Gunnell, Y., Voinchet, P., Manel, C., Braucher, R., Tissoux, H., Bahain, J.-J., Perrenoud, C., and Saos, T.: Terrestrial 10Be and electron spin resonance dating of fluvial terraces quantifies quaternary tectonic uplift gradients in the eastern Pyrenees, Quaternary Science Reviews, 193, 188–211, https://doi.org/10.1016/j.quascirev.2018.06.001, 2018.
del Río, I., Sawakuchi, A. O., Góes, A. M., Hollanda, M. H., Furukawa, N. Y., Porat, N., and Negri, F. A.: Luminescence signals of quartz and feldspar as new methods for stratigraphic discrimination and provenance analysis of siliciclastic successions: the case of the Parnaíba Basin (Brazil) of West Gondwana, Basin Res., 1–22, https://doi.org/10.1111/bre.12590, 2021.
Dennen, W. H., Blackburn, W. H., and Quesada, A.: Aluminum in quartz as a geothermometer, Contributions to Mineralogy and Petrology, 27, 332–342, 1970.
Duttine, M., Villeneuve, G., Bechtel, F., and Demazeau, G.: Caractérisation par résonance paramagnétique électronique (RPE) de quartz naturels issus de différentes sources, Comptes Rendus Geoscience, 334, 949–955, https://doi.org/10.1016/S1631-0713(02)01845-X, 2002.
Duval, M.: Dose response curve of the ESR signal of the Aluminum center in quartz grains extracted from sediment, Ancient TL, 30, 41, 2012.
Fitzsimmons, K. E.: An assessment of the luminescence sensitivity of Australian quartz with respect to sediment history, Geochronometria, 38, 199–208, 2011.
Fitzsimmons, K. E., Perić, Z., Nowatzki, M., Lindauer, S., Vinnepand, M., Prud'homme, C., Dave, A. K., Vött, A., and Fischer, P.: Luminescence Sensitivity of Rhine Valley Loess: Indicators of Source Variability?, Quaternary, 5, 1, https://doi.org/10.3390/quat5010001, 2022.
Fluck, P.: Métamorphisme et magmatisme dans les Vosges moyennes d'Alsace, Contribution à l'histoire de la chaîne varisque, Institut de Géologie, Université Louis-Pasteur, Strasbourg, 282 pp., 1980.
Fluck, P., Piqué, A., Schneider, J.-L., and Whitechurch, H.: Le socle vosgien/The vosgian basement, sgeol, 44, 207–235, https://doi.org/10.3406/sgeol.1991.1867, 1991.
Fukuchi, T.: Increase of radiation sensitivity of ESR centres by faulting and criteria of fault dates, Earth Planet. Sci. Lett., 94, 109–122, 1989.
Gall, J. C.: Fluvial depositional environment evolving into deltaic setting with marine influences in the Buntsandstein of Northern Vosges (France), Lecture Notes in Earth Sciences, 4, 449–477, https://doi.org/10.1007/BFb0010532, 2006.
Gliganic, L. A., Cohen, T. J., Meyer, M., and Molenaar, A.: Variations in luminescence properties of quartz and feldspar from modern fluvial sediments in three rivers, Quaternary Geochronology, 41, 70–82, https://doi.org/10.1016/j.quageo.2017.06.005, 2017.
Godfrey-Smith, D. I. and Cada, M.: IR Stimulation Spectroscopy of Plagioclase and Potassium Feldspars, and Quartz, Radiation Protection Dosimetry, 66, 379–385, https://doi.org/10.1093/oxfordjournals.rpd.a031759, 1996.
Götze, J., Plötze, M., Tichomirowa, M., Fuchs, H., and Pilot, J.: Aluminum in quartz, as an indicator of the temperature of formation of agate, Mineralogical Magazine, 65, 407–413, https://doi.org/10.1180/002646101300119484, 2001.
Götze, J., Plötze, M., Graupner, T., Hallbauer, D. K., and Bray, C. J.: Trace element incorporation into quartz: A combined study by ICP-MS, electron spin resonance, cathodoluminescence, capillary ion analysis, and gas chromatography, Geochim. Cosmochim. Acta, 68, 3741–3759, https://doi.org/10.1016/j.gca.2004.01.003, 2004.
Goswami, K., Panda, S. K., Alappat, L., and Chauhan, N.: Luminescence for sedimentary provenance quantification in river basins: A methodological advancement, Quaternary Geochronology, 79, 101488, https://doi.org/10.1016/j.quageo.2023.101488, 2024.
Gray, H. J., Tucker, G. E., Mahan, S. A., McGuire, C., and Rhodes, E. J.: On extracting sediment transport information from measurements of luminescence in river sediment, Journal of Geophysical Research: Earth Surface, 122, 654–677, 2017.
Gray, H. J., Jain, M., Sawakuchi, A. O., Mahan, S. A., and Tucker, G. E.: Luminescence as a sediment tracer and provenance tool, Reviews of Geophysics, 57, https://doi.org/10.1029/2019RG000646, 2019.
Guralnik, B., Jain, M., Herman, F., Ankjærgaard, C., Murray, A. S., Valla, P. G., Preusser, F., King, G. E., Chen, R., Lowick, S. E., Kook, M., and Rhodes, E. J.: OSL-thermochronometry of feldspar from the KTB borehole, Germany, Earth and Planetary Science Letters, 423, 232–243, https://doi.org/10.1016/j.epsl.2015.04.032, 2015.
Hu, G., Zeng-Liu, J., Shao, Y., Qin, K., and Gao, Y.: The applications of optically stimulated luminescence dating in active fault and paleo-earthquake studies: A review, Quaternary International, 688, 53–62, https://doi.org/10.1016/j.quaint.2024.01.016, 2024.
Ikeya, M.: New Applications of Electron Spin Resonance, Dating, Dosimetry, and Microscopy, World Scientific, Singapore, 520 pp., https://doi.org/10.1142/1854, 1993.
Ingicco, T., Van Den Bergh, G. D., Jago-on, C., Bahain, J.-J., Chacón, M. G., Amano, N., Forestier, H., King, C., Magyar, G., Bartyik, T., Marković, R. S., Filyó, D., Kiss, T., Marković, S. B., Homolya, V., Balla, Z., Bozsó, G., Baranya, S., Alexanderson, H., Lukić, T., and Sipos, G.: Downstream change of luminescence sensitivity in sedimentary quartz and the rearrangement of optically stimulated luminescence (OSL) components along two large rivers, Quaternary Geochronology, 85, 101629, https://doi.org/10.1016/j.quageo.2024.101629, 2024.
Jain, M., Murray, A. S., and Bøtter-Jensen, L.: Characterisation of blue-light stimulated luminescence components in different quartz samples: implications for dose measurement, Radiat. Meas., 37, 441–449, https://doi.org/10.1016/S1350-4487(03)00052-0, 2003.
Jani, M. G., Bossoli, R. B., and Halliburton, L. E.: Further characterization of the E'1 center in crystalline SiO2, Phys. Rev. B, 27, 2285–2293, https://doi.org/10.1103/PhysRevB.27.2285, 1983.
Jeong, G. Y. and Choi, J.-H.: Variations in quartz OSL components with lithology, weathering and transportation, Quaternary Geochronology, 10, 320–326, https://doi.org/10.1016/j.quageo.2012.02.023, 2012.
Kotova, E. N., Lyutoev, V. P., and Kuznetsov, S. K.: Paramagnetic centers in quartz of basic industry deposits, Acta Crystallographica Section A: Foundations and Advances, A63, s249, https://doi.org/10.1107/S0108767307094378, 2007.
Kotova, E. N., Lyutoev, V. P., and Kuznetsov, S. K.: Aluminum and germanium paramagnetic centers in vein quartz and rock crystals from the Subpolar Urals, Geol. Ore Deposits, 50, 634–641, https://doi.org/10.1134/S1075701508070155, 2008.
Koul, D. K.: Role of alkali ions in limiting the capacity of the 110 °C peak of quartz to remember the firing temperature, Applied Radiation and Isotopes, 64, 110–115, https://doi.org/10.1016/j.apradiso.2005.07.008, 2006.
Koul, D. K. and Chougaonkar, M. P.: The pre-dose phenomenon in the OSL signal of quartz, Radiation Measurements, 42, 1265–1272, https://doi.org/10.1016/j.radmeas.2007.04.001, 2007.
Kratinova, Z., Schulmann, K., Edel, J. B., and Ježek, J.: Model of successive granite sheet emplacement in transtensional setting: integrated microstructural and anisotropy of magnetic susceptibility study, Tectonics, 26, 1–7, https://doi.org/10.1029/2006TC002035, 2007.
Latouche, L., Fabriès, J., and Guiraud, M.: Retrograde evolution in the Central Vosges mountains (northeastern France): implications for the metamorphic history of high-grade rocks during the Variscan orogeny, Tectonophysics, 205, 387–407, https://doi.org/10.1016/0040-1951(92)90444-B, 1992.
Li, S. H.: Luminescence sensitivity changes of quartz by bleaching, annealing and UV exposure, Radiation Effects and Defects in Solids, 157, 357–364, https://doi.org/10.1080/10420150212998, 2002.
Liu, C.-R., Ji, H., Li, W.-P., Wei, C.-Y., and Yin, G.-M.: The relationship between irradiation sensitivity of quartz Al and Ti centers and baking temperature by volcanic lava flow: Example of Datong volcanic group, China, Radiation Measurements, 157, 106823, https://doi.org/10.1016/j.radmeas.2022.106823, 2022.
Lukas, S., Spencer, J. Q. G., Robinson, R. A. J., and Benn, D. I.: Problems associated with luminescence dating of Late Quaternary glacial sediments in the NW Scottish Highlands, Quaternary Geochronology, 2, 243–248, https://doi.org/10.1016/j.quageo.2006.04.007, 2007.
Lutoev, V. P.: Application of the ESR method in geological correlation problems, Applied Magnetic Resonance, 28, 311–330, https://doi.org/10.1007/BF03166764, 2005.
Magyar, G., Bartyik, T., Marković, R. S., Filyó, D., Kiss, T., Marković, S., Homolya, V., Balla, A., Bozsó, G., Baranya, S., Alexanderson, H., Lukić, T., and Sipos, G.: Downstream change of luminescence sensitivity in sedimentary quartz and the rearrangement of optically stimulated luminescence (OSL) components along two large rivers, Quaternary Geochronology, 85, 101629, https://doi.org/10.1016/j.quageo.2024.101629, 2024.
McKeever, S. W. S., Bøtter-Jensen, L., Agersnap Larsen, N., Mejdahl, V., and Poolton, N. R. J.: Optically stimulated luminescence sensitivity changes in quartz due to repeated use in single aliquot readout: experiments and computer simulations, Radiation Protection Dosimetry, 65, 49–54, https://doi.org/10.1093/oxfordjournals.rpd.a031680, 1996.
Mineli, T. D., Sawakuchi, A. O., Guralnik, B., Lambert, R., Jain, M., Pupim, F. N., Rio, I. del, Guedes, C. C. F., and Nogueira, L.: Variation of luminescence sensitivity, characteristic dose and trap parameters of quartz from rocks and sediments, Radiation Measurements, 144, 106583, https://doi.org/10.1016/j.radmeas.2021.106583, 2021.
Moska, P. and Murray, A. S.: Stability of the quartz fast-component in insensitive samples, Radiation Measurements, 41, 878–885, https://doi.org/10.1016/j.radmeas.2006.06.005, 2006.
Murray, A. S. and Roberts, R. G.: Measurement of the equivalent dose in quartz using a regenerative-dose single-aliquot protocol, Radiation Measurements, 29, 503–515, https://doi.org/10.1016/S1350-4487(98)00044-4, 1998.
Murray, A. S. and Wintle, A. G.: Luminescence dating of quartz using an improved single-aliquot regenerative-dose protocol, Radiation Measurements, 32, 57–73, https://doi.org/10.1016/S1350-4487(99)00253-X, 2000.
Nelson, M. S., Eppes, M. C., and Rittenour, T. M.: Quartz luminescence sensitivity from sediment versus bedrock in highly weathered soils of the Piedmont of North Carolina, south-eastern USA, Quaternary Geochronology, 101343, https://doi.org/10.1016/j.quageo.2022.101343, 2022.
Niyonzima, P., Sawakuchi, A. O., Jain, M., Kumar, R., Mineli, T. D., del Río, I., and Pupim, F. N.: Radiofluorescence of quartz from rocks and sediments and its correlation with thermoluminescence and optically stimulated luminescence sensitivities, Ancient TL, 38, 11–20, https://doi.org/10.1016/j.epsl.2018.04.006, 2020.
Odlum, M. L., Rittenour, T., Ault, A. K., Nelson, M., and Ramos, E. J.: Investigation of quartz luminescence properties in bedrock faults: Fault slip processes reduce trap depths, lifetimes, and sensitivity, Radiation Measurements, 155, 106784, https://doi.org/10.1016/j.radmeas.2022.106784, 2022.
Ono, Y., Naruse, T., Ikeya, M., Kohno, H., and Toyoda, S.: Origin and derived courses of eolian dust quartz deposited during marine isotope stage 2 in East Asia, suggested by ESR signal intensity, Global and Planetary Change, 18, 129–135, https://doi.org/10.1016/S0921-8181(98)00012-5, 1998.
Parida, S., Kaushal, R. K., Chauhan, N., and Singhvi, A. K.: Changes in thermoluminescence sensitivity of 110 °C glow peak of quartz grains from sediments of River Ganga: Observation and implications, Earth and Planetary Science Letters, 656, 119267, https://doi.org/10.1016/j.epsl.2025.119267, 2025.
Pearce, N. J. G., Perkins, W. T., Westgate, J. A., Gorton, M. P., Jackson, S. E., Neal, C. R., and Chenery, S. P.: A Compilation of New and Published Major and Trace Element Data for NIST SRM 610 and NIST SRM 612 Glass Reference Materials, Geostandards Newsletter, 21, 115–144, https://doi.org/10.1111/j.1751-908X.1997.tb00538.x, 1997.
Pietsch, T. J., Olley, J. M., and Nanson, G. C.: Fluvial transport as a natural luminescence sensitiser of quartz, Quaternary Geochronology, 3, 365–376, https://doi.org/10.1016/j.quageo.2007.12.005, 2008.
Polymeris, G. S., Sakalisa, A., Papadopoulou, D., Dallasa, G., Kitis, G., and Tsirliganis, N. C.: Firing temperature of pottery using TL and OSL techniques, Nuclear Instruments and Methods in Physics Research A, 580, 747–750, https://doi.org/10.1016/j.nima.2007.05.139, 2007.
Poolton, N. R. J., Smith, G. M., Riedi, P. C., Bulur, E., Bøtter-Jensen, L., Murray, A. S., and Adrian, M.: Luminescence sensitivity changes in natural quartz induced by high temperature annealing: a high frequency EPR and OSL study, Journal of Physics D: Applied Physics, 33, 1007–1017, https://doi.org/10.1088/0022-3727/33/8/318, 2000.
Preusser, F., Ramseyer, K., and Schlüchter, C.: Characterization of low OSL intensity quartz from the New Zealand Alps, Radiation Measurements, 41, 871–877, 2006.
Preusser, F., Chithambo, M. L., Götte, T., Martini, M., Ramseyer, K., Sendezera, E. J., Susino, G. J., and Wintle, A. G.: Quartz as a natural luminescence dosimeter, Earth Sci. Rev. 97, 184e214, https://doi.org/10.1016/j.earscirev.2009.09.006, 2009.
Rey, P., Burg, J.-P., and Caron, J.-M.: Middle and Late Carboniferous extension In the Variscan Belt: structural and petrological evidences from the Vosges massif (Eastern France), Geodinamica Acta, 5, 17–36, https://doi.org/10.1080/09853111.1992.11105217, 1992.
Rhodes, E. J. and Pownall, L.: Zeroing of the OSL signal in quartz from young glaciofluvial sediments, Radiat. Meas., 23, 329–333, 1994.
Rink, W. J., Rendell, H., Marseglia, E. A., Luff, B. J., and Townsend, P. D.: Thermoluminescence spectra of igneous quartz and hydrothermal vein quartz, Phys. Chem. Minerals, 20, https://doi.org/10.1007/BF00215106, 1993.
Rink, W. J., Bartoll, J., Schwarz, H. P., Shane, P., and Bar-Yosef, O.: Testing the reliability of ESR dating of optically exposed buried quartz sediments, Radiat. Meas., 42, 1618–1626, 2007.
Rixhon, G., Briant, R. M., Cordier, S., Duval, M., Jones, A., and Scholz, D.: Revealing the pace of river landscape evolution during the Quaternary: recent developments in numerical dating methods, Quaternary Science Reviews, 166, 91–113, https://doi.org/10.1016/j.quascirev.2016.08.016, 2017.
Saavedra, J., de la Roche, H., Leterrier, J., and Pellitero, E.: Essai de typologie géochimique de quelques granites à deux micas des Vosges moyennes, Bull. Soc. géol. Fr., 7, XV, 541–554, 1973.
Sawakuchi, A. O., Blair, M. W., De Witt, R., Faleiros, F. M., Hyppolito, T., and Guedes, C. C. F.: Thermal history versus sedimentary history: OSL sensitivity of quartz grains extracted from rocks and sediments, Quat. Geochronol., 6, 261–272, 2011a.
Sawakuchi, A. O., DeWitt, R., and Faleiros, F. M.: Correlation between thermoluminescence sensitivity and crystallization temperatures of quartz: potential application in geothermometry, Radiation Measurements, 46, 51–58, https://doi.org/10.1016/j.radmeas.2010.08.005, 2011b.
Sawakuchi, A. O., Jain, M., Mineli, T. D., Nogueira, L., Bertassoli Jr., D. J., Häggi, C., Sawakuchi, H. O., Pupim, F. N., Grohmann, C. H., Chiessi, C. M., Zabel, M., Schefuß, E., Mulitza, S., and the TS47 team: Luminescence of quartz and feldspar fingerprints provenance and correlates with the source area denudation in the Amazon River basin, Earth Planet. Sci. Lett., 492, 152–162, 2018.
Sawakuchi, A. O., Rodrigues, F. C. G., Mineli, T. D., Mendes, V. R., Melo, D. B., Chiessi, C. M., Giannini, P. C. F., Häggi, C., Sawakuchi, H. O., Pupim, F. N., Grohmann, C. H., and Chiessi, C. M.: Optically Stimulated Luminescence Sensitivity of Quartz for Provenance Analysis, Methods Protoc., 3, 6, https://doi.org/10.3390/mps3010006, 2020.
Schilles, T., Poolton, N. R. J., Bulur, E., Bøtter-Jensen, L., Murray, A. S., Smith, G. M., Riedi, P. C., and Wagner, G. A.: A multi-spectroscopic study of luminescence sensitivity changes in natural quartz induced by high-temperature annealing, Journal of Physics D: Applied Physics, 34, 722–731, 2001.
Schulmann, K.: Rapid burial and exhumation during orogeny: Thickening and synconvergent exhumation of thermally weakened and thinned crust (Variscan orogen in Western Europe), American Journal of Science, 302, 856–879, https://doi.org/10.2475/ajs.302.10.856, 2002.
Schulmann, K., Martinez Catalan, J. R., Lardeaux, J. M., Janoušek, V., and Oggiano, G.: The Variscan orogeny: extent, timescale and the formation of the European crust, Geol. Soc. Lond. Spec. Publ., 405, 1–6, 2014.
Sharma, S. K., Chawla, S., Sastry, M. D., Gaonkar, M., Mane, S., Balaram, V., and Singhvi, A. K.: Understanding the reasons for variations in luminescence sensitivity of natural quartz using spectroscopic and chemical studies, Proc. Ind. Nat. Sci. Acad., 83, 645–653, https://doi.org/10.16943/ptinsa/2017/49024, 2017.
Shimada, A., Takada, M., and Toyoda, S.: Characteristics of ESR signals and TL/CLs of quartz included in various source rocks and sediments in Japan: A clue to sediment provenance, Geochronometria, 40, 334–340, https://doi.org/10.2478/s13386-013-0111-z, 2013.
Shimada, A., Takada, M., and Toyoda, S.: Electron spin resonance signals of quartz in present-day river bed sediments and possible source rocks in the Kizu River basin, Western Japan, Geochronometria, 43, 155–161, https://doi.org/10.1515/geochr-2015-0039, 2016.
Skrzypek, E., Stipska, P., and Cocherie, A.: The Origin of zircon and the significance of U-Pb ages in high-grade metamorphic rocks: a case study from the Variscan orogenic root (Vosges Mountains, NE France), Contrib. Mineral Petrol., 164, 935–957, https://doi.org/10.1007/s00410-012-0781-1, 2012.
Skrzypek, E., Schulmann, K., Tabaud, A. S., and Edel, J. B.: Palaeozoic evolution of the Variscan Vosges Mountains, Geol. Soc. Lond. Spec. Publ., 405, 45–75, 2014.
Souza, P. E., Pupim, F. N., Mazoca, C. E. M., Río, I. D., Mineli, T. D., Rodrigues, F. C. G., Porat, N., Hartmann, G. A., and Sawakuchi, A. O.: Quartz OSL sensitivity from dating data for provenance analysis of pleistocene and holocene fluvial sediments from lowland Amazonia, Quaternary Geochronology, 74, 101422, https://doi.org/10.1016/j.quageo.2023.101422, 2023.
Stalder, R., Jaeger, D., Andò, S., Garzanti, E., Chiessi, C. M., Sawakuchi, A. O., and Strasser, M.: Trace element and OH content of quartz grains in the Amazon river: Potential application in provenance analysis, Sedimentary Geology, 480, 106853, https://doi.org/10.1016/j.sedgeo.2025.106853 2025.
Stavrov, O. D.: Geochemistry of Lithium, Rubidium and Cesium in the Magmatic Process, Nedra, Moscow, 216 pp., 1978 (in Russian).
Tabaud, A.-S., Whitechurch, H., Rossi, P., Schulmann, K., Guerrot, C., and Cocherie, A.: Devonian–Permian magmatic pulses in the northern Vosges Mountains (NE France): result of continuous subduction of the Rhenohercynian Ocean and Avalonian passive margin, Geol. Soc. Lond. Spec. Publ., 405, 197–223, 2014.
Timar-Gabor, A.: Electron spin resonance characterisation of sedimentary quartz of different grain sizes, Radiation Measurements, 120, 59–65, https://doi.org/10.1016/j.radmeas.2018.06.023, 2018.
Tissoux, H., Toyoda, S., Falguères, C., Voinchet, P., Takada, M., Bahain, J.-J., and Despriée, J.: ESR Dating of Sedimentary Quartz from Two Pleistocene Deposits Using Al and Ti-Centers, Geochronometria, 30, 23–31, https://doi.org/10.2478/v10003-008-0004-y, 2008.
Tissoux, H., Voinchet, P., Lacquement, F., and Despriée, J.: ESR as a method for the characterization of alluvial sediments, Radiation Measurements, 81, 2–8, https://doi.org/10.1016/j.radmeas.2015.05.010, 2015.
Toyoda, S.: Paramagnetic lattice defects in quartz for applications to ESR dating, Quaternary Geochronology, 30, 498–505, https://doi.org/10.1016/j.quageo.2015.05.010, 2015.
Toyoda, S. and Falguères, C.: The method to represent ESR signal intensity of the aluminium hole center in quartz for the purpose of dating, Advances in ESR Applications, 20, 7–10, 2003.
Toyoda, S. and Ikeya, M.: Thermal stabilities of paramagnetic defect and impurity centers in quartz: Basis for ESR dating of thermal history, Geochem. J., 25, 437–445, https://doi.org/10.2343/geochemj.25.437, 1991.
Toyoda, S. and Ikeya, M.: ESR dating of quartz with stable component of impurity centers, Quaternary Science Reviews, 13, 625–628, https://doi.org/10.1016/0277-3791(94)90089-2, 1994.
Toyoda, S., Voinchet, P., Falguères, C., Dolo, J. M., and Laurent, M.: Bleaching of ESR signals by the sunlight: a laboratory experiment for establishing the ESR dating of sediments, Appl. Radiat. Isot., 52, 1357–1362, 2000.
Toyoda, S., Miura, H., and Tissoux, H.: Signal regeneration in ESR dating of tephra with quartz, Radiation Measurements, 44, 483–487, https://doi.org/10.1016/j.radmeas.2009.03.002, 2009.
Toyoda, S., Nagashima, K., and Yamamoto, Y.: ESR signals in quartz: Applications to provenance research – A review, Quaternary International, 397, 258–266, https://doi.org/10.1016/j.quaint.2015.05.048, 2016.
Tsukamoto, S., Nagashima, K., Murray, A. S., and Tada, R.: Variations in OSL components from quartz from Japan sea sediments and the possibility of reconstructing provenance, Quaternary International, 234, 182–189, 2011.
Vartanian, E., Guibert, P., Roque, C., Bechtel, F., and Schvoerer, M.: Changes in OSL properties of quartz by preheating: an interpretation, Radiat. Meas., 32, 647–652, 2000.
von Eller, J.-P.: Carte géologique et pétrographique des Vosges moyennes, partie centrale et partie orientale 1 : 50 000, Bull. Serv. Carte Géol. Alsace Lorraine, 14, 1–22, https://doi.org/10.3406/sgeol.1961.1223, 1961.
Wark, D. A. and Watson, E. B.: TitaniQ: a titanium-in-quartz geothermometer, Contributions to Mineralogy and Petrology, 152, 743–754, 2006.
Wild, B., Daval, D., Beaulieu, E., Pierret, M.-C., Viville, D., and Imfeld, G.: In-situ dissolution rates of silicate minerals and associated bacterial communities in the critical zone (Strengbach catchment, France), Geochimica et Cosmochimica Acta, 249, 95–120, https://doi.org/10.1016/j.gca.2019.01.003, 2019.
Zular, A., Sawakuchi, A. O., Guedes, C. C. F., and Giannini, P. C. F.: Attaining provenance proxies from OSL and TL sensitivities: Coupling with grain size and heavy minerals data from southern Brazilian coastal sediments, Radiat. Meas., 81, 39–45, 2015.
- Abstract
- Introduction
- Overview of TL-OSL and ESR methods as sediment/bedrock tracers
- Study area and sampling
- Methods and protocol
- Results
- Discussion
- Conclusions
- Appendix A
- Appendix B
- Appendix C
- Appendix D
- Data availability
- Author contributions
- Competing interests
- Disclaimer
- Acknowledgements
- Financial support
- Review statement
- References