
the Creative Commons Attribution 4.0 License.
the Creative Commons Attribution 4.0 License.
 | 27 Aug 2026
Technical note: Disentangling pre- and post-depositional thermal histories in partially reset samples
Birk P. Härtel
Eva Enkelmann
Akeek Maitra
Interpreting thermochronological data of a partially reset detrital sample is challenging because its age distribution reflects a mixture of each grain's individual pre-depositional and the shared post-depositional thermal history. A promising approach to meet this challenge is combined geo- and thermochronological dating on the same grains. We present an algorithm for disentangling the pre- and post-depositional thermal histories using data from zircon –(U-Th) He double-dating. It differs from previous approaches in that it doesn't make any assumptions about the pre-depositional thermal histories of the grains in their source regions. First, we determine candidate post-depositional temperature-time paths by inverse thermal-history modeling of syn-depositional grains that crystallized at or near the time of deposition. We then calculate pre-depositional (U-Th) He model ages for each candidate thermal history representing cooling of the grains in their source regions. Subsequently, we evaluate which post-depositional thermal histories are plausible using the likelihood of their pre-depositional model ages falling in the expected interval between the crystallization ages of each grain and the time of sediment deposition. The final result is a selection of high-likelihood pairs of post-depositional thermal histories and pre-depositional ages. We illustrate this strategy by applying it to a Devonian sandstone from the Northern Canadian Cordillera. The results show the general agreement of the modeled thermal histories and pre-depositional (U-Th) He ages with existing thermochronological data. The post-depositional thermal histories are also consistent with additional zircon-Raman thermochronological data from the same grains. We discuss the limitations of our approach imposed by the need for syn-depositional grains, its application to other thermochronometers, and how targeting rather than avoiding partially reset samples enhances our capability to extract thermal-history information from the detrital record. Finally, we introduce PaRACAS, the implementation of our approach in a jupyter notebook that calculates, plots, and evaluates the pre-depositional zircon (U-Th) He model ages for post-depositional temperature-time paths determined in HeFTy.
- Article
(3894 KB) - Full-text XML
-
Supplement
(318 KB) - BibTeX
- EndNote


Detrital thermochronology is a powerful tool to date thermal events in sedimentary basins and in their source regions (e.g., Garver et al., 1999; Malusà and Fitzgerald, 2020). The information we obtain from detrital thermochronology depends on the sample's post-depositional history as shown in Fig. 1: an unreset sample (blue line in Fig. 1a) stayed at temperatures lower than the partial retention zone (PRZ). Its grains did not lose radioactive-decay products (daughters) during post-depositional heating. Its single-grain ages thus pre-date deposition (Fig. 1b); their variation mainly reflects different pre-depositional thermal histories and provides valuable information about cooling in the source regions (e.g., Garver et al., 1999; Rahl et al., 2003; Enkelmann et al., 2008; Bernet and Garver, 2005; Malusà and Fitzgerald, 2020). A fully reset sample was reheated well above the PRZ, erasing prior age information (yellow line in Fig. 1a). Its single-grain age distribution displays one age peak post-dating deposition (Fig. 1b). Minor within-sample age differences occur due to thermal-sensitivity differences between grains, e.g., related to properties such as grain size, composition, or radiation damage (Carlson et al., 1999; Reiners and Farley, 2001; Flowers et al., 2009; Guenthner et al., 2013). Reset samples allow us to constrain the time of post-depositional cooling in the basin (e.g., Cecil et al., 2014; Enkelmann et al., 2014; McKay et al., 2021).
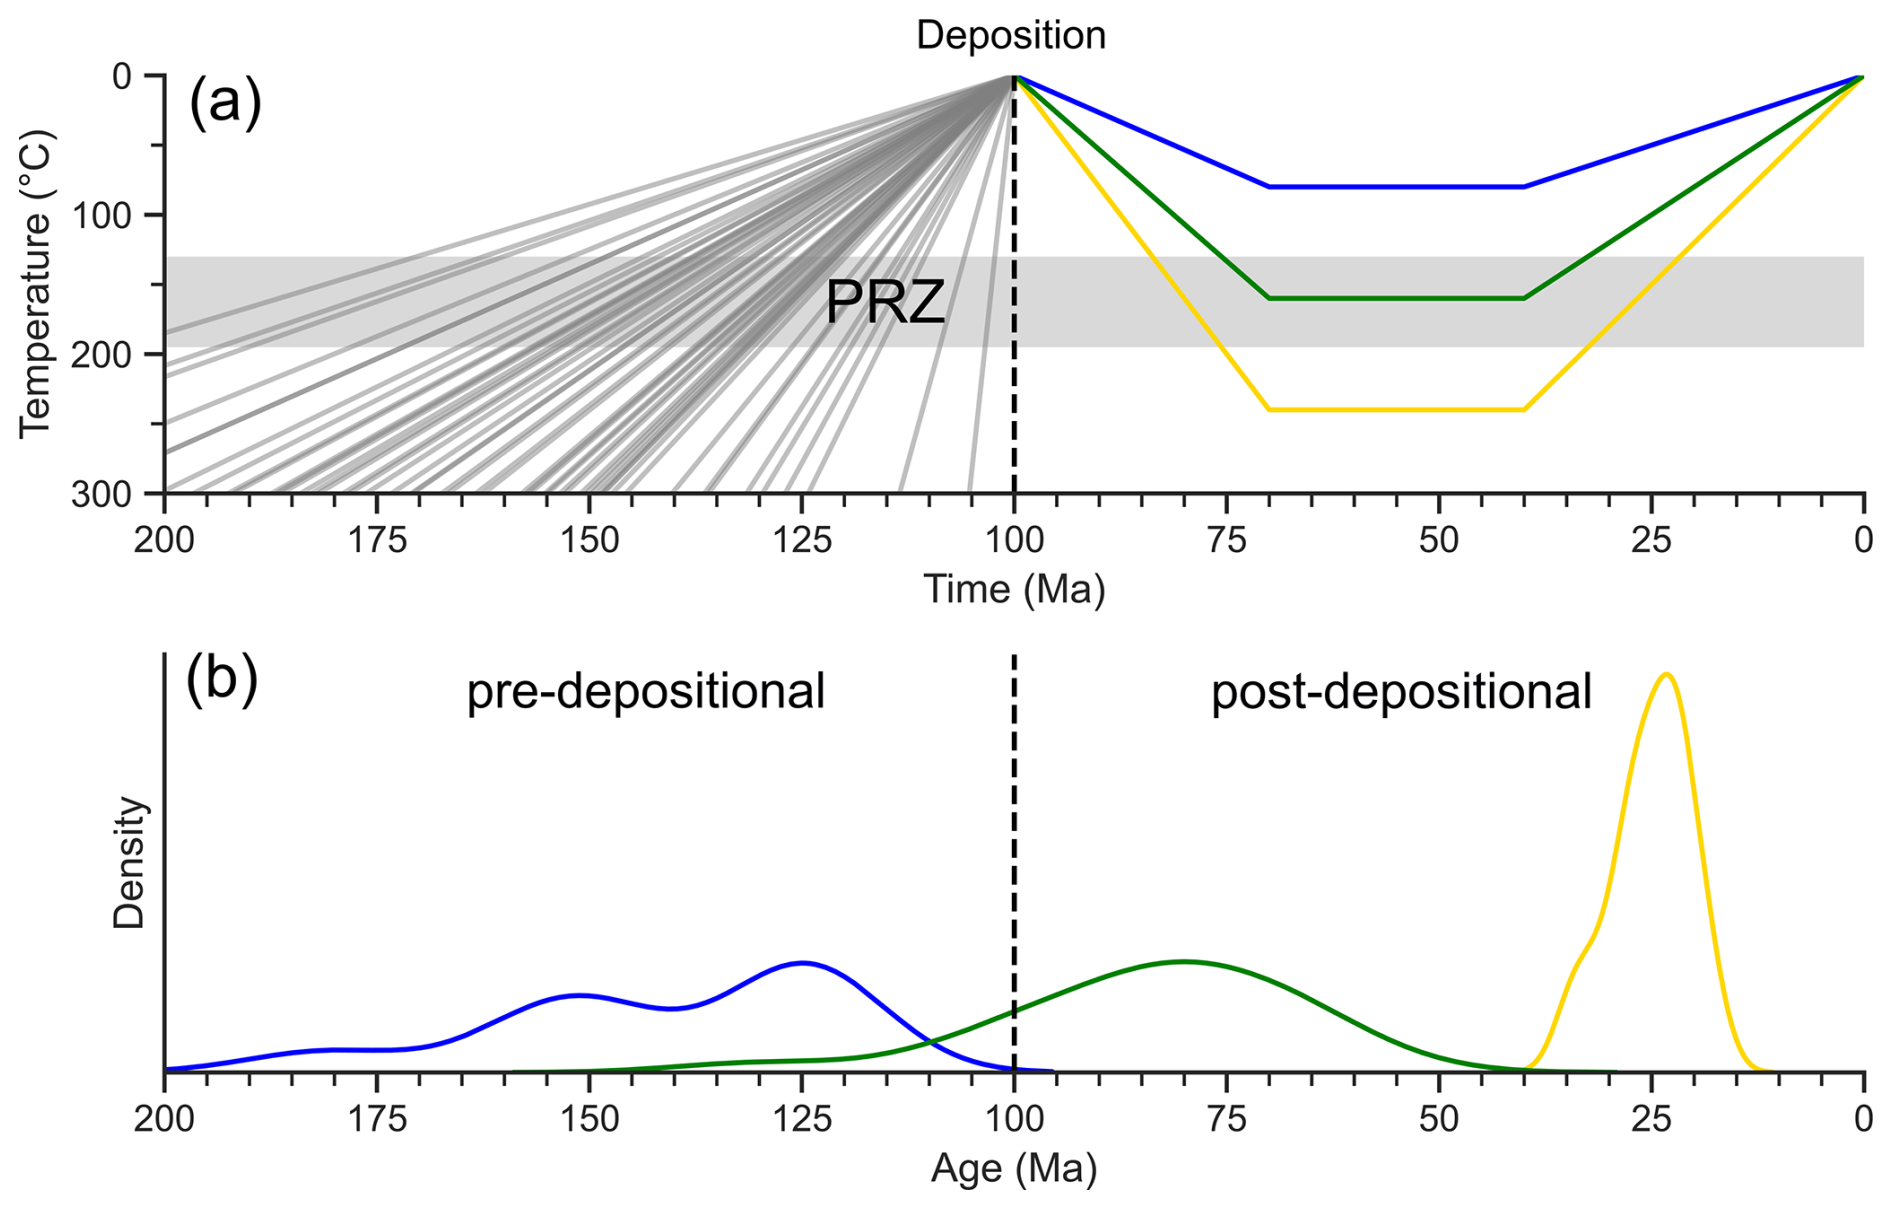
Figure 1Schematic thermal histories and single-grain age distributions of unreset (blue), partially reset (green), and fully reset (yellow) sedimentary samples in the zircon (U-Th) He (ZHe) system. (a) Example thermal histories for detrital grains with pre-depositional (grey) temperature-time (T–t) paths that represent simplified cooling paths for each grain and shared post-depositional paths (colored). The grey-shaded area marks the partial retention zone (PRZ; kinetics of Reiners et al., 2004, for non-metamict zircon grains with equivalent spherical radii of 20–90 µm and 30 Myr holding time). (b) Kernel-density estimate (KDE) curves for synthetic age distributions reflecting the thermal histories in (a).
In contrast, a partially reset sample experienced post-depositional heating into the PRZ (green line in Fig. 1a). It retained only part of its accumulated daughters after deposition and the age distribution spans across the depositional age (Fig. 1b). The single-grain ages vary due to both differences in pre-depositional thermal histories and differences between the thermal sensitivity of individual grains. With increasing post-depositional temperatures, the age spectrum approaches that of a fully reset sample. During holding at very high or low temperatures in the PRZ, the within-sample thermal-sensitivity differences even enable the co-existence of partially reset grains with unreset or fully reset grains.
In theory, partially reset samples contain information on both the pre- and post-depositional history that is inaccessible for fully reset or unreset samples. The mere notion of a sample having spent time within the well-defined temperature window of the PRZ provides a more precise estimate on the timing and temperature of maximum heating rather than just an upper (unreset) or lower (fully reset) temperature limit. Correcting the observed thermochronological ages for post-depositional heating would allow to extract the time when the source rocks cooled (e.g., Reiners et al., 2005) – information beyond the reach of fully reset samples. However, accurate interpretation of thermochronological data from partially reset detrital samples is complicated by the single-grain ages representing a mixture of the shared post-depositional and the individual pre-depositional thermal histories (Reiners et al., 2005; Flowers et al., 2022).
The most promising approach for disentangling pre- and post-depositional thermal histories is combined thermochronological and geochronological dating of the same grains (e.g., Carter and Moss, 1999; Reiners et al., 2005; Enkelmann et al., 2019b; Bootes et al., 2019; Danišik, 2019; Dunkl et al., 2024). In the popular zircon –(U-Th) He double-dating scheme, the ages – commonly interpreted as crystallization ages – provide individual constraints on the start of the thermal history for each grain that can be used for forward and inverse thermal-history modeling of each grain (Reiners et al., 2005; Fosdick et al., 2015; Yonkee et al., 2019). Nevertheless, the existing interpretation strategies for partially reset samples based on double-dating rely on assumptions about the pre-depositional thermal histories. These include the time of initial source-rock cooling or the duration and magnitude of heating events in the source regions. That knowledge is often not available, especially for pre-Cenozoic sediments because the specific source lithologies have been eroded. An alternative approach is therefore necessary, particularly in the light of the in-situ ZHe– double-dating technique by laser ablation, which allows acquiring large numbers of detrital-zircon double-dates (e.g., Vermeesch et al., 2012; Tripathy-Lang et al., 2013; Evans et al, 2015; Forte et al., 2022; Zawacki et al., 2024; Dunkl et al., 2024).
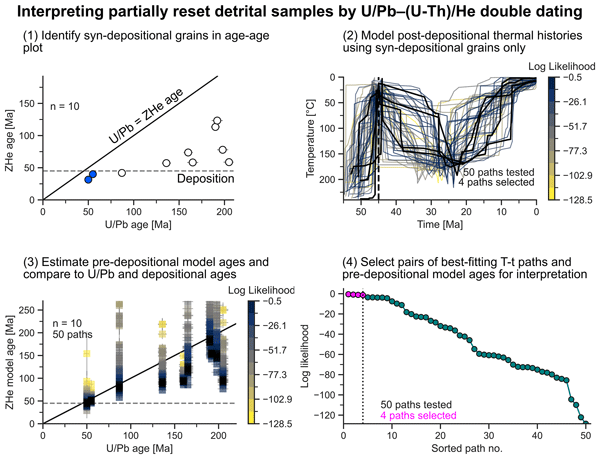
Building on the approaches of Reiners et al. (2005) and Fosdick et al. (2015), we present a new interpretation strategy for combined ZHe and data from partially reset samples. Its main innovation is that it avoids assumptions regarding the pre-depositional history by relying on syn-depositional grains, i.e., volcanic or shallow magmatic zircon grains that crystallized at or near the time of deposition. Our approach proceeds in three steps: (1) finding candidate temperature-time (T–t) paths for the post-depositional history by inverse T–t modeling of the syn-depositional grains; (2) calculating pre-depositional model ages for each grain and each candidate T–t path; (3) evaluating the plausibility of post-depositional thermal histories based on the likelihood of the pre-depositional model ages to fall between the individual crystallization ages and the depositional age. The results of this procedure are selected pairs of post-depositional thermal histories and pre-depositional model ages that can be interpreted in terms of source-region cooling. We first explain the details of our new approach on a set of synthetic data and compare it to existing interpretation strategies (Fig. 2). We then apply it to a partially reset Devonian sandstone from the Northern Canadian Cordillera. The results show that our strategy allows extraction of meaningful information on the pre- and post-depositional histories from ancient sediments. We discuss (1) the limits of our method, including the requirement of syn-depositional grains, problems with nearly fully-reset samples, and simplifying assumptions in He-diffusion modeling, (2) the application of our modeling strategy to other double-dating schemes, and (3) the question if and when it is necessary to model partially reset samples. Lastly, we introduce PaRACAS (Partial Reset Analysis for Cooling Ages of Sources; Härtel, 2026), a jupyter notebook that provides the functions for determining, plotting, and evaluating pre-depositional model ages from double-dating results and the outputs of inverse T–t modeling.
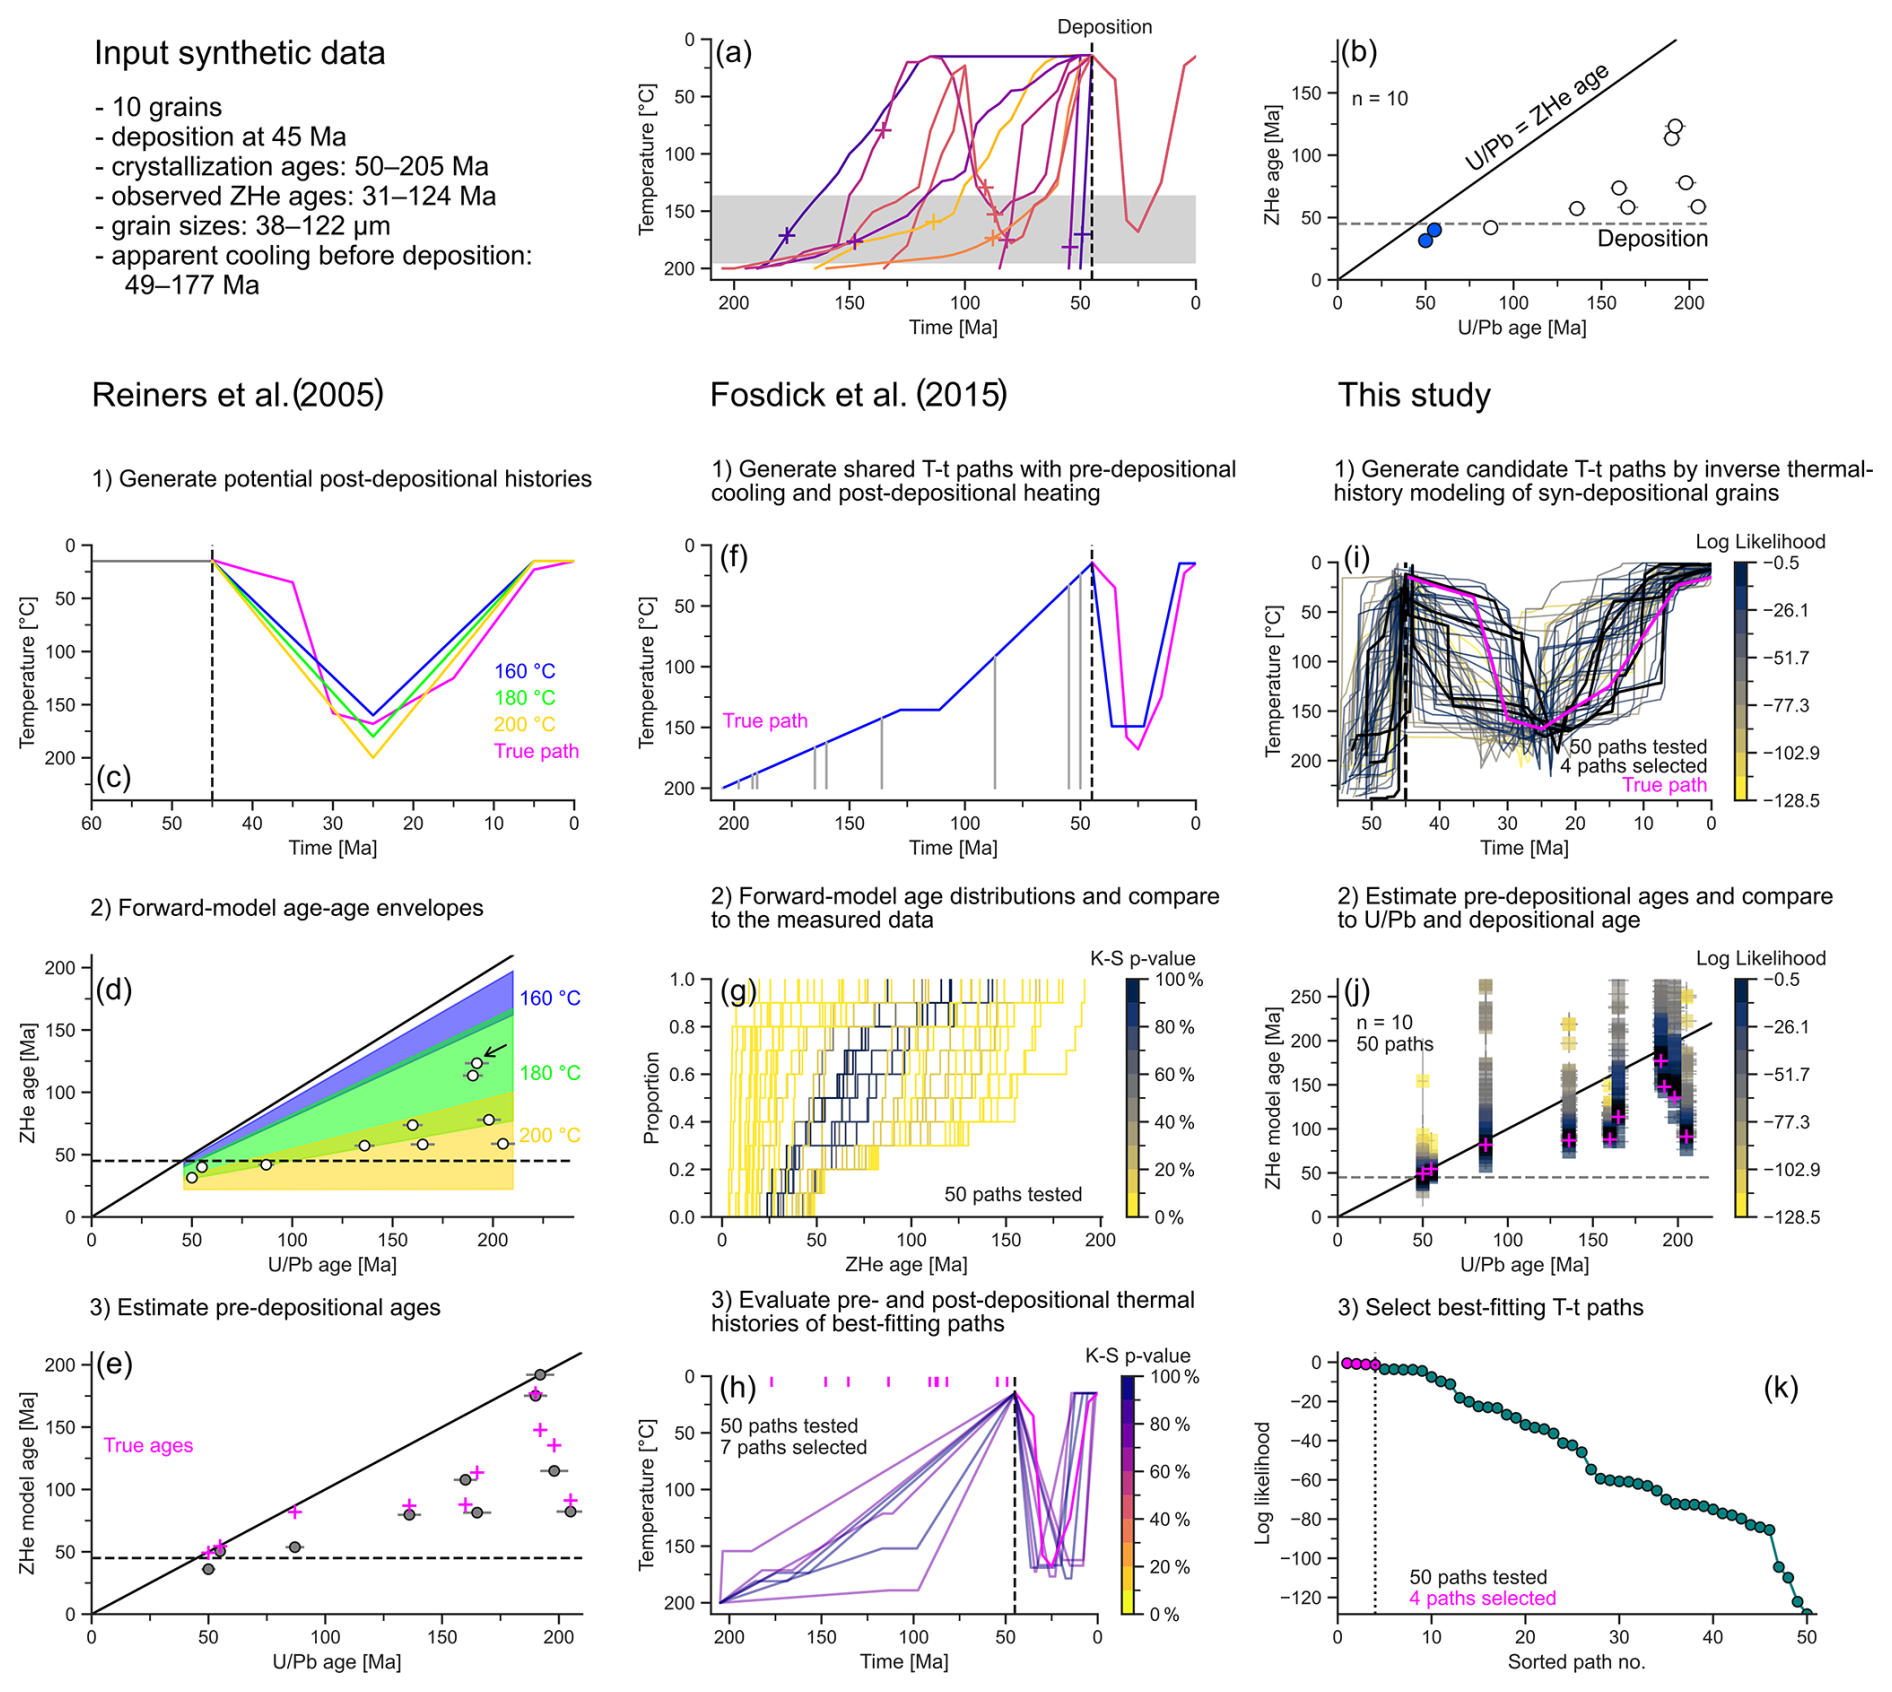
Figure 2Overview of partial-reset-modeling strategies applied to a synthetic zircon –(U-Th) He dataset. All information on this dataset is provided at the top panel. (a) True temperature-time (T–t) paths for each grain. The grey-shaded area marks the zircon (U-Th) He (ZHe) partial retention zone (grain size of the synthetic grains; kinetic parameters of Reiners et al., 2004) and (b) plot of (α-ejection-corrected) ZHe age vs. age. The panels below show the three different interpretation strategies of Reiners et al. (2005; c–e), Fosdick et al. (2015; f–h) and this study (i–k), each in three analytical steps. Detailed description of the specific steps for each strategy in the text.
While it is clear when fully reset or unreset samples accumulated the bulk of their daughters, partially reset samples contain a mixture of pre- and post-depositional daughters. Interpreting partially reset zircon (U-Th) He (ZHe) data with standard inverse thermal-history modeling (e.g., Ketcham, 2005, 2024; Gallagher, 2012) starting at the depositional age suffers from two biases: (1) for samples with many ZHe ages pre-dating deposition, the models underestimate post-depositional temperature – to reach a good fit with the measured ages all T–t paths need to ensure accumulation and retention of enough He in a restricted time frame. (2) If most ZHe ages post-date deposition, matching the T–t paths with the measured data leads to overestimation of post-depositional temperature toward a full-reset scenario. A widely-used approach is forward modeling the thermal history with an “inheritance envelope” of pre-depositional residence near the surface or a pre-depositional cooling rate (e.g., Fillon et al., 2013; Cecil et al., 2014; Guenthner et al., 2015; Powell et al., 2016, 2020; Fox et al., 2019; Yonkee et al., 2019). Its main advantage is that it allows accumulating not only pre-depositional He but also radiation damage that affects the thermal sensitivity of the ZHe system (Hurley et al., 1956; Reiners et al., 2005; Guenthner et al., 2013; Gérard et al., 2022). This approach evaluates the model fit by comparing the predicted relationship between ages and effective uranium concentrations (eU) to the measured data. However, this approach requires at least endmember assumptions about the pre-depositional thermal history, which is usually unknown and varies from grain to grain.
Combining ZHe and dating on the same detrital grains imposes constraints on the pre- and post-depositional histories, as the of each grain marks the starting point of its thermal history. For example, the observed amount of He loss since crystallization is a proxy for the degree of reset (Reiners et al., 2005), and each grain's age is a high-temperature starting point for thermal-history modeling (Fosdick et al., 2015). Figure 2 illustrates three interpretation strategies on a synthetic –ZHe dataset (Table S1 in the Supplement; n=10) with ages ranging from 50 to 205 Ma and grain sizes (equivalent spherical radii) between 38 and 122 µm. The grains underwent different thermal histories before deposition at 45 Ma (Fig. 2a; crosses: true pre-depositional ZHe ages) and were heated together to a maximum temperature of 168 °C at 25 Ma (thermal-history data in Table S2). The resulting (α-ejection-corrected) ZHe ages (31 to 124 Ma) span across the depositional age (dashed line) and correlate positively with the ages (Fig. 2b). This relationship reflects the ZHe-age variation due to different pre-depositional thermal histories.
Reiners et al. (2005) present a first-order interpretation approach to estimate the maximum-heating temperature for a simple post-depositional thermal history and a correction approach to obtain ZHe ages of pre-depositional cooling (Fig. 2c–e). Their first step is forward modeling the ZHe ages for a set of post-depositional thermal histories (Fig. 2c) assuming every grain stayed at surface temperatures between crystallization and deposition (grey horizontal line on the left). Figure 2d plots the measured ZHe ages against the ages with fields of modeled ages based on the maximum temperatures in Fig. 2c and the measured grain-size range. The further interpretation relies on the fraction of total He loss ftotal:
where tZHe and tUPb are the ZHe and ages, respectively, and treset is the time of post-depositional resetting (here: 25 Ma).
The grain plotting at the lowest temperature in Fig. 2d is the grain with the smallest total He loss (ftotal=fmin). fmin also denotes the maximum possible He loss that can have occurred to all grains together after deposition, indicating the maximum post-depositional temperature. The grain with the lowest total He loss in Fig. 2d (arrow) suggest that heating reached between 160 and 180 °C, an interval containing the true maximum temperature of 168 °C.
fmin also allows correcting all ZHe ages for the maximum possible post-depositional He loss and determining a pre-depositional model ZHe age tmodel:
Figure 2e plots these model ages against the ages (grey circles) and compares them to the “true” pre-depositional ages calculated from forward modeling the paths in Fig. 2a up to the depositional age (pink crosses). While the pre-depositional ages are a first approximation, six out of ten grains deviate from the true pre-depositional ages by more than 10 Myr – one model age even post-dates the timing of deposition (dashed line). This discrepancy results from extrapolating the annealing kinetics of the least-reset grain to the other grains. If the least-reset grain is more retentive than the average grain, Eq. (2) underestimates the pre-depositional model ages (Fig. 2e). Reiners et al. (2005) discuss two additional limitations: first, the model assumes that the grains cooled rapidly after crystallization and stayed near the surface until deposition. This neglects pre-depositional residence in the PRZ. fmin is thus a maximum estimate of the post-depositional reset of the least-reset grain and the model age may still overestimate the time of pre-depositional cooling. This is particularly a problem for samples with many grains post-dating deposition. Second, depending on the relationship between the depositional age and the measured ZHe ages, the assumed value of treset may have a strong impact on the pre-depositional ages. Nevertheless, this interpretation approach is a simple method for narrowing down the maximum post-depositional temperature. It is also independent of a specific He-diffusion model, as long as the diffusion kinetics are sufficiently similar across grains.
In contrast, Fosdick et al. (2015) present an approach that models a combination of both pre- and post-depositional thermal histories. It uses forward modeling of T–t paths that consist of a pre-depositional segment (Fig. 2f, left of the depositional-age line), to which every grain rapidly cooled immediately after crystallization (grey vertical lines), and a post-depositional heating pulse (blue path, Fig. 2f). Fosdick et al. (2015) generate a large set of T–t paths with different maximum temperatures, timings and durations of residence in the PRZ and model the present-day single-grain ZHe ages for each path. They evaluate the modeled and observed ZHe age distributions with a two-sample Kolmogorov-Smirnov (K-S) test (cumulative-distribution plot in Fig. 2g), keeping only the best-fitting paths for model interpretation (K-S p value >68 %; blue and black lines). Finally, they compare the pre-and post-depositional histories of these best-fitting models (Fig. 2h). For our synthetic data, the seven best-fitting T–t paths cluster at maximum temperatures of 160 to 180 °C, which they reached between 40 and 15 Ma and held for 2–13 Myr. Their timing and maximum temperature of post-depositional heating agrees to a first degree with the input thermal history (pink line). The time of pre-depositional cooling through the PRZ for these models spans a large range from 200 to about 100 Ma containing most of the true pre-depositional ages (pink vertical ticks).
One of this method's drawbacks is that it does not evaluate pre-depositional cooling on a grain-by-grain basis, but only for the bulk sample. Thus, sources with different cooling histories contributing only few grains to the sample will be overlooked because the best-fitting paths are selected based on the bulk goodness-of-fit. Nevertheless, this approach is more flexible than that of Reiners et al. (2005) for testing different pre- and post-depositional histories and considers kinetic differences between grains.
The main limitation of both modeling approaches is that they assume either a specific pre-depositional history for every grain or at least uniform pre-depositional histories across grains. We therefore present an alternative strategy (Fig. 2i–k). Instead of making assumptions about the pre-depositional thermal history, it focuses exclusively on the post-depositional history shared by all grains. To this end, it makes use of two fundamental principles: (1) syn-depositional grains, i.e., grains that crystallized at or near the time of deposition, record only the post-depositional thermal history (Fosdick et al., 2015), and (2) cooling through the PRZ in the source areas happened after crystallization but before deposition. Our strategy combines the probabilistic evaluation of T–t paths of Fosdick et al. (2015) and the pre-depositional model ages of Reiners et al. (2005). Its first step consists in identifying syn-depositional or near syn-depositional grains based on the and the depositional ages (blue circles in Fig. 2b). We use these grains for inverse thermal-history modeling in HeFTy (Ketcham, 2005, 2024) to obtain candidate post-depositional T–t paths (Fig. 2i). In the second step, we evaluate each of these paths by calculating pre-depositional model ages. To this end, we determine the net amount of helium accumulated after deposition, Hepost, and the remaining fraction ϕpost of pre-depositional He by forward modeling the candidate post-depositional T–t paths (details in Appendix A). Analogous to Eq. (2), we calculate the pre-depositional He concentration Hepre from the present-day concentration Heobs, Hepost and ϕpost:
The pre-depositional ZHe model age then follows from a generic age equation (Härtel and Enkelmann, 2024) and adding the depositional age tdep for scaling:
M238, λ238, and 8 are the molar mass of 238U, its decay constant, and the number of α-disintegrations in its decay chain, respectively. eUpre is the pre-depositional effective uranium concentration, i.e., the concentrations of U and Th at the timing of deposition recalculated to the integrated decay rate of 238U between tmodel and tdep.
We evaluate each path based on the likelihood of the pre-depositional model ages falling into the expected envelopes between the individual ages and the depositional age (details in Appendix B). Figure 2j plots the model ages against the ages, color-coded by their likelihood. Each vertical string of squares represents the set of model ages of one grain for the different T–t paths. The higher-likelihood paths (dark squares) mostly fall between the equal-age (solid) and depositional-age (dashed) lines. For further interpretation, it is practical to focus on a subset of the highest-likelihood post-depositional thermal histories and their pre-depositional model ages. The likelihoods and their distribution vary from one dataset to another, depending on the number of dated grains, the age distribution and uncertainties, and the extent of reset. Finding a universally applicable algorithm for selecting such a subset based on a number or proportion of paths, or an absolute-likelihood threshold is therefore difficult. We apply a “knee-detection” criterion to determine a cutoff likelihood (dotted line in Fig. 2k; kneedle algorithm of Satopää et al., 2011). This criterion uses the point at which the likelihood difference between a path and the next-less-likely path drops significantly. The selection therefore contains the paths most consistent with crystallization and deposition constraints spanning a range of likelihoods, while the non-selected paths have low likelihoods and differ little in their fit with the constraints. Thereby, we select the highest-likelihood paths with the likelihood spread still allowing to distinguish how well they agree with the constraints, while we exclude less-likely paths that are more difficult to distinguish based on their likelihood. For the synthetic dataset, the knee-detection algorithm suggests four thermal histories (pink circles). Their post-depositional T–t paths (thick black lines in Fig. 2i) reach maximum temperatures of 160 to 190 °C between 25 and 20 Ma, close to the true thermal history (pink line). These best-fitting T–t paths also predict pre-depositional ages (black squares in Fig. 2j) matching the true pre-depositional ages within 10 Myr (pink crosses).
Building on the strategy of Fosdick et al. (2015) to evaluate a large range of possible T–t paths, our strategy uses Monte-Carlo-based inverse thermal-history modeling to find plausible post-depositional thermal histories that would be tedious to implement in pure forward-modeling approaches. In addition, our approach provides pre-depositional model ages on a grain-by-grain basis like that of Reiners et al. (2005). Interpretation of these pre-depositional ages can proceed in a similar way as combined –ZHe dating results of unreset detrital samples to interpret source-cooling populations based on their age-age relationship (e.g., Reiners et al., 2005; Fosdick et al., 2024), for example as: (1) clusters of grains that overlap in both and ZHe age, suggesting that they crystallized and cooled together (e.g., Dunkl et al., 2024); (2) grains from shallow magmatic or volcanic sources, for which the ratio of to ZHe ages is approximately unity (e.g., Reiners et al., 2005; Saylor et al., 2012); (3) arrays of grains sharing the same crystallization age but with different ZHe ages, pointing to a similar source but having experienced different thermal histories (e.g., Reiners et al., 2005), or (4) grain populations showing the same ZHe age, but different ages, e.g., due to recycling from a fully reset (meta-)sedimentary source or erosion of grains from an igneous source and its contact aureole (e.g., Rahl et al., 2003; Saylor et al., 2012; Malusà et al., 2022). In addition, the pre-depositional model-age populations may show relationships to other single-grain provenance data such as grain size, mineral chemistry, or ϵHf values (e.g., von Eynatten and Dunkl, 2012; Sundell and Saylor, 2021). The good fit of our models to the synthetic dataset confirms the validity of this approach in theory. In the following section, we illustrate its use on actual thermochronological data from the Northern Canadian Cordillera.
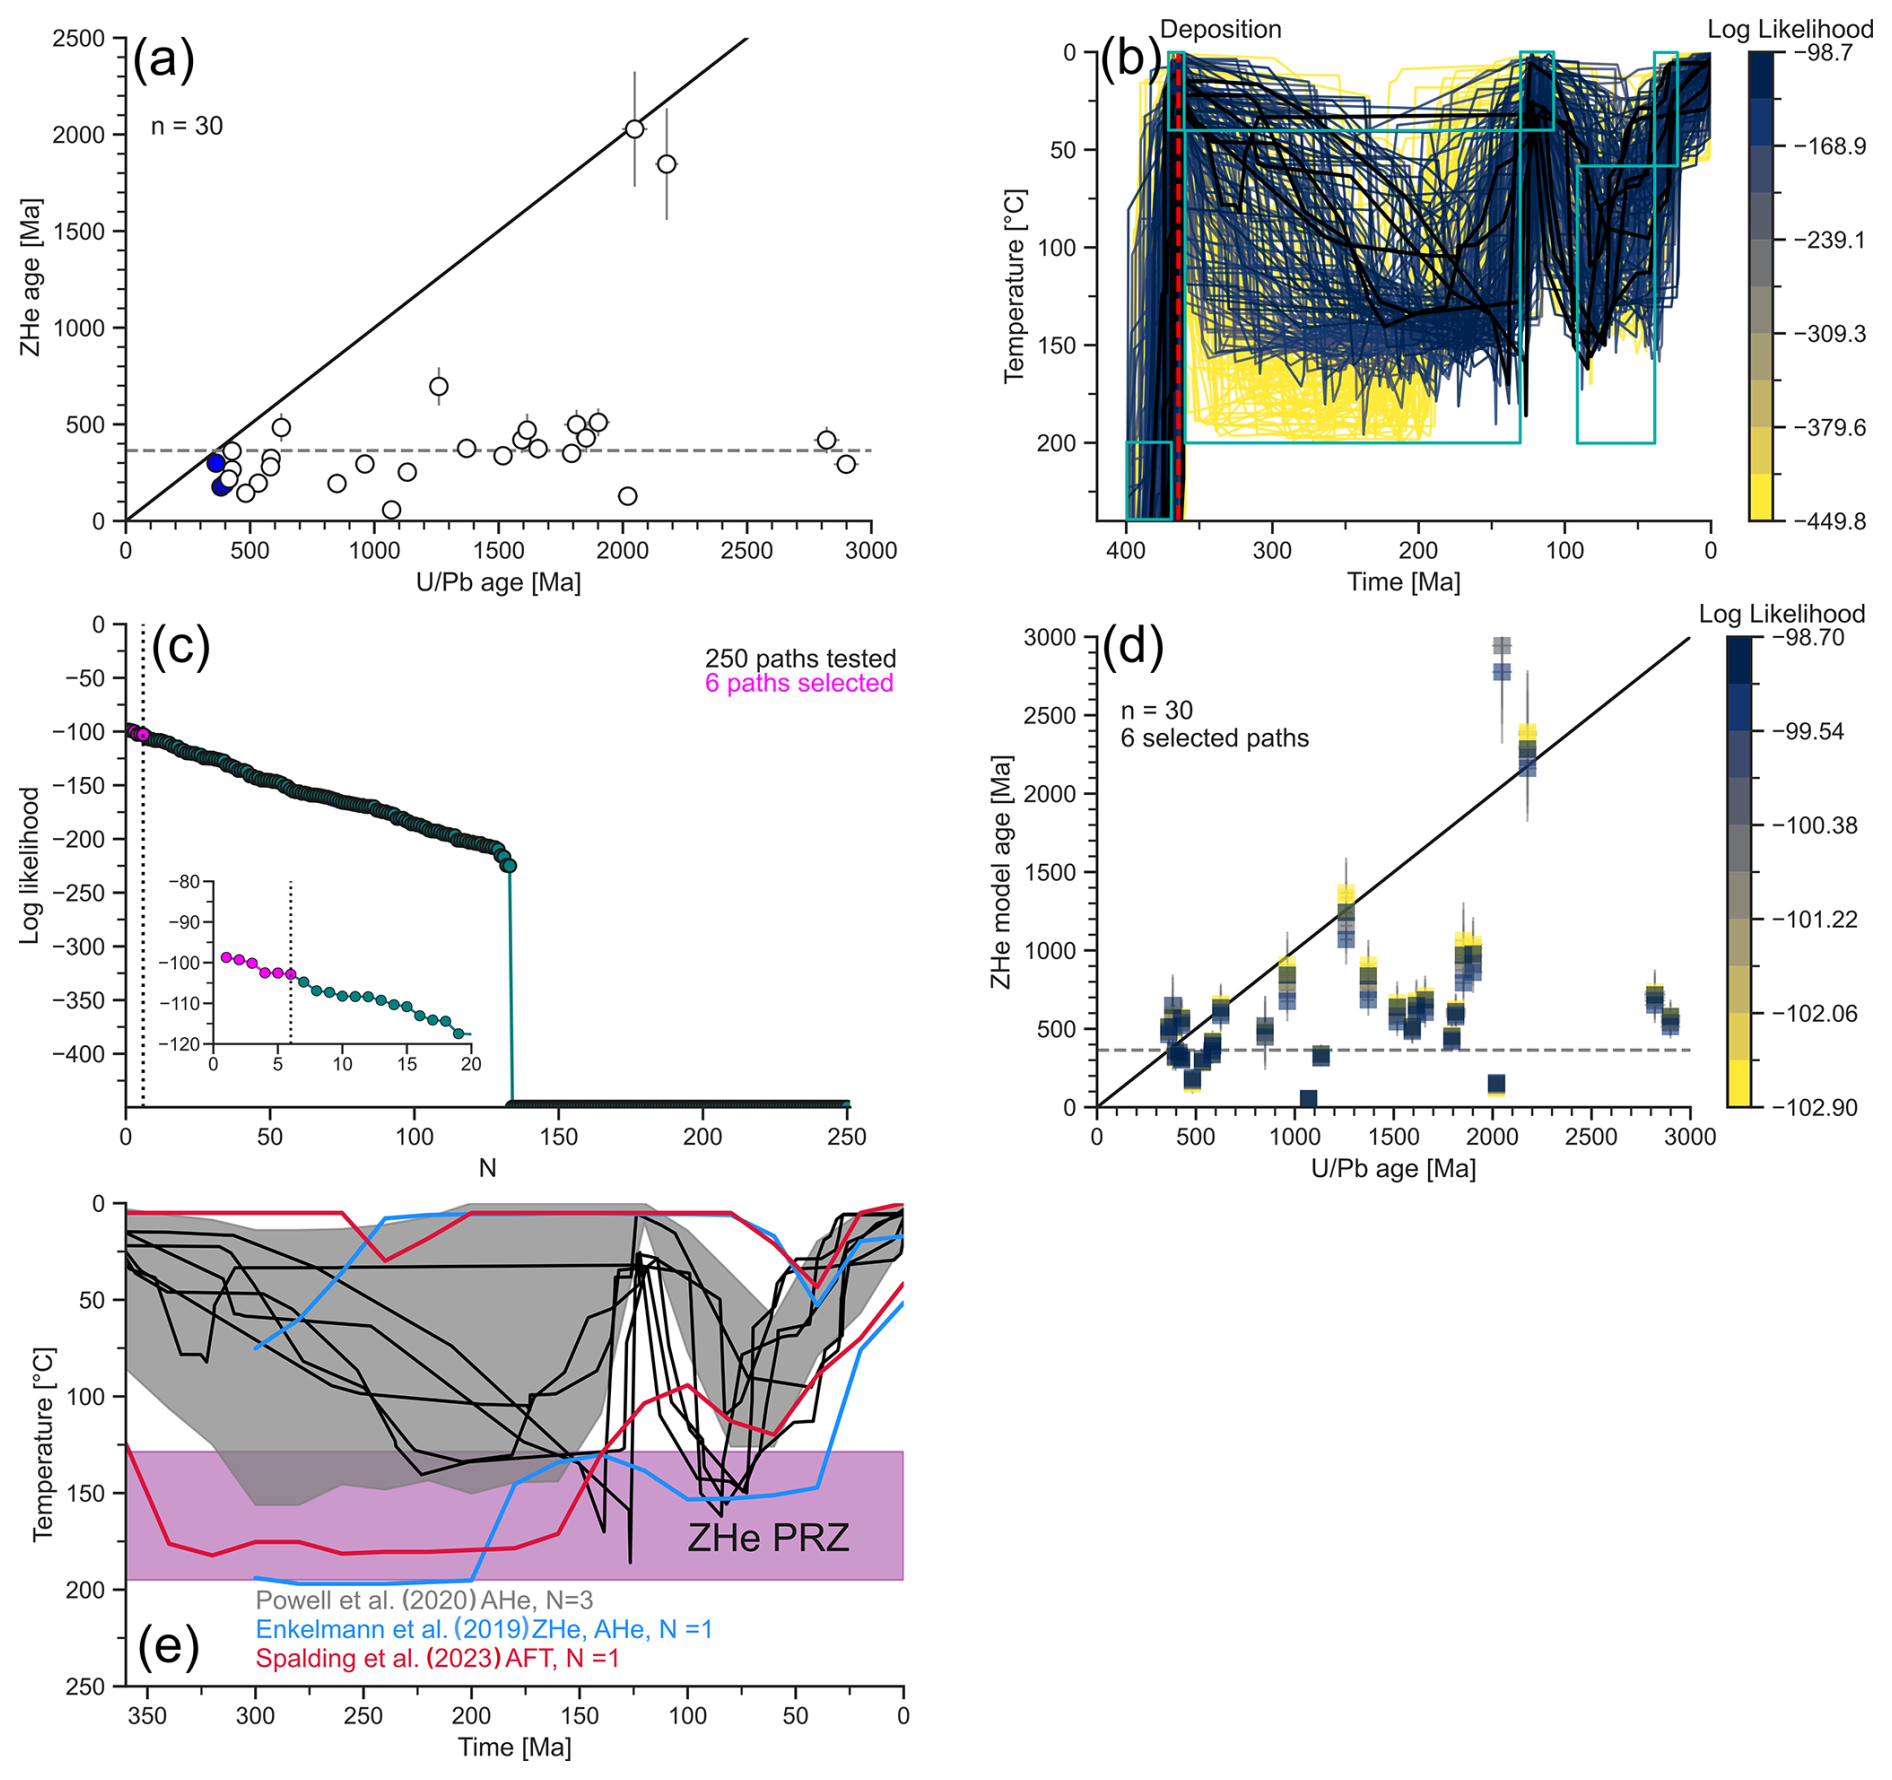
Figure 3Zircon –(U-Th) He (ZHe) data and modeling results for an Imperial Formation sandstone from the Northern Canadian Cordillera. (a) Plot of measured ZHe age (corrected for α-ejection; see Härtel et al., 2026) vs. concordia ages with equal-age (solid), and depositional-age (dashed) lines. Blue symbols: syn-depositional grains. Bars show 2 s uncertainties. (b) Temperature–time (T–t) paths from inverse modeling of syn-depositional grains color-coded by log-likelihood. Light-blue boxes: Modeling constraints (Table S3). Black lines: best-fitting model paths. (c) Sorted log-likelihoods of model paths. The inset shows the region of the 20 highest-likelihood paths. Dotted line: cutoff for the selected best-fitting models (pink circles). (d) Plot of pre-depositional model ZHe ages vs. concordia ages for the selected paths color-coded by log-likelihood. Lines and uncertainty bars as in (a). (e) T–t paths of the selected paths (black lines) compared to envelopes of good-fitting paths from existing thermal-history models (Enkelmann et al., 2019a, blue lines; Powell et al., 2020, grey-shaded area; Spalding et al., 2023; red lines) and the ZHe partial-retention zone (PRZ; purple-shaded area; as in Fig. 1). N: number of samples.
We applied our new modeling strategy to zircon –(U-Th) He–Raman multi-chronometer data from a Devonian sandstone (Imperial Formation) from the Mackenzie Plain, Northern Canadian Cordillera (Härtel et al., 2026; their sample NW-15). The data were acquired in three steps: Raman spectroscopic radiation-damage mapping of the ν3 (∼ 1008 cm−1) and external rotation (ER, ∼356 cm−1) bands, He extraction from a small volume within the grains by laser-ablation noble-gas mass spectrometry (e.g., Boyce et al., 2006; Vermeesch et al., 2012; Evans et al., 2015), and LA-ICP-MS for determining the U and Th concentrations – to calculate the ZHe and zircon Raman (ZR) ages – and the age. For details on the analytical procedure and data treatment, see Härtel et al. (2026). Figure 3a shows the combined ZHe and concordant zircon data. ages range from 364 Ma to 2.9 Ga. ZHe ages span a range between 57 and 2030 Ma, across the depositional age of 364.3±5.7 Ma (dashed line in Fig. 3a; maximum-depositional age of Härtel et al., 2026); about 73 % of the grains post-date the depositional age. The ZHe ages also show a weak positive correlation with the ages. These observations confirm a high degree of partial reset by heating into the ZHe PRZ after deposition as suggested by thermal-history models on other Imperial-Formation samples from Northern Canada (Issler et al., 2005; Enkelmann et al., 2019a; Powell et al., 2020; Spalding et al., 2023).
For the inverse thermal-history modeling, we selected the three youngest grains with concordant ages <400 Ma (uncorrected ZHe ages: 106.1±20.1 Ma (2 s); 157.5±25.7 Ma; 266.7±40.3 Ma; blue circles in Fig. 3a), allowing for individual pre-depositional thermal histories of ≤36 Myr, less than 10 % of the post-depositional history. We performed inverse thermal-history modeling in HeFTy (Ketcham, 2005, 2024) with input uncertainties of 20 % to ensure finding T–t paths compatible with all three grains despite their ZHe-age differences. Appendix C describes how we adjusted the modeling procedures to account for differences between whole-grain He-diffusion kinetics and the diffusion kinetics of the volume that the He was extracted from by laser-ablation. We used the radiation-damage-independent diffusion parameters of Reiners et al. (2004) because the dose-equivalent α-radiation-damage densities of our grains (20 to 120×1016α g−1, measured by Raman spectroscopy) are well within the range for radiation-damage-independent He diffusion (∼5 to 200×1016α g−1, Guenthner et al., 2013). Table S3 lists the T–t constraints we set for the inverse thermal-history models, including the geologic observation of Lower Cretaceous strata unconformably overlaying the Imperial Formation. We set the stopping condition for the Monte-Carlo-based T–t inversion in HeFTy to 250 good-fit paths (goodness-of-fit >0.5).
For the resulting good-fit paths (Fig. 3b), we calculated the pre-depositional model ages and the path likelihoods. In theory, the syn-depositional grains permit full reset by heating to temperatures >190 °C before 200 Ma (yellow lines), but these paths have low log-likelihoods because they are incompatible with the crystallization ages of the older grains. Most of the other paths (blue and black lines) indicate heating during the Late Paleozoic to Early Mesozoic into the interval between 130 and 180 °C, followed by a second heating event to 50–160 °C in the Late Cretaceous to Paleogene. Out of the 250 paths, the knee-detection algorithm suggests six best-fitting paths (pink circles in Fig. 3c; thick black lines in Fig. 3b and e). Two of these paths show a first heating phase up to 140 °C in the Triassic, followed by ≥50 Myr residence in the ZHe PRZ (purple-shaded area) and cooling in the Jurassic to Cretaceous. Two paths reach their peak temperatures of 140 to 180 °C only in the Late Jurassic to Early Cretaceous before cooling nearly instantaneously. The two final paths do not show heating into the ZHe PRZ before the Late Cretaceous. For the Late-Cretaceous to Paleogene heating event, the best-fitting paths indicate peak temperatures of 100 to 160 °C between 90 and 70 Ma, or about 95 °C at 50 Ma.
Figure 3d plots the pre-depositional model ZHe ages for the six best-fitting paths against the ages of our grains. Overall, about 83 % of the grains (25 out of 30 grains) show the expected behavior, falling between the crystallization age (solid line) and the deposition age (dashed line). The main group of pre-depositional model ZHe ages falls in the Neoproterozoic to Paleozoic range, with a single grain straddling the equal-age line at 2.2 Ga. Two of the remaining pre-depositional ages are higher than the respective ages, indicating that the diffusion model overestimates their degree of reset relative to the measured ZHe age. One of them is a syn-depositional grain, whose misfit in Fig. 3d reflects the difference between its analytical uncertainty and the expanded uncertainty used for the inverse T–t modeling. Three pre-depositional ages post-date deposition because the diffusion model underestimates their degree of reset. The misfits between modeled and expected ages reflect several simplifications of the diffusion model, which we discuss in Sect. 4.1. Still, the 83 % of the grains overlapping with the expected envelope, confirm that a simple diffusion model can retrieve consistent T–t information from detrital data with a high degree of partial reset.
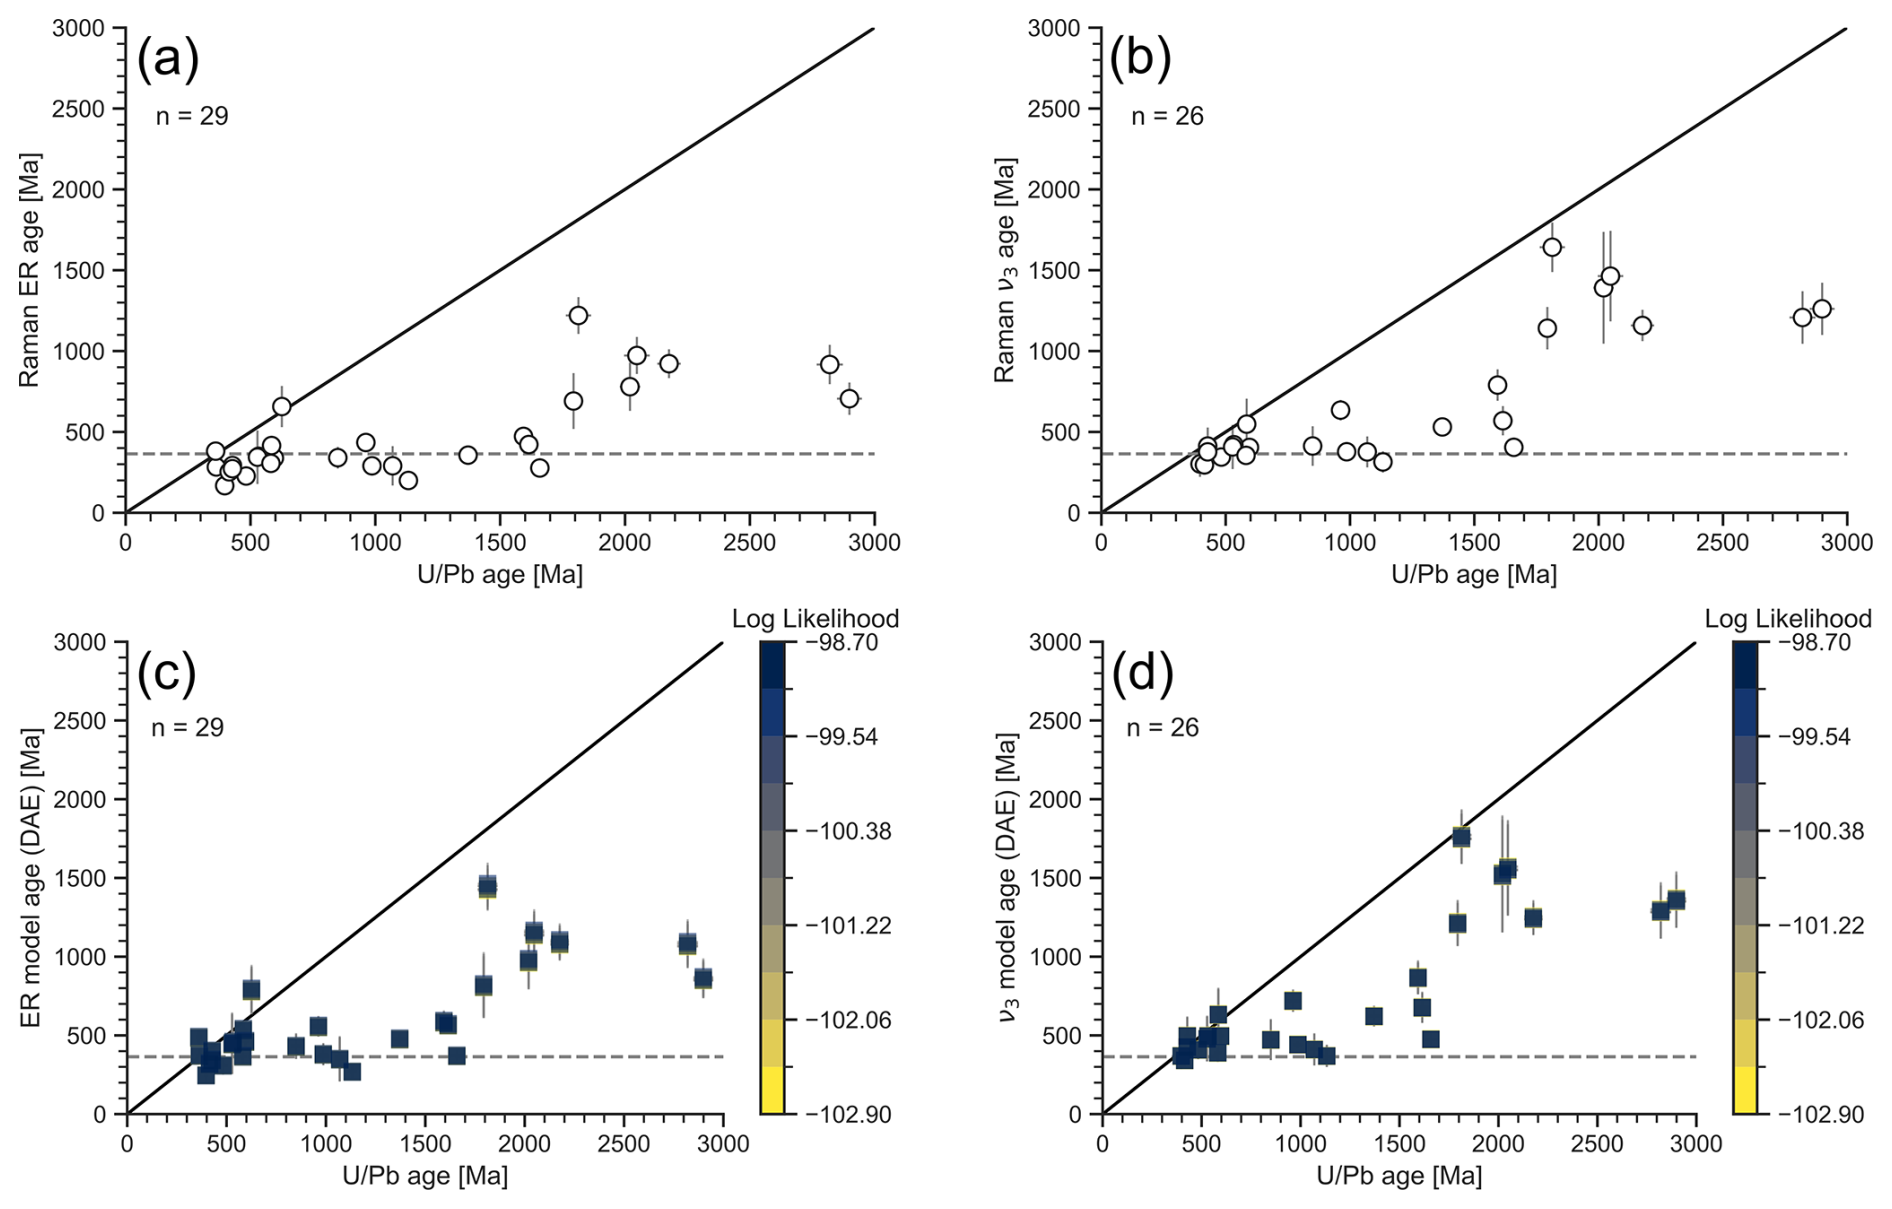
Figure 4Zircon Raman (ZR) data and pre-depositional model ages for the Imperial-Formation sandstone. (a–b) ZR vs. age-age plots for the external rotation (ER; a) and ν3 (b) Raman bands. (c–d) Plots of pre-depositional model ZR vs. ages for the ER (c) and ν3 (d) bands color-coded by the log-likelihood. The lines denote equal ages (solid), and the depositional age (dashed). The bars show 2 s uncertainties.
To further validate our modeling results, we use the ZR data from the same grains dated with the and ZHe methods. Figure 4a and b plot the measured ZR ages from the ER and ν3 Raman bands against the ages. The ZR ages spread across the depositional age, indicating that these dating systems were partially reset. The lower proportions of post-depositional ages in Fig. 4a and b (ER: 55 %; ν3: 19 %) compared to the ZHe ages (73 %) agree with the ZR systems' lower susceptibilities to reset and the overlap of the ZHe PRZ with the ZR partial-annealing zones (ER: 180 to 450 °C; ν3: 220 to 480 °C for 20 to 80 % annealing; Härtel et al., 2021). In addition, both ZR age distributions are bimodal, with a younger population (ER: 200 to 500 Ma; ν3: 300 to 800 Ma) of grains that crystallized after 1.8 Ga, and an older population (ER: 700 to 1300 Ma, ν3: 1.1 to 1.7 Ga) of grains with ages exceeding 1.8 Ga. We determined the pre-depositional model ZR ages based on the distributed-activation-energy kinetic model of Härtel et al. (2021; see Appendix A). Figure 4c and d plot these ages against the ages. In general, there is negligible age variation between T–t paths, which is explained by the low sensitivity of lattice damage to temperature differences at low degrees of damage annealing. Of the 29 pre-depositional ER ages, 24 (∼83 %) overlap with the expected age range; only three are lower than the depositional age and do not overlap within uncertainties, while two ages pre-date the ages. For the ν3 band, all pre-depositional ages overlap with the expected age range within uncertainty. For both ZR ages, the pre-depositional ages preserve their bimodal distributions with the younger group ranging from the depositional age to 800 Ma (ER) and 900 Ma (ν3), and the older group spanning from 800 to 1500 Ma (ER) and from 1.2 to 1.8 Ga (ν3). The overall good fits of the pre-depositional model ZR ages to the expected age range confirm the consistency of the modeled T–t paths based on He-diffusion kinetics with the measured ZR ages and the radiation-damage-annealing kinetics.
While a geological interpretation of the T–t paths and pre-depositional ages for this Devonian sandstone is outside the scope of this paper, we compare our modeling results to existing thermal-history models from the Imperial Formation. Figure 3e plots our best-fitting T–t paths (black lines) together with the envelopes of good-fit T–t paths determined by Enkelmann et al. (2019a; blue lines; apatite (U-Th-Sm) He (AHe) and ZHe data), Powell et al. (2020; grey-shaded area; AHe data with T–t constraints from forward modeling of ZHe data and inverse modeling of apatite fission-track (AFT) data and stratigraphy), and Spalding et al. (2023; red lines; AFT data) – these thermal-history models used a total of five samples within 60 km from our sample location. In general, our best-fitting paths fall into the comparison envelopes, but they show three important deviations: (1) for the Carboniferous–Early Cretaceous part of the thermal history, our best-fitting paths mostly fall into the comparison envelopes, but show less temperature variation, likely due to the and depositional ages not allowing heating into the ZHe PRZ before the Triassic (Fig. 3b). (2) Some of our T–t paths indicate higher temperatures during the Early Cretaceous, however, this is likely due to different constraints used for each of the models. (3) Our temperatures for the Late Cretaceous–Paleogene heating event are higher than for the models of Powell et al. (2020) and Spalding et al. (2023), but only two of our paths exceed the temperatures suggested by the models of Enkelmann et al. (2019a). This is likely the result of Powell et al. (2020) and Spalding et al. (2023) mostly relying on lower-temperature thermochronometers, which are difficult to reconcile with some of the strongly reset ZHe data. Overall, while our T–t paths match previous modeling results from the Imperial Formation, our modeling approach could benefit further from using additional lower-temperature thermochronometers to better constrain post-reset cooling.
The pre-depositional ages also allow comparison to provenance and source-cooling interpretations of the Imperial Formation. The Imperial Formation is part of the Ellesmerian clastic wedge, representing a mixture of sources from the Canadian Shield and Proterozoic to Paleozoic terranes that collided with Laurentia in the Late-Devonian to Mississippian Ellesmerian orogeny (Hadlari et al., 2009; Beranek et al., 2010; Lemieux et al., 2011). Our pre-depositional ZHe ages (Fig. 3d) form a broad continuous distribution from the Neoproterozoic to the Paleozoic and thus do not contradict Archean to Devonian sources that were partially to fully reset during the Ellesmerian orogeny. The bimodal pre-depositional ZR ages (Fig. 4c and d) separate the cooling of the Canadian Shield in the Paleo- to Mesoproterozoic (older population) from Neoproterozoic to Paleozoic cooling in the younger source terranes (younger population), with a potential minor overprint during the Ellesmerian orogeny. The ZR ages of the younger grain population also overlap strongly with muscovite ages of Powell and Schneider (2013) from the Imperial formation, which mostly range from 370 to 640 Ma. The similar closure temperatures (muscovite : 350 to 400 °C, Harrison and Zeitler, 2005; ER: 260 to 310 °C, ν3: 330 to 370 °C, Härtel et al., 2021), suggest comparable thermal histories for the zircon and muscovite source rocks. All in all, our modeling results match the existing thermochronological data from the Imperial Formation in the Mackenzie Plain.
While the results show the overall viability of our modeling approach for partially reset samples, it also has some limitations. In the following section, we address the limitations and simplifying assumptions of our approach and their practical implications. Then we discuss the application of our modeling approach to other thermochronometers. Finally, we compare the possibilities of partial-reset modeling to strategies avoiding partially reset samples.
4.1 Limitations of the proposed modeling approach
Our modeling strategy successfully leverages the information contained in syn-depositional grains to disentangle pre- and post-depositional thermal histories, but there are four limitations that could hamper its use: first, the availability of syn-depositional grains is the method's Achilles heel. In general, the quality of the post-depositional thermal histories depends on the number and quality of the syn-depositional grains. As a simple heuristic, we suggest aiming for 3–10 syn-depositional grains as typically dated in conventional-ZHe bedrock studies (e.g., Reiners, 2005; Flowers et al., 2022) because the syn-depositional population experienced a single (post-depositional) thermal history similar to bedrock samples. Obtaining enough syn-depositional grains is not critical for strata that were sourced from regions with coeval magmatic activity (e.g. magmatic arcs, rift magmatism), but it complicates matters for strata with source regions where most of the datable zircon grains are eroded from significantly older rocks (e.g., cratons, metamorphic hinterland; Cawood et al., 2012). It is, however, possible to screen the sample for syn-depositional or near syn-depositional grains first. Daniels et al. (2018) applied analysis by LA-ICP-MS with short ablation pulses (e.g., 5 s) to a large number of detrital grains (n≥600) to find the youngest age population and define a maximum-depositional age. Such a screening approach can be carried out before polishing the grains to the full depth and performing double- or multi-dating. This procedure provides additional information from grain rims and offers the prospect of recognizing syn-depositional overgrowths on inherited cores from magmatic sources (Malusà et al., 2022). In this regard, laser-ablation-based ZHe dating has a decisive advantage over conventional whole-grain ZHe dating for addressing samples with few syn-depositional grains, as it allows acquiring dozens to hundreds of -ZHe age pairs without biasing the selection toward syn-depositional grains. If no geo- and thermochronometric data from syn-depositional grains can be obtained, it is still possible to use other grains for inverse thermal-history modeling, given that their pre-depositional thermal history is constrained well enough. The most promising way to achieve this – although restricted to coarse clastic deposits – is by analyzing zircon from clasts instead of detrital grains (e.g., Rahl et al., 2011; Grabowski et al., 2013; Falkowski et al., 2016; Stevens Goddard et al., 2024). The main advantage is that other thermochronometers on different minerals or information on the source of the clast can be used together to constrain the pre-depositional thermal history well enough and model the post-depositional history. A different approach is to model the post-depositional thermal history with fully reset lower-temperature thermochronometers such as AFT or AHe dating and using the evaluation of the post-depositional model ages in the next step to weed out the paths not fitting the partially reset ZHe data. As a last resort in the absence of syn-depositional grains, it is also possible to construct simplified post-depositional T–t paths, e.g., in the way of Fosdick et al. (2015) by randomly sampling timing, temperature, and duration of heating for a large number of paths and evaluate their fit with the data with the likelihood criterion in the subsequent step.
Second, while our data show that the modeling strategy performs well at a high degree of partial ZHe reset, it becomes less useful once a sample approaches full reset. In this case, the inverse T–t modeling step will find many good-fit paths that lead to full reset. This increases the number of paths necessary for forward modeling to find solutions that are compatible with the crystallization and depositional ages. In addition, the uncertainty on the pre-depositional model ages increases while reset erases information on the pre-depositional history. This weakens the log-likelihood criterion for model evaluation and hampers the interpretation of source cooling.
Third, the syn-depositional grains may not be representative of the entire grain population in terms of He-retention kinetics. In this case, modeling is not infeasible but may require more inverse T–t modeling to find high-likelihood paths. If the syn-depositional grains are much smaller than the rest of the dated grains, they may have been fully reset after deposition. In this case, the inverse thermal-history modeling software will accept many paths because they reach temperatures just high enough to reset the syn-depositional grains despite being incompatible with the larger grains. Conversely, modeling large syn-depositional grains leads to T–t paths that do not fit with the thermochronological data from the smaller grains. We therefore recommend to select syn-depositional grains with variable size if possible.
Fourth, our modeling example in Sect. 3 relies on several simplifying assumptions that affect model accuracy, but can be dealt with in the future: (1) we assume a uniform U and Th concentration. Uranium and thorium zoning is common in zircon (e.g., Corfu et al., 2003). It determines He-concentration gradients and thus diffusion rates (e.g., Meesters and Dunai, 2002). If information on zoning is available, e.g., from U-Th mapping, it can easily be incorporated into the inverse- and forward-modeling routines by calculating the He accumulation profile based on the U and Th distributions. (2) We did not take into account effects of inherited radiation-damage. In our case study, this decision was supported by low radiation-damage densities directly measured by Raman spectroscopy. For samples containing grains with potentially high degrees of inherited radiation damage, it is possible to incorporate the damage-diffusivity relationship in the forward-modeling step (e.g., Guenthner et al., 2013; Guenthner, 2021). To avoid assumptions about the individual pre-depositional damage accumulation, we suggest using Raman spectroscopic measurements of present-day radiation damage and tracing it back through the post-depositional thermal history (Appendix A) to determine the He-diffusion parameters at every time step. In a subsequent step, it is then also possible to test the extent of radiation-damage annealing in the source regions (e.g., Resentini et al., 2026). (3) For modeling the retention of pre-depositional He during post-depositional heating, we assumed that the initial He-concentration profile within the grain was similar to an α-ejection profile. While this is not necessarily the case, we regard it as a reasonable estimate: if diffusion rounding of the He concentration profile occurred before deposition, it is at least in part diluted toward an α-ejection profile during pre-depositional cooling. Hence, the true He-concentration profile will only differ significantly from an α-ejection profile for a sample that first accumulated a large amount of He prior to deposition, was reheated to temperatures within the PRZ, and cooled immediately before deposition. Nevertheless, it is possible to adjust the pre-depositional He profile in the modeling procedure, e.g., to account for the effect of abrasion during transport. For abraded grains, the He-accumulation profile at the time of deposition falls between two endmembers (see Rahl et al., 2003): either the grains were abraded a long time before deposition and developed an α-ejection profile with respect to its present-day grain boundary, or their complete α-ejection profile was abraded very close to the time of deposition. It is therefore possible to determine a pre-depositional-age envelope for the abraded grains by using two different He-concentration profile, one with and one without α-ejection rim. (4) We assumed approximate ablation-pit positions within the grain for the laser-ablation ZHe data in Sect. 3 and placed them directly in the spherical transformations of our grains (Appendix C). Accurate measurements of the pit positions relative to the 3D grain boundaries would allow the translation of the pit volume to spherical coordinates. Sampling the modeled He concentrations from this translated volume would improve the accuracy of both, the inverse- and forward-modeling steps.
4.2 Other thermochronometers
The focus of our modeling approach is on zircon –(U-Th) He double-dating, but the overall strategy can also be applied to other thermochronometers. For samples partially reset with respect to the AHe system, the combination with apatite dating can be applied in the same way. While the apatite system is more susceptible to Pb loss by thermally activated diffusion than the zircon system, its temperature-sensitivity window (closure temperature ≈350 to 570 °C; Cherniak, 2010) is much higher than that of the AHe PRZ (40 to 80 °C; Farley, 2000). Hence, the apatite age allows the identification of grains that formed or cooled from sufficiently high temperatures processes shortly before deposition. Compared to zircon, apatite is mechanically and chemically less stable (Morton, 1982; Jess et al., 2023), making it more useful for tracing the provenance and cooling histories of first-cycle sediment sources. In addition, its chemical composition is more diagnostic for source-rock lithologies (e.g., O'Sullivan et al., 2020).
Another double-dating scheme, for which partial-reset modeling holds great potential, is combined and fission-track dating, particularly in the light of the laser-ablation-based fission-track dating technique (e.g., Hasebe et al., 2004). Fission-track dating is popular for detrital thermochronology due to the time- and cost-efficient data acquisition for large samples and its compatibility with dating (e.g., Garver et al., 1999; Bernet and Garver, 2005; Chew and Donelick, 2012; Enkelmann et al., 2019b). Besides the ages, confined-track-length distributions in apatite are a powerful tool for thermal-history modeling (e.g., Green, 1988; Duddy et al., 1988; Ketcham, 2005). Still, for partially reset samples, the uncertainty about each grain's pre-depositional thermal history complicates the interpretation of AFT data (e.g., Fillon et al., 2013). A suggested solution to this problem uses the relative age of confined tracks with respect to their length for distinguishing pre- and post-depositional tracks and modeling the post-depositional thermal history (e.g., Keil et al., 1987; Jensen and Hansen, 2021; Jensen et al., 1992). However, this approach requires a large-enough number of post-depositional fission tracks, which is a potential problem for post-Paleozoic sedimentary samples or samples containing relatively U-poor apatite grains. In contrast, translating our strategy to –fission-track double-dating would allow constraining the post-depositional thermal history from apatite or zircon fission-track ages of the syn-depositional grains. For AFT samples with large numbers of confined tracks, the track lengths of the syn-depositional grains could even provide a high-resolution post-depositional thermal history.
The above discussion raises a question: (when) is modeling of partially reset detrital samples necessary? This depends first and foremost on the geological question to be addressed, e.g., if one aims to determine the cooling history of source rocks, the sediment-burial depth, or both. To determine cooling ages of source regions, relying on an undisturbed, higher-temperature thermochronometer is a viable strategy. However, this risks opening a large temporal gap (lag-time) between source-region cooling and deposition, potentially overlooking relevant lower-temperature processes. On the other hand, a fully reset low-temperature sample tracks cooling in the basin but only provides a minimum estimate for the burial temperature. Avoiding partial reset also requires additional temperature information, e.g., from stratigraphy, thermal maturation of the analyzed strata, or metamorphic grades in the source regions.
In contrast, the possibility of extracting thermal histories by partial-reset modeling allows analyzing samples with different degrees of reset, e.g., in a stratigraphic succession, across unconformities or faults, without changing chronometers. In addition, a partially reset thermochronometer is most sensitive to heating and cooling in the temperature window the sample reached after deposition. It thus offers the unique opportunity of determining the T–t history of post-depositional heating in more detail than a fully reset chronometer. It also records source cooling through relatively low temperatures, narrowing the gap between initial cooling and deposition. Still, incorporating additional temperature information from thermochronological, thermal-maturation, or sedimentological data is beneficial for partial-reset modeling, but not absolutely necessary to reconstruct the post-depositional thermal history. Finally, while mainly intended for interpreting the thermal history of partially reset samples, our modeling approach is still useful for unreset samples. Calculating pre-depositional ages based on T–t paths from lower-temperature thermochronometers allows testing the upper temperature limit of post-depositional heating: too high temperatures would move the pre-depositional model ages beyond their age.
Together with the partial-reset-modeling strategy presented in the preceding sections, we introduce the software tool PaRACAS (Partial Reset Analysis for Cooling Ages of Sources). It is available at https://doi.org/10.5281/zenodo.18248224 (Härtel, 2026) as a jupyter notebook together with the underlying Python code and an input-data template with the synthetic data from Sect. 2.
PaRACAS takes as inputs inverse-modeling results in a HeFTy-output text file (.txt) and a comma-separated text file (.csv) with the ZHe and data, their uncertainties, the ratios and the grain size. After the user specifies a selection of best-fitting T–t paths and a depositional age, PaRACAS carries out the forward modeling and calculates pre-depositional ages and likelihoods as described in Sect. 2 and Appendices A and B. It then plots the results as in Figs. 3 and 4. For ZHe data acquired by laser-ablation in-situ dating, PaRACAS allows adding He-extraction-pit sizes and their approximate positions to improve the match between measured ages and He-diffusion profiles and to determine an abrasion parameter for more accurate inverse modeling in HeFTy (see Sect. 3 and Appendix C). For samples without syn-depositional grains, PaRACAS can generate post-depositional T–t paths based on input ranges for the onset, duration, end and maximum temperature of a single heating pulse (see Sect. 4.1 and Fosdick et al., 2015). Besides ZHe data, PaRACAS also handles ZR thermochronological data, either using the selected paths from ZHe forward modeling as the input for determining pre-depositional ZR model ages as in Sect. 3, or modeling the ZR data on their own.
Plans for further development of the PaRACAS workflow include forward modeling of data from apatite dating combined with AFT or AHe dating (Sect. 4.2) and the incorporation of U-Th zoning in the diffusion models (Sect. 4.1). The jupyter notebook format and additional Python scripts also facilitate user-specific customization of the workflow.
In this paper, we describe a new modeling strategy for interpreting partially reset ZHe data from sedimentary samples using combined zircon –(U-Th) He dating on individual grains. Its main improvement over existing approaches is that it does not assume the grains' pre-depositional thermal histories. It uses the ages to find grains that crystallized at or near the time of deposition and determines the post-depositional thermal history from inverse T–t modeling based on these grains. It then proceeds by forward modeling the post-depositional history and determining pre-depositional model ages for each grain. Finally, the likelihood of the pre-depositional model ages falling into the expected interval between and depositional age is a criterion to identify pairs of plausible T–t paths and pre-depositional ages. Applying this strategy to combined and ZHe data from a Devonian sandstone from the Northern Canadian Cordillera gives results that are internally consistent and agree with existing thermochronological data. Our approach is further validated by data from the higher-temperature and thus less-reset ZR dating system and pre-depositional ZR ages match existing muscovite data from the Imperial Formation. While leveraging the thermal-history information from syn-depositional grains allows us to separate the pre- and post-depositional histories, it also limits our modeling approach to samples containing such grains. On the other hand, compared to other modeling approaches, our strategy does not require specific assumptions on the pre-depositional thermal history. In addition, calculating pre-depositional ages on a grain-by-grain basis allows to compare them to other single-grain data relevant for sediment provenance. Our approach uses a simple He-diffusion model, but other factors such as U and Th zoning, radiation damage, or grain abrasion can be integrated into the modeling procedure. While this paper focuses on zircon double-dating by the and ZHe methods or multi-dating including Raman thermochronology, the general principles of our modeling approach can be directly translated to combined apatite and AHe or AFT dating.
Our forward model for estimating the fraction of retention and the He accumulated after deposition used a radial diffusion model in spherical geometry. We first translated the dimensions of the analyzed grains to an equivalent spherical radius, using the equation of Ketcham et al. (2011) for a cylindrical shape and divided the radial profile into a discrete number of nodes. To determine the relative proportion of He produced at each radial distance from the center, we determined the α-ejection profile by Monte-Carlo simulation. The stopping distances were calculated in SRIM 2013 (Ziegler, 2013) based on disintegration energies of Haynes et al. (2014), excluding those energies occurring for <1 % of the parent nuclide's decay events. To estimate the respective contributions from the 238U, 235U and 232Th decay chains, we used the measured ratios, assuming uniform U and Th concentrations throughout the grains.
The next step was to cut and simplify the post-depositional T–t paths provided by the inverse modeling in HeFTy (v. 2.17; Ketcham, 2005, 2024). First, we interpolated the T–t paths to short (e.g., 2 Myr) isothermal segments between deposition and the present day. The lower limit of the depositional-age constraint from HeFTy was used to exclude pre-depositional cooling from the forward models. We summarized consecutive steps with small temperature differences (e.g., 5 °C) in each T–t path by integrating the temperature-dependent diffusion coefficient D (e.g., Lovera et al., 1989):
with ti being the starting time of the ith time step.
The HeFTy modeling from the syn-depositional grains allows T–t paths leading to fully reset. As such solutions are at odds with the observation of a partially reset sample, we filtered out all fully reset paths based on an estimate for the total degree of post-depositional reset. We based this estimate on Dtotal each path's T–t conditions integrated into a single time step using Eq. (A1). The remaining pre-depositional He concentration depends on the normalized step length F:
where ttotal is the total time of the thermal history and R is the equivalent spherical grain radius. The analytical equation for the ratio of He retained after the thermal history, ϕpost, is (Jost, 1952; Fechtig et al., 1961):
Figure A1 shows the decrease of ϕpost with increasing F. We identified the paths with a median F of 0.75 (ϕpost<0.3 %) among the analyzed grains as full-reset paths and set all their pre-depositional ages to zero.
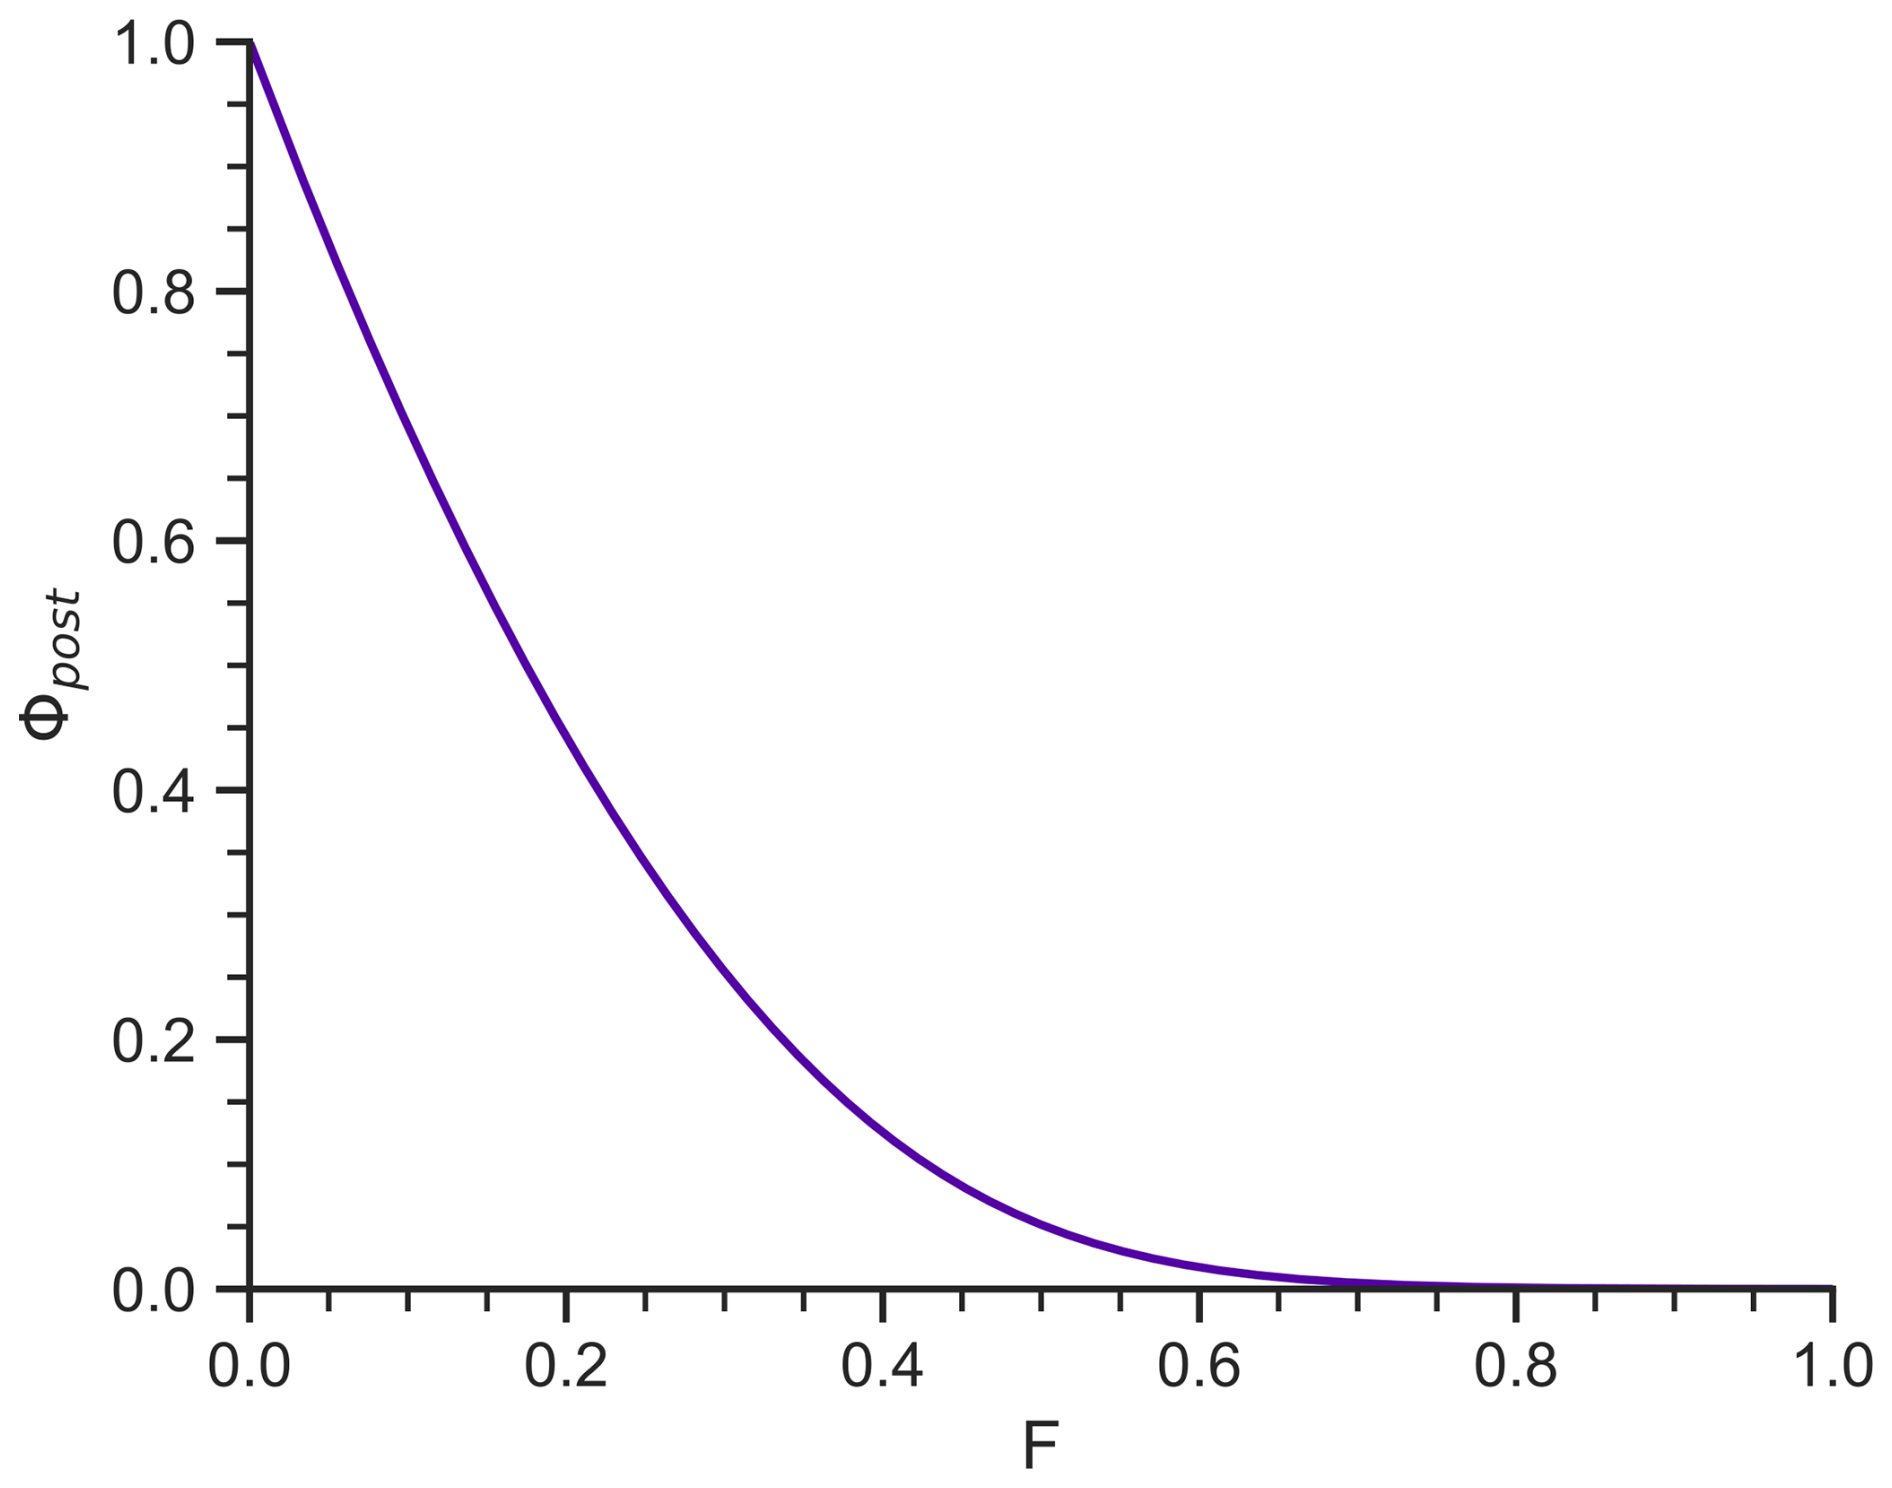
Figure A1Relationship between the post-depositional He retention ϕpost and the normalized step length F.
We determined the degree of post-depositional He retention ϕpost by forward modeling He diffusion using ttotal and Dtotal. The He concentration was determined at every node in the radial profile using the Crank–Nicolson algorithm (Crank and Nicolson, 1947) with a Neumann boundary at the center (constant concentration gradient) and a Dirichlet boundary at the grain rim (infinite He sink).
We used the kinetic parameters of Reiners et al. (2004) for non-metamict zircon, however, it is possible to use other models such as the zircon-radiation-damage-and-annealing model (ZRDAAM, Guenthner et al., 2013, 2015; Guenthner, 2021). We calculated the fraction of post-depositional retention ϕpost as the ratio of the remaining concentration Closs only to the starting concentration Cinitial. The whole-grain concentrations C are the radially weighted sums of the concentration Cr at the radial distance r from the grain center:
The weight wr at radius r is:
dr is the radial distance between the He-concentration nodes.
We modeled the amount of He accumulated during the post-depositional thermal history with He production and diffusion at each step of the simplified T–t history. The He production used the relative concentrations of the α-ejection profile scaled by the He accumulation rate depending on the changes in U and Th concentrations over geologic time. We determined the pre-depositional He concentration from the observed He concentration and the modeling results using Eq. (3) and calculated the pre-depositional model age from Eq. (4) by iteration of the effective uranium concentration (eU; Härtel and Enkelmann, 2024; their Appendix A) based on the U and Th concentrations at the time of deposition. For α-ejection correction, we scaled the final He-concentration profile against the α-ejection profile. To approximate the model-age uncertainty, we divided the observed ZHe age uncertainty by ϕpost. We tested the validity of our diffusion model against the analytical equation for volume diffusion from a spherical grain (Eq. A3) and the accumulation and age-calculation procedures against synthetic accumulation-only thermal histories.
For the ZR ages in Sect. 3, we first interpolated the HeFTy paths to isothermal segments as for the ZHe model. We applied an equivalent-time-based modeling approach (Duddy et al., 1988) similar to that of Guenthner (2021) for radiation-damage forward modeling. The principle of equivalent time assumes that future daughter loss only depends on the future T–t conditions and the current degree of reset, but not the specific past T–t history. This implies that any segment of a given thermal history can be translated to a different T–t pair that causes an equivalent degree of reset, which facilitates dealing with complicated thermal histories. Let the post-depositional history comprise k isothermal steps with temperature Ti and duration Δti. fi is the cumulative degree of fractional annealing a portion of daughters produced in the ith step for all steps ≥i. The reset duration Δτres,i is then the time necessary to reach fi by isothermal holding at Ti. fi follows from the reset function R(t,T):
Δτres,i is easily defined for the last time step k, where it simply equals the duration Δtk:
The radiation-damage produced at the second-last step k−1 underwent the combined thermal history of steps k−1 and k. Its reset duration follows from the duration of step k−1 and the equivalent time Δτeq:
Δτeq is the time needed to reach the degree of reset of the kth step R(Δtk,Tk) at temperature Tk−1:
fi then follows from Eq. (A9) and Δτres,i of each previous step:
We determined the post-depositional fraction of damage retention equals from the degree of annealing of the first time step. The post-depositional damage density Dpostdep is the scalar product of the duration vector τ, the vector f of the fractions of reset at each time step, and ρ, the vector of damage-production rates at each time step:
We calculated the pre-depositional model ZR ages from Eq. (4). For the radiation-damage modeling, we assumed that most of the lattice damage present at the time of deposition behaved as unannealed, i.e. that no significant annealing took place immediately before deposition, analogous to the assumption of an α-ejection profile (Sect. 4.1). We used the damage-annealing kinetics following the distributed-activation-energy model of Härtel et al. (2021) but other radiation-damage annealing models (e.g., Geisler et al., 2001; Ginster et al., 2019) can also be used, as long as the activation energy of the annealing process is not a function of time (Duddy et al., 1988; Rufino et al., 2023).
To evaluate the T–t paths determined by HeFTy, we calculated the path likelihood Li for the ith grain as the probability of the pre-depositional model age tp,i falling between the age and the depositional age tdep:
This likelihood is approximately the integral of a Gaussian function with the model age as mean and the model-age uncertainty (1s) as standard deviation in the limits of the and depositional age (grey-shaded area in Fig. B1).
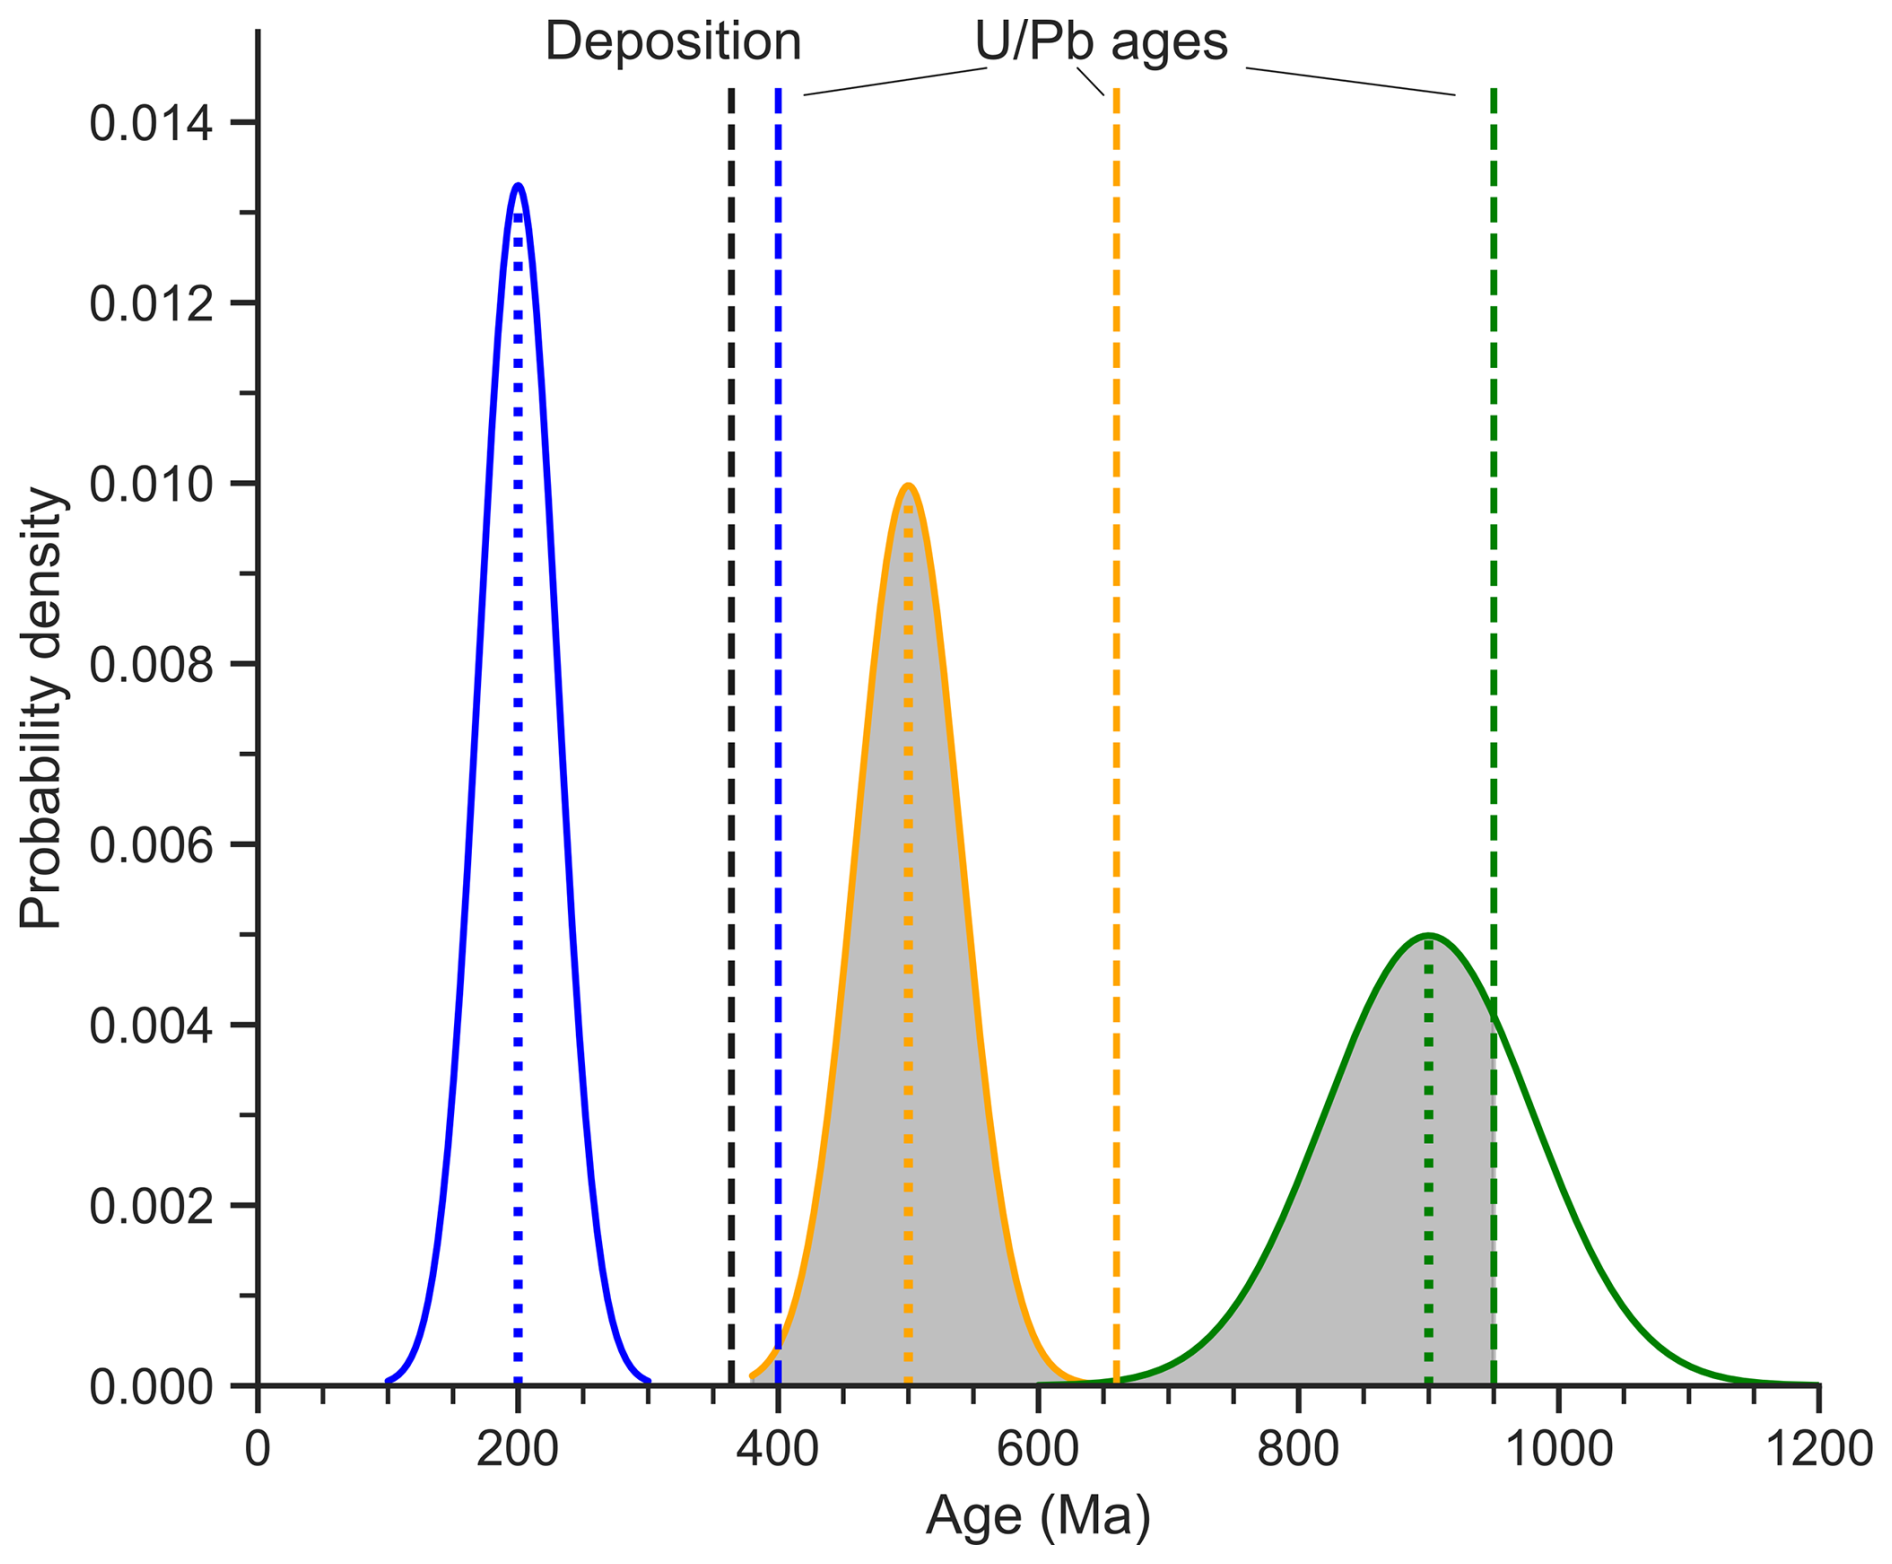
Figure B1Probability-density plot illustrating the assignment of likelihoods to model paths on three grains with Gaussian bell curves describing the pre-depositional model ages (dotted lines) and uncertainties, and the dashed lines representing the and depositional ages. Shaded areas: model-age density in the expected age envelope.
To include uncertainties on the and depositional ages, we determined the likelihoods in a Monte Carlo approach. We sampled n values (here 1 000 000) for tp,i, , and tdep from normal distributions with ages as means and 1s uncertainties as standard deviations and calculated the likelihood by dividing the number of cases, in which tp,i falls between the other two by n. For grain-thermal-history combinations, in which none of the iterations matched the expected envelope, we set the likelihood to that of half a match. This procedure for calculating the individual-grain likelihoods has several consequences: (1) it penalizes models producing pre-depositional ages outside the expected age envelope. (2) The single-grain likelihoods are relatively constant within the expected envelope, so that no pre-depositional cooling age within the allowed range is preferred over another. (3) The discrete lower limit of the single-grain likelihoods assigns a constant likelihood to model ages far from the expected age interval. Therefore, they lose influence on the model selection once they reach a certain distance from this envelope. We then determined the total log-likelihood LL of each T–t path as the sum of the logarithmized individual likelihoods.
To adapt our modeling strategy to the laser-ablation-based in-situ zircon (U-Th) He (ZHe) data in Sect. 3, we modified the inverse- and forward-modeling algorithms to only evaluate the part of the He-concentration profile that corresponds most closely to the position of the laser-ablation pit, from which He was extracted. In the absence of precise measurements, we determined pit positions using the following criteria: (1) we assumed spherical grains; (2) we assumed that the pits were centered on the centers of the horizontal polished grain sections; (3) for grains that were drilled through during the U and Th analysis by LA-ICP-MS, we determined the vertical position of the He-extraction pit from the distance of its floor to the bottom of the grain (see Härtel et al., 2026); (4) for the other grains, we estimated the vertical position of the pit based on the amount of material polished away during sample preparation (20 µm; Härtel et al., 2026). Based on the pit position, the grain size and the average pit shape and size (a truncated cone with a radius of 8 µm at the polished surface, pit walls at an angle of 22° to vertical, and a depth of 6.6 µm), we determined the volume distribution of the He-extraction pit in every grain as a function of the distance from the grain center by Monte-Carlo simulation.
We used this information for the inverse- and forward-modeling steps of our analysis. For the inverse modeling in HeFTy, we estimated an “abraded” parameter based on the volume distributions of the pits in the syn-depositional grains. This option in HeFTy assumes a spherical post-abrasion core. We therefore determined the size of a sphere surrounding the grain center, whose volume distribution relative to the grain center is as close to that of the ablation spot as possible. Figure C1a illustrates the volume distributions of an ablation pit (blue line; geometry as above, 10 µm distance from the grain bottom) for a grain with a spherical radius of 30 µm and an abraded core with 25 µm radius (orange line). We evaluated the misfit between the two distributions as the sum of the absolute areas between the curves (grey shaded areas). This value varies between 0 for a perfect match and 2 for two distributions that do not overlap. Figure C1b is a plot of the misfit of the ablation pit in Fig. C1a against different abraded depths for a grain with 30 µm radius. The global minimum of misfit is at about 10 µm and rapidly increases toward lower and higher values. We used the abraded portions for the minimum misfits as “abraded” values as inputs in HeFTy. For the forward modeling, we determined ϕpost and Hepost by modeling each grain and then sampling He from the concentration profiles based on the volume distributions of the He-extraction pits. We also used these volume distributions to correct the pre-depositional He concentrations for α-ejection.
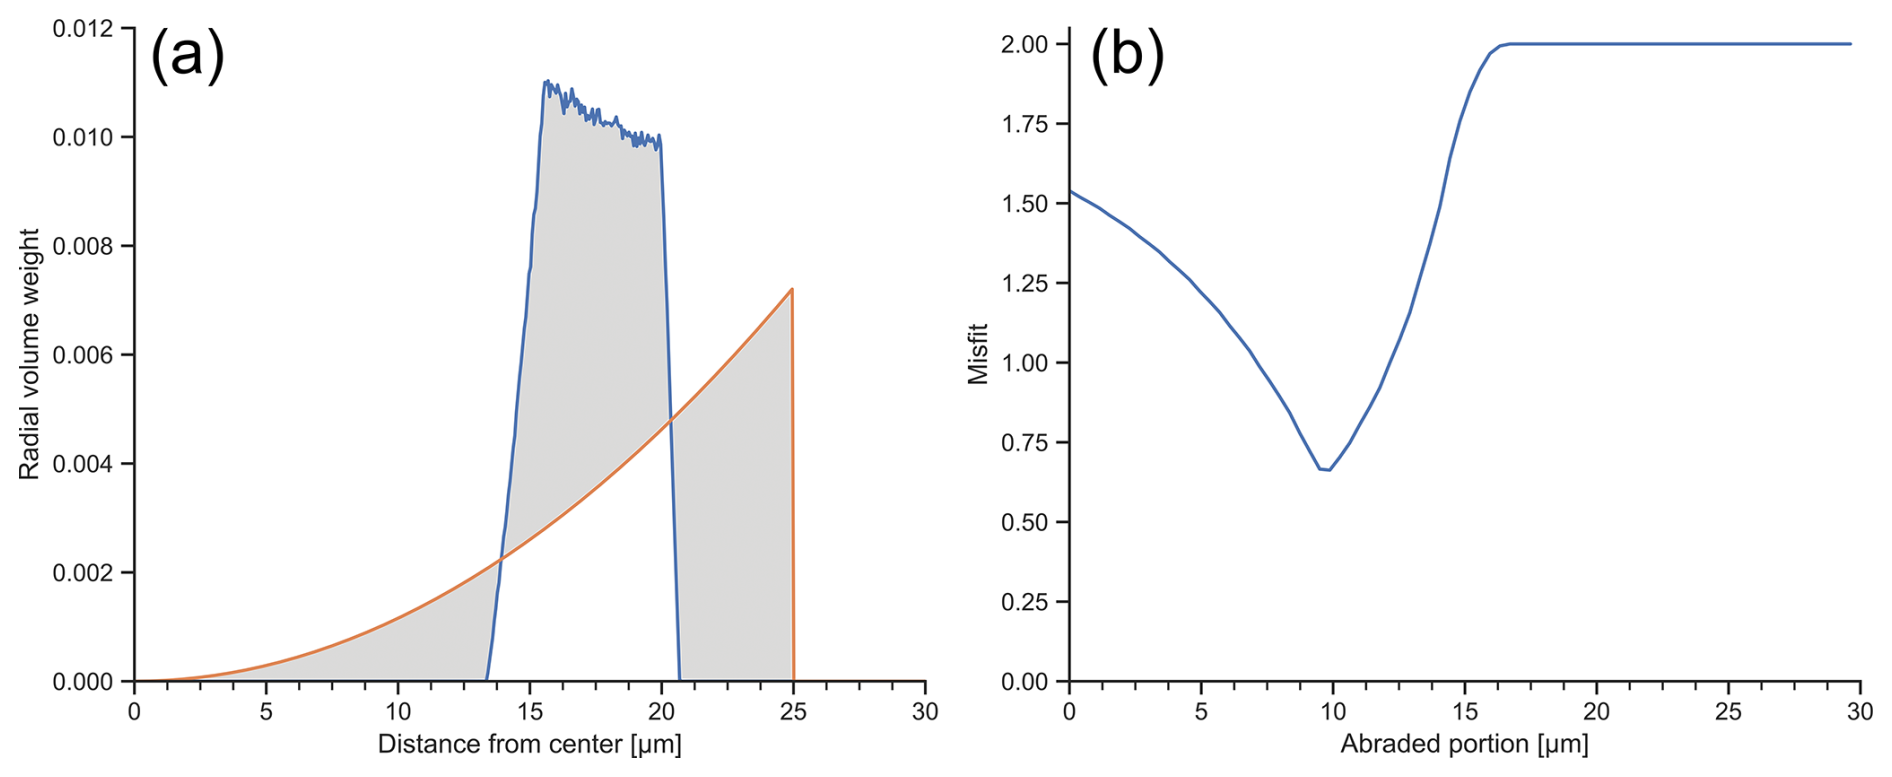
Figure C1Comparison of the volume-weighted radial positions of He-extraction pits from laser ablation and spherical cores of abraded grains. (a) Radial-volume-weight curves for the laser-ablation pit (blue) in a 30 µm radius zircon grain and the abraded core after 5 µm abrasion (orange). The shaded areas mark radial regions of misfit. (b) Plot of misfit between radial curves as in (a) as a function of the abraded portion.
The synthetic and zircon (U-Th) He data shown in Fig. 2 and their true thermal histories are available in Tables S1 and S2 in the Supplement to this article. The zircon , (U-Th) He, and Raman data in Figs. 3 and 4 are from the Supplement of Härtel et al. (2026). PaRACAS is available as a jupyter notebook at https://doi.org/10.5281/zenodo.18248224 (Härtel, 2026).
The supplement related to this article is available online at https://doi.org/10.5194/gchron-8-475-2026-supplement.
BPH, EE, and AM contributed to the conceptualization of the study. BPH and AM carried out the formal analysis. BPH developed the software. BPH and EE acquired the funding. BPH wrote the manuscript with contributions from the co-authors.
The contact author has declared that none of the authors has any competing interests.
Publisher's note: Copernicus Publications remains neutral with regard to jurisdictional claims made in the text, published maps, institutional affiliations, or any other geographical representation in this paper. The authors bear the ultimate responsibility for providing appropriate place names. Views expressed in the text are those of the authors and do not necessarily reflect the views of the publisher.
This article is part of the special issue “Technical notes on modelling thermochronologic data”. It is not associated with a conference.
We thank the reviewers Benjamin Gérard and Andrea Stevens Goddard for providing helpful comments to improve and clarify our article. We also thank the associate editor Audrey Margirier for handling the manuscript and reviews and for providing additional suggestions. BPH thanks Joel Padgett for testing the updated versions of PaRACAS.
This research has been supported by the Natural Sciences and Engineering Research Council of Canada (grant no. RGPIN-2024-03863), the donors of the American Chemical Society Petroleum Research Fund under New Directions Grant (grant no. PRF#67107-ND8), and the Deutsche Forschungsgemeinschaft (grant no. HA 9685/1-1). EE served as Principal Investigator on PRF#67107-ND8 that provided support for BPH and AM.
This paper was edited by Audrey Margirier and reviewed by Benjamin Gérard and Andrea Stevens Goddard.
Beranek, L. P., Mortensen, J. K., Lane, L. S., Allen, T. L., Fraser, T. A., Hadlari, T., and Zantvoort, W. G.: Detrital zircon geochronology of the western Ellesmerian clastic wedge, northwestern Canada: insights on Arctic tectonics and the evolution of the northern Cordilleran miogeocline, Geol. Soc. Am. Bull., 122, 1899–1911, https://doi.org/10.1130/B30120.1, 2010.
Bernet, M. and Garver, J. I.: Fission-track analysis of detrital zircon, Rev. Mineral. Geochem., 58, 205–238, https://doi.org/10.2138/rmg.2005.58.8, 2005.
Bootes, N., Enkelmann, E., and Lease, R.: Late Miocene to Pleistocene source to sink record of exhumation and sediment routing in the Gulf of Alaska from detrital zircon fission-track and U-Pb double dating, Tectonics, 38, 2703–2726, https://doi.org/10.1029/2019TC005497, 2019.
Boyce, J. W., Hodges, K. V., Olszewski, W. J., Jercinovic, M. J., Carpenter, B. D., and Reiners, P. W.: Laser microprobe (U-Th) He geochronology, Geochim. Cosmochim. Ac., 70, 3031–3039, https://doi.org/10.1016/j.gca.2006.03.019, 2006.
Carlson, W. D., Donelick, R. A., and Ketcham, R. A.: Variability of apatite fission-track annealing kinetics; I, Experimental results, Am. Miner., 84, 1213–1223, https://doi.org/10.2138/am-1999-0901, 1999.
Carter, A. and Moss, S. J.: Combined detrital-zircon fission-track and U-Pb dating: A new approach to understanding hinterland evolution, Geology, 27, 235–238, https://doi.org/10.1130/0091-7613(1999)027<0235:CDZFTA>2.3.CO;2, 1999.
Cawood, P. A., Hawkesworth, C. J., and Dhuime, B.: Detrital zircon record and tectonic setting, Geology, 40, 875–878, https://doi.org/10.1130/G32945.1, 2012.
Cecil, M. R., Saleeby, Z., Saleeby, J., and Farley, K. A.: Pliocene–Quaternary subsidence and exhumation of the southeastern San Joaquin Basin, California, in response to mantle lithosphere removal, Geosphere, 10, 129–147, https://doi.org/10.1130/GES00882.1, 2014.
Cherniak, D. J.: Diffusion in accessory minerals: zircon, titanite, apatite, monazite and xenotime, Rev. Mineral. Geochem., 72, 827–869, https://doi.org/10.2138/rmg.2010.72.18, 2010.
Chew, D. and Donelick, R. A.: Combined apatite fission track and U-Pb dating by LA-ICP-MS and its application in apatite provenance analysis, in: Quantitative mineralogy and microanalysis of sediments and sedimentary rocks, edited by: Sylvester, P., Mineralogical Association of Canada, Sudbury, 219–247, https://doi.org/10.3749/9780921294825.ch12, 2012.
Corfu, F., Hanchar, J. M., Hoskin, P. W. O., and Kinny, P.: Atlas of zircon textures, Rev. Mineral. Geochem., 53, 469–500, https://doi.org/10.2113/0530469, 2003.
Crank, J. and Nicolson, P.: A practical method for numerical evaluation of solutions of partial differential equations of the heat-conduction type, Math. Proc. Camb. Phil. Soc., 43, 50–67, https://doi.org/10.1017/S0305004100023197, 1947.
Daniels, B. G., Auchter, N. C., Hubbard, S. M., Romans, B. W., Matthews, W. A., and Stright, L.: Timing of deep-water slope evolution constrained by large-n detrital volcanic ash zircon geochronology, Cretaceous Magallanes Basin, Chile, Geol. Soc. Am. Bull., 130, 438–454, https://doi.org/10.1130/B31757.1, 2018.
Danišik, M.: Integration of fission-track thermochronology with other geochronologic methods on single crystals, in: Fission-track thermochronology and its application to Geology, edited by: Malusà, M. G. and Fitzgerald, P. G., Springer International Publishing, New York, 93–108, https://doi.org/10.1007/978-3-319-89421-8_5, 2019.
Duddy, I. R., Green, P. F., and Laslett, G. M.: Thermal annealing of fission tracks in apatite 3. Variable temperature behaviour, Chem. Geol., 73, 25–38, https://doi.org/10.1016/0168-9622(88)90019-X, 1988.
Dunkl, I., Mallis, F., Lünsdorf, N. K., Schönig, J., and von Eynatten, H.: Zircon U-Pb-He double dating of modern sands from the Inn River catchment: assessing resolution and potential in a complex orogenic setting, J. Geophys. Res.-Earth Surf., 129, e2023JF007360, https://doi.org/10.1029/2023JF007360, 2024.
Enkelmann, E., Garver, J. I., and Pavlis, T. L.: Rapid exhumation of ice-covered rocks of the Chugach–St. Elias orogen, Southeast Alaska, Geology, 36, 915–918, https://doi.org/10.1130/G2252A.1, 2008.
Enkelmann, E., Ridgway, K. E., Carignano, C., and Linnemann, U.: A thermochronometric view into an ancient landscape: tectonic setting, development, and inversion of the Paleozoic eastern Paganzo basin, Argentina, Lithosphere, 6, 93–107, https://doi.org/10.1130/L309.1, 2014.
Enkelmann, E., Finzel, E., and Arkle, J.: Deformation at the eastern margin of the Northern Canadian Cordillera: Potentially related to opening of the North Atlantic, Terra Nova, 31, 151–158, https://doi.org/10.1111/ter.12374, 2019a.
Enkelmann, E., Sanchez-Lohff, S. K., and Finzel, E. S.: Detrital zircon double-dating of forearc basin strata reveals magmatic, exhumational, and thermal history of sediment source areas, Geol. Soc. Am. Bull., 131, 1364–1384, https://doi.org/10.1130/B35043.1, 2019b.
Evans, N. J., McInnes, B. I. A., McDonald, B., Danišik, M., Becker, T., Vermeesch, P., Shelley, M., Marillo-Sialer, E., and Patterson, D. B.: An in situ technique for (U-Th-Sm) He and U-Pb double dating, J. Anal. Atom. Spectrom., 30, 1636–1645, https://doi.org/10.1039/C5JA00085H, 2015.
Falkowski, S., Enkelmann, E. Drost, K., Pfänder, J. A., Stübner, K., and Ehlers, T. A.: Cooling history of the St. Elias syntaxis, southeast Alaska, revealed by geo- and thermochronology of cobble-size glacial detritus, Tectonics, 35, 447–468, https://doi.org/10.1002/2015TC004086, 2016.
Farley, K. A.: Helium diffusion from apatite: General behavior as illustrated by Durango fluorapatite, J. Geophys. Res.-Sol. Ea., 105, 2903–2914, https://doi.org/10.1029/1999JB900348, 2000.
Fechtig, H., Gentner, W., and Kalbitzer, S.: Argonbestimmungen an Kaliummineralien – IX: Messungen zu den verschiedenen Arten der Argondiffusion, Geochim. Cosmochim. Ac., 25, 297–311, https://doi.org/10.1016/0016-7037(61)90064-3, 1961.
Fillon, C., Gautheron, C., and van der Beek, P.: Oligocene–Miocene burial and exhumation of the Southern Pyrenean foreland quantified by low-temperature thermochronology, J. Geol. Soc. London, 170, 67–77, https://doi.org/10.1144/jgs2012-051, 2013.
Flowers, R. M., Ketcham, R. A., Shuster, D. L., and Farley, K. A.: Apatite (U-Th) He thermochronometry using a radiation damage accumulation and annealing model, Geochim. Cosmochim. Ac., 73, 2347–2365, https://doi.org/10.1016/j.gca.2009.01.015, 2009.
Flowers, R. M., Ketcham, R. A., Enkelmann, E., Gautheron, C., Reiners, P. W., Metcalf, J. R., Danišik, M., Stockli, D. F., and Brown, R. W.: (U-Th) He chronology: Part 2. Considerations for evaluating, integrating, and interpreting conventional individual aliquot data, Geol. Soc. Am. Bull., 135, 137–161, https://doi.org/10.1130/B36268.1, 2022.
Forte, A. M., Gutterman, K. R., van Soest, M. C., and Gallagher, K.: Building a young mountain range: insights into the growth of the Greater Caucasus Mountains from detrital zircon (U-Th) He thermochronology and 10Be erosion rates, Tectonics, 41, e2021TC006900, https://doi.org/10.1029/2021TC006900, 2022.
Fosdick, J. C., Grove, M., Graham, S. A., Hourigan, J. K., Lovera, O., and Romans, B. W.: Detrital thermochronologic record of burial heating and sediment recycling in the Magallanes foreland basin, Patagonian Andes, Basin Res., 27, 546–572, https://doi.org/10.1111/bre.12088, 2015.
Fosdick, J. C., Stevens Goddard, A. L., Mackaman-Lofland, C., Lossada, A. C., Rodríguez, M. P., and Carrapa, B.: Eocene exhumation of the High Andes at ∼30° S differentiated by detrital multimethod U-Pb-He thermochronology, Geology, 52, 678–682, https://doi.org/10.1130/G52272.1, 2024.
Fox, M., Dai, J.-G., and Carter, A.: Badly behaved detrital (U-Th) He ages: problems with He diffusion models or geological models?, Geochem. Geophys. Geosys., 20, 2418–2432, https://doi.org/10.1029/2018GC008102, 2019.
Gallagher, K.: Transdimensional inverse thermal history modeling for quantitative thermochronology, J. Geophys. Res., 117, B02408, https://doi.org/10.1029/2011JB008825, 2012.
Garver, J. I., Brandon, M. T., Roden-Tice, M., and Kamp, P. J. J.: Exhumation history of orogenic highlands determined by detrital fission-track thermochronology, in: Exhumation processes: normal faulting, ductile flow and erosion, edited by: Ring, U., Brandon, M. T., Lister, G. S., and Willett, S. D., Geol. Soc. Spec. Pub., 154, London, 283–304, https://doi.org/10.1144/GSL.SP.1999.154.01.13, 1999.
Geisler, T., Pidgeon, R. T., Van Bronswijk, W., and Pleysier, R.: Kinetics of thermal recovery and recrystallization of partially metamict zircon: a Raman spectroscopic study, Eur. J. Mineral., 13, 1163–1176, https://doi.org/10.1127/0935-1221/2001/0013-1163, 2001.
Gérard, B., Robert, X., Grujic, D., Gautheron, C., Audin, L., Bernet, M., and Balvay, M.: Zircon (U-Th) He closure temperature lower than apatite thermochronometric systems: reconciliation of a paradox, Minerals, 12, 145, https://doi.org/10.3390/min12020145, 2022.
Ginster, U., Reiners, P. W., Nasdala, L., and Chanmuang N. C.: Annealing kinetics of radiation damage in zircon, Geochim. Cosmochim. Ac., 249, 225–246, https://doi.org/10.1016/j.gca.2019.01.033, 2019.
Grabowski, D., Enkelmann, E., and Ehlers, T. A.: Spatial extend of rapid denudation in the glaciated St. Elias syntaxis region, SE Alaska, J. Geophys. Res.-Earth Surf., 118, 1–18, https://doi.org/10.1002/jgrf.20136, 2013.
Green, P. F.: The relationship between track shortening and fission track age reduction in apatite: combined influences of inherent instability, annealing anisotropy, length bias and system calibration, Earth Planet. Sc. Lett., 89, 335–352, https://doi.org/10.1016/0012-821X(88)90121-5, 1988.
Guenthner, W. R.: Implementation of an alpha damage annealing model for zircon (U-Th) He thermochronology with comparison to a zircon fission track annealing model, Geochem. Geophys. Geosys., 22, GC008757, https://doi.org/10.1029/2019GC008757, 2021.
Guenthner, W. R., Reiners, P. W., Ketcham, R. A., Nasdala, L., and Giester, G.: Helium diffusion in natural zircon: radiation damage, anisotropy, and the interpretation of zircon (U-Th) He thermochronology, Am. J. Sci., 313, 145–198, https://doi.org/10.2475/03.2013.01, 2013.
Guenthner, W. R., Reiners, P. W., DeCelles, P. G., and Kendall, J.: Sevier belt exhumation in central Utah constrained from complex zircon (U-Th) He data sets: Radiation damage and He inheritance effects on partially reset detrital zircons, Geol. Soc. Am. Bull., 127, 323–348, https://doi.org/10.1130/B31032.1, 2015.
Hadlari, T., Tylosky, S. A., Lemieux, Y., Zantvoort, W. G., and Catuneanu, O.: Slope and submarine fan turbidite facies of the Upper Devonian Imperial Formation, Northern Mackenzie Mountains, NWT, Bull. Can. Energy Geosci., 57, 192–208, https://doi.org/10.2113/gscpgbull.57.2.192, 2009.
Harrison, T. M. and Zeitler, P. K.: Fundamentals of noble gas thermochronometry, Rev. Mineral. Geochem., 58, 123–149, https://doi.org/10.2138/rmg.2005.58.5, 2005.
Härtel, B.: PaRACAS (Partial Reset Analysis for Cooling Ages of Sources) (v1.02), Zenodo [code], https://doi.org/10.5281/zenodo.18248224, 2026.
Härtel, B. and Enkelmann, E.: The daughter–parent plot: a tool for analyzing thermochronological data, Geochronology, 6, 429–448, https://doi.org/10.5194/gchron-6-429-2024, 2024.
Härtel, B., Jonckheere, R., Wauschkuhn, B., and Ratschbacher, L.: The closure temperature(s) of zircon Raman dating, Geochronology, 3, 259–272, https://doi.org/10.5194/gchron-3-259-2021, 2021.
Härtel, B., Enkelmann, E., and Whelan, E.: Combined zircon -(U-Th) He-Raman dating, Chem. Geol., 713, 123435, https://doi.org/10.1016/j.chemgeo.2026.123435, 2026.
Hasebe, N., Barbarand, J., Jarvis, K., Carter, A., and Hurford, A. J.: Apatite fission-track chronometry using laser ablation icp-ms, Chem. Geol., 207, 135–145, https://doi.org/10.1016/j.chemgeo.2004.01.007, 2004.
Haynes, W. M., Lide, D. R., and Bruno, T. J. (Eds.): CRC Handbook of Chemistry and Physics, 95th Edition, CRC Press, Taylor and Francis Group, Boca Raton, Florida, 2666 pp., ISBN 978-1482208672, 2014.
Hurley, P. M., Larsen, E. S., and Gottfried, D.: Comparison of radiogenic helium and lead in zircon, Geochim. Cosmochim. Ac., 9, 98–102, https://doi.org/10.1016/0016-7037(56)90060-6, 1956.
Issler, D. R., Grist, A. M., and Stasiuk, L. D.: Post-Early Devonian thermal constraints on hydrocarbon source rock maturation in the Keele Tectonic Zone, Tulita area, NWT, Canada, from multi-kinetic apatite fission track thermochronology, vitrinite reflectance and shale compaction, Bull. Can. Pet. Geol., 53, 405–431, https://doi.org/10.2113/53.4.405, 2005.
Jensen, P. K. and Hansen, K.: Deconvolution of fission-track length distributions and its application to dating and separating pre- and post-depositional components, Geochronology, 3, 561–575, https://doi.org/10.5194/gchron-3-561-2021, 2021.
Jensen, P. K., Hansen, K., and Kunzendorf, H.: A numerical model for the thermal history of rocks based on confined horizontal fission tracks, Nucl. Tracks Radiat. Meas., 20, 349–359, https://doi.org/10.1016/1359-0189(92)90064-3, 1992.
Jess, S., Enkelmann, E., and Matthews, W.: The effect of sediment storage in glaciated catchments on multimineral detrital geochronology: deciphering conflicting zircon and apatite U-Pb dates, J. Geophys. Res.-Earth Surf., 128, e2022JF006738, https://doi.org/10.1029/2022JF006738, 2023.
Jost, W.: Diffusion in solids, liquids and gases, Academic Press Inc., New York, 558 p.p, ISBN 978-0123907509, 1952.
Keil, R., Pahl, M., and Bertagnolli, E.: Thermal history and length distribution of fission tracks: Part II, Nucl. Tracks Radiat. Meas.,13, 25–33, https://doi.org/10.1016/1359-0189(87)90004-5, 1987.
Ketcham, R. A.: Forward and inverse modeling of low-temperature thermochronometry data, Rev. Mineral. Geochem., 58, 275–314, https://doi.org/10.2138/rmg.2005.58.11, 2005.
Ketcham, R. A.: Thermal history inversion from thermochronometric data and complementary information: New methods and recommended practices, Chem. Geol., 653, 122042, https://doi.org/10.1016/j.chemgeo.2024.122042, 2024.
Ketcham, R. A., Gautheron, C., and Tassan-Got, L.: Accounting for long alpha-particle stopping distances in (U-Th-Sm) He geochronology: refinement of the baseline case, Geochim. Cosmochim. Ac., 75, 7779–7791, https://doi.org/10.1016/j.gca.2011.10.011, 2011.
Lemieux, Y., Hadlari, T., and Simonetti, A.: Detrital zircon geochronology and provenance of Devono-Mississippian strata in the northern Canadian Cordilleran miogeocline, Can. J. Earth Sci., 48, 515–541, https://doi.org/10.1139/E10-056, 2011.
Lovera, O. M., Richter, F. M., and Harrison, T. M.: The thermochronometry for slowly cooled samples having a distribution of diffusion domain sizes, J. Geophys. Res., 94, 17917–17935, https://doi.org/10.1029/JB094iB12p17917, 1989.
Malusà, M. G. and Fitzgerald, P. G.: The geologic interpretation of the detrital thermochronology record within a stratigraphic framework, with examples from the European Alps, Taiwan and the Himalayas, Earth-Sci. Rev., 201, 103074, https://doi.org/10.1016/j.earscirev.2019.103074, 2020.
Malusà, M. G., Anfinson, O. A., and Stockli, D. F.: (Mis)identification of magmatic and exhumation ages by detrital zircon U-Pb and He double dating: a case study from the Bergell-Gonfolite system (European Alps), Chem. Geol., 606, 120970, https://doi.org/10.1016/j.chemgeo.2022.120970, 2022.
McKay, R., Enkelmann, E., Hadlari, T., Matthews, W., and Mouthereau, F.: Cenozoic exhumation history of the eastern margin of the Northern Canadian Cordillera, Tectonics, 40, e2020TC006582, https://doi.org/10.1029/2020TC006582, 2021.
Meesters, A. G. C. A. and Dunai, T. J.: Solving the production–diffusion equation for finite diffusion domains of various shapes Part II. Application to cases with α-ejection and nonhomogeneous distribution of the source, Chem. Geol., 186, 57–73, https://doi.org/10.1016/S0009-2541(01)00423-5, 2002.
Morton, A. C.: The provenance and diagenesis of Palaeogene sandstones of southeast England as indicated by heavy mineral analysis, Proc. Geol. Assoc., 93, 263–274, https://doi.org/10.1016/S0016-7878(82)80003-5, 1982.
O'Sullivan, G., Chew, D., Kenny, G., Henrichs, I., and Mulligan, D.: The trace element composition of apatite and its application to detrital provenance, Earth-Sci. Rev., 201, 103044, https://doi.org/10.1016/j.earscirev.2019.103044, 2020.
Powell, J. and Schneider, D. A.: Preliminary results of detrital muscovite 40Ar 39Ar geochronology from the eastern Mackenzie Mountains and Mackenzie Plain, Northwest Territories, Geological Survey of Canada, Current Research, 2013–2018, 20, Natural Resources Canada, https://doi.org/10.4095/292712, 2013.
Powell, J. W., Schneider, D., Stockli, D., and Fallas, K.: Zircon (U-Th) He thermochronology of Neoproterozoic strata from the Mackenzie Mountains, Canada: Implications for the Phanerozoic exhumation and deformation history of the northern Canadian Cordillera, Tectonics, 35, 663–689, https://doi.org/10.1002/2015TC003989, 2016.
Powell, J. W., Issler, D. R., Schneider, D. A., Fallas, K. M., and Stockli, D. F.: Thermal history of the Mackenzie Plain, Northwest Territories, Canada: Insights from low-temperature thermochronology of the Devonian Imperial Formation, Geol. Soc. Am. Bull., 132, 767–783, https://doi.org/10.1130/B35089.1, 2020.
Rahl, J. M., Reiners, P. W., Campbell, I. H., Nicolescu, S., and Allen, C. M.: Combined single-grain (U-Th) He and dating of detrital zircons from the Navajo Sandstone, Utah, Geology, 31, 761–764, https://doi.org/10.1130/G19653.1, 2003.
Rahl, J. M., Haines, S. H., and van der Pluijm, B. A.: Links between orogenic wedge deformation and erosional exhumation: Evidence from illite age analysis of fault rock and detrital thermochronology of syn-tectonic conglomerates in the Spanish Pyrenees, Earth Planet. Sc. Lett., 307, 180–190, https://doi.org/10.1016/j.epsl.2011.04.036, 2011.
Reiners, P. W.: Zircon (U-Th) He thermochronometry, Rev. Mineral. Geochem., 58, 151–179, https://doi.org/10.2138/rmg.2005.58.6, 2005.
Reiners, P. W. and Farley, K. A.: Influence of crystal size on apatite (U-Th) He thermochronology: an example from the Bighorn Mountains, Wyoming, Earth Planet. Sc. Lett., 188, 413–420, https://doi.org/10.1016/S0012-821X(01)00341-7, 2001.
Reiners, P. W., Spell, T. L., Nicolescu, S., and Zanetti, K. A.: Zircon (U-Th) He thermochronometry: He diffusion and comparisons with dating, Geochim. Cosmochim. Ac., 68, 1857–1887, https://doi.org/10.1016/j.gca.2003.10.021, 2004.
Reiners, P. W., Campbell, I. H., Nicolescu, S., Allen, C. M., Hourigan, J. K., Garver, J. I., Mattinson, J. M., and Cowan, D. S.: (U-Th)/(He-Pb) double dating of detrital zircons, Am. J. Sci., 305, 259–311, https://doi.org/10.2475/ajs.305.4.259, 2005.
Resentini, A., Malusà, M. G., Favaro, S., Longhi, M., Tiepolo, M., Villa, I. M., and Zanchetta, S.: Bedrock testing of zircon annealing for detrital provenance studies: Raman and U-Pb analysis in the Adamello batholith (Southern Alps, Italy), Chem. Geol., 715, 123486, https://doi.org/10.1016/j.chemgeo.2026.123486, 2026.
Rufino, M., Lixandrão-Filho, A. L., and Guedes, S.: A reappraisal of the principle of equivalent time based on physicochemical methods, Chem. Geol., 627, 121459, https://doi.org/10.1016/j.chemgeo.2023.121459, 2023.
Satopää, V., Albrecht, J., Irwin, D., and Raghavan, B.: Finding a “kneedle” in a haystack: Detecting knee points in system behavior, in: Proceedings of the 31st International Conference on Distributed Computing Systems, Minneapolis, Minnesota, June 2011, Workshops, 166–171, https://doi.org/10.1109/ICDCSW.2011.20, 2011.
Saylor, J. E., Stockli, D. F., Horton, B. K., Nie, J., and Mora, A.: Discriminating rapid exhumation from syndepositional volcanism using detrital zircon double dating: Implications for the tectonic history of the Eastern Cordillera, Colombia, Geol. Soc. Am. Bull., 124, 762–779, https://doi.org/10.1130/B30534.1, 2012.
Spalding, J., Powell, J. W., Schneider, D. A., and Fallas, K. M.: Thermal history of the Peel Plateau, northern Canadian Cordillera, resolved through multikinetic apatite fission-track dating, Mar. Pet. Geol., 155, 106358, https://doi.org/10.1016/j.marpetgeo.2023.106358, 2023.
Stevens Goddard, A. L., Black, S. R., Balgord, E. A., Anderson, Z. W., Leary, R. J., Thurston, O. G., and Yonkee, W. A.: Detrital thermochronology histories preserved in Paleogene strata of Utah (USA) provide distant records of Paleozoic Alleghanian orogenesis and sediment dispersal, Geology, 53, 217–221, https://doi.org/10.1130/G52736.1, 2024.
Sundell, K. E. and Saylor, J. E.: Two-dimensional quantitative comparison of density distributions in detrital geochronology and geochemistry, Geochem. Geophys. Geosys., 22, e2020GC009559, https://doi.org/10.1029/2020GC009559, 2021.
Tripathy-Lang, A., Hodges, K. V., Monteleone, B. D., and van Soest, M. C.: Laser (U-Th) He thermochronology of detrital zircons as a tool for studying surface processes in modern catchments, J. Geophys. Res.-Earth Surf., 118, 1333–1341, https://doi.org/10.1002/jgrf.20091, 2013.
Vermeesch, P., Sherlock, S. C., Roberts, N. M. W., and Carter, A.: A simple method for in-situ U-Th-He dating, Geochim. Cosmochim. Ac., 79, 140–147, https://doi.org/10.1016/j.gca.2011.11.042, 2012.
von Eynatten, H. and Dunkl, I.: Assessing the sediment factory: The role of single grain analysis, Earth-Sci. Rev., 115, 97–120, https://doi.org/10.1016/j.earscirev.2012.08.001, 2012.
Yonkee, W. A., Eleogram, B., Wells, M. L., Stockli, D. F., Kelley, S., and Barber, D. E.: Fault slip and exhumation history of the Willard thrust sheet, Sevier fold-and-thrust belt, Utah: relations to wedge propagation, hinterland uplift, and foreland basin sedimentation, Tectonics, 38, 2850–2893, https://doi.org/10.1029/2018TC005444, 2019.
Zawacki, E. E., van Soest, M. C., Hodges, K. V., Scott, J. J., Barboni, M., Strecker, M. R., Feibel, C. S., Campisano, C. J., and Arrowsmith, J. R.: Sediment provenance and silicic volcano-tectonic revolution of the northern East-African Rift System from and (U-Th) He laser ablation double dating of detrital zircons, Earth Planet. Sc. Lett., 580, 117375, https://doi.org/10.1016/j.epsl.2022.117375, 2024.
Ziegler, J. F.: SRIM – The Stopping and Range of Ions in Matter, http://www.srim.org (last access: 25 April 2026), 2013.
- Abstract
- Introduction
- Interpretation strategies for partially reset samples using combined zircon –(U-Th) He dating
- Example: zircon –(U-Th) He–Raman data from a Devonian sandstone, Northern Canadian Cordillera
- Discussion
- Partial-reset modeling vs. unreset or fully reset samples
- PaRACAS – a jupyter notebook for partial-reset modeling
- Conclusions
- Appendix A: Model setup for pre-depositional age calculation
- Appendix B: Calculation of Likelihoods for each tested T–t path
- Appendix C: Adapting the zircon (U-Th) He diffusion model to laser-ablation-based dating
- Code and data availability
- Author contributions
- Competing interests
- Disclaimer
- Special issue statement
- Acknowledgements
- Financial support
- Review statement
- References
- Supplement
- Abstract
- Introduction
- Interpretation strategies for partially reset samples using combined zircon –(U-Th) He dating
- Example: zircon –(U-Th) He–Raman data from a Devonian sandstone, Northern Canadian Cordillera
- Discussion
- Partial-reset modeling vs. unreset or fully reset samples
- PaRACAS – a jupyter notebook for partial-reset modeling
- Conclusions
- Appendix A: Model setup for pre-depositional age calculation
- Appendix B: Calculation of Likelihoods for each tested T–t path
- Appendix C: Adapting the zircon (U-Th) He diffusion model to laser-ablation-based dating
- Code and data availability
- Author contributions
- Competing interests
- Disclaimer
- Special issue statement
- Acknowledgements
- Financial support
- Review statement
- References
- Supplement