
the Creative Commons Attribution 4.0 License.
the Creative Commons Attribution 4.0 License.
 | 15 Sep 2026

Meteoric beryllium-10 fluxes from soil inventory measurements in the East River watershed, Colorado, USA
José M. Marmolejo-Cossío

Eyal Marder
Alan J. Hidy
Meteoric beryllium-10 (10Bemet) has a wide range of applications as a geochronometer and tracer of geological processes. 10Bemet is produced in the atmosphere by cosmic rays and delivered to Earth's surface primarily via precipitation. 10Bemet is particularly suitable for quantifying surface process rates where use of in situ-produced 10Be is challenging, such as landscapes with quartz-poor bedrock. However, using 10Bemet for dating and quantifying surface process rates requires constraining depositional fluxes across space and time. Although empirical and physical models for predicting fluxes exist, the predictions can deviate substantially from measured values. Here we quantify 10Bemet flux in the East River watershed in Colorado, USA where precipitation is dominated by snowfall. We measured the 10Bemet inventory in soils on five glacial moraines 13–18 ka in age that span 700 m of elevation and calculated 10Bemet fluxes by dividing each inventory by moraine age. Inheritance-corrected fluxes range from 4.31×10⁵–1.80×10⁶ atoms cm−2 yr−1 and fluxes corrected using modeled erosional and desorption losses differ by a factor of 0.3 to 2.1. The predicted fluxes are well correlated with elevation, mean annual precipitation, mean snow depth, and snow water equivalent (R2=0.71 to 0.99). Regression models applied to gridded elevation, precipitation, snow depth, and snow water equivalent data predict watershed-averaged fluxes of 1.1×10⁶–3.8×10⁶ atoms cm−2 yr−1. Predicted fluxes from a published empirical model that estimates fluxes as a function of precipitation were 1.8–3.8 times higher than inheritance-corrected site fluxes, and 1.0 to 6.0 times higher than erosion- and desorption-corrected fluxes calculated using a profile-average desorption model. Fluxes predicted by general circulation models generally fall within the range of our empirically estimated watershed-averaged fluxes, although the degree of agreement depends on the predictor variable and whether inheritance-corrected or erosion- and desorption-corrected fluxes are used. Our results highlight both the importance of factors that drive variability in 10Bemet delivery to soils and how local calibration can improve estimates of 10Bemet flux in mountain watersheds.
- Article
(9648 KB) - Full-text XML
-
Supplement
(2557 KB) - BibTeX
- EndNote


The cosmogenic nuclide beryllium-10 (10Be) is used widely for geochronology and to quantify rates of Earth surface processes (Brown, 1984; Bierman and Nichols, 2004; Willenbring and von Blanckenburg, 2010; Granger et al., 2013). 10Be forms during high energy collisions between cosmic particles and target nuclei (Lal and Peters, 1967). 10Be produced in Earth's atmosphere (typically from N and O) is known as atmospheric, garden variety, or meteoric 10Be (10Bemet), whereas in situ-produced 10Be (10Bein situ) is formed in mineral lattices at and near Earth's surface. Production rates of 10Bein situ are on the order of a few to tens of atoms g−1 yr−1 in quartz (Gosse and Phillips, 2001; Borchers et al., 2016). In contrast, 10Bemet is generated at orders of magnitude higher rates, with a global-averaged flux in excess of 1 million atoms cm−2 yr−1(Monaghan et al., 1986; McHargue and Damon, 1991). Prior to its deposition on Earth's surface by precipitation or dry fallout, 10Bemet resides in the stratosphere and troposphere for 2 years and 55 d, respectively (Yamagata et al., 2019). Hence global circulation transports 10Bemet from the site where it is produced in the atmosphere prior to its deposition (Field et al., 2006; Heikkilä et al., 2008). Once delivered to Earth's surface, 10Bemet adsorbs to and is co-precipitated on mineral surfaces, hence the highest concentrations are associated with secondary minerals and fine-grained particles with high surface areas (e.g., Graly et al., 2010). 10Bemet is partitioned with the solid phase at approximately neutral pH values (You et al., 1989). 10Bemet is thought to be retained in soils where pH is (Graly et al., 2010), but laboratory experiments indicate pH 6 soils are more retentive than pH 4 soils and that retention also varies as a function of the type of organic compounds present (Boschi and Willenbring, 2016a, b). 10Bemet may be lost from upper soil horizons where low pH leads to leaching (Dixon et al., 2018), where clay minerals or humic material with adsorbed Be are translocated to greater depth (Pavich et al., 1984; Jagercikova et al., 2015), and where the surface of the soil has been eroded (Harden et al., 2002). Hence soil 10Bemet inventories depend on a variety of factors, including the local delivery rate, landform age, degree of chemical weathering, soil pH, and erosion rate (e.g., Graly et al., 2010; Willenbring and von Blanckenburg, 2010).
The high production rates, which allow 10BeBe ratios to be readily measured via accelerator mass spectrometry (AMS), the wide range of soils and regolith where 10Bemet is retained, and – unlike 10Bein situ – the ability to be measured in non-quartz-bearing materials has allowed 10Bemet to be used widely as a geochronometer and tracer of Earth surface processes (e.g., Brown, 1987a, b; Graly et al., 2010; Willenbring and von Blanckenburg, 2010). For example, 10Bemet has been used to date terraces and moraines (Tsai et al., 2008; Egli et al., 2010; Dünforth et al., 2012), determine rock-to-soil production rates (Monaghan et al., 1992; McKean et al., 1993; Jungers et al., 2009), quantify soil residence times (Monaghan et al., 1983; Bacon et al., 2012; Foster et al., 2015), determine earthflow velocities (Mackey et al., 2009), trace sediment through hillslopes and fluvial systems (Brown et al., 1988; Reusser and Bierman, 2010; West et al., 2014; Campforts et al., 2016), and, when coupled with 9Be measurements, to quantify watershed-scale denudation rates and chemical weathering (von Blanckenburg et al., 2012; Wittmann et al., 2015; Dannhaus et al., 2018; Portenga et al., 2019; Deng et al., 2020b, 2021b). However, a requirement for using 10Bemet for dating and quantifying surface process rates is that the deposition rate or flux of 10Bemet (Fmet, atoms cm−2 yr−1) to the study area is known.
Numerous efforts have been made to measure or predict Fmet at local to global spatial scales and over annual to millennial timescales (Willenbring and von Blanckenburg, 2010; Graly et al., 2011). Direct measurement of 10Bemet concentrations in precipitation has been used to quantify 10Bemet flux at point scales and short timescales to develop empirical relations that predict Fmet as a function of precipitation rate or latitude (Brown et al., 1989; Monaghan et al., 1986; Raisbeck et al., 1981; Graham et al., 2003; Graly et al., 2011; Willenbring and von Blanckenburg, 2010). Nuclide production functions (e.g., Lal and Peters, 1967; Masarik and Beer, 1999) are coupled with general circulation models (GCM) to simulate global scale spatial and temporal patterns of Fmet as a function of geomagnetic field strength, solar activity, atmospheric circulation, and precipitation (Field et al., 2006; Heikkilä et al., 2008; Heikkilä and von Blanckenburg, 2015; Panovska et al., 2023; Zheng et al., 2021, 2024). Millennial-averaged values of Fmet can be inferred from soils by measuring the 10Bemet inventory (Imet, atoms cm−2) and dividing the inventory by landform age (e.g., Egli et al., 2010; Reusser et al., 2010; Graly et al., 2011; Deng et al., 2021a).
However, there is often disagreement between Fmet values determined from soil inventories, global-scale physical models, and precipitation-based empirical models (Ouimet et al., 2015; Deng et al., 2020a; Krone et al., 2024). Substantial variability in Fmethas been documented at spatial scales smaller than the grid cell size (often several hundred km) of many GCMs (Ouimet et al., 2015; Clow et al., 2020; Deng et al., 2020a). The discrepancies and spatial variability likely stem from temporal and spatial fluctuations in 10Bemet production, atmospheric transport, and precipitation (Monaghan et al., 1986; Graham 2003; Jordan et al., 2003; Deng et al., 2020b; Krone et al., 2024). Hence, it is often desirable to locally-calibrate Fmet prior to using 10Bemetto quantify surface process rates (e.g., Reusser et al., 2010; Ouimet et al., 2015; Deng et al., 2021a). Local-scale calibration is particularly important in mountainous settings, where microclimate variability can cause 10Bemet inventories and fluxes to vary over short distances (Ouimet et al., 2015). Here we quantify the 10Bemet flux at sites throughout the East River watershed, near Crested Butte, Colorado, USA (Fig. 1), a site of intensive research on the physical and biogeochemical drivers of watershed function (Hubbard et al., 2018). We measure 10Bemet inventories on independently dated glacial moraines, assess local-scale influences on 10Bemet flux, model potential losses of 10Bemet due to erosion and desorption, and compare 10Bemet flux measurements against predictions from empirical and physical models to evaluate the spatial variability and predictability of 10Bemet fluxes in alpine environments.
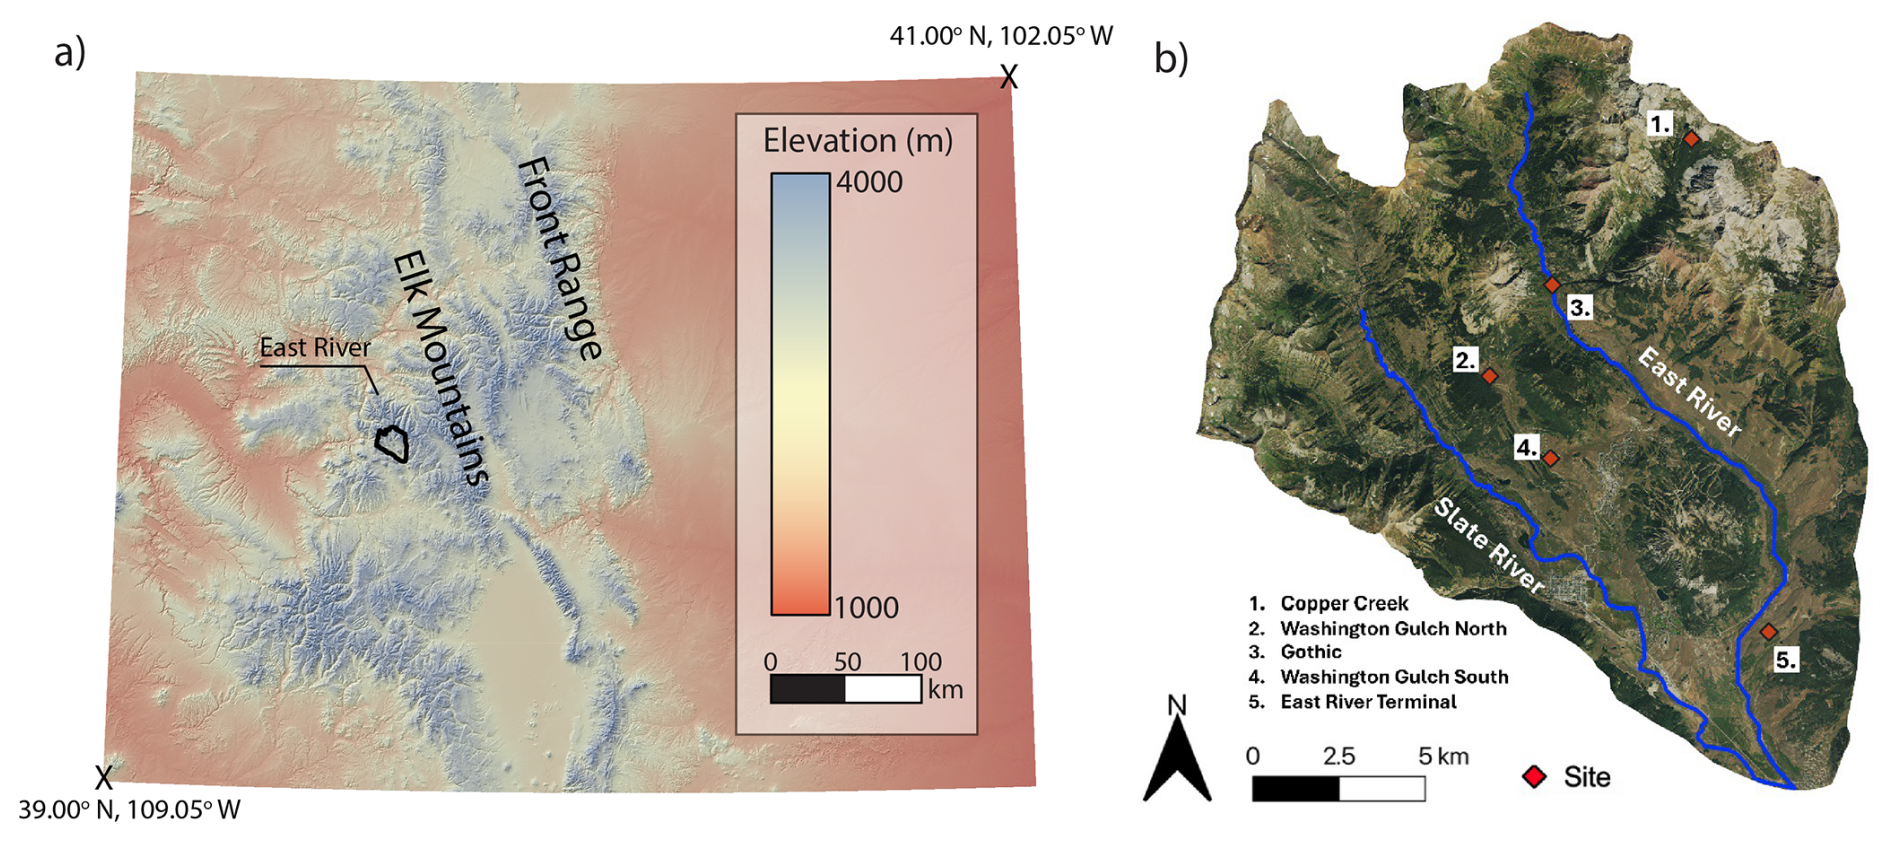
Figure 1(a) Digital elevation model (DEM) of Colorado, USA showing the location of East River watershed. (b) Image of the East River watershed showing locations (red diamonds) where soil 10Bemet inventories were measured.
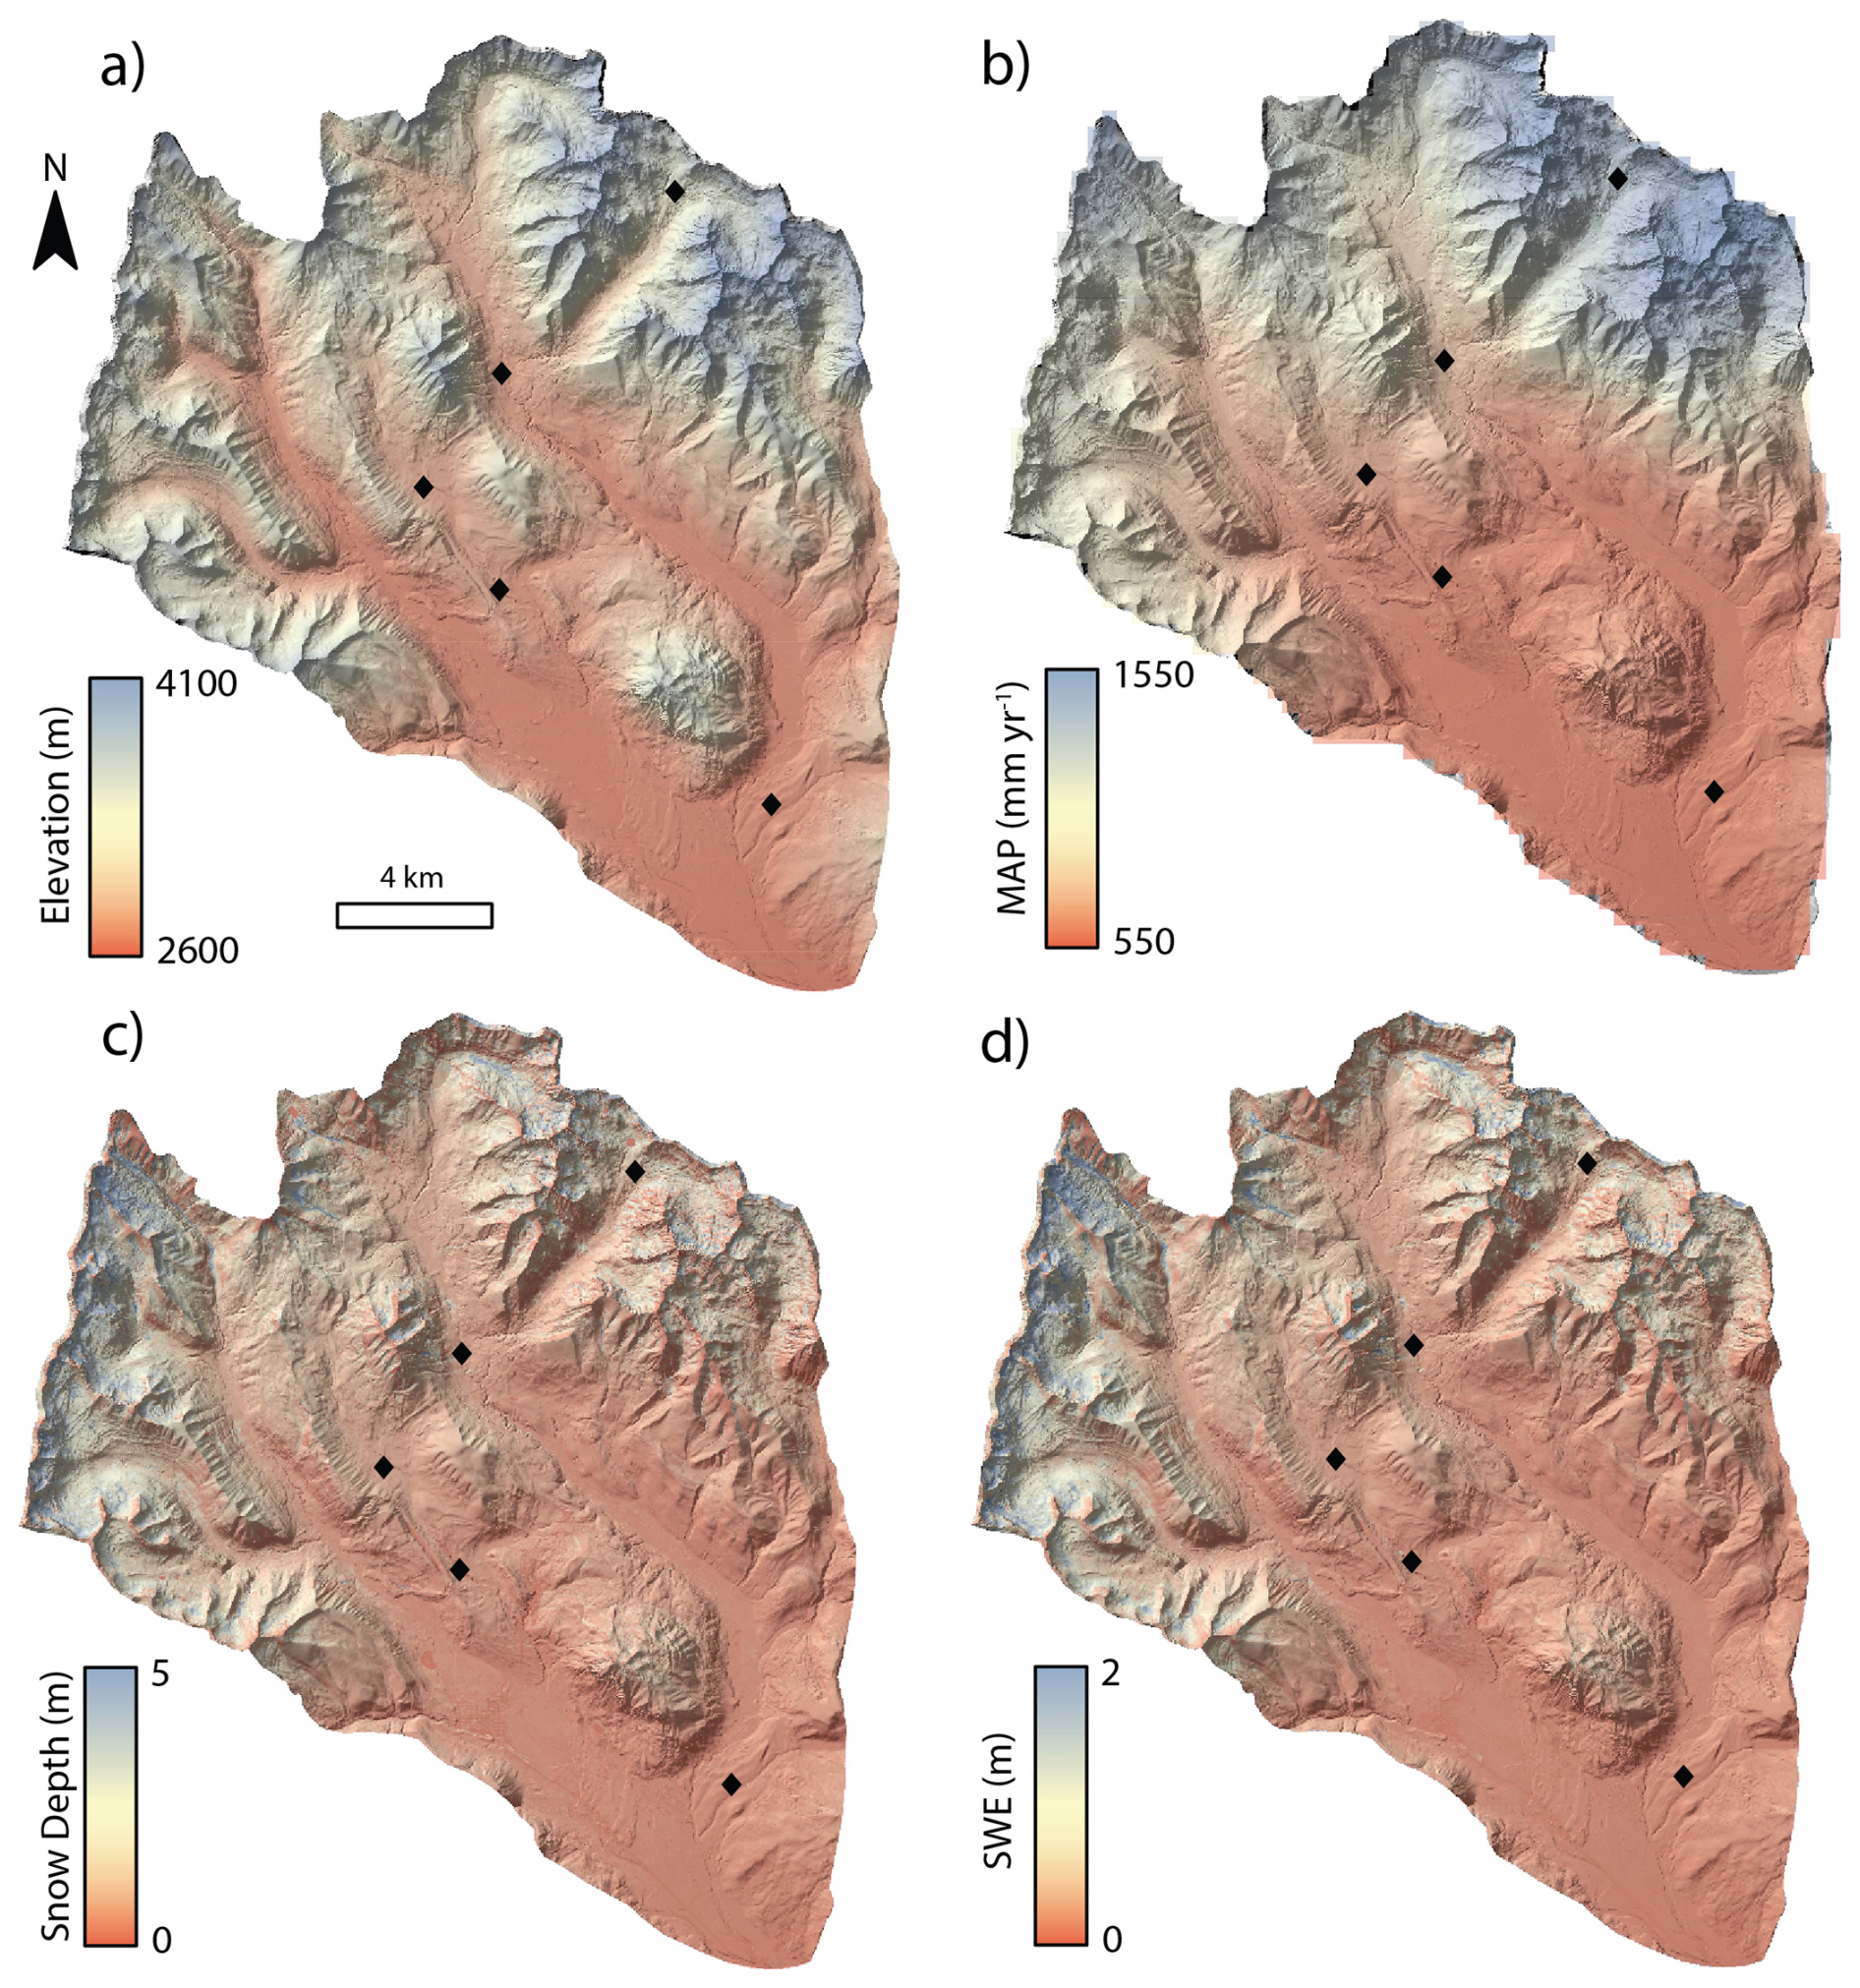
Figure 2Maps of environmental variables within the East River watershed. (a) LiDAR-derived elevation data (Goulden et al., 2020); (b) downscaled Parameter-elevation Regressions on Independent Slopes Model (PRISM) mean annual precipitation (MAP) data averaged from 2008–2019 (Mital et al., 2022); (c) mean snow depth, and (d) mean snow water equivalent (SWE), derived from Airborne Snow Observatory data from 2018–2019 (Painter, 2018a, b). The black diamonds show each sample location.
The East River drains the Elk Range of the Rocky Mountains in Colorado, USA (∼38.9° N, 106.9° W). The East River joins the Taylor River to form the Gunnison River, a major tributary to the Colorado River. The East River watershed and its tributaries, Washington Gulch and the Slate River, are a steep mountainous landscape, with elevations that range from 2600 to 4100 m above sea-level (Fig. 2a). The climate is characterized by long, cold winters and cool, short summers (Hubbard et al., 2018). The mean annual temperature is ∼0 °C, with mean minimum and maximum temperatures of −9.2 and 9.8 °C, respectively (Hubbard et al., 2018). Most of the annual precipitation occurs as snowfall, which can exceed several meters per year (Prather et al., 2023). Observations of enhanced precipitation rates on the windward side of mountains demonstrate that orography plays a strong role in controlling precipitation patterns within the watershed (Heflin et al., 2024). Hence like other mountain landscapes with orographically-influenced rain and snowfall (e.g., Roe, 2005), mean annual precipitation within the East River watershed increases with elevation (Fig. 2). The continental subarctic climate in the East River watershed supports montane, subalpine, and alpine ecosystems, which host aspen, meadow, mixed conifer, sagebrush, grass, sedge, and forb species (Fig. S1 in the Supplement) (Harte and Shaw, 1995). Bedrock in the watershed is primarily Cretaceous-age Mancos Shale and other sedimentary rocks that are intruded by Paleocene- to Miocene-age quartz monzonite porphyry and granodiorite rocks (Gaskill et al., 1967, 1991). Pleistocene glaciers eroded high elevation cirques and deposited moraines and outwash in the main East River valley (Gaskill et al., 1967, 1991). Exposure ages based on 10Bein situ concentrations measured in samples from boulders indicate the terminal moraine at the end of the valley dates to 17.9 ka, whereas the youngest recessional moraine in a high-elevation cirque within the Copper Creek watershed was exposed at 13.0 ka (Quirk et al., 2024).
3.1 Field and laboratory methods
Soil 10Bemet inventories were determined for five glacial moraines with exposure ages that range from 17.9 to 13.0 ka (Fig. 1; Table 1; Quirk et al., 2024). Soil pits were dug on the flattest part of each moraine crest to minimize the potential of post-depositional erosion, with the exception of the Gothic moraine site, which was opportunistically located where the East River has laterally eroded a cutbank into the moraine, permitting deeper sampling. The pits were dug until shovel refusal, to depths between 60 and 145 cm. At the Washington Gulch North site, we sampled from a soil pit on a flat portion of the moraine, and collected a sample on the same moraine that was exposed by a recent landslide ∼375 m from the soil pit to assess inheritance in a deeper sample than we could access by digging. Bulk density was determined at each site by driving a 90.8 cm3 steel cylinder into the soil at depths corresponding to different horizons and weighing the dry soil (Table S1 in the Supplement). Samples were collected in either 5 or 10 cm depth increments by pressing a stainless-steel box, open at the top and front, into the face of the soil pit and scraping soil into the box. Samples were dried and sieved to separate <2 mm particles. We combined samples from adjacent depths to generate composite samples that encompassed depth intervals that range from 10 to 20 cm. Samples were combined by mixing splits of the <2 mm size fraction in proportion to the total mass of <2 mm particles in each sampling interval. The combined <2 mm fractions were powdered using a tungsten carbide shatter box. We measured soil pH in water and in 0.01 M CaCl2 to assess 10Bemet retention. The measurements in water were made by mixing ∼5 g of powdered <2 mm grain-size material with 12 mL ultrapure water. The CaCl2 pH measurements were made by mixing approximately 5 g of powdered <2 mm material with 25 mL of 0.01 M CaCl2 to maintain a 1:5 soil to solution ratio (You et al., 1989). The pH values were measured with a Fisher Scientific accumet AE150 probe calibrated with multiple U.S. National Institute of Standards and Technology-traceable standards immediately prior to use (for more details, please see Table S2).
Table 1Age, location, topographic attributes, and estimated surface lowering rates for the sites used to assess meteoric 10Be flux.

Sample locations were determined using a Bad Elf Flex GNSS with sub-meter precision. Slope and curvature values (Fig. S2) were generated using 3 m LiDAR DEM (Goulden et al., 2020). Curvature (m−1) was derived by fitting a polynomial surface to a neighbourhood of 11 pixels using LSDtopotools (Mudd et al., 2014). Surface erosion rate () values were measured for the Gothic moraine site using an in situ-produced 10Be depth profile (Quirk et al., 2024) and modelled for the other sites using Eq. (4).
10Bemet chemistry was conducted at the University of Massachusetts Cosmogenic Nuclide Laboratory using the Stone (1998) fusion method. Approximately 0.5 g of homogenized and pulverized <2 mm soil particles was weighed into 30 mL Pt crucibles. We then added ∼350 µg of 9Be from a carrier with a ratio of to each sample. We also added 1000 µg of Al from a commercial carrier, which reportedly improves Be yields (Stone and Balco, 2004). Samples were dried overnight at 60 °C, then mixed with ∼2.5 g of KHF2 and ∼0.5 g of Na2SO4 flux prior to heating with a gas torch to melt the sample. Once the samples were fully melted, they were heated for an additional 1–2 min. Be was extracted by soaking the crucibles with the fusion cakes overnight in 200 mL of ultrapure water. The solution was reduced to a volume of ∼30 mL by evaporation, then centrifuged. We decanted the supernatant and added ∼10–15 mL of 49 % HClO4 to precipitate K as KClO4. The solution was centrifuged to remove KClO4 and the supernatant was dried overnight in Teflon beakers following addition of 1 mL of 8 M HNO3. The samples were redissolved in 25 mL ultrapure water and Be was precipitated as BeOH by adding drops of ∼10 % NH4OH until the solution pH was ∼9. The Be(OH)2 was washed multiple times by repeatedly centrifuging, pouring off the supernatant, and remixing the Be(OH)2 with ultrapure water. The Be(OH)2 was dissolved with 2–3 drops of 6 M HCl, dried overnight in a quartz crucible, calcined by heating with a gas torch until BeO remained incandescent for 1 min, and packed into cathodes with Nb powder. The ratios were analyzed by AMS at Lawrence Livermore National Laboratory (LLNL) against AMS Be standard 01-5-4 (LLNL standard 07KNSTD) (Nishiizumi et al., 2007). 10Be concentrations in soil samples were blank-corrected by subtracting ratios measured in full process blanks from ratios measured in samples, with uncertainties added in quadrature.
Primary and secondary soil minerals contain 9Be at parts-per-million concentrations (e.g., Barg et al., 1997; Bacon et al., 2012). To assess the amount of naturally-occurring 9Be relative to the amount added as carrier, we dissolved ∼0.1 g of each sample in 49 % HF, reconstituted the samples in a 1 % HNO3 + 1 % H2SO4 solution, centrifuged to separate insoluble organic matter, and measured Be in the supernatant via Inductively Coupled Plasma – Optical Emission Spectroscopy (ICP-OES).
3.2 10Bemet inventory and flux analysis
We determined millennial-averaged Fmet values for each moraine by measuring the 10Bemet inventory. The inventory was determined by multiplying the inheritance-corrected 10Bemet concentration (Ncorr, atoms g−1), by soil bulk density (ρ, g cm−3), the thickness of the sampling interval (z, cm), and the volumetric fraction of fine (<2 mm) soil Vf, and summing the values for all (n) individual sample depth increments (i) (e.g., Deng et al., 2021a):
Using soil inventories to quantify Fmet assumes that 10Bemet accumulation begins at the time a landform is initially exposed to wet and dry fallout. However, the ages of the moraines we use to constrain flux are orders of magnitude lower than the 10Be half-life (1.387 Ma; Chmeleff et al., 2010; Korschinek et al., 2010). Hence the soils we collected contain inherited 10Bemet atoms that were sorbed to mineral surfaces prior to their incorporation within the moraines. The inherited concentration was identified, following methods from prior work (e.g., Reusser et al., 2010), by the presence of a near constant 10Bemet concentration in the lower part of the depth profile. At four of the five sites, the 10Bemetconcentration reached a near-constant value with depth (Fig. 3). We assumed the concentration measured in the lowest depth interval was equal to the inherited 10Bemetconcentration and subtracted that value from concentrations measured in overlying samples (e.g., Reusser et al., 2010) and added the 1σ AMS analytical uncertainties in quadrature. If the 10Bemetconcentration in the sample used for the inheritance correction was greater than the concentration of a sample higher in the profile (e.g., at the Gothic moraine site), we set the concentration for that depth interval to zero. At the fifth site in the Copper Creek watershed, the 10Bemet profile is well-mixed above an indurated stone line at the base of the soil (Fig. 3a). Hence, we used the mean inheritance value of 7.58×10⁷ atoms g−1 measured at the other four sites to correct for inheritance at the Copper Creek site.
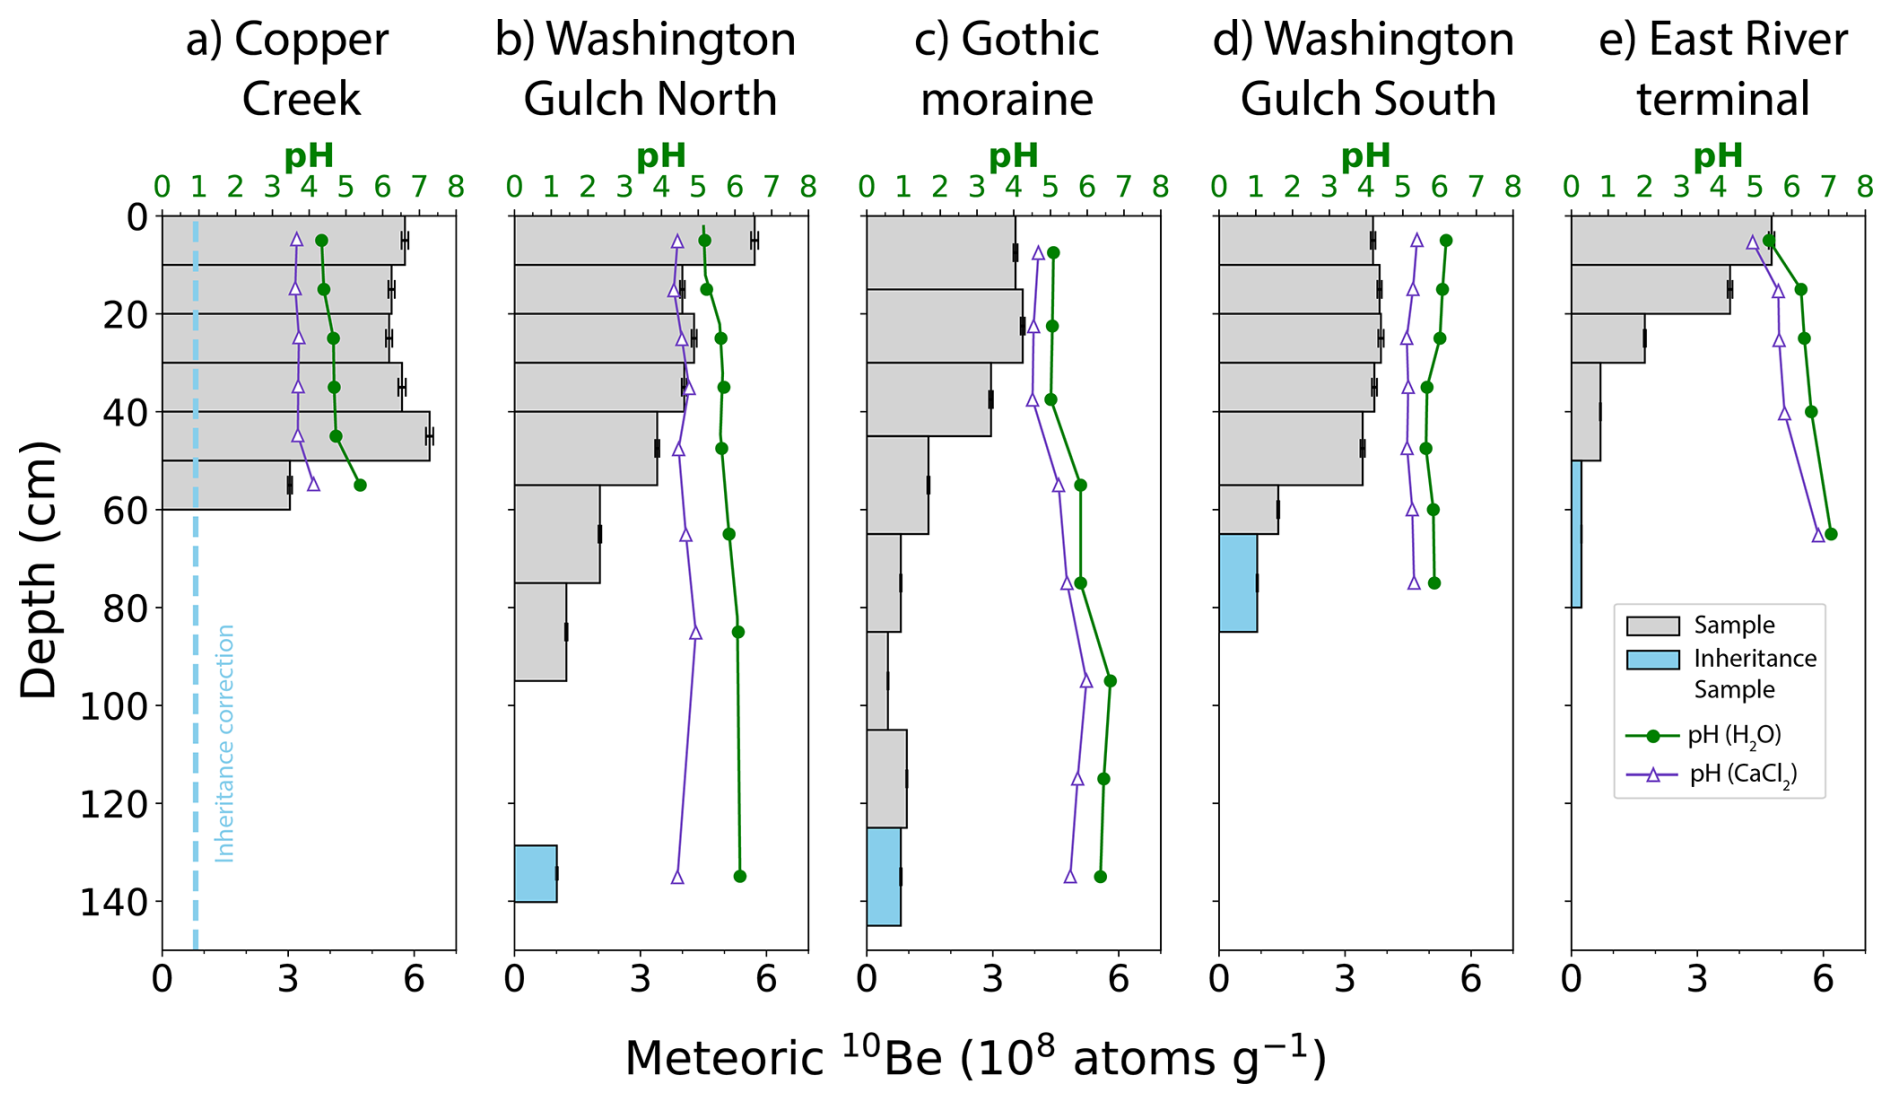
Figure 310Bemetconcentration and pH as a function of depth for (a) Copper Creek, (b) Washington Gulch North, (c) Gothic, (d) Washington Gulch South, and (e) East River Terminal moraines. Grey boxes show measured concentrations and uncertainties. Blue boxes indicate samples assumed to represent the inherited 10Bemet concentration. In (a), the blue dashed line shows the mean inheritance value calculated from profiles (b)–(e). The sample used for the inheritance correction in (b) was sampled from a landslide exposure on the Washington Gulch North moraine that was 374 m away from the soil pit where the other samples were collected.
Since we measured bulk density by soil horizon, and not sample depth interval, we assigned bulk density values to each sample interval based on soil horizons identified in the field (Table S3). The volumetric fraction of <2 mm soil particles was calculated for each depth interval following Deng et al. (2021a) as: , where Vc1 and Vc2 are volumes of two sizes of coarse clasts. Vc1 was determined by sieving each sample to separate <2 and >2 mm clasts and the volume fraction of >2 mm clasts was calculated assuming a density of 2.65 g cm−3. Vc2 was estimated by using field photos of each soil pit to digitize the area of large cobble- to boulder-sized clasts that were too large to be sampled by our 44.7 mm diameter steel ring. The volume fraction of large clasts was calculated by multiplying the area fraction by two-thirds (e.g., Deng et al., 2021a). We propagated uncertainty for individual depth increments by adding uncertainty associated with the inheritance-corrected 10Bemet concentrations and an assumed 5 % relative uncertainty in both ρ and Vf, in quadrature.
Given that the age of the moraines we sample is much less than the mean life of 10Be, and hence loss via decay is negligible, we divided the Imet value by moraine age (t, years) to determine the flux (e.g., Graly et al., 2010; Reusser et al., 2010; Ouimet et al., 2015; Clow et al., 2020; Deng et al., 2021a):
Uncertainty in Fmet for each calibration site was calculated by adding uncertainty in Imet values and moraine age in quadrature. Moraine age uncertainty was based on the standard error of the mean of multiple exposure ages on boulders or, for the Gothic moraine, a 1 ka uncertainty associated with a 10Bein situ depth profile age (Table 1; Quirk et al., 2024).
The Fmet values calculated using Eq. (2) assume complete retention of 10Bemet. We corrected fluxes (Fcor) for erosional and desorption losses according to Clow et al. (2020):
where ϵ is the erosion rate (g cm−2 yr−1), Nsurface is the inheritance-corrected 10Bemet concentration in the uppermost sample that is assumed to represent the concentration in eroding soil (atoms g−1), λ is the 10Be decay constant ( yr−1), Q (L cm−2 yr−1) is the flux of water through the soil, and Nj and Kd,j are the inheritance-corrected 10Bemet concentration and Be partition coefficient (L kg−1), respectively, for the soil depth interval j of interest, which is described below.
The 10Bein situ depth profile method used to date the Gothic moraine, which was also sampled for 10Bemet, yielded a median value of m yr−1 (Quirk et al., 2024). The source area for the Gothic moraine is primarily intrusive rock, hence the till matrix contained sufficient quartz for 10Bein situ measurement. However, the till matrix was dominated by quartz-poor Mancos shale at the other sites and because of the dense shale-derived matrix, the pits could not be excavated deep enough to permit use of a 10Bein situ profile to assess erosion rates. Hence we modeled the surface lowering rate at the other sites as:
where D is the topographic diffusion coefficient (m2 yr−1), and ∇2z is topographic curvature (m−1). Equation (4) is appropriate for low-gradient hillslopes like the moraines we sampled (Table 1), where surface lowering rates scale linearly with curvature (e.g., Kwang et al., 2022). Based on the median surface lowering rate and topographic curvature (Table 1), we infer the value of D at the Gothic moraine site is m2 yr−1. Given the similar soils and climate, we assume D is comparable across the five moraines and use the diffusion coefficient for the Gothic moraine site and topographic curvature values to estimate values at the four sites that lack direct measurements. We assume values from Eq. (4) are equivalent to ϵ values in Eq. (3) and convert from units of length per time to mass per area per time using bulk density values inferred for the Nsurface sample (Table S3).
We calculate Q as the difference between mean annual precipitation (MAP) and evapotranspiration (ET), which assumes that only the fraction of the precipitation that infiltrates the entire soil profile contributes to desorption losses. We determined MAP at each site using downscaled (400×400 m) Parameter-elevation Regressions on Independent Slopes Model (PRISM; Daly et al., 2008) raster data, which averages over the period from 2008–2019 (Mital et al., 2022). We used annual ET data from 2014–2015 that were simulated using the Community Land Model (CLM). ET values were reported for discrete locations within the East River watershed (Tran et al., 2019) and we assigned values to our study sites using the CLM prediction with an elevation and vegetation that most closely matched each site (Table S4). Following Deng et al. (2021a), we estimated Kd values using a logistic regression relationship from Campforts et al. (2016) where Kd is predicted as a function of pH measured in H2O.
Prior work used Eq. (3) to assess 10Bemet desorption losses from the surface of the soil profile and assumed that desorbed Be exited the profile (Clow et al., 2020). Here we model three different desorption scenarios where Nj and Kd,j correspond to values for different depth intervals. The first analysis we conducted is for the soil surface sample, which yields results comparable to those of Clow et al. (2020). The second analysis uses profile-average values of N and Kd and assumes the mean Kd for the entire soil column is the primary influence on desorption losses. Because pH generally increases with depth, the third scenario uses Kd values for the lowermost sample in the profile and assumes desorption losses are controlled by the pH of the lowermost depth increment in the profile. The soil surface and lowermost sample scenario uses the respective Kd value and inheritance-corrected 10Bemet concentration associated with each depth interval for Nj. The profile-average scenario uses the weighted mean Kd value for the entire profile and the profile weighted mean value of the inheritance-corrected 10Bemet concentration for Nj, where the thickness of each sampling interval was used as the weighting factor. We report the results from all scenarios, but use the results of the profile-average scenario for regression analyses and for comparison against predictions from existing empirical and GCM-based models.
3.3 Relationships between flux, elevation, and precipitation
It is well-established that the flux of 10Bemet is strongly influenced by precipitation rates (e.g., Willenbring and von Blanckenburg, 2010; Graly et al., 2011). Given that precipitation within the East River watershed is orographically-controlled (Heflin et al., 2024), there should also be a relationship between elevation and the flux of 10Bemet. We used gridded datasets and univariate regression to assess the correlation between Fmet (and Fcor) and elevation, MAP, snow depth, and snow water equivalent (SWE). The influence of elevation was evaluated using 3 m resolution LiDAR data (Goulden et al., 2020). We used the same gridded MAP data described in Sect. 3.2 that we use to estimate Q (Mital et al., 2022), and snow data products derived from the Airborne Snow Observatory (ASO; Painter et al., 2016). ASO combines airborne LiDAR and imaging spectrometry with snow energy balance models to generate spatial maps of snowpack properties. Snow depth is calculated as the difference between a snow-covered LiDAR survey and a snow-free “bare-earth” LiDAR scan. For this study, we used ASO-derived snow depth data (3 m resolution) acquired on 31 March 2018, and 7 April 2019 (Painter, 2018a). We used SWE data (50 m resolution) from the same dates as snow depth (Painter, 2018b). We used the coefficient of determination (R2) from linear regression analysis to assess the degree that variability in Fmet and Fcor is explained by elevation and precipitation metrics. The significance of each regression model was determined using the associated p value. For the precipitation-based metrics, we additionally conducted regression through the origin analyses where the y-intercept was set to equal zero, because Fmet and Fcor should be zero where precipitation is zero, assuming dry fallout of 10Bemet is negligible.
3.4 Comparing inventory-based fluxes against estimates from other methods
We predicted Fmet for each of the five calibration sites using the precipitation- and latitude-based empirical model of Graly et al. (2011) using the down-scaled PRISM MAP data (Mital et al., 2022). We re-scaled the Graly et al. (2011) predictions, which are based on present-day precipitation measurements, to Holocene-averaged values by multiplying them by to account for differences in paleomagnetic and solar intensity variations (e.g., Clow et al., 2020) and compared the re-scaled predictions against our Fmet and Fcor values.
The elevation, MAP, snow depth, and SWE data for each sample location were extracted from gridded datasets that span the entire watershed, including the Washington Gulch and Slate River tributaries. We applied the regression equations described in Sect. 3.3 to generate a prediction of flux for each pixel in the watershed. We then predicted watershed-average fluxes by calculating the mean value of all pixels. We used the regression through the origin models to generate predictions based on MAP, snow depth, and SWE to ensure model predictions were physically realistic (e.g., a negative y-intercept value could produce a negative flux value, which is physically-implausible). Our predicted watershed-average flux values integrate over a larger area, hence they are more appropriate for comparison against GCM-based flux estimates than our point-based values from each soil pit.
We compared our watershed-averaged flux predictions against three GCM-based predictions. The ECHAM5-HAM flux predictions of Heikkilä and von Blanckenburg (2015) are from a three-decade simulation that used pre-industrial aerosol and greenhouse gas concentrations and a modern solar modulation factor (φ) of 501.76 MeV. The solar modulation during the Holocene was lower (φ=280.94 MeV), hence Heikkilä and von Blanckenburg (2015) multiplied the fluxes by a factor of 1.23 to re-scale them to average Holocene values that represent the last 9400 years. The GEOS-Chem 14.1.1 and ECHAM6.3-HAM2.3 model predictions of Zheng et al. (2024) are modern predictions that average from 2005 to 2013 and use a φ value of 488 MeV. Since our flux estimates from the East River average over the Holocene, we multiply both of the Zheng et al. (2024) flux predictions by 1.23, which approximately re-scales them to Holocene-averaged values and makes them more comparable to our predicted watershed-average values.
4.1 Soil pH
Soil pH for the uppermost sample interval of each profile ranged from 4.3–6.3 when measured in H2O and from 3.7–5.4 when measured in CaCl2 and the values generally increased with depth (Fig. 3; Table S2). Mean pH values averaged across all depths for Copper Creek, Washington Gulch North, Gothic, Washington Gulch South, and East River Terminal moraines are 4.7, 5.6, 5.7, 5.9, and 6.3, for measurements in H2O, and 3.8, 4.6, 5.2, 5.2, and 5.8, when measured in CaCl2, respectively. The most acidic soils are found at the Copper Creek site, which has the highest elevation and is dominated by spruce-fir forest vegetation (Fig. S1).
4.2 10Bemetprofiles, inventories, fluxes, and controls on fluxes
AMS-measured ratios typically were on the order of to , which is several orders of magnitude greater than the to ratios measured in blanks (Table 2). Measured 10Bemet concentrations ranged from about 2.4×10⁷ to 6.4×10⁸ atoms g−1 (Table 2). Concentrations of 9Be were ∼1 ppm indicating the average mass of 9Be in the samples was ∼0.2 % of the mass added as carrier (Table S5). Given that 0.2 % is less than the uncertainty of the Be concentration of the carrier we used (1.2 %), no corrections were made to the AMS-measured ratios. The 10Bemet concentration profiles exhibit a variety of shapes. Profiles at four of the sites have relatively uniform concentrations in the upper ∼0.5 m of the profile, with maximum concentrations at or near the ground surface that decline at greater depths (Table 2; Fig. 3a–d). At the lowest elevation site on the terminal moraine, the 10Bemet concentration is greatest at the surface and declines exponentially with depth (Fig. 3e). The shallowest profile was at the Copper Creek site, where a coarse, indurated stone layer 60 cm below the ground surface prevented deeper sampling. At Copper Creek the concentration profile is well mixed in the upper 40 cm, exhibits a subsurface peak concentration 40–50 cm below the ground surface, and then declines sharply in the 10 cm interval directly above the stone line, but not to levels as low as those observed in the deepest samples from other profiles (Fig. 3a). Inheritance-corrected 10Bemet inventories range from 7.68×10⁹ to 2.35×10¹⁰ atoms cm−2 (Table 3), with the largest and smallest inventories at the Copper Creek and East River terminal moraine sites, respectively. Inheritance-corrected Fmet values range from 0.43×10⁶ to 1.80×10⁶ atoms cm−2 yr−1 (Table 3). Correcting for inheritance, erosion, desorption (using the profile averaged model), and decay yields Fcor values of 0.31×10⁶ to 3.7×10⁶ atoms cm−2 yr−1 (Table 4). Hence accounting for erosion and desorption caused fluxes to deviate from uncorrected values by a factor of 0.3 to 2.1 (Tables 3, 4). The desorption model scenarios for the uppermost and lowermost soil depth intervals predict fluxes that are generally within a factor of two of the profile-averaged model, except for the Copper Creek site, where the flux predicted from the upper sample pH is an order of magnitude greater than the flux predicted by the pH of the lowermost sample (Table 4).
Fmet values are well-correlated with elevation and precipitation metrics in the East River watershed (Fig. 4; Table S6). Fmet values are linearly correlated with elevation (R2=0.91), mean annual precipitation (R2=0.82–0.85), mean snow depth (R2=0.95–0.97), and mean SWE (R2=0.97–0.98). Due to the large range of elevation and precipitation within the watershed (Fig. 2), the regression models predict substantial within-watershed variability in Fmet (Fig. 5). The erosion- and desorption-corrected fluxes based on the profile-averaged model exhibit similar trends with elevation and precipitation variables, but the correlations exhibited greater variability, with R2 values of 0.96 for elevation, 0.56–0.95 for mean annual precipitation, 0.72–0.88 for mean snow depth in 2018–2019, and 0.66 to 0.90 for mean SWE in 2018–2019 (Fig. 4). The Copper Creek site has substantially higher elevation and precipitation values than the other sites and hence strongly influences regression relationships. When the Copper Creek site is omitted from the analysis, R2 values range from 0.25 to 0.93 (Table S7).
Table 210Bemet sample information and AMS results.
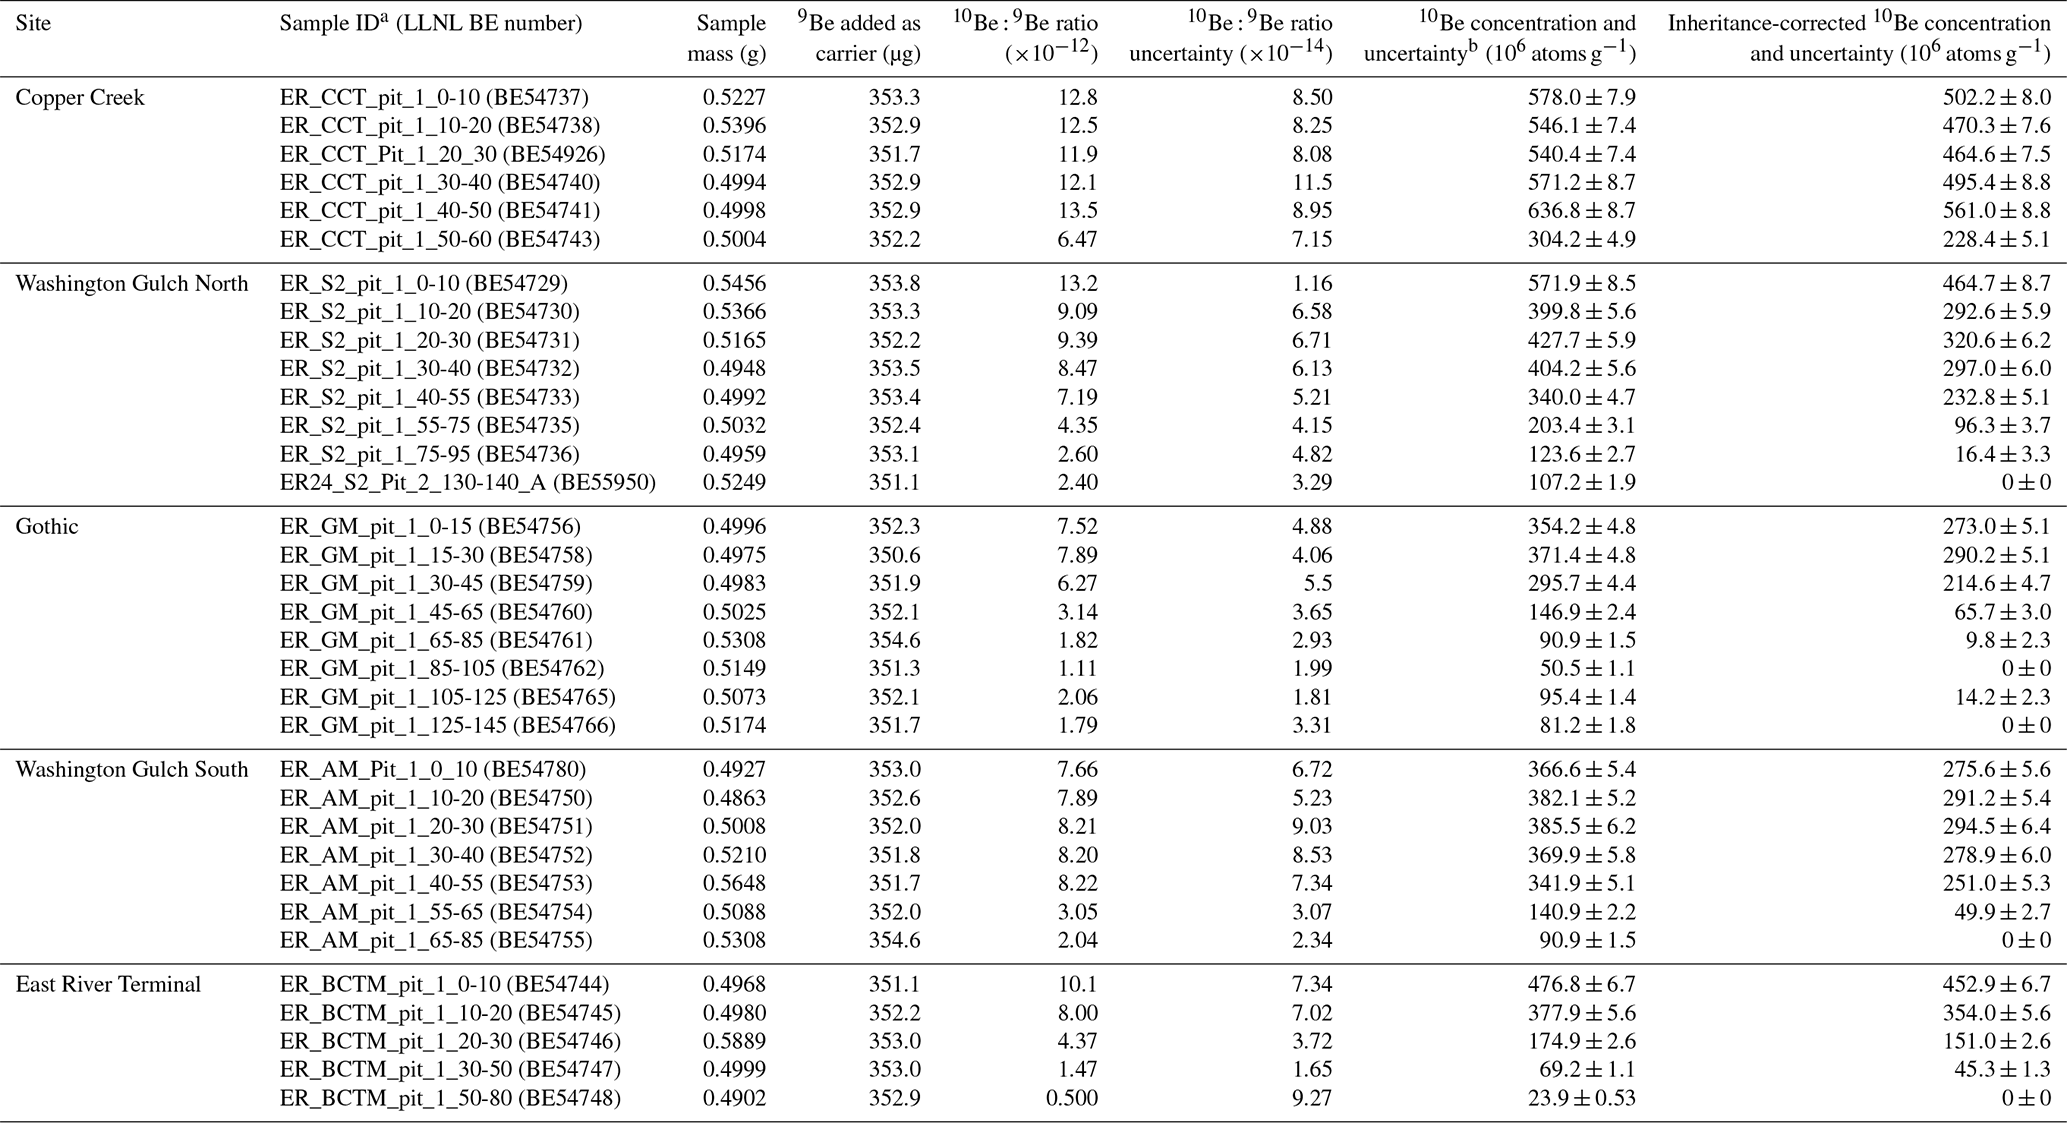
a Values at the end of each sample ID refer to the sample depth interval (cm). b Reported 10Be concentrations are corrected using ratios measured in process blanks. ratios measured in process blanks in the same batches as the samples were: 2.44, 1.64, 2.55, 2.93, 2.11, 2.39, 4.71, 2.92, and . Uncertainty in Imet values was determined by adding the uncertainty for individual depth increments in quadrature. Analytical uncertainties were low (1.3 %–2.2 %) and the Imet uncertainties primarily reflect the uncertainties in ρ, Vf, and in some cases, the inheritance-corrected 10Bemet concentration. In some cases, uncertainties in the inheritance-corrected 10Bemet concentrations were large relative to the 10Bemet concentrations because the difference in concentrations between the two depth increments was small. Hence the Washington Gulch North and Gothic inventories have slightly higher uncertainties relative to the other sites.
Table 3Environmental variable values and 10Bemet fluxes at each calibration site.

a elevation (m) from Goulden et al. (2020), b mean annual precipitation (MAP) from Mital et al. (2022), c mean snow depth (m) from 2018–2019 (Painter, 2018a), and d Mean snow water equivalent (SWE) (m) from 2018–2019 (Painter, 2018b).
Table 4Modeled erosional, decay, and desorption meteoric 10Be losses and loss-corrected fluxes.

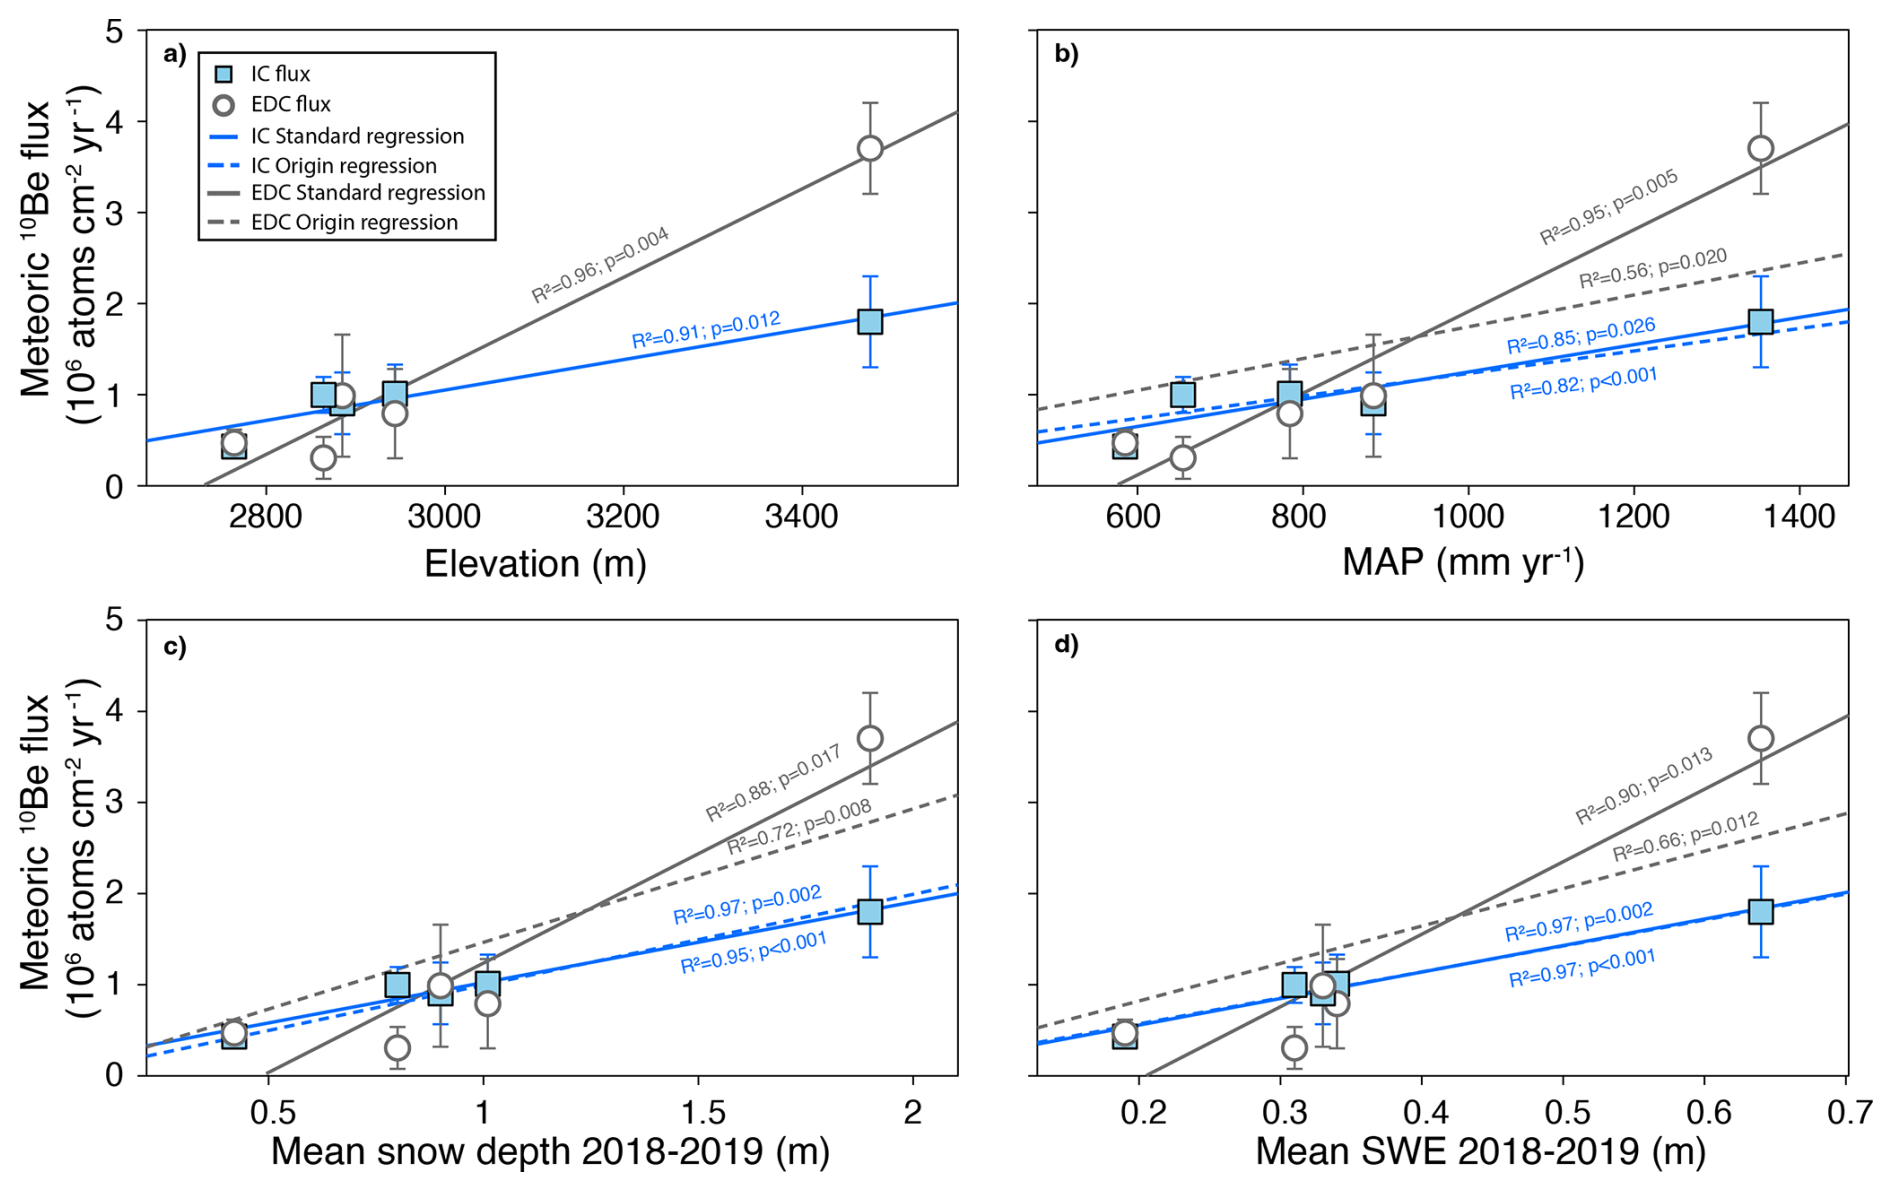
Figure 4Linear regression models of 10Bemet flux versus (a) elevation, (b) mean annual precipitation (MAP), (c) mean snow depth (2018–2019), and (d) mean snow water equivalent (SWE) (2018–2019). Blue squares show inheritance-corrected fluxes and open gray circles show erosion- and desorption-corrected fluxes. The erosion- and desorption-corrected fluxes use the profile-average desorption model. For the inheritance-corrected (IC) data, solid blue lines show results from standard regression models and the dashed blue lines show regression through the origin models. For the corrected (EDC) data, solid grey lines show standard regression model results and grey dashed lines show regression through the origin models where the y-intercept is zero. Regression through the origin models are shown only for MAP, mean snow depth, and mean SWE. Regression coefficients, R2 values, and p values are reported in Table S6. Figure S3 and Table S7 report regression results with Copper Creek excluded from the analysis. Figures S4 and S5 show the results from the uppermost and lowermost sample desorption models.
The different regression models predicted watershed-averaged Fmet values that vary by about a factor of two (Table 5). For elevation, the regression models yield average Fmet and Fcor of 1.30×10⁶ and 2.04×10⁶ atoms cm−2 yr−1, respectively. The MAP-based regression resulted in average Fmet and Fcor values of 1.10×10⁶ and 1.48×10⁶ atoms cm−2 yr−1 for the standard and 1.11×10⁶ and 1.57×10⁶ atoms cm−2 yr−1 for the regression through the origin models, respectively. Snow depth models produced average Fmet and Fcor values of 1.33×10⁶ and 2.07×10⁶ and 1.34×10⁶ and 1.97×10⁶ atoms cm−2 yr−1 for the standard and regression through the origin regression models, respectively. Similarly, SWE-based regressions yielded watershed-averaged Fmet and Fcor values of 1.43×10⁶ and 2.34×10⁶ for the standard regression and 1.42×10⁶ and 2.05×10⁶ atoms cm−2 yr−1 for the regression through the origin models, respectively. We assessed the influence of extreme values and potential outliers by calculating watershed-averaged Fmet and Fcor values using only pixels with the lowest 99th, 95th, and 90th percentile values, which resulted in lower mean values, with the greatest reductions for the snow-depth and SWE-based estimates (Table 5).
Table 5Watershed-averaged 10Bemet flux predictions based on all pixels (100 %) and when excluding pixels with high values by using only the lowest 99th, 95th, and 90th percentile values when calculating the mean.
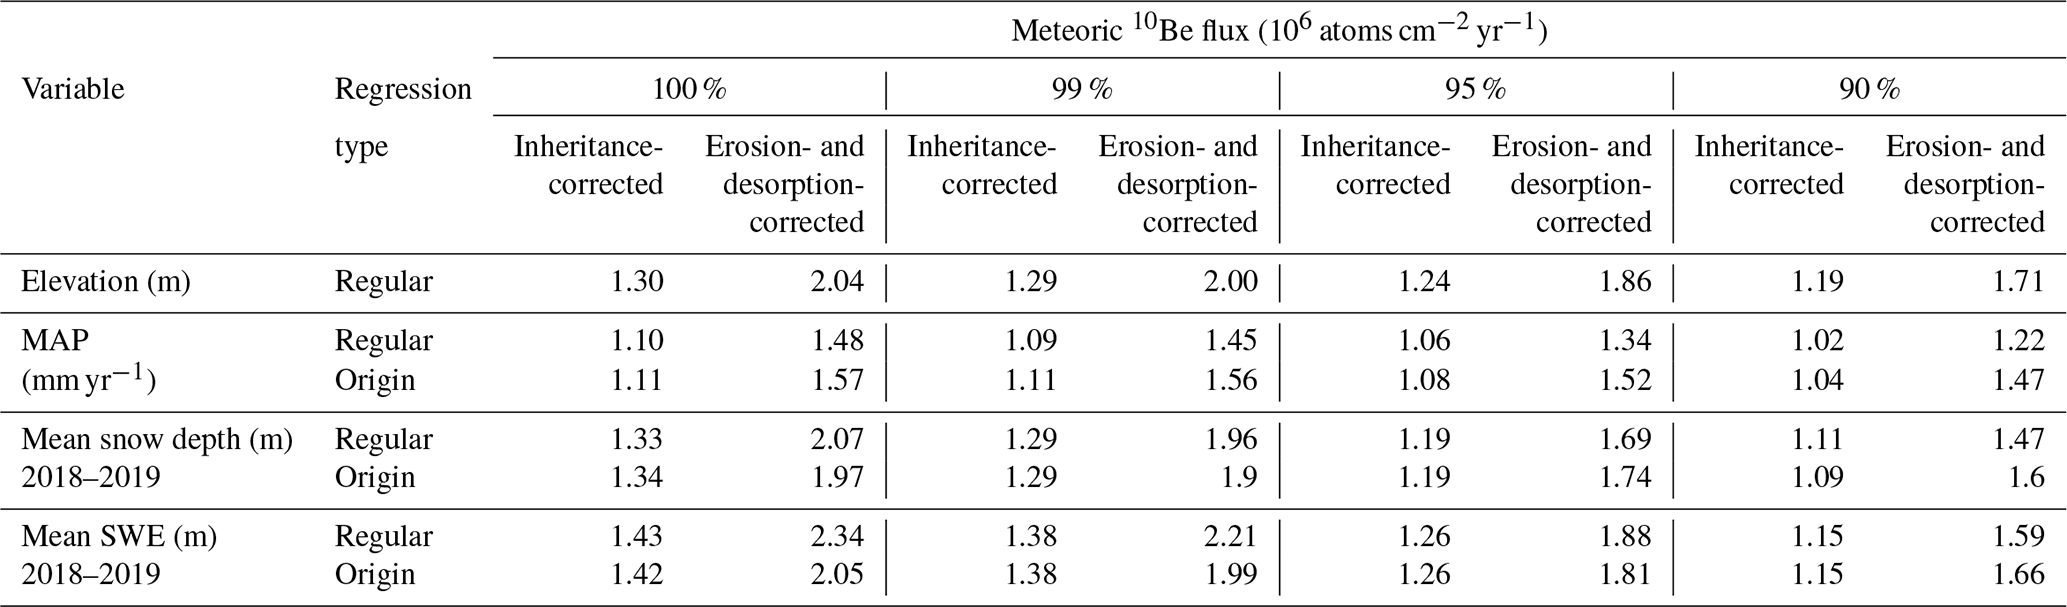
Values are calculated by applying regression equations to gridded elevation, mean annual precipitation (MAP), mean snow depth, and mean snow water equivalent (SWE) data to predict a value for each pixel in the watershed and then calculating the average of all pixels.
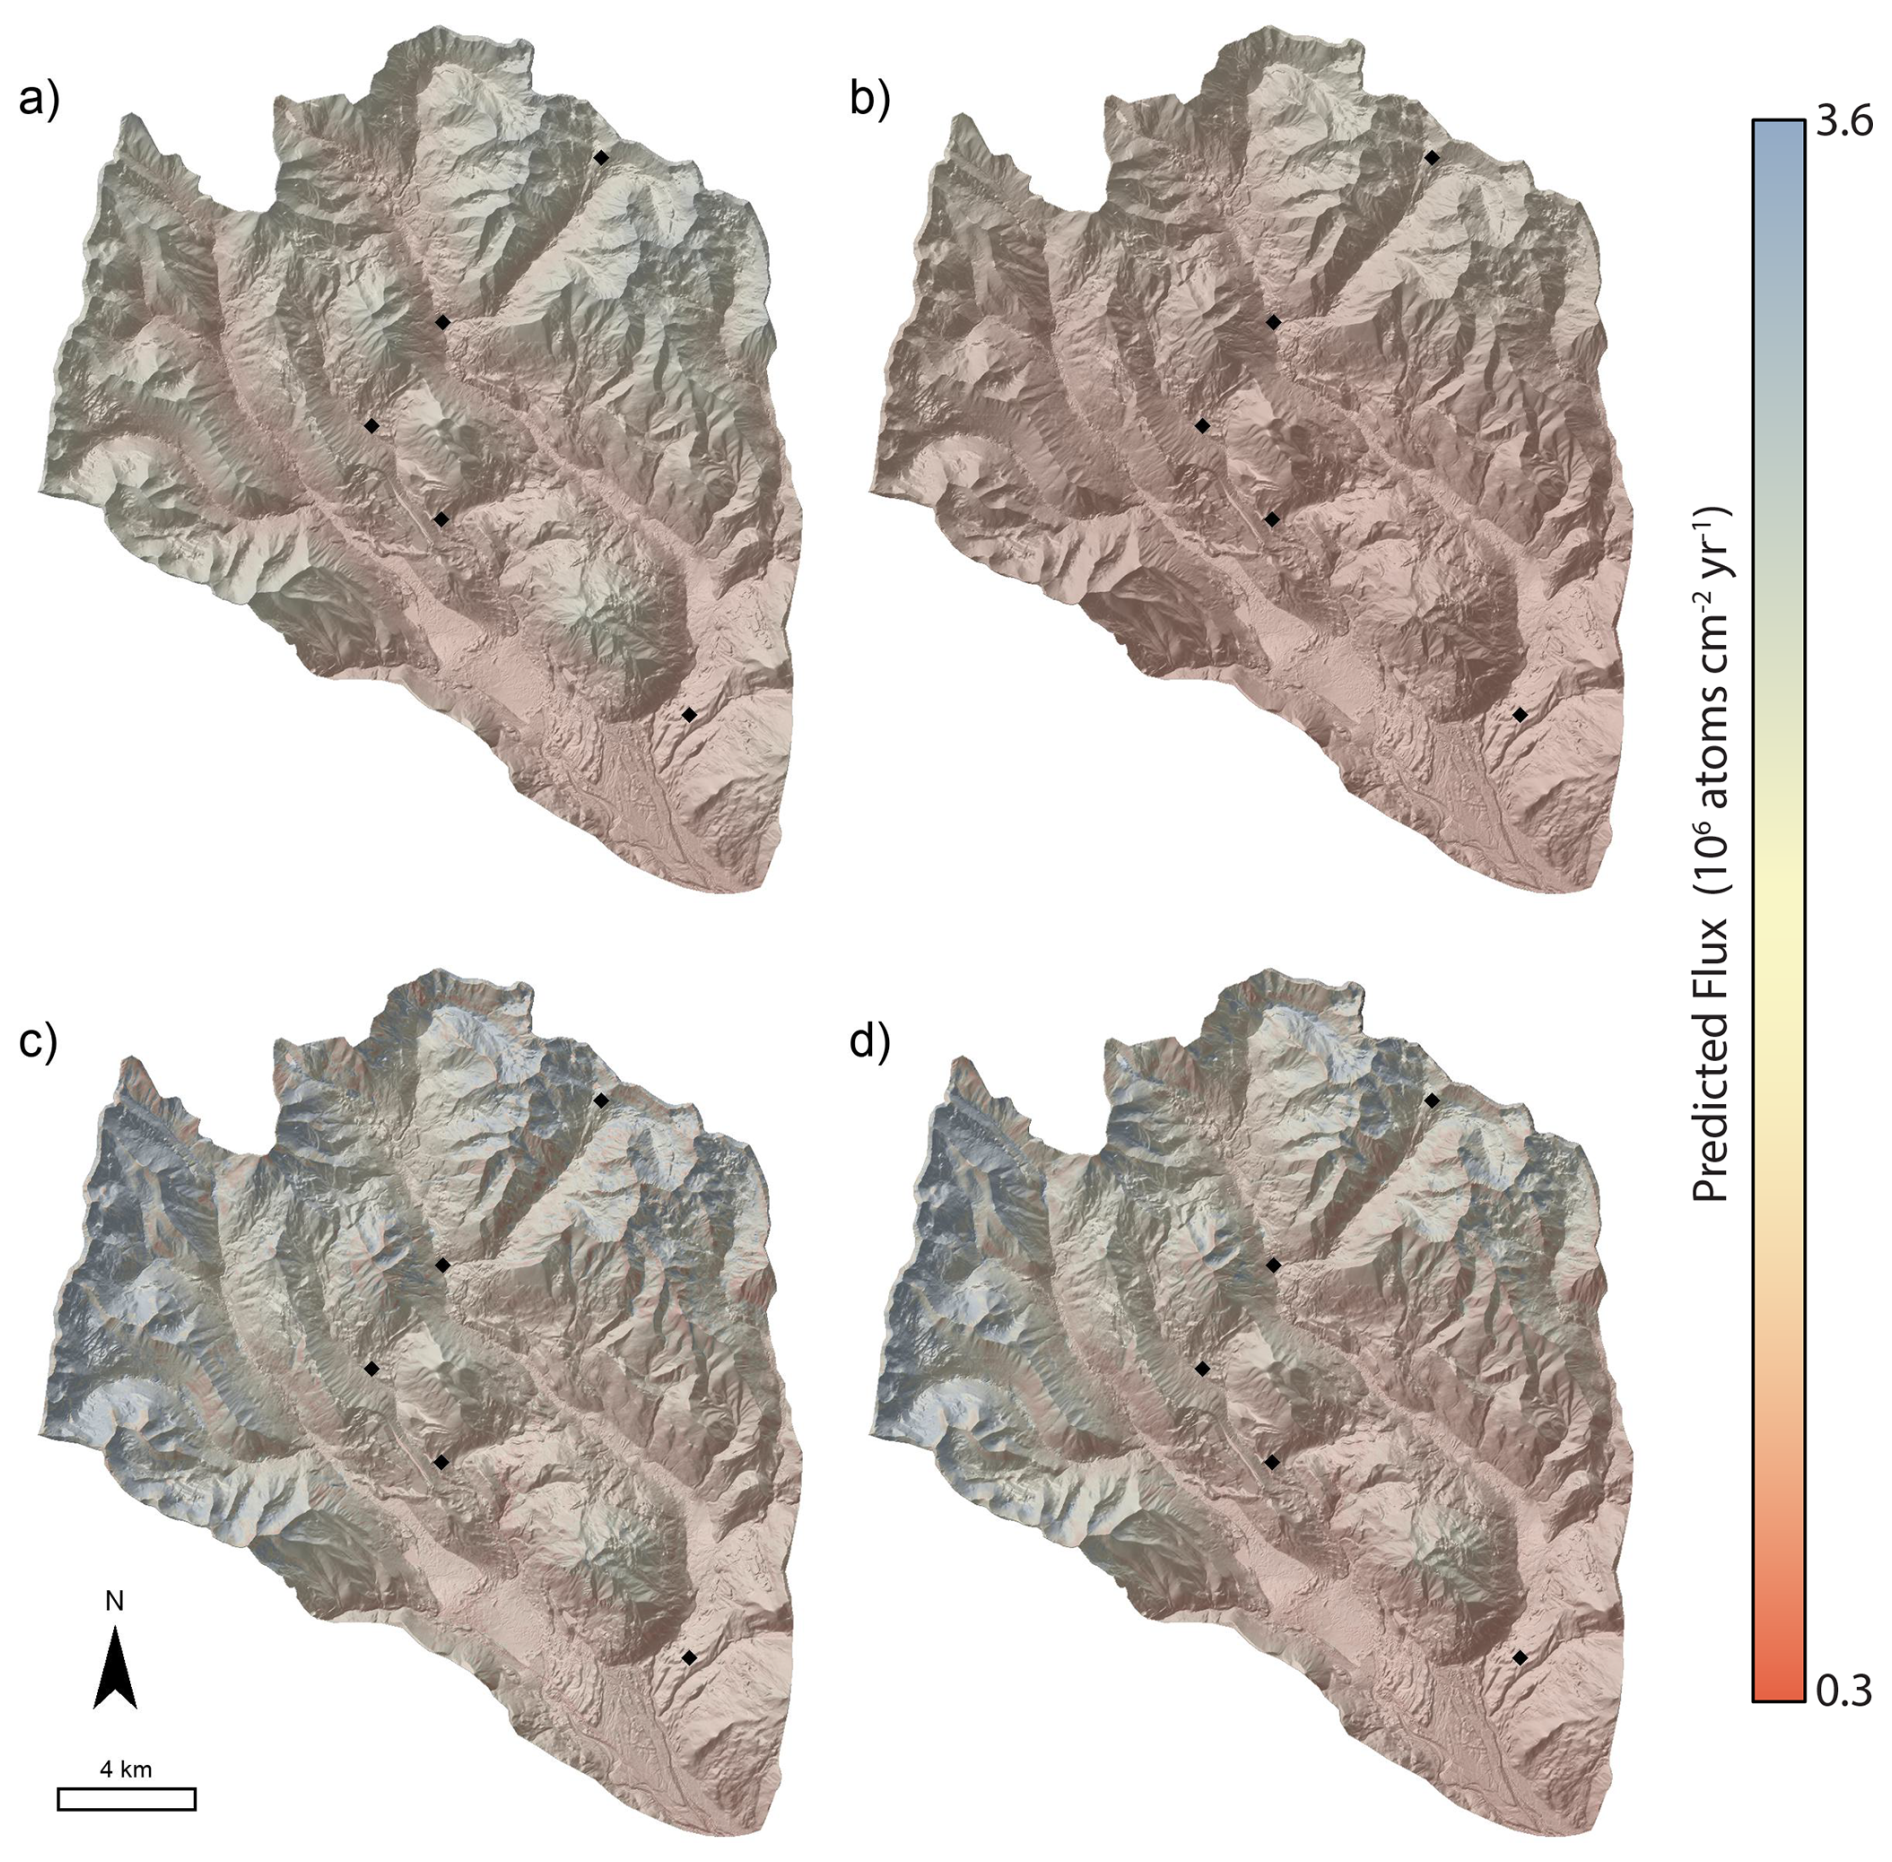
Figure 5Spatial predictions of 10Bemet flux based on inheritance-corrected regression models using: (a) elevation with the regular regression; (b) mean annual precipitation with the origin regression; (c) mean snow depth from 2018–2019 with the origin regression; and (d) mean snow water equivalent from 2018–2019 with the origin regression. The equivalent results for erosion- and desorption-corrected fluxes calculated using the profile-average desorption model are shown in Fig. S6.
10Bemet profiles tend to have characteristic shapes, and the shapes are sometimes used to infer processes of 10Bemet mobility (e.g., Graly et al., 2010). The two most common profile shapes are characterized by either a subsurface peak in concentration or concentrations that decline with depth from a maximum value at the soil surface (Graly et al., 2010). The profile on the East River terminal moraine exhibits an exponential decline in concentration with depth, however the concentrations at the other four sites are fairly uniform with depth. The uniform profiles likely arise from bioturbation, via vegetation or burrowing mammals. Pocket gophers (Thomomys talpoides) are the main soil-disturbing mammal within the East River watershed, and soil disturbance can be intense, with surveys indicating soil disturbance by burrowing can exceed one disturbance per m2 within the elevation range of our sampling sites (Lynn et al., 2018). The distinct stone line at the Copper Creek site may have been generated by bioturbation (e.g., Johnson, 1989), though we cannot rule out the possibility of a periglacial origin (Ball, 1967). The stone line prevented deeper sampling at the Copper Creek site, which makes it difficult to determine whether the full 10Bemet inventory was sampled, or whether non-inherited 10Bemet is present below the stone line. In either case, the high-elevation Copper Creek site has the highest inventory, which is consistent with the higher precipitation rates at the site.
Glacial moraines erode via diffusive soil transport processes (e.g., Putkonen and Swanson, 2003) and loss of 10Bemet due to leaching has been documented or suspected in low pH soils with substantial chemical alteration (e.g., Pavich et al., 1984; Bacon et al., 2012; Dixon et al., 2018). The measured Fmet values are hence minimum values because erosional and desorption losses of 10Bemet reduce inventories. Modeled erosional losses are largest at the Gothic moraine which has the most convex topography, whereas desorption losses are predicted to be greatest at Copper Creek where pH and therefore Kd are estimated to be lowest. The modelling predicts that desorption losses of 10Bemet predicted by the profile averaged model tend to be greater than erosional losses, particularly at the Copper Creek site, where predicted desorption losses are about an order of magnitude greater than desorption losses predicted for the other sites. In principle, accounting for erosional, decay, and desorption losses should increase flux estimates relative to the measured inheritance-corrected values. However, using Eq. (3) to account for erosion and desorption results in corrected fluxes that are similar to or less than the measured values for all sites except Copper Creek (Tables 3, 4), which suggests that the modeled loss terms may not fully capture true 10Bemet losses. Although the diffusion coefficient we calculate is comparable to values measured in other landscapes with similar climates (Richardson et al., 2019), there is still inherent uncertainty in using modeled, rather than measured, erosion rates and there is uncertainty in how rates of diffusive soil transport vary with elevation within the East River watershed. There is also uncertainty in the pH-derived Kd values, particularly because the presence of organic compounds, which are abundant in soil, alters sorption relative to experimental systems consisting of only mineral material (Boschi and Willenbring, 2016a, b).
Fmet is highly correlated with elevation, MAP, snow depth, and SWE, which is unsurprising because these variables are related to one another via orographic controls on precipitation rates. However, different slope and intercept values for regression relationships result in different Fmet and Fcor predictions for the same location and watershed-averaged fluxes that differ by a factor of about two. The precipitation data average over only a few decades and snow depth and SWE datasets cover only two winters, which are only small fractions of the post-glacial period over which 10Bemet has accumulated in soils. The recent snowfall magnitude may differ from Holocene averages, though the patterns are not likely to have varied substantially, given the orographic controls. However, unlike elevation and MAP datasets, the snow-based inventories yield insight on how local-scale topography may influence spatial patterns of Fmet. For example, we predict that lower snow accumulation on sharp ridges relative to adjacent slopes leads to lower 10Bemet accumulation on ridges (Fig. 5). Watershed-averaged fluxes predicted using snow depth and SWE are more sensitive to extreme values than average fluxes based on elevation (Table 5). The mean snow depth of 1.90 m at the highest elevation Copper Creek site is a fraction of the highest snow depth values in the watershed, which exceed 20 m (Fig. S7) and indicates the highest snow depth values are potentially artefacts. The lack of Fmet calibration sites in areas with higher snow accumulation may result in inaccurate predictions for such areas, however the lack of moraines or other stable, datable landforms at higher elevations makes it difficult to measure 10Bemet fluxes in such areas. The MAP data are based on decadal-scale precipitation measurements but are interpolated from weather station measurements using elevation as a predictor (Daly et al., 2008). However, the watershed-averaged MAP-based predictions are slightly lower than values based on elevation and snow data. Elevation is the only parameter not subject to temporal bias caused by measurement duration. Hence, given the orographic influences on precipitation within the watershed, elevation should be a robust predictor of 10Bemet fluxes. However, elevation-based predictions may be biased where local topography leads to persistent snow redistribution via wind and avalanches. Given the different 10Bemet flux predictions from the elevation, MAP, snow depth, and SWE datasets, an ensemble approach may be appropriate for using 10Bemet values to quantify surface process rates, in a manner similar to assessing results from multiple production rate scaling models when determining 10Bein situ exposure ages (e.g., Balco et al., 2008).
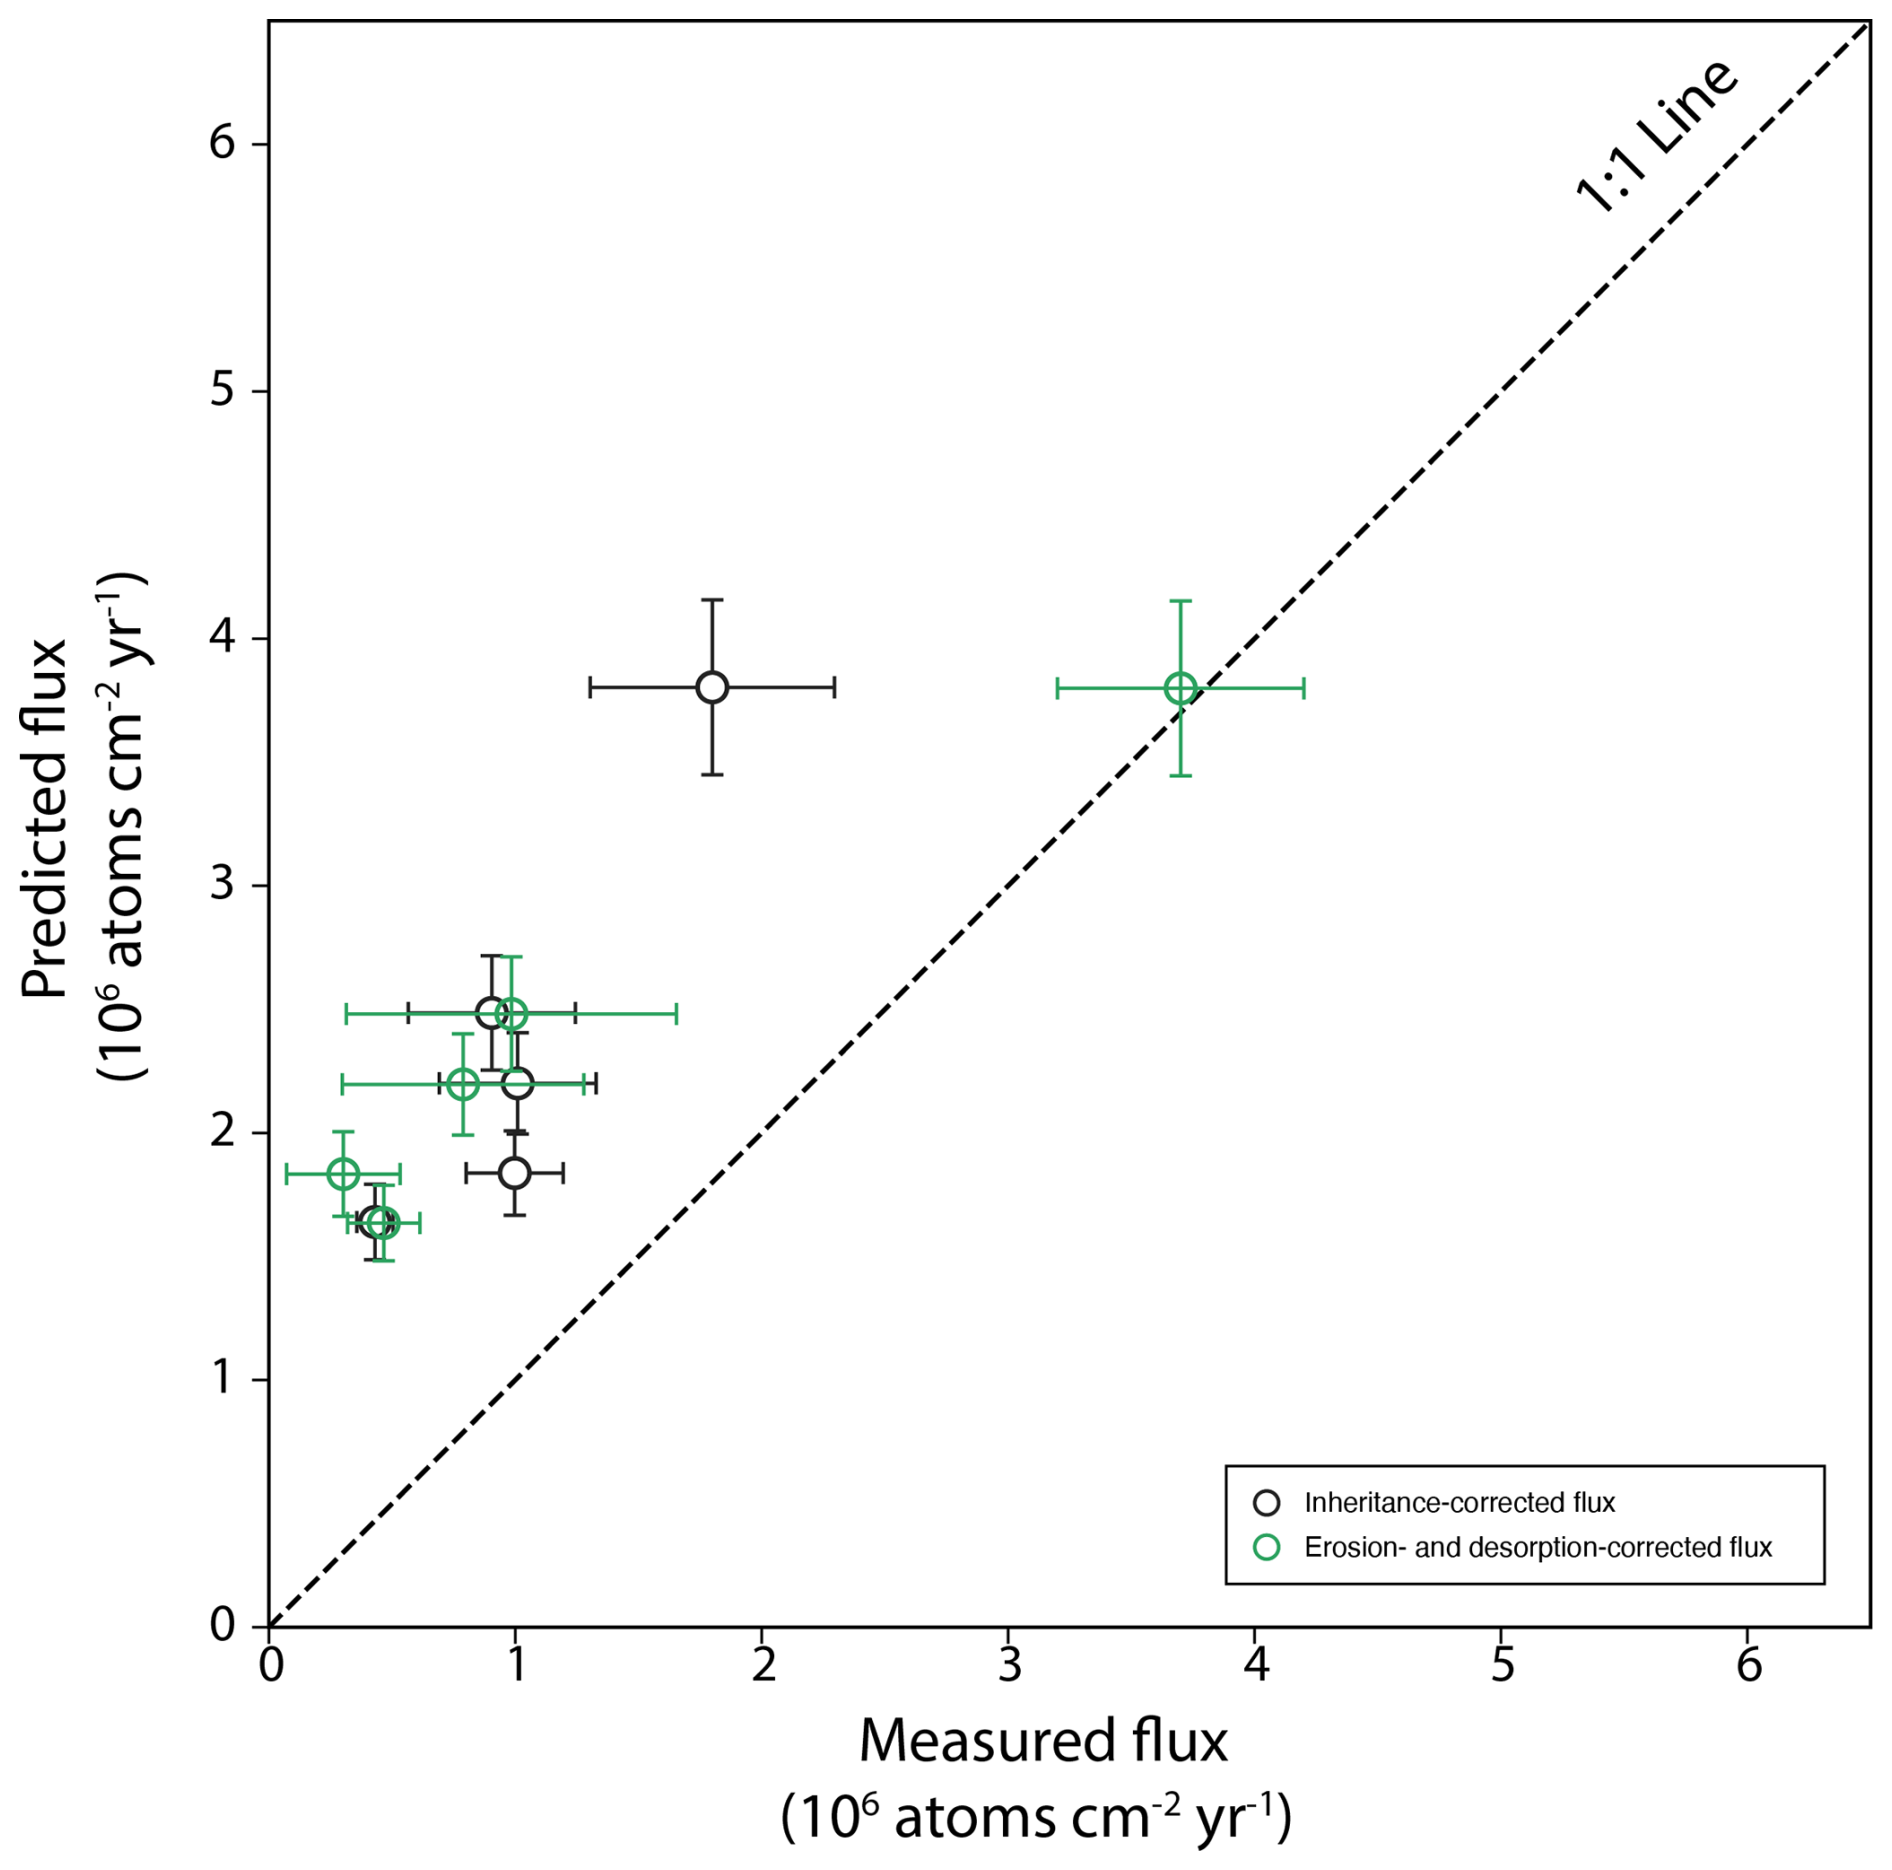
Figure 6Predicted 10Bemet flux from the empirical precipitation-based model of Graly et al. (2011), scaled to reflect Holocene-average values (e.g., Clow et al., 2020) versus measured flux values for the five study sites. Measured erosion- and desorption-corrected fluxes use the profile-average desorption model.
Fluxes predicted by an empirical precipitation- and latitude-based model (Graly et al., 2011) are 1.8–3.8 times higher than measured inheritance-corrected fluxes (Fig. 6). The predicted fluxes are 1.0 to 6.0 times higher than the observed erosion- and desorption-corrected values. The empirical formulation of Graly et al. (2011) predicts fluxes as a function of both latitude and precipitation rate. Since our sites have essentially the same latitude, the variability in the predicted fluxes solely represents differences in precipitation. Hence the cause of the discrepancy in measured and predicted fluxes may simply reflect a different proportionality between precipitation and flux in the Graly et al. (2011) dataset, which included a worldwide compilation of sites, and the East River dataset. GCM-based models predict 10Bemet fluxes of 1.46×10⁶ atoms cm−2 yr−1 (Heikkilä and von Blanckenburg, 2015), 1.63×10⁶ atoms cm−2 yr−1(Zheng et al., 2024, ECHAM6.3-HAM2.3), and 2.12×10⁶ atoms cm−2 yr−1 (Zheng et al., 2024, GEOS-Chem 14.1.1) for the East River watershed and its tributaries (Fig. 7). A single grid-cell from the GCM-models covers an area larger than the watershed, hence the models simulate the influence of meso-scale atmospheric dynamics on 10Bemet flux, but do not capture within-watershed 10Bemet variability caused by orographic precipitation. For example, the highest GCM-based flux prediction is 7–13 times greater than the lowest erosion and desorption-corrected flux inferred for the Washington Gulch South site, but our watershed-average predictions only differ from GCM-based predictions by a factor of 1.0 to 1.9. In general, the watershed-averaged predictions from the measured, inheritance-corrected inventories better match GCM-based fluxes than watershed average fluxes corrected for erosion and desorption, which tend to be higher (Fig. 7). An exception is the MAP-based watershed-average flux (1.10–1.57×10⁶ atoms cm−2 yr−1), which is lower than predictions based on elevation (1.30–2.04×10⁶ atoms cm−2 yr−1), snow depth (1.33–2.07×10⁶ atoms cm−2 yr−1), and SWE (1.43–2.34×10⁶ atoms cm−2 yr−1), which causes the erosion- and desorption-corrected fluxes to better align with the GCM-based predictions (Fig. 7). Hence, the GCM-based predictions generally fall within the range of our empirically estimated watershed-averaged flux values, although the degree of agreement depends on the predictor variable and whether or not fluxes are corrected for erosion and desorption.
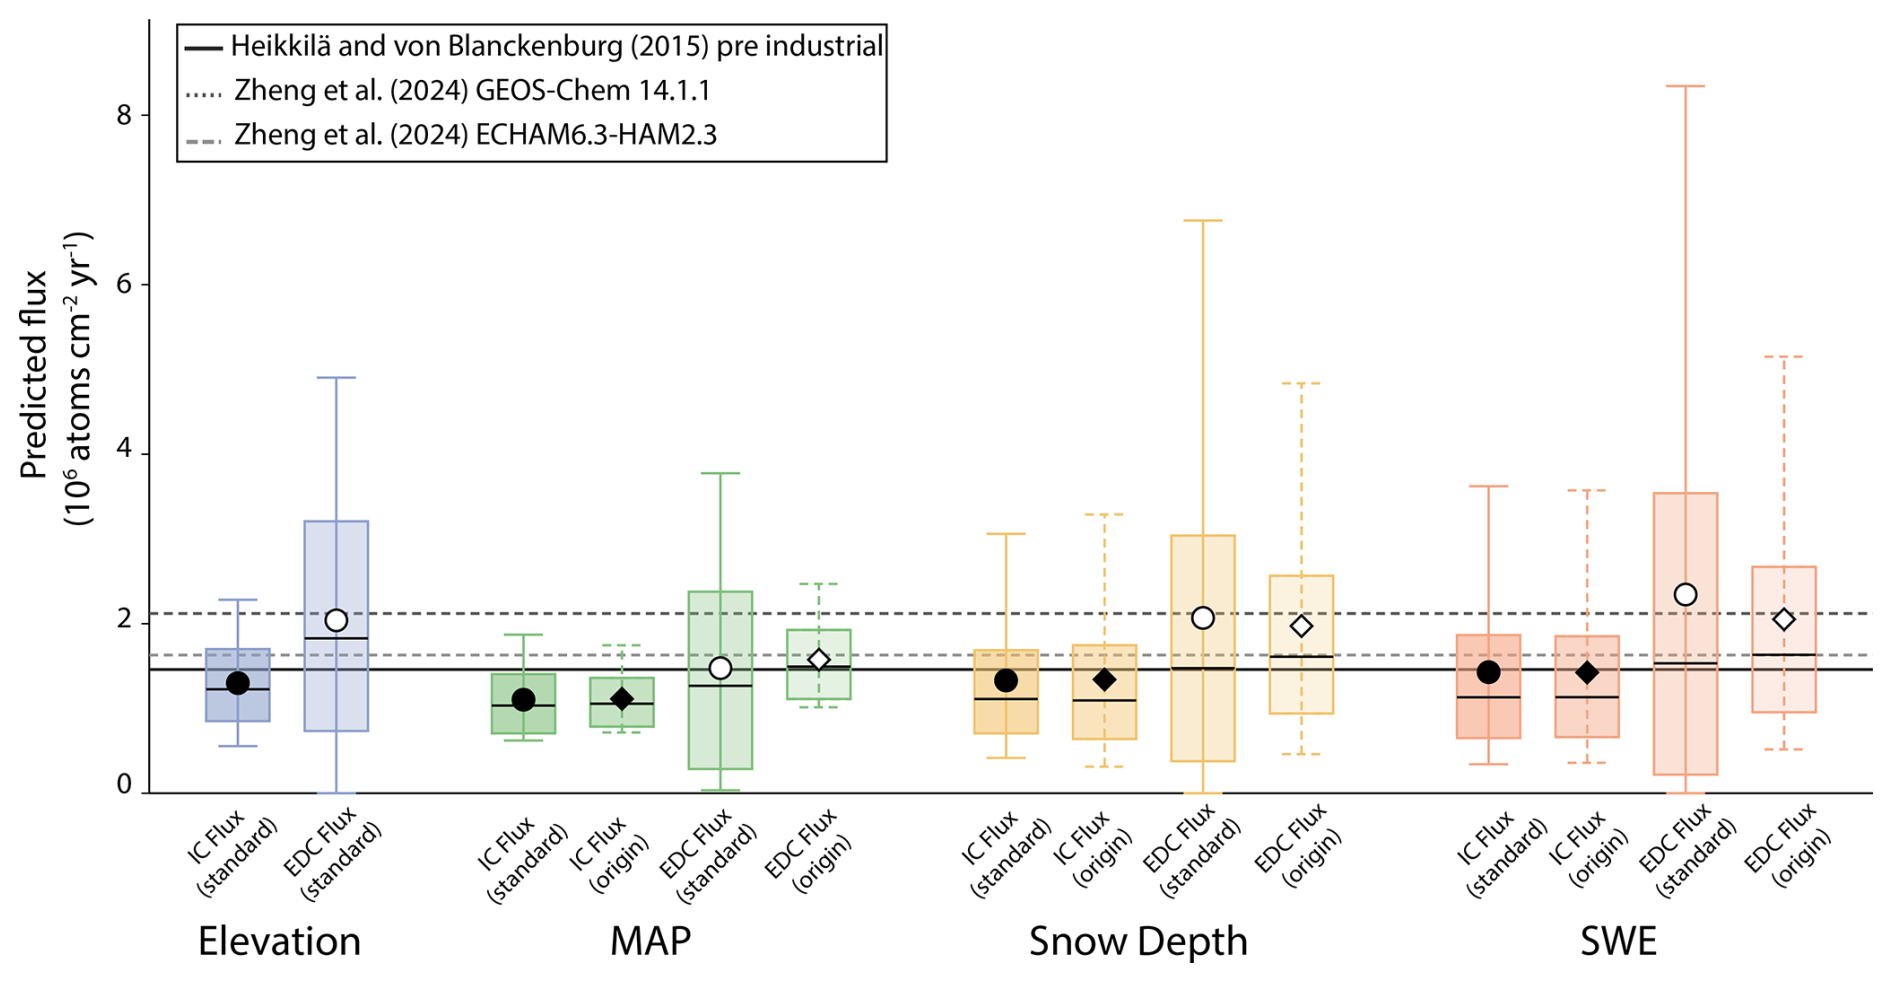
Figure 7Watershed-scale 10Bemet fluxes predicted by empirical models based on elevation, mean annual precipitation (MAP), mean snow depth, and mean snow water equivalent (SWE) and flux predictions from global circulation-based (GCM) models. Boxplots show the median (horizontal line), interquartile range, and 5th and 95th percentiles of flux values. Mean fluxes are shown with circles (standard regression models, left box) and diamonds (regression through origin models, right box). GCM-based flux predictions from Heikkilä and von Blanckenburg (2015) and Zheng et al. (2024) are shown as horizontal lines. IC indicates inheritance-corrected fluxes and EDC indicates erosion- and desorption-corrected fluxes calculated using the profile-average desorption model.
Soils contain 10Bemetscavenged from the atmosphere by aerosols, but also from dust particles that are derived from aeolian erosion and transported in the atmosphere before being deposited (Monaghan et al., 1986; Graly et al., 2011). The dust-derived or “recycled” 10Bemet can be as much as ∼20 % of the total flux (Monaghan et al., 1986; Graham et al., 2003). Although the dust contribution to flux estimates does not need to be independently known to quantify surface process rates, provided that time-averaged delivery of dust to soils is representative of the timescale relevant to the surface process rate under investigation, dust contributions should be accounted for before comparing measured fluxes against predictions from GCMs. Hence the comparison of measured 10Bemet fluxes against the GCM-based predictions is somewhat complicated by the likely contribution of dust to our measured values. The contribution of dust to 10Bemet inventories in the East River is unconstrained. Contemporary dust fluxes of 5–10 g m−2 yr−1 have been measured in the San Juan Mountains of Colorado (Lawrence et al., 2010), but recent dust deposition is much greater than average Holocene values (Neff et al., 2008). Long term dust fluxes in the Colorado Front Range are low (Dethier et al., 2012) and dust is thought to contribute <10 % of the total flux of 10Bemet (Ouimet et al., 2015). If the contribution of dust in the East River is comparable to that in the Front Range, accounting for dust would not substantially influence the magnitude of discrepancies between GCM-based predictions and our empirically derived 10Bemet flux estimates.
At a regional level, 10Bemet fluxes for the Colorado Front Range based on soil inventories have been estimated to be atoms cm−2 yr−1 (Ouimet et al., 2015). Soil inventory-based 10Bemet fluxes in the Wind River Mountains, Wyoming are and atoms cm−2 yr−1 for Pinedale- and Bull Lake-aged moraines, respectively (Clow et al., 2020). The 0.43–1.8×10⁶ atoms cm−2 yr−1 Fmet values and 0.31–3.70×10⁶ atoms cm−2 yr−1 Fcor values we measure are consistent with those from the Front Range and Wind River Mountains, though those sites are drier, with ∼500 mm yr−1 of mean annual precipitation in the Front Range (Ouimet et al., 2015) and 276 mm yr−1 at the Wind River Mountains sites (Clow et al., 2020), relative to the 585 to 1353 mm yr−1 precipitation at the five East River study sites. The driest site in the East River (terminal moraine, 585 mm yr−1 MAP) has Fmet and Fcor values of 0.43×10⁶ and 0.47×10⁶ atoms cm−2 yr−1, respectively, which are lower than fluxes inferred in the Front Range and Wind River Mountains. These comparisons suggest that precipitation contributes to regional differences in 10Bemet flux, but does not explain all of the variability among sites.
Local calibration of 10Bemet flux greatly increases the utility of 10Bemet as a tracer of surface processes in the East River watershed, where there is prevalent shale bedrock that is not very amenable to the more common 10Bein situ method. Our findings show that, whereas 10Bemet flux predictions from GCM-based models are broadly applicable for large-scale watershed applications, such models do not capture the high spatial variability in 10Bemet fluxes that is driven by orographic influences on precipitation. Hence using 10Bemet to quantify physical erosion and weathering rates at the small watershed or soil profile-scale requires not only local-scale calibration of 10Bemet fluxes, but also a means for predicting 10Bemet fluxes for sites where elevation and precipitation are different from that of the sites used for calibration. Our study demonstrates how high-resolution LiDAR elevation and snowpack datasets can be combined with locally calibrated 10Bemet flux measurements to generate spatially resolved flux predictions, which furthers our understanding of the processes that control the delivery of 10Bemet to soils.
Meteoric 10Be fluxes calculated from soil inventories on five glacial moraines dated to 13.0–17.9 ka in the East River watershed, Colorado, USA range from 0.43–1.8×10⁶ atoms cm−2 yr−1 when corrected for inheritance only and 0.31–3.70×10⁶ atoms cm−2 yr−1 after also taking loss of 10Be by erosion and desorption into account. Accounting for pH-dependent desorption substantially increases the estimated flux at the Copper Creek site where soil pH is lowest. The inheritance-corrected and erosion- and desorption-corrected fluxes vary systematically with environmental gradients across the watershed and are generally correlated with elevation, mean annual precipitation, snow depth, and snow water equivalent, reflecting the important role orographic precipitation plays in influencing spatial patterns of meteoric 10Be flux within the watershed. Elevation is the only predictor of flux that is not subject to temporal bias, whereas the snow-based predictions are based on only two years of measurements, and the magnitude and pattern of snow accumulation during those years may vary substantially from Holocene averages. However, the snow-based predictions yield insight into smaller-scale topographic controls on meteoric 10Be fluxes, such as predictions of lower fluxes on sharp ridge crests relative to adjacent hillslopes due to snow redistribution. The fluxes measured at the five moraines are lower by a factor of 1.0 to 6.0 than predictions from an empirical model relating flux and mean annual precipitation and latitude (Graly et al., 2011). Watershed-averaged fluxes predicted from empirical correlations between measured flux and elevation, mean annual precipitation, mean snow depth, and mean snow water equivalent are comparable to predictions from global-scale GCMs. Although the GCM models do not capture the spatial variation in flux within the watershed and are of less utility for soil profile-based applications, the GCM results provide useful estimates of watershed-scale flux. The findings highlight the large degree which meteoric 10Be fluxes vary within alpine landscapes and demonstrate how combining soil meteoric 10Be inventories and high-resolution gridded datasets can generate spatially-resolved meteoric 10Be flux predictions. Our results enhance the utility of meteoric 10Be as a tracer of surface processes in the East River watershed, and other alpine landscapes with rocks that are not conducive to using in situ-produced 10Be and add to our overall understanding of the factors that influence the delivery and retention of meteoric 10Be in soils.
Data are available at the U.S. Department of Energy ESS-DIVE archive (https://doi.org/10.15485/3025240; Marmolejo-Cossío et al., 2026).
The supplement related to this article is available online at https://doi.org/10.5194/gchron-8-547-2026-supplement.
JM: data curation, formal analysis, investigation, writing (original draft preparation); IL: conceptualization, funding acquisition, investigation, methodology, project administration, resources, supervision, writing (original draft preparation, reviewing and editing); EM: formal analysis, data curation, writing (reviewing and editing); AH: formal analysis, writing (reviewing and editing).
The contact author has declared that none of the authors has any competing interests.
Publisher's note: Copernicus Publications remains neutral with regard to jurisdictional claims made in the text, published maps, institutional affiliations, or any other geographical representation in this paper. The authors bear the ultimate responsibility for providing appropriate place names. Views expressed in the text are those of the authors and do not necessarily reflect the views of the publisher.
We thank J. Reithel at the Rocky Mountain Biological Laboratory for securing access to study sites, B. Quirk for assistance sampling, J. Deems for information on snow datasets, M. Winnick for use of a pH probe, and K. Deng and M. Zheng for helpful correspondence. This is LLNL-JRNL-2007359.
This research has been supported by the U.S. Department of Energy (grant no. DE-SC0020354 to Isaac J. Larsen). Prepared in part by Lawrence Livermore National Laboratory under Contract DE-AC52-07NA27344.
This paper was edited by Hella Wittmann and reviewed by two anonymous referees.
Bacon, A. R., Richter, D. D., Bierman, P. R., and Rood, D. H.: Coupling meteoric 10Be with pedogenic losses of 9Be to improve soil residence time estimates on an ancient North American interfluve, Geology, 40, 847–850, https://doi.org/10.1130/G33449.1, 2012.
Balco, G., Stone, J. O., Lifton, N. A., and Dunai, T. J.: A complete and easily accessible means of calculating surface exposure ages or erosion rates from 10Be and 26Al measurements, Quaternary Geochronol., 3, 174–195, https://doi.org/10.1016/j.quageo.2007.12.001, 2008.
Ball, D. F.: Stone pavements in soils of Caernarvonshire, North Wales, J. Soil Sci., 18, 103–108, https://doi.org/10.1111/j.1365-2389.1967.tb01491.x, 1967.
Barg, E., Lal, D., Pavich, M. J., Caffee, M. W., and Southon, J. R.: Beryllium geochemistry in soils: evaluation of ratios in authigenic minerals as a basis for age models, Chem. Geol., 140, 237–258, https://doi.org/10.1016/S0009-2541(97)00051-X, 1997.
Bierman, P. R. and Nichols, K. K.: Rock to sediment – slope to sea with 10Be – rates of landscape change, Annu. Rev. Earth Planet. Sci., 32, 215–255, https://doi.org/10.1146/annurev.earth.32.101802.120539, 2004.
Borchers, B., Marrero, S., Balco, G., Caffee, M., Goehring, B., Lifton, N., Nishiizumi, K., Phillips, F., Schaefer, J., and Stone, J.: Geological calibration of spallation production rates in the CRONUS-Earth project, Quaternary Geochronol., 31, 188–198, https://doi.org/10.1016/j.quageo.2015.01.009, 2016.
Boschi, V. and Willenbring, J. K.: The effect of pH, organic ligand chemistry and mineralogy on the sorption of beryllium over time, Environ. Chem., 13, 711–722, https://doi.org/10.1071/EN15107, 2016a.
Boschi, V. and Willenbring, J. K.: Beryllium desorption from minerals and organic ligands over time, Chem. Geol., 439, 52–58, https://doi.org/10.1016/j.chemgeo.2016.06.009, 2016b.
Brown, L.: Applications of Accelerator Mass Spectrometry, Annu. Rev. Earth Planet. Sci., 12, 39-59, https://doi.org/10.1146/ANNUREV.EA.12.050184.000351, 1984.
Brown, L.: 10Be: Recent applications in Earth sciences, Philos. T. R. Soc. Lond. A, 323, 75–86, 1987a.
Brown, L.: 10Be as a tracer of erosion and sediment transport, Chem. Geol. Isotope Geoscience Section, 65, 189–196, https://doi.org/10.1016/0168-9622(87)90002-9, 1987b.
Brown, L., Pavich, M. J., Hickman, R. E., Klein, J., and Middleton, R.: Erosion of the eastern United States observed with 10Be, Earth Surface Process. Land., 13, 441–457, https://doi.org/10.1002/esp.3290130509, 1988.
Brown, L., Stensland, G. J., Klein, J., and Middleton, R.: Atmospheric deposition of 7Be and 10Be, Geochim. Cosmochim. Ac., 53, 135–142, https://doi.org/10.1016/0016-7037(89)90280-9, 1989.
Campforts, B., Vanacker, V., Vanderborght, J., Baken, S., Smolders, E., and Govers, G.: Simulating the mobility of meteoric 10Be in the landscape through a coupled soil-hillslope model (Be2D), Earth Planet. Sc. Lett., 439, 143–157, https://doi.org/10.1016/j.epsl.2016.01.017, 2016.
Chmeleff, J., von Blanckenburg, F., Kossert, K., and Jakob, D.: Determination of the 10Be half-life by multicollector ICP-MS and liquid scintillation counting, Nuclear Instruments and Methods in Physics Research Section B: Beam Interactions with Materials and Atoms, 268, 192–199, https://doi.org/10.1016/j.nimb.2009.09.012, 2010.
Clow, T., Willenbring, J. K., Schaller, M., Blum, J. D., Christl, M., Kubik, P. W., and von Blanckenburg, F.: Calibrating a long-term meteoric 10Be delivery rate into eroding western US glacial deposits by comparing meteoric and in situ produced 10Be depth profiles, Geochronology, 2, 411–423, https://doi.org/10.5194/gchron-2-411-2020, 2020.
Daly, C., Halbleib, M., Smith, J. I., Gibson, W. P., Doggett, M. K., Taylor, G. H., Curtis, J., and Pasteris, P. P.: Physiographically sensitive mapping of climatological temperature and precipitation across the conterminous United States, Int. J. Climatol., 28, 2031–2064, https://doi.org/10.1002/joc.1688, 2008.
Dannhaus, N., Wittmann, H., Krám, P., Christl, M., and von Blanckenburg, F.: Catchment-wide weathering and erosion rates of mafic, ultramafic, and granitic rock from cosmogenic meteoric ratios, Geochim. Cosmochim. Ac., 222, 618–641, https://doi.org/10.1016/j.gca.2017.11.005, 2018.
Deng, K., Wittmann, H., and von Blanckenburg, F.: The depositional flux of meteoric cosmogenic 10Be from modeling and observation, Earth Planet. Sc. Lett., 550, 116530, https://doi.org/10.1016/J.EPSL.2020.116530, 2020a.
Deng, K., Yang, S., von Blanckenburg, F., and Wittmann, H.: Denudation rate changes along a fast-eroding mountainous river with slate headwaters in Taiwan from 10Be (meteoric)/9Be ratios, J. Geophys. Res.-Earth Surf., 125, e2019JF005251, https://doi.org/10.1029/2019JF005251, 2020b.
Deng, K., Wittmann, H., Hsieh, M. L., Yang, S., and von Blanckenburg, F.: Deposition and retention of meteoric 10Be in Holocene Taiwan river terraces, Quaternary Sci. Rev., 265, 107048, https://doi.org/10.1016/j.quascirev.2021.107048, 2021a.
Deng, K., Wittmann, H., Yang, S., and von Blanckenburg, F.: The upper limit of denudation rate measurement from cosmogenic 10Be (meteoric)/9Be ratios in Taiwan, J. Geophys. Res.-Earth Surf., 126, e2021JF006221, https://doi.org/10.1029/2021JF006221, 2021b.
Dethier, D. P., Birkeland, P. W., and McCarthy, J. A.: Using the accumulation of CBD- extractable iron and clay content to estimate soil age on stable surfaces and nearby slopes, Front Range, Colorado, Geomorphology, 173–174, 17–29, https://doi.org/10.1016/j.geomorph.2012.05.022, 2012.
Dixon, J. L., Chadwick, O. A., and Pavich, M. J.: Climatically controlled delivery and retention of meteoric 10Be in soils, Geology, 46, 899–902, https://doi.org/10.1130/G45176.1, 2018.
Dühnforth, M., Anderson, R. S., Ward, D. J., and Blum, A.: Unsteady late Pleistocene incision of streams bounding the Colorado Front Range from measurements of meteoric and in situ 10Be, J. Geophys. Res.-Earth Surf., 117, F01023, https://doi.org/10.1029/2011JF002232, 2012.
Egli, M., Brandová, D., Böhlert, R., Favilli, F., and Kubik, P. W.: 10Be inventories in Alpine soils and their potential for dating land surfaces. Geomorphology, 119, 62–73, https://doi.org/10.1016/J.GEOMORPH.2010.02.019, 2010.
Field, C. V., Schmidt, G. A., Koch, D., and Salyk, C.: Modeling production and climate-related impacts on 10Be concentration in ice cores, J. Geophys. Res.-Atmos., 111, D15107, https://doi.org/10.1029/2005JD006410, 2006.
Foster, M. A., Anderson, R. S., Wyshnytzky, C. E., Ouimet, W. B., and Dethier, D. P.: Hillslope lowering rates and mobile-regolith residence times from in situ and meteoric 10Be analysis, Boulder Creek Critical Zone Observatory, Colorado, Geol. Soc. Am. Bull., 127, 862–878, https://doi.org/10.1130/B31115.1, 2015.
Gaskill, D. L., Godwin, L. H., and Mutschler, F. E.: Geologic map of the Oh-Be-Joyful quadrangle, Gunnison County, Colorado, scale 1:24 000, U.S. Geological Survey, Geologic Quadrangle, 578, https://doi.org/10.3133/gq578, 1967.
Gaskill, D. L., Mutschler, F. E., Kramer, J. H., Thomas, J. A., and Zahony, S. G.: Geologic map of the Gothic quadrangle, Gunnison County, Colorado, scale 1:24 000, U.S. Geological Survey, Geologic Quadrangle, 1689, https://doi.org/10.3133/gq1689, 1991.
Gosse, J. C. and Phillips, F. M.: Terrestrial in situ cosmogenic nuclides: theory and application, Quaternary Sci. Rev., 20, 1475–1560, https://doi.org/10.1016/S0277-3791(00)00171-2, 2001.
Goulden, T., Hass, B., Brodie, E., Chadwick, K. D., Falco, N., Maher, K., Wainwright, H., and Williams, K.: NEON AOP Survey of Upper East River CO Watersheds: LAZ Files, LiDAR Surface Elevation, Terrain Elevation, and Canopy Height Rasters, Watershed Function SFA, ESS-DIVE [data set], https://doi.org/10.15485/1617203, 2020.
Graham, I., Ditchburn, R., and Barry, B.: Atmospheric deposition of 7Be and 10Be in New Zealand rain (1996–98), Geochim. Cosmochim. Ac., 67, 361–373, https://doi.org/10.1016/S0016-7037(02)01092-X, 2003.
Graly, J. A., Bierman, P. R., Reusser, L. J., and Pavich, M. J.: Meteoric 10Be in soil profiles – A global meta-analysis, Geochim. Cosmochim. Ac., 74, 6814–6829, https://doi.org/10.1016/J.GCA.2010.08.036, 2010.
Graly, J. A., Reusser, L. J., and Bierman, P. R.: Short and long-term delivery rates of meteoric 10Be to terrestrial soils, Earth Planet. Sc. Lett., 302, 329–336, https://doi.org/10.1016/j.epsl.2010.12.020, 2011.
Granger, D. E., Lifton, N. A., and Willenbring, J. K.: A cosmic trip: 25 years of cosmogenic nuclides in geology, Geol. Soc. Am. Bull., 125, 1379–1402, https://doi.org/10.1130/B30774.1, 2013.
Harden, J. W., Fries, T. L., and Pavich, M. J.: Cycling of beryllium and carbon through hillslope soils in Iowa, Biogeochemistry, 60, 317–335, https://doi.org/10.1023/A:1020308729553, 2002.
Harte, J. and Shaw, R.: Shifting dominance within a montane vegetation community: results of a climate-warming experiment, Science, 267, 876–880, https://doi.org/10.1126/science.267.5199.876, 1995.
Heflin, S., Abel, M., Biswas, S., Morales, A., Cifelli, R., Sedlar, J., Feldman, D., Chandrasekar, V., and Kennedy, P., 2024. X-band radar and surface-based observations of cold-season precipitation in western Colorado's complex terrain, J. Hydrometeorol., 25, 1501–1523, https://doi.org/10.1175/JHM-D-23-0147.1, 2024.
Heikkilä, U. and von Blanckenburg, F.: The global distribution of Holocene meteoric 10Be fluxes from atmospheric models: Distribution maps for terrestrial Earth's surface applications, GFZ Data Services [data set], https://doi.org/10.5880/GFZ.3.4.2015.001, 2015.
Heikkilä, U., Beer, J., and Alfimov, V.: Beryllium‐10 and beryllium‐7 in precipitation in Dübendorf (440 m) and at Jungfraujoch (3580 m), Switzerland (1998–2005), J. Geophys. Res.-Atmos., 113, D11104, https://doi.org/10.1029/2007JD009160, 2008.
Hubbard, S. S., Williams, K. H., Agarwal, D., Banfield, J., Beller, H., Bouskill, N., Brodie, E., Carroll, R., Dafflon, B., Dwivedi, D., Falco, N., Faybishenko, B., Maxwell, R., Nico, P., Steefel, C., Steltzer, H., Tokunaga, T., Tran, P. A., Wainwright, H., and Varadharajan, C.: The East River, Colorado, Watershed: A Mountainous Community Testbed for Improving Predictive Understanding of Multiscale Hydrological-Biogeochemical Dynamics, Vadose Zone J., 17, https://doi.org/10.2136/vzj2018.03.0061, 2018.
Jagercikova, M., Cornu, S., Bourlès, D., Antoine, P., Mayor, M., and Guillou, V.: Understanding long-term soil processes using meteoric 10Be: A first attempt on loessic deposits, Quaternary Geochronol., 27, 11–21, https://doi.org/10.1016/j.quageo.2014.12.003, 2015.
Johnson, D. L.: Subsurface stone lines, stone zones, artifact-manuport layers, and biomantles produced by bioturbation via pocket gophers (Thomomys bottae), American Antiquity, 54, 370–389, https://doi.org/10.2307/281712, 1989.
Jordan, C. E., Dibb, J. E., and Finkel, R. C.: tracer of atmospheric transport and stratosphere‐troposphere exchange, J. Geophys. Res.-Atmos., 108, 4234, https://doi.org/10.1029/2002JD002395, 2003.
Jungers, M. C., Bierman, P. R., Matmon, A., Nichols, K., Larsen, J., and Finkel, R.: Tracing hillslope sediment production and transport with in situ and meteoric 10Be, J. Geophys. Res.-Earth Surf., 114, F04020, https://doi.org/10.1029/2008JF001086, 2009.
Korschinek, G., Bergmaier, A., Faestermann, T., Gerstmann, U. C., Knie, K., Rugel, G., Wallner, A., Dillmann, I., Dollinger, G., Von Gostomski, C. L., and Kossert, K.: A new value for the half-life of 10Be by heavy-ion elastic recoil detection and liquid scintillation counting, Nuclear Instruments and Methods in Physics Research Section B: Beam Interactions with Materials and Atoms, 268, 187–191, https://doi.org/10.1016/j.nimb.2009.09.020, 2010.
Krone, L. V., Wittmann, H., and von Blanckenburg, F.: Precipitation control on weathering intensity and depositional flux of Meteoric 10Be revealed from soil profiles along a climate gradient (Chile), Geophys. Res. Lett., 51, e2024GL108825, https://doi.org/10.1029/2024GL108825, 2024.
Kwang, J. S., Thaler, E. A., Quirk, B. J., Quarrier, C. L., and Larsen, I. J.: A landscape evolution modeling approach for predicting three‐dimensional soil organic carbon redistribution in agricultural landscapes, J. Geophys. Res.-Biogeo., 127, e2021JG006616, https://doi.org/10.1029/2021JG006616, 2022.
Lal, D. and Peters, B.: Cosmic ray produced radioactivity on the Earth, in: Kosmische Strahlung II/Cosmic rays II, Springer-Verlag, Berlin Heidelberg, 551–612, https://doi.org/10.1007/978-3-642-46079-1_7, 1967.
Lawrence, C. R., Painter, T. H., Landry, C. C., and Neff, J. C.: Contemporary geochemical composition and flux of aeolian dust to the San Juan Mountains, Colorado, United States, J. Geophys. Res.-Biogeo., 115, G03007, https://doi.org/10.1029/2009JG001077, 2010.
Lynn, J. S., Canfield, S., Conover, R. R., Keene, J., and Rudgers, J. A.: Pocket gopher (Thomomys talpoides) soil disturbance peaks at mid-elevation and is associated with air temperature, forb cover, and plant diversity, Arct. Antarct. Alp. Res., 50, e1487659, https://doi.org/10.1080/15230430.2018.1487659, 2018.
Mackey, B. H., Roering, J. J., and McKean, J. A.: Long-term kinematics and sediment flux of an active earthflow, Eel River, California, Geology, 37, 803–806, https://doi.org/10.1130/G30136A.1, 2009.
Marmolejo-Cossío, J., Larsen, I., Marder, E., and Hidy, A.: Meteoric 10Be Flux Calibration Data for the East River Watershed, Colorado, USA. Abiotic and Biotic Controls on Chemical Weathering Rates and Solute Generation, ESS-DIVE repository [data set], https://doi.org/10.15485/3025240, 2026.
Masarik, J. and Beer, J.: Simulation of particle fluxes and cosmogenic nuclide production in the Earth's atmosphere, J. Geophys. Res.-Atmos., 104, 12099–12111, https://doi.org/10.1029/1998JD200091, 1999.
McHargue, L. R. and Damon, P. E.: The global beryllium 10 cycle, Rev. Geophys., 29, 141–158, https://doi.org/10.1029/91RG00072, 1991.
McKean, J. A., Dietrich, W. E., Finkel, R. C., Southon, J. R., and Caffee, M. W.: Quantification of soil production and downslope creep rates from cosmogenic 10Be accumulations on a hillslope profile, Geology, 21, 343–346, https://doi.org/10.1130/0091-7613(1993)021<0343:QOSPAD>2.3.CO;2, 1993.
Mital, U., Dwivedi, D., Brown, J. B., and Steefel, C. I.: Downscaled hyper-resolution (400 m) gridded datasets of daily precipitation and temperature (2008–2019) for the East–Taylor subbasin (western United States), Earth Syst. Sci. Data, 14, 4949–4966, https://doi.org/10.5194/essd-14-4949-2022, 2022.
Monaghan, M. C., Krishnaswami, S., and Thomas, J. H.: 10Be concentrations and the long-term fate of particle-reactive nuclides in five soil profiles from California, Earth Planet. Sc. Lett., 65, 51–60, https://doi.org/10.1016/0012-821X(83)90189-9, 1983.
Monaghan, M. C., Krishnaswami, S., and Turekian, K. K.: The global-average production rate of 10Be, Earth Planet. Sc. Lett., 76, 279–287, https://doi.org/10.1016/0012-821X(86)90079-8, 1986.
Monaghan, M. C., McKean, J., Dietrich, W., and Klein, J.: 10Be chronometry of bedrock-to-soil conversion rates, Earth Planet. Sc. Lett., 111, 483–492, https://doi.org/10.1016/0012-821X(92)90198-5, 1992.
Mudd, S. M., Attal, M., Milodowski, D. T., Grieve, S. W., and Valters, D. A.: A statistical framework to quantify spatial variation in channel gradients using the integral method of channel profile analysis, J. Geophys. Res.-Earth Surf., 119, 138–152, 2014.
Neff, J. C., Ballantyne, A. P., Farmer, G. L., Mahowald, N. M., Conroy, J. L., Landry, C. C., Overpeck, J. T., Painter, T. H., Lawrence, C. R., and Reynolds, R. L.: Increasing eolian dust deposition in the western United States linked to human activity, Nat. Geosci., 1, 189–195, https://doi.org/10.1038/ngeo133, 2008.
Nishiizumi, K., Imamura, M., Caffee, M. W., Southon, J. R., Finkel, R. C., and McAninch, J.: Absolute calibration of 10Be AMS standards, Nuclear Instruments and Methods in Physics Research Section B: Beam Interactions with Materials and Atoms, 258, 403–413, https://doi.org/10.1016/j.nimb.2007.01.297, 2007.
Ouimet, W., Dethier, D., Bierman, P., Wyshnytzky, C., Shea, N., and Rood, D. H.: Spatial and temporal variations in meteoric 10Be inventories and long-term deposition rates, Colorado Front Range, Quaternary Sci. Rev., 109, 1–12, https://doi.org/10.1016/J.QUASCIREV.2014.11.003, 2015.
Painter, T.: ASO L4 Lidar Snow Depth 3m UTM Grid. (ASO_3M_SD, Version 1), NASA National Snow and Ice Data Center Distributed Active Archive Center [data set], https://doi.org/10.5067/KIE9QNVG7HP0, 2018a.
Painter, T.: ASO L4 Lidar Snow Water Equivalent 50m UTM Grid. (ASO_50M_SWE, Version 1), NASA National Snow and Ice Data Center Distributed Active Archive Center [data set], https://doi.org/10.5067/M4TUH28NHL4Z, 2018b.
Painter, T. H., Berisford, D. F., Boardman, J. W., Bormann, K. J., Deems, J. S., Gehrke, F., Hedrick, A., Joyce, M., Laidlaw, R., Marks, D., and Mattmann, C.: The Airborne Snow Observatory: Fusion of scanning lidar, imaging spectrometer, and physically-based modeling for mapping snow water equivalent and snow albedo, Remote Sens. Environ., 184, 139–152, https://doi.org/10.1016/j.rse.2016.06.018, 2016.
Pavich, M. J., Brown, L., Klein, J., and Middleton, R.: 10Be accumulation in a soil chronosequence, Earth Planet. Sc. Lett., 68, 198–204, https://doi.org/10.1016/0012-821X(84)90151-1, 1984.
Panovska, S., Poluianov, S., Gao, J., Korte, M., Mishev, A., Shprits, Y. Y., and Usoskin, I.: Effects of global geomagnetic field variations over the past 100,000 years on cosmogenic radionuclide production rates in the Earth's atmosphere, J. Geophys. Res.-Space Phys., 128, e2022JA031158, https://doi.org/10.1029/2022JA031158, 2023.
Portenga, E. W., Bierman, P. R., Trodick, C. D., Greene, S. E., DeJong, B. D., Rood, D. H., and Pavich, M. J.: Erosion rates and sediment flux within the Potomac River basin quantified over millennial timescales using beryllium isotopes, Geol. Soc. Am. Bull., 131, 1295–1311, https://doi.org/10.1130/B31840.1, 2019.
Prather, R. M., Underwood, N., Dalton, R. M., Barr, B., and Inouye, B. D.: Climate data from the Rocky Mountain Biological Laboratory (1975–2022), Ecology, 104, e4153, https://doi.org/10.1002/ecy.4153, 2023.
Putkonen, J. and Swanson, T.: Accuracy of cosmogenic ages for moraines, Quaternary Res., 59, 255–261, https://doi.org/10.1016/S0033-5894(03)00006-1, 2003.
Quirk, B. J., Larsen, I. J., and Hidy, A. J.: Latest Pleistocene glacial chronology and paleoclimate reconstruction for the East River watershed, Colorado, USA, Quaternary Res., 119, 86–98, https://doi.org/10.1017/qua.2024.5, 2024.
Raisbeck, G., Yiou, F., Fruneau, M., Loiseaux, M., Lieuvin, M., Ravel, J. C., and Lorius, C.: Cosmogenic 10Be concentrations in Antarctic ice during the past 30,000 years, Nature, 292, 825–826, https://doi.org/10.1038/292825a0, 1981.
Reusser, L. J. and Bierman, P. R.: Using meteoric 10Be to track fluvial sand through the Waipaoa River basin, New Zealand, Geology, 38, 47–50, https://doi.org/10.1130/G30395.1, 2010.
Reusser, L., Graly, J., Bierman, P., and Rood, D.: Calibrating a long-term meteoric 10Be accumulation rate in soil, Geophys. Res. Lett., 37, L19403, https://doi.org/10.1029/2010GL044751, 2010.
Richardson, P. W., Perron, J. T., and Schurr, N. D.: Influences of climate and life on hillslope sediment transport, Geology, 47, 423–426, https://doi.org/10.1130/G45305.1, 2019.
Roe, G. H.: Orographic precipitation, Annu. Rev. Earth Planet. Sci., 33, 645–671, https://doi.org/10.1146/annurev.earth.33.092203.122541, 2005.
Stone, J. and Balco, G.: Extraction of beryllium-10 from soil by fusion, University of Washington Cosmogenic Nuclide Laboratory, 6 pp., https://depts.washington.edu/cosmolab/chem/fusionmethod.pdf (last access: 31 August 2026), 2004.
Stone, J. O. H.: A rapid fusion method for separation of beryllium-10 from soils and silicates, Geochim. Cosmochim. Ac., 62, 555–561, https://doi.org/10.1016/S0016-7037(97)00340-2, 1998.
Tran, A. P., Rungee, J., Faybishenko, B., Dafflon, B., and Hubbard, S. S.: Assessment of spatiotemporal variability of evapotranspiration and its governing factors in a mountainous watershed, Water, 11, 243, https://doi.org/10.3390/w11020243, 2019.
Tsai, H., Maejima, Y., and Hseu, Z. Y.: Meteoric 10Be dating of highly weathered soils from fluvial terraces in Taiwan, Quaternary Int., 188, 185–196, https://doi.org/10.1016/j.quaint.2007.06.007, 2008.
von Blanckenburg, F., Bouchez, J., and Wittmann, H.: Earth surface erosion and weathering from the 10Be (meteoric)/9Be ratio, Earth Planet. Sc. Lett., 351–352, 295–305, https://doi.org/10.1016/J.EPSL.2012.07.022, 2012.
West, N., Kirby, E., Bierman, P., and Clarke, B. A.: Aspect-dependent variations in regolith creep revealed by meteoric 10Be, Geology, 42, 507–510, https://doi.org/10.1130/G35357.1, 2014.
Willenbring, J. K. and von Blanckenburg, F.: Meteoric cosmogenic Beryllium-10 adsorbed to river sediment and soil: Applications for Earth-surface dynamics, Earth-Sci. Rev., 98, 105–122, https://doi.org/10.1016/J.EARSCIREV.2009.10.008, 2010.
Wittmann, H., von Blanckenburg, F., Dannhaus, N., Bouchez, J., Gaillardet, J., Guyot, J.L., Maurice, L., Roig, H., Filizola, N., and Christl, M.: A test of the cosmogenic 10Be (meteoric)/9Be proxy for simultaneously determining basin‐wide erosion rates, denudation rates, and the degree of weathering in the Amazon basin, J. Geophys. Res.-Earth Surf., 120, 2498–2528, https://doi.org/10.1002/2015JF003581, 2015.
Yamagata, T., Nagai, H., Matsuzaki, H., and Narasaki, Y.: Decadal variations of atmospheric 7Be and 10Be concentrations between 1998 and 2014 in Japan, Nuclear Instruments and Methods in Physics Research Section B: Beam Interactions with Materials and Atoms, 455, 265–270, https://doi.org/10.1016/j.nimb.2018.12.029, 2019.
You, C. F., Lee, T., and Li, Y. H.: The partition of Be between soil and water, Chem. Geol., 77, 105–118, https://doi.org/10.1016/0009-2541(89)90136-8, 1989.
Zheng, M., Adolphi, F., Sjolte, J., Aldahan, A., Possnert, G., Wu, M., Chen, P., and Muscheler, R.: Solar Activity of the Past 100 Years Inferred From 10Be in Ice Cores – Implications for Long‐Term Solar Activity Reconstructions, Geophys. Res. Lett., 48, e2020GL090896, https://doi.org/10.1029/2020GL090896, 2021.
Zheng, M., Adolphi, F., Ferrachat, S., Mekhaldi, F., Lu, Z., Nilsson, A., and Lohmann, U.: Modeling atmospheric transport of cosmogenic radionuclide 10Be using geos‐chem 14.1. 1 and echam6. 3‐ham2. 3: Implications for solar and geomagnetic reconstructions, Geophys. Res. Lett., 51, e2023GL106642, https://doi.org/10.1029/2023GL106642, 2024.