the Creative Commons Attribution 4.0 License.
the Creative Commons Attribution 4.0 License.
 | 07 Jun 2022
Technical note: Accelerator mass spectrometry of 10Be and 26Al at low nuclide concentrations
Alexandru T. Codilean
Réka-H. Fülöp
Steven Kotevski
Anna H. Rood
Dylan H. Rood
Alexander J. Seal
Krista Simon
Accelerator mass spectrometry (AMS) is currently the standard technique to measure cosmogenic 10Be and 26Al concentrations, but the challenge with measuring low nuclide concentrations is to combine high AMS measurement efficiency with low backgrounds. The current standard measurement setup at ANSTO uses the 3+ charge state with Ar stripper gas at 6 MV for Be and 4 MV for Al, achieving ion transmission through the accelerator for 10Be3+ and 26Al3+ of around 35 % and 40 %, respectively. Traditionally, 26Al measurement uncertainties are larger than those for 10Be. Here, however, we show that 26Al can be measured to similar precision as 10Be even for samples with 26Al 27Al ratios in the range of 10−15, provided that measurement times are sufficiently long. For example, we can achieve uncertainties of 5 % for 26Al 27Al ratios around , typical for samples of late Holocene age or samples with long burial histories. We also provide empirical functions between the isotope ratio and achievable measurement precision, which allow predictive capabilities for future projects and serve as a benchmark for inter-laboratory comparisons. For the smallest signals, not only is understanding the source of 10Be or 26Al background events required to select the most appropriate blank correction method but also the impact of the data reduction algorithms on the obtained nuclide concentration becomes pronounced. Here we discuss approaches to background correction and recommend quality assurance practices that guide the most appropriate background correction method. Our sensitivity analysis demonstrates a 30 % difference between different background correction methods for samples with 26Al 27Al ratios below 10−14. Finally, we show that when the measured signal is small and the number of rare isotope counts is also low, differing 26Al or 10Be concentrations may be obtained from the same data if alternate data reduction algorithms are used. Differences in the resulting isotope concentration can be 50 % or more if only very few (≲ 10) counts were recorded or about 30 % if single measurement is shorter than 10 min. Our study presents a comprehensive method for analysis of cosmogenic 10Be and 26Al samples down to isotope concentrations of a few thousand atoms per gram of sample, which opens the door to new and more varied applications of cosmogenic nuclide analysis.
- Article
(1928 KB) - Full-text XML
- BibTeX
- EndNote


Cosmogenic nuclides are now routinely applied in the Earth sciences (Schaefer et al., 2022). Over the past three decades, the technique has revolutionised the field of quantitative geomorphology (e.g. Granger and Schaller, 2014; Dixon and Riebe, 2014) and has made important contributions to the reconstruction of glacier chronologies and past climate changes (e.g. Ivy-Ochs and Briner, 2014; Balco, 2019). While cosmogenic 10Be has been the workhorse for Earth science applications, 26Al – as part of the 26Al 10Be nuclide pair – has also been widely applied in studies of burial dating (e.g. Granger, 2006; Balco and Rovey, 2008) and in settings where material has experienced a complex exposure history. The latter includes landforms repeatedly covered by ice (Knudsen and Egholm, 2018, and references therein) and the sediment of large river basins (Fülöp et al., 2020; Wittmann et al., 2020).
Accelerator mass spectrometry (AMS) is currently the standard technique to measure cosmogenic 10Be and 26Al concentrations, and while the majority of routine samples yield 10Be 9Be or 26Al 27Al ratios or above, more recent applications often push the limits of the technique. Examples of such applications, routinely yielding isotope ratios on order of 10−14–10−15, include dating of young glacial deposits (Schaefer et al., 2009), using onshore and offshore bedrock and sediment cores to reconstruct the glaciation histories of polar regions (Bierman et al., 2016; Schaefer et al., 2016; Shakun et al., 2018) or to reconstruct palaeo-erosion rate records (Lenard et al., 2020; Mariotti et al., 2021; Mandal et al., 2021; see also Codilean and Sadler, 2021), estimating coastal cliff retreat rates (Hurst et al., 2016; Swirad et al., 2020) or denudation rates in rapidly uplifting terrain (Derrieux et al., 2014; Siame et al., 2011), dating of old ice (Auer et al., 2009), and search for supernova signatures (Feige et al., 2018). Furthermore, recent refinements to burial dating models (Knudsen et al., 2020) will likely translate into an increase in isochron burial dating applications in the near future. These applications will require accurate and precise determination of 26Al 27Al ratios that are often close to background values.
The above applications are not only pushing the limits of the technique but also require increased sample numbers. The answer to both challenges at some level is to optimise and improve the AMS measurement efficiency. In this study, we quantify the measurement losses that limit the achievable measurement sensitivity for 10Be and 26Al analyses at ANSTO's AMS facilities, discuss approaches to background correction for low ratio 10Be and 26Al measurements, and discuss approaches to calculating nuclide concentrations from small numbers of rare isotope counts. Although the data presented here are specific to the setup at ANSTO, the conclusions drawn from these data are more widely applicable.
The principle behind an AMS measurement, including that of 10Be and 26Al, is as follows (e.g. Finkel and Suter, 1993; Fifield, 1999; Synal, 2013): negative ions are extracted from the sample via Cs sputtering (e.g. Middleton, 1983; Southon and Santos, 2007) and after electrostatic and magnetic analysis ions with selected mass to charge ratio are injected into an accelerator. In the accelerator terminal the ions undergo collisions with gas molecules (or a solid foil may also be used) that result in molecule breakup and the injected ions leaving the terminal with a range of charge states. A second electrostatic and magnetic analysis, after the accelerator, is used to select the mass to charge ratio for the final ion detection.
Recent important technical improvements in the AMS method are summarised by Synal (2013). In the context of 10Be and 26Al, these improvements include:
- i.
molecular breakup at 1+ charge state (Lee et al., 1984; Suter et al., 1997; Synal et al., 2000);
- ii.
development of He gas strippers (Lachner et al., 2014; Müller et al., 2015);
- iii.
development of ion detection methods to suppress 10B interference at low energies (Grajcar et al., 2004, 2007; Müller et al., 2008, 2010);
- iv.
development of the gas-filled magnet method to enable magnesium suppression for 26Al measurements using AlO− ions (Paul et al., 1989; Arazi et al., 2004; Fifield et al., 2007; Miltenberger et al., 2017).
As a result of the above technical improvements, it is now possible to measure 10Be and 26Al with accelerators that range from a few hundred kV to 10 MV or larger. In general all these varying measurement methods can achieve backgrounds that are sufficient for the majority of routine samples with 10Be 9Be or 26Al 27Al ratios or above, and have led to increased accessibility with a growing number of AMS facilities that are capable of measuring cosmogenic nuclides. However, a challenge is posed by samples with low nuclide concentrations because the losses during the measurement will directly affect the sensitivity and achievable statistical precision.
AMS measurement efficiency is characterised by losses in: (i) ion source, (ii) ion transport, (iii) charge state yields, and (iv) ion detection. Understanding, quantifying, and subsequently minimising these losses will improve the measurement sensitivity and increase the achievable statistical precision for 10Be and 26Al analysis. Typically the largest losses arise from the inefficient negative ionisation in the ion source, with lesser but still significant losses in the transmission of the ions through the accelerator and ion detection.
2.1 Measurement of 10Be
Unfortunately beryllium does not form negative ions as readily as carbon, for example, and the achieved ionisation efficiencies for beryllium are much lower. Standard practice is to use molecular BeO− ions for 10Be measurement as they are more prolific than elemental negative beryllium ions (Middleton, 1989). Nevertheless, the highest reported ionisation efficiencies using BeO− are ∼ 3 % (Middleton, 1989; Rood et al., 2010; Wilcken et al., 2019), whereas for C− values between 10 % and 30 % have been reported (Fallon et al., 2007; Hlavenka et al., 2017; Yokoyama et al., 2010). The poor negative ion yield for Be and Al (see Sect. 2.2) is sometimes taken to be an inherent limitation of the technique, rather than a challenge to be addressed.
There is significant scope for improvement in the performance and operation of negative ion Cs-sputter sources in terms of their stability, consistency, sample consumption, and efficiency. However, this is challenging as some design considerations are somewhat contradictory, e.g. to ensure expedient sample consumption the sputtering rate of the material needs to be high which in turn makes it difficult to keep the source insulators clean. The lack of a well-understood theoretical model for the negative ionisation process further adds to the engineering challenges. Modifications to the source design that improve longevity, stability, optimise the sample consumption, and improve negative ionisation probability are equally important. Practical methods to optimise sample consumption and negative ionisation include: (i) optimising the shape of the sample holder, (ii) changing the position that the sample is loaded in relative to the sample holder, (iii) using different binding materials and amounts relative to the amount of sample material, (iv) optimising the position of the sample within the ion source, and (v) finding the optimal operating conditions for each ion source. Inconveniently, different ion source designs require their own optimisations, and different isotopes are likely to behave differently with the same ion source. For example, the optimal recess depth where the sample is loaded within the sample holder is different between C−, BeO−, and Al− ions (Yokoyama et al., 2010; Auer et al., 2007; Hunt et al., 2006, 2007).
Table 1Beam transmission for 9Be ions injected as 9Be16O− for 1+, 2+, and 3+ charge states at selected accelerator terminal voltages (TV) for Ar and He stripper gases using ANSTO's VEGA and SIRIUS accelerators.
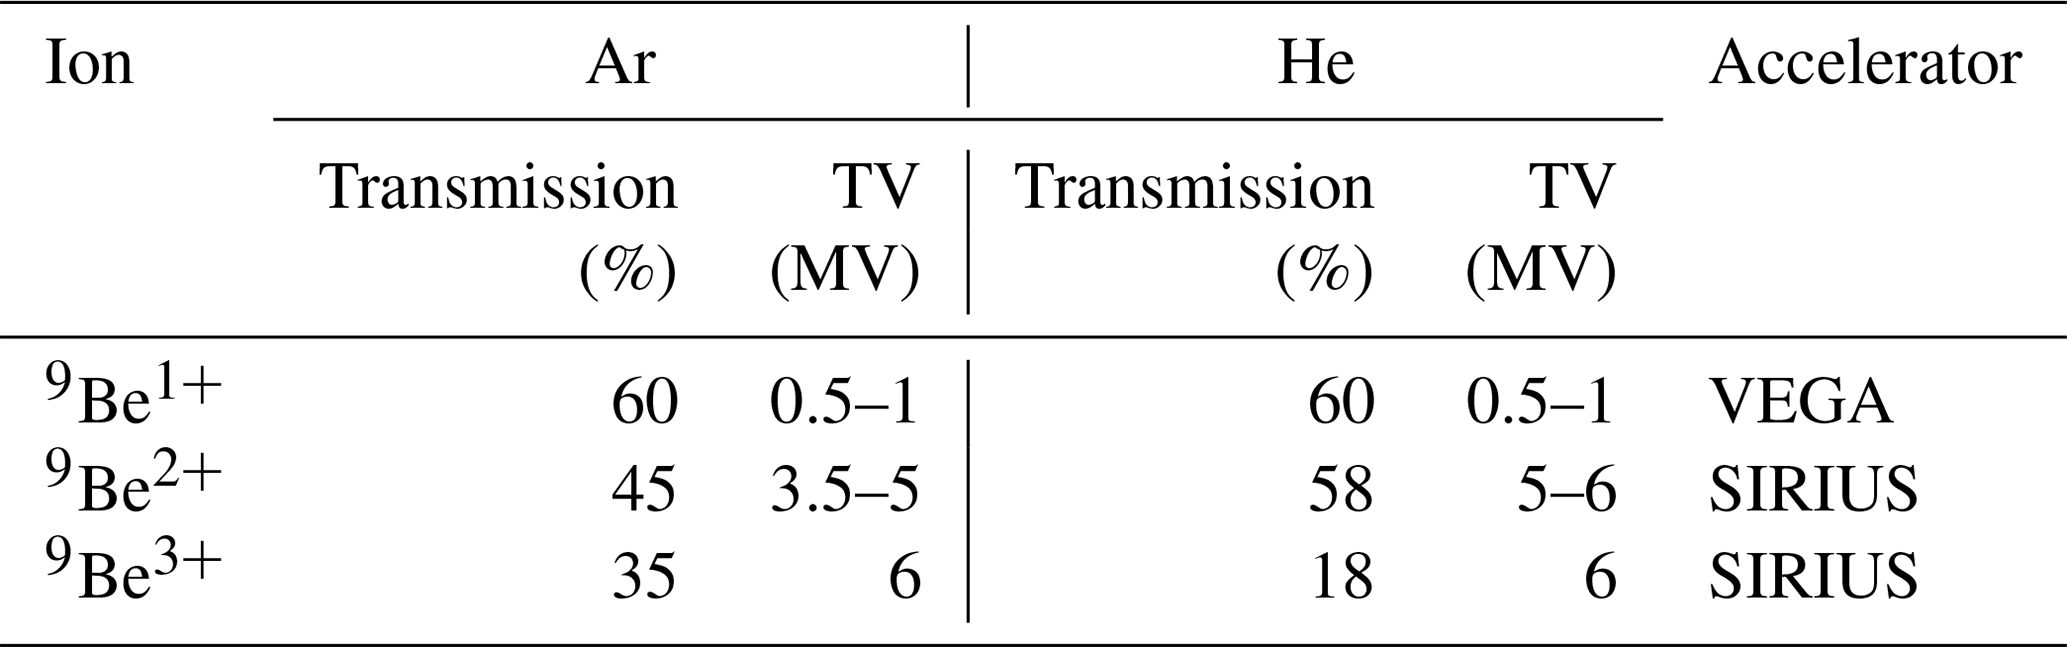
The nature of tandem acceleration is that only a certain fraction of the negative ions that are injected into the accelerator go into the positive charge state that is selected for analysis. This is the second most significant loss in the AMS measurement. Table 1 shows the transmission of the 9Be ions when injected as 9Be16O− for 1+, 2+, and 3+ charge states with Ar and He stripper gases at accelerator voltages that yield maximum transmission for the given charge state and stripper gas. Selecting the most prominent charge state is an advantage but impacts the ion detection as will be discussed below.
The accelerator terminal voltage that is required to reach maximum transmission under equilibrium charge state distributions for both Ar and He are displayed in Table 1, collating measurements on ANSTO's 1 MV VEGA (Wilcken et al., 2015) and 6 MV SIRIUS (Wilcken et al., 2017) accelerators using BeO− ions. In our case, charge states 1+, 2+, and 3+ are all a viable option given that we have 1 and 6 MV accelerators that can be used for the 10Be measurement. Table 1 shows that charge state losses can be minimised if 1+ or 2+ ions are selected for analysis with maximum transmission being ∼ 60 % with Ar and/or He stripper gases. For 1+, the maximum yield is achieved around 0.5–1 MV (Ar and He), whereas 2+ transmission peaks occur around 3.5–5 MV with Ar but later around 5–6 MV with He. We cannot reach the charge state peak for 3+ either with Ar or He with the maximum 6 MV acceleration voltage, where the measured transmissions are ∼ 35 % and ∼ 18 %, respectively.
Currently, our standard measurement setup uses the 3+ charge state with Ar stripper gas at 6 MV accelerator voltage. This is combined with the conventional passive absorber cell method where the interfering 10B ions are stopped within the absorber cell in front of the ion detector whilst 10Be ions pass through (Klein et al., 1982; Raisbeck et al., 1984). The method offers an effective suppression of 10B (see Sect. 3.1) without compromising the measurement efficiency. The measured unnormalised 10Be 9Be ratio of a standard material is typically between 80 % and 90 % of the reference value, which is the result of transmission differences between 9Be and 10Be and losses during ion detection. Whilst measurements of 10Be 9Be ratios at the level 10−16 or below are possible (Wilcken et al., 2019), typically the blank samples are in the range from 3 × 10⁻¹⁶ to 3 × 10⁻¹⁵. These blank levels do not include any additional boron correction and depend on the carrier used and the sample preparation laboratory where the samples were prepared.
The above measurement setup is preferred over low energy 1+ measurements (Wilcken et al., 2015) because the total measurement efficiency is higher; that is, even though the transmission to 1+ charge state at 1 MV through the accelerator is 60 %, which is nearly double what is achieved to 3+ at 6 MV, the losses in the ion detection to suppress 10B interference in our case mean that the total efficiency is currently a factor of ∼ 3 lower when using the 1+ instead of the 3+ method.
Recently it has been demonstrated that the high transmission of 55 % to 2+ at 3 MV can be used for 10Be measurements and backgrounds below 7 × 10⁻¹⁶ without significant losses in the ion detection efficiency (Steier et al., 2019). In our case we have ion optical losses when running the accelerator around 3–4 MV and reach only about 45 % transmission with Ar, as opposed to 55 % reported by Steier et al. (2019). Alternatively using He stripping the 2+ peak occurs later around 5–6 MV and we observe close to 60 % transmission. However, our stripper design is currently not able to contain He to a sufficient thickness to suppress the molecular interferences and using it for 10Be measurements is not practical. Furthermore, we have not assessed how the suppression of 10B or other interferences compares with our current standard method, and hence will not discuss this approach further.
2.2 Measurement of 26Al
Similar to, but worse than, 10Be, low ionisation efficiency is the major challenge for 26Al measurements. For 26Al, one is faced with two options as the measurements can be done by either using Al− or AlO− beams. A distinct advantage of using Al− is that 26Mg does not form stable negative ions and the measurement of 26Al becomes free from isobaric interferences. Unfortunately, the highest reported ionisation efficiencies for Al− are around 0.2 % (Middleton, 1989; Auer et al., 2007; Wilcken et al., 2017). In contrast, the molecular AlO− beam is typically on the order of 10–20 times higher than Al−, but ion detection of 26Al requires suppression of the interfering 26Mg ions that are injected into the accelerator as 26MgO−. Whilst the separation of 26Al and 26Mg can be done using the gas-filled magnet technique (Paul et al., 1989; Arazi et al., 2004; Fifield et al., 2007; Miltenberger et al., 2017), the latter requires large accelerators (≳ 6 MV) and one may need to compromise the efficiency of ion transport and detection, which would reduce the advantage of the higher ionisation yield. An alternative emerging technique involves the use of lasers to suppress the 26MgO− ions after the ion source (Martschini et al., 2019; Lachner et al., 2019, 2021).
We use Al− for the measurement of 26Al and therefore the challenge almost entirely becomes optimising the ion source performance. Beyond the low ionisation efficiency of Al−, there is the well-known characteristic of ion source output decreasing during the course of a run. An example of this is provided in Fig. 1, which shows traces of 27Al− currents as a function of time from cathodes analysed during two separate runs. Traces in grey to black lines show a drastic reduction in output when we returned to them after a break-off ∼ 60 h that had been spent on measuring other samples that were part of the same run. When returned to these samples the output dropped to 200–300 nA despite being in the order of 800–1000 nA before the break. In contrast, the second set of samples (shown in shades of blue) analysed during a separate run shows no sign of the output deteriorating during the course of the run. Whilst earlier work by Middleton (1983) showed that higher sputtering voltages yield an increase in Al− output, we observed that this might be sometimes overshadowed by deterioration in the source output, as with 4.5 kV sputtering voltages (blue profiles) in Fig. 1 the samples performed much more consistently as a function of time than with 6.5 kV sputtering voltages (grey profiles). However, whilst we are confident that the difference in longevity of the source is not simply a matter of quality in target preparation and/or packing, as the feature existed across multiple samples from different sources, we are not suggesting that the increased longevity is solely due to lower sputtering voltage. We cannot control all the parameters, such as the amount of Cs in the source between experiments, and therefore we cannot isolate the cause for the observed improvement in longevity.
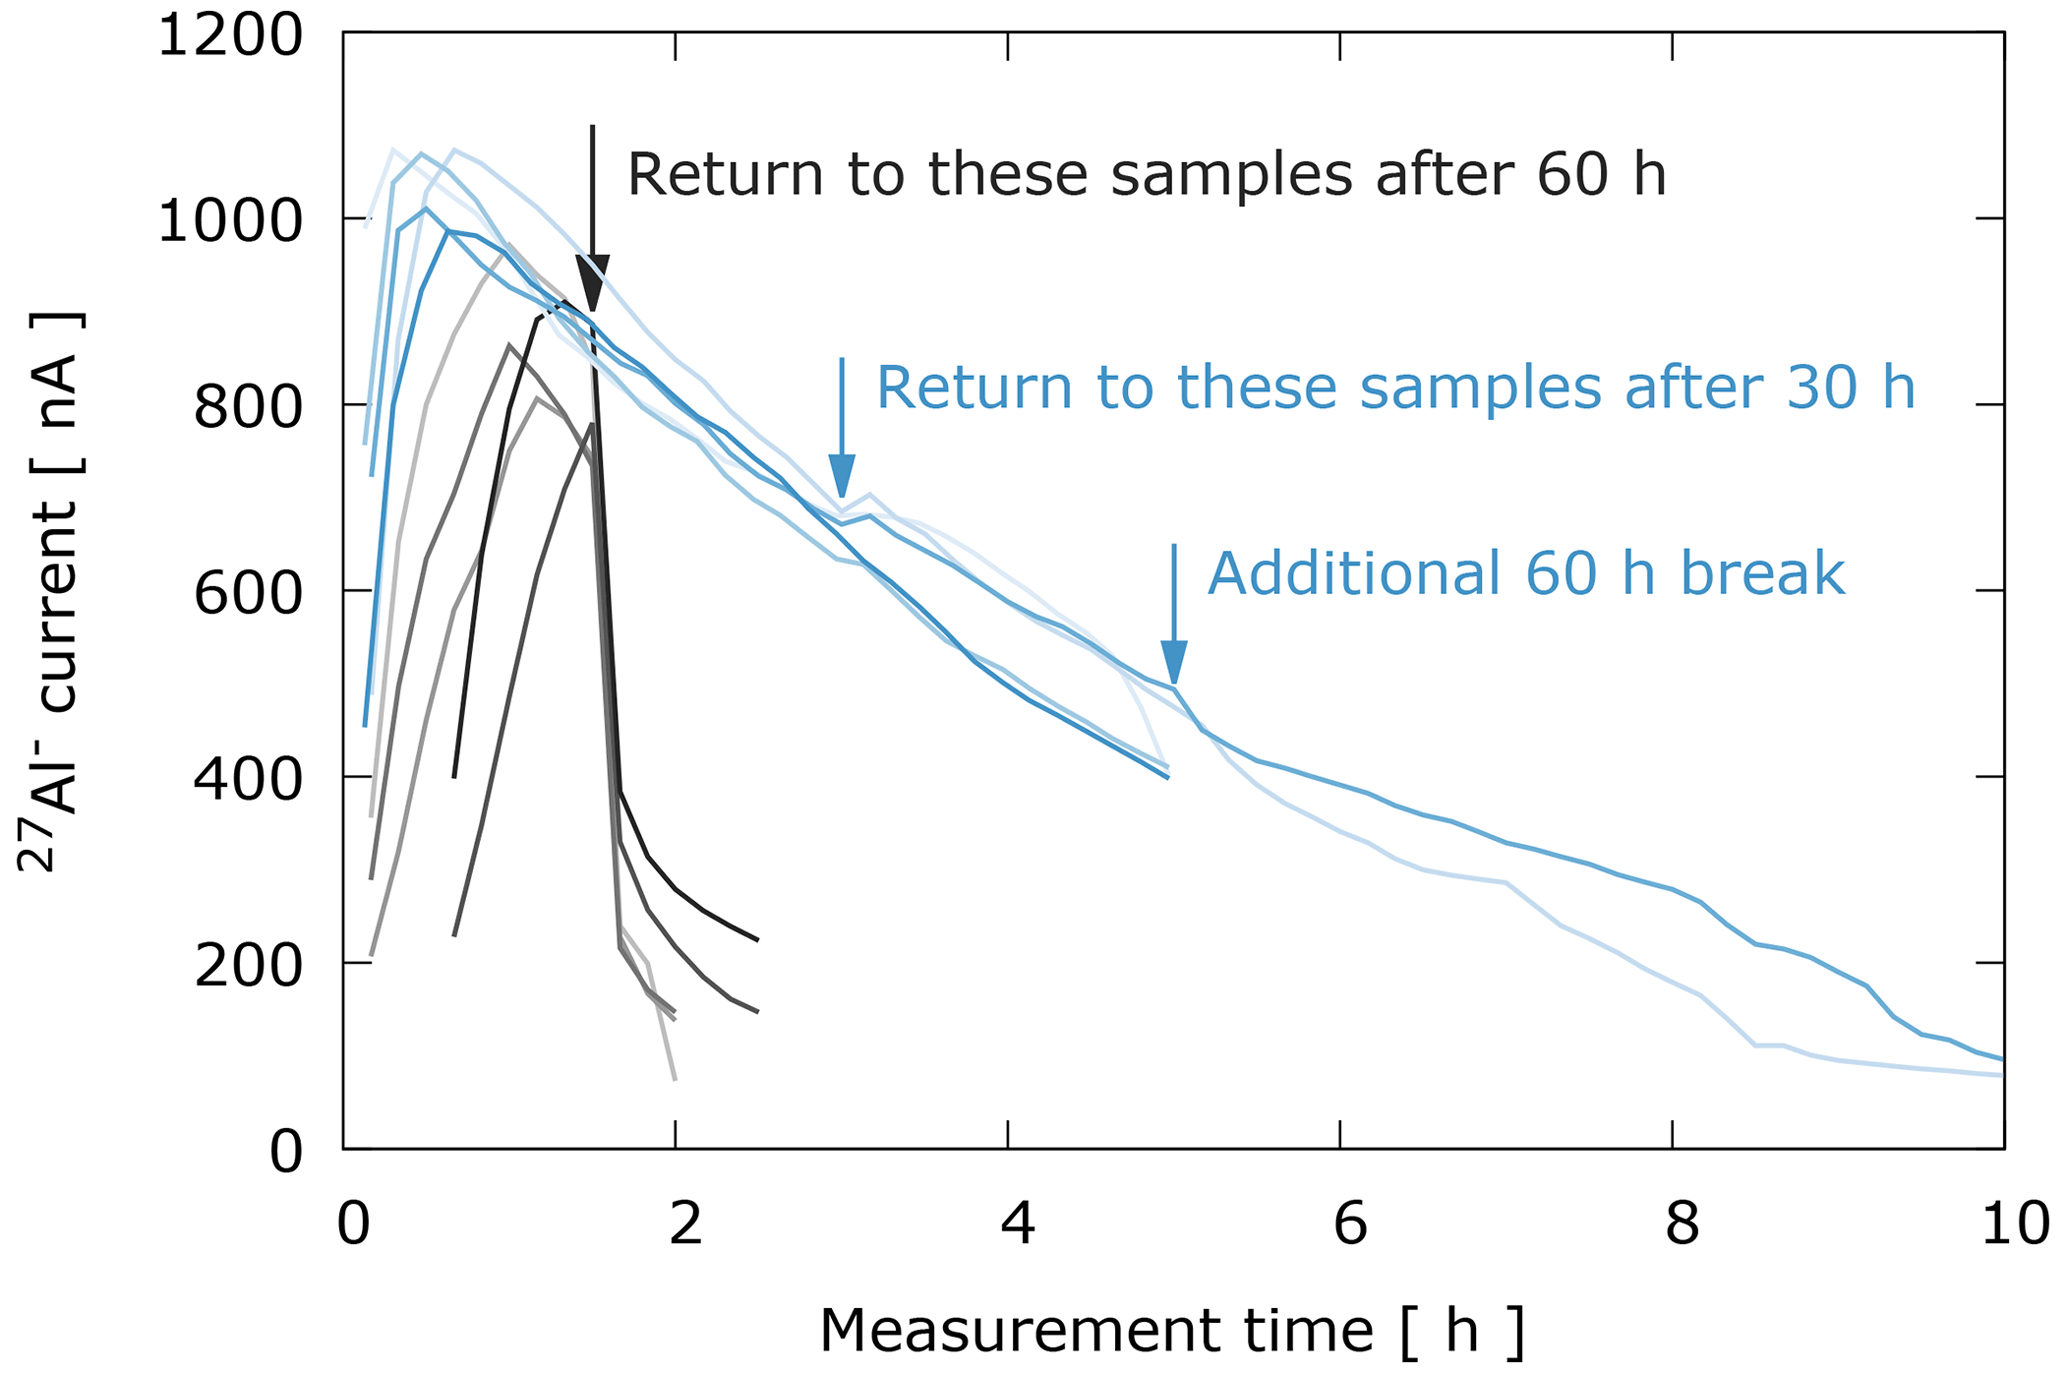
Figure 127Al− output as a function of time for a representative set of samples from two different runs highlighting the idiosyncratic behaviour of Cs-sputter sources.
The difference in the source stability, as shown in Fig. 1, highlights the reason why it is often difficult to achieve the theoretical efficiency from real samples. Another practical issue that hinders the measurement of 26Al is that samples typically vary in outputs when compared with standard reference materials. To quantify the latter, Fig. 2 shows histograms of sample outputs relative to the primary standard KN-4-2 (Nishiizumi, 2004) from three different sample preparation laboratories: ANSTO, University of Wollongong (UOW), and CosmIC Laboratories at Imperial College London (IMPERIAL).
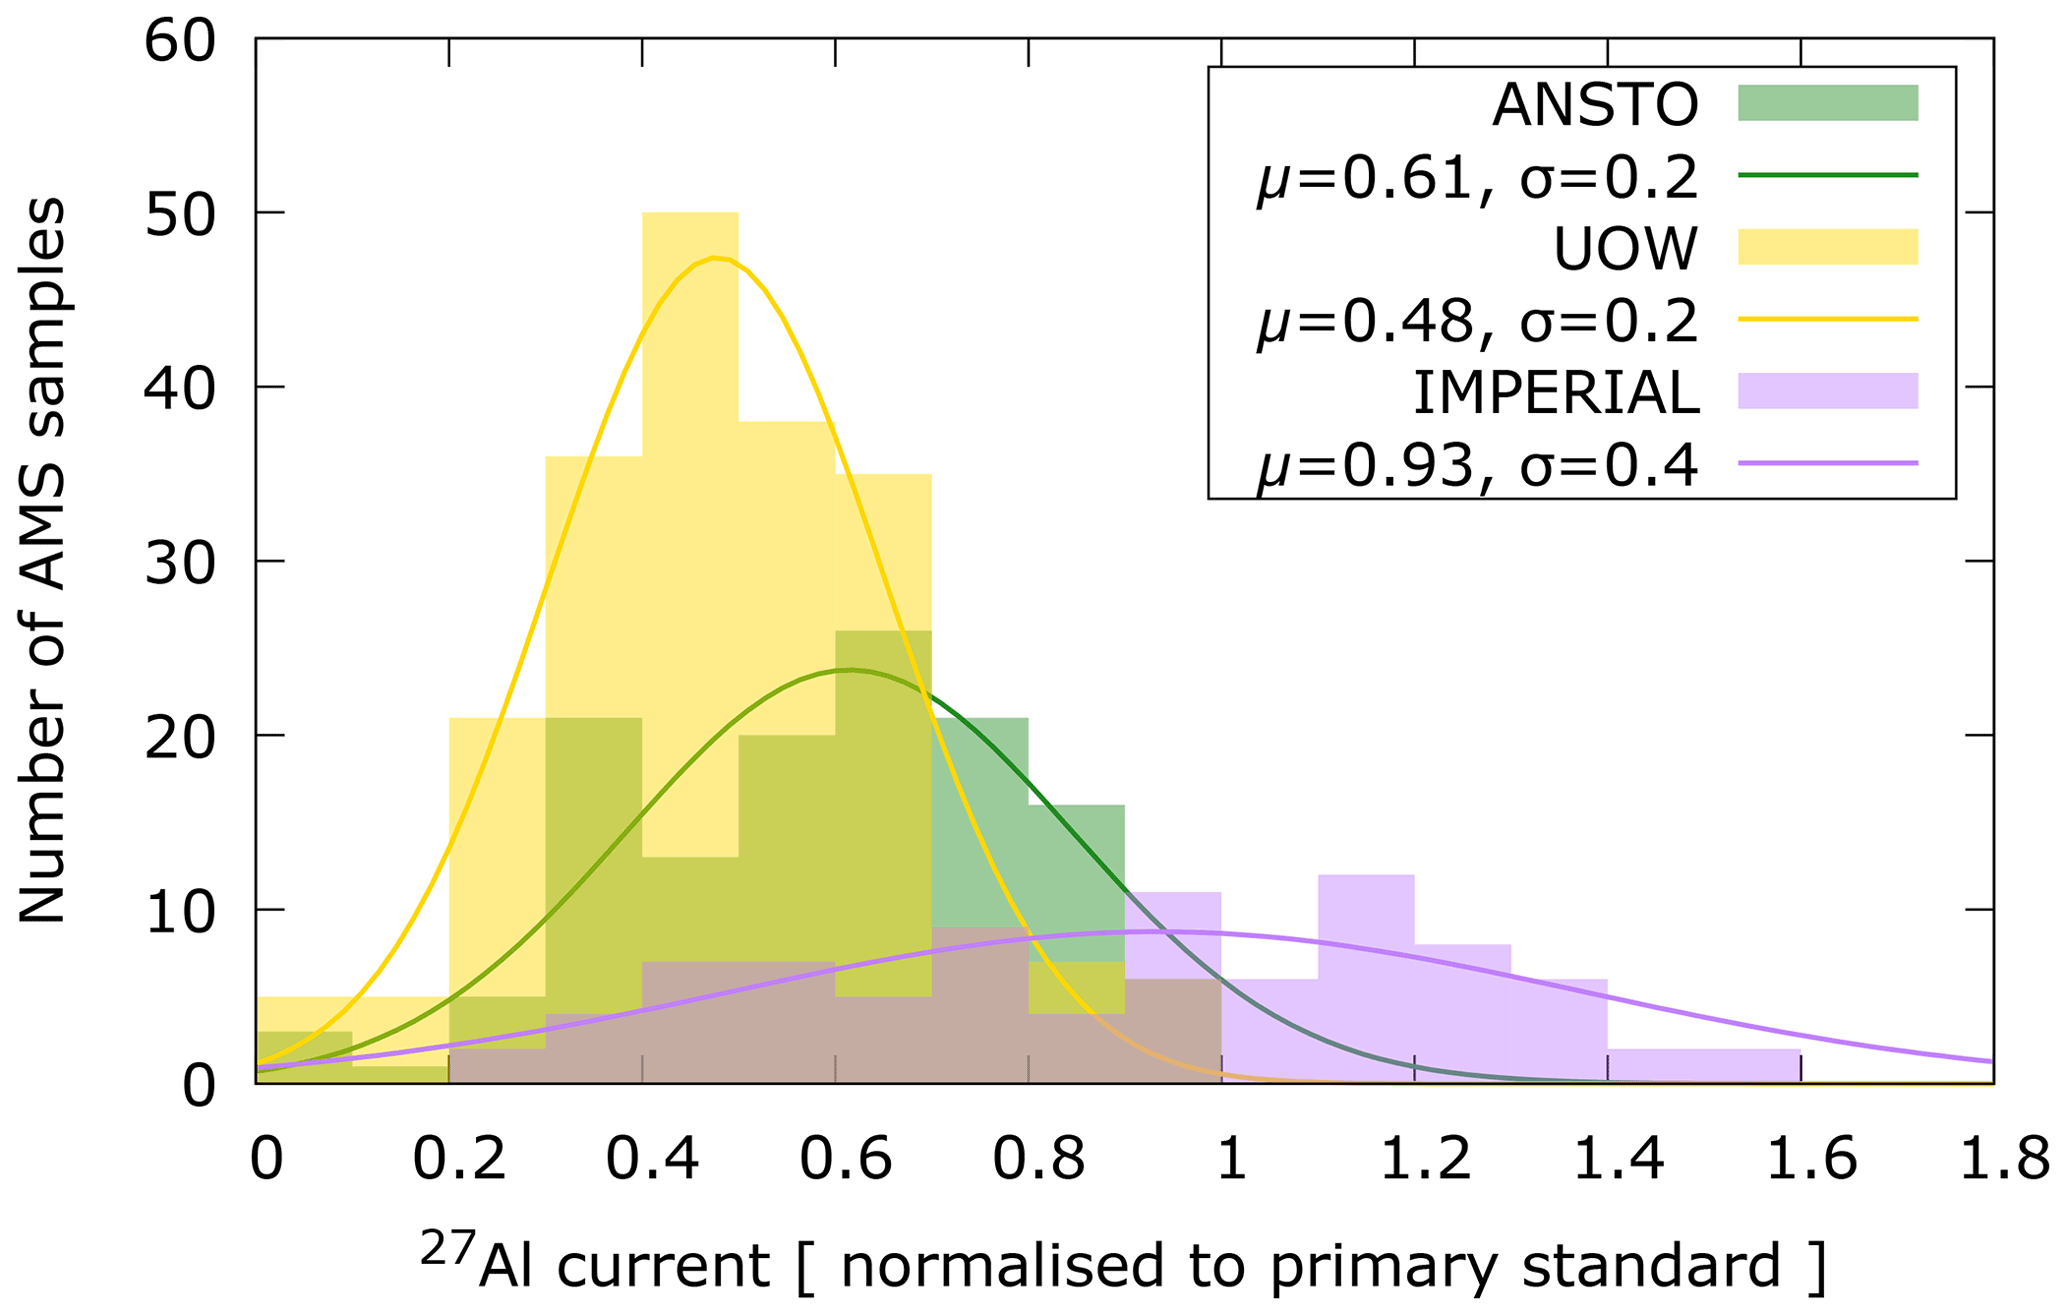
Figure 227Al− output relative to the primary standard KN-4-2 (Nishiizumi, 2004) for collection of samples from three different sample preparation laboratories. Gaussian curves are fitted to the histograms with centroids and widths given.
Aluminium purification procedures at ANSTO and UOW follow Child et al. (2000), whereas those at CosmIC Laboratories mostly follow Corbett et al. (2016). On average, samples prepared at ANSTO and UOW give outputs that are 60 % and 50 % of the primary standard, respectively. In contrast, samples prepared at CosmIC Laboratories at Imperial College London give on average 90 % of the current of the standards but show the largest spread. Al2O3 is mixed with Ag at 1 : 2 ratio by weight and loaded into Cu cathodes independently at each laboratory. Whilst there are differences in how long the samples were measured, we make the first-order approximation that a set of samples from each laboratory would be subject to a similar spread. This allows us to quantify that the small differences in trace elemental composition between samples, or differences in the process of loading the samples, may yield a factor of two differences in outputs.
Table 2Beam transmission for 27Al ions injected as 27Al− for 1+, 2+, and 3+ charge states at selected accelerator terminal voltages (TV) for Ar and He stripper gases using ANSTO's VEGA and SIRIUS accelerators (Wilcken et al., 2015, 2017).
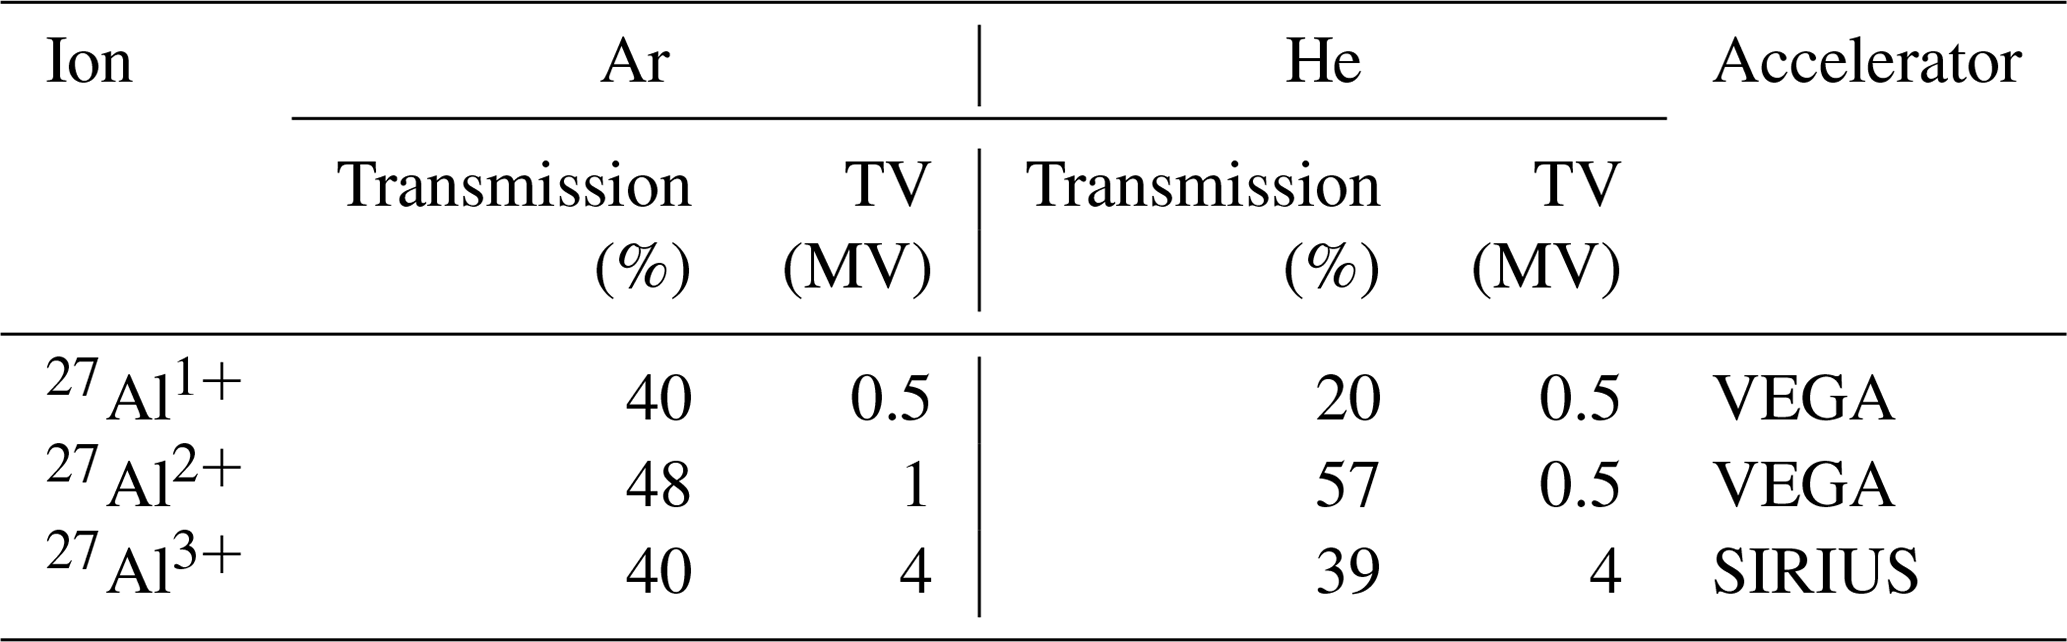
As in the case of 10Be, the second largest contributor to the 26Al measurement inefficiency is the charge state yield. The transmission of 27Al to 1+, 2+, and 3+ charge states with Ar and He stripper gases at accelerator voltages that yield maximum transmission for the given charge state and stripper gas are shown in Table 2. Using Ar stripper gas, maximum transmissions to 1+, 2+, and 3+ charge states are 40 %, 48 %, and 40 % at 0.5, 1, and 4 MV accelerator voltages, respectively. Using He stripping, the maximum measured transmissions to 1+, 2+, and 3+ are 21 %, 57 %, and 39 % at 0.5, 0.5, and 4 MV, respectively.
Our standard measurement setup uses 3+ charge state at 4 MV accelerator voltage with Ar stripper gas (Wilcken et al., 2019). The measured unnormalised 26Al 27Al ratio of a standard material is typically around 90 % of the reference value, which is due to a combination of transmission differences between 26Al and 27Al, and losses in the ion detection. The above method does not utilise the maximum transmission that is achievable with 2+, but the benefit of clean spectra that is free of interferences has, to date, outweighed the losses in transmission. Equal ion optical transmission of about 40 % can be achieved with 1+ charge state, but this decreases to about ∼ 30 % by the time all the molecular interferences are sufficiently suppressed (Wilcken et al., 2015), and therefore offers no gain over the 3+ method.
The maximum transmission to 2+ is about 60 % at 0.5 MV when using He stripper gas. Given the extremely low ionisation efficiency, the possibility to improve the measurement precision with 1.5 times higher count rates, when compared with our standard 3+ method, is significant. However, the challenges with 26Al2+ measurement are the interfering 13C+ ions and how to separate these with low ion energies. Whilst the latter has been demonstrated elsewhere (e.g. Müller et al., 2015), we have not assessed the robustness of the method with our accelerator setup and samples from varying lithological settings.
2.3 Benchmarks
A simple approach to estimate the overall measurement efficiency is to look at the achieved precision from a suite of 10Be and 26Al samples as shown in Fig. 3. These are minimum efficiency values because the samples are not fully consumed, and consumed to variable degrees. At isotope ratios below 10−13 the achievable precision becomes dominated by the counting statistics and from there on precision decreases for lower isotope ratios. At higher nuclide concentrations we typically limit the statistical precision to about 2 % in measurement sequencing to allocate more time for low ratio samples and to ensure the measurement proceeds expeditiously. Reproducibility of standard reference materials is about 1 % for both 10Be and 26Al as has been demonstrated at different AMS laboratories: ANSTO (Wilcken et al., 2017), SUERC (Xu et al., 2015), and LLNL-CAMS (Rood et al., 2013).
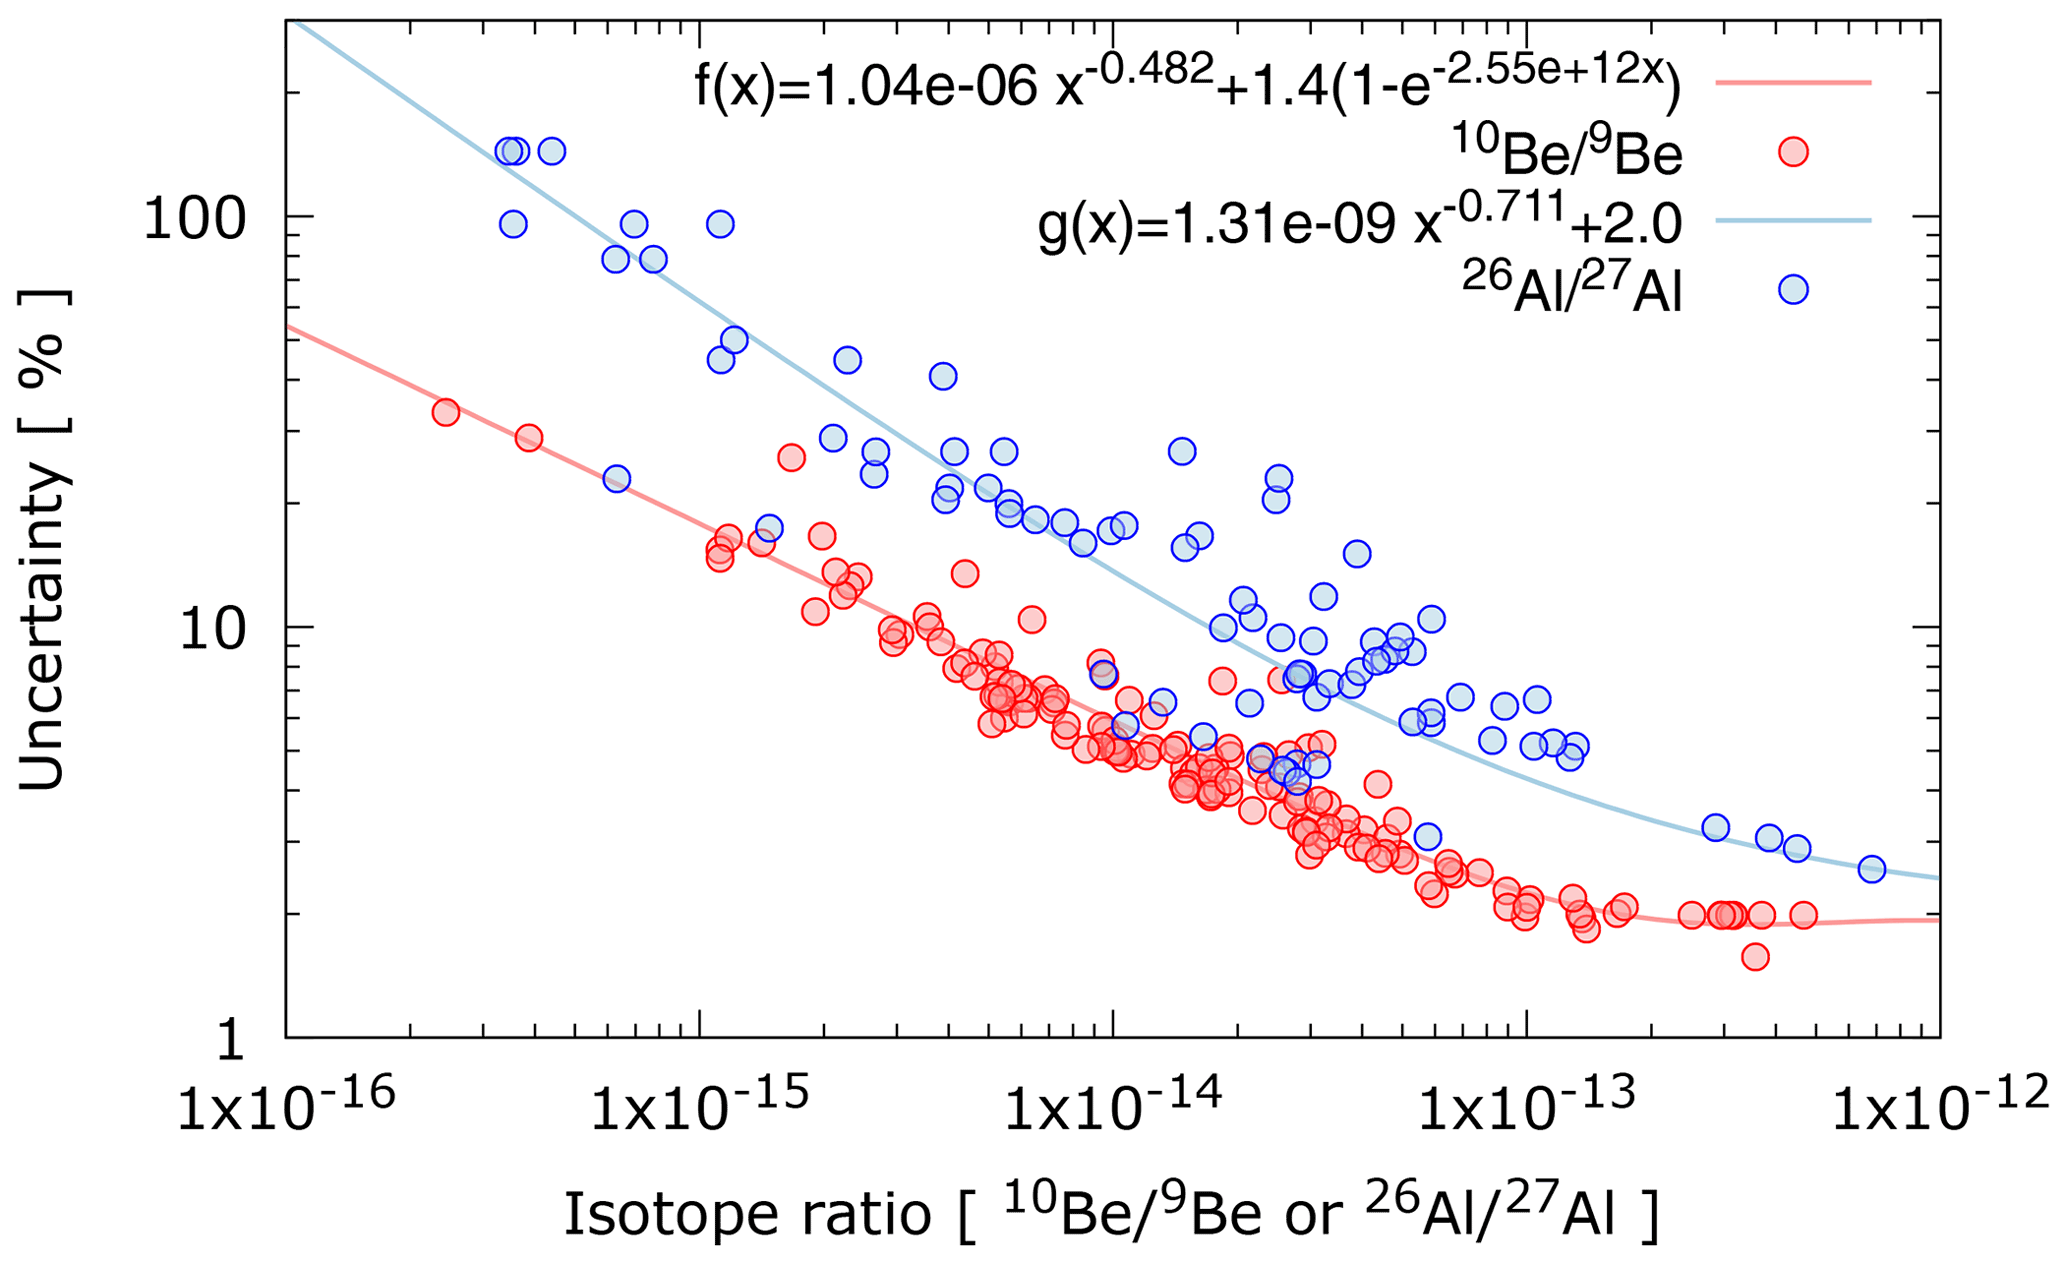
Figure 3Measurement precision for a collection of 10Be and 26Al samples, as a function of 10Be 9Be and 26Al 27Al ratios. The fitted curves are given to allow easy estimation of achievable precision for future work and for inter-laboratory comparisons.
Figure 3 demonstrates that it is possible to measure 26Al and 10Be to similar precision even for samples with isotope ratios at . This is possible for samples with 26Al 10Be ratios close to the surface production ratio of 6.75 in quartz (Balco et al., 2008), where the roughly factor of 10 lower ionisation efficiency for Al− compared with BeO− is, for typical chemistry procedures and stable Al concentrations in quartz, in part compensated by a 26Al 27Al ratio two to three times higher than the 10Be 9Be ratio for the same sample. However, currently the long measurement times required to achieve similar precision as for 10Be (see Fig. 1) reserve the capability only for a few selected projects, and for most samples the 26Al measurement precision is lower than for 10Be, as shown in Fig. 3.
A distinct feature of the 26Al samples shown in Fig. 3 is that the measurement precision is more variable than for 10Be and it is possible to see nearly a factor of 10 differences in measurement precision for samples with similar 26Al 27Al ratios. This is a direct consequence of either the variable output from samples as shown earlier in Fig. 2, or of the idiosyncratic behaviour of the ion source during the run as shown in Fig. 1. In contrast, 10Be behaves much more consistently which is reflected in the tight grouping of the data.
To allow a simple means to estimate achievable precision for future projects, functions have been fitted to the measured 10Be 9Be and 26Al 27Al data and are given in Fig. 3. The fitted functions were forced to result in measurement precision of about 2 % when ratios approach . This is our routine measurement precision and whilst higher precision is possible for high-ratio samples, it is not pertinent here. The functions given in Fig. 3 are applicable to standard size samples with BeO and Al2O3 masses around 0.6 and 4 mg, respectively.
With small signals, the importance of background correction is clear, and ultimately comes down to the question of when a signal is above background (e.g. Currie, 1968). In AMS, one must employ Poisson statistics which is typically done as Gaussian approximation; however, at a very low number of counts, such approximation does not apply anymore (Currie, 1972; Schmidt et al., 1984; Feldman and Cousins, 1998). How differing measurement times between sample and blank will impact the lowest minimum detectable quantity has been discussed in Mathews and Gerts (2008), Potter and Strzelczyk (2008, 2011), and Alvarez (2013). However, before any such statistical analysis is undertaken, we argue that it is possible to isolate the most likely source of background by fully characterising the AMS instrument in question with a suite of quality assurance samples. This information, in turn, will be our primary guide for selecting the most appropriate background correction method.
The background for 10Be or 26Al measurements can be categorised to arise from three distinct sources: (i) it may originate from the carrier used, (ii) it may be due to contamination during sample processing, or (iii) it may be due to instrument response, including sample cross talk in the ion source or insufficient suppression of interferences. Depending on the dominant source of the background, the resulting blank correction scales differently. For example, if the dominant source is the carrier, the background correction should scale with the amount of carrier used; contamination during sample processing scales with the amount of reagents used or time in the laboratory; and if AMS measurement dominates the blank then the background correction should be based on the length of measurement and/or, in case of source memory, when the sample was measured, or the concentration of possible interfering isotopes. To account for all these different sources of background, one needs to quantify their contribution and acknowledge that the most appropriate correction may differ between samples and nuclides. This is particularly the case with 26Al when one may or may not use carrier, or when carrier is used, different amounts may be added to each sample.
3.1 Background corrections for 10Be
The measured 10Be 9Be ratio for an unknown sample and process blank can be approximated as:
where sub- and superscripts s, q, c, sp, and b refer to sample, dissolved quartz, carrier, sample process, and blank, respectively, and R10,s and R10,b are the measured 10Be 9Be ratios in a sample and process blank, respectively. The number of 10Be atoms from the dissolved quartz is N10,q. To account for potentially different amounts of carrier between samples and blanks these are labelled as and , respectively. Similarly, the 10Be atoms that might enter the sample or blank during the sample processing are labelled as and , respectively. Any 10Be events that are recorded due to the AMS measurement itself are accounted with N10,AMS and again can be different between sample and blank. N10,AMS encapsulates sample cross talk in the ion source as well as potential interference caused by high 10B rates. Equations (1) and (2) are based on the assumption that the amount of 9Be coming from the dissolved quartz, sample processing, or AMS make negligible contributions as compared with the carrier itself. If these assumptions are not valid, one needs to expand Eqs. (1) and (2) to include the relevant terms, but here we focus on the given approximations as they are valid under regular routine methods. 10Be 9Be ratios in the sample (R10,s) and blank (R10,b) are measured and the amounts of carrier added ( and ) are known.
To be able to solve the number of 10Be atoms from the dissolved quartz from Eqs. (1) and (2), one needs to either make assumptions about, or have external information on, the origin of the background 10Be events. The first common assumption is that the number of 10Be atoms that might enter a sample and a blank during sample processing is approximately equal, i.e. . This is a reasonable assumption in most circumstances as the sample preparation steps for unknown samples and blanks are closely mimicked.
The apparent 10Be counts observed due to the AMS instrument response (N10,AMS) can be treated as equal between samples and blanks () under the following circumstances: samples and blanks are measured close in time for a similar duration when small source memory contribution can be approximated to be equal, and B rates are below a certain threshold above which the background 10Be 9Be ratio starts to increase due to increasing interference rate. In Fig. 4, we plot a set of background test samples with artificially elevated boron concentrations (grey circles) along a representative collection of unknown samples (red circles) in order to illustrate the impact of increasing B rates on measurement background. The 10B test samples were prepared by adding diluted 1000 ppm B standard solution to crucibles with 9Be carrier solution, the mixture being subsequently dried down and calcined. As shown in Fig. 4, samples located to the left of the inflection point in 10B test samples, where the measured 10Be 9Be ratio starts to increase as a function of increasing interference rate, do not need a separate B correction. In this case, for example, all the unknown samples do not need a correction for B.
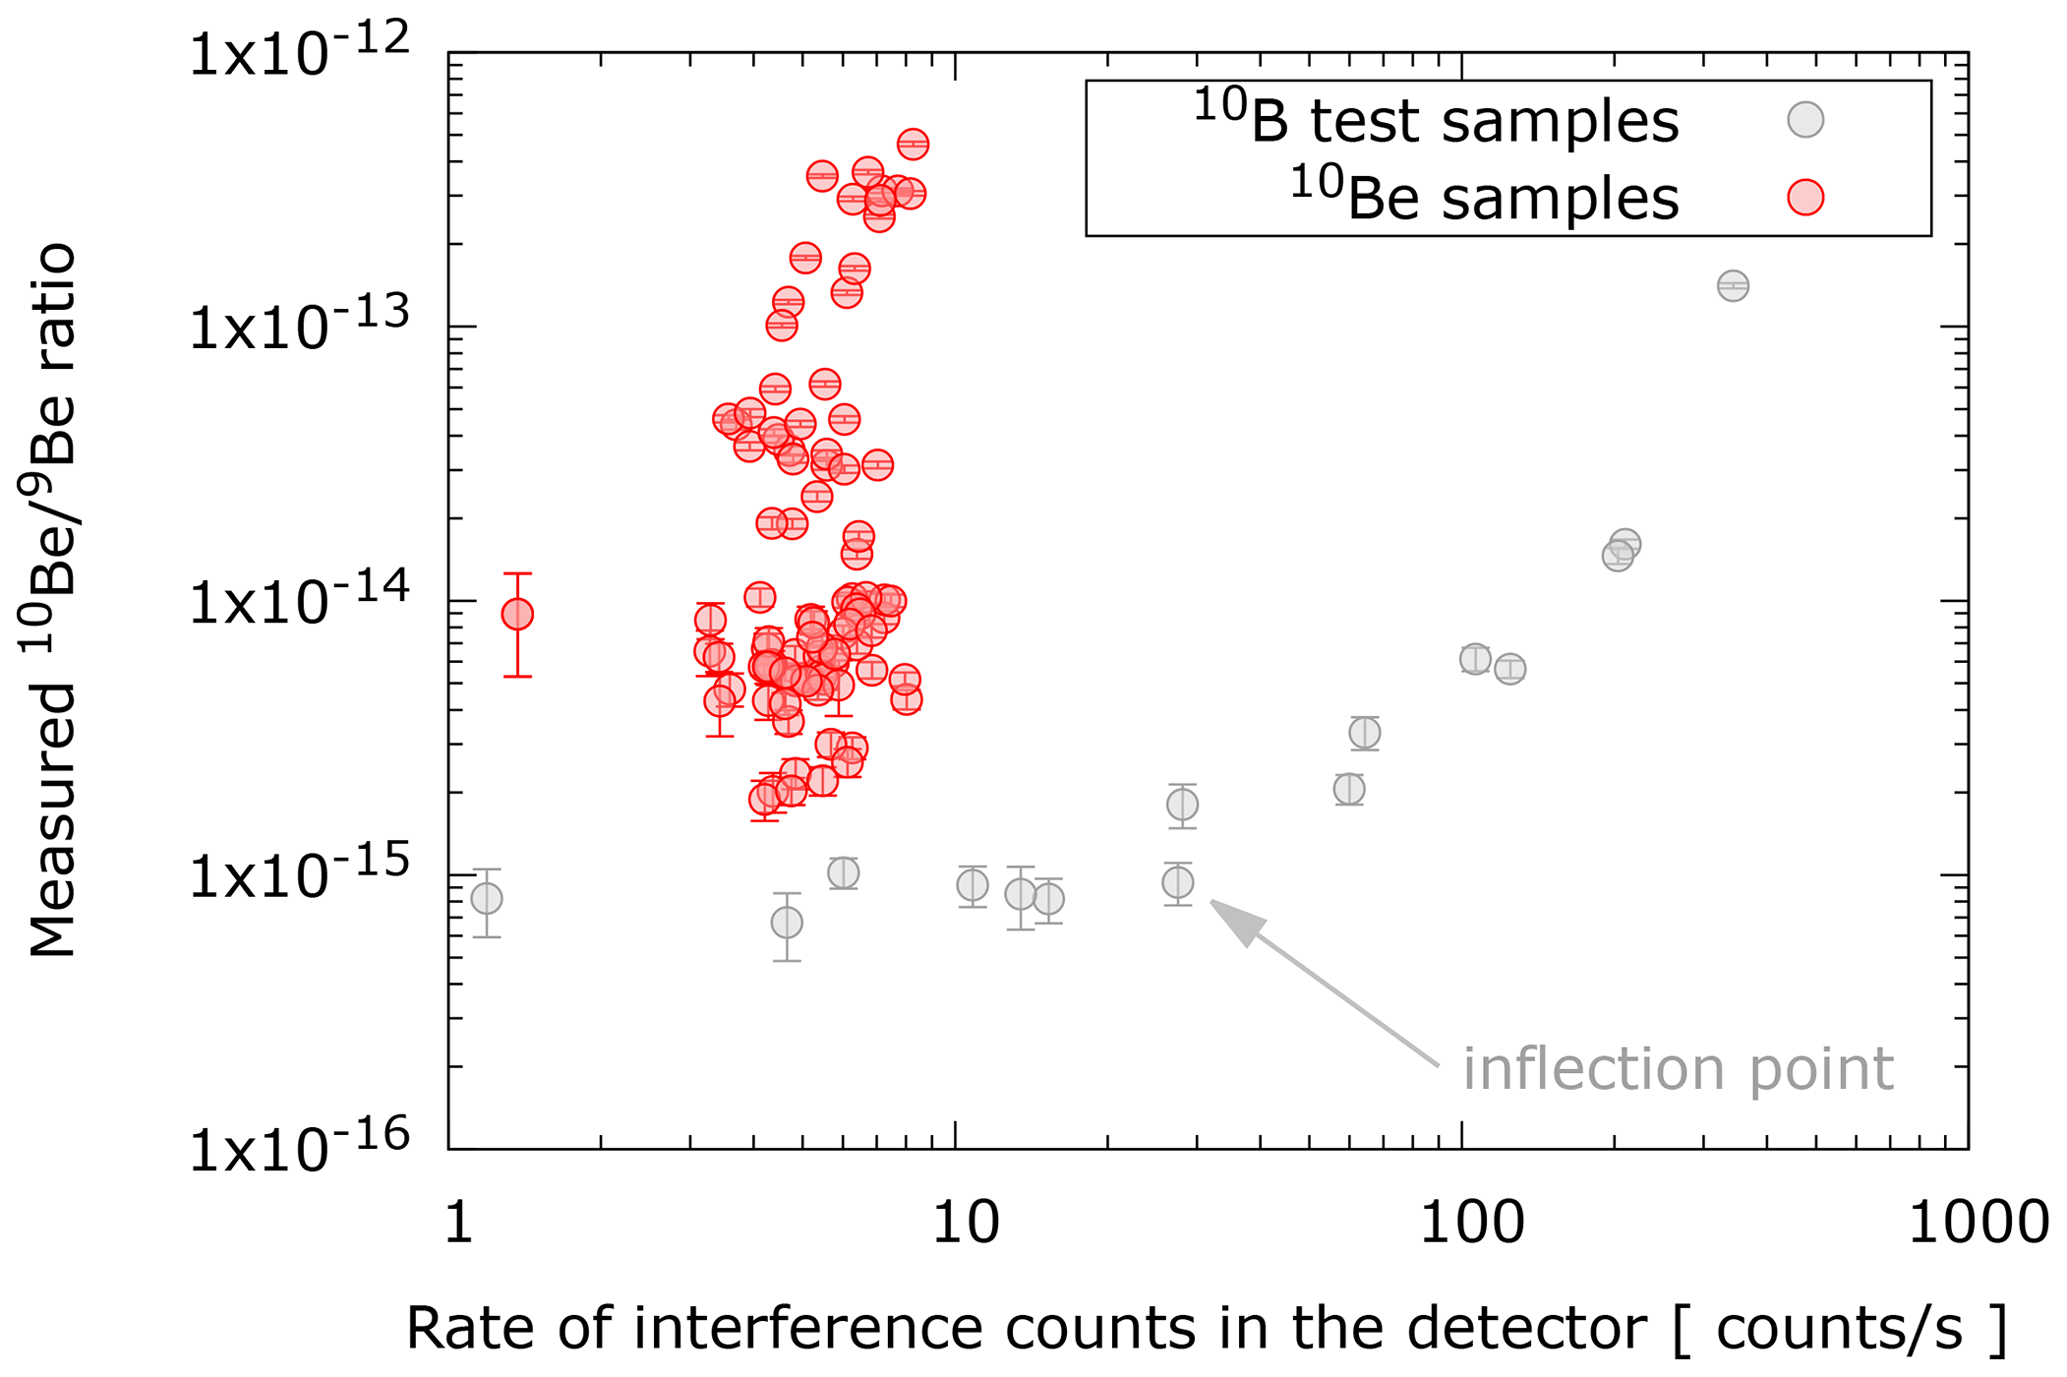
Figure 4Compilation of 10B test samples (grey) and a collection of regular unknown samples (red) plotted against interference count rate in the detector. The inflection point where 10B induced interference starts to elevate the measured 10Be 9Be ratio appears around 30 counts s−1.
A further contribution of 10Be atoms in the blank is from the 9Be carrier itself. This may be quantified by preparing an AMS sample directly from the carrier by conversion of the carrier solution to BeO with minimal handling and measuring it early in the run to avoid source memory build-up. The measurable 10Be 9Be ratio in the carrier can be written as .
Now, we may solve the number of 10Be atoms in the quartz sample by rewriting Eqs. (1) and (2):
The above is the general solution for background correction and requires one to measure both a process blank and a direct carrier blank. An obvious way to simplify the blank correction is to keep the carrier mass equal between a sample and a blank when and become equal. As a consequence the R10,c terms cancel out in Eq. (3) and we obtain:
Equation (4) is also reached if the dominant source of 10Be in the blank samples is the carrier itself, when R10,b approaches R10,c and the second term in Eq. (3) becomes very small. Note also that Eq. (4) is identical to the common background correction method where the number of atoms in the blank are scaled with the masses of the carrier solutions between samples and blank:
where m9,s and m9,b are the masses of carrier solutions added to sample and blank, respectively.
In contrast, if the sample preparation process dominates the 10Be background, R10,s and R10,b become much larger than R10,c and Eq. (3) may be rewritten as:
Here it is noteworthy that when the sample preparation process itself is the dominant source of 10Be background atoms, the correction does not scale with the mass of the carrier in the sample as shown in Eq. (6). However, the simple practice of keeping the carrier masses equal between samples and blanks makes the blank correction very simple and one does not need to choose between Eqs. (4) and (6) as they become identical. There may be situations when keeping carrier masses between samples and blanks equal is not desired, however, as the carrier mass is proportional with the longevity of the sample during measurement and carrier masses may be chosen such that predicted 10Be 9Be ratios are within a range that does not compromise the measurement.
3.2 Background corrections for 26Al
Similar to 10Be, the measured 26Al 27Al ratio for an unknown sample R26,s and process blank R26,b, respectively, can be written as:
where N26,q is the number of 26Al atoms from the dissolved quartz, and and are the numbers of 26Al atoms from the carrier, if any was used, in the sample and blank, respectively. Additional 26Al atoms that might enter the sample during sample processing are N26,sp, and the impact of AMS measurement to the recorded 26Al events is N26,AMS. The latter encapsulates cross talk in the ion source as well as any events that might have erroneously been recorded as 26Al. As in the case of 10Be, contamination during processing or measurement (N26,sp and N26,AMS) can be assumed to be equal between sample and blank as long as they are processed and measured in a similar way and there are no clear ion source memory effects or interferences that might be different between the two. The latter is quite a safe assumption when using Al− beams and the 3+ charge state for the measurement because the 26Al events are so clearly separated from any possible interferences. Equations (7) and (8) assume that possible 27Al contamination is negligible.
If the carrier 26Al 27Al ratio () is known, we can solve the number of 26Al atoms from the dissolved quartz from Eqs. (7) and (8):
This general solution simplifies to a simple blank subtraction if the amounts of carrier added to the sample and blank are equal, in which case the second term drops out of Eq. (9). However, unlike in the case of 10Be, the presence of 27Al from the dissolved quartz means that the amounts of carrier added to the sample and blank are often different, and more commonly no carrier is added at all to samples to bolster the 26Al 27Al ratio. The above means that measurements of R26,s, R26,b, and R26,c are required in order to weigh the different sources of backgrounds appropriately.
Unfortunately, 26Al count rates are so low that it is often difficult to obtain a sufficient number of counts to be able to tell different blank samples apart. However, a collection of multiple blank measurements over a longer measurement time period offers higher statistical precision and allows differentiation of various blank samples, as shown in Table 3.
Table 3Long-term 26Al count rates from collection of blank samples: pure Ag powder, Al carrier (1000 ppm ICP solution), and full process blanks from laboratories at ANSTO, University of Wollongong (UOW), and Imperial College London (IMPERIAL). Number of samples measured is N.
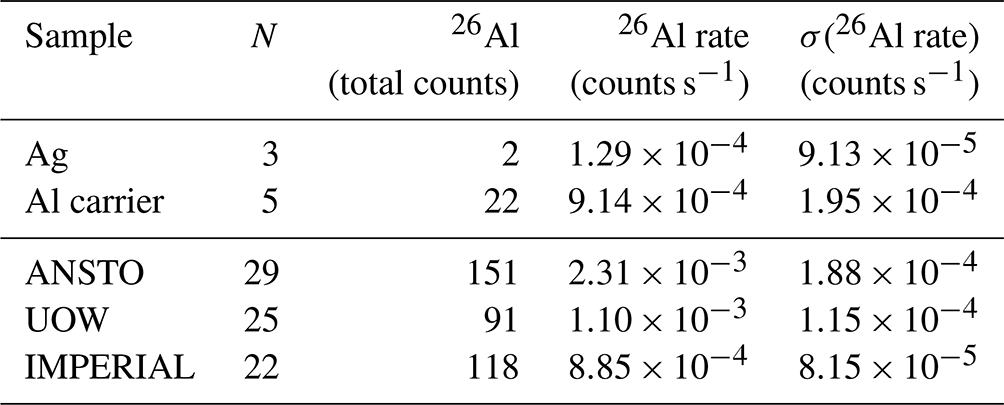
For 26Al measurements, we mix Al2O3 with Ag at a ratio of 1 : 2 by weight and load into Cu sample holders. To measure the ion source memory or the potential contribution from the Ag powder and/or Cu sample holder, we have measured the 26Al count rate from pure Ag powder with no Al2O3 present. As shown in Table 3, these three samples have had over 4 h of cumulative sputtering and only 2 counts have been recorded yielding a count rate of (1.3 ± 0.9) × 10−4 counts s−1. This is roughly an order of magnitude lower than what is measured from our Al carrier (1000 ppm ICP solution), (9.1 ± 2.0) × 10−4 counts s−1, indicating that the source memory is not dominating the blank measurements. A similar conclusion is reached when comparing count rates for individual blanks that were measured at the beginning and at the end of a run with no clear difference. However, the low statistical precision presents a challenge1. Ion source output between Al carrier and full chemistry blanks is roughly equal with no systematic differences between the two.
When the full process blanks from the University of Wollongong and CosmIC Laboratories at Imperial College London are compared with the ICP carrier, the measured 26Al rates are within uncertainties, which indicates that the dominant source of 26Al in the blanks originates from the carrier itself in those laboratories. Conversely, full process blanks from ANSTO show roughly a factor of two higher count rate than the ICP carrier, indicating an additional source of 26Al in those samples.
A challenge with the general background correction Eq. (9) is that the 26Al 27Al ratio in the carrier, R26,c, might not be known with sufficient precision to improve the accuracy of the blank correction. Two end-member assumptions can be made to simplify Eq. (9). The first assumption is that the blank is dominated by the inherent 26Al in the carrier, which is the likely scenario for the University of Wollongong and Imperial College London laboratories (see Table 3). In this case, R26,c and Eq. (9) simplifies to:
The alternative assumption is that the dominant source of contamination is from sample processing. In this case, R26,c becomes small compared with R26,b and Eq. (9) can be written as:
Equations (10) and (11) are similar to Eqs. (4) and (6) for 10Be, with the same conclusion that if the carrier itself is the dominant source of 26Al or 10Be atoms in the blank sample, then the background correction is the blank 26Al 27Al ratio multiplied by the amount of carrier added to the sample. If no carrier is added to the sample, no blank correction is required. In contrast, if the dominant source of 26Al (or 10Be) atoms in the blank is sample processing, the background correction is calculated with the amount of carrier added to the blank.
To demonstrate the impact of different background corrections – i.e. applying Eqs. (9), (10), and (11) – we have corrected a set of samples with 26Al 27Al ratios from to and the three different methods and results are shown in Fig. 5. The shaded area in Fig. 5 highlights the difference between (i) assuming that the source of background is the carrier itself and (ii) assuming that the main source of background is contamination during sample processing, i.e. Eqs. (10) and (11), respectively. General background correction using Eq. (9) is shown with blue circles. Figure 5 demonstrates that for samples with 26Al 27Al ratios above 1 × 10⁻¹⁴ the choice of background correction is typically less significant, and all three methods lead to similar correction. In contrast, for samples with 26Al 27Al ratios below 1 × 10⁻¹⁴, not only can the magnitude of the background correction be similar to or larger than the measurement uncertainty (see Fig. 3), but also it can differ by up to 30 % depending on which correction scheme is used. Therefore, knowing which correction method is the most applicable to each case is highly pertinent for low ratio 26Al measurements.
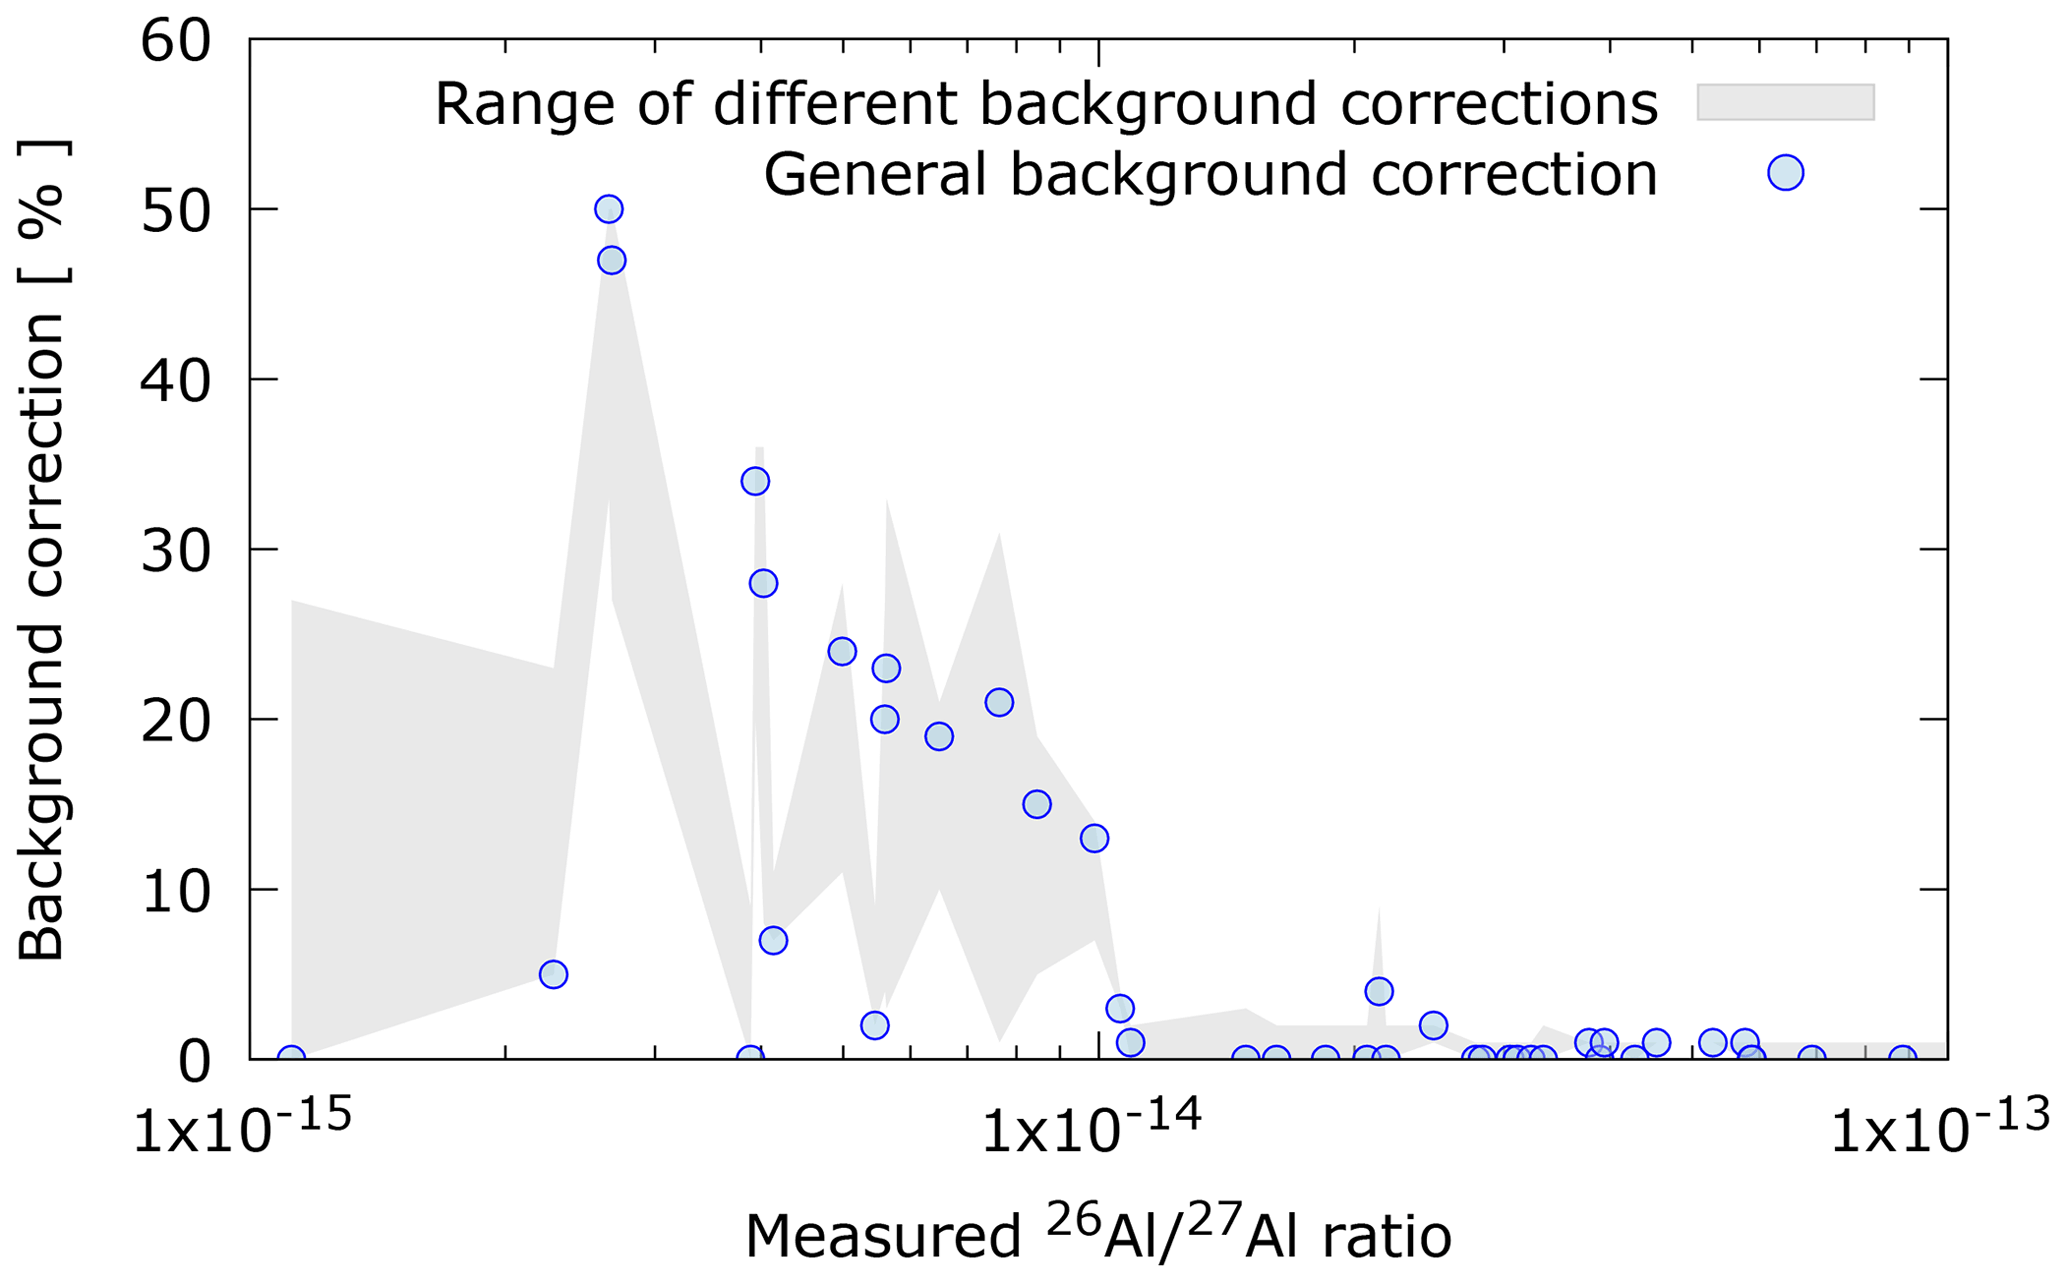
Figure 5Impact of three different background corrections for a collection of 26Al samples as a function of 26Al 27Al ratio. See text for more details.
The above sensitivity analysis differs philosophically from common approaches where varying blank values, e.g. the long-term mean or median, are subtracted to account for the effect of spurious high blank values (e.g. Corbett et al., 2017). Our approach addresses the uncertainty in the origin of the background events by using different correction methods. Using both approaches is recommended.
During an AMS measurement, a sample is typically measured between 3 and 10 times for a few minutes each, where the number of repetitions and length of each measurement may vary depending on the AMS laboratory. These multiple measurements are then converted to a final result with an uncertainty that is either based on the number of rare isotope counts or that is spread between individual measurements (Elmore et al., 1984; Wacker et al., 2010). However, when the measured signal is small and the number of rare isotope counts is also low, the final result becomes sensitive to how the uncertainty is defined and how the individual measurements are combined. For more information on how to calculate an uncertainty when the number of counts are low, the reader is referred to earlier works (e.g. Currie, 1972; Schmidt et al., 1984; Feldman and Cousins, 1998).
To demonstrate the impact of different algorithms for calculating the final ratios and to validate our method, we show a sensitivity analysis based on a couple of low ratio 26Al samples. We selected five 26Al samples that were each measured ∼ 100 min during which 4–83 counts were recorded with an average 27Al− current of 200–300 nA. To combine individual measurements to a final ratio, one may either sum the total counts and charge before calculating the final ratio or one may calculate a weighted mean from the individual measurement ratios. Whilst the former process is independent of measurement sequence, the latter is easier to normalise for drifts in the spectrometer and is our preferred approach. To calculate weighted mean
where wi is the weighting factor, ri is the single isotope ratio measurement, and R is the final ratio, for example Bevington and Robinson (2003), the following weighting factors are considered:
- i.
Equal weights, where wi=1 and the final ratio is a simple arithmetic mean of the individual measurements;
- ii.
Integrated current, where the weighting factor is the average 27Al current multiplied by measurement time;
- iii.
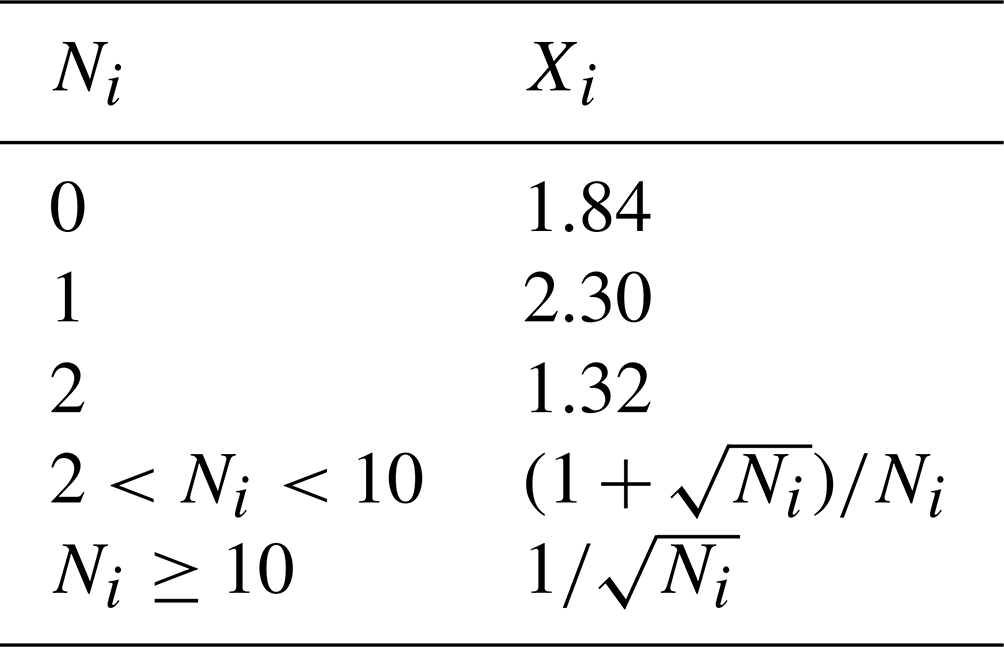
Uncertainty, where and σAi=riXi, with ri being the measured ratio and relative uncertainty Xi is assigned based on the number of 26Al counts Ni during that run as shown in Table 4;
- iv.
Normal uncertainty, where and , with ri and Ni being the measured ratio and number of 26Al counts during that run, respectively.
Table 4Relative uncertainties used in the sensitivity analysis when the number of rare isotope counts is low, based on Schmidt et al. (1984).
Using the above weighting factors, we calculate the weighted mean of individual measurement ratios as a function of a single measurement duration for the selected five low ratio samples as shown in Fig. 6. Single measurement durations from 30 s to ∼ 100 min were considered. To obtain non-zero weighting factors when these are based on uncertainties, one count was assumed in cases where none were recorded.

Figure 6Impact of different methods for calculating the final 26Al 27Al ratio for five low concentration samples as a function of the measurement duration. For each sample, we provide the total number of 27Al counts, uncertainty using Gaussian approximation, and 26Al 27Al ratio.
Our sensitivity analysis (Fig. 6) demonstrates that the measured 26Al 27Al ratio is dependent on the duration of the measurement if the arithmetic mean or uncertainty based weighting factors are used to calculate the mean. Increasing the duration of a measurement will alleviate the differences until all the results converge to a single value that corresponds to a scenario where all the data for a sample were collected during one long ∼ 100 min measurement. Differences in the measured 26Al 27Al ratio and resulting isotope concentration can be 50 % or more if only very few (≲ 10) counts were recorded or about 30 % if a single measurement is shorter than 10 min. In contrast, if the integrated 27Al current is used to calculate the weighted mean, the final 26Al 27Al ratio and subsequent nuclide concentration is independent of the measurement duration, as shown in Fig. 6.
To ensure that our results are independent of the measurement sequence, which is arbitrary in our case, our standard method is to calculate the final isotope ratio by weighing the individual measurements with the integrated current as described in Wacker et al. (2010). However, as illustrated by our analysis, differing 26Al (or 10Be) concentrations may be obtained from the same data if alternate data reduction algorithms are used.
The challenge with measuring low 10Be or 26Al nuclide concentrations is to combine high AMS measurement efficiency with low backgrounds. Achieving an increase in ionisation efficiency will not help if losses elsewhere in the instrument negate the gains. Similarly, achieving improved suppression of interferences in the ion detection is not sufficient if it comes at the cost of measurement efficiency. There is a strong connection between quality of AMS measurement and sample preparation, the latter being particularly important with low 10Be or 26Al nuclide concentrations. To facilitate a robust methodology for low nuclide concentrations, we recommend quality assurance practices that collate long-term data on carrier blank, ion source cross talk, and interference suppression. These practices add to the measurement time and cost but are essential to optimising analytical procedures that ultimately improve data quality and enable new applications.
By far the largest losses during an AMS measurement are in the ion source, where roughly 97 % or 99.8 % of the 10Be or 26Al atoms, respectively, are lost and do not contribute to the statistical precision. Our ion transmission through the accelerator for 10Be3+ and 26Al3+ are around 35 % and 40 %, respectively. In both cases, using the 2+ charge state would increase ion transmission to around 60 %, but whether this gain can be harnessed with equal or better backgrounds remains to be assessed. Using our measurement setup, we show that 26Al can be measured to similar precision as 10Be even for samples with 26Al 27Al ratios in the range of 10−15, provided that measurement times are sufficiently long. For example, for an early Holocene sample with 10Be 9Be and 26Al 27Al ratios on the order of we would expect the uncertainties to be around 3 %–5 %, whereas for a late Holocene sample with 10Be 9Be and 26Al 27Al ratios of we would expect the uncertainties to be in the range of 8 %–20 %.
With low 10Be 9Be or 26Al 27Al ratios, the importance of background correction is obvious. However, this correction should not be done purely on the basis of process blanks, whether batch specific or long-term average, as the origin of the background events is an important factor in deciding the most appropriate correction method. For 26Al, for example, it is often not feasible to keep the mass of the carrier equal between samples and blanks, and the dominant source of the background events dictates the most appropriate blank correction. Our simple sensitivity analysis has shown that when 26Al 27Al ratios are in the range of (5–10) × 10−15, typical for late Holocene surface exposure dating samples, or for burial dating samples, one can expect 30 % differences in blank corrected concentrations and corresponding ages, depending on how blank corrections are done.
When the measured signal is small and the number of rare isotope counts is also low, the calculated final 10Be 9Be or 26Al 27Al ratio becomes sensitive to how the uncertainty is defined and how the individual measurements are combined. Our analysis demonstrates that the measured isotope ratio is dependent on the duration of the measurement, if the arithmetic mean or uncertainty based weighting factors are used to calculate the mean. Differences in the resulting isotope concentration can be 50 % or more if only very few (≲ 10) counts were recorded or about 30 % if a single measurement is shorter than 10 min. In contrast, if the integrated 9Be or 27Al current is used to calculate the weighted mean – our standard method – the final 10Be 9Be or 26Al 27Al ratio and subsequent nuclide concentration is independent of the measurement duration.
To summarise, our study presents a comprehensive method for analysis of cosmogenic 10Be and 26Al samples down to isotope concentrations of a few thousand atoms per gram of sample, which opens the door to new and more varied applications of cosmogenic nuclide analysis.
The data presented in this study are available by contacting the corresponding author.
KMW was responsible for the AMS analyses, ATC and RHF for the sample preparation at University of Wollongong, KS and SK for the sample preparation at ANSTO, and AHR, DHR, and AJS for the sample preparation at Imperial College London. All authors contributed to the writing of the manuscript.
The contact author has declared that neither they nor their co-authors have any competing interests.
Publisher’s note: Copernicus Publications remains neutral with regard to jurisdictional claims in published maps and institutional affiliations.
We acknowledge the Traditional Custodians of the lands on which we have worked, and their continued spiritual and cultural connection to Country.
This research has been supported by the University of Wollongong, Imperial College London, and the Centre for Accelerator Science at ANSTO through the National Collaborative Research Infrastructure Strategy (NCRIS).
This paper was edited by Yeong Bae Seong and reviewed by two anonymous referees.
Alvarez, J. L.: Correction to the count-rate detection limit and sample/blank time-allocation methods, Nucl. Instrum. Meth. A, 729, 725–727, 2013. a
Arazi, A., Faestermann, T., Niello, J. F., Frischke, D., Knie, K., Korschinek, G., Maier, H., Richter, E., Rugel, G., and Wallner, A.: Magnesium suppression for 26Al measurements using AlO− ions, Nucl. Instrum. Meth. B, 223, 259–262, 2004. a, b
Auer, M., Kutschera, W., Priller, A., Wagenbach, D., Wallner, A., and Wild, E.: Measurement of 26Al for atmospheric and climate research and the potential of 26Al 10Be ratios, Nucl. Instrum. Meth. B, 259, 595–599, 2007. a, b
Auer, M., Wagenbach, D., Wild, E. M., Wallner, A., Priller, A., Miller, H., Schlosser, C., and Kutschera, W.: Cosmogenic 26Al in the atmosphere and the prospect of a 26Al 10Be chronometer to date old ice, Earth Planet. Sc. Lett., 287, 453–462, 2009. a
Balco, G.: Glacier Change and Paleoclimate Applications of Cosmogenic-Nuclide Exposure Dating, Annu. Rev. Earth Pl. Sc., 48, 1–28, https://doi.org/10.1146/annurev-earth-081619-052609, 2019. a
Balco, G. and Rovey, C. W.: An isochron method for cosmogenic-nuclide dating of buried soils and sediments, Am. J. Sci., 308, 1083–1114, https://doi.org/10.2475/10.2008.02, 2008. a
Balco, G., Stone, J. O., Lifton, N. A., and Dunai, T. J.: A complete and easily accessible means of calculating surface exposure ages or erosion rates from 10Be and 26Al measurements, Quat. Geochronol., 3, 174–195, 2008. a
Bevington, P. R. and Robinson, D. K.: Data reduction and error analysis for the physical sciences, McGraw-Hill, New York, USA, ISBN 0072472278, 2003. a
Bierman, P. R., Shakun, J. D., Corbett, L. B., Zimmerman, S. R., and Rood, D. H.: A persistent and dynamic East Greenland Ice Sheet over the past 7.5 million years, Nature, 540, 256–260, 2016. a
Child, D., Elliott, G., Mifsud, C., Smith, A., and Fink, D.: Sample processing for earth science studies at ANTARES, Nucl. Instrum. Meth. B, 172, 856–860, 2000. a
Codilean, A. T. and Sadler, P. M.: Tectonic Controls on Himalayan Denudation?, AGU Advances, 2, e2021AV000539, https://doi.org/10.1029/2021av000539, 2021. a
Corbett, L. B., Bierman, P. R., and Rood, D. H.: An approach for optimizing in situ cosmogenic 10Be sample preparation, Quat. Geochronol., 33, 24–34, 2016. a
Corbett, L. B., Bierman, P. R., Rood, D. H., Caffee, M. W., Lifton, N. A., and Woodruff, T. E.: Cosmogenic 26Al 10Be surface production ratio in Greenland, Geophys. Res. Lett., 44, 1350–1359, 2017. a
Currie, L. A.: Limits for qualitative detection and quantitative determination. Application to radiochemistry, Anal. Chem., 40, 586–593, 1968. a
Currie, L. A.: The measurement of environmental levels of rare gas nuclides and the treatment of very low-level counting data, IEEE T. Nucl. Sci., 19, 119–126, 1972. a, b
Derrieux, F., Siame, L. L., Bourlès, D. L., Chen, R.-F., Braucher, R., Léanni, L., Lee, J.-C., Chu, H.-T., and Byrne, T. B.: How fast is the denudation of the Taiwan mountain belt? Perspectives from in situ cosmogenic 10Be, J. Asian Earth Sci., 88, 230–245, https://doi.org/10.1016/j.jseaes.2014.03.012, 2014. a
Dixon, J. L. and Riebe, C. S.: Tracing and Pacing Soil Across Slopes, Elements, 10, 363–368, https://doi.org/10.2113/gselements.10.5.363, 2014. a
Elmore, D., Conard, N., Kubik, P. W., and Fabryka-Martin, J.: Computer controlled isotope ratio measurements and data analysis, Nucl. Instrum. Meth. B, 5, 233–237, 1984. a
Fallon, S. J., Guilderson, T. P., and Brown, T. A.: CAMS/LLNL ion source efficiency revisited, Nucl. Instrum. Meth. B, 259, 106–110, 2007. a
Feige, J., Wallner, A., Altmeyer, R., Fifield, L. K., Golser, R., Merchel, S., Rugel, G., Steier, P., Tims, S. G., and Winkler, S. R.: Limits on supernova-sssociated 60Fe 26Al nucleosynthesis ratios from accelerator mass spectrometry measurements of deep-sea sediments, Phys. Rev. Lett., 121, 221103, https://doi.org/10.1103/PhysRevLett.121.221103, 2018. a
Feldman, G. J. and Cousins, R. D.: Unified approach to the classical statistical analysis of small signals, Phys. Rev. D, 57, 3873, https://doi.org/10.1103/PhysRevD.57.3873, 1998. a, b
Fifield, L. K.: Accelerator mass spectrometry and its applications, Rep. Prog. Phys., 62, 1223, https://doi.org/10.1088/0034-4885/62/8/202, 1999. a
Fifield, L. K., Tims, S., Gladkis, L., and Morton, C.: 26Al measurements with 10Be counting statistics, Nucl. Instrum. Meth. B, 259, 178–183, 2007. a, b
Finkel, R. C. and Suter, M.: AMS in the earth sciences: technique and applications, Advances in Analytical Geochemistry, 1, 1–114, 1993. a
Fülöp, R.-H., Codilean, A. T., Wilcken, K. M., Cohen, T. J., Fink, D., Smith, A. M., Yang, B., Levchenko, V. A., Wacker, L., Marx, S. K., Stromsoe, N., Fujioka, T., and Dunai, T. J.: Million-year lag times in a post-orogenic sediment conveyor, Sci. Adv., 6, eaaz8845, https://doi.org/10.1126/sciadv.aaz8845, 2020. a
Grajcar, M., Döbeli, M., Kubik, P., Maden, C., Suter, M., and Synal, H.-A.: 10Be measurements with terminal voltages below 1 MV, Nucl. Instrum. Meth. B, 223, 190–194, 2004. a
Grajcar, M., Döbeli, M., Kubik, P. W., Synal, H.-A., Wacker, L., and Suter, M.: New concepts of 10Be AMS at low energies, Nucl. Instrum. Meth. B, 259, 173–177, 2007. a
Granger, D. E.: A review of burial dating methods using 26Al and 10Be, in: In-situ-produced cosmogenic nuclides and quantification of geological processes, edited by: Siame, L., Bourlès, D. L., and Brown, E., GSA Special Paper No. 415, Geological Society of America, https://doi.org/10.1130/2006.2415(01), 2006. a
Granger, D. E. and Schaller, M.: Cosmogenic Nuclides and Erosion at the Watershed Scale, Elements, 10, 369–373, https://doi.org/10.2113/gselements.10.5.369, 2014. a
Hlavenka, J. D., Abrams, H., Roberts, M. L., and Longworth, B. E.: Increased AMS ion source efficiency and ion currents by modifying SNICS cathode material and geometry, Physcs. Proc., 90, 17–21, 2017. a
Hunt, A., Petrucci, G., Bierman, P., and Finkel, R.: Metal matrices to optimize ion beam currents for accelerator mass spectrometry, Nucl. Instrum. Meth. B, 243, 216–222, 2006. a
Hunt, A., Petrucci, G., Bierman, P., and Finkel, R.: Investigation of metal matrix systems for cosmogenic 26Al analysis by accelerator mass spectrometry, Nucl. Instrum. Meth. B, 260, 633–636, 2007. a
Hurst, M. D., Rood, D. H., Ellis, M. A., Anderson, R. S., and Dornbusch, U.: Recent acceleration in coastal cliff retreat rates on the south coast of Great Britain, P. Natl. Acad. Sci. USA, 113, 13336–13341, 2016. a
Ivy-Ochs, S. and Briner, J. P.: Dating Disappearing Ice with Cosmogenic Nuclides, Elements, 10, 351–356, https://doi.org/10.2113/gselements.10.5.351, 2014. a
Klein, J., Middleton, R., and Tang, H.: Modifications of an FN tandem for quantitative 10Be measurement, Nucl. Instrum. Meth., 193, 601–616, 1982. a
Knudsen, M. F. and Egholm, D. L.: Constraining Quaternary ice covers and erosion rates using cosmogenic 26Al 10Be nuclide concentrations, Quaternary Sci. Rev., 181, 65–75, https://doi.org/10.1016/j.quascirev.2017.12.012, 2018. a
Knudsen, M. F., Nørgaard, J., Grischott, R., Kober, F., Egholm, D. L., Hansen, T. M., and Jansen, J. D.: New cosmogenic nuclide burial-dating model indicates onset of major glaciations in the Alps during Middle Pleistocene Transition, Earth Planet. Sc. Lett., 549, 116491, https://doi.org/10.1016/j.epsl.2020.116491, 2020. a
Lachner, J., Christl, M., Müller, A. M., Suter, M., and Synal, H.-A.: 10Be and 26Al low-energy AMS using He-stripping and background suppression via an absorber, Nucl. Instrum. Meth. B, 331, 209–214, 2014. a
Lachner, J., Marek, C., Martschini, M., Priller, A., Steier, P., and Golser, R.: 36Cl in a new light: AMS measurements assisted by ion-laser interaction, Nucl. Instrum. Meth. B, 456, 163–168, 2019. a
Lachner, J., Martschini, M., Kalb, A., Kern, M., Marchhart, O., Plasser, F., Priller, A., Steier, P., Wieser, A., and Golser, R.: Highly sensitive 26Al measurements by Ion-Laser-InterAction Mass Spectrometry, Int. J. Mass Spectrom., 465, 116576, https://doi.org/10.1016/j.ijms.2021.116576, 2021. a
Lee, H., Galindo-Uribarri, A., Chang, K., Kilius, L., and Litherland, A.: The molecule and radiocarbon dating by accelerator mass spectrometry, Nucl. Instrum. Meth. B, 5, 208–210, 1984. a
Lenard, S. J. P., Lavé, J., France-Lanord, C., Aumaître, G., Bourlès, D. L., and Keddadouche, K.: Steady erosion rates in the Himalayas through late Cenozoic climatic changes, Nat. Geosci., 13, 448–452, https://doi.org/10.1038/s41561-020-0585-2, 2020. a
Mandal, S. K., Scherler, D., and Wittmann, H.: Tectonic Accretion Controls Erosional Cyclicity in the Himalaya, AGU Advances, 2, e2021AV000487, https://doi.org/10.1029/2021av000487, 2021. a
Mariotti, A., Blard, P.-H., Charreau, J., Toucanne, S., Jorry, S. J., Molliex, S., Bourlès, D. L., Aumaître, G., and Keddadouche, K.: Nonlinear forcing of climate on mountain denudation during glaciations, Nat. Geosci., 14, 16–22, https://doi.org/10.1038/s41561-020-00672-2, 2021. a
Martschini, M., Hanstorp, D., Lachner, J., Marek, C., Priller, A., Steier, P., Wasserburger, P., and Golser, R.: The ILIAMS project–An RFQ ion beam cooler for selective laser photodetachment at VERA, Nucl. Instrum. Meth. B, 456, 213–217, 2019. a
Mathews, K. and Gerts, D.: Bayesian analysis for very-low-background counting of short-lived isotopes: Lowest minimum detectable quantity, J. Radioanal. Nucl. Ch., 276, 305–312, 2008. a
Middleton, R.: A versatile high intensity negative ion source, Nucl. Instrum. Methods, 214, 139–150, 1983. a, b
Middleton, R.: A negative ion cookbook, University of Pennsylvania, https://www.pelletron.com/cookbook.pdf (last access: 3 June 2022), 1989. a, b, c
Miltenberger, K.-U., Müller, A. M., Suter, M., Synal, H.-A., and Vockenhuber, C.: Accelerator mass spectrometry of 26Al at 6 MV using AlO− ions and a gas-filled magnet, Nucl. Instrum. Meth. B, 406, 272–277, 2017. a, b
Müller, A., Christl, M., Döbeli, M., Kubik, P. W., Suter, M., and Synal, H.-A.: 10Be AMS measurements at low energies (E < 1 MeV), Nucl. Instrum. Meth. B, 266, 2207–2212, 2008. a
Müller, A. M., Christl, M., Lachner, J., Suter, M., and Synal, H.-A.: Competitive 10Be measurements below 1 MeV with the upgraded ETH–TANDY AMS facility, Nucl. Instrum. Meth. B, 268, 2801–2807, 2010. a
Müller, A. M., Christl, M., Lachner, J., Synal, H.-A., Vockenhuber, C., and Zanella, C.: 26Al measurements below 500 kV in charge state 2+, Nucl. Instrum. Meth. B, 361, 257–262, 2015. a, b
Nishiizumi, K.: Preparation of 26Al AMS standards, Nucl. Instrum. Meth. B, 223, 388–392, 2004. a, b
Paul, M., Glagola, B. G., Henning, W., Keller, J. G., Kutschera, W., Liu, Z., Rehm, K. E., Schneck, B., and Siemssen, R. H.: Heavy ion separation with a gas-filled magnetic spectrograph, Nucl. Instrum. Meth. A, 277, 418–430, 1989. a, b
Potter, W. and Strzelczyk, J.: Computer code for detection limits and type II errors with unequal sample and blank counting times, J. Radioanal. Nucl. Ch., 276, 313–316, 2008. a
Potter, W. E. and Strzelczyk, J. J.: Improved confidence intervals when the sample is counted an integer times longer than the blank, Health Phys., 100, S67–S70, 2011. a
Raisbeck, G., Yiou, F., Bourlès, D., Lestringuez, J., and Deboffle, D.: Measurement of 10Be with a Tandetron accelerator operating at 2 MV, Nucl. Instrum. Meth. B, 5, 175–178, 1984. a
Rood, D. H., Hall, S., Guilderson, T. P., Finkel, R. C., and Brown, T. A.: Challenges and opportunities in high-precision 10Be measurements at CAMS, Nucl. Instrum. Meth. B, 268, 730–732, 2010. a
Rood, D. H., Brown, T. A., Finkel, R. C., and Guilderson, T. P.: Poisson and non-Poisson uncertainty estimations of 10Be 9Be measurements at LLNL–CAMS, Nucl. Instrum. Meth. B, 294, 426–429, 2013. a
Schaefer, J. M., Denton, G. H., Kaplan, M., Putnam, A., Finkel, R. C., Barrell, D. J., Andersen, B. G., Schwartz, R., Mackintosh, A., Chinn, T., and Schlüchter, C.: High-frequency Holocene glacier fluctuations in New Zealand differ from the northern signature, Science, 324, 622–625, 2009. a
Schaefer, J. M., Finkel, R. C., Balco, G., Alley, R. B., Caffee, M. W., Briner, J. P., Young, N. E., Gow, A. J., and Schwartz, R.: Greenland was nearly ice-free for extended periods during the Pleistocene, Nature, 540, 252–255, 2016. a
Schaefer, J. M., Codilean, A. T., Willenbring, J. K., Lu, Z.-T., Keisling, B., Fülöp, R.-H., and Val, P.: Cosmogenic nuclide techniques, Nature Reviews Methods Primers, 2, 18, https://doi.org/10.1038/s43586-022-00096-9, 2022. a
Schmidt, K.-H., Sahm, C.-C., Pielenz, K., and Clerc, H.-G.: Some remarks on the error analysis in the case of poor statistics, Z. Phys. A-Hadron. Nucl., 316, 19–26, 1984. a, b, c
Shakun, J. D., Corbett, L. B., Bierman, P. R., Underwood, K., Rizzo, D. M., Zimmerman, S. R., Caffee, M. W., Naish, T., Golledge, N. R., and Hay, C. C.: Minimal East Antarctic Ice Sheet retreat onto land during the past eight million years, Nature, 558, 284–287, 2018. a
Siame, L., Angelier, J., Chen, R.-F., Godard, V., Derrieux, F., Bourlès, D., Braucher, R., Chang, K.-J., Chu, H.-T., and Lee, J.-C.: Erosion rates in an active orogen (NE-Taiwan): A confrontation of cosmogenic measurements with river suspended loads, Quat. Geochronol., 6, 246–260, https://doi.org/10.1016/j.quageo.2010.11.003, 2011. a
Southon, J. and Santos, G. M.: Life with MC-SNICS. Part II: Further ion source development at the Keck carbon cycle AMS facility, Nucl. Instrum. Meth. B, 259, 88–93, 2007. a
Steier, P., Martschini, M., Buchriegler, J., Feige, J., Lachner, J., Merchel, S., Michlmayr, L., Priller, A., Rugel, G., Schmidt, E., Wallner, A., Wild, E. M., and Golser, R.: Comparison of methods for the detection of 10Be with AMS and a new approach based on a silicon nitride foil stack, Int. J. Mass Spectrom., 444, 116175, https://doi.org/10.1016/j.ijms.2019.116175, 2019. a, b
Suter, M., Jacob, S., and Synal, H. A.: AMS of 14C at low energies, Nucl. Instrum. Meth. B, 123, 148–152, 1997. a
Swirad, Z. M., Rosser, N. J., Brain, M. J., Rood, D. H., Hurst, M. D., Wilcken, K. M., and Barlow, J.: Cosmogenic exposure dating reveals limited long-term variability in erosion of a rocky coastline, Nat. Commun., 11, 1–9, 2020. a
Synal, H.-A.: Developments in accelerator mass spectrometry, Int. J. Mass Spectrom., 349, 192–202, 2013. a, b
Synal, H.-A., Jacob, S., and Suter, M.: New concepts for radiocarbon detection systems, Nucl. Instrum. Meth. B, 161, 29–36, 2000. a
Wacker, L., Christl, M., and Synal, H.-A.: Bats: a new tool for AMS data reduction, Nucl. Instrum. Meth. B, 268, 976–979, 2010. a, b
Wilcken, K., Hotchkis, M., Levchenko, V., Fink, D., Hauser, T., and Kitchen, R.: From carbon to actinides: A new universal 1MV accelerator mass spectrometer at ANSTO, Nucl. Instrum. Meth. B, 361, 133–138, 2015. a, b, c, d
Wilcken, K., Fink, D., Hotchkis, M., Garton, D., Button, D., Mann, M., Kitchen, R., Hauser, T., and O’Connor, A.: Accelerator mass spectrometry on SIRIUS: New 6 MV spectrometer at ANSTO, Nucl. Instrum. Meth. B, 406, 278–282, 2017. a, b, c, d
Wilcken, K., Fujioka, T., Fink, D., Fülöp, R., Codilean, A., Simon, K., Mifsud, C., and Kotevski, S.: SIRIUS Performance: 10Be, 26Al and 36Cl measurements at ANSTO, Nucl. Instrum. Meth. B, 455, 300–304, 2019. a, b, c
Wittmann, H., Oelze, M., Gaillardet, J., Garzanti, E., and Blanckenburg, F. V.: A global rate of denudation from cosmogenic nuclides in the Earth's largest rivers, Earth-Sci. Rev., 204, 103147, https://doi.org/10.1016/j.earscirev.2020.103147, 2020. a
Xu, S., Freeman, S. P., Rood, D. H., and Shanks, R. P.: Decadal 10Be, 26Al and 36Cl QA measurements on the SUERC 5 MV accelerator mass spectrometer, Nucl. Instrum. Meth. B, 361, 39–42, 2015. a
Yokoyama, Y., Koizumi, M., Matsuzaki, H., Miyairi, Y., and Ohkouchi, N.: Developing ultra small-scale radiocarbon sample measurement at the University of Tokyo, Radiocarbon, 52, 310–318, 2010. a, b
On the other hand, one may argue that, because there is no Al2O3 present in the pure Ag sample, the total output from the ion source is much less than from regular Al2O3 samples and may impact the probability of 26Al ions reaching the detector. Whilst this effect might be true, we believe the impact is within the uncertainties at these extremely low count rates.