the Creative Commons Attribution 4.0 License.
the Creative Commons Attribution 4.0 License.
 | 15 Jun 2022
Simulating sedimentary burial cycles – Part 2: Elemental-based multikinetic apatite fission-track interpretation and modelling techniques illustrated using examples from northern Yukon
Dale R. Issler
Kalin T. McDannell
Paul B. O'Sullivan
Larry S. Lane
Compositionally dependent apatite fission track (AFT) annealing is a common but underappreciated cause for AFT age dispersion in sedimentary samples. We present an interpretation and modelling strategy for samples with variable apatite composition that exploits multikinetic AFT annealing to obtain thermal histories that can provide more detail and better resolution compared to conventional methods. We illustrate our method using a Permian and a Devonian sample from northern Yukon, Canada, both with complicated geological histories and long residence times in the AFT partial annealing zone. Effective Cl values (eCl; converted from rmr0 values) derived from detailed apatite elemental data are used to define AFT statistical kinetic populations with significantly different total annealing temperatures (∼110–185 ∘C) and ages that agree closely with the results of age mixture modelling. These AFT populations are well resolved using eCl values but exhibit significant overlap with respect to the conventional parameters of Cl content or Dpar. Elemental analyses and measured Dpar for Phanerozoic samples from Yukon and the Northwest Territories confirm that Dpar has low precision and that Cl content alone cannot account for the compositional and associated kinetic variability observed in natural samples. An inverse multikinetic AFT model, AFTINV, is used to obtain thermal-history information by simultaneously modelling multiple kinetic populations as distinct thermochronometers with different temperature sensitivities. A nondirected Monte Carlo scheme generates a set of statistically acceptable solutions at the 0.05 significance level and then these solutions are updated to the 0.5 level using a controlled random search (CRS) learning algorithm. The smoother, closer-fitting CRS solutions allow for a more consistent assessment of the eCl values and thermal-history styles that are needed to satisfy the AFT data. The high-quality Devonian sample (39 single-grain ages and 202 track lengths) has two kinetic populations that require three cycles of heating and cooling (each subsequent event of lower intensity) to obtain close-fitting solutions. The younger and more westerly Permian sample with three kinetic populations only records the latter two heating events. These results are compatible with known stratigraphic and thermal maturity constraints, and the QTQt software produces similar results. Model results for these and other samples suggest that elemental-derived eCl values are accurate within the range 0–0.25 apfu (atoms per formula unit, with rmr0 values of 0.73–0.84), which encompasses most of the data from annealing experiments. Outside of this range, eCl values for more exotic compositions may require adjustment relative to better-constrained apatite compositions when trying to fit multiple kinetic populations. Our results for natural and synthetic samples suggest that an element-based multikinetic approach has great potential to dramatically increase the temperature range and resolution of thermal histories relative to conventional AFT thermochronology.
- Article
(17731 KB) - Full-text XML
- Companion paper
-
Supplement
(551 KB) - BibTeX
- EndNote


The works published in this journal are
distributed under the Creative Commons Attribution 4.0 License.
This licence does not affect the Crown copyright work, which is
reusable under the Open Government Licence (OGL). The Creative
Commons Attribution 4.0 License and the OGL are interoperable
and do not conflict with, reduce, or limit each other. The co-authors
Dale R. Issler and Larry S. Lane are employees of the Canadian Government and
therefore claim Crown copyright for the respective contributions.
© Crown copyright 2022
Apatite fission track (AFT) thermochronology is a well-established method for constraining low-temperature (<150 ∘C) thermal histories for a broad range of rock types in a wide variety of geological settings (e.g., Gallagher et al., 1998; Gleadow et al., 2002; Lisker et al., 2009; Malusà and Fitzgerald, 2019; Wagner and Van den Haute, 1992). Fission tracks (FTs) are linear damage zones within apatite crystals that form continuously through time by the spontaneous fission decay of 238U. An AFT “age” is a function of the measured track density, which in turn depends on the uranium concentration and the orientation and length of the observed tracks. AFTs form with an initial length of ∼16 µm but undergo temperature-dependent length reduction (thermal annealing), yielding a track length distribution that reflects the style and rate of heating and cooling of the apatite-bearing sample (Gleadow et al., 1983). For typical fluorapatite, FTs show variable partial annealing between ∼20 and ∼110 ∘C (Donelick et al., 1990; Green et al., 1989; Ketcham et al., 1999; Tamer and Ketcham, 2020) and are totally annealed at higher temperatures. AFT age and length data can be used to constrain the time–temperature history of a sample over a broad temperature range using a thermal model with appropriate annealing kinetics (e.g., Gallagher, 1995, 2012; Green et al., 1989; Issler et al., 2005; Ketcham, 2005; Ketcham et al., 2000, 2007; Willett, 1997).
In general, application of the AFT method can be straightforward for crystalline rocks with apatite grains of similar composition and a common formation age. In contrast, sedimentary rocks can pose special challenges for the interpretation and modelling of AFT data because they may contain mixed populations of detrital apatite of variable composition from source areas with significantly different thermal histories. This can lead to discordant AFT grain age distributions where the variance of the grain ages is greater than expected for the analytical error, and therefore the grains cannot be treated as a single age population (Brandon, 2002; Galbraith and Laslett, 1993; Vermeesch, 2019). Overdispersed AFT grain ages are quite common for sedimentary rocks and may result from mixed provenance (e.g., Carter and Gallagher, 2004; Coutand et al., 2006; Garver et al., 1999) and/or variable composition-dependent annealing of fission tracks (Barbarand et al., 2003; Carlson et al., 1999; Crowley et al., 1991; Green et al., 1986; Ketcham et al., 1999; Ravenhurst et al., 2003). The sedimentary samples used in this study have discordant AFT grain age distributions that we attribute to differential thermal annealing related to apatite composition.
Chlorine content (e.g., Green, 1995; Green et al., 1985, 1986) and Dpar, the mean length of fission track etch figures on the polished mineral surface parallel to the crystallographic c axis (Burtner et al., 1994; Donelick, 1993), are two widely used parameters for constraining AFT annealing kinetics (e.g., Barbarand et al., 2003; Donelick et al., 2005; Ketcham et al., 1999, 2007). Unfortunately, these single-parameter methods may only work for simple cases, which may be one of the reasons why there are relatively few published multikinetic AFT studies. The empirical rmr0 parameter (Carlson et al., 1999; Ketcham et al., 1999, 2007) is potentially more useful for characterizing multikinetic AFT annealing behaviour because it can account for the effects of variable elemental composition, but it has largely been overlooked in the scientific literature. Individual rmr0 values can be calculated for each analysed grain using a multivariate equation with elemental data obtained from electron probe microanalysis (Carlson et al., 1999; Ketcham et al., 2007). The rmr0 parameter was calibrated based on the results of AFT annealing experiments for a range of apatite compositions and is a measure of the relative resistance to annealing for a given apatite compared with the most retentive apatite used in the experiments (Ketcham et al., 1999, 2007). It has been applied successfully to constrain multikinetic AFT thermal histories for a number of areas in northern Canada (Issler, 2011; Issler and Grist, 2008a, b, 2014; Powell et al., 2018, 2020; Schneider and Issler, 2019) where the conventional parameters (Dpar and Cl content) have failed.
In a previous paper (McDannell and Issler, 2021), we used synthetic data to show that it is possible in principle to recover a thermal history with multiple heating events from a single high-quality multikinetic AFT sample using inverse modelling techniques. The obvious implication, discussed in McDannell and Issler (2021), is that multikinetic AFT interpretation can provide more thermal-history information than conventional approaches. The purpose of this paper is to demonstrate how compositionally variable detrital apatite grains within natural samples can be grouped into separate statistical kinetic populations that behave as distinct thermochronometers using elemental data and other supporting information. Our method allows for virtually all the sample AFT data to be used; only grains with obviously poor quality AFT or chemical analyses or (more rarely) single grains with unique chemistry or a different provenance may need to be excluded in some cases. The AFT kinetic populations of this study have a wider range of total annealing temperatures (∼110 to 185 ∘C based on model thermal histories) than typical fluorapatite (∼110 ∘C), and therefore they can resolve details of the thermal history beyond the range of a single fluorapatite population. We use an inverse thermal-history model (AFTINV; Issler, 1996; Issler et al., 2005; Schneider and Issler, 2019) to show that it is possible to extract records of multiple heating events preserved in natural multikinetic AFT samples with long residence times in the partial annealing zone. We conclude that age dispersion is a desirable feature of multikinetic AFT samples that can be exploited to resolve thermal histories in unprecedented detail compared with conventional approaches.
We use two samples from northern Yukon, Canada, to illustrate how we interpret and model multikinetic AFT data. Table 1 summarizes basic sample location and stratigraphic information and a geological map with plotted sample locations is available in Issler et al. (2021). Percent vitrinite reflectance (%Ro) data (Issler et al., 2021) indicate that both samples experienced paleotemperatures that were high enough (∼135–175 ∘C) to cause substantial AFT annealing. The geological setting and implications of model results for these samples will be discussed in more detail elsewhere as part of a larger regional study of northern Yukon. The early Permian (∼295–285 Ma) sandstone sample is from well cuttings collected approximately 70 m below a pre-Cretaceous unconformity in the Eagle Plain west of the Richardson Mountains. Approximately 1 km of Cretaceous strata (≤0.6 %Ro) overlie the unconformity, which represents approximately 170 million years of missing geological record. The second sandstone sample is from an Upper Devonian (∼375–365 Ma) outcrop northeast of the first sample on the western flank of the Richardson Mountains. These samples provide an opportunity to investigate whether multikinetic samples can retain important details of the thermal history in areas with a complicated tectonic history and much of the stratigraphic record missing.

Figure 1 is a flowchart outlining the key steps for multikinetic AFT analysis and data interpretation. The order of steps is based on (1) efficiency and speed of analysis, (2) maximizing the number of track lengths, (3) minimizing selection bias for age grains, and (4) obtaining replicate elemental data. The method can be modified to optimize for other factors or to deal with particular sample conditions, but this may increase the cost or the time for analysis. Steps 1 and 2 involve the acquisition of AFT and apatite elemental data. Steps 3 and 4 concern the processing of data to obtain kinetic parameter values that are associated with AFT age and length measurements. Steps 5 and 6 deal with visual displays of the data to aid in the interpretation of kinetic populations. Step 7 involves assessing the interpretation by considering all available data in the context of measurement uncertainty and missing information. The goal here is to try to use all the available data except for obviously poor analyses that provide no useful information (i.e., inaccurate U measurements). Exclusion of any outlier data should be justified on reasonable analytical or geological grounds. Inverse modelling of the interpreted data is carried out in step 8. The objective is to obtain thermal solutions that provide close fits to the data within acceptable statistical precision while satisfying available geological constraints. In general, this requires iterative modelling to refine implicit model parameters, explicit boundary conditions, and investigate different thermal-history styles.
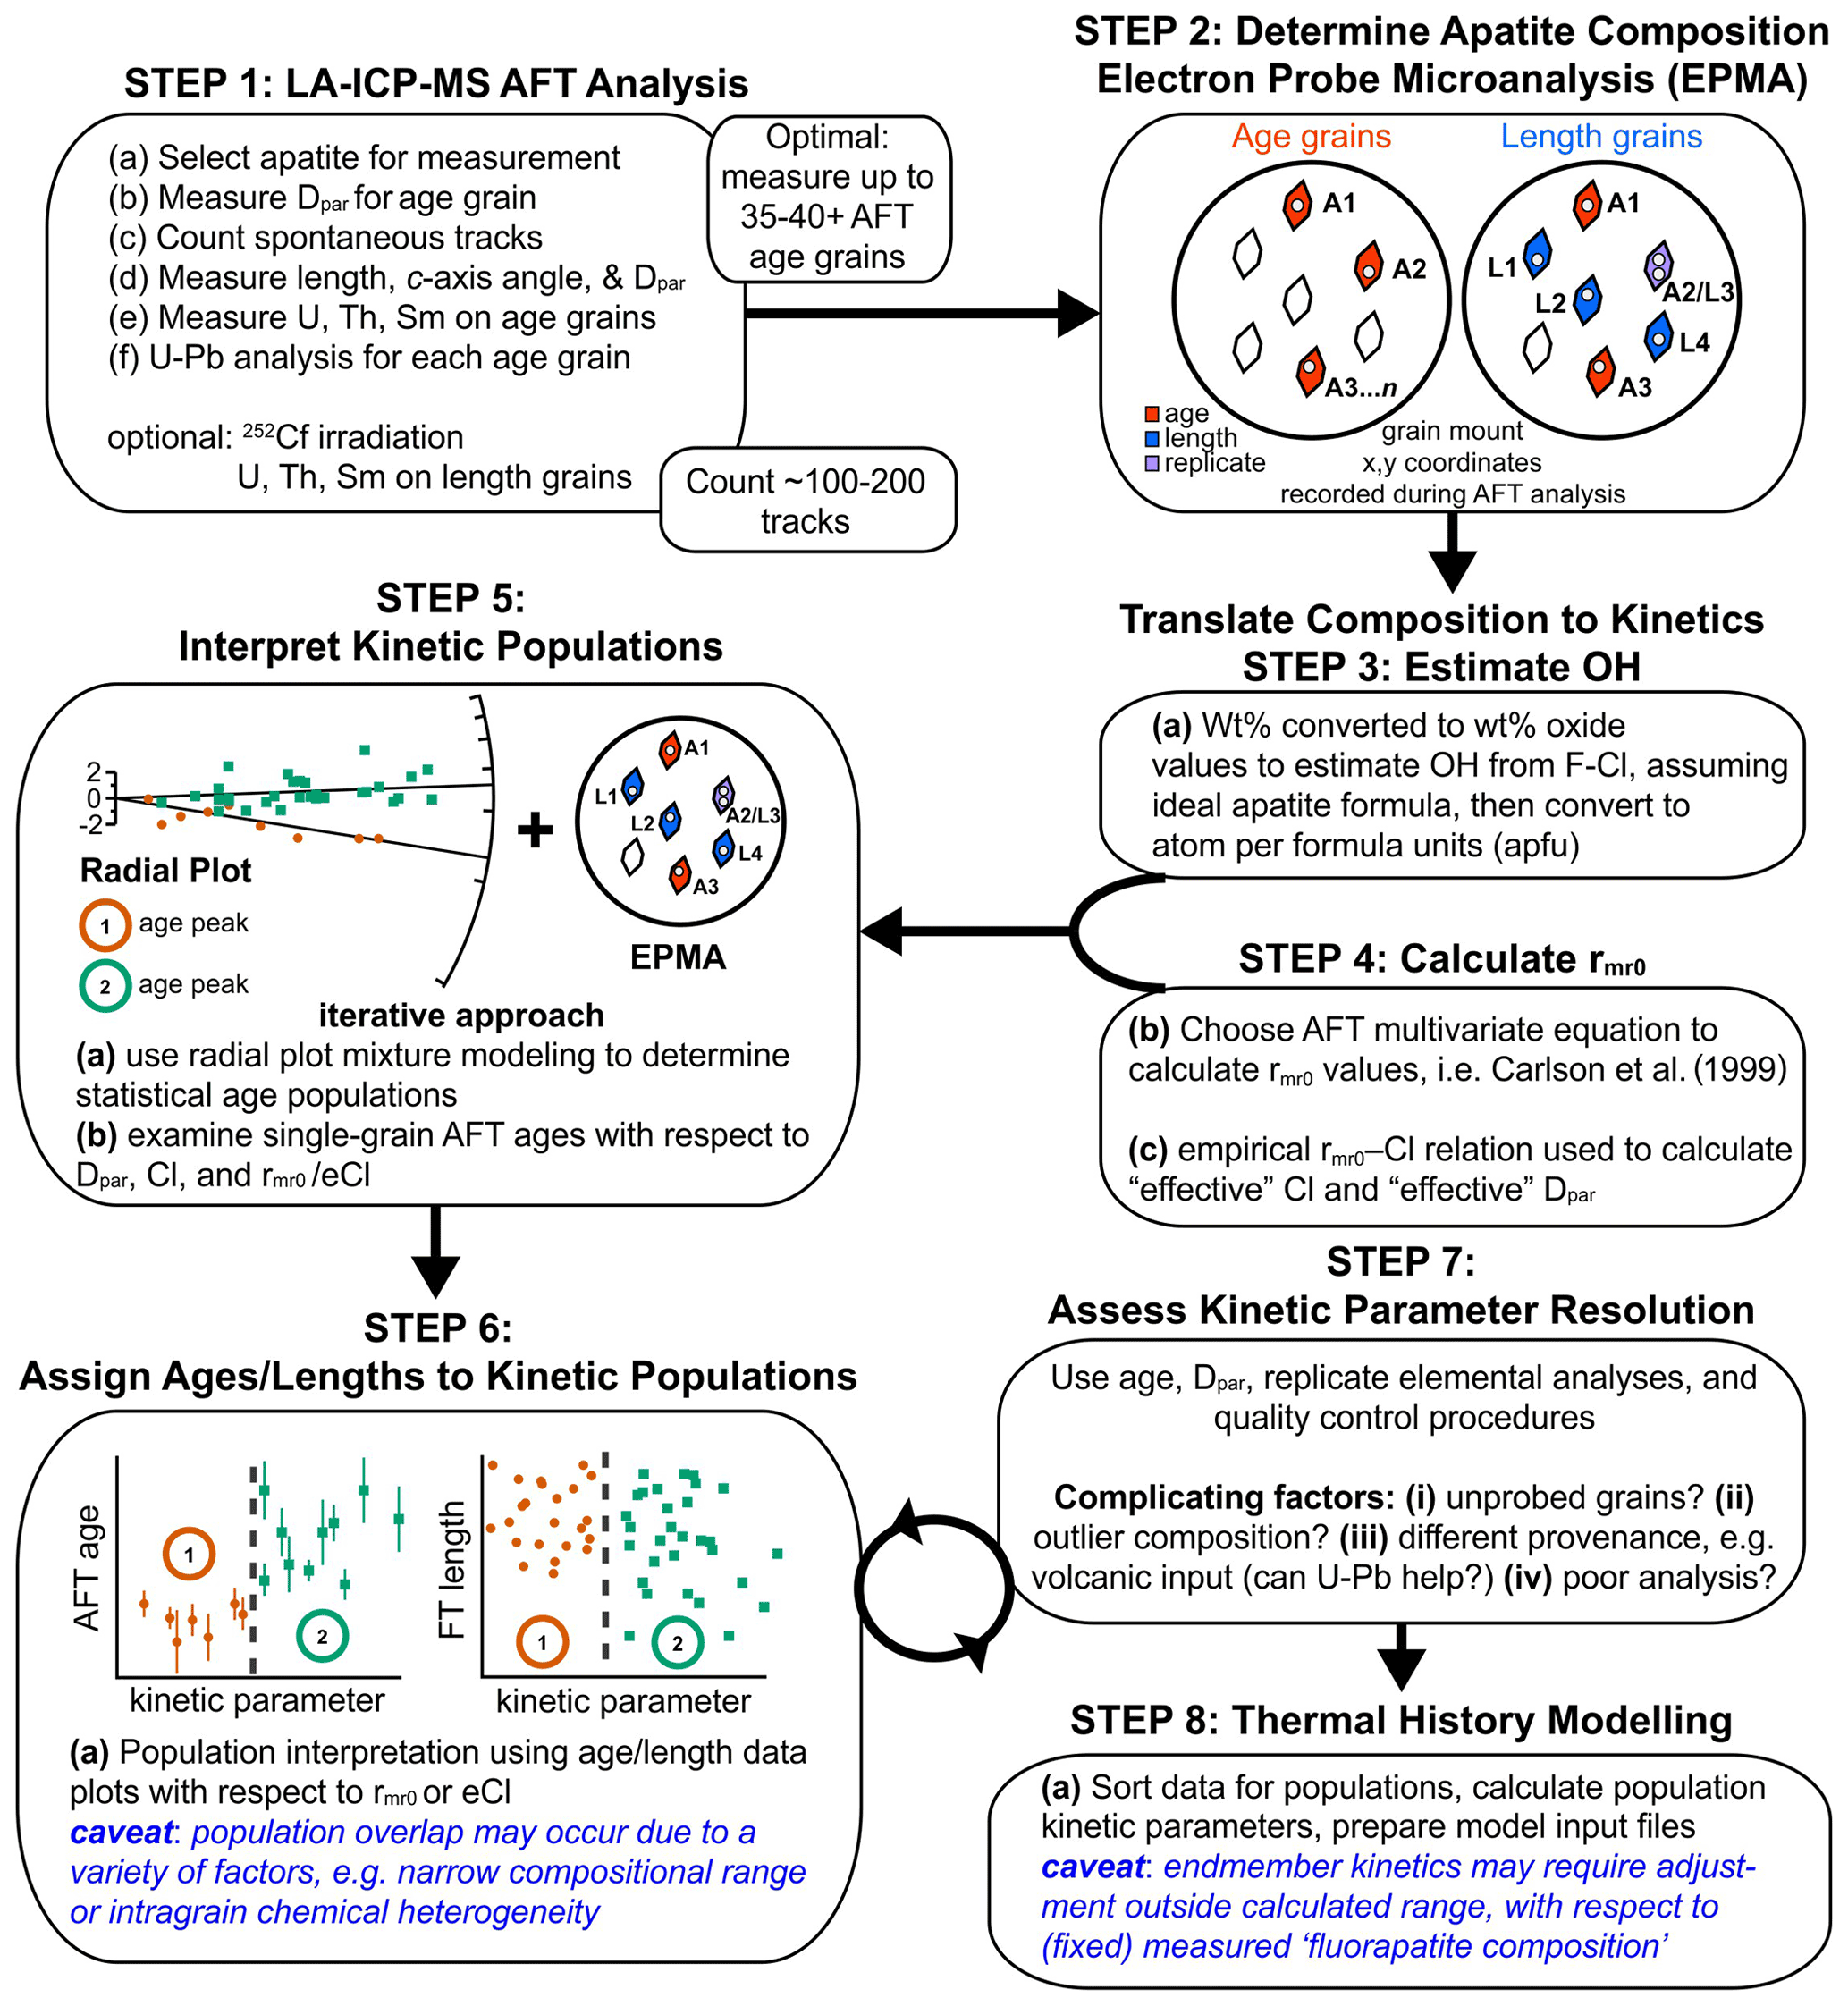
Figure 1Flowchart outlining the key steps involved in the acquisition, interpretation, and modelling of multikinetic AFT data.
2.1 AFT and elemental data acquisition
This section discusses the type of data required for multikinetic AFT thermochronology; more details on sample analysis are in Issler et al. (2021). Our AFT data were acquired using the laser ablation inductively coupled plasma mass spectrometry (LA-ICP-MS) method (Chew and Donelick, 2012; Cogné et al., 2020; Donelick et al., 2005; Hasebe et al., 2004) although the technique works equally well using the older external detector method (EDM; Hurford and Green, 1982). A key difference is that the U data needed for AFT age determination are acquired for the spontaneous track count area after counting is completed (LA-ICP-MS method), whereas counting of spontaneous and induced (proxy measure for U from sample irradiation) tracks are done at the same time (EDM). Typically, 40 single-grain AFT ages and 100–200 track lengths are obtained per sample, depending on apatite yield. Generally, this amount of data is sufficient for most multikinetic samples with two or three kinetic populations, but more data may be required for samples with unevenly distributed populations or with more than three populations. In contrast, many EDM AFT studies have used a lower number of age grains per sample (usually ≤20) for thermal-history studies. The greater number of counted age grains naturally increases the statistical probability of χ2 failure that may complicate mixture model interpretation (McDannell, 2020; Vermeesch, 2019).
Following standard mineral separation and grinding, polishing, and etching of apatite crystals to expose spontaneous tracks, grain mounts are typically 252Cf-irradiated to increase the number of confined tracks for length measurement (this may not be necessary for samples with high track densities such as Precambrian samples). Following this, spontaneous tracks are counted, Dpar is measured for individual apatite age grains (average of four Dpar measurements where possible), and grain x and y coordinates are recorded so that subsequent measurements can be linked to the age grains (Step 1, Fig. 1). The sample is re-etched to reveal horizontal confined tracks and their lengths and angles with respect to the mineral c axis, and Dpar are measured and x and y coordinates are recorded for the measured grains. Finally, the sample is analysed using LA-ICP-MS to obtain U, Th, Sm, and U–Pb age and trace element (as an option) data for the AFT age grains, ensuring that the laser spot coincides with the track count area to minimize any potential problems with inhomogeneous U distributions. Jepson et al. (2021) discuss how U–Pb age, trace element, and AFT data can be used to enhance thermal-history interpretations. As an additional option, U–Pb age, U, Th, Sm, and other trace element data can be acquired for the length grains as well. Although apatite U–Pb ages and Dpar measurements are of low precision, the data can be useful for the qualitative assessment of AFT kinetic populations because it is not always possible to obtain elemental data for every grain. In particular, U–Pb ages can be very useful for distinguishing between detrital and volcanic components. Routine application of the above procedures means that ages and lengths are measured separately and only a subset of grains may have both age and length measurements. There are significant advantages to obtaining length measurements from all the age grains, but the analysis is a more time-consuming process.
Step 2 (Fig. 1) involves the acquisition of detailed elemental data for sample apatite grains having AFT age and length measurements. These data are critical for constraining the annealing parameters that are required to recognize and group the data into different statistical kinetic populations. Currently, we recommend that elemental data be acquired using electron probe microanalysis (EPMA) rather than by LA-ICP-MS even if the latter method allows for elemental data to be acquired at the point of age measurement and it is more convenient to integrate in the workflow. We have used both methods, and they give accurate information for the elements analysed. However, at present, F content cannot always be determined accurately using LA-ICP-MS, and therefore OH content cannot be estimated. Without OH information, track retentivity can be underestimated, causing significant overlap of populations in kinetic parameter space, a result consistent with previous studies that emphasize the influence of OH on kinetic parameters (Ketcham et al., 1999; Powell et al., 2018). Analytical conditions for elemental analysis are summarized in the elemental data files included with the Issler et al. (2021) sample report. For the sake of efficient sample processing, a single setup was used for elemental analysis, and time-dependent corrections were used to deal with halogen migration (similar to Nielsen and Sigurdsson, 1981), with the knowledge that crystals oriented with their c axis parallel to the electron beam could yield some inaccurate results.
In our experience, the following suite of elements are useful for identifying kinetic populations for most multikinetic samples: Fe, Mn, Mg, Na, Sr, La, Y, Ce, F, Cl, Ca, P, Si, and S. Fe is very important because current kinetic model calibrations suggest it has a stronger influence on annealing than other elements and is common in apatite recovered from Phanerozoic rocks of northern Canada. In addition, multikinetic detrital samples can have significant concentrations of elements such as Mn, Mg, Na, and Sr. Anions (F, Cl, OH) are known to have a strong effect on annealing behaviour, and both F and Cl are essential for estimating OH (e.g., Barbarand et al., 2003; Carlson et al., 1999). Ca and P are useful for assessing the quality of probe analyses and ensuring stoichiometric calculations are accurate. Finally, Si and S have been observed in high abundance for some samples, although their contributions to annealing cannot be properly accounted for with existing models. These data may still be useful for assessing relative track retentivity among grains, particularly Si, since there is experimental evidence to suggest it greatly enhances track retentivity (in wt % quantities) with respect to the Durango apatite age standard (Tello et al., 2006). The raw analysis time for our samples (Peter Hooper Geoanalytical Lab, WSU) is approximately 3.7 min per spot (16 grains per hour), excluding the time for setup (1–2 h), standardization (8 h), and point picking (150 grains per hour). Hourly billing is capped at 12 h d−1, and thus it is advantageous to run samples in large batches for 48–72 h straight, which can reduce the hourly rate by 30 %–40 %. EPMA increases the average cost of AFT analysis by approximately 20 % for our samples.
We try to obtain EPMA measurements on a smooth “clean” surface, but this is not always possible for small grains with many etched tracks and other imperfections. Missing elements and track void space in the electron beam excitation volume can result in elemental totals that are less than the 97 wt %–100 wt % expected for good analyses (see the data tables in Issler et al. , 2021), and this can happen for samples with AFT data acquired by LA-ICP-MS or EDM. Fortunately, we have observed that suboptimal analyses still yield an elemental signature that allows for discrimination of different kinetic populations. Replicate elemental analyses with good and lower elemental totals yield similar results for the study samples. EPMA is undertaken in two passes per grain mount using the x and y coordinates to identify grains with age and length measurements (step 2, Fig. 1). As a result, there may be sets of replicate elemental analyses corresponding to grains with both types of measurements. Replicate analyses (both Dpar and elemental) are very useful for assessing the reproducibility and relative precision of conventional and elemental-based kinetic parameters (see below). Results indicate that compositional zoning is not a common problem for the samples we have studied, which is important because the grains are not probed at the exact point of age measurement (laser ablation precedes EMPA). This could contribute to the occasional compositional outlier in kinetic parameter space if elemental zoning is present, but kinetic populations are still better resolved compared to when conventional parameters Dpar or Cl are used (see below). Changing the order of steps so that EPMA is done before laser ablation may help alleviate this problem and reduce the number of AFT grains without elemental data, but it could delay sample analysis time by up to several weeks because samples must be transferred back and forth between labs and schedules need to be coordinated. Our current method is efficient and works well for the majority of our samples, but it can be modified as needed to deal with more problematic samples. For example, if compositional zoning is a significant issue, it might be better to do laser ablation after EPMA and obtain track lengths from age grains only.
Elemental weight percentage oxide values are converted to atoms per formula unit (apfu) based on an ideal apatite formula (step 3, Fig. 1). We used in-house software (Probecal) that incorporates the stoichiometric model of Ketcham (2015) to calculate apfu values (including estimation of OH content) for the Permian sample (Table 1). Elemental data were collected in 2011 for the Devonian sample and provided as apfu values directly from the fission-track laboratory. The apfu values are needed for calculating the empirical annealing kinetic parameter, rmr0 (Carlson et al., 1999; Ketcham et al., 1999, 2007).
2.2 Kinetic parameter determination and precision
2.2.1 Calculation of rmr0, effective Cl, and eDpar values
Composition-dependent AFT annealing was investigated using laboratory experiments (Carlson et al., 1999), and the observed difference in annealing behaviour between different compositional groups was approximated using the following equation (Ketcham et al., 1999):
where rlr and rmr are the reduced fission-track lengths corresponding to apatite that is less resistant and more resistant to thermal annealing, respectively, and k and rmr0 are fitted parameters. The most resistant apatite in the experimental dataset is B2 apatite from Bamble, Norway (highly enriched in Cl and OH) and it is the reference apatite used in Eq. (1). The parameter, rmr0, is the reduced length of the more resistant apatite at the point in the thermal history when the less resistant apatite is totally annealed. From a computational standpoint, this means that annealing calculations are only required for the most resistant reference apatite and the degree of thermal annealing can be determined for any number of less resistant apatite populations using Eq. (1). Elemental apfu values can be used with an empirical multivariate equation (Eq. 6 in Carlson et al., 1999) to calculate rmr0 values for each analysed apatite grain per sample (step 4, Fig. 1). Ketcham et al. (2007) proposed an alternate equation for rmr0 that was derived from the analysis of the combined annealing experimental data of Carlson et al. (1999) and Barbarand et al. (2003). Either equation can be used, but we prefer the original Carlson et al. (1999) equation because it resolves kinetic populations better (less grain overlap) for the samples we have studied. Small values of rmr0 represent highly track-retentive apatite (rmr0=0 for B2 apatite), whereas retentivity decreases with increasing rmr0. Although endmember fluorapatite has a nominal rmr0 value of 0.84 for the Ketcham et al. (1999) annealing model, we have encountered less retentive apatite with higher rmr0 values and the model can be extrapolated beyond this limit. Conversely, the model will not work properly in the unlikely event that an apatite is more retentive than the reference B2 apatite.
For most AFT studies, detailed elemental data are unavailable and Dpar or Cl content are used as kinetic parameters that are converted to rmr0 values in thermal-history models for the annealing calculations. Here, we do the opposite and convert element-based rmr0 values for each apatite grain into “effective Cl” (eCl) values (apfu) (e.g., Issler et al., 2018; McDannell et al., 2019; Schneider and Issler, 2019; McDannell and Issler, 2021) (step 4, Fig. 1) using an equation that relates rmr0 to measured Cl (given in Fig. 7 of Ketcham et al., 1999):
where Abs(Cl−1). Similarly, we can convert rmr0 values to “effective Dpar” (eDpar) values using the Ketcham et al. (1999) expression that relates rmr0 to Dpar:
Equations (2) and (3) can be used to transform measured kinetic parameters (i.e., Dpar and Cl) to rmr0 values or vice versa by rearranging the equations in terms of Cl and Dpar (see Eq. 1 of McDannell and Issler, 2021, for eCl). The Ketcham et al. (2007) multikinetic model has similar equations with slightly different coefficients. For example, the rmr0 value for fluorapatite in this model is 0.83, which translates to an eCl value of ∼0.03 apfu and an eDpar of ∼1.85 µm. The corresponding rmr0, eCl, and eDpar values for the Ketcham et al. (1999) model are 0.84, 0.0 apfu, and 1.75 µm, respectively.
There are several advantages to converting nonlinear rmr0 values to “linear” eCl values for data interpretation purposes. First, eCl values are more evenly distributed on linear x and y plots, which enhances the visual display and interpretation of the data. Second, arithmetic averages of eCl values can be used to estimate representative eCl values for different kinetic populations. Third, eCl values can be compared with the conventional parameter, Cl content, to show how other elements enhance AFT retentivity beyond what is expected from Cl alone. The eCl parameter represents the Cl concentration that would be required to yield an equivalent rmr0 value for the Ketcham et al. (1999) annealing model. The data transformation is temporary because eCl values revert back to rmr0 values when used for thermal-history modelling.
2.2.2 Relative precision of rmr0 versus conventional kinetic parameters
In order to investigate the relative precision of elemental-based rmr0 values with respect to Dpar and Cl content, elemental data were compiled for fifty-two Phanerozoic AFT samples collected from northern Yukon and the Northwest Territories of northern Canada and then calculated rmr0 values were converted to eCl and eDpar values (step 4, Fig. 1) using Eqs. (2) and (3). Replicate elemental (a single EPMA spot per AFT analysis) and Dpar analyses from separate measurements on grains with both age and length data (step 2, Fig. 1) are very important for assessing the reproducibility of kinetic parameter values (Fig. 2). The eCl and eDpar values represent the actual Cl and Dpar measurements that would be required to produce the same rmr0 value as derived from elemental data. Significant differences between these calculated and measured values imply that there are incompatibilities between rmr0 and these conventional kinetic parameters. The data used for Fig. 2 are in the Supplement; these data will be published in more detail elsewhere after interpretation and modelling have been completed for these samples.
Figure 2a and b show a comparison of replicate eCl and Cl values, respectively, from single-spot elemental analyses on apatite grains from fifty different samples. Both eCl and Cl are reproducible within ±0.03 apfu for the majority of the data, representing a 5 %–10 % variation over the range of measured values. As expected, a somewhat higher percentage (91 % versus 84 %) of Cl values show closer agreement than the eCl values which were determined using multiple elements. Approximately 95 % of the eCl values are within ±0.06 apfu, and a small number of grains show differences as high as 0.24 apfu, likely representing chemical zoning within a sample. A similar plot of 322 replicate results for F is included with Table S1 in the Supplement, and it shows that 92 % of the measurements are within ±0.2 apfu, with larger variations associated with zoning and non-stoichiometric F values. Overall, the accuracy of the halogen measurements is sufficient for estimating OH contents and calculating rmr0 values. These results are encouraging because they suggest that chemical zoning is not a widespread problem and that single-spot probe analyses may be adequate to generate consistent eCl values for most apatite grains. In contrast, replicate Dpar analyses show much larger variation that represents uncertainties of up to ±20 %–50 % of the typical measured range in a sample (Fig. 2c). Such large variations in Dpar could make it difficult to resolve different kinetic populations if they are present. Despite the relatively high precision of eCl and Cl measurements, there are strong systematic differences between them (Fig. 2d). The eCl values are skewed to the right of the 1:1 line, indicating higher track retentivity than predicted by Cl alone due to the contributions of OH and elevated cation concentrations. Apatite with low Cl values can still have high eCl values as a result. Dpar is a function of apatite solubility, which in turn is related to mineral composition. The influence of apatite composition on Dpar may be the reason why data points are more evenly distributed on the Dpar versus eDpar plot (Fig. 2e). Large differences between eDpar and Dpar seem to be explained mainly by the imprecision of the Dpar measurements (Fig. 2c).
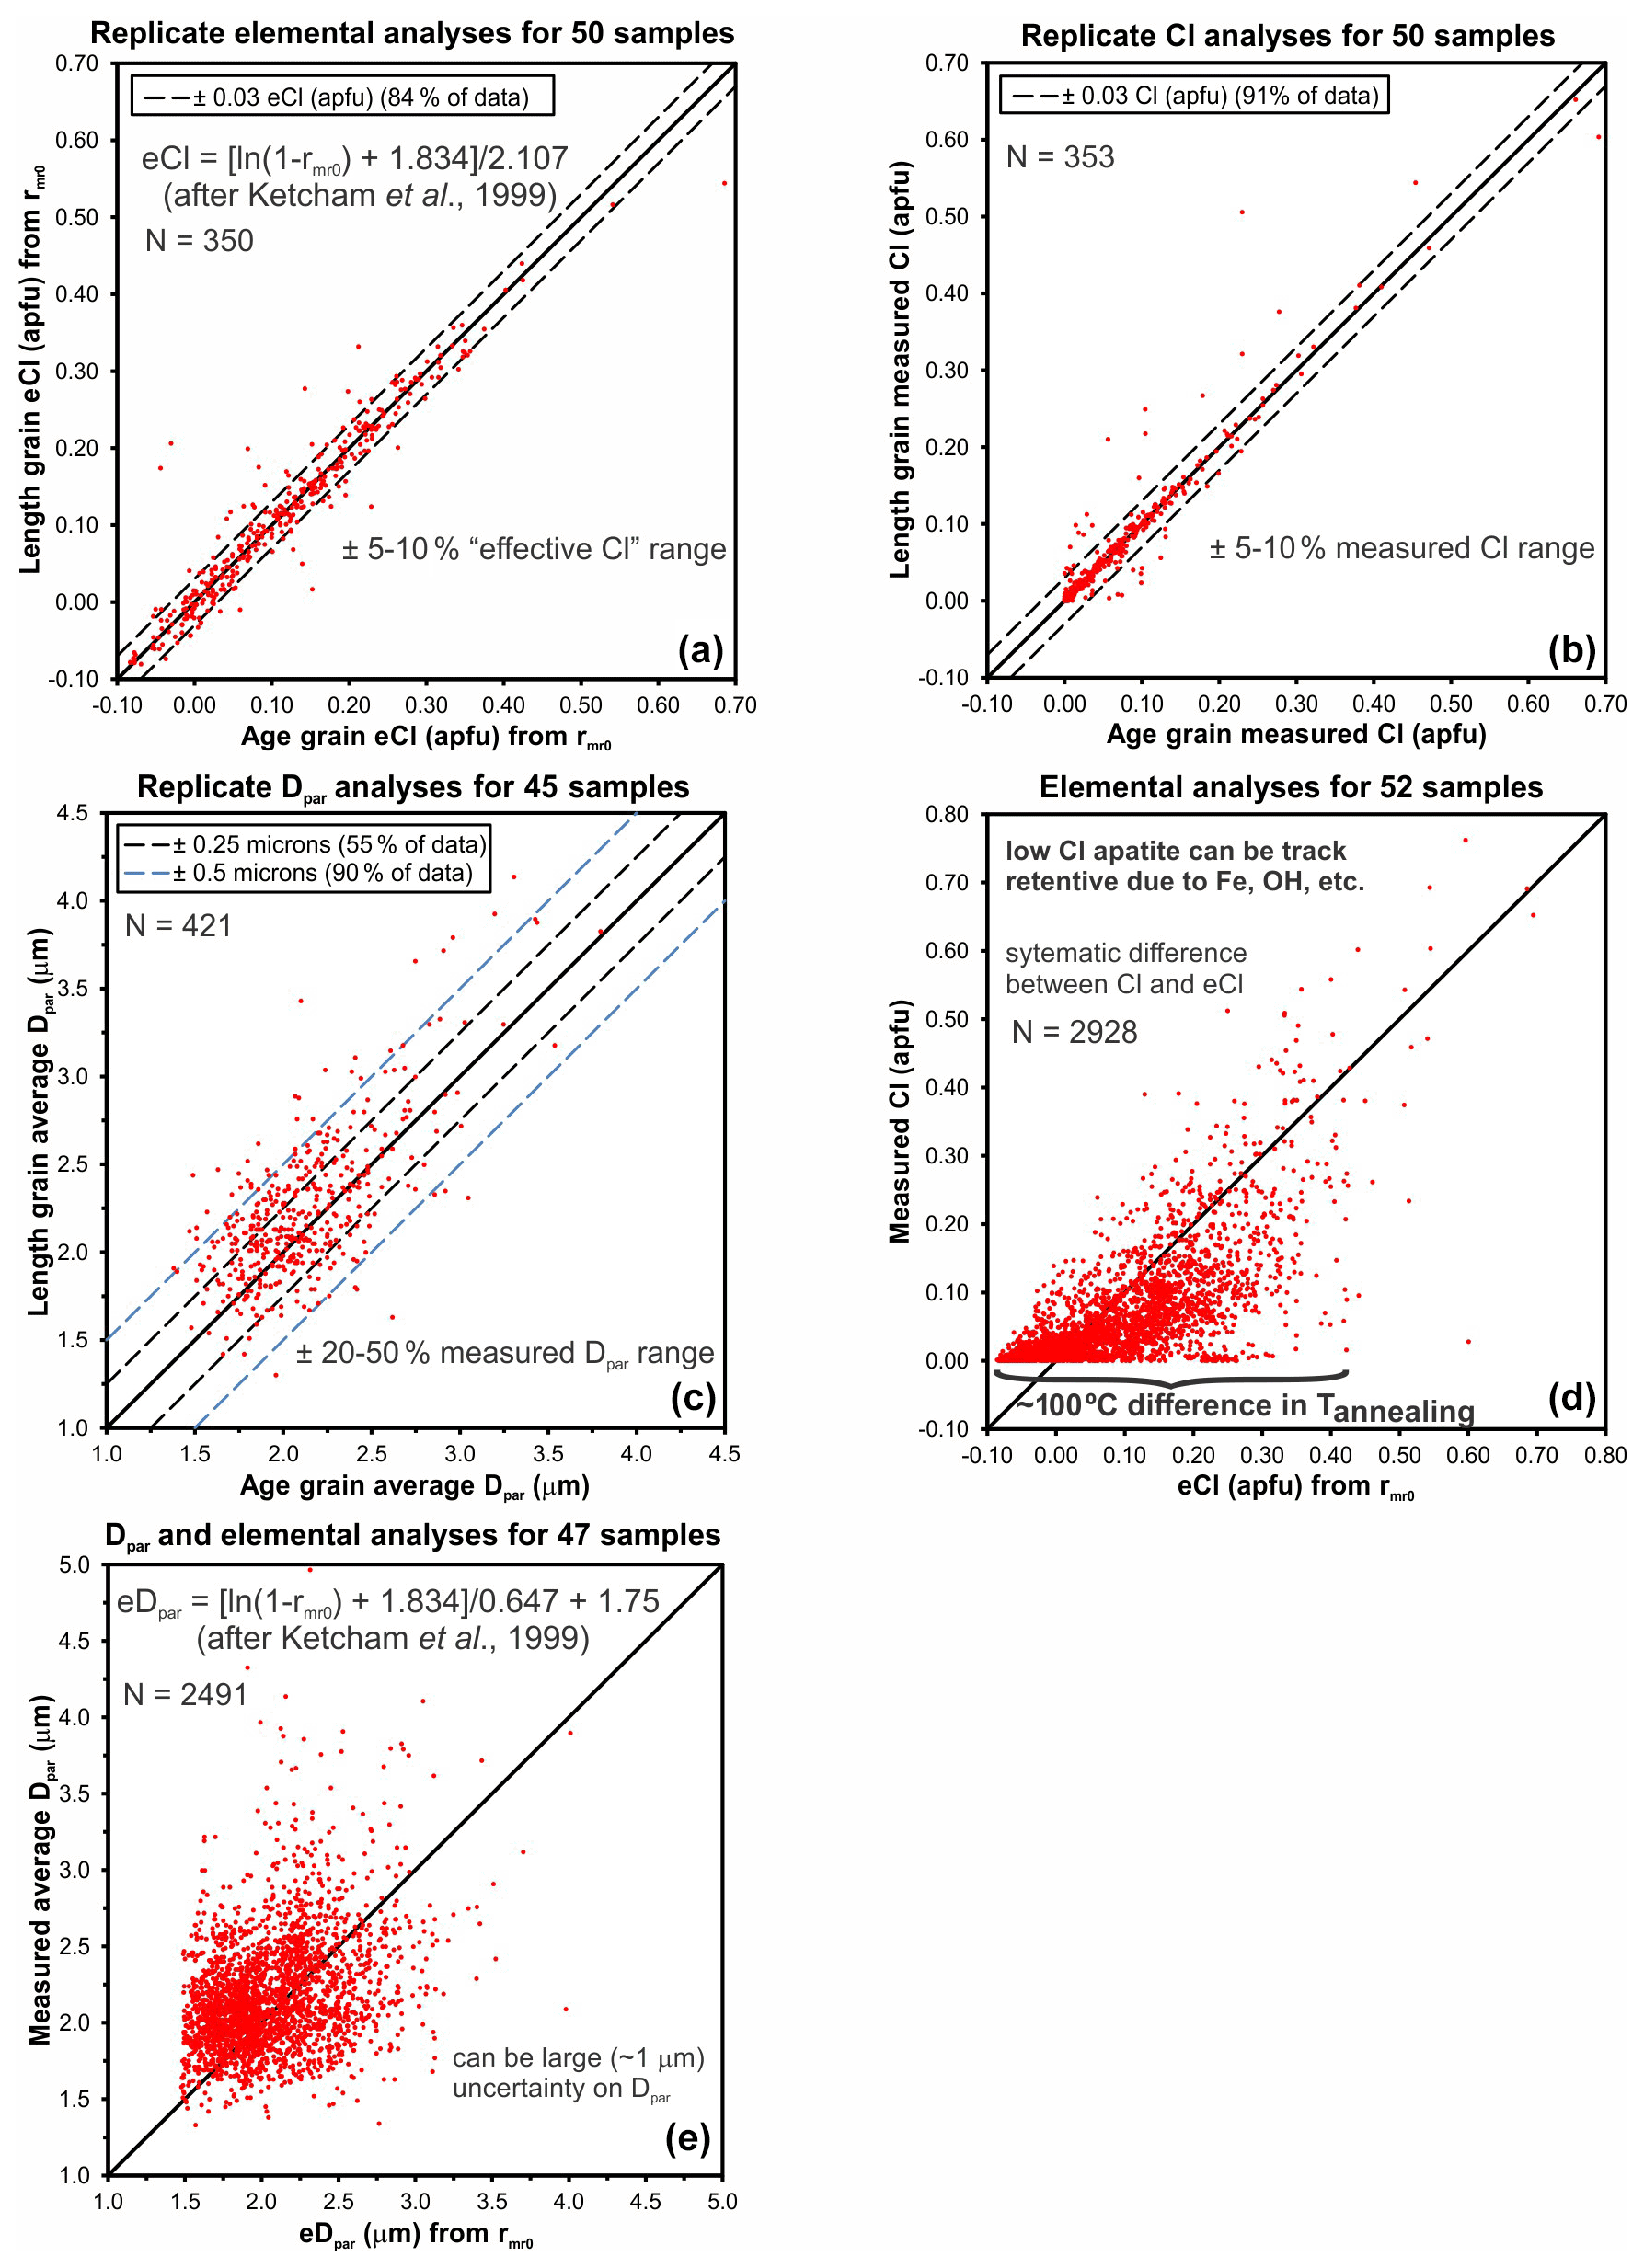
Figure 2Relative precision of different AFT kinetic parameters based on data from Phanerozoic rocks of northern Canada. (a) The eCl values from replicate elemental analyses for apatite grains with both age and length measurements. (b) Replicate Cl analyses for apatite grains with both age and length measurements. (c) Replicate Dpar measurements for apatite grains with both age and length measurements. (d) Comparison of Cl values with elemental-derived eCl values for the same apatite grains. Note systematic differences where eCl values tend to be greater than Cl values because multiple elements increase track retentivity. (e) Comparison of measured Dpar values with elemental-derived eDpar values for the same apatite grains. Unlike in panel (d), data are more evenly distributed around the 1:1 line, suggesting that low measurement precision may be a dominant influence.
In summary, the elemental-based rmr0 parameter has significantly higher precision than Dpar and, unlike the single parameter Cl, it incorporates experimentally determined contributions of multiple elements to AFT annealing behaviour. Analysis of Phanerozoic rocks in northern Canada indicates that heterogeneous apatite composition is widespread in sedimentary rocks. Therefore, rmr0 is superior to Dpar or Cl for recognizing and characterizing multikinetic AFT populations in samples with variable apatite composition.
2.3 Kinetic population interpretation
Preliminary interpretation of the data gathered in steps 1 to 4 (Fig. 1) involves visual display of single-grain AFT ages on a radial plot (Galbraith, 1990) and age mixture modelling (Galbraith and Green, 1990; Sambridge and Compston, 1994) to investigate if the sample may have more than one age population (step 5; Fig. 1). We use the DensityPlotter software (version 8.4; Vermeesch, 2012) to plot single-grain AFT ages and estimate age populations. Single-grain ages and track length measurements are then plotted with respect to eCl values to determine whether discrete age and associated length populations can be identified as statistical kinetic populations (step 6; Fig. 1). Although boundaries separating interpreted kinetic populations are set at a fixed eCl value, overlap of some population age and length data across boundaries is expected, given the documented uncertainties in eCl values (Fig. 2a). Other complications may include missing elemental data for some grains, compositional zoning, outlier ages associated with a different provenance, and poor-quality data. Some ambiguity in the interpretation can be reduced by including other data such as apatite U–Pb age data, Dpar values, replicate elemental analyses, and quality control procedures to refine the interpretations (step 7, Fig. 1). Kinetic population interpretation is facilitated if all length measurements come from age grains; if not, length data must be sorted using eCl values and information from replicate measurements. Single-grain ages can be “colour coded” with respect to the kinetic populations on a radial plot for comparison with the radial arms representing model age populations. There is strong evidence to infer multikinetic behaviour if age populations based on eCl values correspond closely with those determined from age mixture modelling, especially if there is other evidence (e.g., organic maturity) to indicate that burial temperatures were hot enough for substantial AFT annealing.
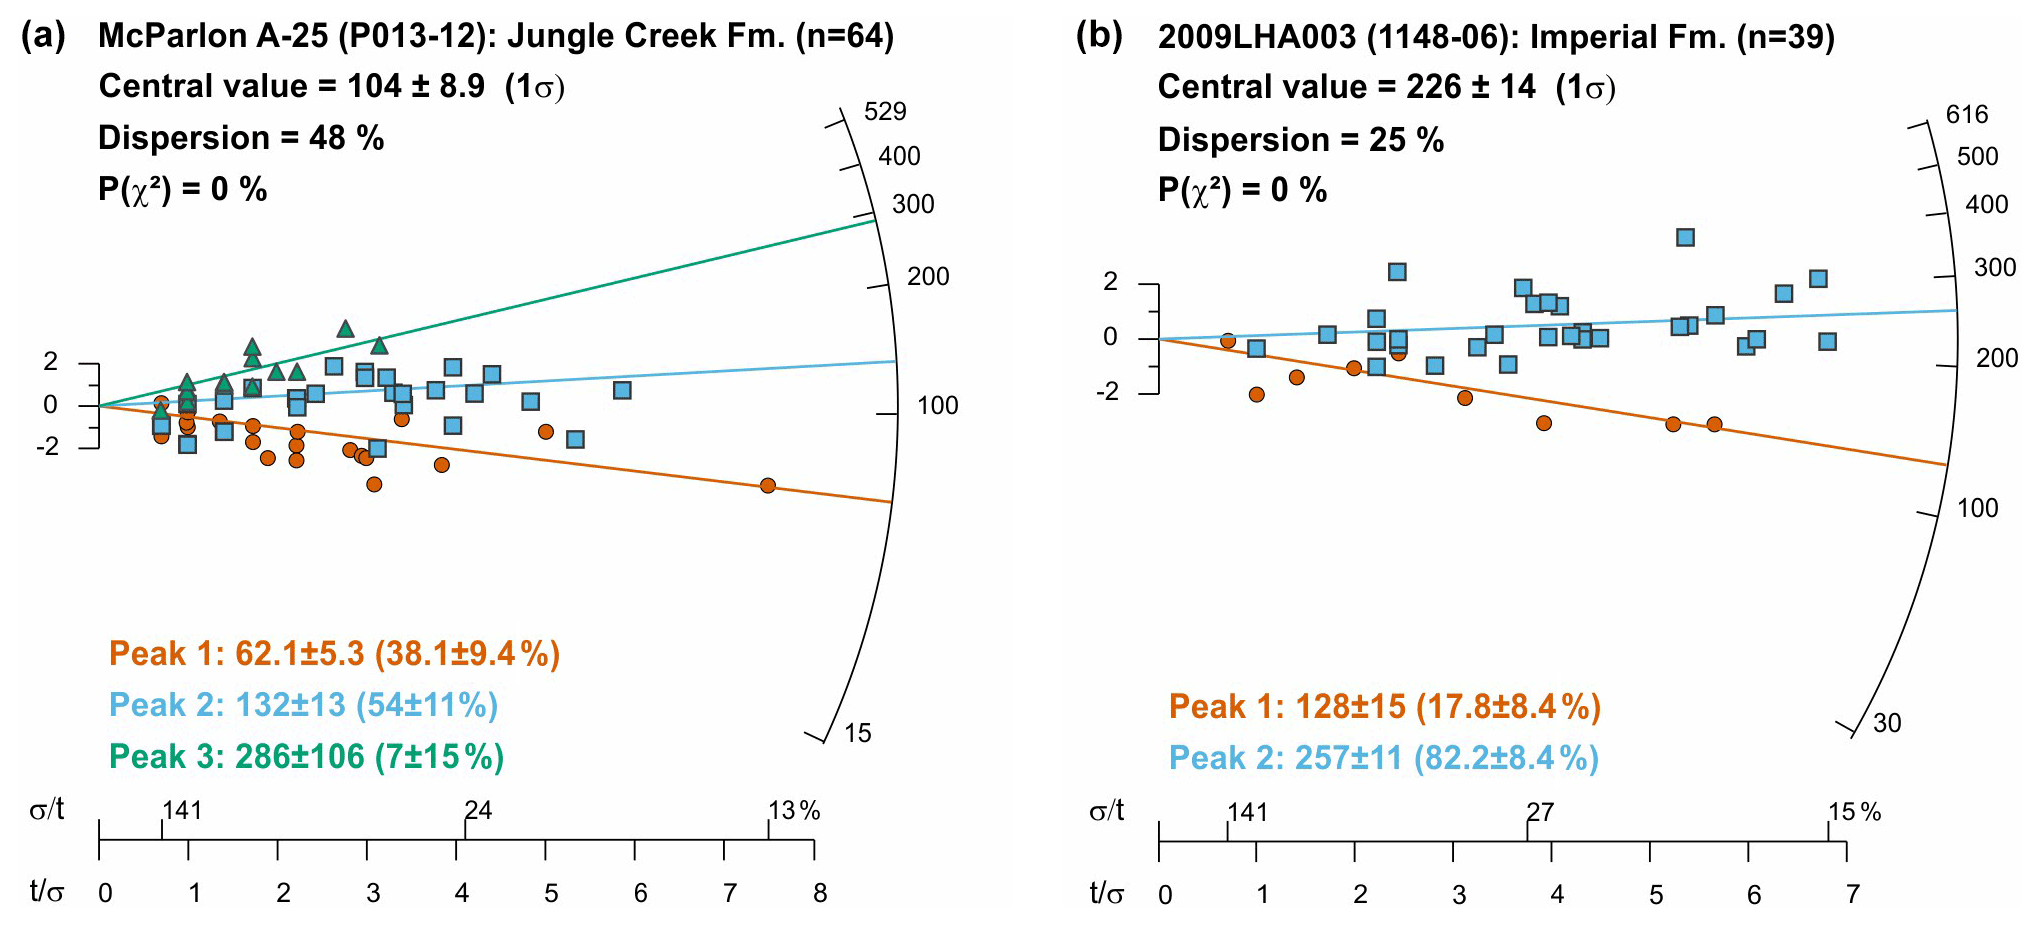
Figure 3Radial plots of single-grain ages for the multikinetic Permian (a) and Devonian (b) AFT samples. Points are colour coded according to the kinetic populations determined in Figs. 4 and 5. Peak ages are from age mixture modelling (estimated percentage of grains per population in brackets) and show good correspondence with kinetic population ages summarized in Table 2.
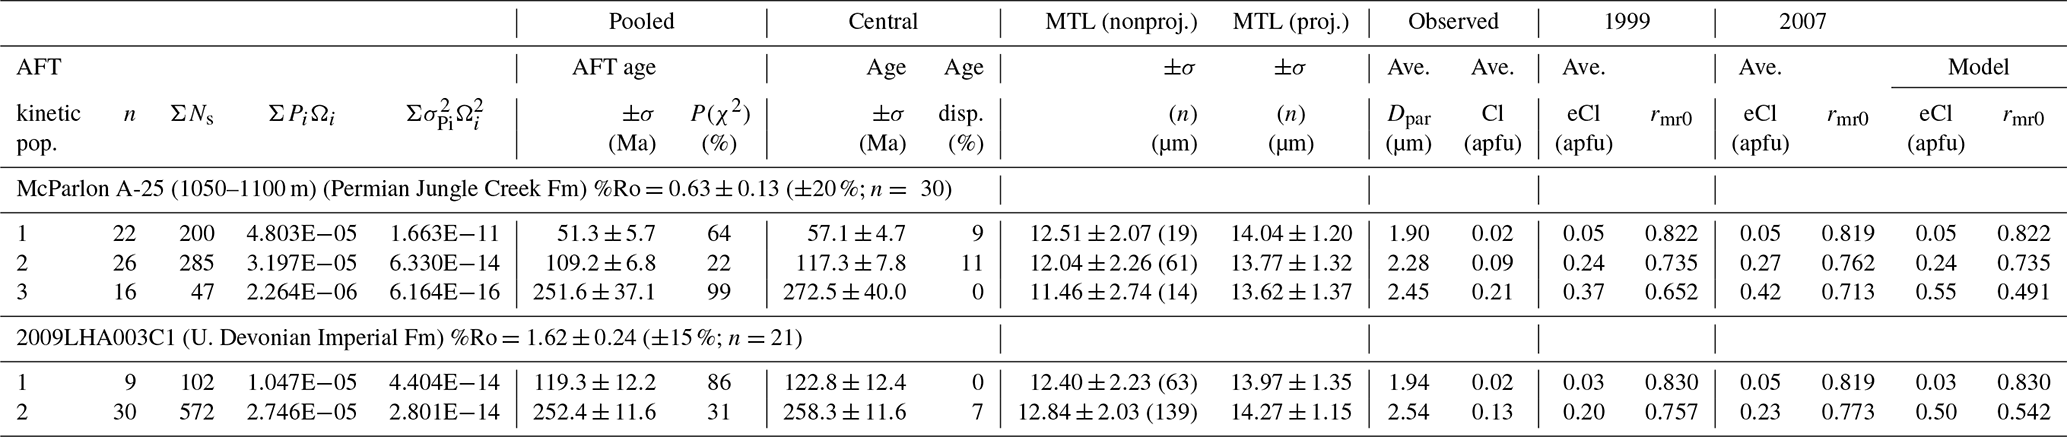
Figure 3 shows radial plot results for the Permian (Jungle Creek Fm.) and Upper Devonian (Imperial Fm.) AFT samples listed in Table 1. Age mixture modelling yields three and two age populations for the Permian and Devonian samples, respectively. Single-grain ages are colour coded according to the interpreted kinetic populations in Figs. 4 and 5 and the model peak ages (Fig. 3) are within a standard deviation of the kinetic population ages summarized in Table 2 (see Issler et al., 2021, for complete AFT data). All kinetic populations pass the χ2 test, but the complete samples fail with high age dispersion (Fig. 3). Pooled ages are used for the kinetic populations if age dispersion is <10 %; otherwise, the central age is used. Age and length data are well resolved for each kinetic population when plotted with respect to eCl (Figs. 4a, b and 5a, b) but show significant to complete overlap when plotted with respect to Cl content (Figs. 4c, d and 5c, d) and Dpar (Figs. 4e, f and 5e, f). Population boundaries were set at eCl values of 0.134 and 0.312 apfu for the Permian sample (Fig. 4a, b) and 0.725 apfu for the Devonian sample (Fig. 5a, b). Percent vitrinite reflectance (%Ro; Table 2) measurements indicate that both samples exceed the threshold for full organic maturity (0.6 %Ro), implying significant AFT annealing.
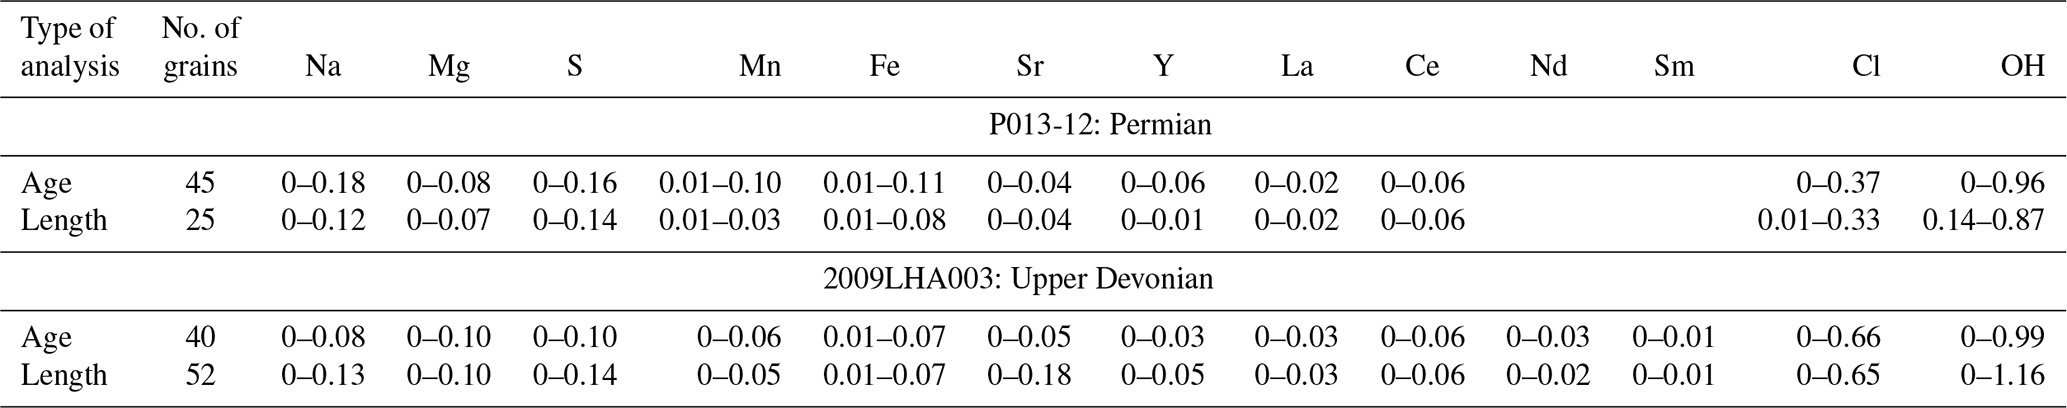
Average Dpar and Cl values are listed for each kinetic population in Table 2. Although average Dpar increases with population age, these values are not viable kinetic parameters due to the severe population overlap in Dpar space. Table 3 summarizes the range of measured elemental concentrations for the apatite grains with age and length measurements (see Issler et al., 2021, for elemental data), and it is clear that there are elevated cation and OH concentrations that can increase track retentivity. In all cases, the average Cl value for each population is less than the average eCl values calculated using the Ketcham et al. (1999) or Ketcham et al. (2007) rmr0 Cl equations (equivalent rmr0 values are shown also). The last two columns in Table 2 show the eCl values (and equivalent rmr0 values) that were used for thermal-history modelling (see below).
Table 2Summary apatite fission track data for Permian and Devonian samples, northern Yukon.
Here, n is the number of age grains for each apatite fission track (AFT) statistical kinetic population per sample.
ΣNs is the sum of the number of counted spontaneous fission tracks for the age grains in each kinetic population per sample.
ΣPiΩi is the sum of the product of individual 238UCa ratios (Pi) and corresponding track count areas (Ωi) for each age grain per kinetic population.
ΣNs and ΣPiΩi are used to calculate the pooled AFT age, and with ΣσPi2Ωi2 (includes error on Pi) they are used to calculate its standard deviation, σ.
Kinetic population grain ages pass the χ2 test for χ2 probability, P(χ2)>5 %.
Central age ± standard deviation and corresponding age dispersion are shown alongside the pooled AFT age for each kinetic population per sample.
Conventional and c axis projected mean track length (MTL) ± standard deviation (number of measured lengths in brackets) is shown for each kinetic population per sample.
The arithmetic average of age and length Dpar measurements (etch figure diameter parallel to c axis) is shown for each kinetic population per sample.
The arithmetic average of age and length Cl measurements is shown for each kinetic population per sample.
Arithmetic average eCl and equivalent rmr0 values from elemental analysis using the Ketcham et al. (1999, 2007) rmr0-Cl equations and values used for thermal modelling.
AFT ages are calculated using the LA-ICP-MS (ζ-calibration) method with modified ζ=12.357, standard error (ζ)=0.2251, and total decay constant of 238U yr−1.
Table 3Summary elemental data for AFT age and length measurements (atoms per formula unit).
The Permian well cuttings sample illustrates some of the issues that can arise when dealing with natural multikinetic samples. It had modest apatite recovery and was processed in two aliquots to obtain 64 single-grain ages and 94 track lengths (Fig. 4). Sample drilling contamination does not appear to be a problem; the sandstone interval is overlain by a shale section, and shallower Cretaceous AFT samples from the well bear no resemblance to it. Not all of the grains could be probed (approximately 30 % of the age and length data have no associated elemental data), but there is enough information to demonstrate that three populations are present. Data from the unprobed grains were sorted using age, Dpar, and information from replicate analyses that link length data to age grains. Missing probe data is not a serious concern for this sample; population ages are similar (within a few million years) if age grains without probe data are excluded. A total of 16 of the length measurements without elemental data are associated with age grains that were sorted into various populations. A total of 11 lengths with intermediate Dpar values were included with the dominant population two; the mean track length changes by <0.3 µm if these data are excluded. Four age grains are interpreted to overlap with other populations in Fig. 4a. A single-grain age in each of populations two and three crosses the boundary dividing the populations but values are within the expected error range (Fig. 2a). Two relatively high precision ages (one with a single track length; Fig. 4b) plot within population two space but are assigned to population one based on their age. We have more confidence in the age (rather than eCl) because U concentration was determined at the point where the tracks were counted (see Sect. 2.1). Other lower-precision young ages were kept with population two because they had little effect on the population age even if they increase the age dispersion (Fig. 4a). In our experience, the LA-ICP-MS method produces consistent and reliable AFT ages, and therefore we use as much of the data as possible. If a higher-precision AFT age matches an existing age population but plots as an outlier in kinetic space, we prefer to reassign it to the matching population rather than omitting the grain.
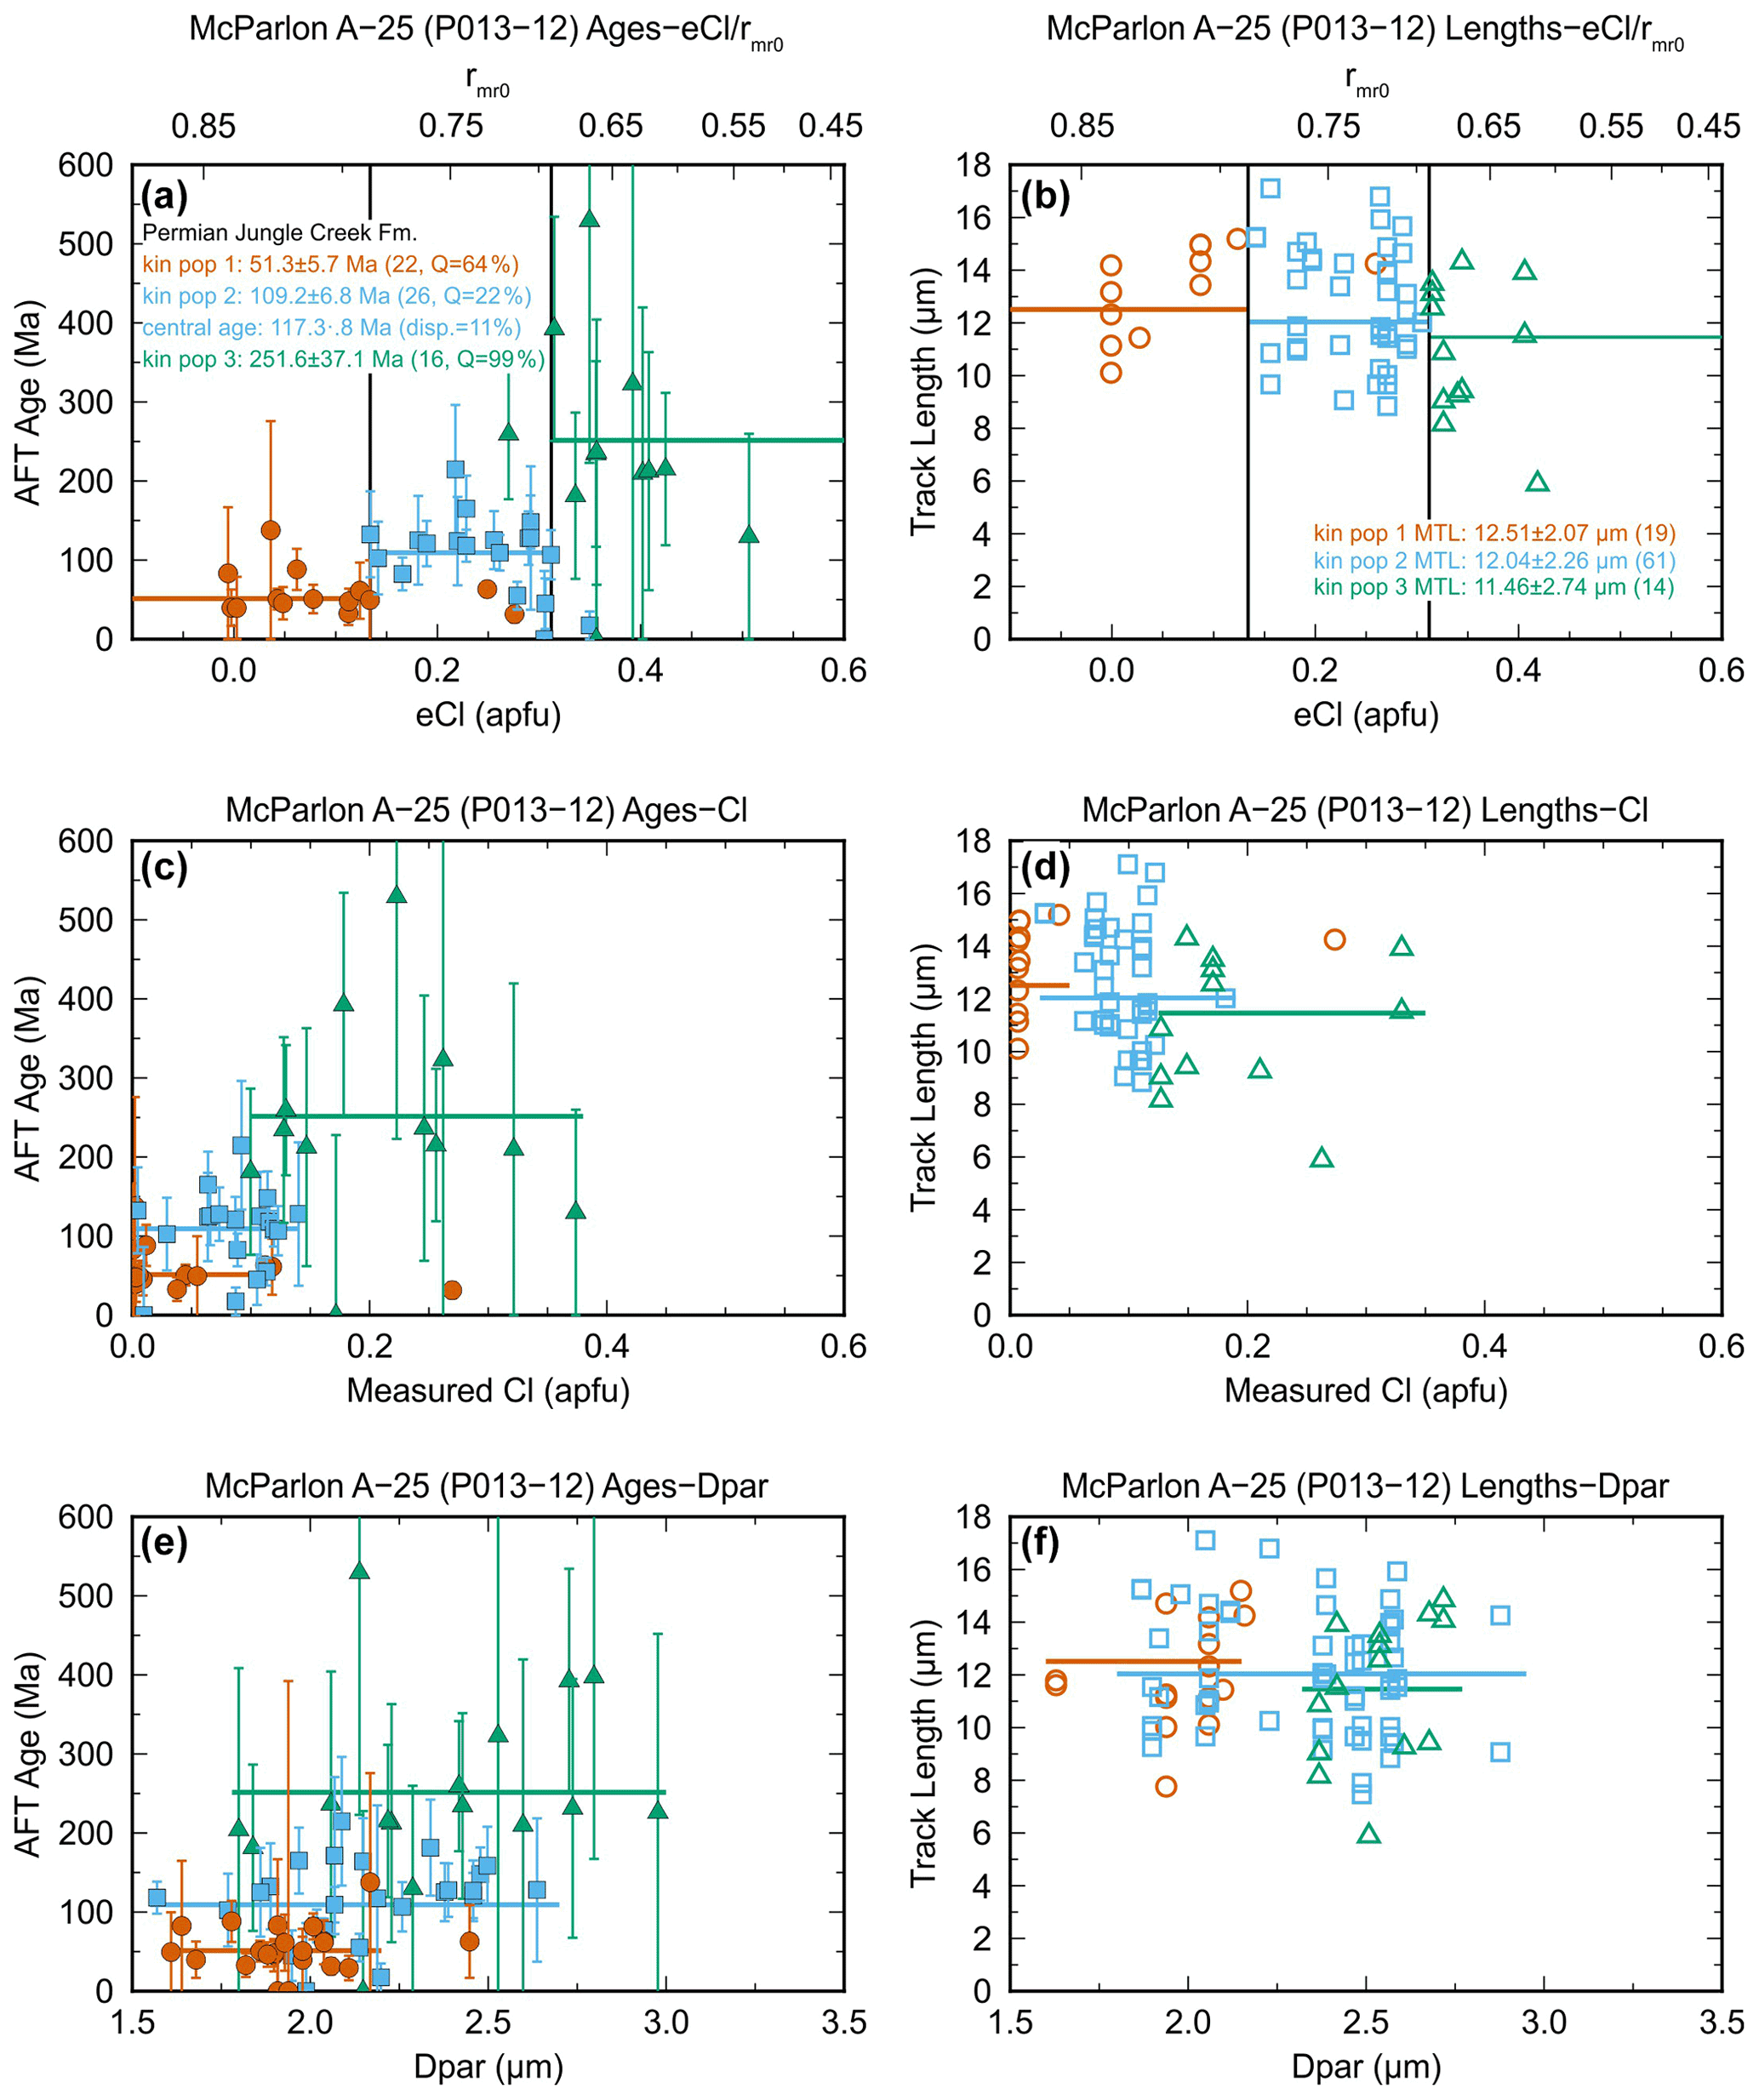
Figure 4Plots of (a) single-grain ages and (b) track lengths grouped into different colour-coded kinetic populations using eCl values for the Permian well sample. Boundary between populations is indicated by vertical black lines. Similar plots of population ages and lengths with respect to Cl concentration (c, d) and Dpar (e, f) using the same colour coding as in (a) and (b) are also shown.
The Devonian outcrop sample is of high quality with 39 single-grain ages and 202 track lengths that clearly define two robust kinetic populations in eCl space (Fig. 5a, b); two single-grain ages from population two are inferred to overlap with population one, but this is within measurement uncertainty (Fig. 2a). Both populations overlap completely with respect to Cl (Fig. 5c, d) and Dpar (Fig. 5e, f), indicating that multikinetic behaviour would be undetected or incorrectly interpreted for this sample using conventional kinetic parameters. Well-resolved populations with low age dispersion (Fig. 5a, b), close agreement between radial plot and kinetic population ages (Fig. 3 and Table 2), high thermal maturity, and abundant AFT data make this an excellent and unambiguous example for illustrating compositionally controlled multikinetic AFT annealing. The next step is to obtain thermal-history information from the multikinetic samples using inverse modelling techniques (step 8, Fig. 1).
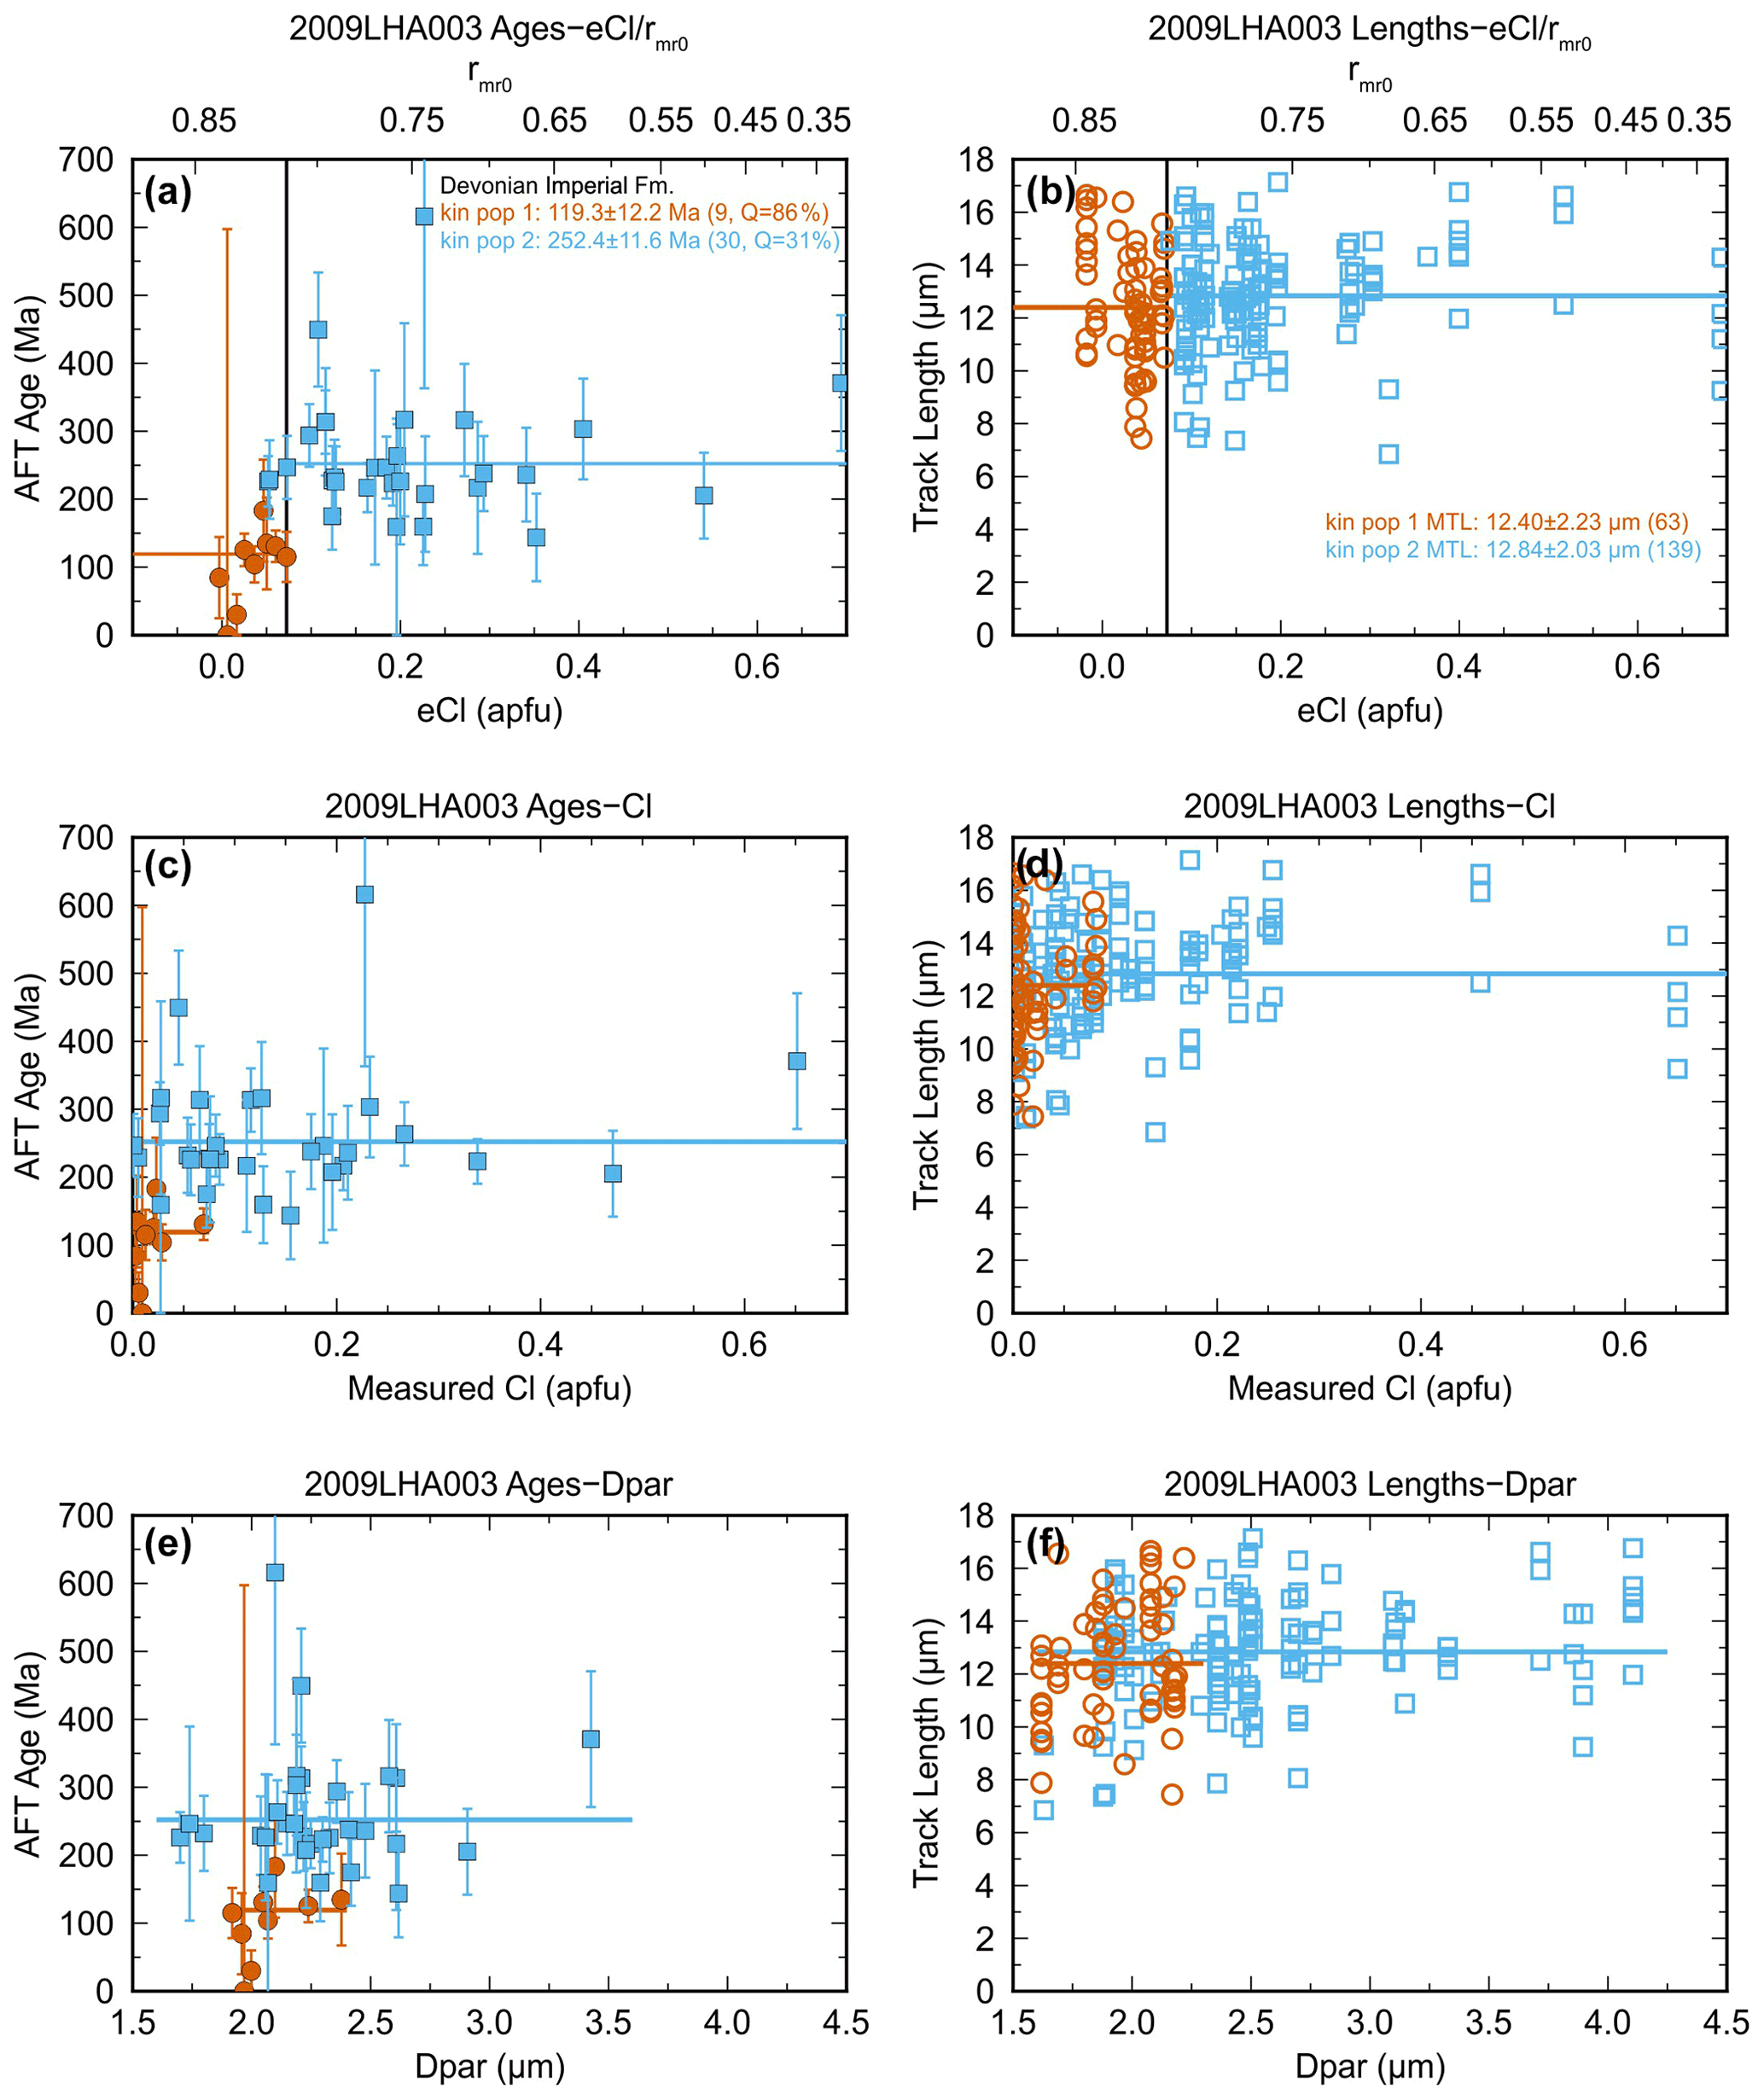
Figure 5Plots of (a) single-grain ages and (b) track lengths grouped into different coloured-coded kinetic populations using eCl values for the Devonian outcrop sample. The boundary between populations is indicated by the vertical black line. Similar plots of population ages and lengths with respect to Cl concentration (c, d) and Dpar (e, f) with the same colour scheme as (a) and (b) are also shown.
We use a newer version of the inverse thermal model AFTINV v. 6.1 (Issler, 1996; Issler et al., 2005) to illustrate how detailed thermal-history information can be extracted from multikinetic AFT data. We refer the reader to McDannell and Issler (2021) for a recent application of the software to a synthetic AFT dataset. AFTINV uses the Ketcham et al. (1999) multikinetic annealing formulation and can model up to four kinetic populations. Similar to the HeFTy model (Ketcham, 2005), thermal histories are generated randomly and fits between calculated and observed AFT ages and lengths are assessed using p values. Temperatures are calculated at fixed, user-specified time points using randomly selected heating and cooling rates. Different thermal-history styles (T styles) can be combined to create complicated thermal histories with multiple phases of heating and cooling. For example, T styles 4 (random heating, then cooling), 5 (random cooling, then heating), and 10 (cooling then two cycles of heating and cooling with randomly selected thermal minima) are used for modelling the two samples in this study (Table 4). Monte Carlo calculations terminate when a specific number of solutions (usually 300) exceed the 0.05 level of significance. Unlike HeFTy, a controlled random search (CRS; Price, 1977; Willett, 1997) learning algorithm is then used to try and improve the initial 0.05 level solution set to a higher significance level (typically 0.5 level). Calculations proceed iteratively until either all members of the solution set exceed the new significance threshold or no further improvements can be made.
Table 4Model boundary conditions and constraints for two AFT samples.
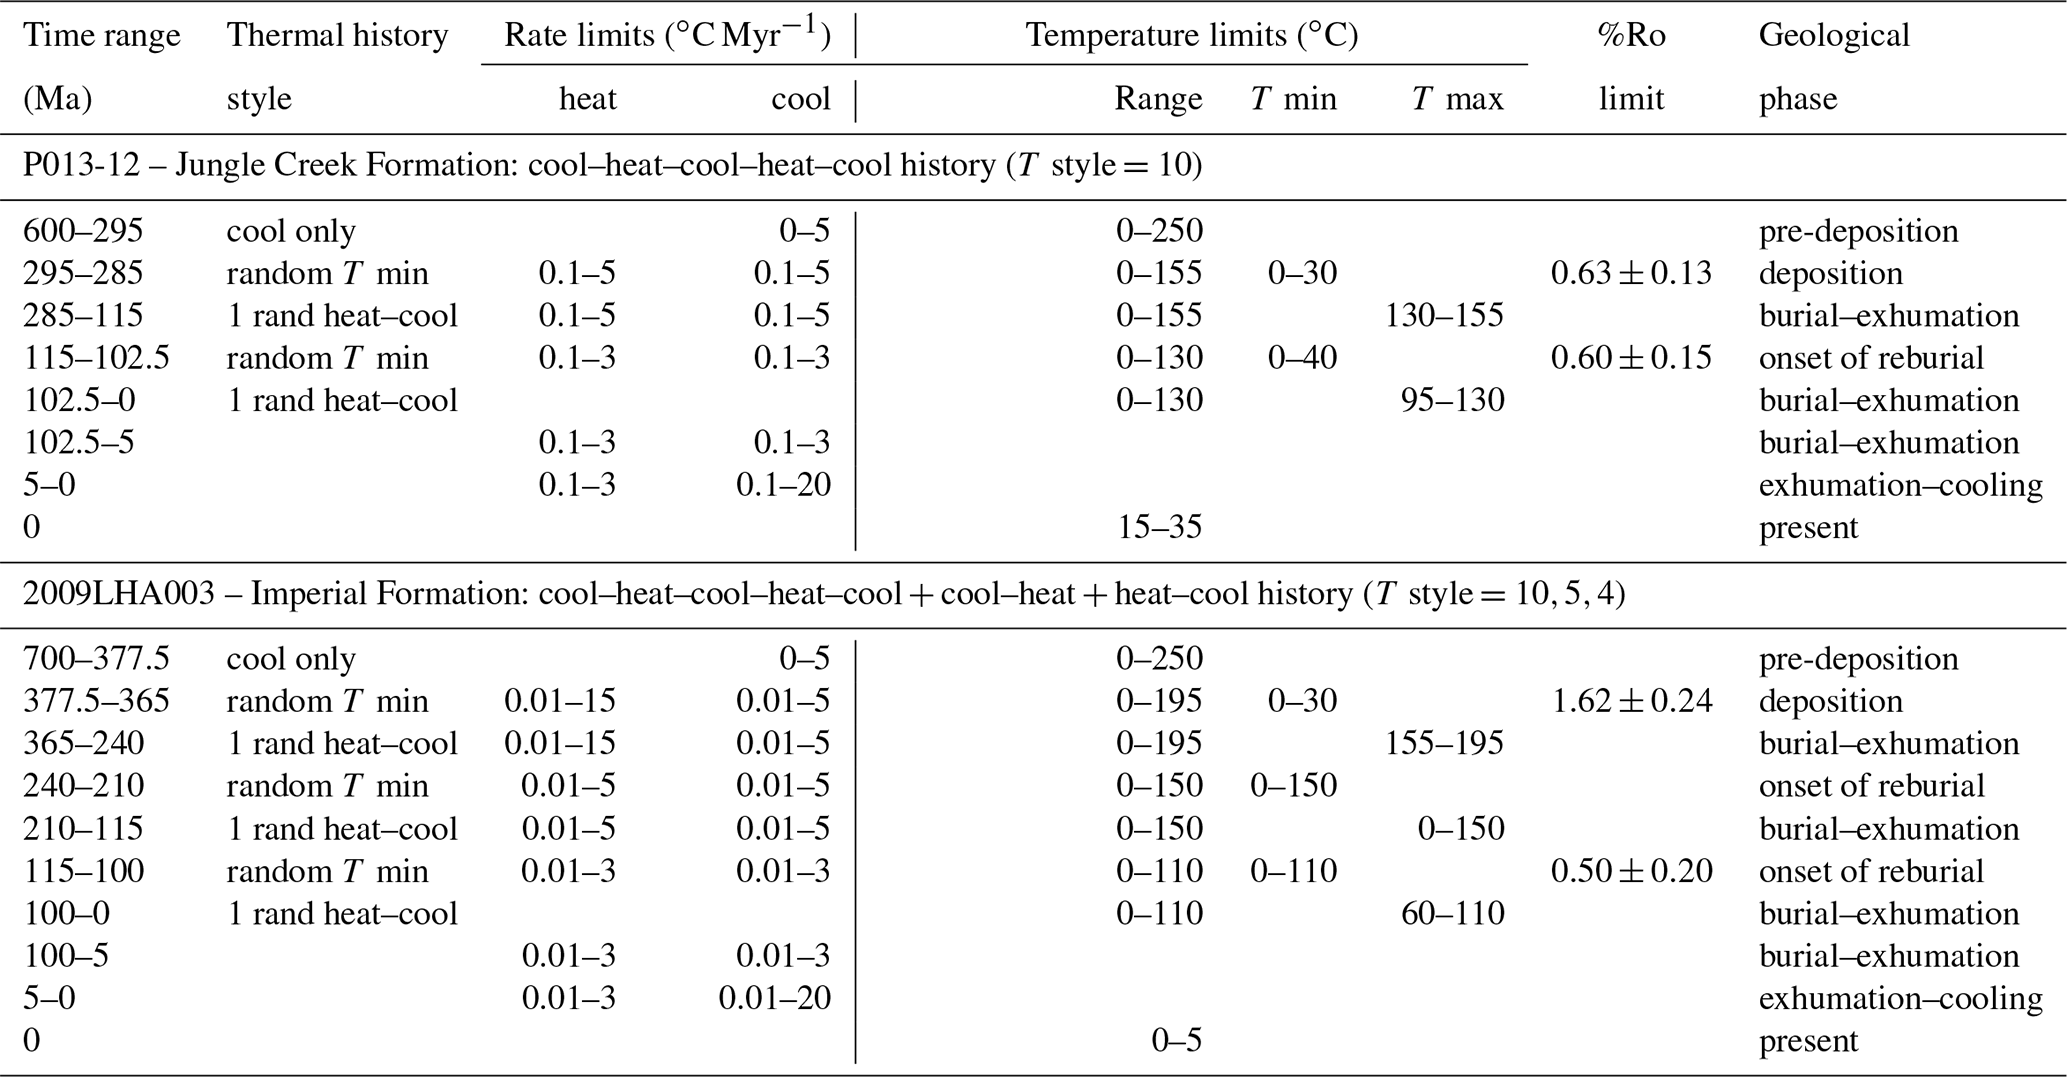
Table 4 shows the boundary conditions used to model the Permian (P013-12) and Devonian (2009LHA003) samples. The Permian sample was modelled with an initial pre-depositional cooling event followed by two cycles of random heating and cooling (T style 10). The Devonian sample has an extra cycle of heating and cooling that was accommodated seamlessly by adding an additional random cooling–heating (T style 5) and heating–cooling (T style 4) cycle. Each model starts at a high temperature (245–250 ∘C) and cools to surface temperatures (0–30 ∘C) within a time range for deposition that captures uncertainties in the stratigraphic age. The model uses static and dynamic temperature limits. Static limits define the entire model search space, whereas dynamic limits are applied only at model inflection points to focus calculations into favourable regions of solution space to improve model efficiency. The static temperature limits (column 5, Table 4) were estimated based on maximum temperatures inferred from organic maturity data, the general degree of annealing among the different kinetic populations, and regional maturity and stratigraphic trends. Dynamic limits are given for thermal minimum (column 6, Table 4) and thermal maximum (column 7, Table 4) inflection points, and they are set equal to the static temperature limits where geological constraints are lacking. Heating and cooling rate limits are estimated based on regional geological information and model sensitivity tests. Vitrinite reflectance (%Ro) values are calculated for the entire post-depositional thermal history and for the last phase of heating and cooling using the basin%Ro model (Nielsen et al., 2017), which provides better fits to observed maturity profiles in northern Canada than the Sweeney and Burnham (1990) EASY%Ro model (e.g., Issler et al., 2016; Powell et al., 2020). Further details on model boundary conditions and supporting geological data are the subject of a future paper that deals with the regional thermal history and its geological implications.
Model sensitivity runs were undertaken to determine the style of thermal history and the suite of kinetic parameters that were needed to obtain model solutions that closely fit the AFT data. Table 2 lists the model eCl values that yield a set of 300 solutions at the 0.5 significance level. For the Permian sample, the average eCl values of 0.05 and 0.24 apfu could be used for kinetic populations one and two, respectively, but the eCl value for population three had to be increased from the average of 0.37 to 0.55 apfu to obtain solutions that closely fit all three populations. For the Devonian sample, the average eCl value (0.03 apfu) was used for population one, but the model eCl value had to be increased substantially from the average value of 0.20 to 0.50 apfu for population two. A three-cycle heating model was attempted for the Permian sample but it cannot be constrained by the data because the first thermal peak had a lower temperature than the second peak. Models using only two cycles of heating (Paleozoic–Mesozoic burial and erosion and Late Cretaceous–Cenozoic burial and erosion) were unsuccessful in finding solutions for the Devonian sample. Thin remnants (20–30 m) of Upper Triassic (Carnian–Norian) strata occur in isolated places in the northern part of the study region (Norris, 1981) suggesting a burial event of unknown significance. The three-cycle history was set up to allow for a reburial event starting in the upper Triassic – but it could occur anywhere between 0 and 150 ∘C (Table 4; i.e., no requirement to cool to near-surface temperatures prior to reburial). If a Triassic–Early Cretaceous burial and exhumation event is not required by the data, then only a minor inflection should appear on the thermal history over this time interval.
4.1 AFTINV
Figures 6 and 7 show AFTINV model results for the Permian and Devonian samples, respectively. The upper panels of both figures show acceptable solution space (≥0.05 significance level) defined by the light grey Monte Carlo solutions. The dark grey curves represent the “good” 0.5 level solutions obtained from updating the light grey solutions using the CRS algorithm. These results indicate that the different kinetic populations are mutually compatible and can be modelled with the same thermal history. The blue curve is the exponential mean of the 300 total 0.5 level solutions and it provides an excellent-fitting smoothed thermal history. The green curve is the closest-fitting minimum objective function CRS solution. The initial temperature search space (yellow shaded area) was estimated using regional geological information and model sensitivity analyses. It is larger than the acceptable solution space but small enough to limit the time spent interrogating unproductive regions of solution space. The initial temperature limits collapse to the bounds enveloping the acceptable thermal solutions when the model converges. The lower panels in Figs. 6 and 7 display the model and c-axis-projected measured track length distributions (coloured histograms) and model retention age distributions for each kinetic population. Model track length distributions are shown for the exponential mean (blue) and minimum objective function (green) solutions along with the regions encompassing track length distributions for the 0.05 (light grey) and 0.5 (dark grey) level solutions. Model retention ages represent a theoretical age for the oldest (shortest) track in each population (assumed to be ∼2 µm based on the shortest track ever measured; Ketcham et al., 2000) and provide an uppermost temperature and time limit for track survival. However, very short tracks are rarely observed and maximum temperatures constrained by the AFT data may be significantly lower.
Two cycles of heating and cooling were used to model the post-depositional thermal history of the Permian sample based on preserved stratigraphy in the well (Fig. 6). A broad range of solutions is permitted at the 0.05 significance level due to the generally low number of track lengths for this sample. Most of the lengths are in population two and therefore it has the strongest influence on the thermal history. The CRS algorithm defines a much narrower region of “good” solution space at the 0.5 level, but it allows for different modes. Most of the peaks for the first heating cycle occur between 160 and 180 Ma, but two higher temperature peaks at 192 Ma are associated with higher older temperature peaks at 70 Ma in the second heating cycle. The 70 Ma peaks are generated by higher Cretaceous heating rates that are permitted by the sparse length data for population one. Retention ages for the exponential mean solution are plotted on the thermal history for each kinetic population (coloured stars). Modelling suggests that population three has retained tracks >2 µm from the initial phase of cooling at very high temperatures after approximately 540 Ma, whereas population two records pre-depositional cooling at lower temperatures after 420 Ma. Any record of pre-depositional cooling is lost for population one due to thermal resetting by the first heating event; it records cooling after 140 Ma and therefore provides no constraint on the magnitude and time of thermal peak one, but it is sensitive to the second heating event. Population 2 is most sensitive to thermal peak one, and it provides some constraint on the second thermal event. Joint modelling of all kinetic populations improves model resolution. The dashed line (upper panel, Fig. 6) coincides with a change to a steady cooling rate (∼1.2 ∘C Myr−1) below 185 ∘C at ∼440 Ma and marks the upper temperature limit that can be resolved from modelling the AFT data. The most robust result is the predicted >30 ∘C difference in burial temperatures between the two heating cycles. The highly retentive population three has little influence on the post-depositional thermal history. Effective Cl values had to be adjusted higher (than calculated) for population three in order to obtain good solutions that improved the model fit to population three AFT data without significantly changing model temperatures.
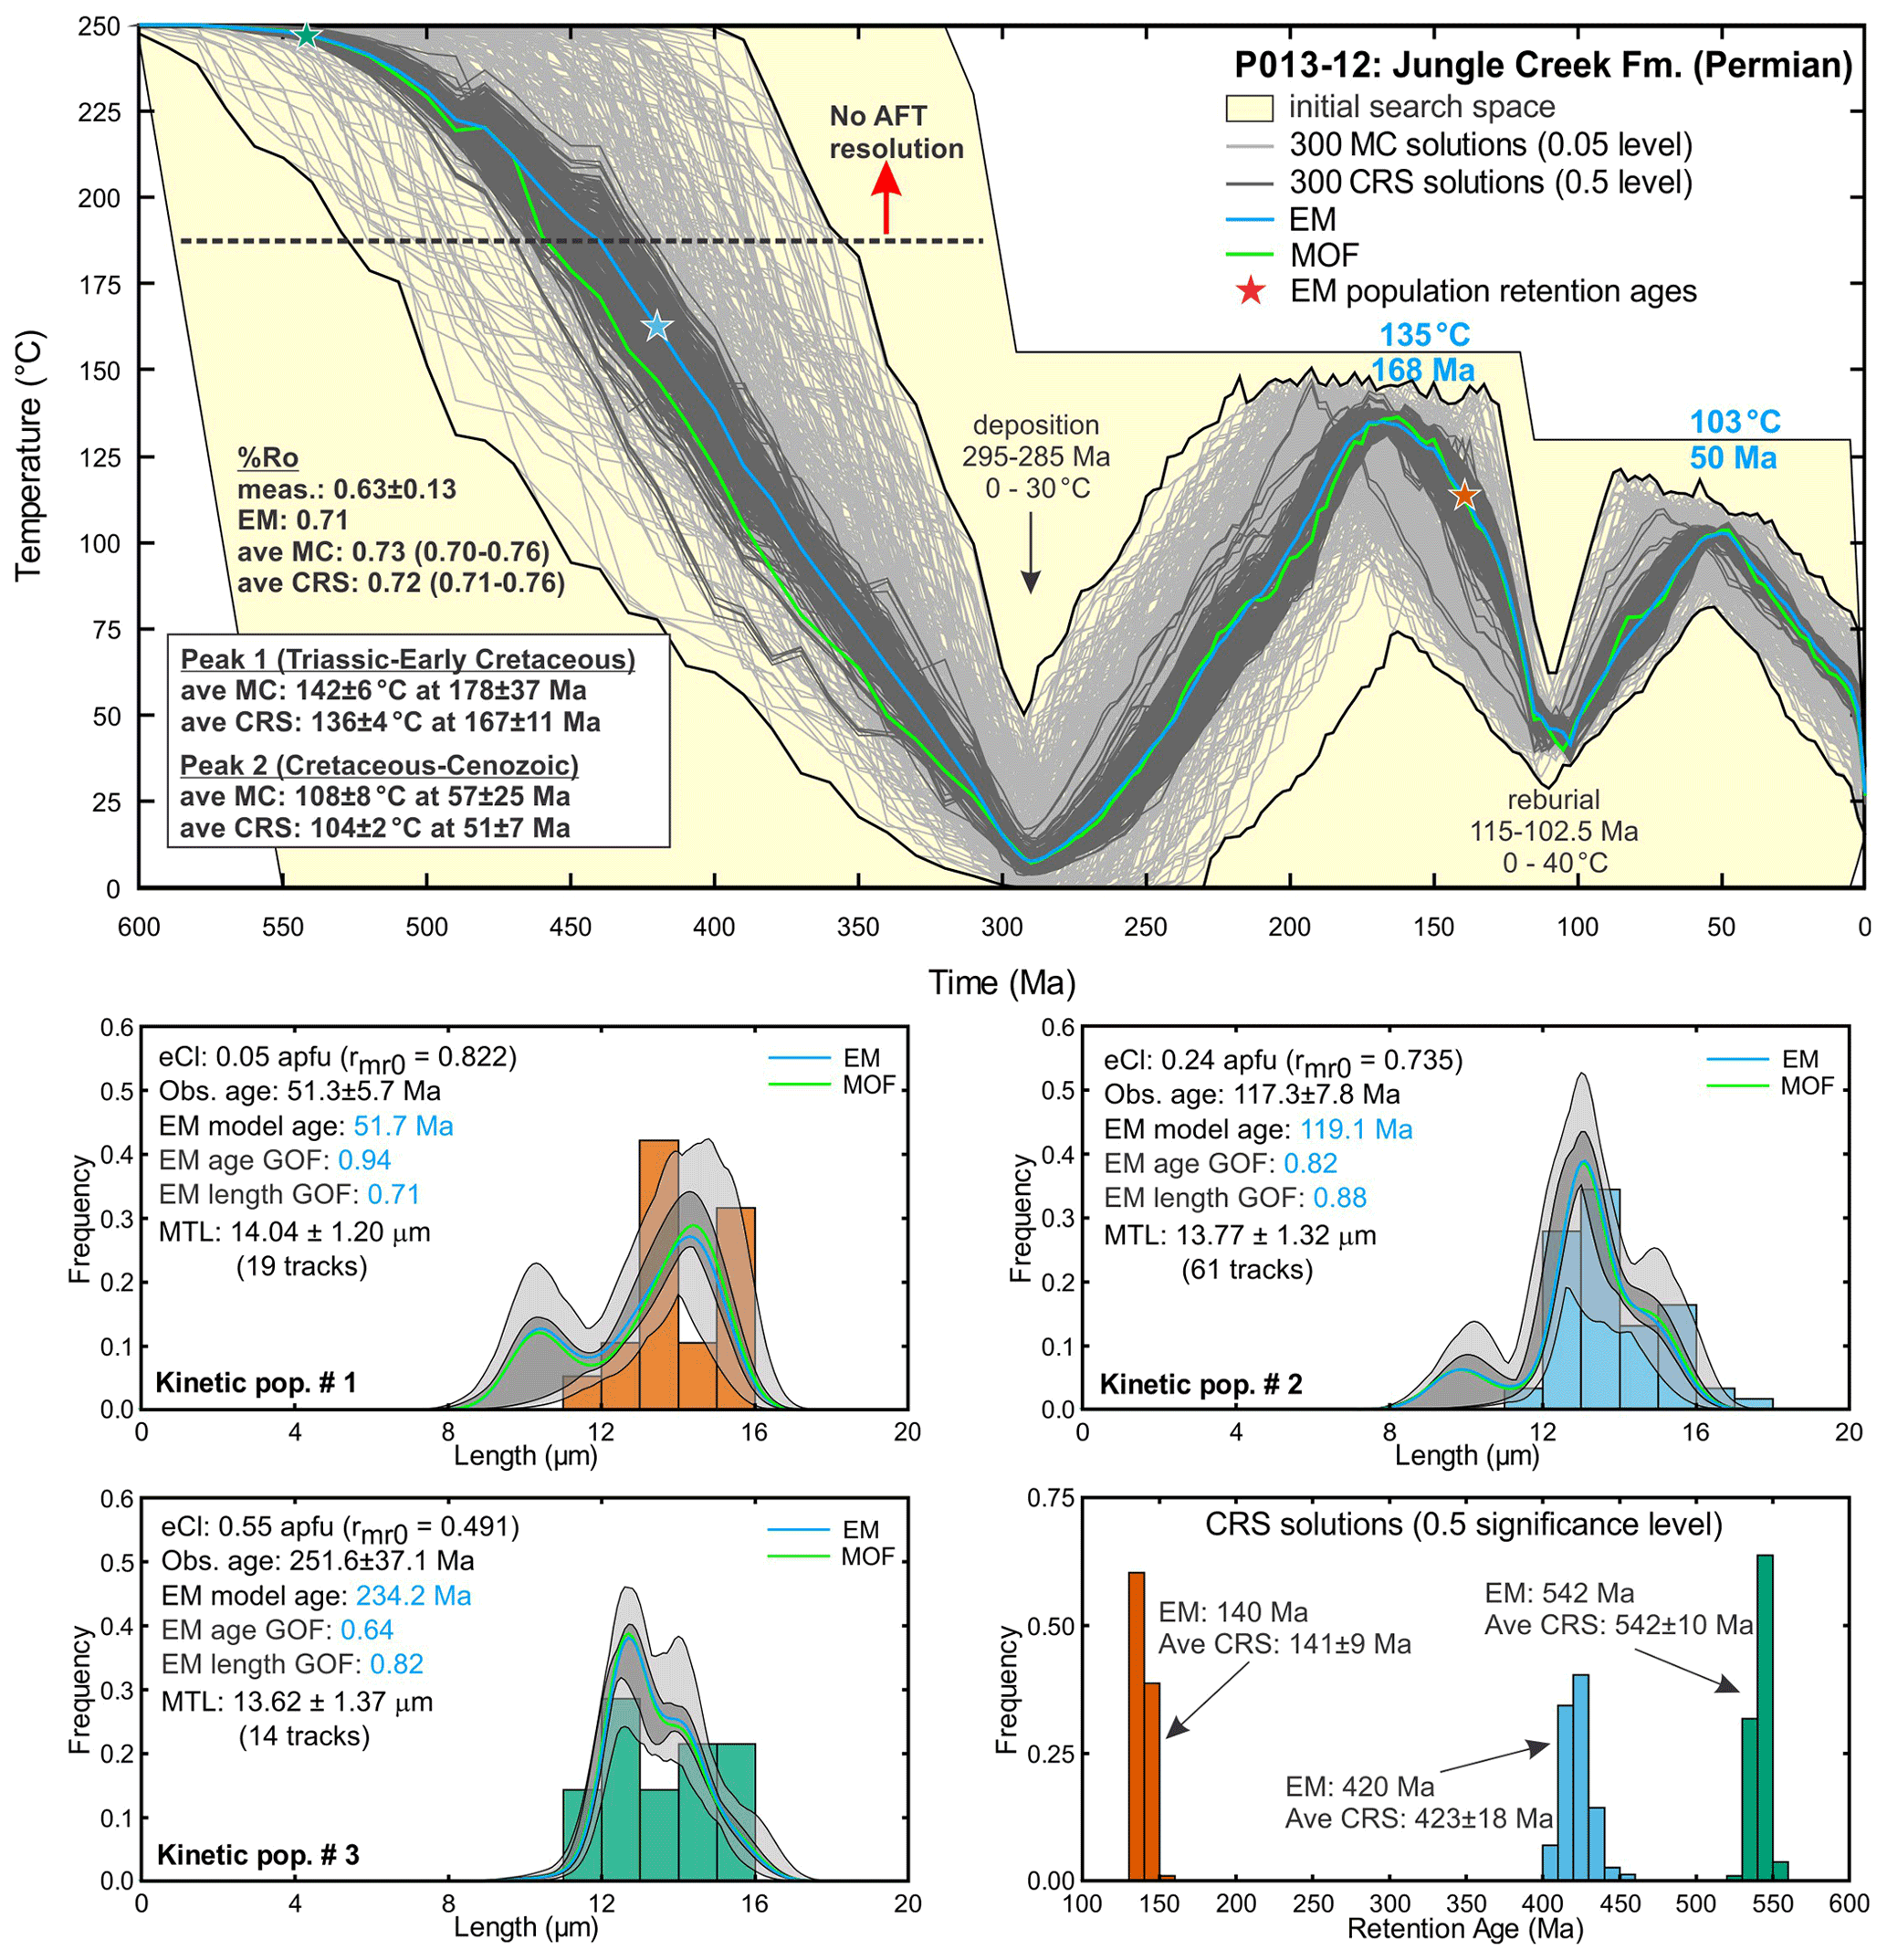
Figure 6The upper panel shows AFTINV thermal-history results for the Permian sample. Light grey lines are statistically acceptable Monte Carlo solutions (≥0.05 significance level), and dark grey lines are good solutions (≥0.5 level). The black curves bounding model solutions are not valid solutions. The blue curve is the exponential mean (EM) of the 300 good solutions, and the green curve is the closest fitting minimum objective function (MOF) solution. The lower panels show model and observed track length distributions and the distribution of model retention ages (age of oldest track) for the different kinetic populations. The goodness of fit (GOF) probability for the age and length data is given for the exponential mean solution. Uncertainties in average retention age, average peak temperature, and average peak time are 2 standard deviations.
The Devonian outcrop sample is of much better quality in terms of data abundance, and although it has only two kinetic populations, it constrains a more complicated and well-resolved thermal history with three cycles of heating and cooling of decreasing intensity with time (Fig. 7). The first phase of rapid Paleozoic heating is consistent with regional organic maturity and sedimentological evidence for rapid burial. Results show substantial cooling (>100 ∘C) prior to reheating starting in the Triassic. This scenario is permitted but not forced by the model, which only requires that an inflection point occur somewhere within the initial temperature envelope over the interval 240–210 Ma. The third heating–cooling cycle is consistent with the widespread occurrence of Cretaceous strata of generally low organic maturity across the region (Link and Bustin, 1989; Reyes et al., 2013). The three-cycle model works so well that the initial set of Monte Carlo solutions found 13 total 0.5 level solutions (irregular dark grey curves), and the CRS algorithm had no problem updating the remaining solutions to the 0.5 level. Although a Triassic to Early Cretaceous burial and exhumation event was not expected for the area, newer results from the Permian sample to the west (Fig. 6) indicate that heating was sufficient at this time to strongly anneal AFT parameters and overprint Paleozoic thermal maturity at that location, providing further evidence that high-quality multikinetic data can preserve information on multiple heating events. The very old retention ages (generally >500 Ma; Fig. 7) and high annealing temperature for population two suggest that it is most sensitive to the pre-depositional cooling history and the first high-temperature peak. Most of the retention ages for population one are older than, or similar to, the second thermal peak, indicating that it has been strongly annealed, retains no information from the first heating event, and is most sensitive to the second thermal event. The larger uncertainty on the timing of the third lower-temperature peak is consistent with the lower level of AFT annealing. Model results suggest that the AFT data can resolve the thermal history below 175 ∘C after ∼480 Ma (dashed line in upper panel, Fig. 7).
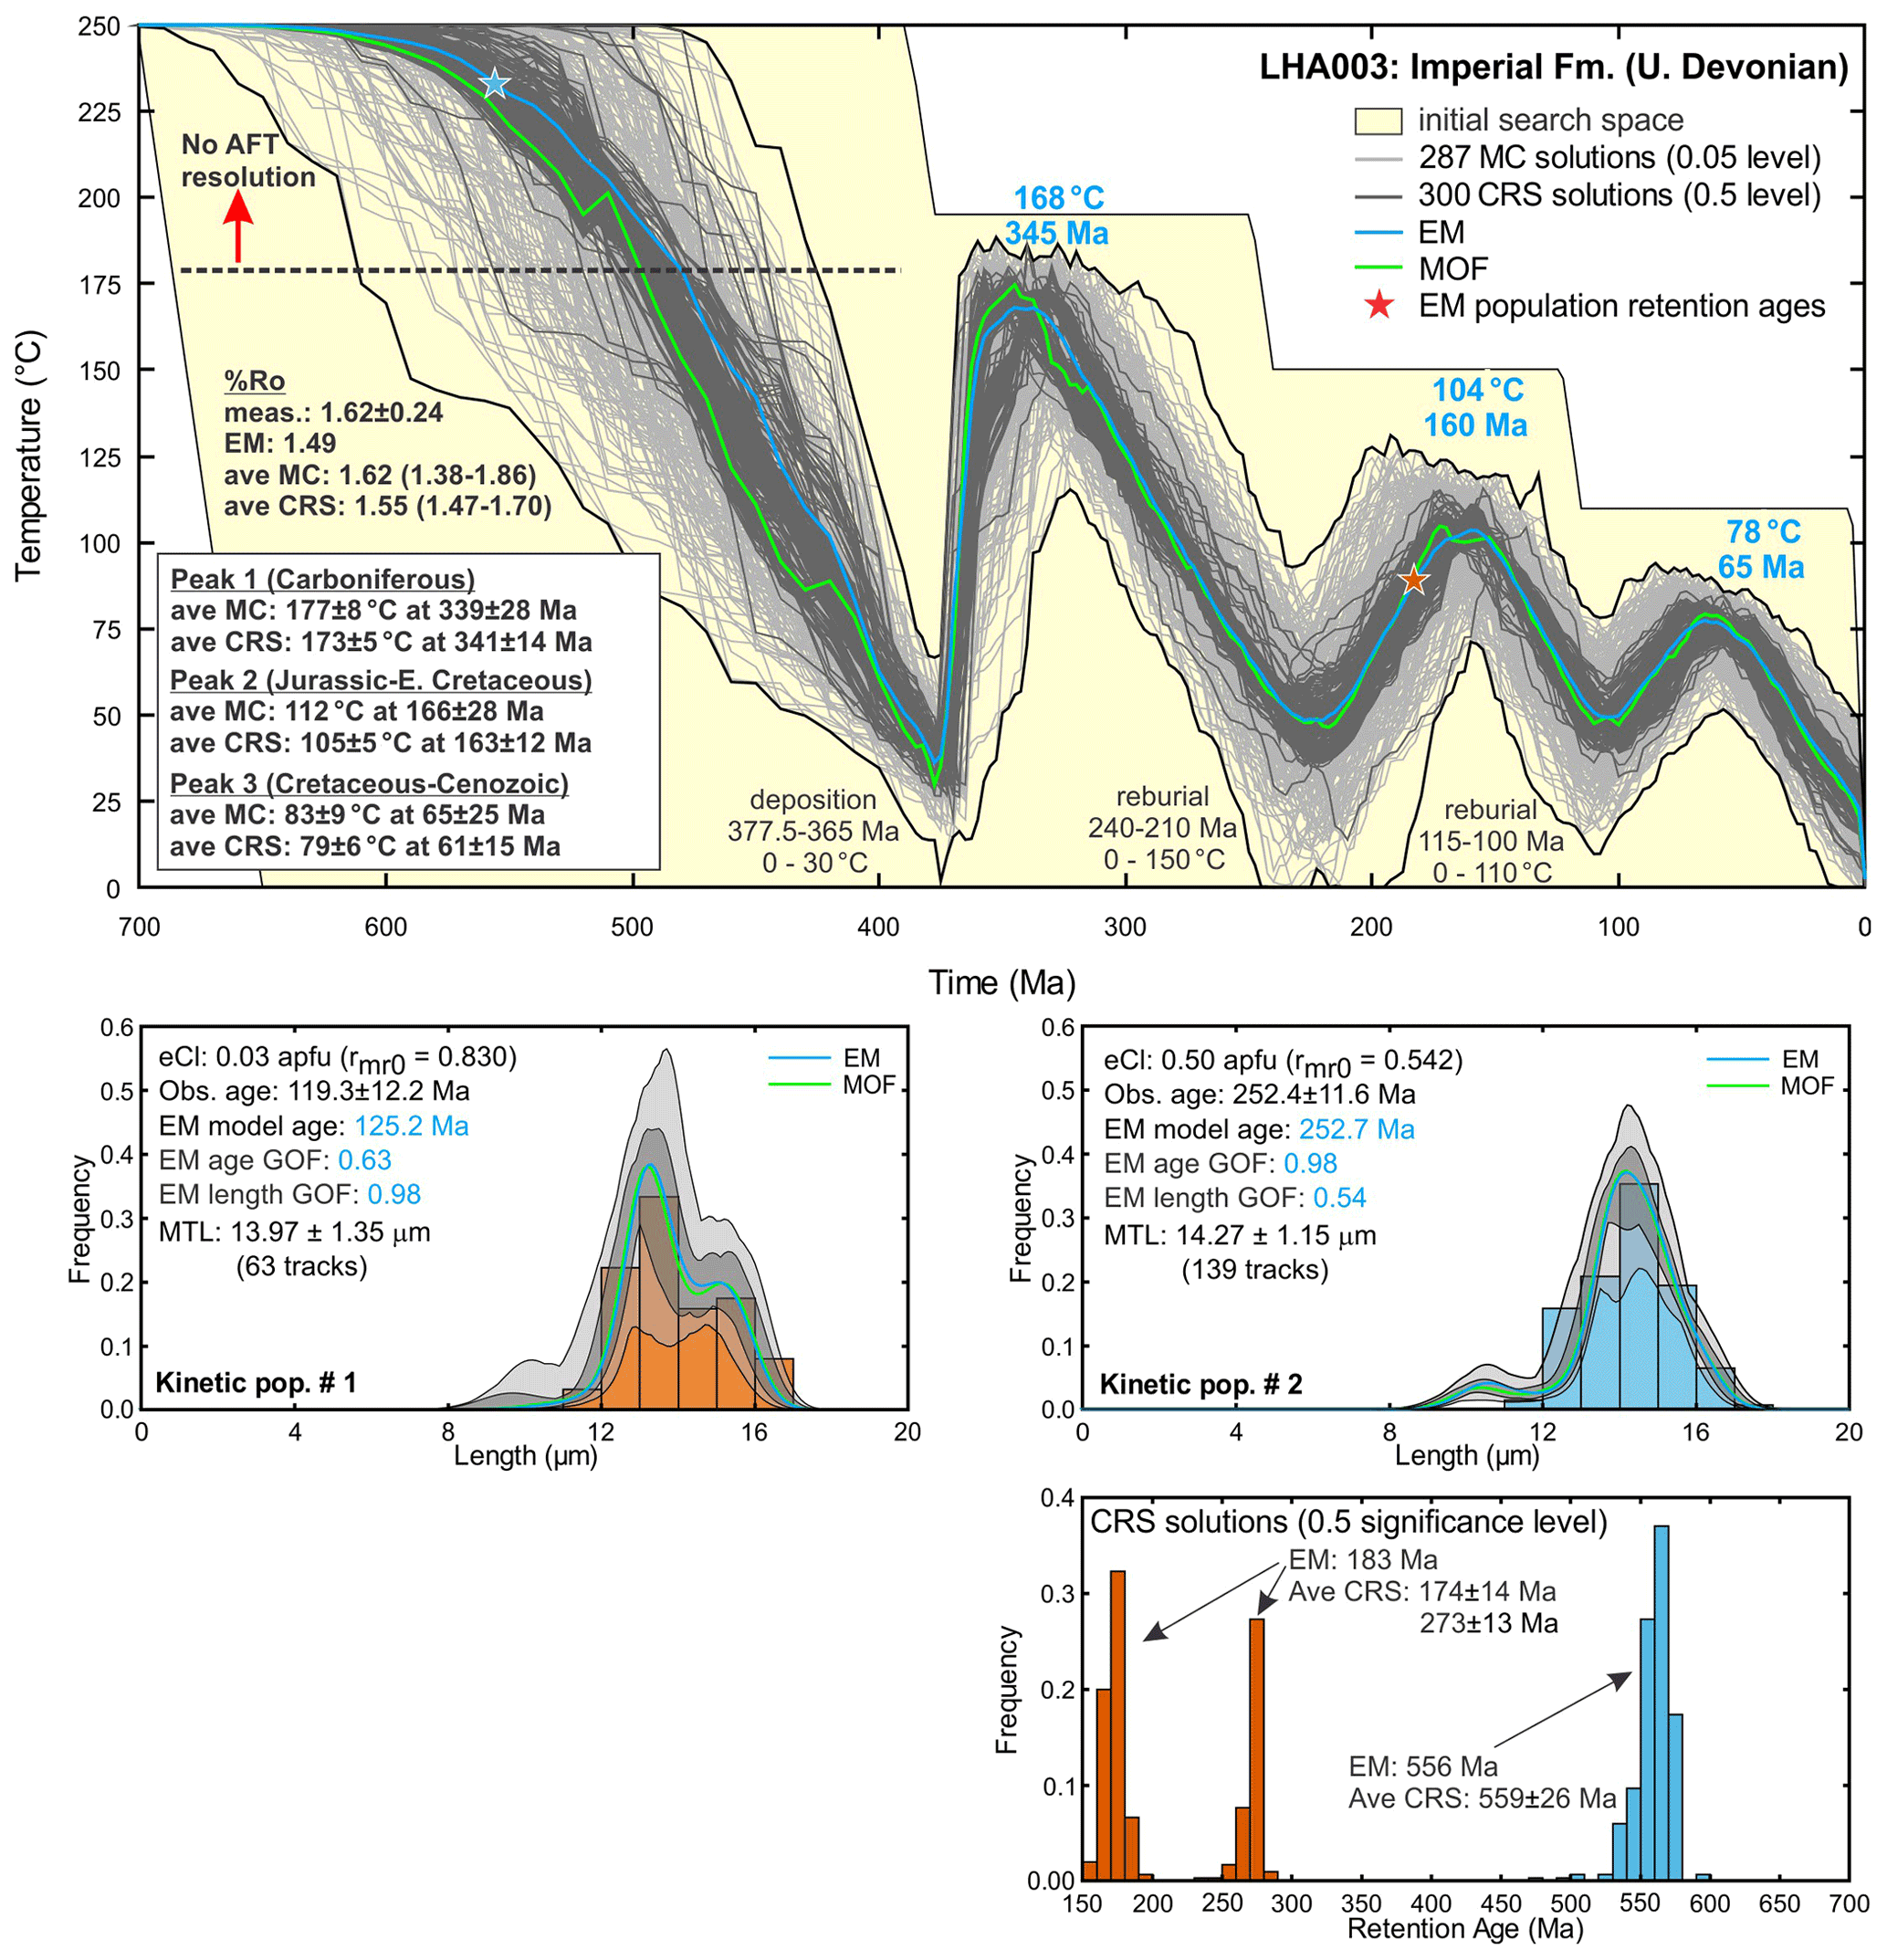
Figure 7The upper panel shows AFTINV thermal-history results for the Devonian sample. Light grey lines are statistically acceptable Monte Carlo solutions (≥0.05 significance level), and dark grey lines are good solutions (≥0.5 level). The black curves bounding model solutions are not valid solutions. The blue curve is the exponential mean (EM) of the 300 good solutions, and the green curve is the closest fitting minimum objective function (MOF) solution. The lower panels show model and observed track length distributions and the distribution of model retention ages (age of oldest track) for the different kinetic populations. The goodness of fit (GOF) probability for the age and length data is given for the exponential mean solution. Uncertainties in average retention age, average peak temperature, and average peak time are 2 standard deviations.
The P013-12 and LHA003 samples were modelled assuming a common inherited, pre-depositional history for each kinetic population in order to better resolve the post-depositional thermal history by taking advantage of relative annealing. We cannot determine whether the kinetic populations within each sample have a shared inheritance because this information has been degraded by thermal annealing of the less track-retentive populations. For LHA003, the pre-depositional thermal record for the lower-retentivity population one was erased completely by thermal annealing, and therefore pre-depositional cooling is only constrained by population two. For P013-12, pre-depositional thermal history has been erased for population one, and population two experienced significant post-depositional annealing. Pre-depositional cooling is dominated by population three, which can easily overlap with any residual cooling record for population two. Overall, the post-depositional thermal histories are not very sensitive to the pre-depositional cooling for these samples.
4.2 QTQt
Model results from the Bayesian QTQt software (Gallagher, 2012) are shown for comparison with model output from AFTINV. General model setup was the same as the approach discussed in McDannell and Issler (2021), except here the same geologic constraints and %Ro data that were used in the AFTINV models were used in QTQt as well. The differences between the QTQt representative output models (i.e., maximum likelihood (ML), maximum posterior (MP), maximum mode (MM), and expected (EX); see Gallagher and Ketcham, 2020) are discussed in McDannell and Issler (2021) and in Fig. 8. We primarily discuss the ML model since it provides the best fit to the observed data. We prevented more complex models from being accepted during simulations unless they provided a better fit to the data; therefore, unnecessary complexity was prohibited and the ML and MP models often end up being similar, with LHA003 being an exception. The overall boundary conditions and heating-style assumptions applied to the AFTINV inversions were absent for QTQt modelling because the latter relies on the data to directly inform the level of model complexity (i.e., t–T history style). We fixed the eCl kinetic parameter for the well-determined kinetic population most similar to fluorapatite, which was the best constrained group in the annealing experiments of Carlson et al. (1999). The remaining kinetic populations were allowed to vary within uncertainty and underwent resampling during QTQt inversions.
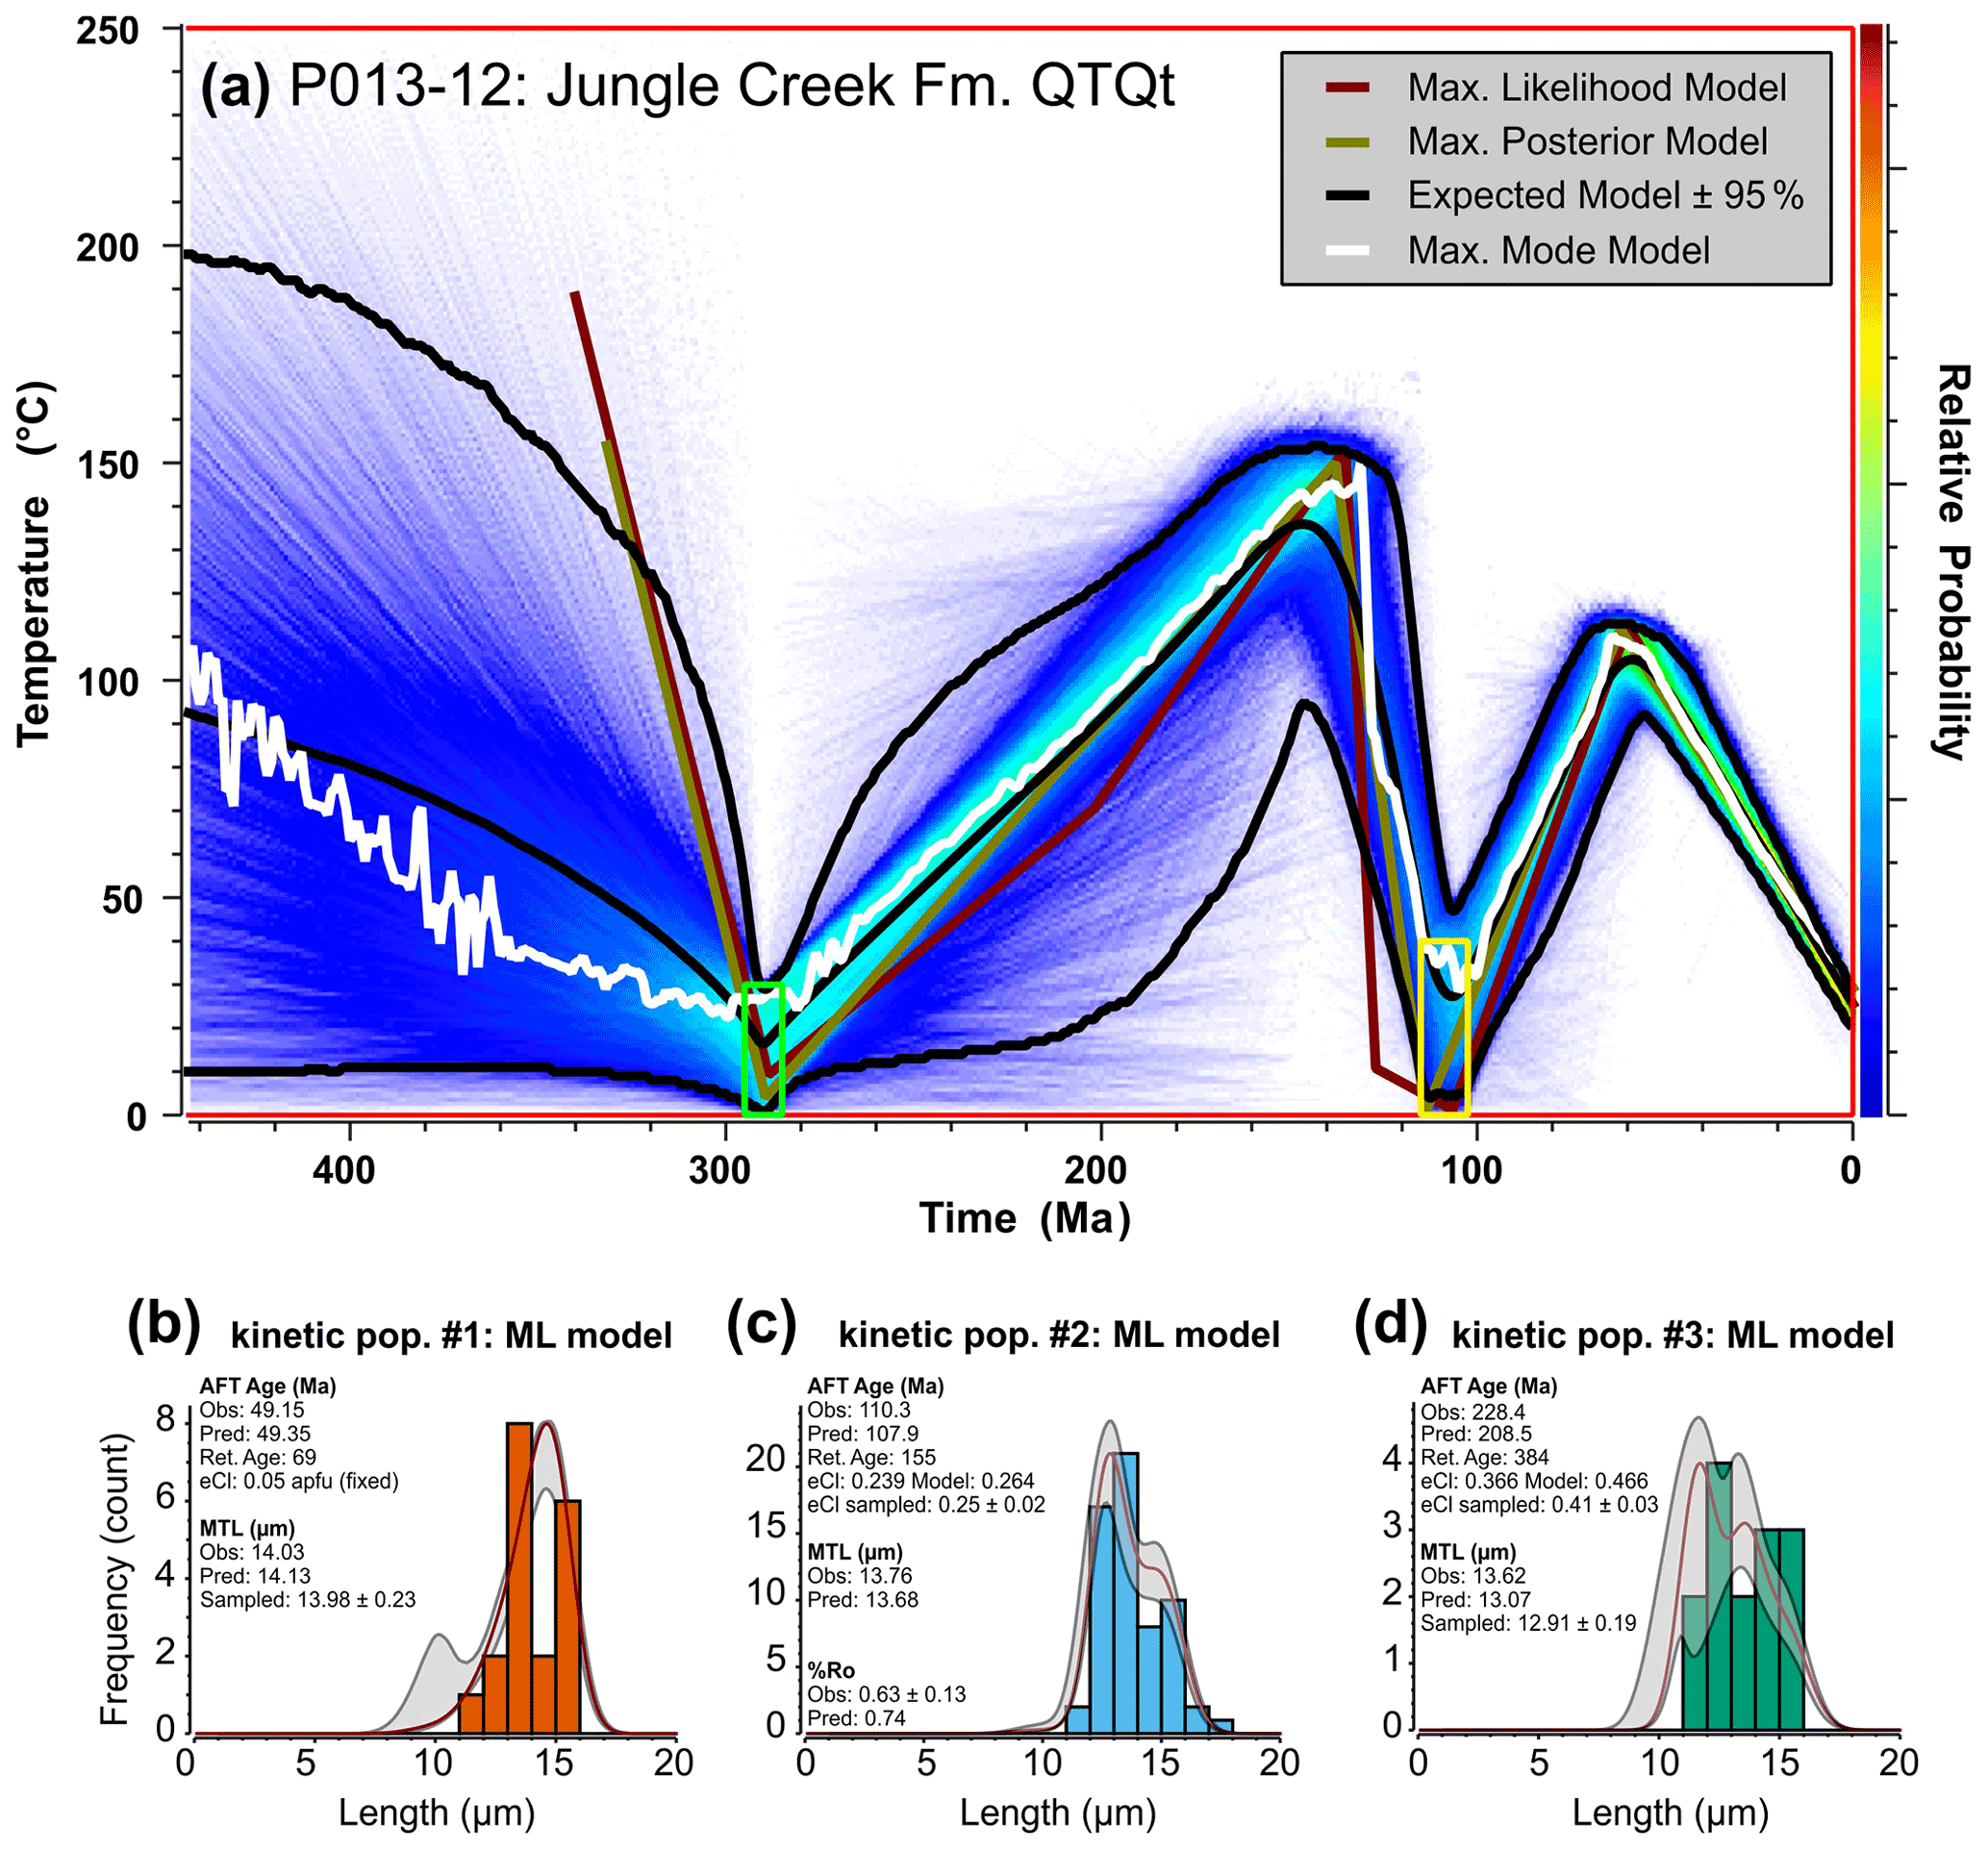
Figure 8QTQt model results for Permian detrital AFT sample P013-12 (Jungle Creek Fm.). (a) Time–temperature plot of the histories retained post burn-in coloured according to relative probability, with warmer colours denoting higher probability. Individual models include the maximum likelihood (highest likelihood and best fit; red curve), maximum posterior (preferred Bayesian model with the simplest, balancing fit with complexity; gold curve), maximum mode (peak of the marginal distribution at 1 Myr intervals; white curve), expected (weighted mean of the marginal distribution ±95 % credible interval; black curves). The latter two models are summaries of the posterior distribution and not directly sampled during the inversion. (b) Maximum likelihood fit to the track length distribution and predictions for AFT age and MTL for population one using a fixed eCl value of 0.05 apfu. (c) Maximum likelihood fit to the track length distribution and predictions for AFT age and MTL for population two, allowing for resampling of the calculated eCl value. (d) Maximum likelihood fit to the track length distribution and predictions for AFT age and MTL for population three, allowing for resampling of the calculated eCl value. The green box is the depositional age of 290±5 Ma (15±15 ∘C). The yellow box is the geologic constraint at 108.75±6.25 Ma (20±20 ∘C). Note that all populations utilize the central AFT age in QTQt, whereas the pooled age is used in AFTINV for samples with <10 % age dispersion. The model setup is as follows: 500 000 iterations (burn-in) and 500 000 iterations (post burn-in; shown). The prior model space is 300±300 Ma and 125±125 ∘C. The modern surface temperature is 25±10 ∘C, and the maximum allowed is 20 ∘C Myr−1. Proposal moves were rejected if proposed outside of the prior, and more complex models were rejected for equivalent likelihood. See Sect. 4.2 for further discussion.
The history for Permian sample P013-12 exhibits a two-pulse heating history in general agreement with the AFTINV results. Maximum temperatures of ∼150 ∘C were achieved at ca. 135 Ma, followed by a second heating event to ∼110 ∘C at ca. 60 Ma (Fig. 8). These temperatures are at the upper end of the range defined by the CRS solutions in Fig. 6 (132–147 ∘C between 150 and 195 Ma and 102–110 ∘C between 45 and 70 Ma) but the 95 % confidence region overlaps with the AFTINV results. The QTQt results for the Devonian Imperial Fm. sample are notable because preliminary AFTINV test simulations investigated the possibility of a two- or three-peak thermal history and the ability of the data to resolve the latter scenario within the regional geologic context of preserved Mesozoic outliers. Other than the depositional age of the Imperial Fm., a large constraint box was placed between 55±55 ∘C to allow for a potential thermal minimum of unknown magnitude at 107±10 Ma (the approximate depositional age of the overlying Cretaceous rocks). The QTQt results demonstrate that a three-peak history is the more likely scenario that provides the best fit to the AFT data (Fig. 9). The EX and ML models suggest the first thermal maximum is at ca. 300 Ma and ∼155–190 ∘C, the second peak is at ca. 155 Ma and ∼100–115 ∘C, and the third occurs near 60 Ma and 70–80 ∘C. QTQt predicts a younger time for the first thermal peak than the AFTINV CRS solutions (Fig. 7; ∼320–360 Ma), but the temperatures and times for the other peaks show good agreement and both models overlap in the 95 % confidence region. AFTINV uses larger eCl values and more closely fits the AFT parameters for the most retentive population in both samples.
Overall, the AFTINV and QTQt results are very similar, even with the subtle trade-offs between the different thermal minima and maxima inflection points and preferred model population kinetic parameters. Model results differ in detail for a number of reasons. Compared with QTQt, AFTINV uses more model points, constructs thermal histories differently, allows for manual fine tuning of kinetic parameters, and generates a much larger set of “acceptable” and “good” solutions. QTQt generally prefers simpler histories, and there is a trade-off between the number of time–temperature points and data fit. QTQt converts LA-ICP-MS AFT data to EDM AFT data and uses Ns and Ni count data rather than ages for modelling, whereas AFTINV models either EDM or LA-ICP-MS AFT data using central or pooled ages depending on χ2 and age dispersion statistics. This difference is most evident for sample P013-12 where QTQt uses younger observed population ages for model input than AFTINV (compare Figs. 6 and 8).
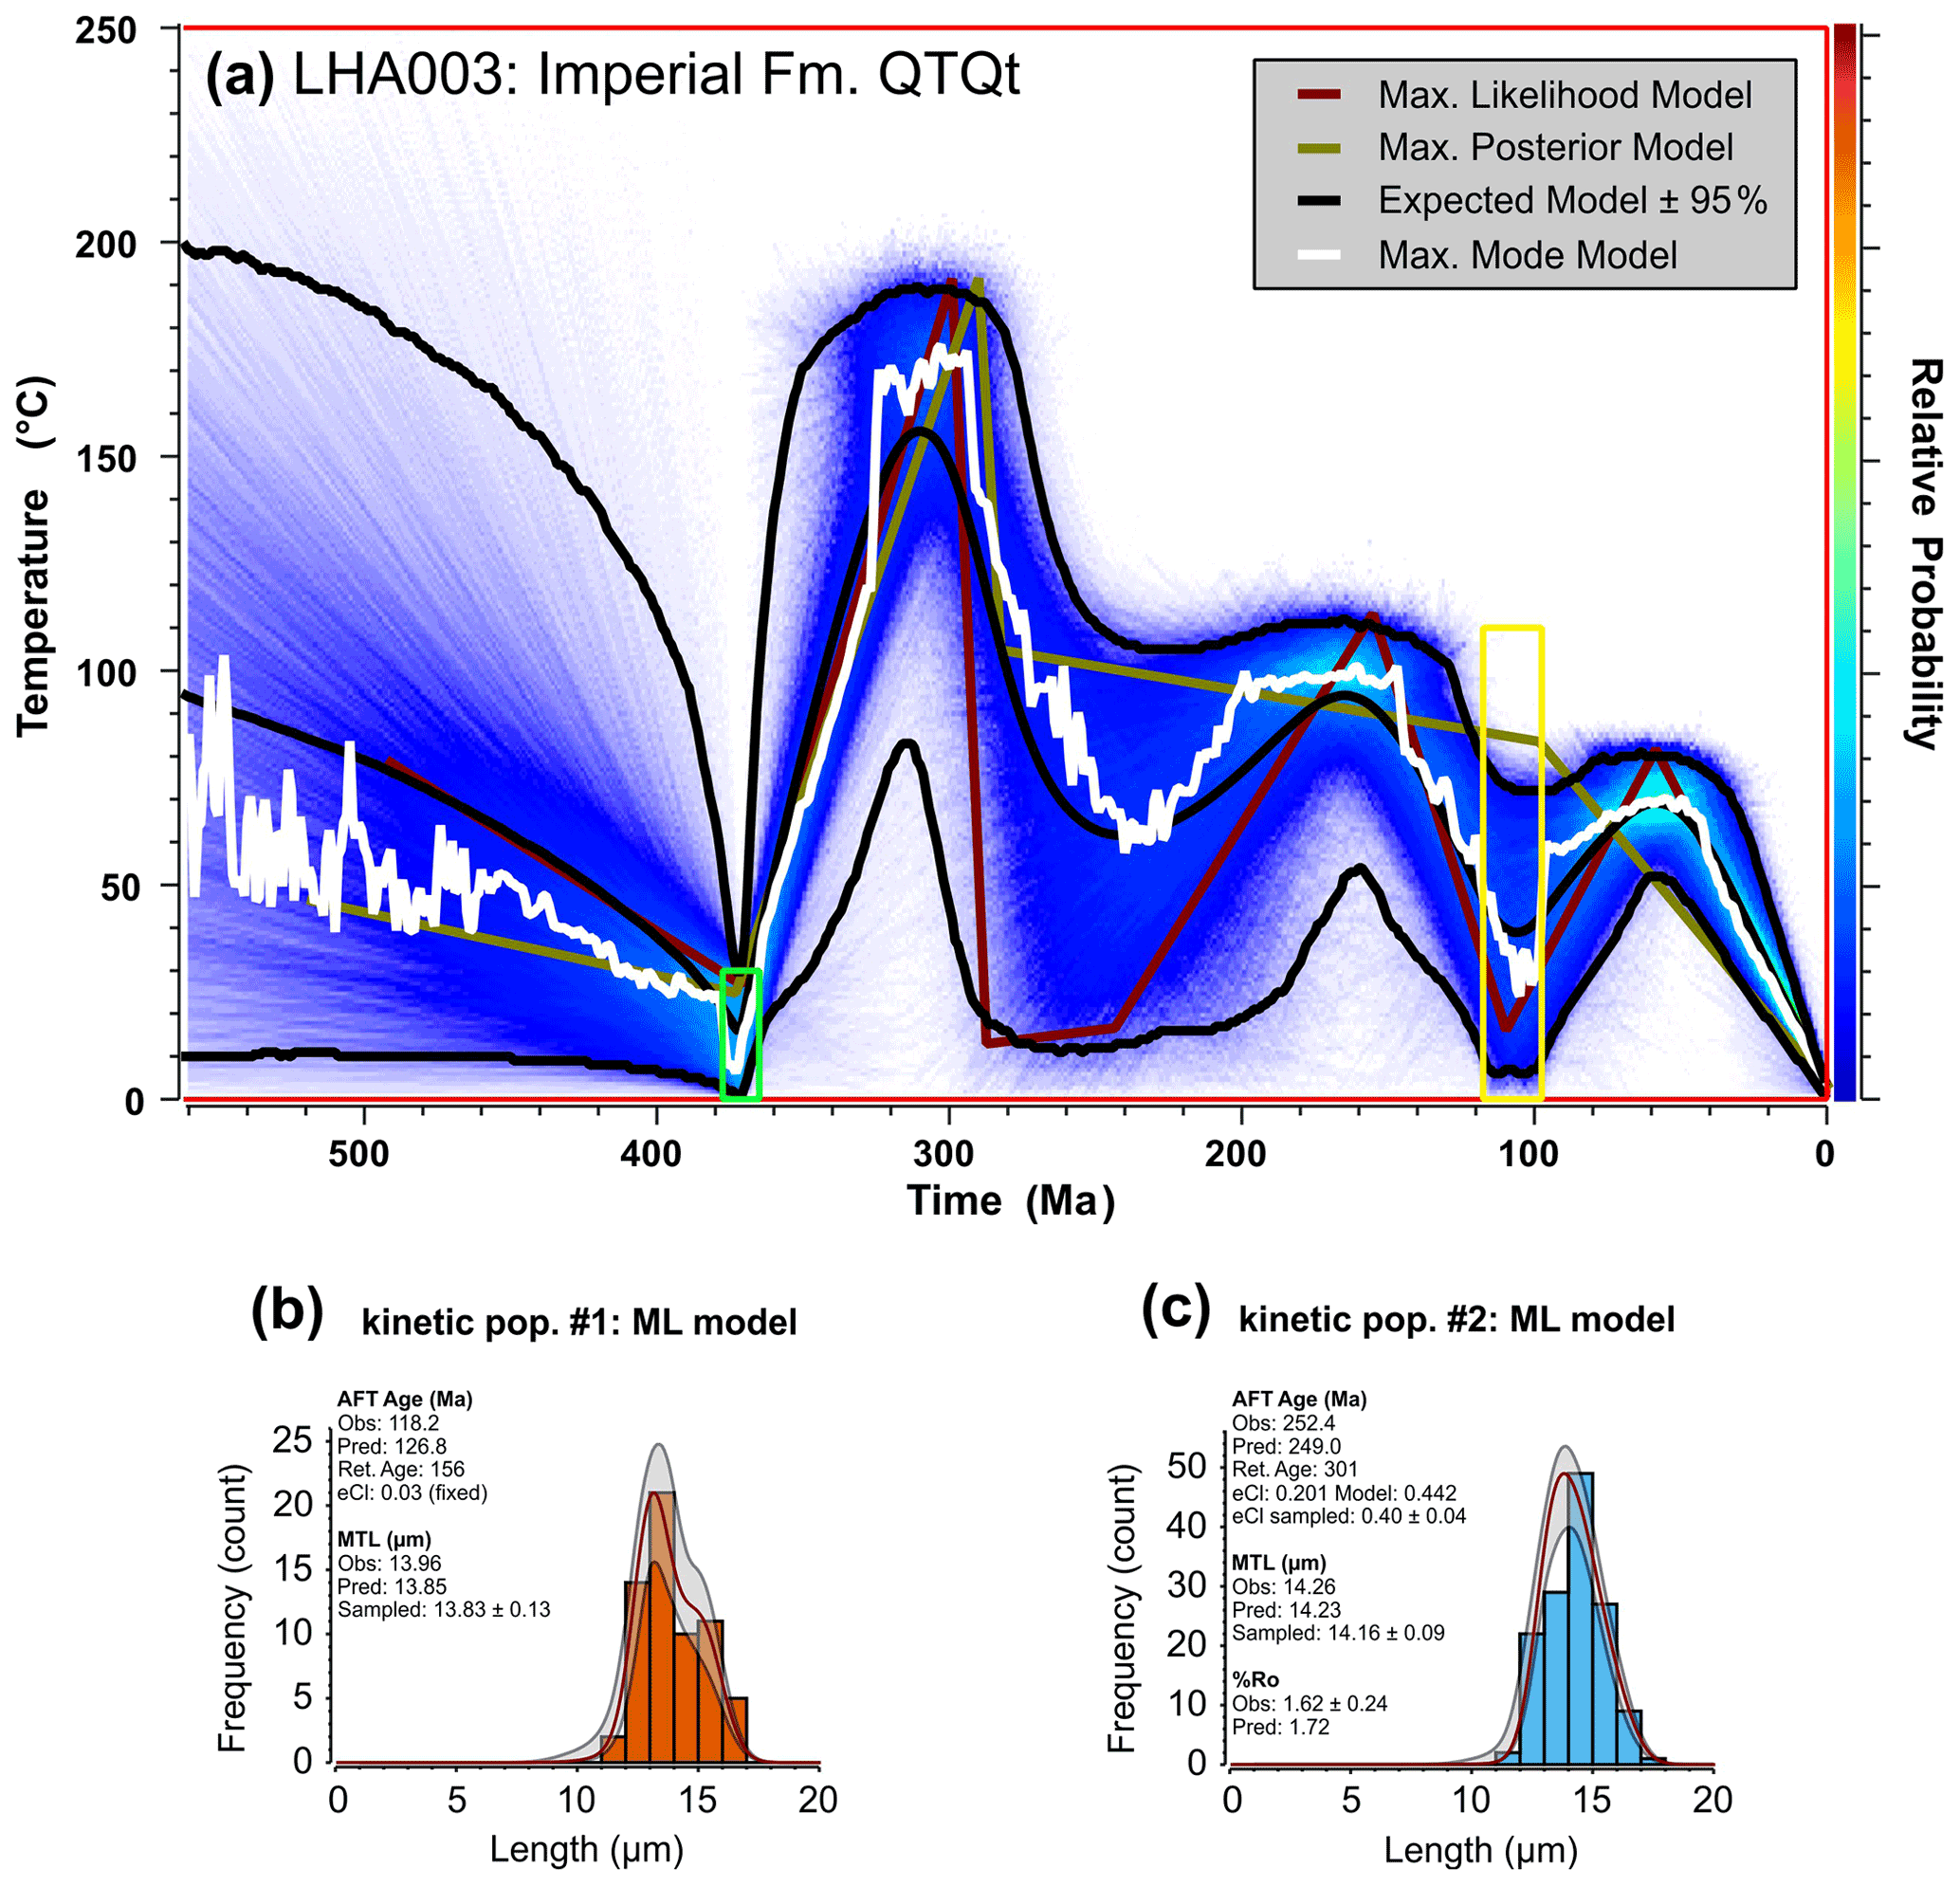
Figure 9QTQt model results for Devonian detrital AFT sample LHA003 (Imperial Fm.). (a) Time–temperature plot of the histories retained post burn-in coloured according to relative probability, with warmer colours denoting higher probability. Individual model descriptions are the same as those in Fig. 8. (b) Maximum likelihood fit to the track length distribution and predictions for AFT age and MTL for population one using a fixed eCl value of 0.03 apfu. (c) Maximum likelihood fit to the track length distribution and predictions for AFT age and MTL for population two, allowing for resampling of the calculated eCl value. Note that the MP model path differs from the ML model primarily because the large Cretaceous box allows a linear t–T segment between 280 and 100 Ma that is simpler but provides a poorer fit to the data. The green box is the depositional age of 371.25±6.25 Ma (15±15 ∘C). The yellow box is the geologic constraint at 107±10 Ma (55±55 ∘C). The model setup is as follows: 500 000 iterations (burn-in) and 500 000 iterations (post burn-in; shown). The prior model space is 350±350 Ma and 125±125 ∘C. The modern surface temperature is 2.5±2.5 ∘C, and the maximum allowed is 20 ∘C Myr−1. Proposal moves were rejected if proposed outside of the prior, and more complex models were rejected for equivalent likelihood.
Our multikinetic data interpretation and modelling techniques are designed to improve thermal-history resolution by exploiting compositionally controlled AFT annealing in samples with high age dispersion. Although numerous factors can contribute to age dispersion, we conclude that multikinetic annealing is the dominant cause of dispersion for Phanerozoic detrital samples from broad geographic areas of northern Canada based on published (Issler et al., 2018; Powell et al., 2018, 2020; Schneider and Issler, 2019) and unpublished (e.g., Fig. 2) results. This result should apply to other areas that have experienced similar amounts of burial and exhumation, and therefore it is of global significance. The method is not restricted to sedimentary rocks and has been applied to Precambrian basement and Proterozoic metasedimentary rocks as well (McDannell et al., 2019; McDannell et al., 2022). Heterogeneous apatite compositions are common for multikinetic detrital AFT samples, and therefore kinetic populations are much better resolved using the multi-elemental rmr0 parameter than the conventional kinetic parameters, Cl content, or Dpar. Although Cl content can be measured with sufficient accuracy and precision, it ignores the documented effects of cation and OH concentrations on track retentivity (e.g., Barbarand et al., 2003; Ketcham et al., 1999). Dpar is influenced by apatite composition, but replicate Dpar analyses show that it has low accuracy and precision (Fig. 2). The dearth of published multi-elemental data for AFT studies suggests that true multikinetic behaviour is underrepresented and underutilized in thermal-history analysis.
Well-characterized multikinetic samples may yield significantly more information than samples with a single AFT population. Therefore, more data and effort are required to interpret and model multikinetic samples, especially if they come from areas with complicated tectonic histories. Generally, 40 age and 100–200 track length measurements are sufficient for typical multikinetic samples with two or three populations, depending on how the data are distributed among the populations. Samples with more populations are less common and may require additional processing to obtain sufficient data to better resolve each population. We can use most or all of the AFT measurements because our interpretations are constrained by multiple parameters (elemental, U–Pb age, and Dpar data). In our experience, multikinetic detrital samples are best interpreted as having discrete kinetic populations that are defined by grouping age and length data using eCl values. The close correspondence between population ages inferred from kinetic parameters and peak ages derived from age mixture modelling supports the discrete model approach and provides compelling evidence that differential AFT annealing is controlling age populations. A discrete population model is the simplest interpretation that is consistent with our data and requires fewer assumptions than a more continuous model that subdivides the data into finer groups using pre-determined incremental kinetic parameter values. The latter model ignores the results of age mixture modelling and assumes that all measurements represent accurate kinetic parameter values over the full (kinetic) model range.
An important point is that successful modelling of multikinetic samples relies on the relative annealing behaviour that is implicit in the rmr0 model(s) of Ketcham et al. (1999, 2007). The basic assumption is that the same annealing mechanism applies to all apatite but that composition controls the temperature at which annealing occurs. This reasonable assumption was used successfully by Ketcham et al. (1999, 2007) to account for experimental annealing data for apatite of variable composition. We extend this approach to natural multikinetic AFT samples, and we are able to show that a common thermal history can reproduce AFT ages and lengths for the different kinetic populations. Ketcham et al. (1999) advised against general use of the Carlson et al. (1999) elemental-based multivariate equation for predicting rmr0 values for unknown apatites due to limited calibration data. We agree that this equation (or the equivalent equation in Ketcham et al., 2007) cannot predict rmr0 values accurately over the full range of apatite compositions that are likely to be encountered in nature, and accurate prediction for poorly represented apatite may well be an unattainable goal. However, this should not be a deterrent to using a method that has the potential to yield better results than conventional approaches, keeping in mind that the conventional parameters are no more accurate and involve the same annealing model. Our method pursues the logical consequences of the annealing experiments and shows that it is possible to use existing techniques in a novel way to improve how we apply thermochronology methods to complex geological problems.
The examples in this paper, other published studies (Powell et al., 2018, 2020; Schneider and Issler, 2019), and unpublished results (Fig. 2) suggest that kinetic parameters can be accurately determined for eCl values of approximately 0–0.25 apfu (rmr0 values of 0.73–0.84), a range that encompasses most of the data for the annealing experiments (Ketcham et al., 1999) and represents more typical apatite compositions. In our experience, the Carlson et al. (1999) multivariate equation overestimates track retentivity for endmember fluorapatite with rmr0 values >0.84 (requiring more negative eCl values than predicted) and underestimates retentivity for more exotic higher-retentivity apatite with rmr0 values <0.73 (requires higher eCl values than predicted). There is a dearth of experimental annealing data for rmr0 values <0.73, and thus the discrepancy between rmr0 values calculated using elemental data and those required for modelling is expected. A successful tactic we have used is to anchor model calculations on the kinetic population having the best calibrated annealing behaviour within the above kinetic parameter range. In this case, the model eCl value can be fixed at the average eCl value for the anchor population, and eCl values for atypical populations can be adjusted as required to obtain successful solutions that fit all populations. Issler et al. (2005; their Fig. 17) used this approach to investigate how the objective function value of the exponential mean solution changes as the kinetic parameter of one population is adjusted with respect to a population with a fixed kinetic value. It is possible to determine the optimal kinetic parameter offset that yields the lowest minimum object function value (closest fit). Optimization generally occurs in a kinetic parameter interval where changing the kinetics has little effect on the thermal-history solution (i.e., minor changes in annealing sensitivity) and yet model misfit is minimized. For software like QTQt, manual adjustment is not required because the model resamples kinetic parameters in an attempt to fit the data. In addition to the uncertainty with rmr0 calculations, high-retentivity populations can span a broad range of kinetic parameter space, and it can be difficult to obtain representative average eCl values for undersampled populations (Fig. 4) or for populations with unevenly distributed data that cluster at one end of the range (Fig. 5). For the Permian sample, average eCl values for kinetic populations one and two are within the range of more typical apatite and require no adjustment, whereas the population three eCl value had to be increased to obtain 300 CRS solutions that fit all three populations. For the Devonian sample, the eCl value was fixed for population one and the eCl value for population two was adjusted relative to population one until 300 solutions at the 0.5 significance level were obtained. Preliminary investigations of resampling the kinetic parameter for all populations within QTQt suggest that the “fluorapatite” population often remains relatively stationary, whereas “exotic” endmember kinetic populations are sampled outside of their calculated eCl range. This aligns with results from the annealing experiments and lends support for our AFTINV approach of relative kinetic adjustment during interpretation and modelling.
The allowable range for estimated eCl values for high-retentivity populations depends on the degree of annealing. At low levels of annealing, there is lower sensitivity to the thermal history, and a broad range of eCl values can yield good solutions. Numerous models were run for the Permian sample, but results are only presented for the model with an eCl value of 0.55 apfu for kinetic population three (Fig. 6) because it gave the highest number of solutions at the 0.5 significance level. Models with eCl values between 0.45 and 0.55 apfu also gave a significant number of 0.5 solutions. The effect of changing eCl was to improve the fit to AFT parameters while having a negligible effect on the thermal history, which is largely constrained by populations one and two. For the Devonian sample, a range of eCl values is also permissible for the higher-retentivity population two, but we only show results for an eCl value of 0.5 apfu (Fig. 7) because it gave 300 solutions at the 0.5 level with the broadest temperature envelope. The number of 0.5 level solutions decreased when eCl was increased to 0.55 apfu or decreased to 0.45 apfu. When eCl was increased from 0.5 to 0.55 apfu, the region defined by the 0.5 level solutions narrowed, and the corresponding average peak temperature shifted from 173 ∘C at 341 Ma to 178 ∘C at 351 Ma, with calculated average vitrinite reflectance increasing from 1.55 %Ro to 1.72 %Ro. The variation was much lower (1 ∘C and 1 Ma) when eCl was decreased to 0.45 apfu. We do not consider these uncertainties in eCl values to be a problem for multikinetic modelling because the effects on the thermal history are minor and well within available geological constraints. In our experience, relative annealing can significantly limit the allowable offset in eCl values (incremental changes <0.05 apfu) between lower-retentivity populations that experienced strong annealing. In some cases, incremental changes must be <0.05 apfu or solutions cannot be obtained at the 0.5 level. For our Permian sample, good solutions were obtained without adjusting the average eCl values for populations one and two.
Our modelling of natural and synthetic (McDannell and Issler, 2021) AFT data demonstrates that multikinetic samples can retain a record of multiple heating and cooling events under suitable geological conditions due to the relative annealing behaviour of kinetic populations that are sensitive to different parts of the thermal history. The ability to recover multi-cycle histories depends on many factors, including sufficient and well-distributed AFTs and elemental data to constrain kinetic population interpretations, a favourable thermal history (decreasing thermal intensity with time) that caused significant annealing of multiple kinetic populations, and appropriate application of modelling strategies. Even if the first two conditions are met, careful modelling is needed to obtain successful solutions. Nondirected Monte Carlo modelling software such as AFTINV and HeFTy depend on user-defined model boundary conditions and kinetic parameter values – often requiring iterative modelling to refine model parameters to obtain solutions. Overly simplistic thermal histories or unsuitable kinetic parameters may result in no or few solutions, and this may be incorrectly attributed to problems with the data. For example, a two-cycle heating and cooling model failed to yield solutions for our high-quality Devonian sample. When boundary conditions were adjusted to allow for the possibility of an extra heating event, the model converged on three well-resolved heating cycles, a scenario that is compatible with available geological constraints and is independently supported by QTQt model results without user-imposed boundary conditions. The QTQt model allows for looser boundary conditions and greater uncertainty in the style of thermal history because it implements a reversible jump Markov chain Monte Carlo optimization algorithm that automatically modifies the kinetic parameters (within specified ranges) and number of heating cycles to try to fit the input data.
Clearly not all samples will be multikinetic, and not all multikinetic samples will share a common thermal history if there has been insufficient annealing to eliminate differences in provenance (i.e., inherited pre-depositional histories). Nevertheless, we have seen many cases where a common thermal history works for multikinetic samples. Possible explanations for this include rapid exhumation of heterogeneous source areas, strong annealing and thermal resetting of some or all AFT populations, and mixing of detrital and syn-depositional volcanic components. Furthermore, multikinetic samples with different age populations may produce similar thermal histories, depending on how differences in provenance and composition interact with the thermal history. Therefore, proximal samples may not necessarily have the same age populations. If interpreted populations are incompatible, then solutions will not be obtained by adjusting kinetic parameters. Ultimately, the value of the approach will be judged on its ability to generate spatially coherent thermal histories over different stratigraphic intervals across study regions. An encouraging sign is that we have been able to use essentially the same kinetic parameters for samples from the same stratigraphic units in Yukon that have experienced different degrees of heating. We strongly recommend that elemental data be collected for detrital AFT samples from areas with complicated geological histories and for other samples with unexplained age dispersion. Age dispersion is a desirable characteristic of samples when viewed in a multikinetic framework due to the potential for enhanced thermal-history resolution.
It is common for sedimentary samples with apatite of variable cation and anion composition to have significant AFT age dispersion that is caused by multikinetic annealing. Under these conditions, AFT age and length data can be sorted into discrete kinetic populations with different annealing temperatures using eCl values (derived from rmr0 values obtained using multi-elemental data). In general, these kinetic populations are unresolved or poorly resolved using the conventional single kinetic parameters, i.e., Dpar or Cl content; Dpar has low precision, and Cl alone neglects how other elements influence track retentivity. Modelling of dozens of samples from northern Yukon, two of which are presented here, indicates that a complicated record of multiple heating and cooling cycles can be retained in multikinetic samples under certain geological conditions (heating cycles of decreasing intensity through time) due to the different relative annealing behaviour of the kinetic populations. Accurate prediction of elemental-derived kinetic parameters is unlikely and may not be attainable for all natural apatite populations; however, this is not a requirement for using the method, and the same problem exists with conventional kinetic parameters. Absolute kinetic parameters are best constrained for eCl values within the range of 0–0.25 apfu (rmr0 values of 0.73–0.84), which represents the more commonly encountered apatite compositions from published annealing experiments. Effective Cl values in this range can be fixed in the model, and inaccurately predicted parameters for more exotic apatite compositions can be adjusted by exploiting the relative annealing inherent in the rmr0 model. As expected, the uncertainty range of the less constrained higher eCl values increases as the degree of AFT annealing decreases. Overall, the model is tolerant of these uncertainties, and a range of eCl values for higher-retentivity populations can still produce similar solutions at the 0.5 significance level. Considering these results, age dispersion in multikinetic samples should be viewed as desirable for enhancing thermal-history resolution rather than as a hindrance to data interpretation and modelling.
The AFTINV software is more suited for expert users and is not publicly available at this time because a user manual is not available. It can be made available on reasonable request, but support cannot be guaranteed.
Detailed model results and complete AFT and elemental data are available online in the 2021 GSC Open File 8821 publication at https://doi.org/10.4095/328844 (Issler et al., 2021).
The Supplement contains the data for Fig. 2. The supplement related to this article is available online at: https://doi.org/10.5194/gchron-4-373-2022-supplement.
DRI developed the method, interpreted and modelled the data using AFTINV, and wrote the paper. KTM performed QTQt modelling, was involved in conceptual discussions, and contributed to writing and editing the paper. PBO'S did the AFT analysis (first at AtoZ Inc. and then at GeoSep Services) and coordinated the elemental analyses at Washington State University. LSL collected the samples, arranged for the analyses, and provided geological context for the study.
The contact author has declared that neither they nor their co-authors have any competing interests.
Publisher's note: Copernicus Publications remains neutral with regard to jurisdictional claims in published maps and institutional affiliations.
These ideas were developed over many years of working with detrital AFT samples and benefitted from many influences. Early on, Ray Donelick impressed upon Dale R. Issler how widespread age dispersion is in detrital samples, and his pioneering work with the LA-ICP-MS AFT method enabled us to acquire the data for this study. Richard Ketcham generously helped Dale R. Issler to better understand his annealing model so it could be incorporated into AFTINV. Careful AFT and multi-elemental analyses by Sandy Grist (formerly of Dalhousie University) for samples from the Mackenzie Delta region provided the first clear evidence for distinct kinetic populations in Canadian samples. We thank Chance Oil and Gas Ltd. (formerly Northern Cross (Yukon) Ltd.) for providing the well sample used in this study. Owen Neill (formerly of the Peter Hooper GeoAnalytical Laboratory, Washington State University) and Ken Severin (Advanced Instrumentation Laboratory, University of Alaska Fairbanks) are recognized for providing EPMA analyses and their assistance in organizing and processing the data. We thank Richard Ketcham, Karl Lang, and Jeremy Powell for their detailed reviews which helped improve the paper. This study has been supported through the Natural Resources Canada Geo-Mapping for Energy and Minerals Program Yukon Basins Project and is NRCan contribution no. 20210455.
This research was funded by the Government of Canada (Natural Resources Canada, Geo-mapping for Energy and Minerals (GEM) Program, 2011–2019)
This paper was edited by Noah M. McLean and reviewed by Richard A. Ketcham and Karl Lang.
Barbarand, J., Carter, A., Wood, I., and Hurford, T.: Compositional and structural control of fission-track annealing in apatite, Chem. Geol., 198, 107–137, 2003.
Brandon, M. T.: Decomposition of mixed grain age distributions using Binomfit, On Track, 24, 13–18, https://campuspress.yale.edu/markbrandon/files/2016/01 (last access: 27 November 2020), 2002.
Burtner, R. L., Nigrini, A., and Donelick, R. A.: Thermochronology of Lower Cretaceous source rocks in the Idaho-Wyoming thrust belt, Am. Assoc. Pet. Geol. Bull., 78, 1613–1636, https://doi.org/10.1306/a25ff233-171b-11d7-8645000102c1865d, 1994.
Carlson, W. D., Donelick, R. A., and Ketcham, R. A.: Variability of apatite fission-track annealing kinetics: I. Experimental results, Am. Mineral., 84, 1213–1223, 1999.
Carter, A. and Gallagher, K.: Characterizing the significance of provenance on the inference of thermal history models from apatite fission-track data – a synthetic data study, Goel. Soc. Am. Spec. Paper, 378, 7–23, 2004.
Chew, D. M. and Donelick, R. A.: Combined apatite fission track and U-Pb dating by LA-ICP-MS and its application in apatite provenance analysis, Quantitative Mineralogy And Microanalysis of Sediments And Sedimentary Rocks, edited by: Sylvester, P., Mineralogical Association of Canada Short Course Series, 42, 219–247, ISBN: 978-0-921294-52-8, 2012.
Cogné, N., Chew, D. M., Donelick, R. A., and Ansberque, C.: LA-ICP-MS apatite fission track dating: A practical zeta-based approach, Chem. Geol., 531, 1–11, https://doi.org/10.1016/j.chemgeo.2019.119302, 2020.
Coutand, I., Carrapa, B., Deeken, A., Schmitt, A. K., Sobel, E. R., and Strecker, M. R.: Propagation of orographic barriers along an active range front: Insights from sandstone petrography and detrital apatite fission-track thermochronology in the intramontane Angastaco basin, NW Argentina, Basin Res., 18, 1–26, https://doi.org/10.1111/j.1365-2117.2006.00283.x, 2006.
Crowley, K. D., Cameron, M., and Shaefer, R. I.: Experimental studies of annealing of etched fission tracks in fluorapatite, Geochim. Cosmochim. Acta, 55, 1449–1465, 1991.
Donelick, R. A.: A method of fission track analysis utilizing bulk chemical etching of apatite, U.S. Patent 5267274, https://www.freepatentsonline.com/5267274.html (last access: 10 June 2022), 1993.
Donelick, R. A., Roden, M. K., Mooers, J. D., Carpenter, B. S., and Miller, D. S.: Etchable length reduction of induced fission tracks in apatite at room temperature (∼23 ∘C): Crystallographic orientation effects and “initial” mean lengths, Int. J. Radiat. Appl. Instrumentation Part D Nucl. Tracks Radiat. Meas., 17, 261–265, 1990.
Donelick, R. A., O'Sullivan, P. B., and Ketcham, R. A.: Apatite fission-track analysis, Rev. Mineral. Geochemistry, 58, 49–94, 2005.
Galbraith, R. F.: The radial plot: graphical assessment of spread in ages, Int. J. Radiat. Appl. Instrumentation. Part D. Nucl. Tracks Radiat. Meas., 17, 207–214, 1990.
Galbraith, R. F. and Green, P. F.: Estimating the component ages in a finite mixture, Int. J. Radiat. Appl. Instrumentation. Part D. Nucl. Tracks Radiat. Meas., 17, 197–206, 1990.
Galbraith, R. F. and Laslett, G. M.: Statistical models for mixed fission track ages, Nucl. Tracks Radiat. Meas., 21, 459–470, 1993.
Gallagher, K.: Evolving temperature histories from apatite fission-track data, Earth Planet. Sci. Lett., 136, 421–435, 1995.
Gallagher, K.: Transdimensional inverse thermal history modeling for quantitative thermochronology, J. Geophys. Res.-Sol. Ea., 117, 1–16, https://doi.org/10.1029/2011JB008825, 2012.
Gallagher, K. and Ketcham, R. A.: Comment on the reply to the Comment on “Thermal history modelling: HeFTy vs. QTQt” by Vermeesch and Tian, Earth-Science Reviews (2014), 139, 279–290, Earth Sci. Rev., 203, 279–290, https://doi.org/10.1016/j.earscirev.2019.102878, 2020.
Gallagher, K., Brown, R., and Johnson, C.: Fission track analysis and its applications to geological problems, Annu. Rev. Earth Planet. Sci., 26, 519–572, 1998.
Garver, J. I., Brandon, M. T., Roden-Tice, M., and Kamp, P. J. J.: Exhumation history of orogenic highlands determined by detrital fission-track thermochronology, in: Geological Society Special Publication, 154, 283–304, Geological Society of London, https://sp.lyellcollection.org/content/154/1/283.short (last access: 15 November 2017), 1999.
Gleadow, A. J. W., Duddy, I. R., and Lovering, J. F.: Fission track analysis: a new tool for the evaluation of thermal histories and hydrocarbon potential, APPEA J., 23, 93–102, https://doi.org/10.1071/AJ82009, 1983.
Gleadow, A. J. W., Belton, D. X., Kohn, B. P., and Brown, R. W.: Fission track dating of phosphate minerals and the thermochronology of apatite, Rev. Mineral. Geochemistry, 48, 579–630, 2002.
Green, P. F.: AFTA Today, OnTrack, 5, 8–10, 1995.
Green, P. F., Duddy, I. R., Gleadow, A. J. W., Tingate, P. R., and Laslett, G. M.: Fission-track annealing in apatite: track length measurements and the form of the Arrhenius plot, Nucl. Tracks Radiat. Meas., 10, 323–328, 1985.
Green, P. F., Duddy, I. R., Gleadow, A. J. W., Tingate, P. R., and Laslett, G. M.: Thermal annealing of fission tracks in apatite: 1. A qualitative description, Chem. Geol. Isot. Geosci. Sect., 59, 237–253, 1986.
Green, P. F., Duddy, I. R., Laslett, G. M., Hegarty, K. A., Gleadow, A. J. W., and Lovering, J. F.: Thermal annealing of fission tracks in apatite 4. Quantitative modelling techniques and extension to geological timescales, Chem. Geol. Isot. Geosci. Sect., 79, 155–182, 1989.
Hasebe, N., Barbarand, J., Jarvis, K., Carter, A., and Hurford, A. J.: Apatite fission-track chronometry using laser ablation ICP-MS, Chem. Geol., 207, 135–145, 2004.
Hurford, A. J. and Green, P. F.: A users' guide to fission track dating calibration, Earth Planet. Sci. Lett., 59, 343–354, 1982.
Issler, D. R.: An inverse model for extracting thermal histories from apatite fission track data: instructions and software for the Windows 95 environment, Geol. Surv. Canada, Open File 2325, 85, https://doi.org/10.4095/208313, 1996.
Issler, D. R.: Integrated thermal history analysis of sedimentary basins using multi-kinetic apatite fission track thermochronology: examples from northern Canada, AAPG Distinguished Lectures, AAPG Search and Discovery Article #90101, http://www.searchanddiscovery.com/abstracts/html/2010/DL/ (last access: 10 June 2022), 2011.
Issler, D. R. and Grist, A. M.: Integrated thermal history analysis of the Beaufort-Mackenzie basin using multi-kinetic apatite fission track thermochronology, Geochim. Cosmochim. Acta, 72, A413–A413, https://geoscan.nrcan.gc.ca/starweb/geoscan/servlet.starweb?path=geoscan/fulle.web&search1=R=225531 (last access: 10 June 2022), 2008a.
Issler, D. R. and Grist, A. M.: Reanalysis and reinterpretation of apatite fission track data from the central Mackenzie Valley, NWT, northern Canada: implications for kinetic parameter determination and thermal modeling, edited by: Garver, J. I. and Montario, M. J., Proceedings of the 11th International Conference on Thermochronometry, Anchorage, Alaska, 15–19 September 2008, 130–132, https://geoscan.nrcan.gc.ca/starweb/geoscan/servlet.starweb?path=geoscan/fulle.web&search1=R=225530 (last access: 10 June 2022), 2008b.
Issler, D. R. and Grist, A. M.: Apatite fission track thermal history analysis of the Beaufort-Mackenzie Basin, Arctic Canada: a natural laboratory for testing multi-kinetic thermal annealing models, Thermo 2014, 14th International Conference on Thermochronology, Chamonix-Mont Blanc, France, 8–14 September 2014, 125–126, https://geoscan.nrcan.gc.ca/starweb/geoscan/servlet.starweb?path=geoscan/fulle.web&search1=R=293881 (last access: 10 June 2022), 2014.
Issler, D. R., Grist, A. M., and Stasiuk, L. D.: Post-Early Devonian thermal constraints on hydrocarbon source rock maturation in the Keele Tectonic Zone, Tulita area, NWT, Canada, from multi-kinetic apatite fission track thermochronology, vitrinite reflectance and shale compaction, Bull. Can. Pet. Geol., 53, 405–431, https://doi.org/10.2113/53.4.405, 2005.
Issler, D. R., Jiang, C., Reyes, J., and Obermajer, M.: Integrated analysis of vitrinite reflectance, Rock-Eval 6, gas chromatography, and gas chromatography-mass spectrometry data for the Reindeer D-27 and Tununuk K-10 wells, Beaufort-Mackenzie Basin, northern Canada, Geol. Surv. Canada, Open File 8047, 94, https://doi.org/10.4095/297905, 2016.
Issler, D. R., Lane, L. S., and O'Sullivan, P. B.: Characterization, interpretation, and modelling of multikinetic apatite fission-track data using elemental data, Geol. Surv. Canada, Sci. Present., 94, https://doi.org/10.4095/311302, 2018.
Issler, D. R., McDannell, K. T., Lane, L. S., O'Sullivan, P. B., and Neill, O. K.: A multikinetic approach to apatite fission-track thermal modelling using elemental data: data and model results for a Permian and Devonian sample from northern Yukon, Geol. Surv. Canada, Open File 8821, GEOSCAN [data set], https://doi.org/10.4095/328844, 2021.
Jepson, G., Carrapa, B., George, S. W. M., Triantafyllou, A., Egan, S. M., Constenius, K. N., Gehrels, G. E., and Ducea, M. N.: Resolving mid- to upper-crustal exhumation through apatite petrochronology and thermochronology, Chem. Geol., 565, 120071, https://doi.org/10.1016/j.chemgeo.2021.120071, 2021.
Ketcham, R. A.: Forward and Inverse Modeling of Low-Temperature Thermochronometry Data, in: Reviews in Mineralogy and Geochemistry, vol. 58, edited by: Reiners, T. A. and Elhers, P. W., 275–314, Mineralogical Society of America, https://doi.org/10.2138/rmg.2005.58.11, 2005.
Ketcham, R. A.: Calculation of stoichiometry from EMP data for apatite and other phases with mixing on monovalent anion sites, Am. Mineral., 100, 1620–1623, 2015.
Ketcham, R. A., Donelick, R. A., and Carlson, W. D.: Variability of apatite fission-track annealing kinetics; III, Extrapolation to geological time scales, Am. Mineral., 84, 1235–1255, https://doi.org/10.2138/am-1999-0903, 1999.
Ketcham, R. A., Donelick, R. A., and Donelick, M. B.: AFTSolve: A program for multi-kinetic modeling of apatite fission-track data, Geol. Mater. Res., 2, 1–32, http://www.minsocam.org/gmr/papers/v2/v2n1/v2n1abs.html (last access: 10 June 2022), 2000.
Ketcham, R. A., Carter, A., Donelick, R. A., Barbarand, J., and Hurford, A. J.: Improved modeling of fission-track annealing in apatite, Am. Mineral., 92, 799–810, https://doi.org/10.2138/am.2007.2281, 2007.
Link, C. M. and Bustin, R. M.: Organic maturation and thermal history of Phanerozoic strata in northern Yukon and northwestern District of Mackenzie, Bull. Can. Pet. Geol., 37, 266–292, https://pubs.geoscienceworld.org/bcpg/issue/37/3, 1989.
Lisker, F., Ventura, B., and Glasmacher, U. A.: Apatite thermochronology in modern geology, Geol. Soc. Spec. Publ., 324, 1–23, https://sp.lyellcollection.org/content/324/1/1 (last access: 10 June 2022), 2009.
Malusà, M. G. and Fitzgerald, P. G.: Fission-Track Thermochronology and its Application to Geology, Springer Textbooks in Earth Sciences, Geography and Environment, 393 pp., https://doi.org/10.1007/978-3-319-89421-8, 2019.
McDannell, K. T.: Notes on statistical age dispersion in fission-track datasets: the chi-square test, annealing variability, and analytical considerations, EarthArXiv, 1–4, https://doi.org/10.31223/osf.io/uj4hx, 2020.
McDannell, K. T. and Issler, D. R.: Simulating sedimentary burial cycles – Part 1: Investigating the role of apatite fission track annealing kinetics using synthetic data, Geochronology, 3, 321–335, https://doi.org/10.5194/gchron-3-321-2021, 2021.
McDannell, K. T., Schneider, D. A., Zeitler, P. K., O'Sullivan, P. B., and Issler, D. R.: Reconstructing deep-time histories from integrated thermochronology: An example from southern Baffin Island, Canada, Terra Nov., 31, 189–204, https://doi.org/10.1111/ter.12386, 2019.
McDannell, K. T., Pinet, N., and Issler, D. R.: Exhuming the Canadian Shield: preliminary interpretations from low-temperature thermochronology and significance for the sedimentary succession of the Hudson Bay Basin, in: Sedimentary basins of the Canadian north – contributions to a 1000 Ma geological journey and insight on resource potential, edited by: Lavoie, D. and Dewing, K., Geol. Surv. Can. B., 609, https://doi.org/10.31223/X54P5F, in press, 2022.
Nielsen, C. H. and Sigurdsson, H.: Quantitative methods for electron microprobe analysis of sodium in natural and synthetic glasses, Am. Mineral., 66, 547–552, 1981.
Nielsen, S. B., Clausen, O. R., and McGregor, E.: basin%Ro: A vitrinite reflectance model derived from basin and laboratory data, Basin Res., 29, 515–536, https://doi.org/10.1111/bre.12160, 2017.
Norris, D. K.: Geology, Eagle River, Yukon Territory, Geol. Surv. Canada, Map 1523A, https://doi.org/10.4095/109352, 1981.
Powell, J. W., Schneider, D. A., and Issler, D. R.: Application of multi-kinetic apatite fission track and (U-Th)/He thermochronology to source rock thermal history: a case study from the Mackenzie Plain, NWT, Canada, Basin Res., 30, 497–512, https://doi.org/10.1111/bre.12233, 2018.
Powell, J. W., Issler, D. R., Schneider, D. A., Fallas, K. M., and Stockli, D. F.: Thermal history of the Mackenzie Plain, Northwest Territories, Canada: Insights from low-temperature thermochronology of the Devonian Imperial Formation, Geol. Soc. Am. Bull., 132, 767–783, 2020.
Price, W. L.: A controlled random search procedure for global optimisation, Comput. J., 20, 367–370, 1977.
Ravenhurst, C. E., Roden-Tice, M. K., and Miller, D. S.: Thermal annealing of fission tracks in fluorapatite, chlorapatite, manganoanapatite, and Durango apatite: Experimental results, Can. J. Earth Sci., 40, 995–1007, https://doi.org/10.1139/e03-032, 2003.
Reyes, J., Saad, S., and Lane, L. S.: Organic petrology and vitrinite thermal maturation profiles for eight Yukon petroleum exploration wells in Eagle Plain and Liard basins, Geol. Surv. Canada, Open File 7056, 1–56, https://doi.org/10.4095/293110, 2013.
Sambridge, M. S. and Compston, W.: Mixture modeling of multi-component data sets with application to ion-probe zircon ages, Earth Planet. Sci. Lett., 128, 373–390, https://doi.org/10.1016/0012-821X(94)90157-0, 1994.
Schneider, D. A. and Issler, D. R.: Application of Low-Temperature Thermochronology to Hydrocarbon Exploration, in: Fission-Track Thermochronology and its Application to Geology, 1st edn., edited by: Malusà, M. G. and Fitzgerald, P., Springer International Publishing, Cham, 315–333, https://link.springer.com/chapter/10.1007/978-3-319-89421-8_18 (last access: 10 June 2022), 2019.
Sweeney, J. J. and Burnham, A. K.: Evaluation of a simple model of vitrinite reflectance based on chemical kinetics, Am. Assoc. Pet. Geol. Bull., 74, 1559–1570, 1990.
Tamer, M. and Ketcham, R.: Is Low-Temperature Fission-Track Annealing in Apatite a Thermally Controlled Process?, Geochem. Geophys. Geosystems, 21, e2019GC008877, https://doi.org/10.1029/2019GC008877, 2020.
Tello, C. A., Palissari, R., Hadler, J. C., lunes, P. J., Guedes, S., Curvo, E. A., and Paulo, S. R.: Annealing experiments on induced fission tracks in apatite: Measurements of horizontal-confined track lengths and track densities in basal sections and randomly oriented grains, Am. Mineral., 91, 252–260, 2006.
Vermeesch, P.: On the visualisation of detrital age distributions, Chem. Geol., 312–313, 190–194, https://doi.org/10.1016/j.chemgeo.2012.04.021, 2012.
Vermeesch, P.: Statistics for Fission-Track Thermochronology, in: Fission-Track Thermochronology and its Application to Geology, 1st edn., edited by: Malusà, M. G. and Fitzgerald, P., Springer International Publishing, Cham, 109–122, ISBN: 978-3-319-89419-5, 2019.
Wagner, G. A. and Van den Haute, P.: Fission Track Dating, 1st edn., Solid Earth Sciences Library v. 6, Klewer Academic Publishers, Dordrecht, ISBN-10: 079231624X, 1992.
Willett, S. D.: Inverse modeling of annealing of fission tracks in apatite 1: A controlled random search method, Am. J. Sci., 297, 939–969, https://doi.org/10.2475/ajs.297.10.939, 1997.
- Abstract
- Copyright statement
- Introduction
- Multikinetic AFT methodology
- Thermal-history modelling of multikinetic AFT data
- Model results
- Discussion
- Conclusions
- Code availability
- Data availability
- Author contributions
- Competing interests
- Disclaimer
- Acknowledgements
- Financial support
- Review statement
- References
- Supplement