the Creative Commons Attribution 4.0 License.
the Creative Commons Attribution 4.0 License.
 | 20 Jul 2022
Complex 40Ar ∕ 39Ar age spectra from low-grade metamorphic rocks: resolving the input of detrital and metamorphic components in a case study from the Delamerian Orogen
Marnie Forster
Wolfgang Preiss
Alicia Caruso
Stacey Curtis
Tom Wise
Davood Vasegh
Naina Goswami
Gordon Lister
In this study, we provide 40Ar 39Ar geochronology data from a suite of variably deformed rocks from a region of low-grade metamorphism within the Cambro–Ordovician Delamerian Orogen, South Australia. Low-grade metamorphic rocks such as these can contain both detrital minerals and minerals newly grown or partly recrystallised during diagenesis and metamorphism. Hence, they typically yield complex 40Ar 39Ar age spectra that can be difficult to interpret. Therefore, we have undertaken furnace step heating 40Ar 39Ar geochronology to obtain age spectra with many steps to allow for application of the method of asymptotes and limits and recognition of the effects of mixing. The samples analysed range from siltstone and shale to phyllite and contain muscovite or phengite with minor microcline as determined by hyperspectral mineralogical characterisation. Whole rock 40Ar 39Ar analyses were undertaken in most samples due to their very fine-grained nature. All samples are dominated by radiogenic 40Ar, and contain minimal evidence for atmospheric Ca- or Cl-derived argon. Chloritisation may have resulted in limited recoil, causing 39Ar argon loss in some samples, which is especially evident within the first few percent of gas released. Most of the age data, however, appear to have some geological significance. Viewed with respect to the known depositional ages of the stratigraphic units, the age spectra from this study do appear to record both detrital mineral ages and ages related to the varying influence of either cooling or deformation-induced recrystallisation. The shape of the age spectra and the degree of deformation in the phyllites suggest the younger ages may record recrystallisation of detrital minerals and/or new mica growth during deformation. Given that the younger limit of deformation recorded in the high-metamorphic-grade regions of the Delamerian Orogen is ca. 490 Ma, the ca. 470 to ca. 458 Ma ages obtained in this study suggest deformation in low-grade shear zones within the Delamerian Orogen may have persisted until ca. 20–32 million years after high-temperature ductile deformation in the high-grade regions of the orogen. We suggest that these younger ages for deformation could reflect reactivation of older structures formed both during rift basin formation and during the main peak of the Delamerian orogeny itself. The younger ca. 470 to ca. 458 Ma deformation may have been facilitated by far-field tectonic processes occurring along the eastern paleo-Pacific margin of Gondwana.
- Article
(22044 KB) - Full-text XML
- BibTeX
- EndNote


In many orogens, low-grade metamorphic rocks comprise the vast bulk of the surface exposure, and hence they are potentially a significant source of information on the orogenic process. However, most studies into the rates and timing of orogenesis concentrate on the high-metamorphic-grade sections of orogens largely because high-temperature minerals are either completely newly grown during orogenesis or at least isotopically reset. Low-grade metamorphic rocks in contrast typically comprise a mixture of detrital minerals and newly grown diagenetic or metamorphic minerals (e.g. Dallmeyer et al., 1988; Dunlap et al., 1991; Cosca et al., 1992; Dallmeyer and Takasu, 1992; Chan et al., 2000; Fergusson and Phillips, 2001; Kirschner et al., 2003; Clauer, 2013). As a result, it can be difficult to separate detrital from metamorphic signals in isotopic analysis of whole rock samples, especially when dealing with fine-grained, low-metamorphic-grade rocks.
The 40Ar 39Ar geochronology of fine-grained and typically low-grade metamorphic rock samples poses significant methodological challenges, including the problem of inheritance from pre-metamorphic minerals and recoil loss and 39Ar redistribution due to the fine-grained nature of the analysed minerals (Fergusson and Phillips, 2001; Phillips et al., 2012). Inheritance can be a major problem and result in overestimation of deformation ages if the age of detrital and newly grown minerals is very close in time or if there are limited heating steps with poor temperature control resulting in averaging of gas from different mineralogical components. One approach to minimising this problem has been to use laser ablation heating and to apply this to specific mineral grains either separated manually or analysed in situ (e.g. Chan et al., 2000; Haines et al., 2004; Kirkland et al., 2008). This can work well in cases where detrital minerals are relatively coarse grained; however, the smaller gas portions obtained via laser fusion can affect age precision. Recoil of 39Ar during neutron irradiation can artificially reduce apparent ages and is especially problematic in fine-grained samples that have undergone chloritic alteration (Lo and Onstott, 1989). Methodological attempts to minimise 39Ar recoil have been made, for example by encapsulation of samples during irradiation (Foland et al., 1992); however, this method produces a single age per sample and is not appropriate for samples which may have multiple age populations. Therefore, resolving detrital from metamorphic signals in complex age spectra remains a challenging task, with the result that low-grade rocks are often overlooked in studies on the timing of deformation in orogenic belts.
In this paper we show that furnace step heating can yield meaningful age gradients in 40Ar 39Ar age spectra from fine-grained whole rock samples and mica separates. In this respect, we utilise a similar methodology to Dallmeyer et al. (1988), who analysed whole rock slate and phyllite samples via furnace step heating. However, here we apply a careful heating schedule for our ultrahigh vacuum (UHV) step heating experiments, utilising a larger number of increments in the step-heating schedule to carefully resolve any variations in age within the sample (thereby applying methods similar to Forster and Lister, 2009; Muston et al., 2021).
Our field area, the Delamerian Orogen exposed in the Mount Lofty Ranges of South Australia, provides an ideal setting with which to investigate low-grade metamorphic rocks because of the extensive exposure of Neoproterozoic to Cambrian metasedimentary units. The timing of orogenic activity in the Delamerian Orogen has been established based on cross-cutting relationships of igneous rocks from high-grade metamorphic zones of the orogen. The earliest interpreted syn-tectonic intrusion within the orogen has a U–Pb zircon age of 514 ± 4 Ma (Rathjen Gneiss; Foden et al., 1999). Bimodal intrusions that cut tectonic fabrics and are weakly or undeformed themselves were emplaced between ca. 490 and 470 Ma. While the ages of these magmatic rocks are interpreted to bracket the timing of deformation between ca. 514–490 Ma (Foden et al., 2020), there has been little geochronology from low-grade portions of the orogen to determine if deformation was synchronous across metamorphic grade zones. Our new samples yield complex age spectra that we interpret to contain evidence for ages from detrital minerals up to Mesoproterozoic in age and ages from newly grown minerals of Cambro–Ordovician age related to cooling and/or deformation.
The Delamerian Orogen formed on the eastern proto-Pacific margin of Gondwana in the late Cambrian to early Ordovician and is part of the family of orogens developed during amalgamation of Gondwana (Fig. 1; Preiss, 1995a; Cawood, 2005; Foden et al., 2006; Glen and Cooper, 2021). The Delamerian Orogeny deformed Neoproterozoic to early Cambrian rocks of the Adelaide Superbasin, including the early Cambrian Kanmantoo Group and Normanville Groups (Fig. 2; Preiss, 1987, 1995a; Flottmann et al., 1998; Preiss, 2000; Lloyd et al., 2020). Deposition of the Kanmantoo and Normanville Groups was contemporaneous with the earliest arc magmatism along the Gondwanan subduction margin to the east of the Delamerian Orogen (Betts et al., 2018; Cayley and Skladzien, 2018). Deformation and metamorphism began at ca. 514 Ma with emplacement of early, syn-tectonic granite (Foden et al., 1999). A belt of high-level, undeformed granites cut major structures in the eastern parts of the orogen formed at ca. 490 Ma, suggesting that the entire orogenic cycle occurred over an approximately ∼ 24 million year period in the late Cambrian (Foden et al., 2006).
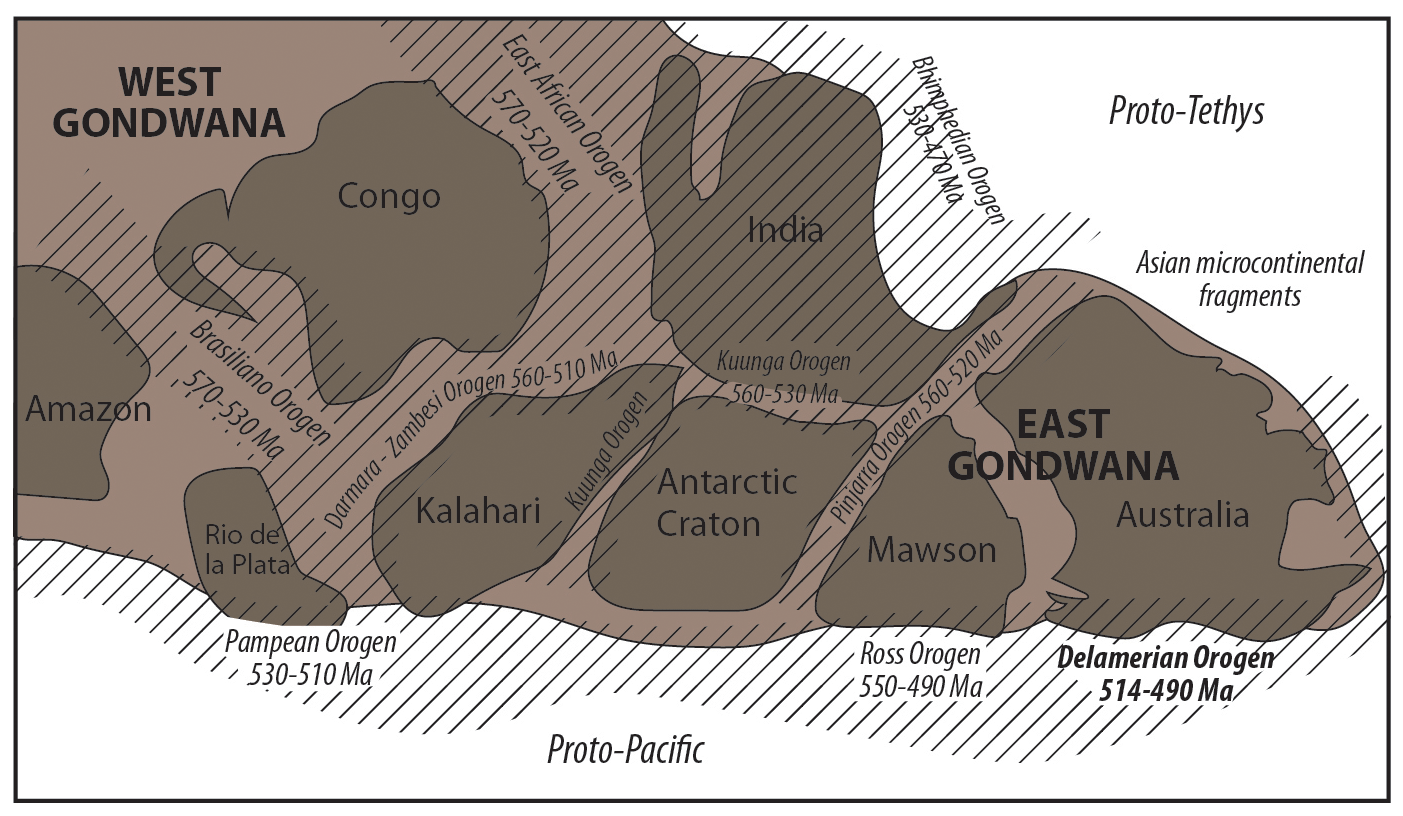
Figure 1Location of the Delamerian Orogen with respect to eastern Gondwanan terranes and Pan-African orogens. Modified from Cawood et al. (2007).
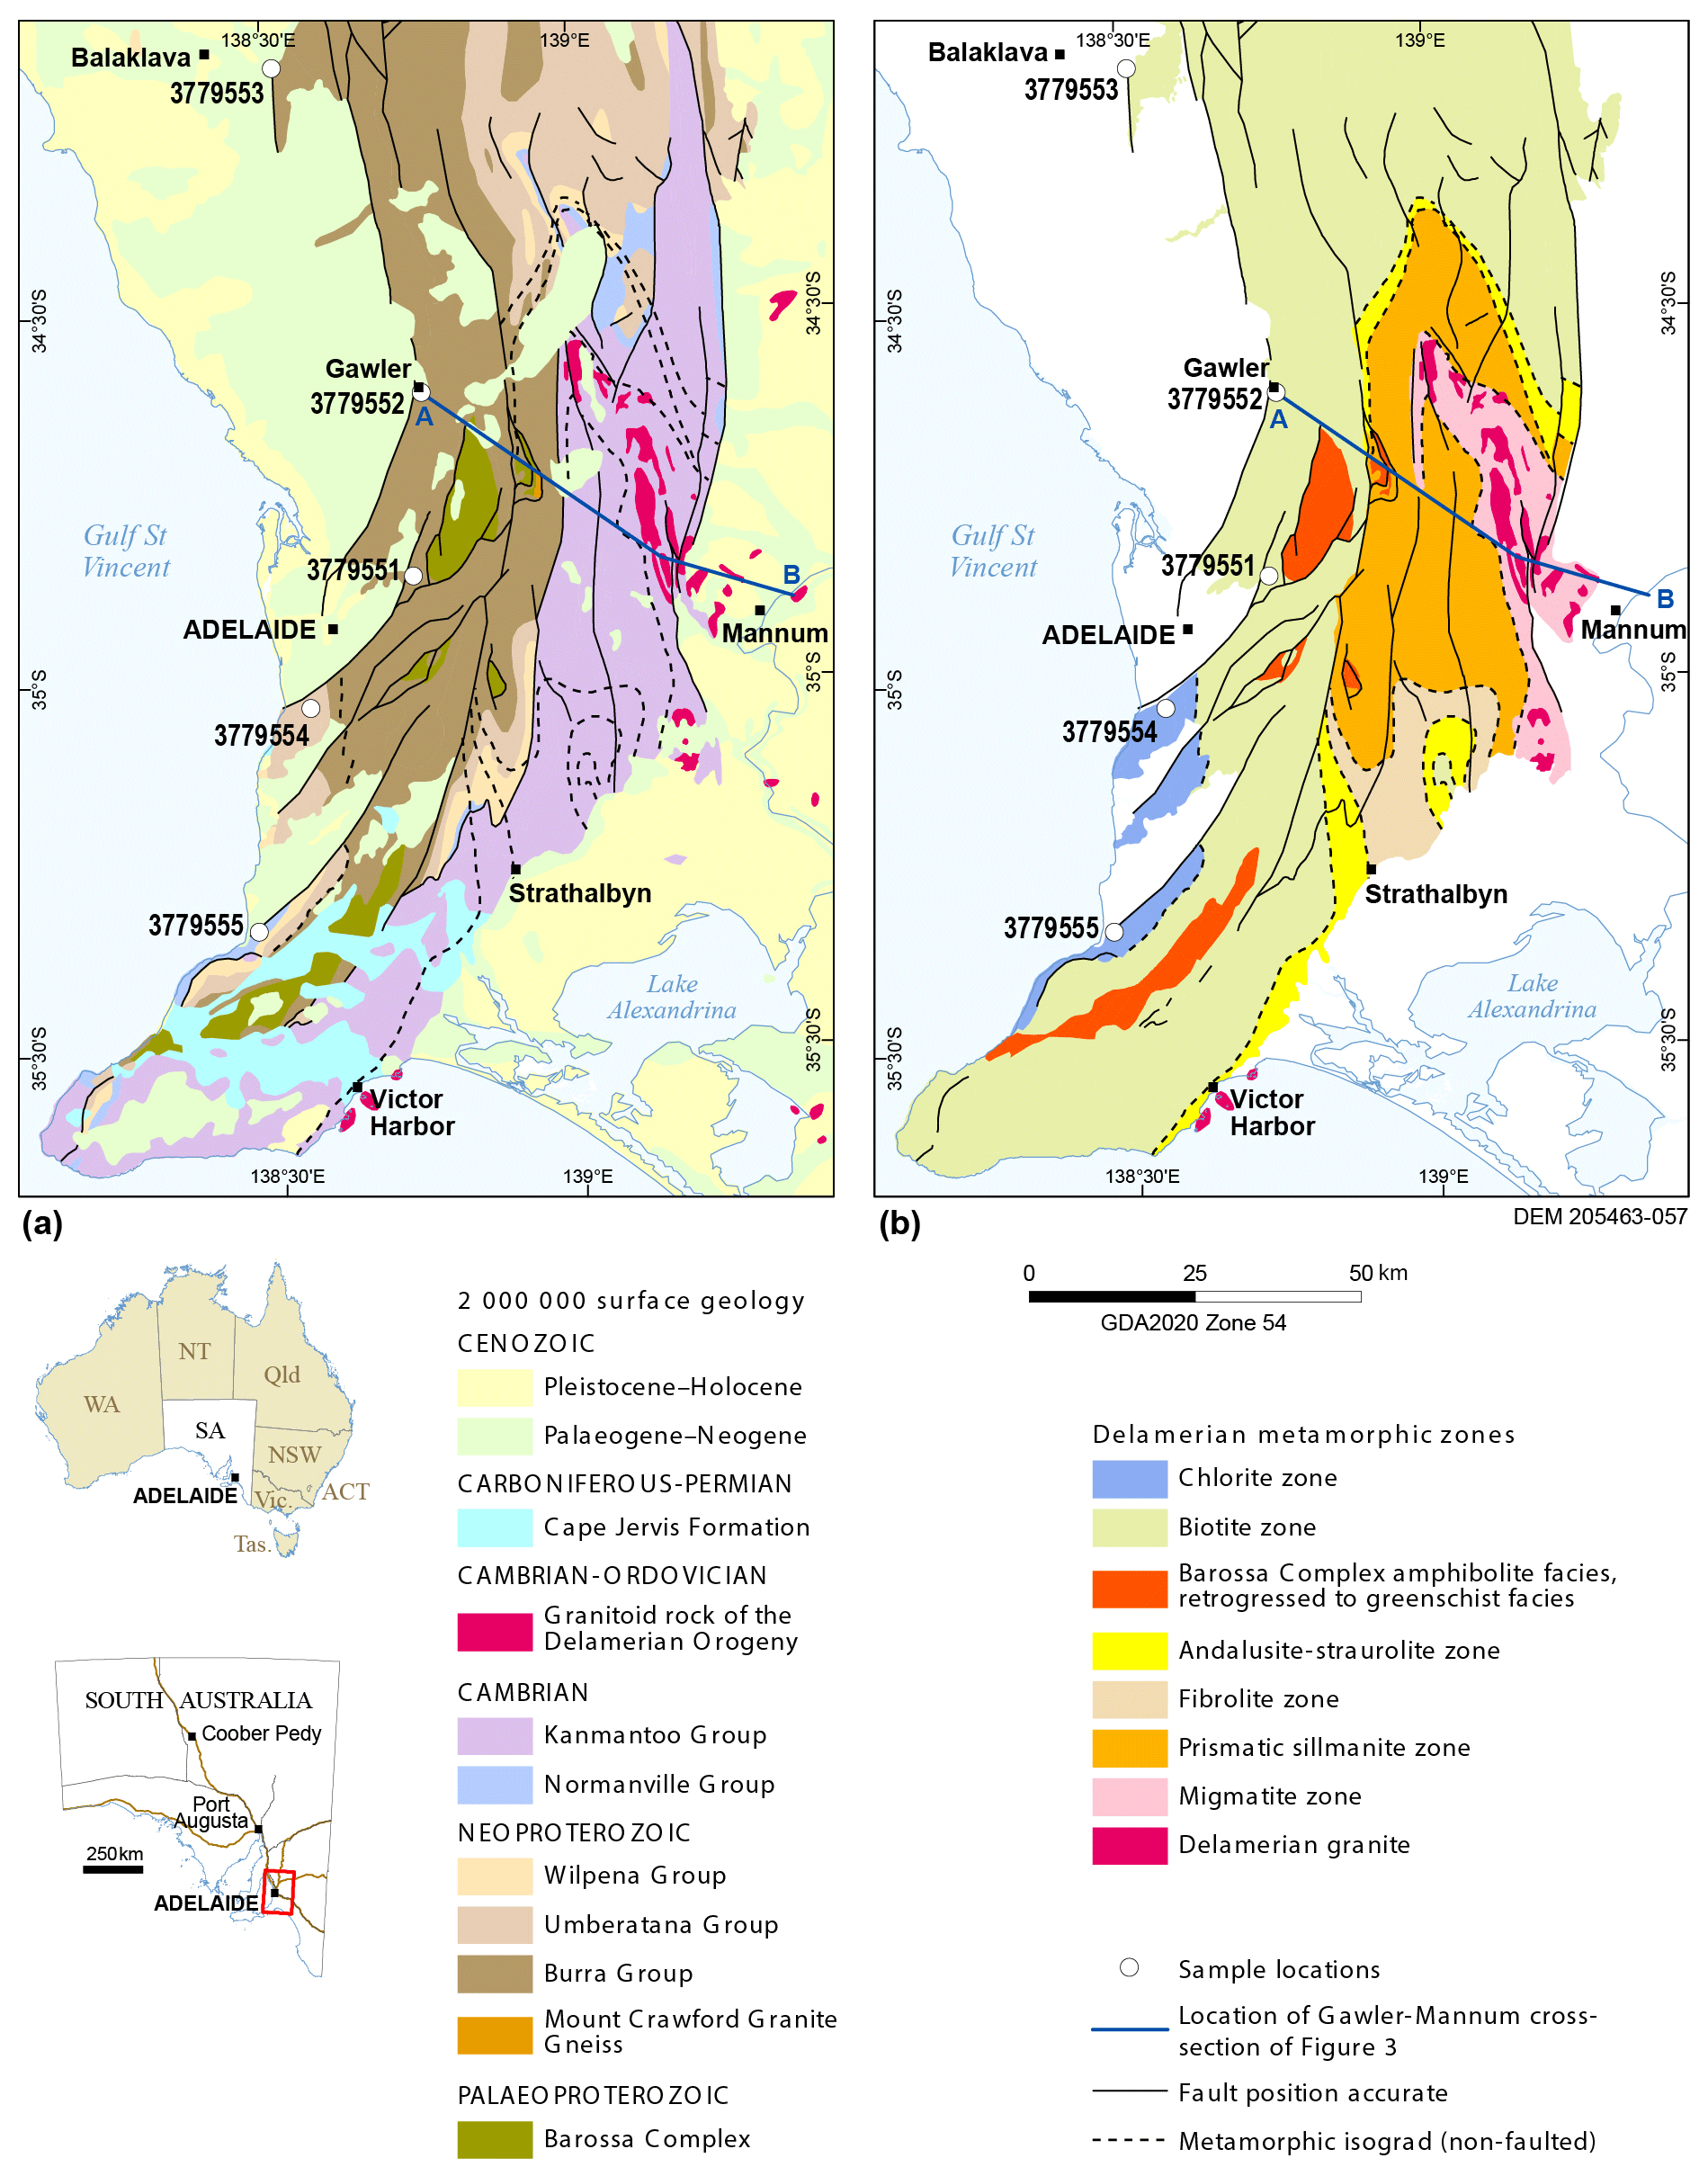
Figure 2Geology of the Mt. Lofty Ranges, part of the Delamerian Orogen, showing the location of samples analysed in this study. (a) 1 : 2 million scale South Australian state-wide geology data set. (b) Delamerian metamorphic isograds of the Mt. Lofty Ranges (following Offler and Fleming, 1968; Mancktelow, 1990; Dymoke and Sandiford, 1992; Preiss, 1995a).
Peak metamorphic conditions of ∼ 3–5 kbar (300-500 MPa) and 550–650 ∘C occur in a migmatite grade zone in the east of the orogen (Dymoke and Sandiford, 1992; Preiss, 1995a). Metamorphic isograds for the Delamerian Orogen cross some stratigraphic boundaries and folds, especially within the Kanmantoo Group, supporting the notion that metamorphism was both synchronous with (but also sometimes overprints) the large-scale deformation features (Fig. 2; Offler and Fleming, 1968; Mancktelow, 1990; Dymoke and Sandiford, 1992). Folding in the orogen was also synchronous with thrusting, with thrust zones in the western region of the Delamerian displaying fault-bend folding in the hanging wall (Fig. 3; Preiss, 1995a; Flottmann and James, 1997; Flottmann et al., 1998; Preiss, 2019). The lowest-metamorphic-grade regions occur along the western edge of the orogen, where weakly cleaved rocks and phyllitic shear zones contain metamorphic chlorite, thereby defining a chlorite zone (Fig. 2), from where several samples analysed in this study were derived.
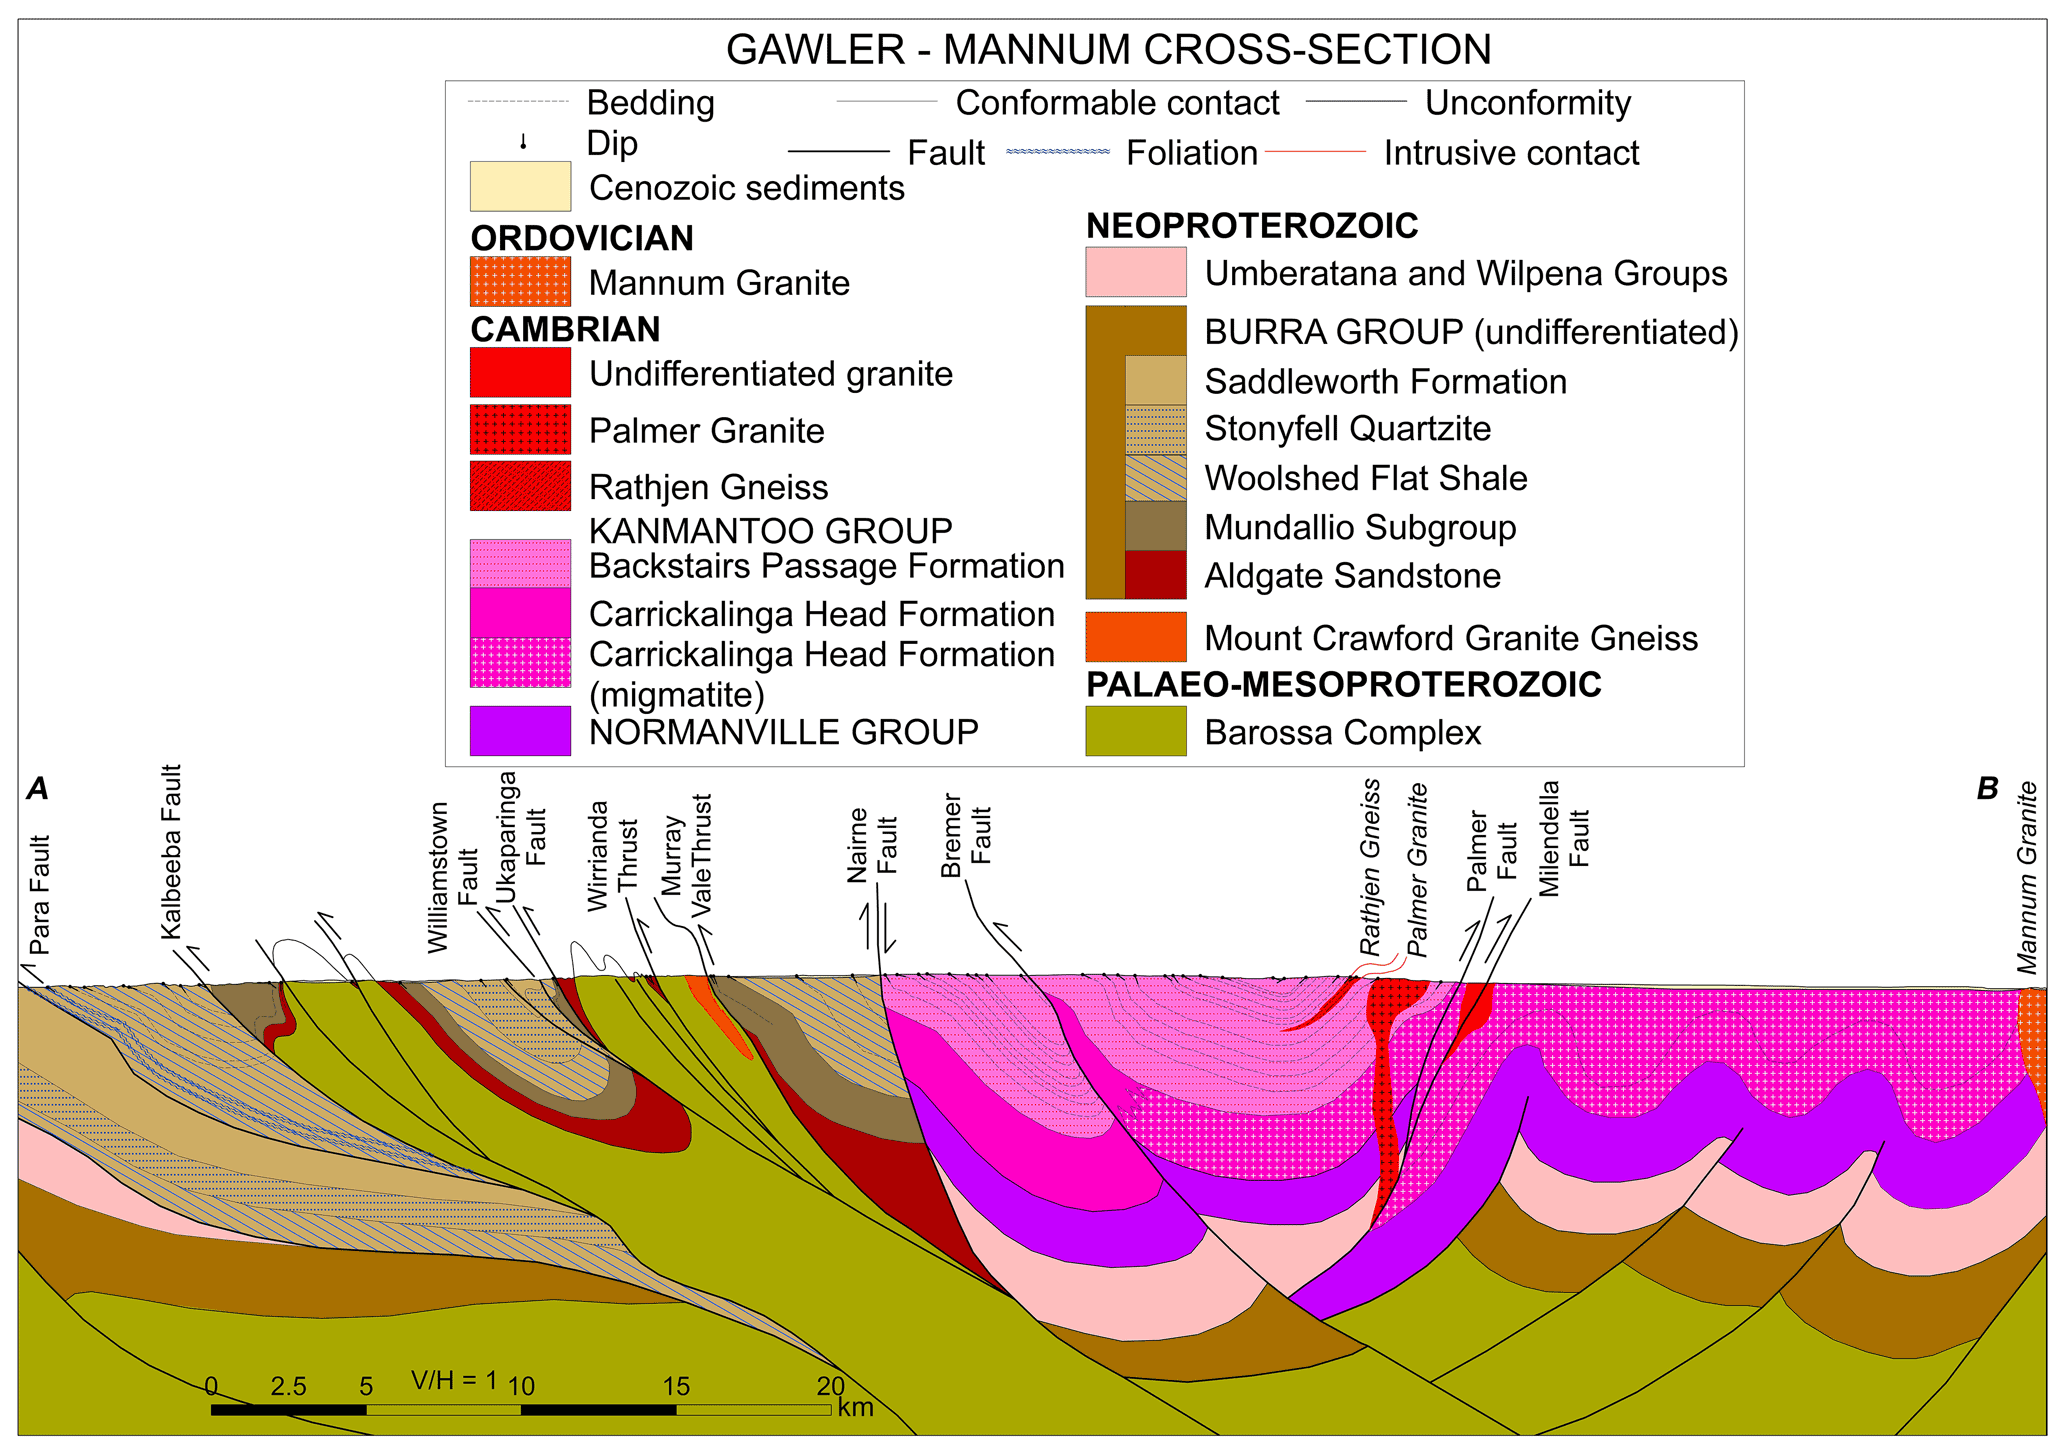
Figure 3Interpretative cross section across the southern Delamerian Orogen from Gawler to Mannum. Both the topographic profile and surface geology, including the dip of structural elements, are well constrained from previous mapping, but their extrapolation at depth in this diagram is more speculative. The left-hand portion of the cross section illustrates the westerly vergence of the major structures in the western low-grade metamorphic zones and the involvement of the basement. Many of the faults originated as extensional faults in the basement as a result of Neoproterozoic and Cambrian rifting. Of the mapped major faults, the Para, Kalbeeba, Williamstown, Bremer, Palmer, and Milendella faults all display compressional neotectonic reactivation. The Nairne Fault differs from other faults in being a ?late Delamerian normal reactivation of a Cambrian extensional fault and locally forms the western boundary of the Kanmantoo Trough. The metamorphic grade jumps from greenschist facies to sillimanite grade across the Williamstown Fault, while migmatite is widely developed in the oldest formation of the Kanmantoo Group. Geology beneath the Kanmantoo Group is schematic only. The location of the cross section is shown in Fig. 2 (A–B).
The few available 40Ar 39Ar analyses from the Delamerian Orogen have mostly been interpreted to record post-peak metamorphic cooling (Turner et al., 1996, 2009; Foden et al., 2006, 2020). Laser-induced step heating 40Ar 39Ar analyses of syn-kinematic muscovite from folded schists in the Delamerian Orogen yielded a plateau age of 502 ± 4 Ma, interpreted to record cooling subsequent to D1 thrusting (Foden et al., 2020). The 40Ar 39Ar analyses of biotite and hornblende from syn-kinematic, largely I-type granites, and country rocks yield ages that range from ca. 498 to 480 Ma (Turner et al., 1996), which broadly corresponds to the timing of intrusion of late-kinematic to post-kinematic granites and mafic rocks. Turner et al. (1996) interpreted the orogen to have cooled below ∼ 300 ∘C by ca. 480 Ma. This is consistent with a muscovite 40Ar 39Ar age of 478 ± 2 Ma from a high-level post-tectonic pegmatite (Burtt and Phillips, 2003).
In contrast to these data from the high-metamorphic-grade portions of the orogen, two studies have used 40Ar 39Ar methods to date low-grade rocks from the southwestern region of the orogen. Haines et al. (2004) and Turner et al. (2009) present laser fusion 40Ar 39Ar data on detrital muscovite from the Delamerian Orogen. Their results show that many of the Neoproterozoic sedimentary rocks within the Delamerian Orogen contain detrital mica that has preserved signature of the source region and has escaped recrystallisation during orogenic activity. Turner et al. (2009) also dated white mica from a sandstone containing a differentiated cleavage and reported an 40Ar 39Ar age of 533 ± 15 Ma and a Rb Sr isochron age of 554 ± 10 Ma, which they interpreted to date the timing of cleavage formation at that locality.
We have sampled rocks within the biotite and chlorite metamorphic zones of the Delamerian Orogen and analysed them using whole rock 40Ar 39Ar methods (Fig. 2). Sample details, including the stratigraphic unit and location, are given in Table 1. As these samples are very fine grained, we have undertaken mineralogical characterisation using hyperspectral imaging with HyLogger-3™ instrumentation (Schodlok et al., 2016) at the South Australian Drill Core Reference Library, Adelaide. Full details of HyLogger-3™ methodology and mineralogical composition of samples from this study are given in Appendix A.
Table 1Details of samples analysed in this study, listed in stratigraphic order.

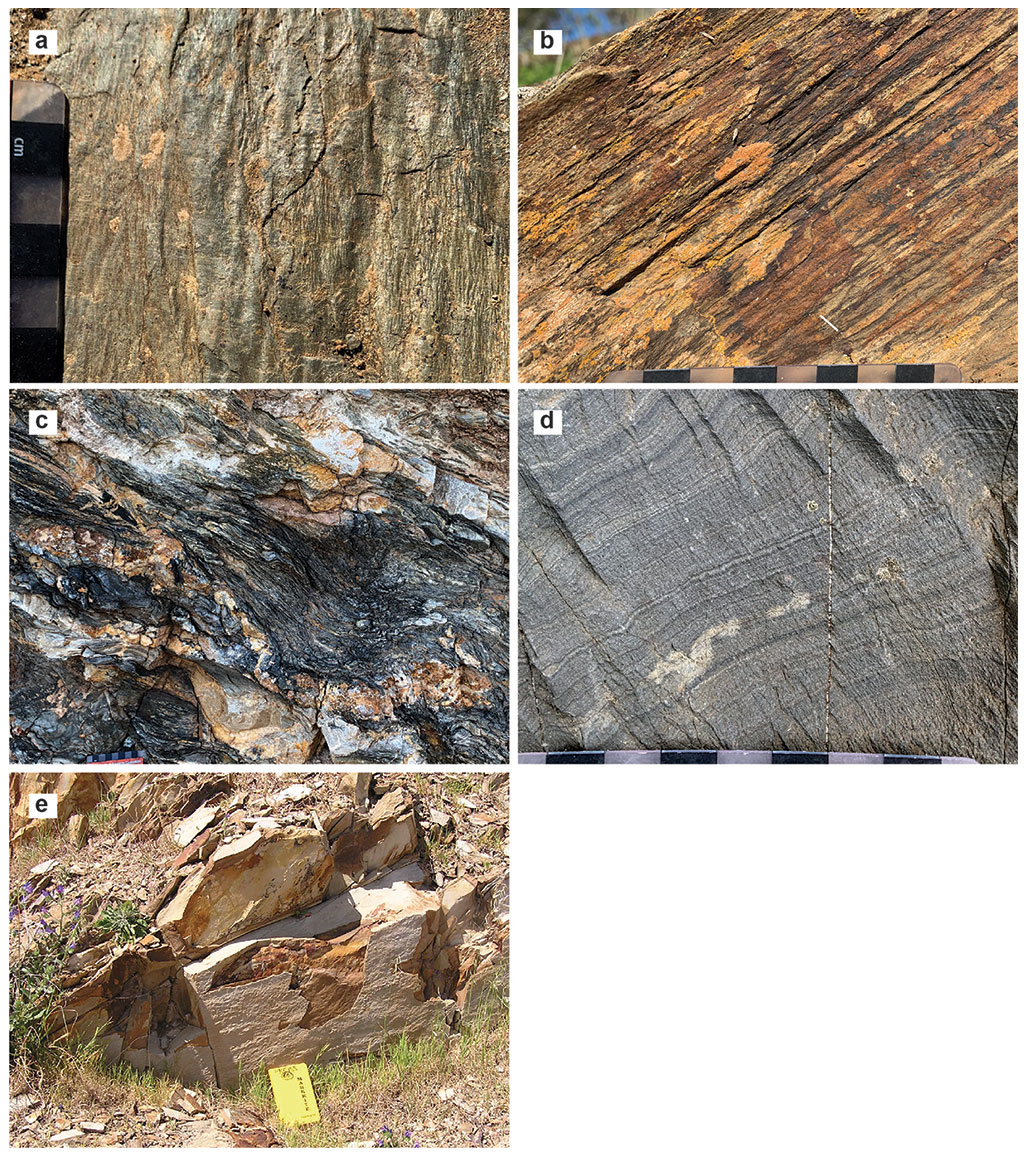
Figure 4Field photographs of analysed samples. (a) Surface of shear fabric in phyllite from the locality of sample 3779553. (b) Cross section of phyllite at the location of sample 3779552, with a view pointed towards the south and a moderate east-dipping deformation fabric. Note that the orange material is lichen. (c) Cross section of phyllite of sample 3779551. This field of view shows rafts of quartzite within the phyllite and complex buckling of the phyllitic-foliation in places with a new shear fabric that developed associated with these structures. (d) Detail of laminated metasiltstone of sample 3779554, showing high-angle slaty cleavage and dipping steeply to the southeast (field of view looking north). (e) Volcaniclastic sediment of the Heatherdale Shale from the locality of sample 3779555.
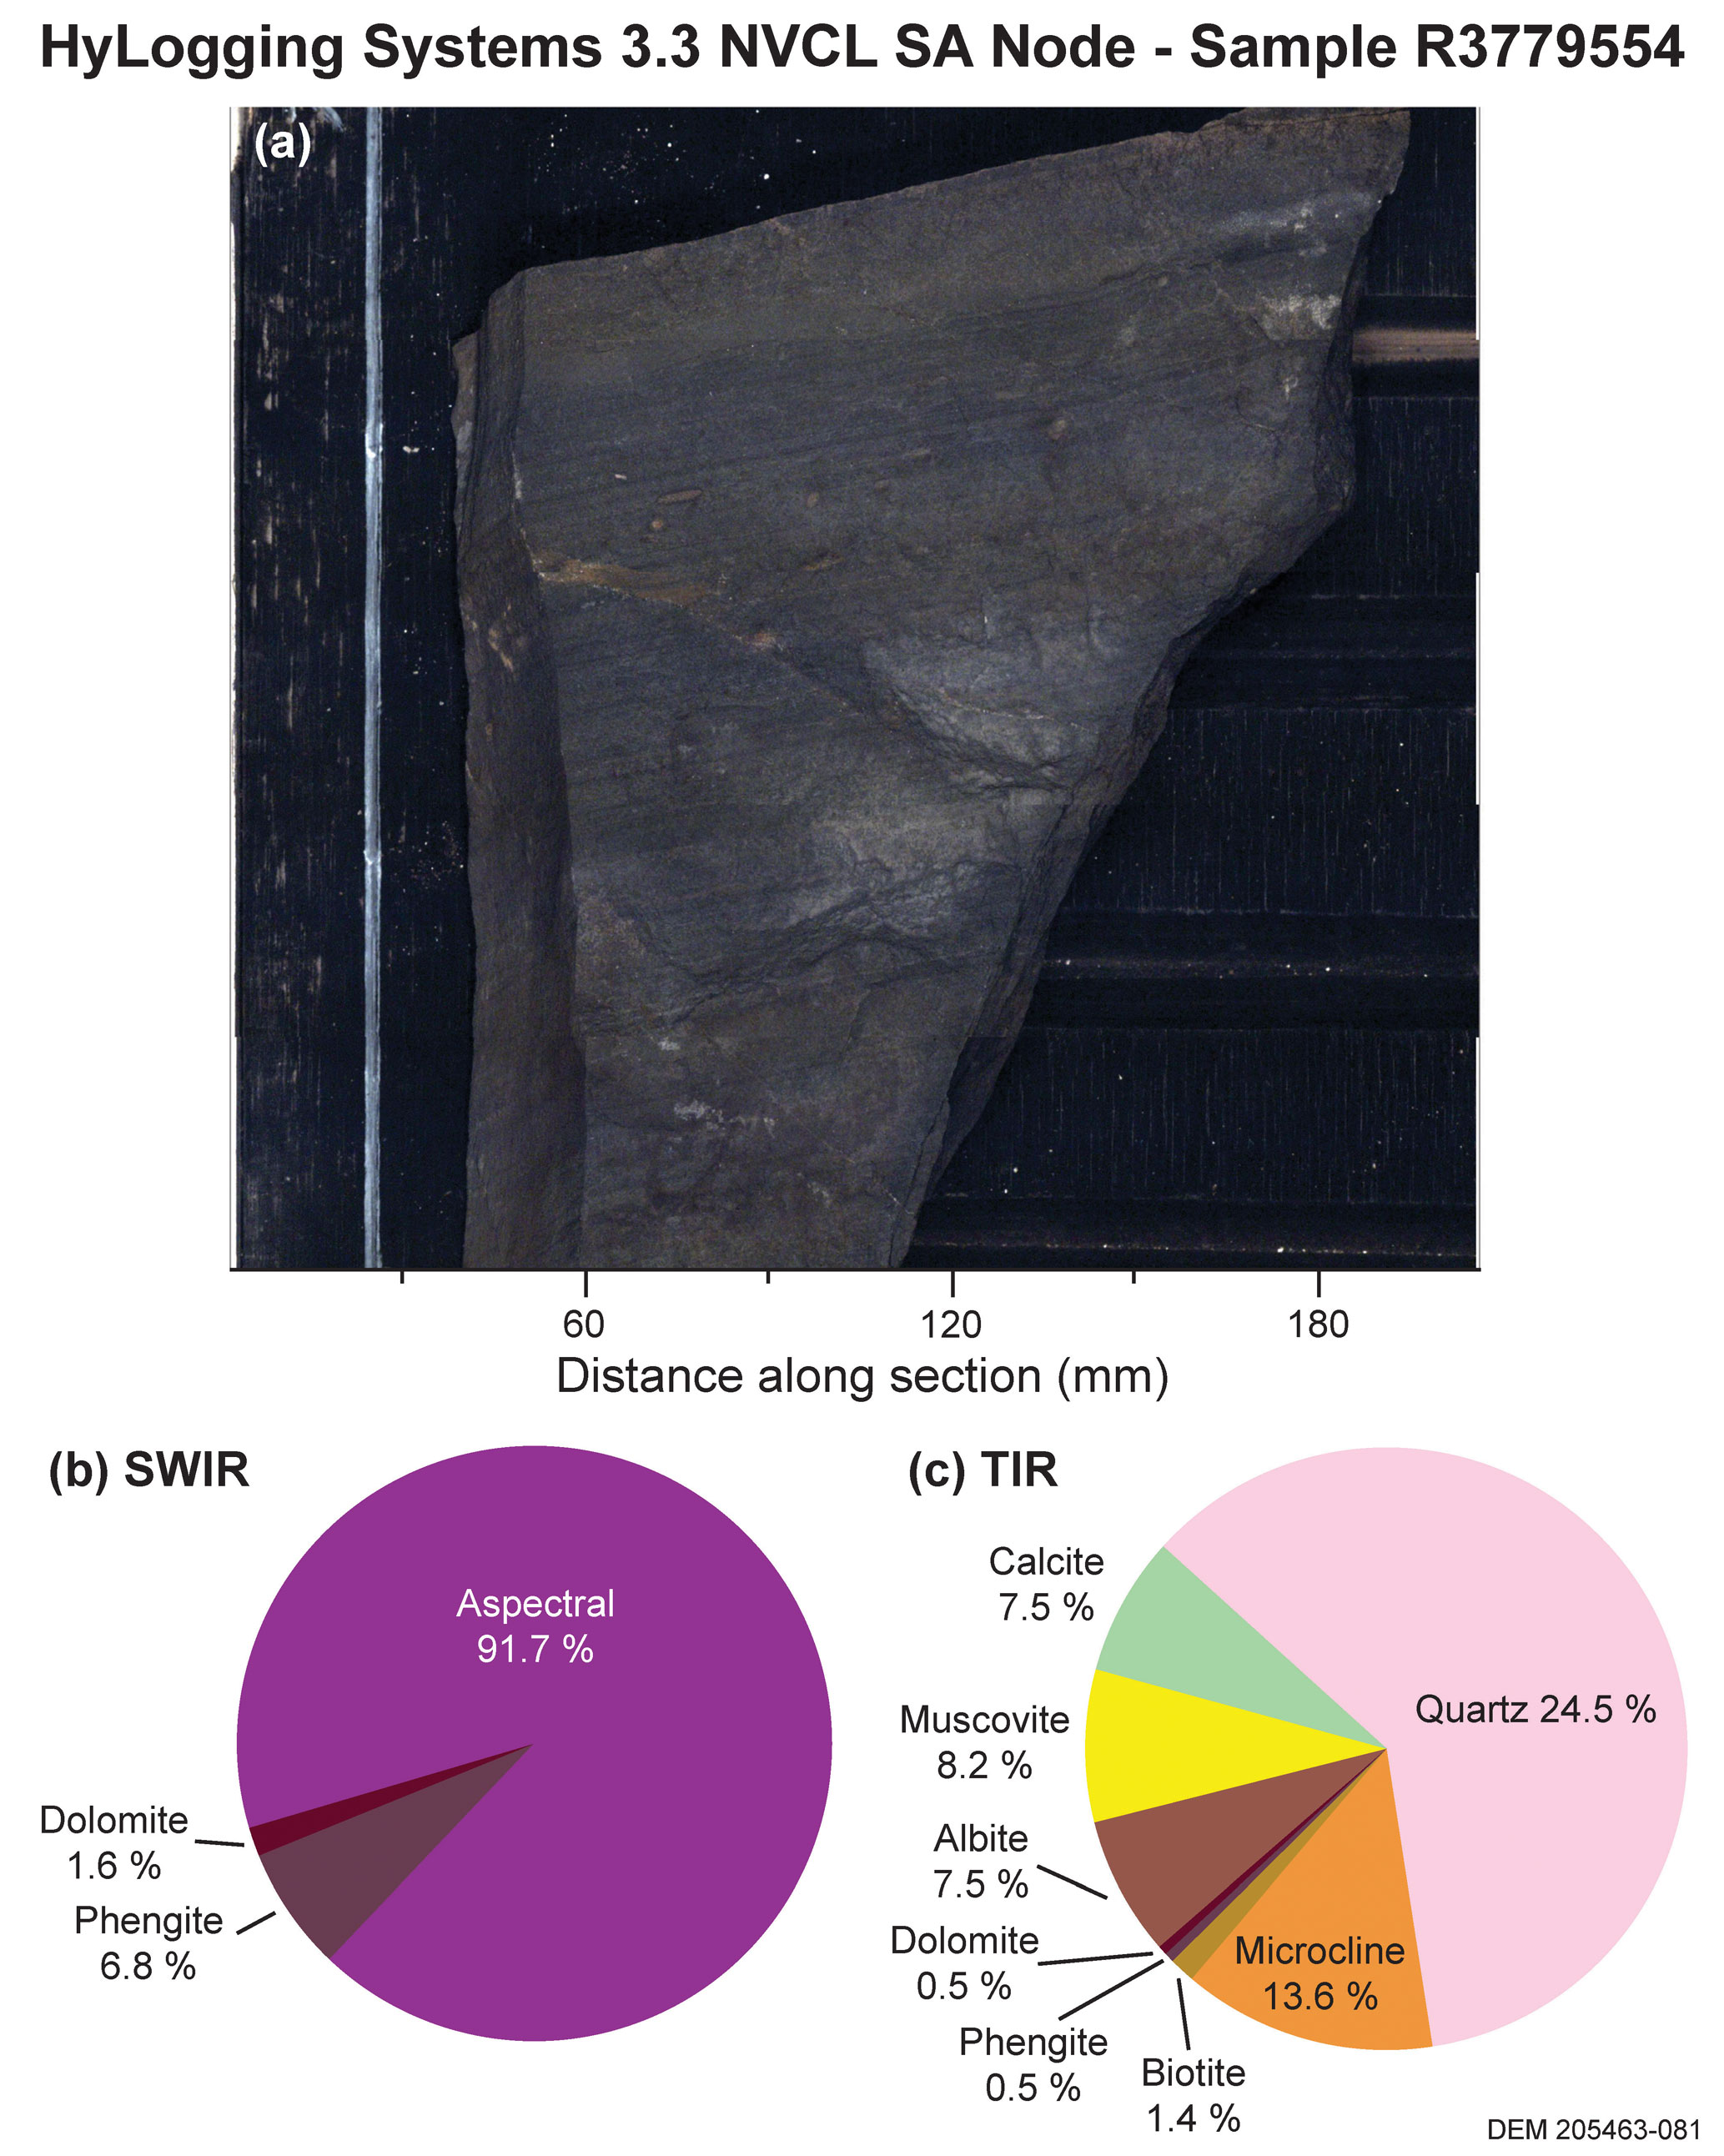
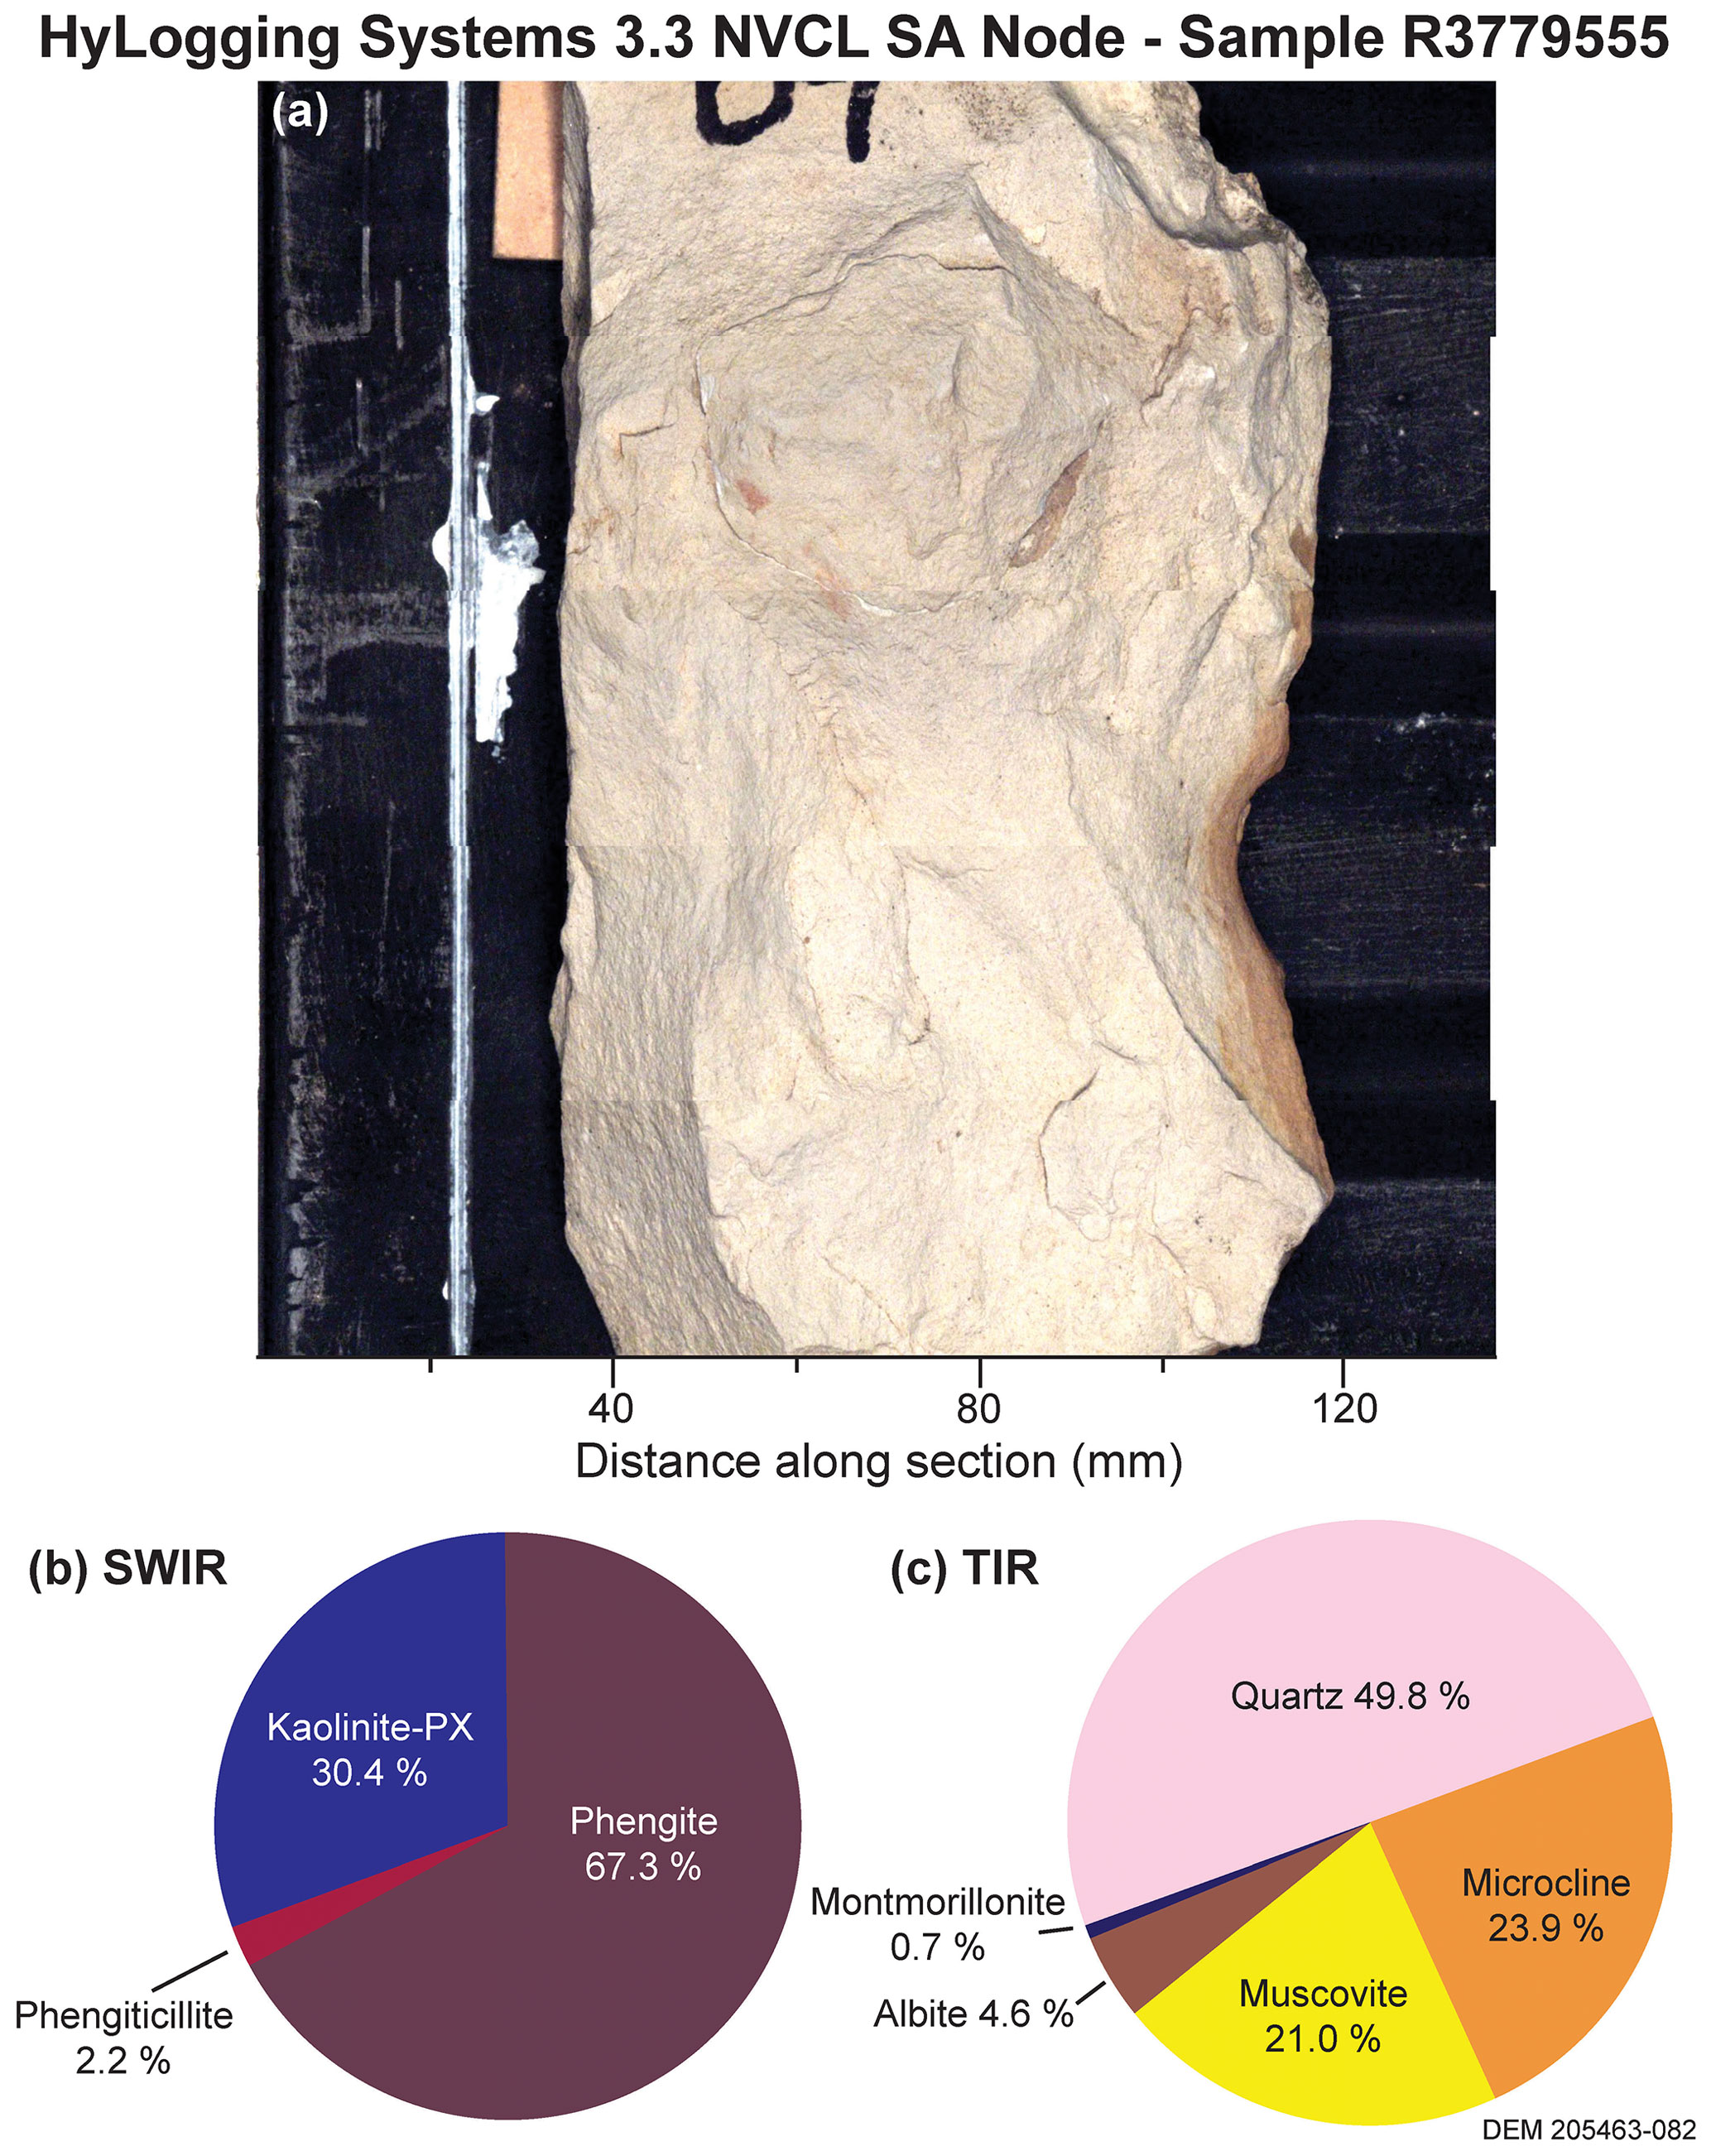
Samples 3779553, 3779552, and 3779551 are phyllitic schists within low-angle thrust zones exposed along the western margin of the Mt. Lofty Ranges (Figs. 2, 4a, b, c). The samples are composed of chlorite, phengitic white mica, albite, muscovite, and quartz, with minor carbonate in sample 3779551 (Appendix A). Samples 3779554 and 3779555 are siltstones from the Tapley Hill Formation and Heatherdale Shale, respectively (Figs. 2, 4d, e). Sample 3779554 possesses an upright, slaty cleavage and is composed of phengitic white mica, quartz, microcline, albite, muscovite, and carbonate, with minor biotite and phengite (Appendix A). Sample 3779555 is very weakly cleaved and composed of phengite, kaolinite, quartz, microcline, muscovite, and albite (Appendix A).
As mica in these samples are very fine grained, whole rock samples were analysed, with the exception of sample 3779551, from which aggregates of white mica were more prominent and were able to be separated and analysed. Whole rock material was crushed and sieved to a 420–250 µm size fraction. Hand picking was done to select the most suitable material and grains before washing in deionised water. Necessary weights were calculated, and the weighed sample grains were packed into aluminium foils. The samples were then subjected to neutron irradiation at the UC Davies nuclear reactor, USA, for 12 h and 5 min along with flux monitors, K2SO4, and CaF2 salts for calculation of J factors and monitoring correction factors including 40Ar production from potassium. Biotite standard GA-1550 was used as the flux monitor. Furnace step-heating diffusion experiments were undertaken at the 40Ar 39Ar Laboratory, Research School of Earth Sciences, Australian National University, Canberra. Complete analytical details are given in Appendix B.
Analyses were conducted using a furnace step-heating procedure through an ultrahigh-vacuum extraction line to a Thermo Fisher ARGUS-VI multi-collector mass spectrometer. Step-heating diffusion experiments on individual samples were carried out with a temperature-controlled furnace that allows for precise control of temperature during step-heating analysis with heating schedules between 450 and 1450 ∘C. The furnace was cleaned four times at 1450 ∘C for 15 min each time prior to each new sample being loaded, ensuring no cross-contamination between samples. Following this, low-temperature baking of each sample is done, whereby the sample is heated to 420 ∘C for 3 min with the gas being pumped away and then heated for 12 h at 400 ∘C with the gas being pumped away. This was undertaken before each analysis to remove weakly held contaminant gas from non-lattice sites. GA-1550 standards were analysed using a CO2 laser and a linear best fit was then used for the calculation of the J factor and J-factor uncertainty. Data were reduced using Noble 2020 software with relevant correction factors and J factors (Appendix B). Stated precisions for 40Ar 39Ar ages include all uncertainties in the measurement of isotope ratios and are quoted at the one sigma level and exclude errors in the age of the flux monitor GA-1550. Reported data have been corrected for system backgrounds, mass discrimination, fluence gradients, and atmospheric contamination. The 40K abundances and decay constants used are recommended values (Renne et al., 2011). Result tables for each step heating experiment are given in Reid and Forster (2022). Weighted mean ages from selected steps are calculated in the case of three or more steps forming a coherent grouping based on Pearson's chi statistic to assess whether the scatter remains within the 95 % confidence limit and calculated using the software eArgon (see Muston et al., 2021, for detailed description of statistical methods).
All samples yield complex age spectra with multiple age populations (Fig. 5). Samples 3779553, 3779551a, and 3779551b have similar age spectra that all have ages between ca. 470 and ca. 459 Ma obtained from between 20 % and 70 % of 39Ar released. Mean ages calculated from these successive steps produce ages of 461.2 ± 1.6, 469.9 ± 1.3, and 459.2 ± 1.1 Ma for samples 3779553, 3779551a, and 3779551b, respectively, each defined by 95 % confidence and a Pearson's chi statistic within acceptable range for a single population (see the age calculation statistics in Appendix C). In each of these samples, the age spectra then step upwards towards significantly older ages, with maxima of ca. 545, ca. 1172, and ca. 1002 Ma, respectively.
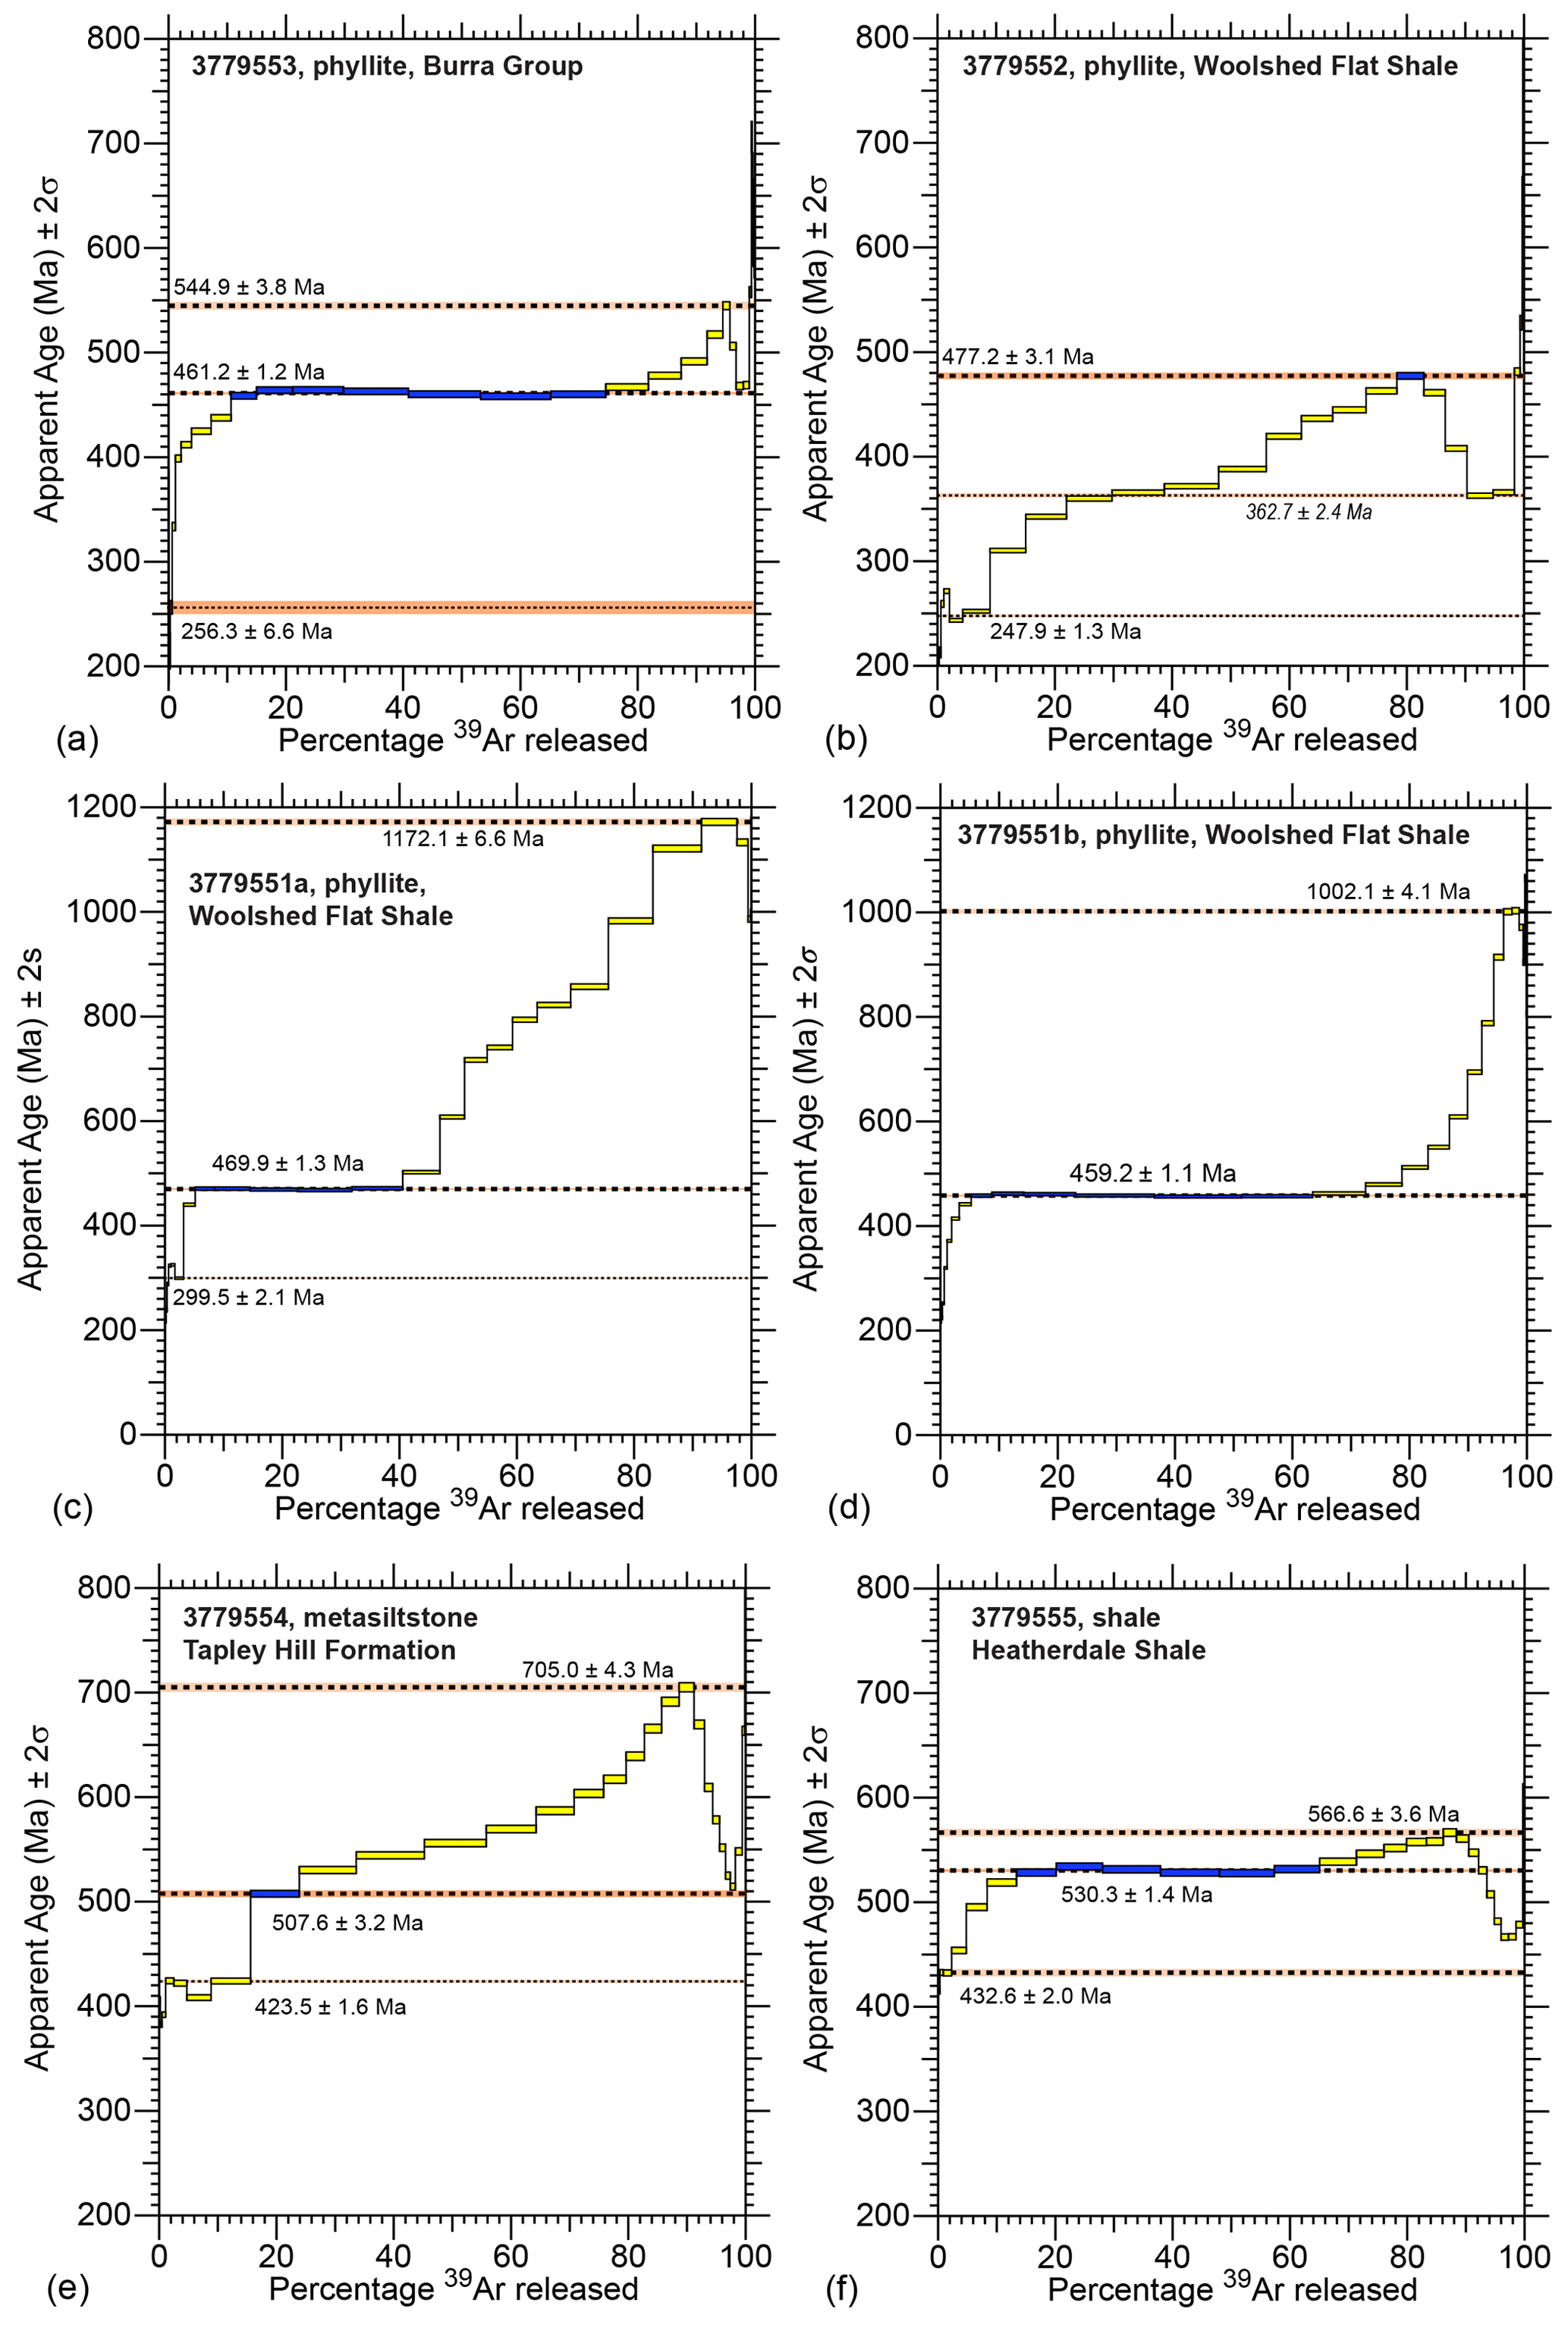
Figure 5Apparent age spectra for samples analysed in this study. Age limits and asymptote (italicised in sample 3779552) defined using criteria of Forster and Lister (2004). All data tables are given in Reid and Forster (2022). (a) Sample 3779553. (b) Sample 3779552. (c) Sample 3779551a. (d) Sample 3779551b. (e) Sample 3779554. (f) Sample 3779555.
Sample 3779552 yielded some of the youngest age data from the samples in this study, with ages steadily rising from as young as ca. 240 Ma to an upper limit of ca. 477 Ma (Fig. 5b). Finally, samples 3779554 and 3779555, from the lowest-metamorphic-grade portions of the orogen (chlorite zone), yield age spectra with limits of ca. 508 and 530.3 ± 1.4 Ma (defined by ∼ 50 % 39Ar released), respectively. These age spectra then increase in age to upper limits of ca. 705 and ca. 567 Ma, respectively. Both samples 3779554 and 3779555 have poorly defined lower limits ca. 430 Ma defined by the first 4 % to 17 % of 39Ar released, respectively.
6.1 Evaluation of 40Ar 39Ar data quality from low grade metamorphic rocks
To interpret the complex 40Ar 39Ar age spectra obtained, we firstly assess the reliability of the age data with respect to isotope correlation diagrams, the relative abundance of radiogenic argon (40Ar∗) and the abundance of Ca- and Cl-derived 37Ar and 38Ar and cross-referencing this with mineralogical data derived from HyLogger™. Appendix C provides the complete set of relevant figures for each sample related to these isotopic data.
In each of the samples, isotope correlation diagrams between 36Ar 40Ar and 39Ar 40Ar show a similar pattern (Appendix C). The first heating steps begin near the 36Ar 40Ar composition of air, track downwards towards very low values of 36Ar 40Ar. Most samples have 36Ar 40Ar values < 0.002 for most heating steps. Significantly, the heating steps from which weighted mean ages are defined in 3779553, 3779551a, 3779551b, and 3779555 all have 36Ar 40Ar values that are low and cluster. Typically, the final few steps in each sample trend towards higher 36Ar 40Ar values, possibly indicating release of 36Ar in the final heating steps as mineral phases begin to break down under the high-temperature furnace conditions.
Mirroring the patterns in the isotope correlation diagrams, the lower-temperature heating steps have correspondingly lower 40Ar∗ and often elevated Ca K and Cl K ratios (Appendix C). In some instances, this is correlated with younger ages, which may indicate recoil 39Ar loss affects the first few percent of the age spectra. For this reason, the ages derived from the early heating steps must be considered with caution; it is unclear if the ages from early heating steps will have geological significance. The elevated Ca and Cl values may further suggest argon from minerals such as plagioclase or chlorite may be influencing the ages from these lower-temperature heating steps.
Sample 3779554 has higher Ca K and Cl K ratios (Appendix C) than any other sample. Interestingly, this sample has a relatively high proportion of albite compared to microcline and muscovite as recorded by thermal infrared spectroscopy (Appendix A). The HyLogger™ data also suggests a relatively high abundance of both calcite and dolomite in this sample, which may also be contributing to the elevated Ca K ratios observed. The 40Ar∗ values are relatively consistent, and the isotope correlation diagram suggests relatively low atmospheric component, implying that most of the age data are reliable and likely represent mixing between at least two “virtual age components”, one with an upper limit of ca. 705 Ma and another with a lower limit of ca. 507 Ma.
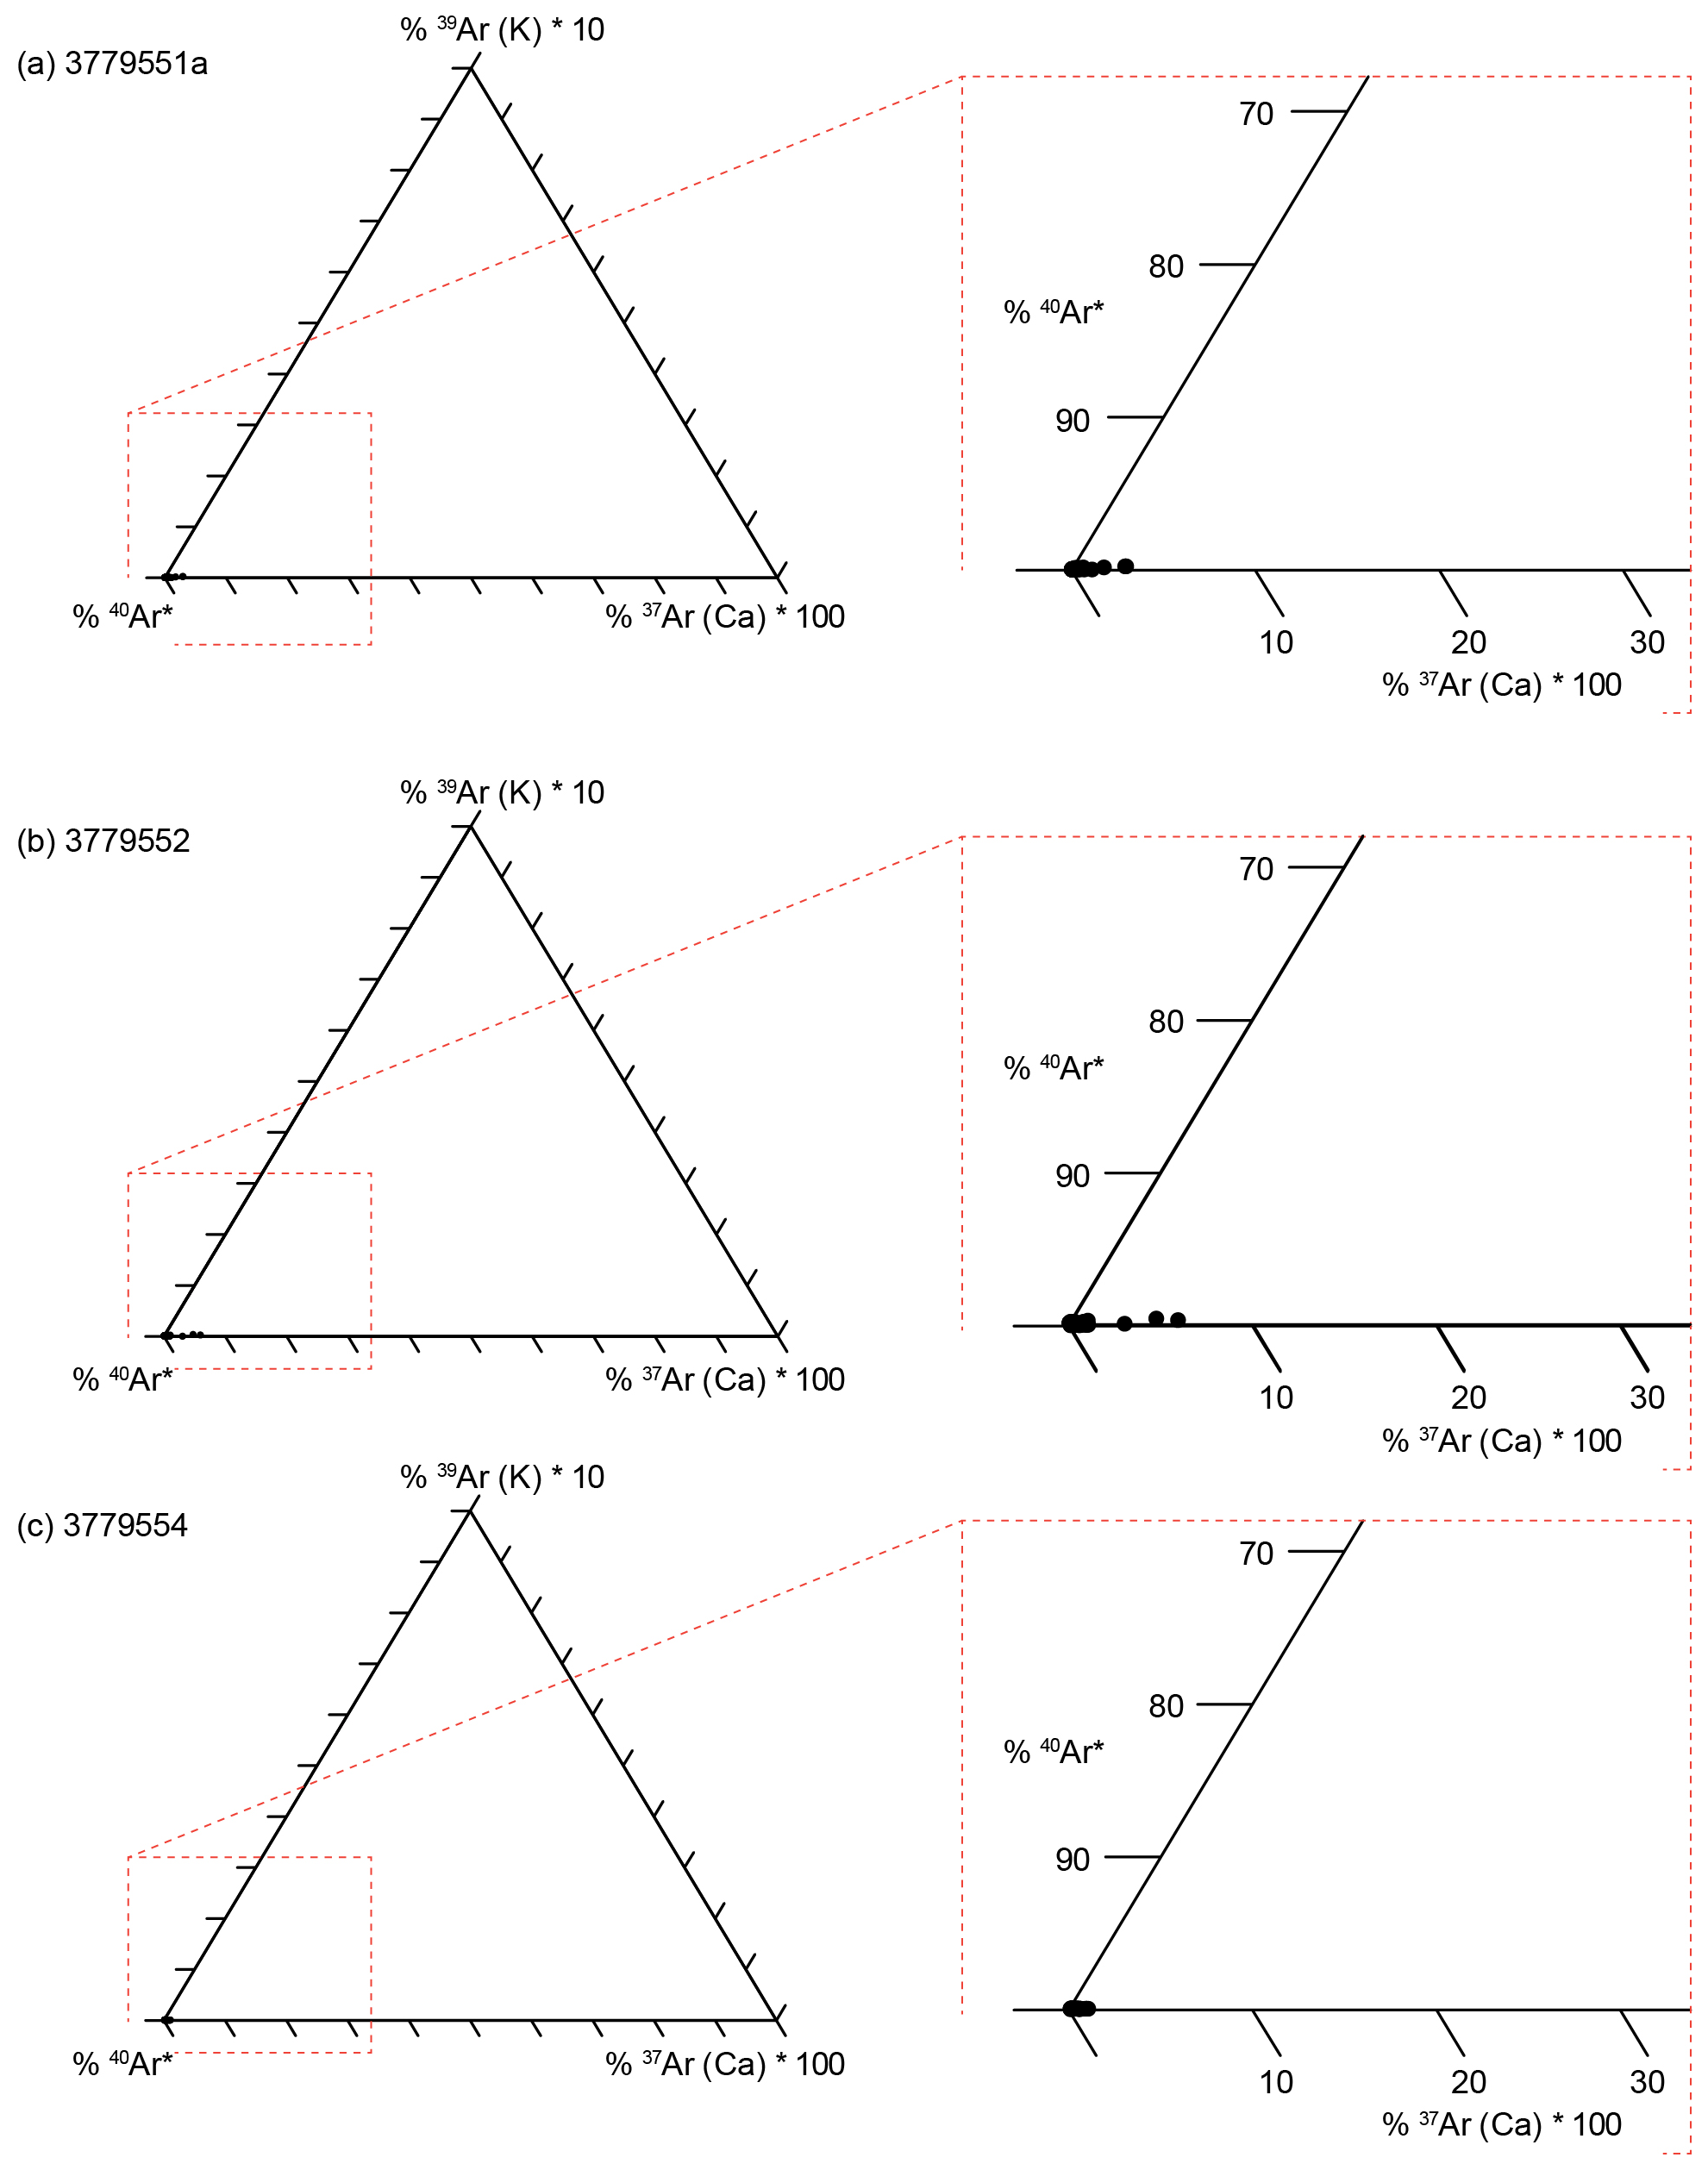
Figure 6Representative ternary diagram for argon step heating data for three samples from this study: (a) 3779551a, (b) 3779552. and (c) 3779554. These ternary diagrams are based on those presented by Popov et al. (2019) and plot percentages of 40Ar∗, K-derived 39Ar, and Cl-derived 37Ar, where the 39Ar(K) value is multiplied by 10 and the 37Ar(Ca) value is multiplied by 100. These multiplication factors are required to make the individual heating steps visible on the ternary diagram; without these factors the variation in these two values is not visible, being 2 or more orders of magnitude smaller than 40Ar∗ abundance.
One potential issue with low-grade metamorphic rocks is the presence of low temperature alteration (e.g. chlorite or clays) that can overprint the K-bearing phases such as muscovite, potentially leading to modification of the ages through recoil along fine-grained mineralogical intergrowths (e.g. Lo and Onstott, 1989; Foland et al., 1992; Di Vincenzo et al., 2003; Popov et al., 2019). Mineralogically, most samples are dominated by muscovite as the major K-bearing phase, although 3779554 and 3779555 have appreciable microcline in addition. Samples 3779551 and 3779553 contain chlorite, while sample 3779552 is dominated by chlorite (Appendix A). Ternary diagrams of 40Ar∗, K-derived 39Ar, and Cl-derived 37Ar reveal that 40Ar∗ abundance dwarfs any contribution made by K- and Cl-derived argon, although we note the relatively large contribution of Ca-derived Ar to sample 3779552 (Fig. 6). This, together with the discordance in the age spectrum, the variance in the isotope correlation diagram, and the relatively large 37Ar contribution suggest the results from this sample need to be treated with some caution. For the remaining samples, however, we can be relatively confident that the age data from the high-40Ar∗ heating steps is robust and can be interpreted to have geological significance.
6.2 Interpretation of complex 40Ar 39Ar age spectra from low grade metamorphic rocks
Now that we can say with some confidence that most of our age data are not significantly influenced by alteration, recoil, or other mineralogical effects, we turn to the problem of interpreting the complex age spectra themselves. In general, age spectra that have more than one plateau or plateau-like segment can be interpreted as containing a mixture of age populations or virtual age components. Interpretation of such mixtures has been discussed in detail by Forster and Lister (2004), the key point being that mixtures can preserve or partially preserve information on the timing of earlier episodes of cooling and/or deformation. Analysis of age spectra using asymptotes and limits enables maximum and minimum constraints to be placed on the timing of the various events that the rock has been subjected to (Forster and Lister, 2004).
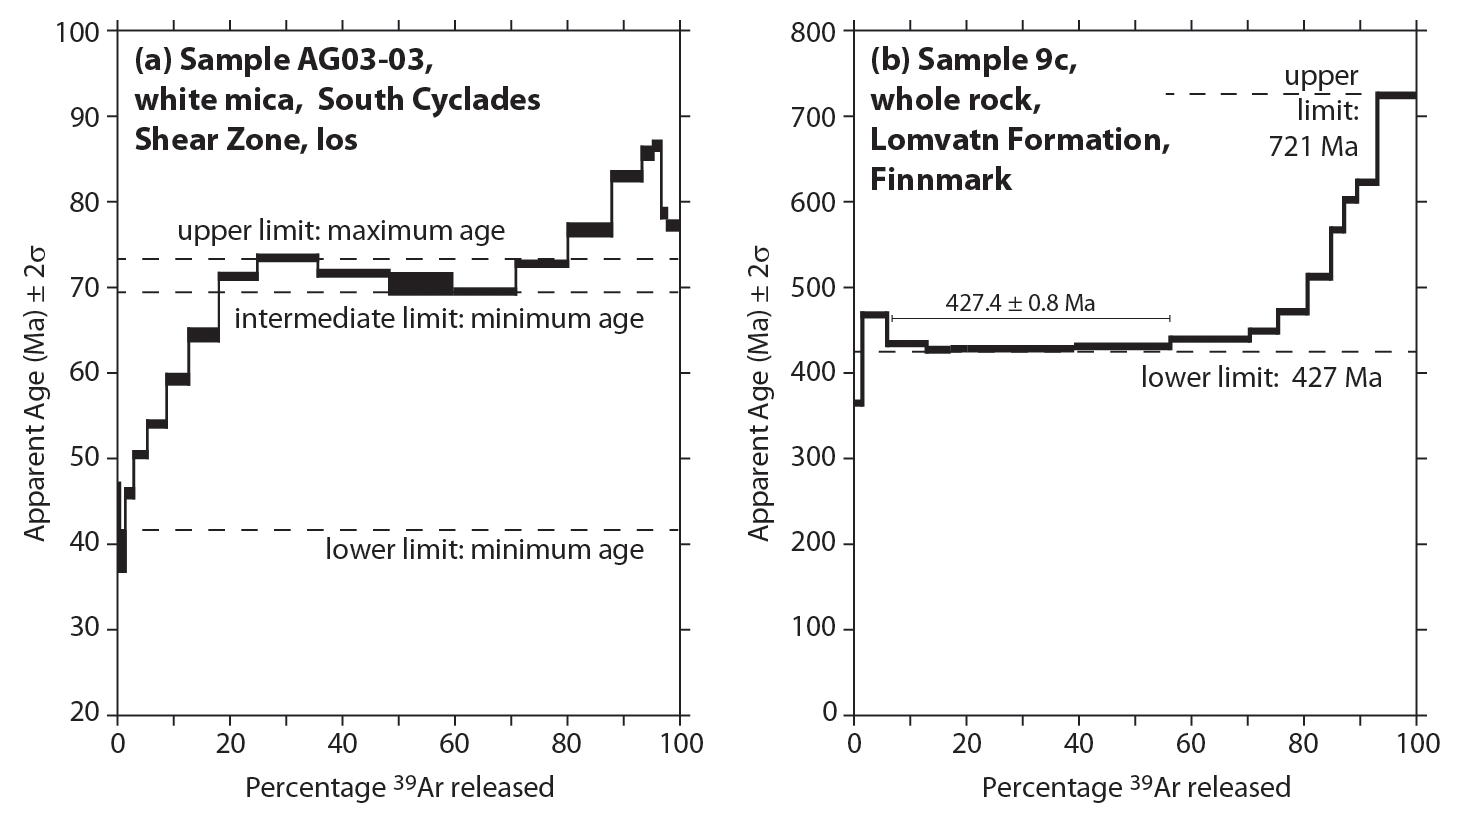
Figure 7Examples of complex age spectra obtained from mixtures of minerals with different microstructural and microchemical compositions. (a) Sample of white mica from South Cyclades Shear Zone, Ios, Greece, data from Forster and Lister (2009). The data are interpreted to contain three limits. The upper and intermediate age limits are interpreted by Forster and Lister (2009) to reflect recrystallisation ages in fabrics that are relict from their earlier deformation, while the younger limit reflects partial modification of the age spectrum during Hercynian amphibolite facies metamorphism (ca. 45 Ma). (b) Whole rock slate analysis from Dallmeyer et al. (1988). The sample contains both detrital mica and a cleavage, with the ca. 427 Ma lower limit interpreted to reflect the timing of cleavage formation, while the older ages reflect the influence of detrital minerals with higher argon retentivity (Dallmeyer et al., 1988).
In multiply deformed tectonites, a record of earlier microstructures can be preserved, especially in cases where the temperatures and timescale at which cooling, deformation, and recrystallisation occurred are not sufficiently strong so as to completely outgas any older, relict mineral phases that may be present. Examples of this have been documented in analyses of white mica from the South Cyclades Shear Zone, Ios, Greece, where the complex age spectra reflect partial resetting during younger tectonic movement of the shear zone in places with opposite kinematics (Fig. 7a; Forster and Lister, 2009). Similar staircase age profiles with upper and lower limits have also been measured by whole-rock 40Ar 39Ar analyses of phyllite from the Caledonian Orogen, Norway (Fig. 7b; Dallmeyer et al., 1988). In the latter example, age gradients were interpreted to reflect incomplete resetting of fine-grained white mica during a Caledonian thermal event linked to emplacement of fold nappes onto the Baltic Shield (Dallmeyer et al., 1988). Numerous samples in our case study have very similar age profiles to those identified by Dallmeyer et al. (1988).
6.3 Detrital 40Ar 39Ar signatures
Comparison of the different age spectra from our study reveals several features, which can be compared with the known depositional ages for the stratigraphic units as well as the timing of the Delamerian Orogeny established from higher grade regions of the orogen (Fig. 8). Firstly, the data reveal the presence of older ages that can be interpreted to be derived from detrital minerals preserved. The transport and deposition of K-bearing minerals can mean the 40Ar 39Ar signature of minerals within sedimentary rocks is representative of events in the source region, rather than indicative of new mineral growth or resetting. This principle has been applied in many settings to reconstruct the early history of orogenic regions now eroded (Stuart, 2002; Blewett et al., 2019), such as in the continental foreland basin of the Himalayas (Najman et al., 1997) and the Lachlan Orogen of eastern Australia (Fergusson and Phillips, 2001).
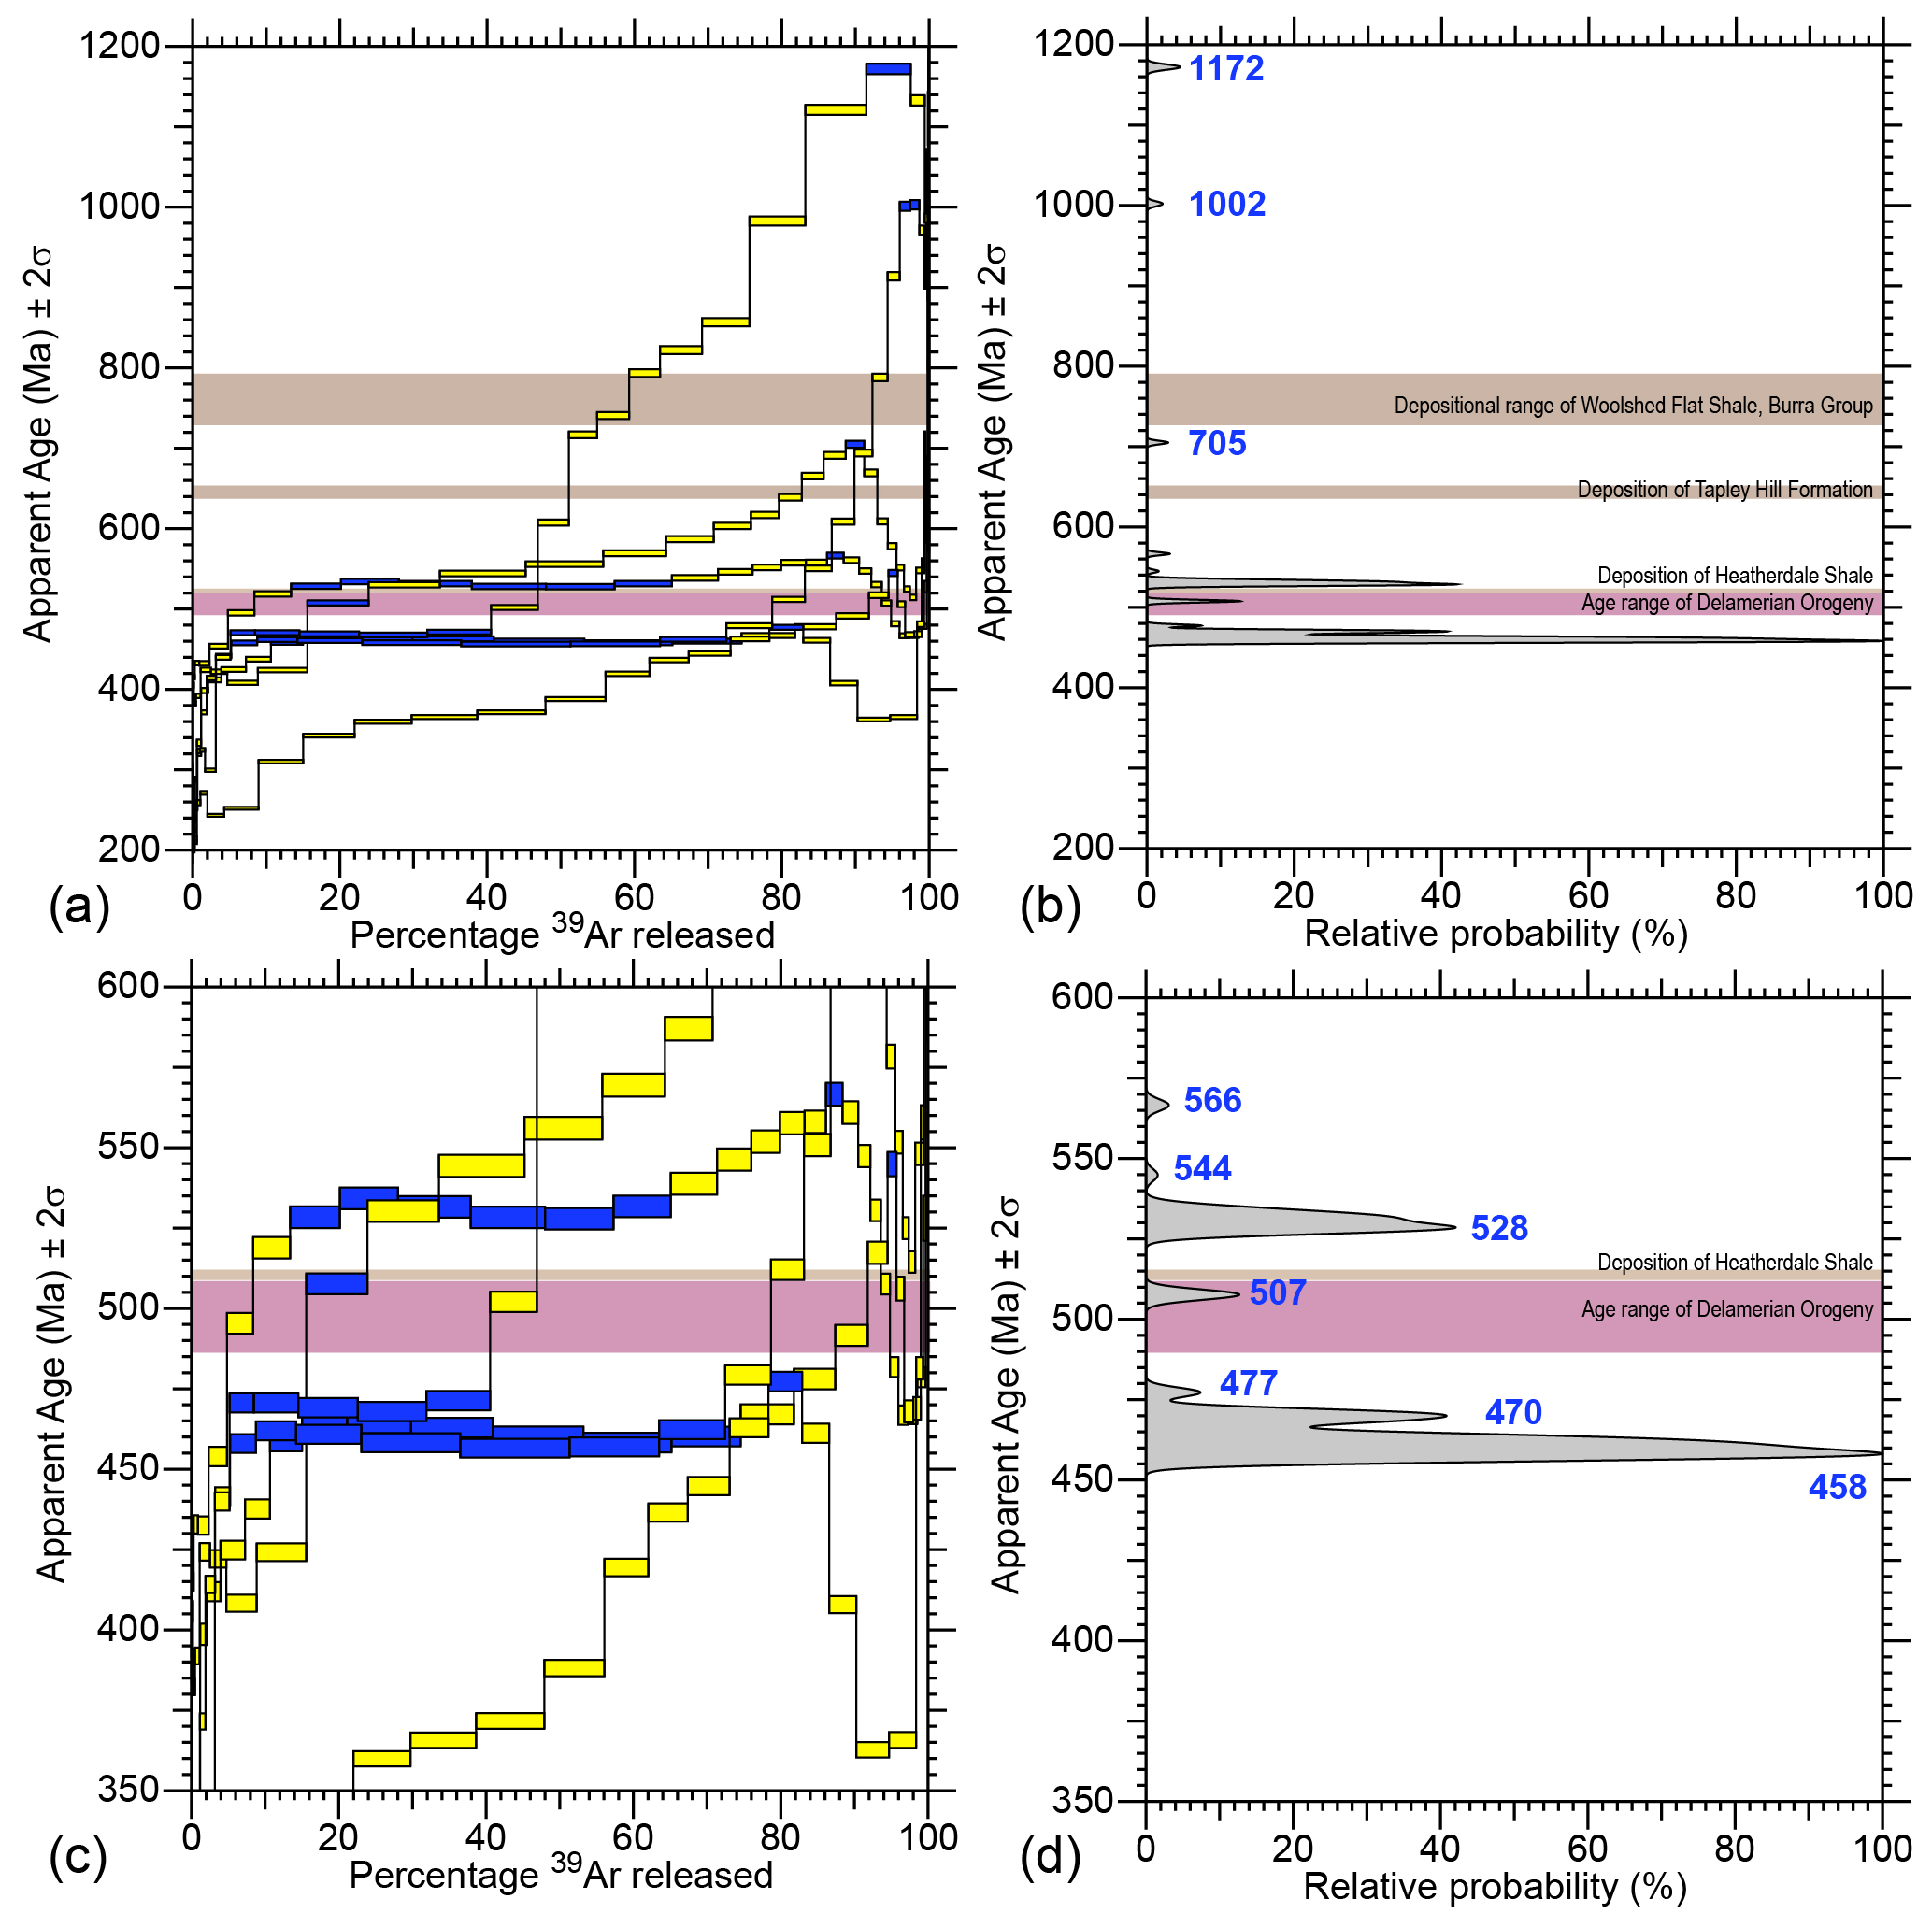
Figure 8Synoptic plots that combine all age spectra and pooled Gaussian probability plots for the limits identified in each spectrum from this study. Steps highlighted in blue have either been combined into pooled ages or are given as age limits. Gaussian plots are calculated using the program eArgon and the methods described in detail by Muston et al. (2021). (a) Synoptic plot from 200 to 1200 Ma. (b) Gaussian probability plot from 200 to 1200 Ma. (c) Detailed synoptic plot from 350 to 600 Ma. (d) Detailed Gaussian probability plot from 350 to 600 Ma.
Two samples of the Woolshed Flat Shale of the Burra Group yield upper age limits of 1002 and 1172 Ma (samples 3779551a and 3779551b) that are older than the ca. 790–730 Ma depositional age range for this unit (Preiss, 2000; Lloyd et al., 2020). Hyperspectral analysis of sample 3779551 shows the dominant K-bearing mineral in the rock is muscovite. These Mesoproterozoic ages potentially reflect input of muscovite derived from the Musgrave Province or equivalent terranes of central Australia, as similar detrital ages are recorded in detrital zircon U–Pb studies of other rocks from the Adelaide Superbasin (Ireland et al., 1998; Keeman et al., 2020; Lloyd et al., 2020). The ages are also consistent with the range of Mesoproterozoic 40Ar 39Ar ages obtained by single-grain laser fusion methods by Haines et al. (2004) from other Neoproterozoic units in the region.
A third sample from the Burra Group, also dominated by muscovite in the hyperspectral data, yields a younger upper limit of 544 Ma (sample 3779553), considerably younger than the depositional age of the unit. In this sample, around 70 % of the 39Ar release produces a pooled age of ca. 461 Ma, with only the final ∼ 17 % of gas release stepping upwards to older ages. This may suggest thermal and or microstructural overprinting that has had the effect of drawing down the age of pre-existing age components in a sample. Indeed, the difference in both the shape of the age spectra and the upper age limit between the two Woolshed Flat Shale samples, 3779551a and 3779551b, also suggests that thermal and or microstructural overprinting has had a variable effect on these aliquots. The difference in these age spectra suggests that variation in the degrees of rate of cooling and or degree of recrystallisation in high-strain zones can affect the 40Ar 39Ar composition of fine-grained rocks, a result that mirrors the variation in recrystallisation documented in the shear zones of Ios by Forster and Lister (2009).
The remaining samples in this study yield apparent ages closer to their depositional age. Sample 3779554 yields an upper limit of 709 Ma. The maximum depositional age of the Tapley Hill Formation is 654 ± 13 Ma (U–Pb zircon; Lloyd et al., 2020) and is very similar to the Re–Os date of 643.0 ± 2.4 Ma for the shale (Kendall et al., 2006), suggesting that the age of the detrital minerals recorded by the 40Ar 39Ar data is at least ∼ 55 million years older than the depositional age. This sample is a laminated metasiltstone with a spaced cleavage and contains both microcline and muscovite in similar proportions. The complexity in the age spectrum therefore relates to both variation in the relative contribution of K-feldspar and muscovite, as well as the probable influence of the formation of the spaced cleavage, which may have induced variable recrystallisation. The upper limit in the 40Ar 39Ar data is therefore a minimum estimate for the age of the detrital component.
The lowest metamorphic grade sample and the one with the least degree of strain is of the Heatherdale Shale. This unit lies at the top of the Early Cambrian Normanville Group and contains tuffaceous zircons that crystallised at 514.98 ± 0.22 Ma (Betts et al., 2018), which constrains the timing of deposition. In our data, the Heatherdale Shale sample has an upper age limit of 566.6 ± 3.6 Ma, and around 50 % of 39Ar samples released define a single age component of 530.3 ± 1.4 Ma. Both ages are older than deposition of the Heatherdale Shale, and given that the rock is weakly deformed and underwent very low-grade metamorphism (chlorite facies from the regional metamorphic grade map, see Fig. 2), these ages must represent detrital mineral ages within the sample. The age spectrum suggests that very little of the K-bearing mineral in the shale has been reset either by diagenetic modification or by younger tectonothermal processes. The minimal modification to the apparently detrital 40Ar 39Ar ages in this sample is consistent with the Heatherdale Shale being the stratigraphically youngest and least metamorphosed rock in this sample set.
In their single-grain laser fusion 40Ar 39Ar study, Haines et al. (2004) show that the Carrackalinga Head Formation, which directly overlies the Heatherdale Shale, has detrital muscovite ages at ca. 550–600 Ma and a minor peak at ca. 950 Ma. The similarity to our data from the Heatherdale Shale supports the notion that very little resetting of the 40Ar 39Ar system has occurred in the detrital minerals of these units. We note, however, that assigning geological significance to the specific ages in our data set is difficult as both muscovite and microcline is present in the sample according to HyLogger™ data. Consequently, it is not certain if the ages record cooling of, for example, muscovite in the source region at ca. 566 Ma and microcline at ca. 530 Ma (or vice versa) or if both virtual age components are indeed mixtures of gas from both minerals. Further work on this sample could include attempts at mineral separation at a fine scale to resolve detrital 40Ar 39Ar ages from the Heatherdale Shale.
6.4 Evidence for the ca. 514–490 Ma Delamerian Orogeny in low-grade rocks from the Delamerian Orogen
In the Delamerian Orogen, syn-tectonic granites were emplaced at ca. 514–500 Ma and post-tectonic granites were emplaced at ca. 490–470 Ma, which bracket the timing of deformation to between ca. 514–490 Ma (Foden et al., 2006, 2020). Somewhat surprisingly, only sample 3779554 of the Tapley Hill Formation has an age limit within the ca. 514–490 Ma time range (Fig. 7). This limit is defined by a single step at ca. 507 Ma at the start of the staircase age spectrum for this sample, which then rises to older ages derived from detrital or partially reset detrital minerals as discussed above. Where we have sampled it, the Tapley Hill Formation contains a weakly spaced cleavage and lies within the chlorite isograd (see Fig. 2), suggesting relatively shallow burial, and it is possible that the ca. 507 Ma age in this sample reflects the time at which this spaced cleavage formed. Nevertheless, in terms of frequently measured ages from this data set, evidence for recrystallisation or cooling during the ca. 514–490 Ma Delamerian Orogeny is conspicuously absent.
The major 40Ar 39Ar age populations from this study instead lie between ca. 470 and ca. 458 Ma (see Fig. 7d). These derive from muscovite- and chlorite-rich phyllite samples in the north of the study area, which are more deformed than either the Tapley Hill Formation or Heatherdale Shale samples. These more deformed samples all have between 35 % and 55 % gas release defining the ages between ca. 470 and ca. 458 Ma. We note that sample 3779552 yields an upper limit of ca. 477 Ma age, which is defined by a single step and is of uncertain geological significance given the discordance of the age spectrum and the abundance of chlorite in this sample. We therefore focus the following discussion on the remaining samples and the ages between ca. 470 and ca. 458 Ma, while recognising that further sampling may reveal age populations that are older than ca. 470 Ma and therefore closer to the age of the Delamerian Orogeny recorded from higher-grade zones within the orogen. The age data from this study suggest that geological processes were operating in the western, low-grade region of the orogen some 20 to 32 million years after deformation in the high-grade region.
While our study has shown younger ages than the main time interval indicated for the Delamerian, we note that Turner et al. (1994, 2009) have also attempted to date low-grade rocks from the orogen and instead produced ages older than the typically quoted ages for Delamerian orogenesis. The single muscovite laser step-heating 40Ar 39Ar age spectrum obtained by Turner et al. (2009) is very similar in form to the age spectra obtained in our study. Turner et al. (2009) averaged a series of steps early in the heating experiment to yield an age of 533 ± 15 Ma, which they interpret as the timing of cleavage formation. The higher-temperature heating steps had significantly older ages (ca. 850–900 Ma), and they were interpreted as detrital in origin. If we reinterpret the muscovite sample of Turner et al. (2009) using the method of asymptotes and limits (Forster and Lister, 2004), the age spectra has a lower limit of 499 ± 27 Ma (step 8 in their sample 01-HC-01). This could provide an alternative estimate of the timing of cleavage formation, with the remainder of the spectrum being a result of mixing between this younger limit and older detrital mineral ages. We note however, that Turner et al. (2009) present complementary Rb Sr data on the same sample with an age of 554 ± 10 Ma, which they use to support the older age for the timing of cleavage formation in these rocks. Turner et al. (2009) rule out mixing of older and younger populations in their analysis; however, considerable uncertainty remains about the significance of the Turner et al. (2009, 1994) Rb Sr isotopic data as it is limited to a single locality (see also the discussion in Preiss, 1995b).
6.5 Cooling ages or deformation ages in fine grained samples
Regarding the ca. 470–458 Ma frequently measured ages obtained in our 40Ar 39Ar data, we explore the following two interpretations as to their significance.
-
These ages record passive cooling below the closure temperature or closure temperature range of the K-bearing minerals from an earlier deformation event that occurred above the closure temperatures of the component minerals.
-
These ages record the timing of recrystallisation of the minerals in the phyllite samples and therefore date the timing of deformation itself.
It is possible that the very fine-grained nature of the samples means that the K-bearing minerals in the samples may have remained open to argon diffusion longer than might be expected if the samples were coarser grained since the rate of diffusion is in part dependent on distance. As a result, fine-grained samples may have continued to “leak” argon until ca. 470–458 Ma when they were exhumed to shallow enough crustal levels to cool sufficiently to begin to retain radiogenic argon. In such a scenario, the shape of the age spectra itself can provide information on the thermal evolution of a sample of a mixture of grains of different argon retentivity. Prolonged cooling through a range of “closure temperatures” in the detrital minerals and newly grown metamorphic mica may be expected to yield a staircase pattern in the age spectra as a result of different argon “reservoirs” in the rock cooling through a range partial argon retention zones (Forster and Lister, 2004, 2010). In our study, this type of staircase pattern is best exemplified by sample 3779554, in which over 85 % of the age spectrum is a mixture between a minimum of ca. 507 Ma and a maximum of ca. 705 Ma. The weak cleavage in this sample supports the notion that most of the K-bearing mineral in the sample is detrital, with only a minor proportion being newly grown mica, possibly grown during formation of the spaced cleavage in the Delamerian Orogeny.
If, on the other hand, more of the K-bearing minerals recrystallise during the deformation, one may expect to see a proportionally greater percentage of the age spectrum recording the younger age population. In such cases, the first portion of the age spectrum is likely to be a coherent age population (e.g. a plateau) derived from fine-grained, less retentive newly grown mica, which transitions via a staircase pattern to older ages that are caused by the presence of incompletely reset or recrystallised detrital minerals. If small degrees of recrystallisation occurred, then we can reasonably expect to see only a small portion of the gas in the age spectrum to record the recrystallisation event. In our study, samples 3779553, 3779551a, and 3779551b all show staircase-like age spectra with younger plateau segments stepping upwards to older ages. These samples are the most deformed of the samples we have analysed and have the highest proportion of muscovite in the mineralogical data, with little evidence for microcline when compared to the samples from lower strain (3779554, 3779555). One possible interpretation is that the higher degree of strain in these samples resulted in the breakdown of any possible detrital K-feldspar to form newly grown muscovite (and or biotite).
In general, phyllite forms at sub-greenschist to lower-greenschist facies temperatures (∼ 200–300 ∘C), with the dominant mineral assemblage being muscovite + chlorite + quartz (e.g. Palin and Dyck, 2021), which is the mineral assemblage of the phyllites sampled in this study. The ∼ 200–300 ∘C temperature window is at the lower end of the spectrum of closure temperature windows expected for muscovite, which can be highly retentive depending on the composition (e.g. Harrison et al., 2009; Nteme et al., 2022). Therefore, we suggest that it is possible to interpret the plateau-like segments in our data from natural phyllites as recording the timing of muscovite recrystallisation and or growth in these rocks. We note also that in their study of thrust sheets in the Norwegian Caledonides, Dallmeyer et al. (1988) show age spectra with very similar profiles resulting from deformation in the footwall of a thrust, with the most deformed samples showing the increase in the percentage of the “young” ages caused by thrusting (Fig. 6). The data presented here from the Delamerian Orogen have similar characteristics and can also be interpreted to indicate recrystallisation of mica during deformation in the zones of phyllite at ca. 470–458 Ma. To further investigate the possibility that the ages recorded in our study from the zones of phyllite are a result deformation, more samples could be taken progressively further away from the thrust zones to investigate changes in argon age related to variation in factors such as deformation intensity, grain size, and mineralogy of the shear zones.
If we interpret at least three of the age spectra presented here as recording the timing of deformation in the phyllitic thrusts at the western edge of the Delamerian Orogen, this implies that deformation in these thrust sheets was active at ca. 470–458 Ma, which is at least 20 million years after the cessation of deformation in the high-metamorphic-grade regions of the orogen recorded in the ages of syn- to post-tectonic igneous intrusion (Foden et al., 2006). This interpretation produces several complications regarding how to account for the structural geology of the region. In the western Delamerian Orogen, cleavage foliations are axial planar to major regional folds, with the intensity of cleavage development increasing and the orientation of the cleavage becoming shallower (east-dipping) especially on lower fold limbs, culminating in shear zones such as the ones sampled in this study (see fault-related folding in the cross sections in Fig. 3 and the balanced cross sections of Flottmann and James, 1997; Flottmann et al., 1998). While it is possible that out of sequence thrusting could have occurred late in the deformation history after the main period of Delamerian deformation, the continuity of structure from low- to high-metamorphic-grade regions across the orogen raises the possibility that the ca. 470–458 Ma ages record only the last phase of deformation in these thrust sheets, rather than the timing of inception of the thrusts themselves. We suggest a likely scenario is that these deformation zones are reactivated zones of weakness formed during earlier phases of the Delamerian Orogeny and possibly even earlier, as some of these structures formed during the Neoproterozoic and Cambrian rifting (Preiss, 1995a; Flottmann and James, 1997; Flottmann et al., 1998; Preiss, 2019). Therefore, although the ca. 470–458 Ma ages are younger than the main ages for Delamerian deformation elsewhere in the orogen and were a surprising outcome of this study, there is no reason why these fault zones could not have been active (or continued to be active) during younger periods of deformation. Indeed, continued reactivation of older structures throughout the Phanerozoic is a feature of faults of the Mt. Lofty Ranges, as detailed by Preiss (2019).
The ca. 470–458 Ma activity recorded in our samples from thrusts of the western portion of the Delamerian Orogen is potentially related to far-field tectonic drivers along the then-active eastern margin of Gondwana, now preserved in the adjacent Lachlan Orogen. Whilst tectonism associated with plate margin processes to the east prior to ca. 470 Ma had been primarily focused into the locally weak continental rift and back-arc basin, stabilisation of the Delamerian Orogen by ca. 480 Ma may have facilitated far-field stresses being then transmitted across the whole orogen from the paleo-Pacific eastern margin of the Australian continent. The paleo-Pacific underwent several cycles of arc magmatism, accretionary tectonics, deformation and slab rollback during the Paleozoic (e.g. Glen, 2013; Rosenbaum, 2018, and others) and is an example of an extensional accretionary orogen (Collins, 2002; Kemp et al., 2009). Between ca. 511 and ca. 500 Ma, arc magmatism was concentrated in the Staveley Arc adjacent a west-dipping subduction system (Cayley and Skladzien, 2018; Lewis et al., 2018) and was broadly contemporaneous with the Delamerian Orogeny in the South Australian portion of the system. Intra-oceanic arc magmatism in the Macquarie Arc initiated outboard of this system as early as ca. 503 Ma and continued to evolve through the Ordovician and into the Silurian (Kemp et al., 2020). Intriguingly, detailed stratigraphy and geochronology of the Macquarie Arc shows a series of “phases” of magmatism and sedimentation, with the initial phase followed by a volcanic hiatus of ca. 8 Myr between ca. 474 and 466 Ma (Glen et al., 2012). Although no precise correlation is necessarily implied, this hiatus in the Macquarie Arc partly corresponds to the timing of deformation inferred from the thrust zones in the Delamerian Orogen dated in this study. This may suggest there was some type of mechanical link between subduction dynamics along the paleo-Pacific margin and the activity along Delamerian thrust systems far inboard from the active margin.
Isotopic analyses of low-grade metamorphic rocks can be difficult to interpret as they are a mixture of detrital and newly grown diagenetic or metamorphic minerals. As a consequence of this mixing, the isotopic signals from each of these components are not necessarily easy to resolve. In this study, we have applied the 40Ar 39Ar method with careful furnace step heating analysis of whole rock samples of low-grade metamorphic rocks. Key to interpreting the complex 40Ar 39Ar age spectra thus derived is the idea that the shape of the spectra themselves is informative as to the nature of the various gas reservoirs in a sample and limits within the spectra define minimum and maximum ages for these components (Forster and Lister, 2004, 2009). In addition, examination of isotope correlation diagrams and ternary plots of 40Ar∗, 39Ar(K), and 37Ar(Ca) reveal the majority of gas in our samples is indeed radiogenic 40Ar∗, with the possible exception of one sample that has a significant proportion of chlorite. Data from this study shows that the Neoproterozoic rocks of the southern Delamerian Orogen preserve detrital mineral components up to ca. 1172 Ma in age, while Cambrian shale yields detrital mineral components with ages of ca. 567 and ca. 530 Ma, closer to the age of deposition.
The younger limits in our data occur in phyllitic samples with age segments at ca. 470–458 Ma, which is at least 20 million years younger than the timing of the Delamerian Orogeny documented from studies of granitic intrusions and amphibolite grade metamorphic fabrics (Foden et al., 2006, 2020). Two interpretations of the younger age components are that they record (1) regional cooling or (2) deformation-induced recrystallisation at temperatures cooler than the closure temperature windows for the main K-bearing minerals in the phyllite. The second interpretation implies that some zones of phyllite in the Delamerian Orogen were active after the main phase of deformation recorded in higher-metamorphic-grade regions of the orogen. Potential coupling of stress transmitted from the distal plate margin along the paleo-Pacific margin of eastern Gondwana with the far-field continental interior may explain the (re)activation of some shear zones in the Delamerian Orogen. Further work is required to test these hypotheses; however, the new data point to the possibility that widespread application of this methodology, likely in combination with other methods such as Rb–Sr dating (e.g. Zack and Hogmalm, 2016), is a pathway forward for analysis of low-grade metamorphic rocks. Certainly, the 40Ar 39Ar method is complementary to analysis of metamorphic rocks from higher-grade regions within orogens by other isotopic methods (e.g. zircon, monazite U–Pb) and provides for an holistic understanding of orogenic regions.
A1 Hyperspectral mineralogy methods
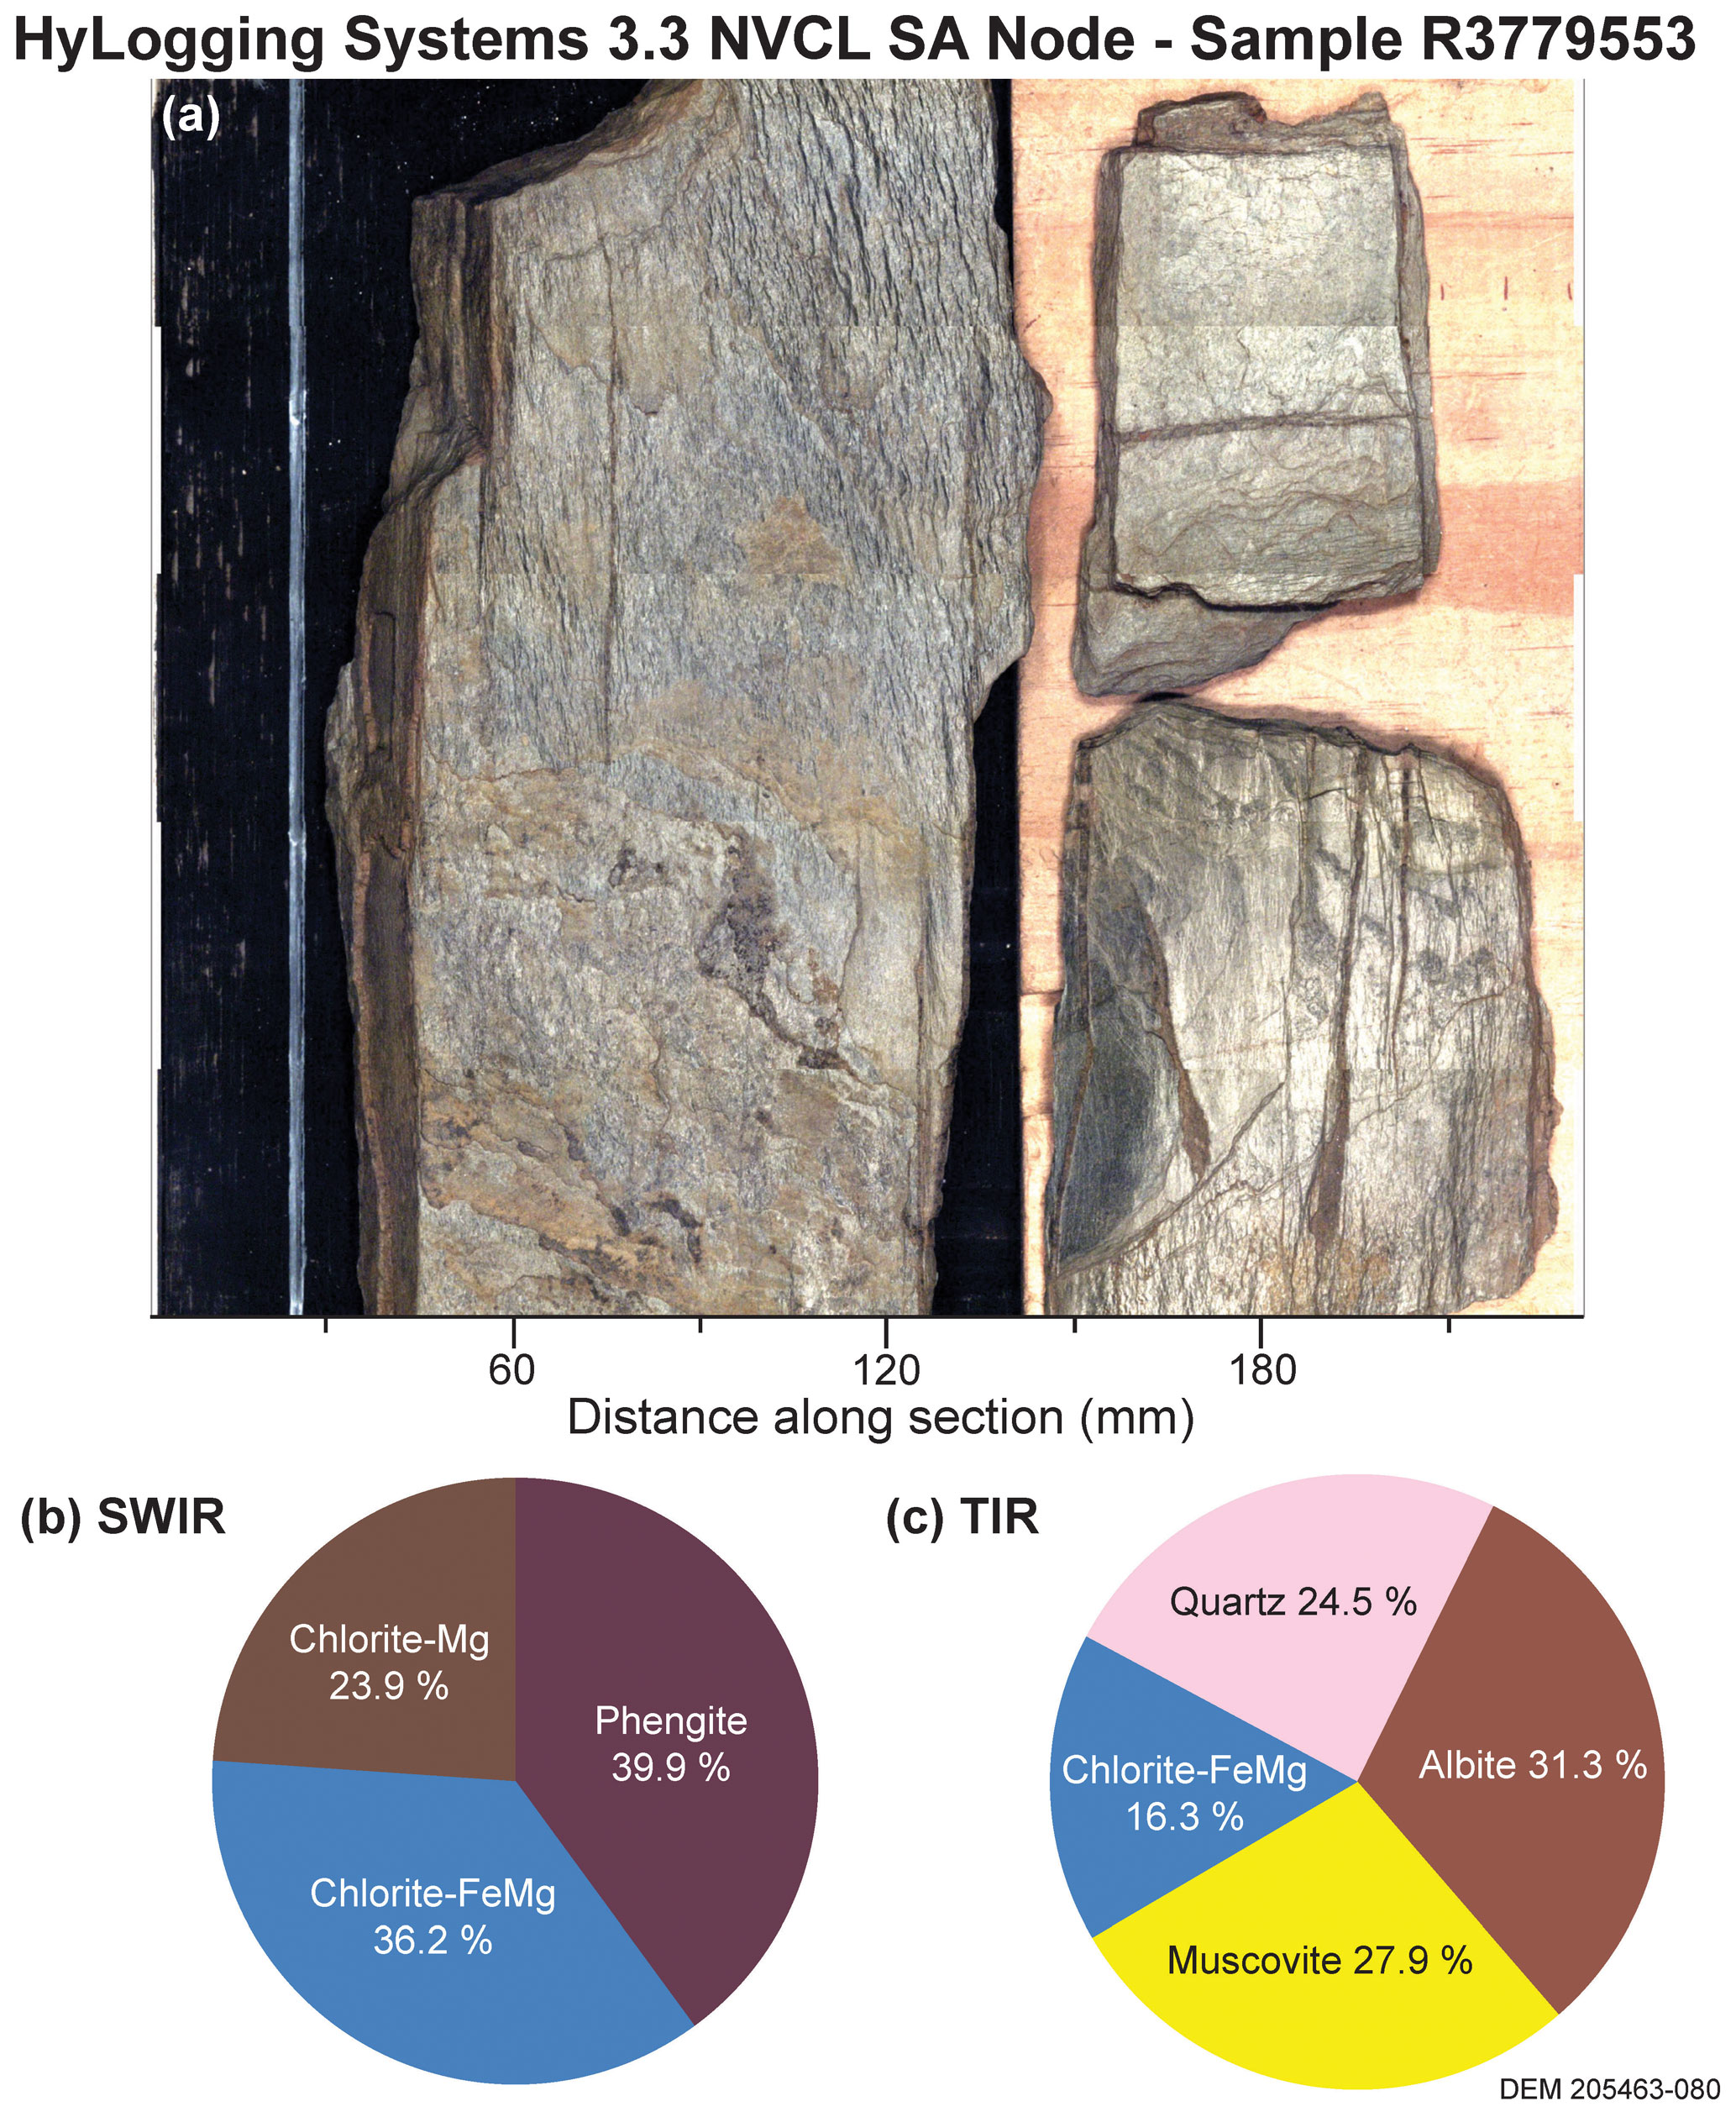
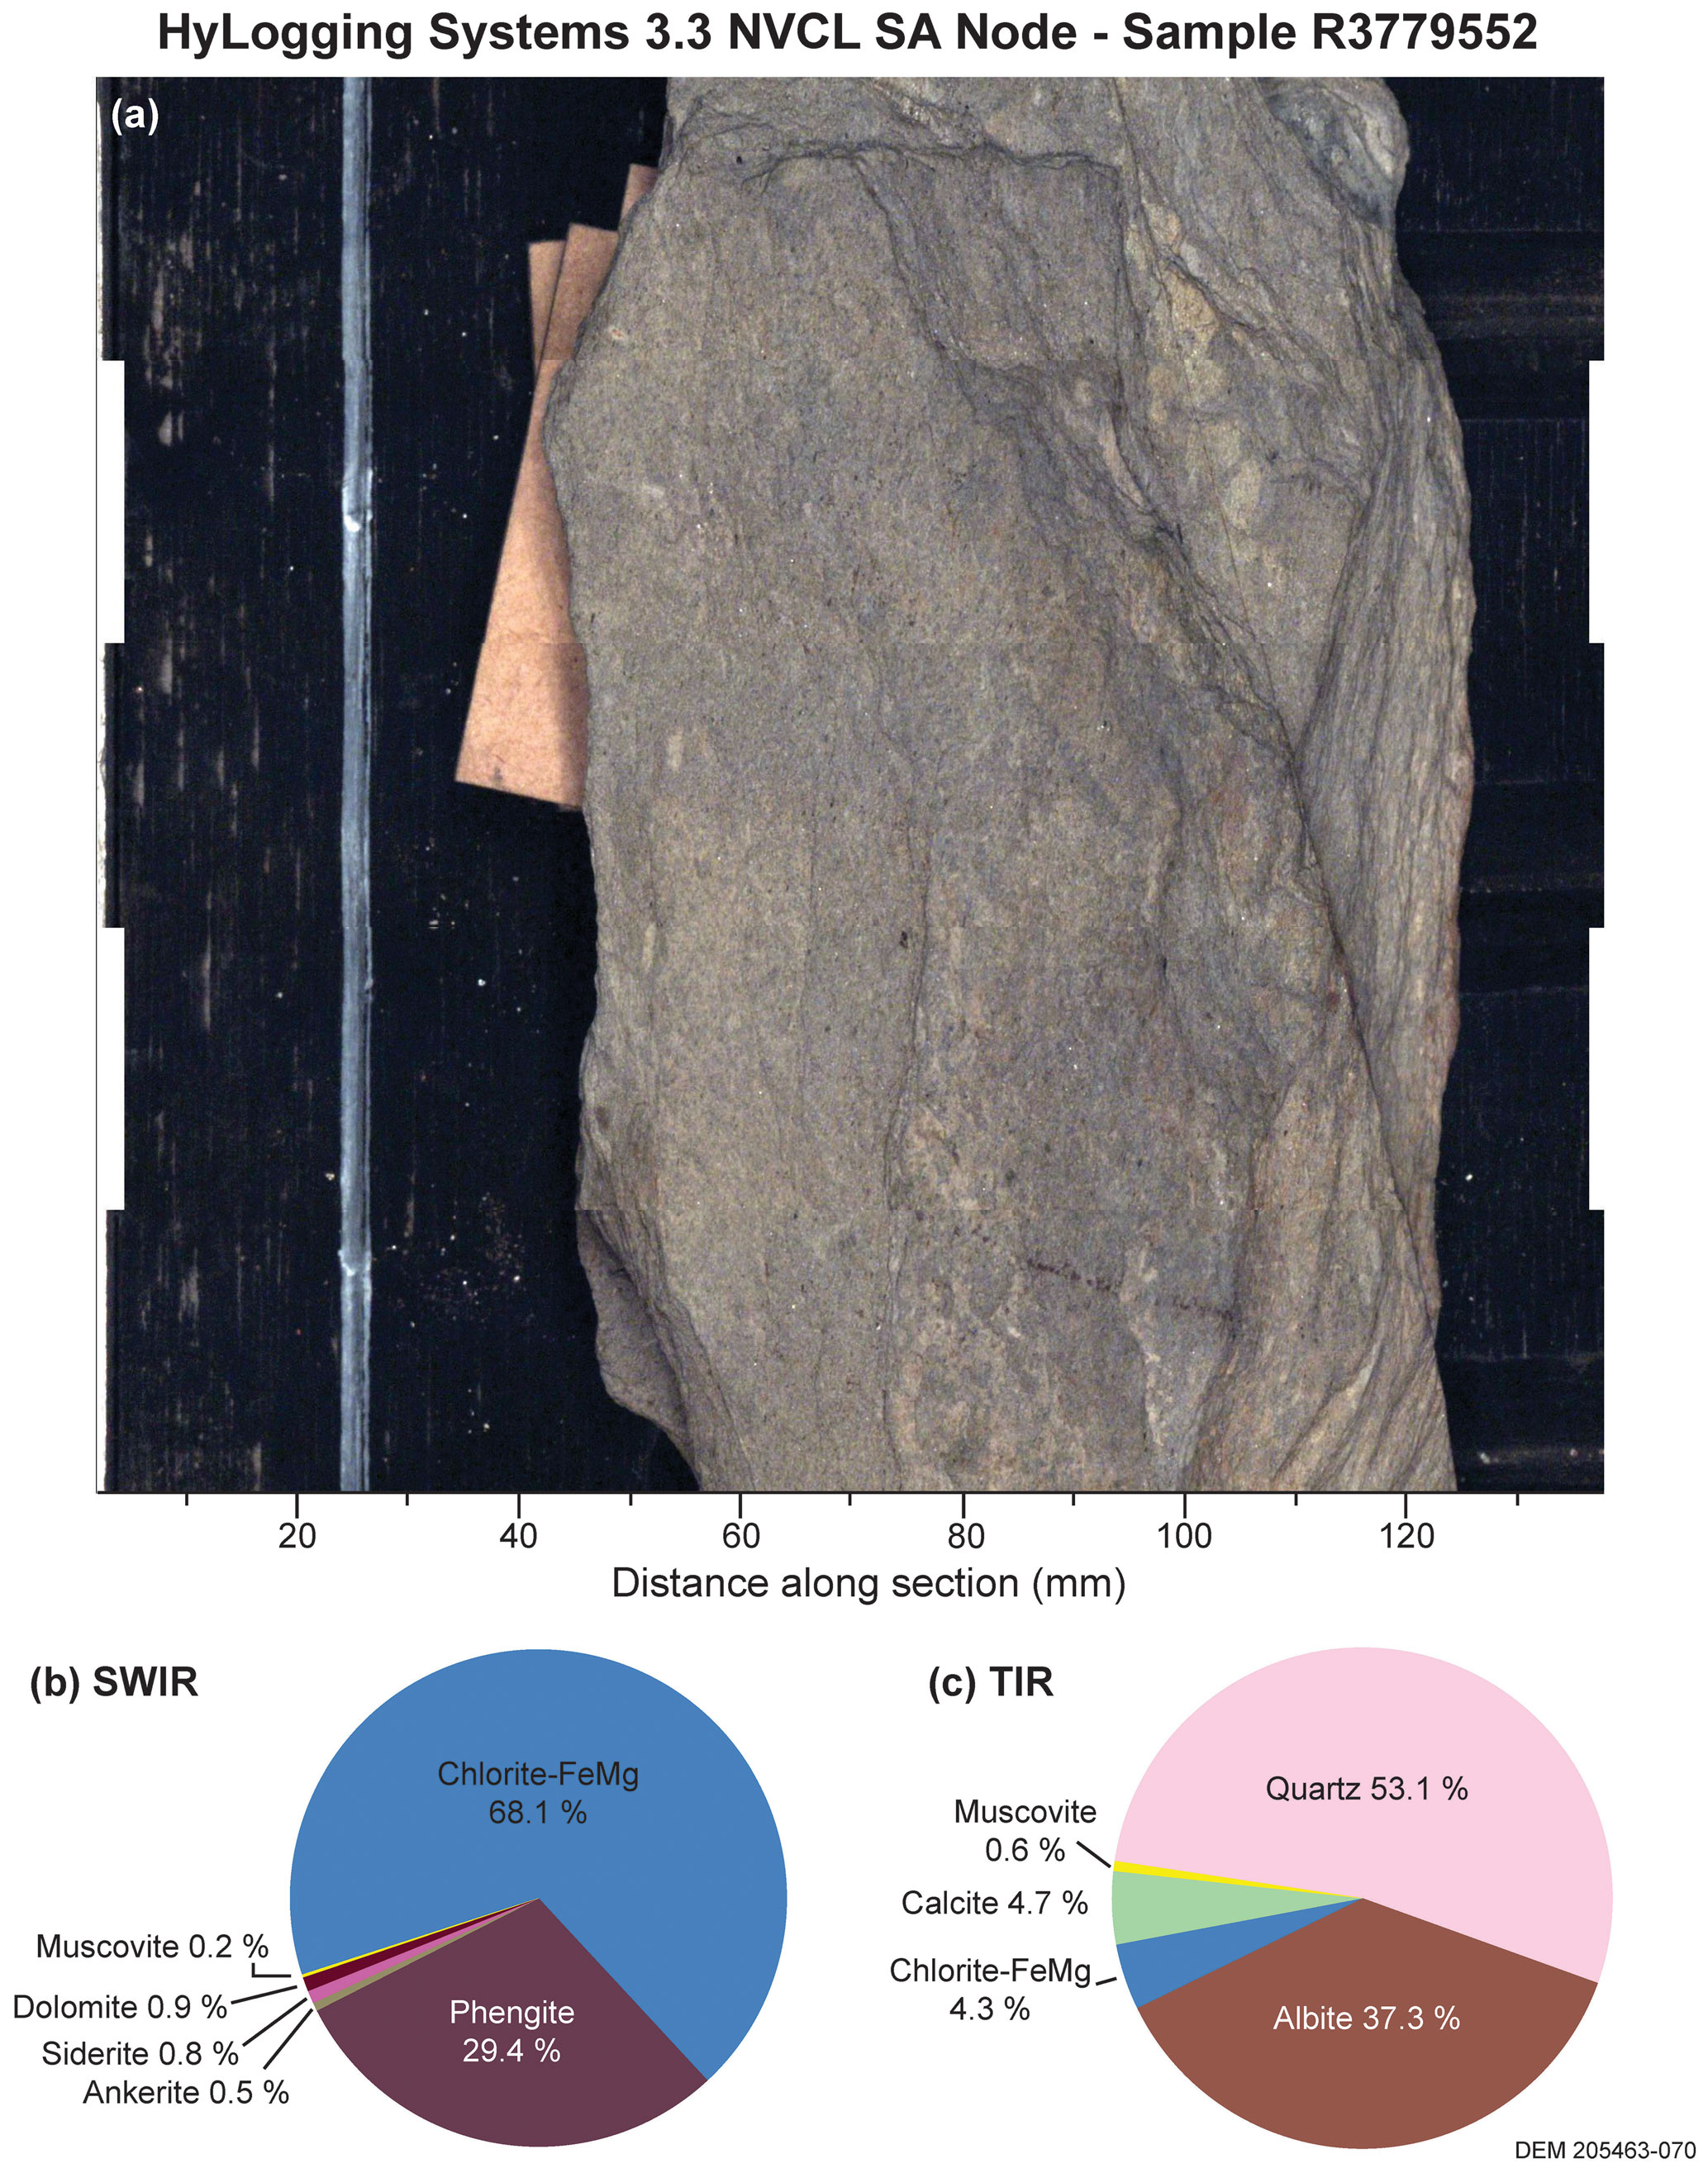
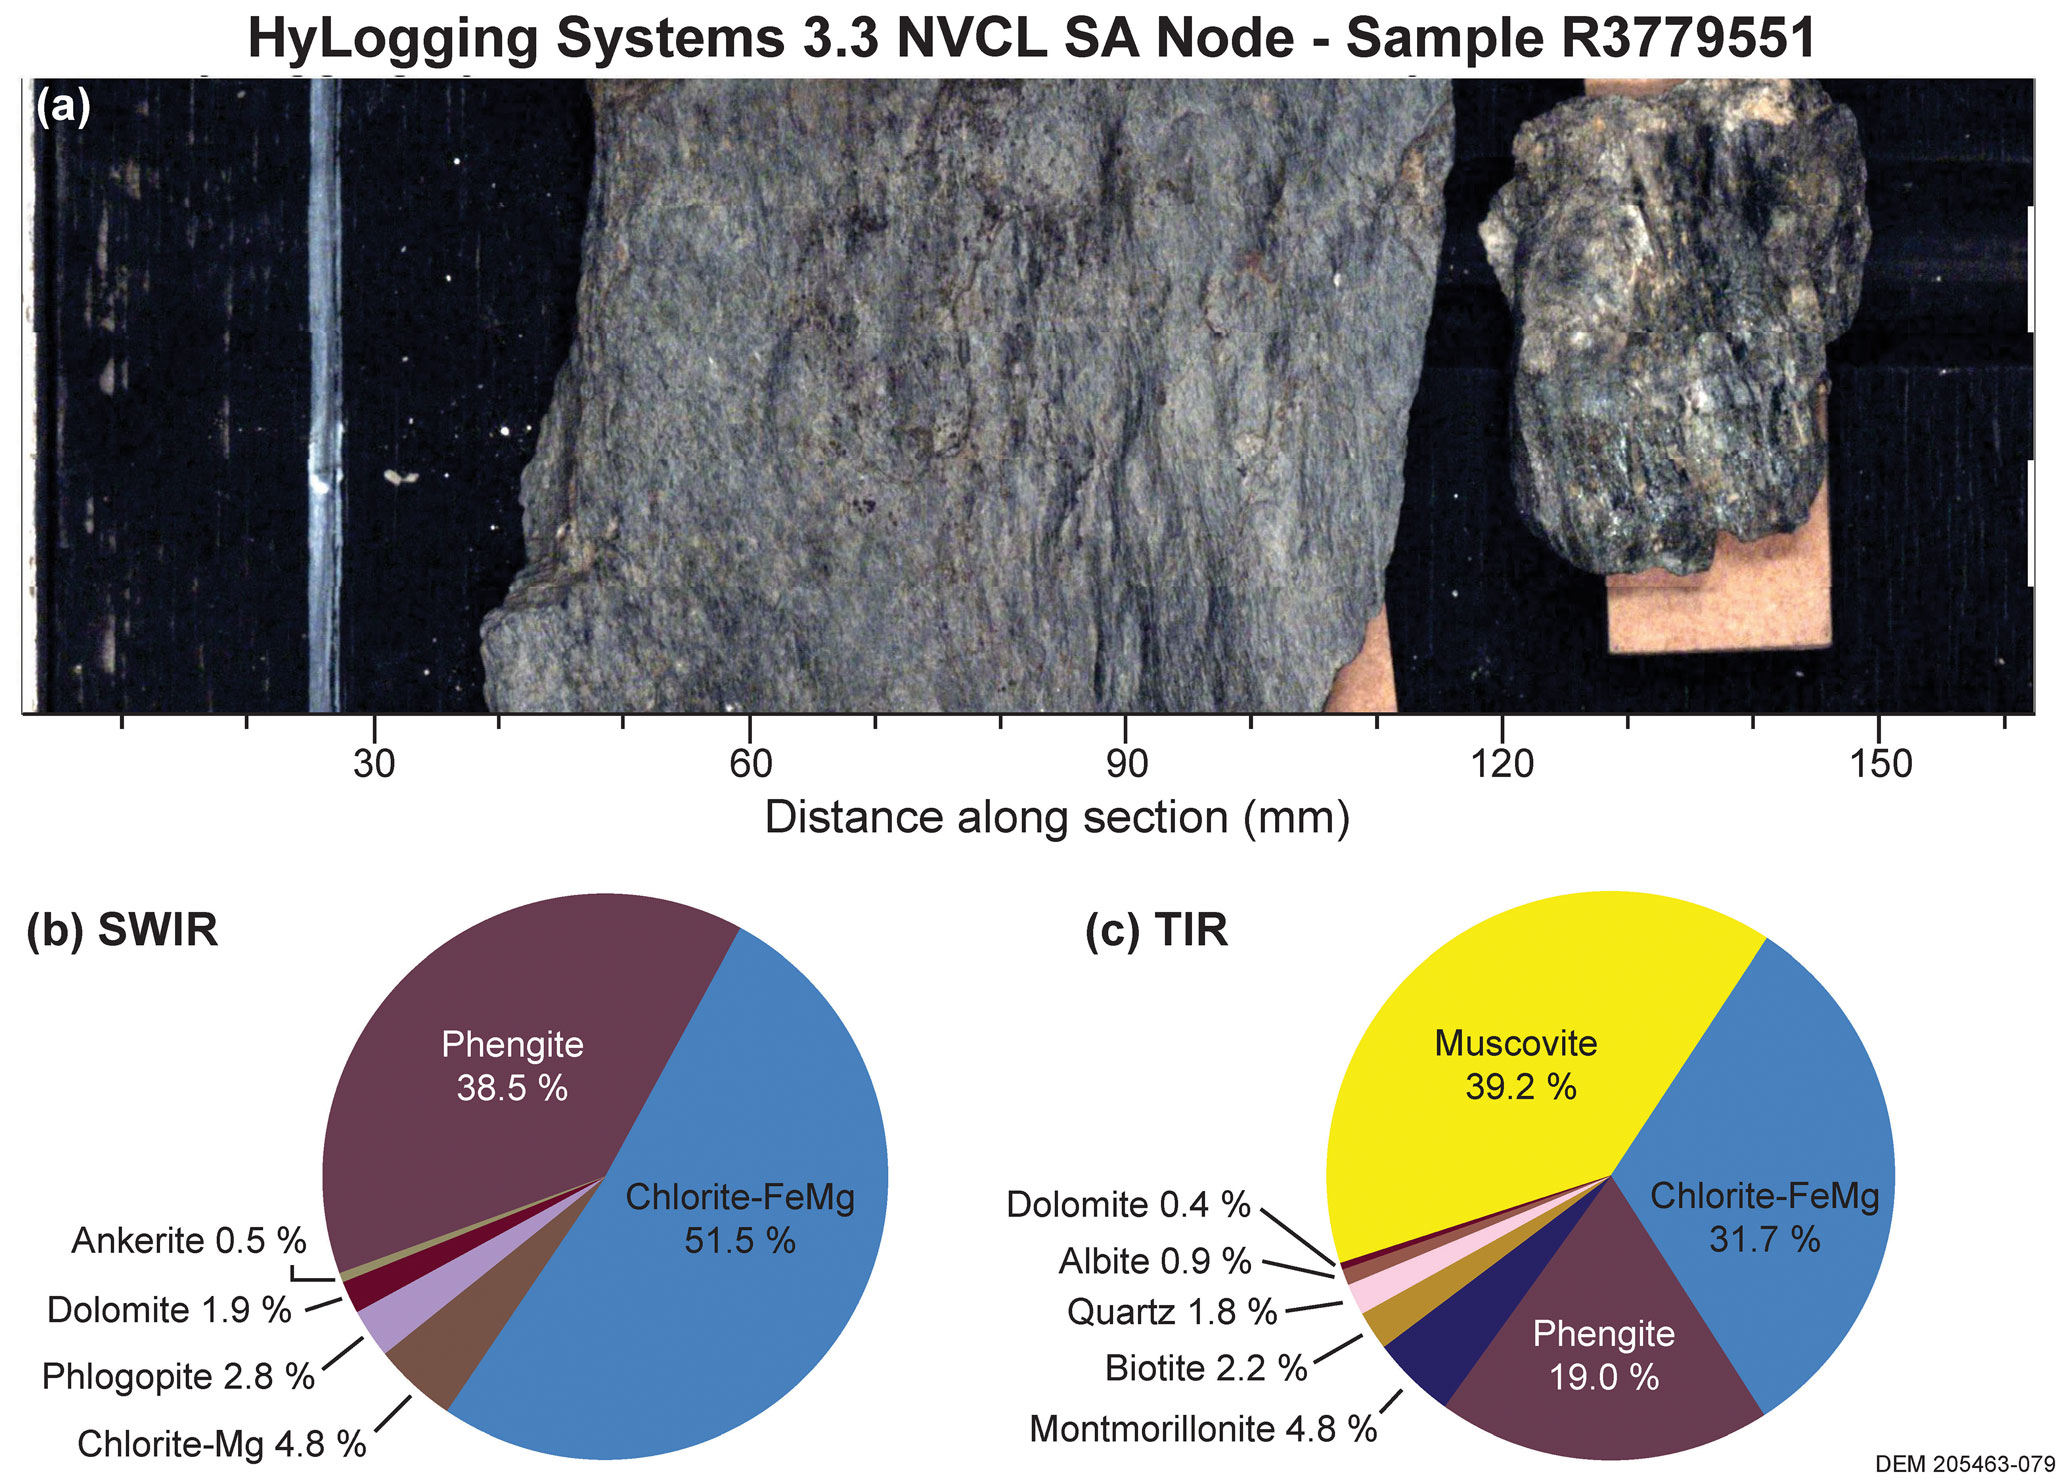
Samples were mineralogically characterised with a HyLogger-3™ (Schodlok et al., 2016) instrument at the Geological Survey of South Australia, Drill Core Reference Library, Adelaide. The HyLogger-3™ collects multiple data types, including reflectance from visible-near-infrared–shortwave-infrared (VNIR–SWIR, 380–2500 nm) and thermal-infrared (TIR, 6500–14 000 nm), high-resolution imagery and laser profilometer data at 4 mm resolution. Although this instrument is primarily designed to scan drill cores, it is adaptable to collect data from a variety of geological materials. Each rock sample was measured with five passes of the HyLogger™. The resulting spectral data was processed to exclude noisy and unwanted spectra using The Spectral Geologist™ v8.1.0.3 (TSG) software (Mason et al., 2020). Two algorithms, The Spectral Assistant™ (TSA) and joint constrained least squares (jCLST) unmix the spectral data and produce a semi-quantitative mineralogical result for SWIR and TIR. In this study, spectral results were obtained via traverses across each sample, with an average mineralogical composition compiled from both the SWIR and TIR spectrometers, as each wavelength range is diagnostic for different minerals. Note that different minerals can appear in both SWIR and TIR analyses and that the total mineralogy identified by each spectral range is not necessarily indicative of the entire mineralogy of the sample. These data are used as a guide to the major mineral components, in particular the fine-grained minerals such as mica that are significant for the present 40Ar 39Ar study.
Scalars are algorithms applied within TSG that are designed to interpret diagnostic absorption features related to specific mineral species. A scalar developed by Haest et al. (2012) examines the wavelength change of the 2200 nm Al–OH absorption feature (Fig. A1), known to distinguish endmembers of white mica. Shorter wavelengths are indicative of a muscovitic composition and longer wavelengths demonstrate a phengitic white mica.
HyLogger™ results for each sample are given in the following forms:
-
a plain light high-resolution image of each sample,
-
a pie diagram compositional summary representing semi-quantitative HyLogger™ data identified in the SWIR wavelength range,
-
a pie diagram compositional summary representing semi-quantitative HyLogger™ data identified in the TIR wavelength range.
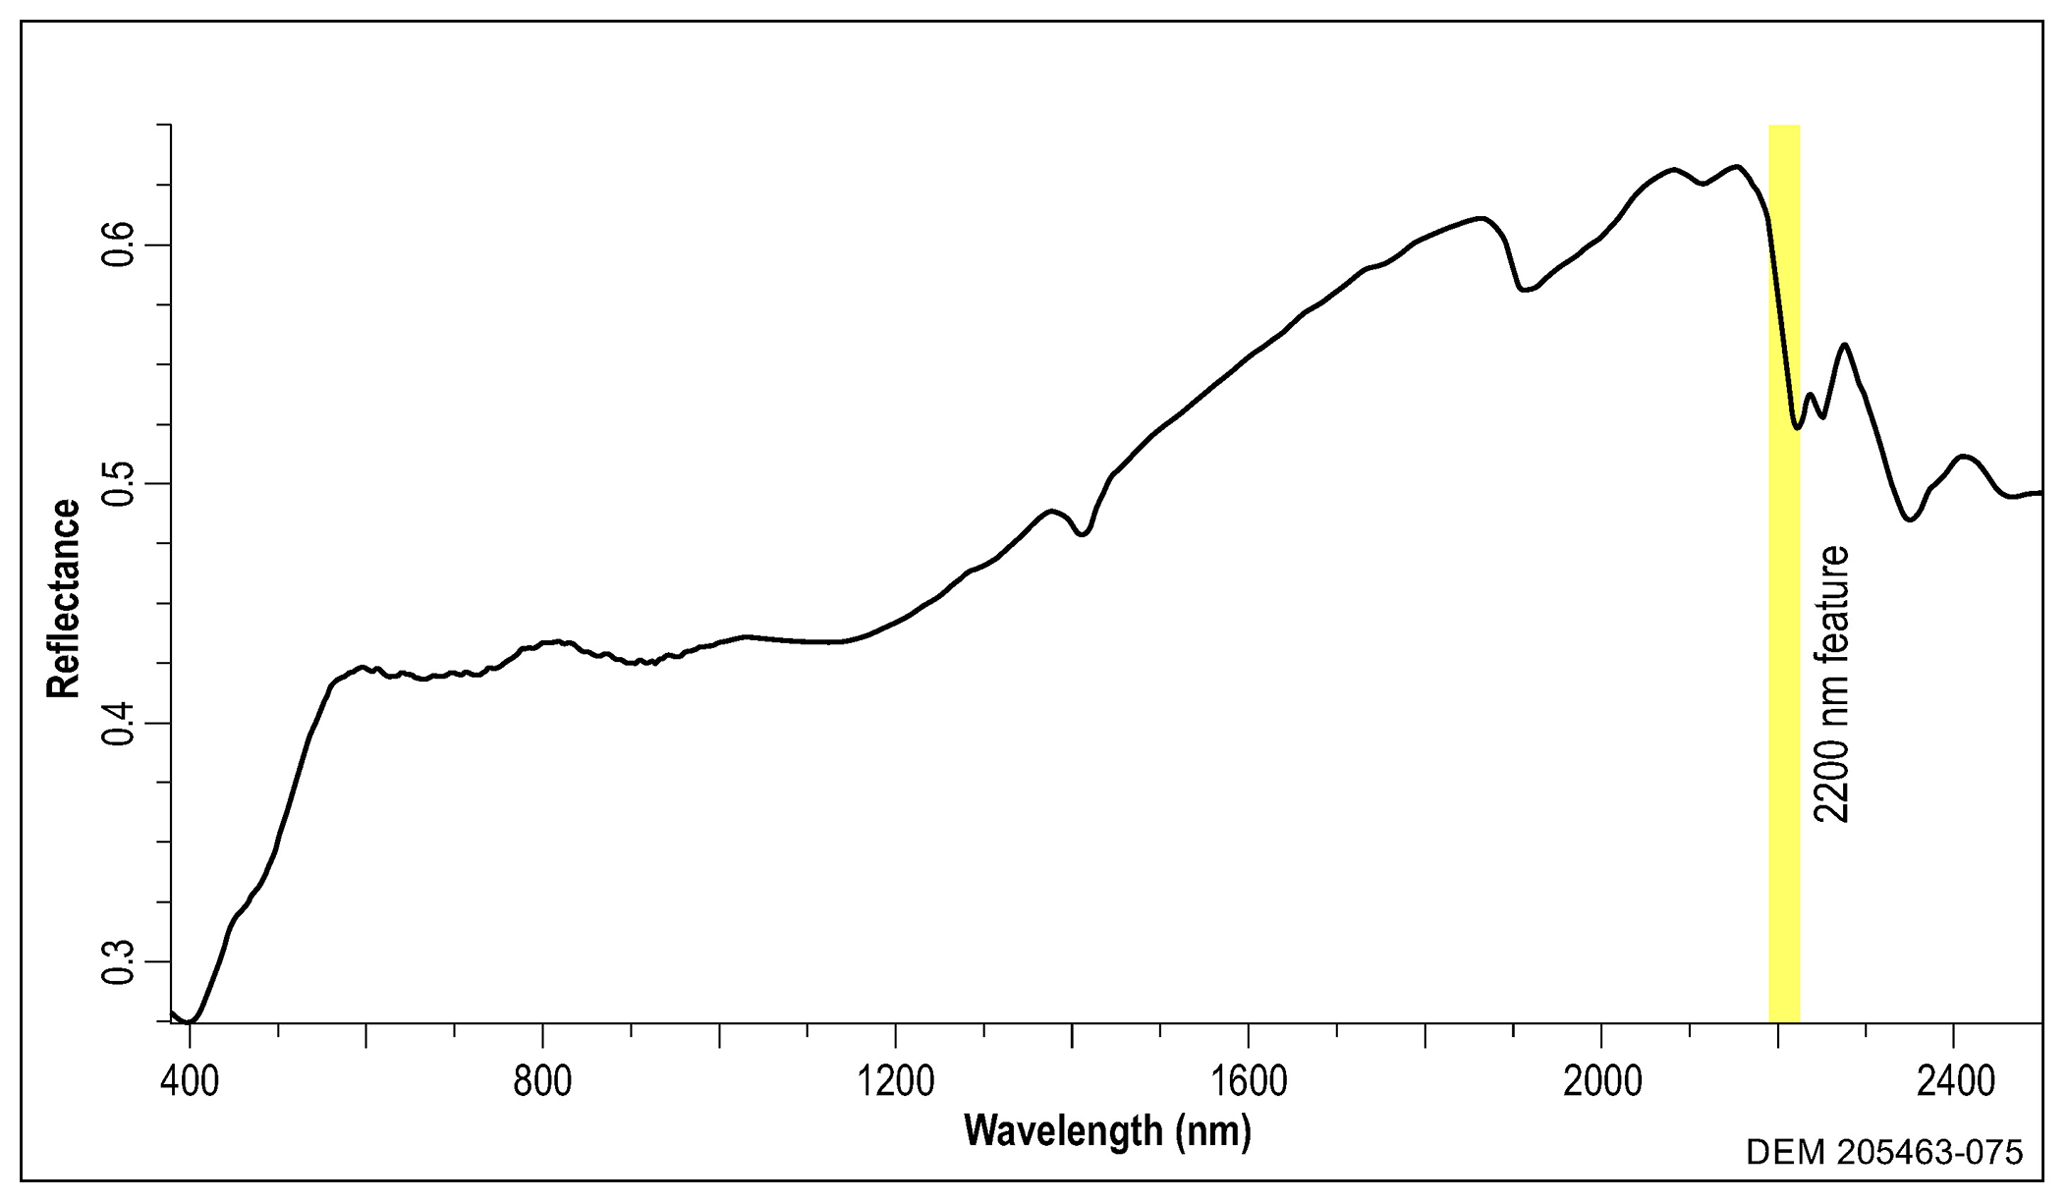
Figure A1A representative spectral measurement from a sample in this study. The 2200 nm feature is highlighted to demonstrate its position relative to the VNIR–SWIR spectral signature.
A2 Hyperspectral mineralogy results for each sample analysed in this study
B1 Sample irradiation details
Irradiation of samples for 40Ar 39Ar analysis is required, and this was undertaken at the University of California Davis McClellan Nuclear Research Centre, CA, US. The samples in this study were wrapped in aluminium foil and irradiated in ANU Canister no. 36, and the canister had 1.0 mm cadmium shielding (Tetley et al., 1980). For each sample, calculated amounts of grains were weighed, recorded, and wrapped in labelled aluminium packets in preparation for irradiation. The sample-filled foils were placed into a quartz irradiation canister together with aliquots of the flux monitor GA1550. The GA1550 standards are dispersed throughout the irradiated canister between the unknown age samples. In addition, packets containing K2SO4 and CaF2 were placed in the middle of the canister to monitor 40Ar production from potassium. Irradiated samples were unwrapped upon their return to the Australian National University and then rewrapped in tin foil in preparation for analysis in the mass spectrometer.
B2 40Ar 39Ar procedures and analysis information
Samples and standards were analysed in the Argon Laboratory at the Research School of Earth Science, The Australian National University, Canberra, Australia, using a Thermo Fisher ARGUS-VI multi-collector mass spectrometer. A furnace step-heating technique was used to extract argon isotopes from the samples to ensure 100 % release of 39Ar, while the flux monitor crystals (GA1550 biotite) were fused using a CO2 continuous-wave laser; gases extracted from both the samples and standards were analysed in the Argus VI mass spectrometer. For the furnace step-heating process, the samples were wrapped in tin foil to melt the tin and pump away the gases prior to the sample analysis. The furnace was degassed four times at 1450 ∘C for 15 min, and the gas was pumped away prior to the loading of the subsequent sample. Gas released from flux monitors and each step of sample analyses was exposed to three different Zr–Al getters to remove active gases for 10 min, and the purified gas was isotopically analysed in the mass spectrometer. Samples were analysed with 30 steps and with temperatures of the overall schedule rising from 450 to 1450 ∘C (Reid and Forster, 2022). The 40Ar 39Ar dating technique is adapted from McDougall and Harrison (1999) and described in Forster and Lister (2009).
The background levels were measured and subtracted from all analyses (laser and furnace). For example, backgrounds were measured prior to every step of the sample analysis and subtracted from the isotope intensities for 40Ar, 39Ar, 38Ar, 37Ar, and 36Ar. The nuclear interfering values for the correction factors for the isotopes are listed below. These are measured for the reactions and uncertainties of (36Ar 37Ar)Ca, (39Ar 37Ar)Ca, (40Ar 39Ar)K, (38Ar 39Ar)K, and (38Ar)Cl (39Ar)K and were calculated prior to sample analysis. The decay constant (λ40K = ) is based on the reported values in Renne et al. (2011).
Table B1ANU Canister no. 36 irradiation information and correction factors.
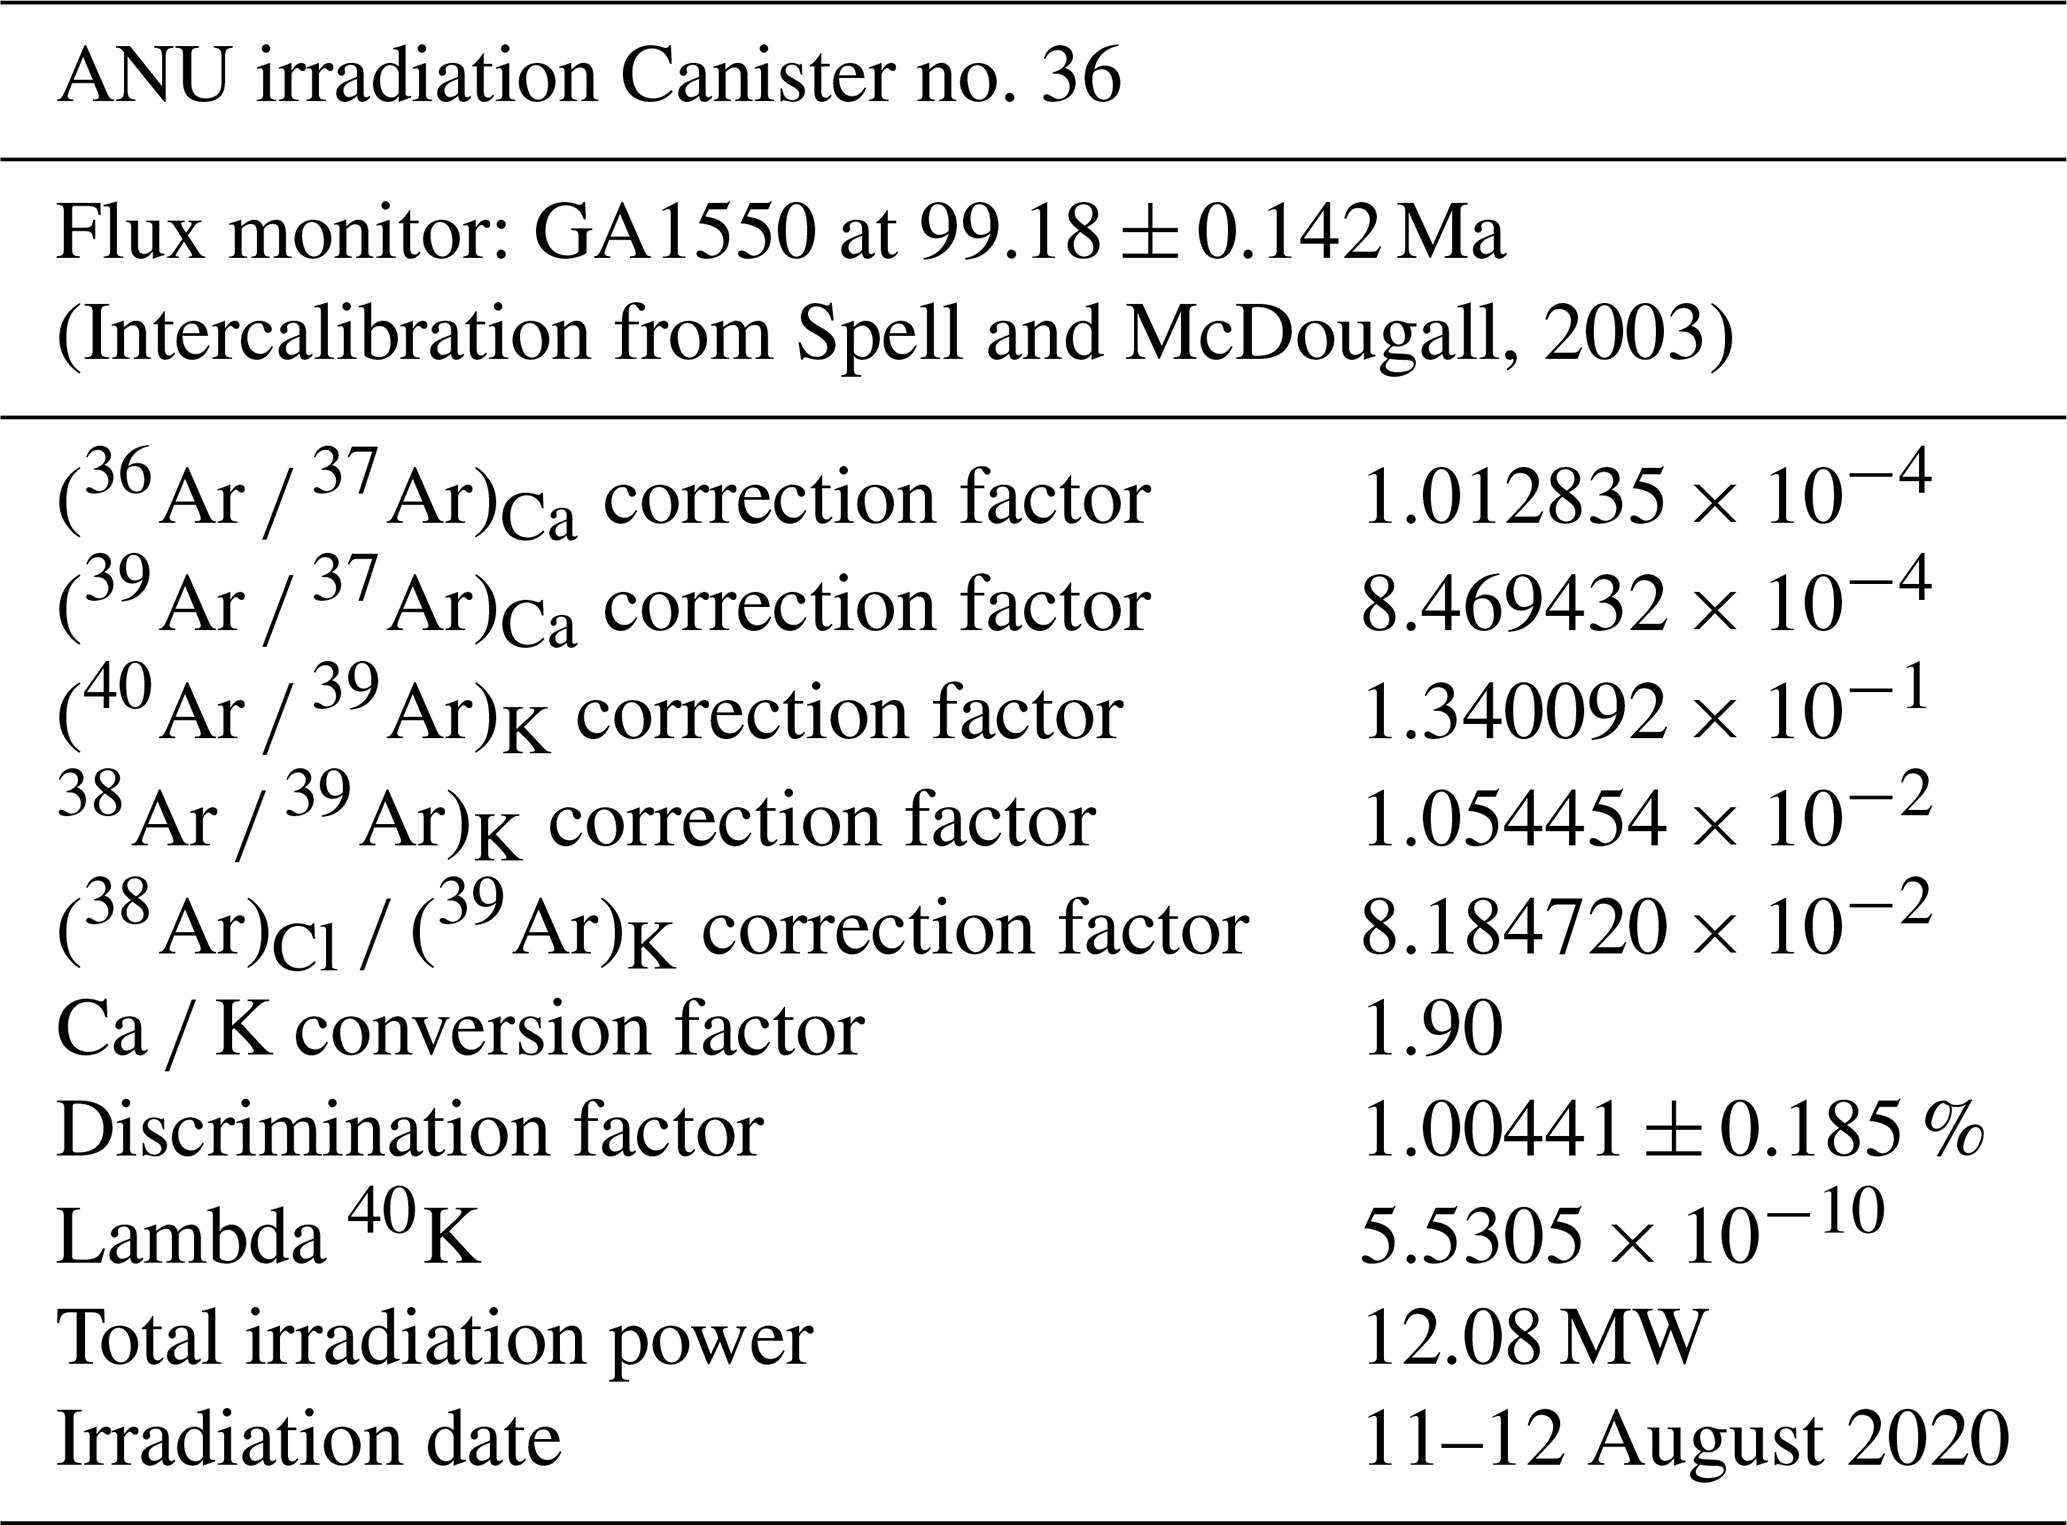
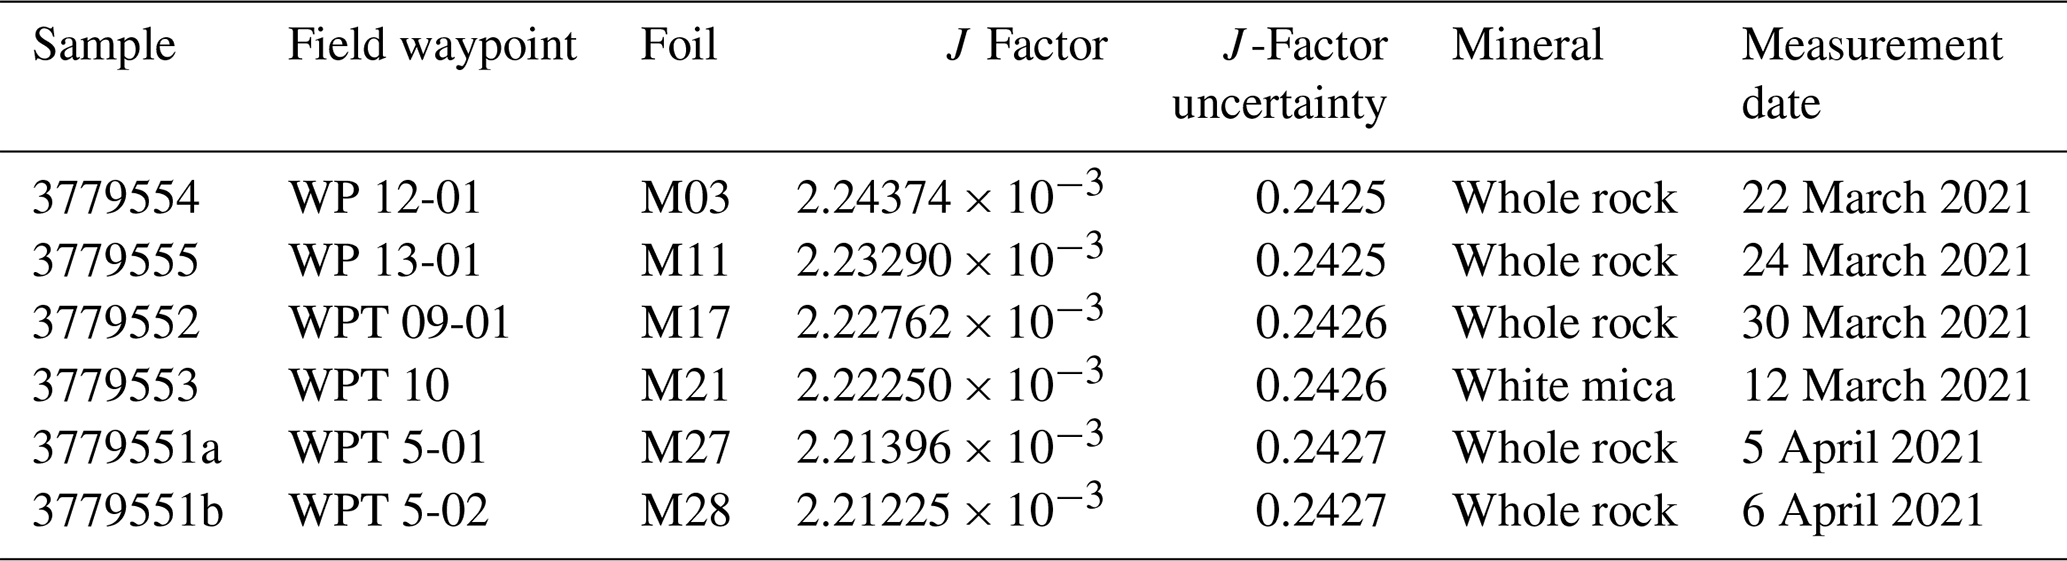
The 40K abundances and decay constants are calculated as in Renne et al. (2011). Stated precisions for 40Ar 39Ar ages include all uncertainties in the measurement of isotope ratios and are quoted at the one sigma level and exclude errors in the age of the fluence monitor GA1550. The age of the flux monitor (GA1550 = 99.18 Ma) is based on the intercalibration value between GA1550 and Fish Canyon Sanidine age reported in Spell and McDougall (2003). The reported data have been corrected for system backgrounds, mass discrimination, fluence gradients, and atmospheric contamination. GA1550 standards were analysed, and a linear best fit was then used for the calculation of the J factor and J-factor uncertainty.
Data reductions were done with an adapted version of Noble software (2020, written and adapted by the Australian National University Argon Laboratory). The data reduction was based on optimising MSWD (the mean square of weighted deviates) of isotope intensities with an exponential best-fit methodology. The discrimination factor was calculated by analysing five Air Shots analysis on either side of sample analysis, based on the atmospheric 40Ar 36Ar ratio (298.57; see Lee et al., 2006), and the calculation of the 1amu was used for the discrimination factor.
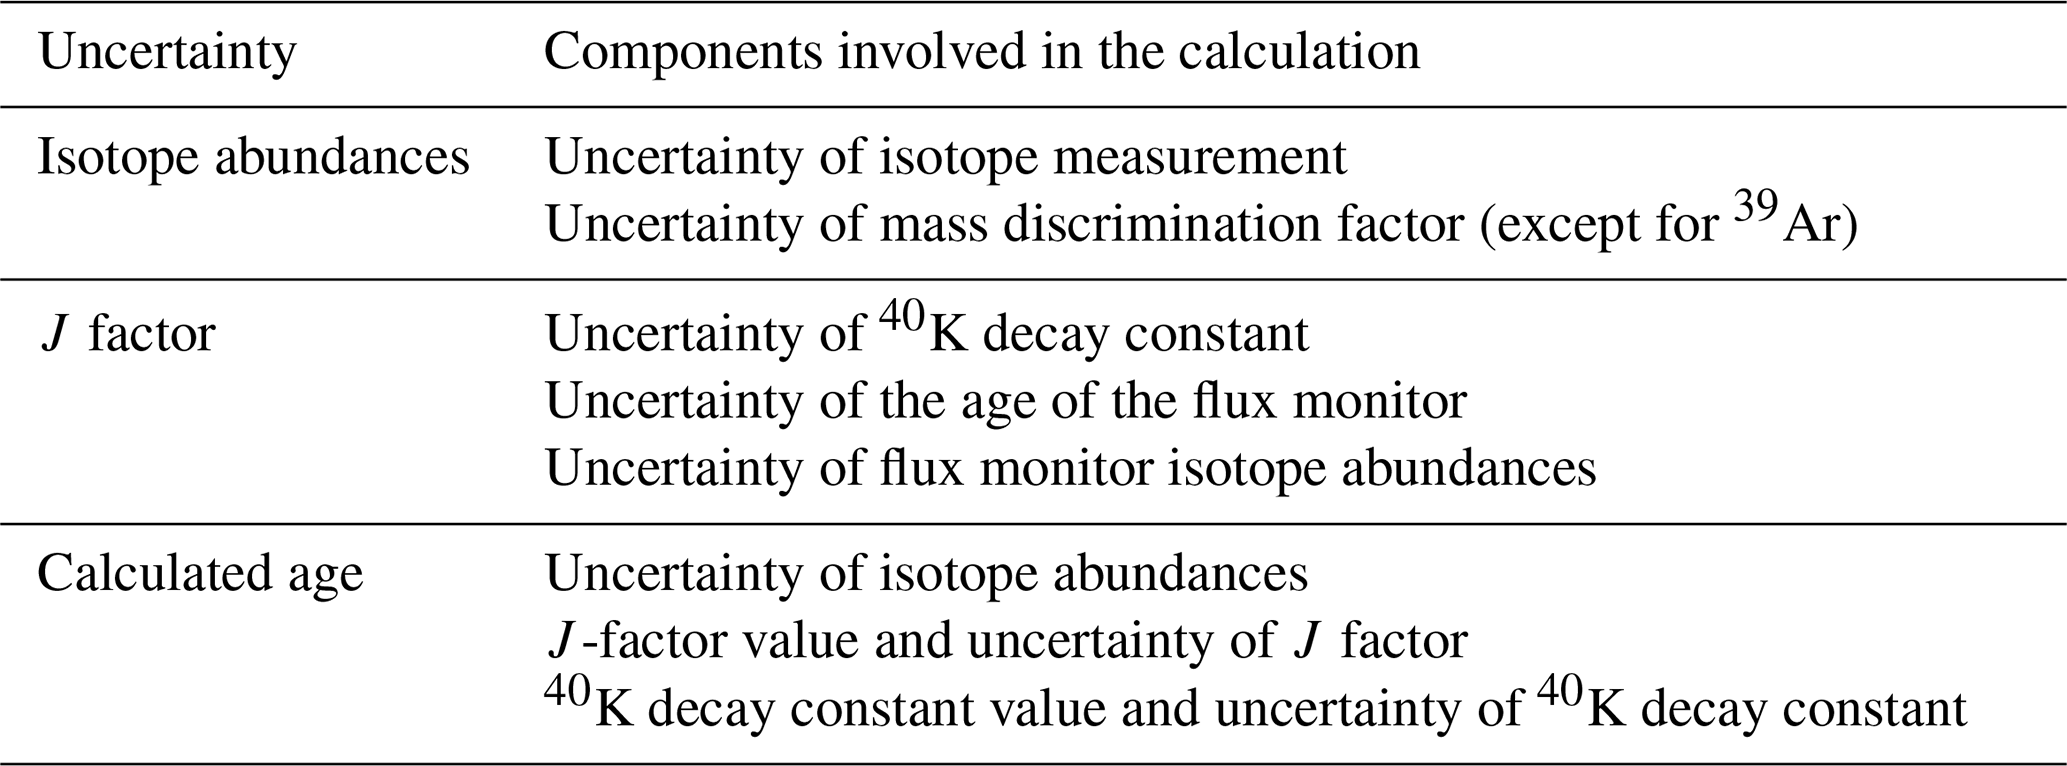
The 40Ar 39Ar isotopic data of the sample are supplied in Reid and Forster (2022), which includes details on the heating schedule, Argon isotope abundances and uncertainty levels, %Ar∗, 40Ar∗ 39Ar(K), cumulative 39Ar %, age and uncertainty, Ca K, Cl K, J factor, and J-factor uncertainty, noting that the fractional uncertainties are shown as percentages and are stated in the headings of the appropriate columns. Uncertainty levels of the calculated ages are at one sigma. Components involved in the calculation of the uncertainties are listed in Table B3.
Table B2J factors and the measurement dates of the samples.
For each sample, the age spectrum (panel a in Figs. C1–C6), isotope correlation diagram (panel b of Figs. C1–C6), percentage radiogenic 40Ar (40Ar∗; panel c in Figs. C1–C6), Ca K ratio (panel d in Figs. C1–C6), and Cl K ratio (panel e in Figs. C1–C6) are presented. Below each set of plots is a description of the ages selected for a combination or as single steps, along with statistical information on the pooled ages and the steps aggregated. Note that limits and asymptotes are defined following Forster and Lister (2004) and that age plateaus are defined as in Schaen et al. (2020).
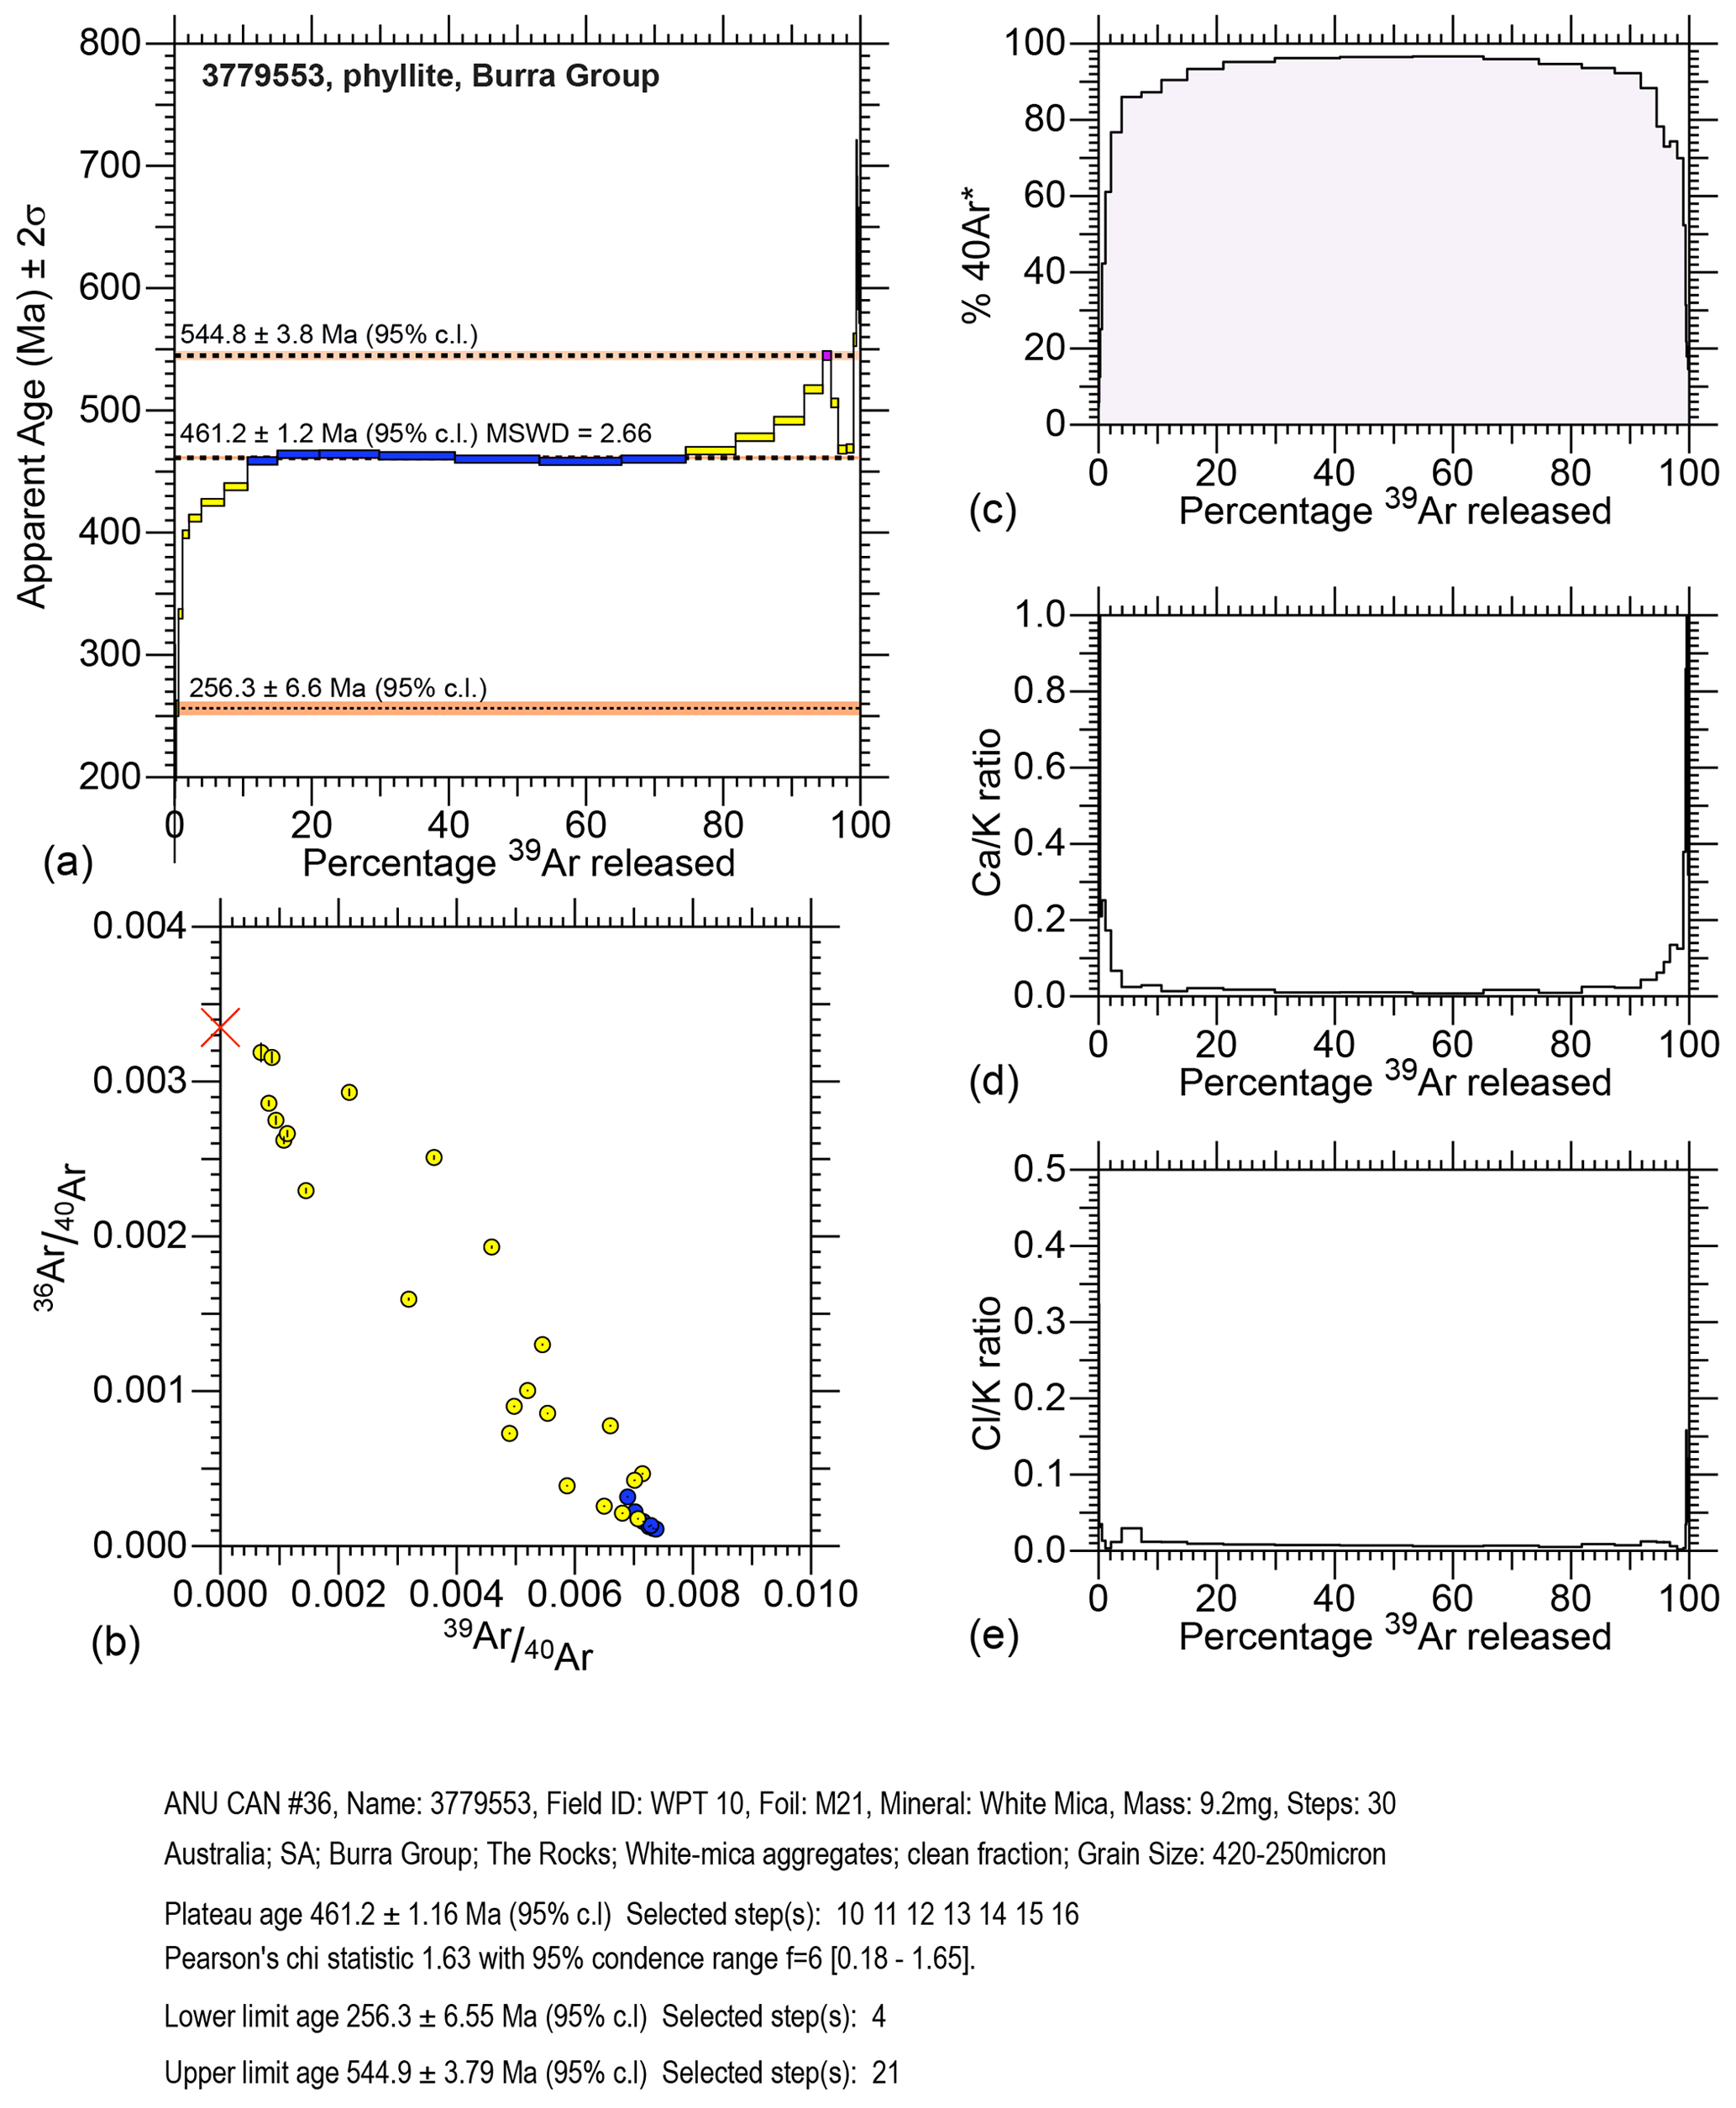
Figure C1Sample 3779553 (a) age spectrum, (b) isotope correlation diagram, (c) percentage radiogenic 40Ar (40Ar∗), (d) Ca K ratio, and (e) Cl K ratio.
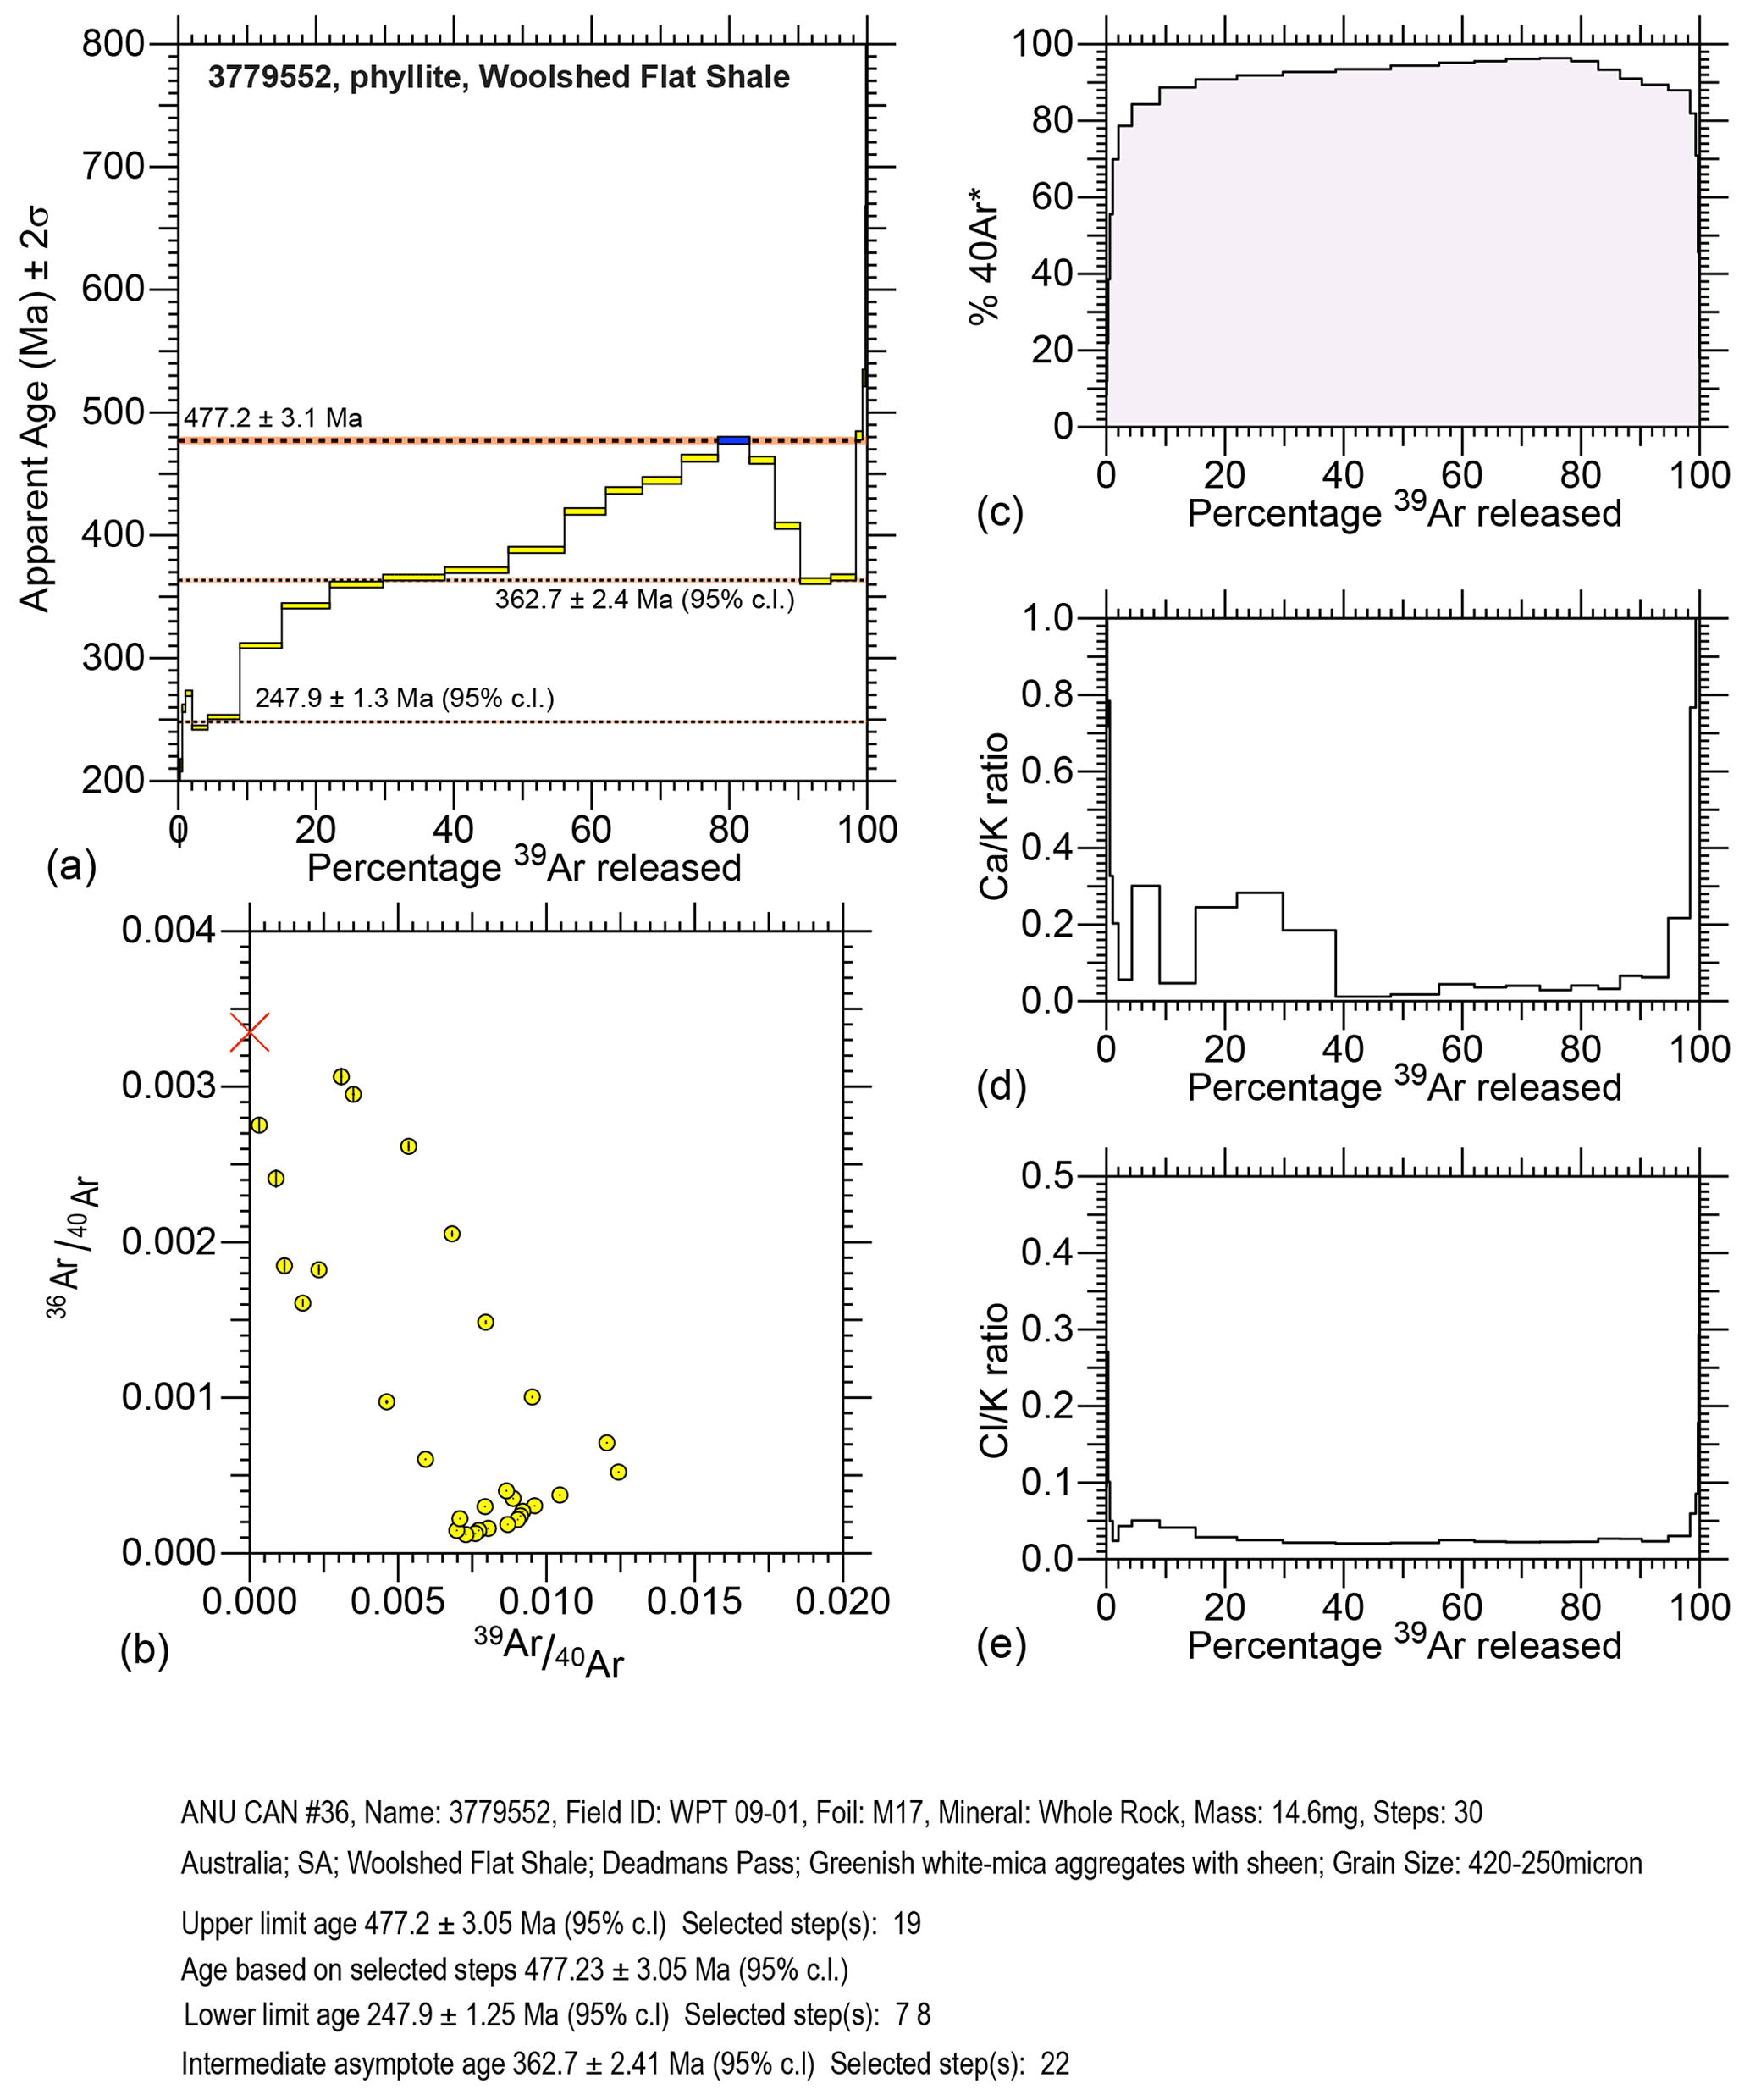
Figure C2Sample 3779552 (a) age spectrum, (b) isotope correlation diagram, (c) percentage radiogenic 40Ar (40Ar∗), (d) Ca K ratio, and (e) Cl K ratio.
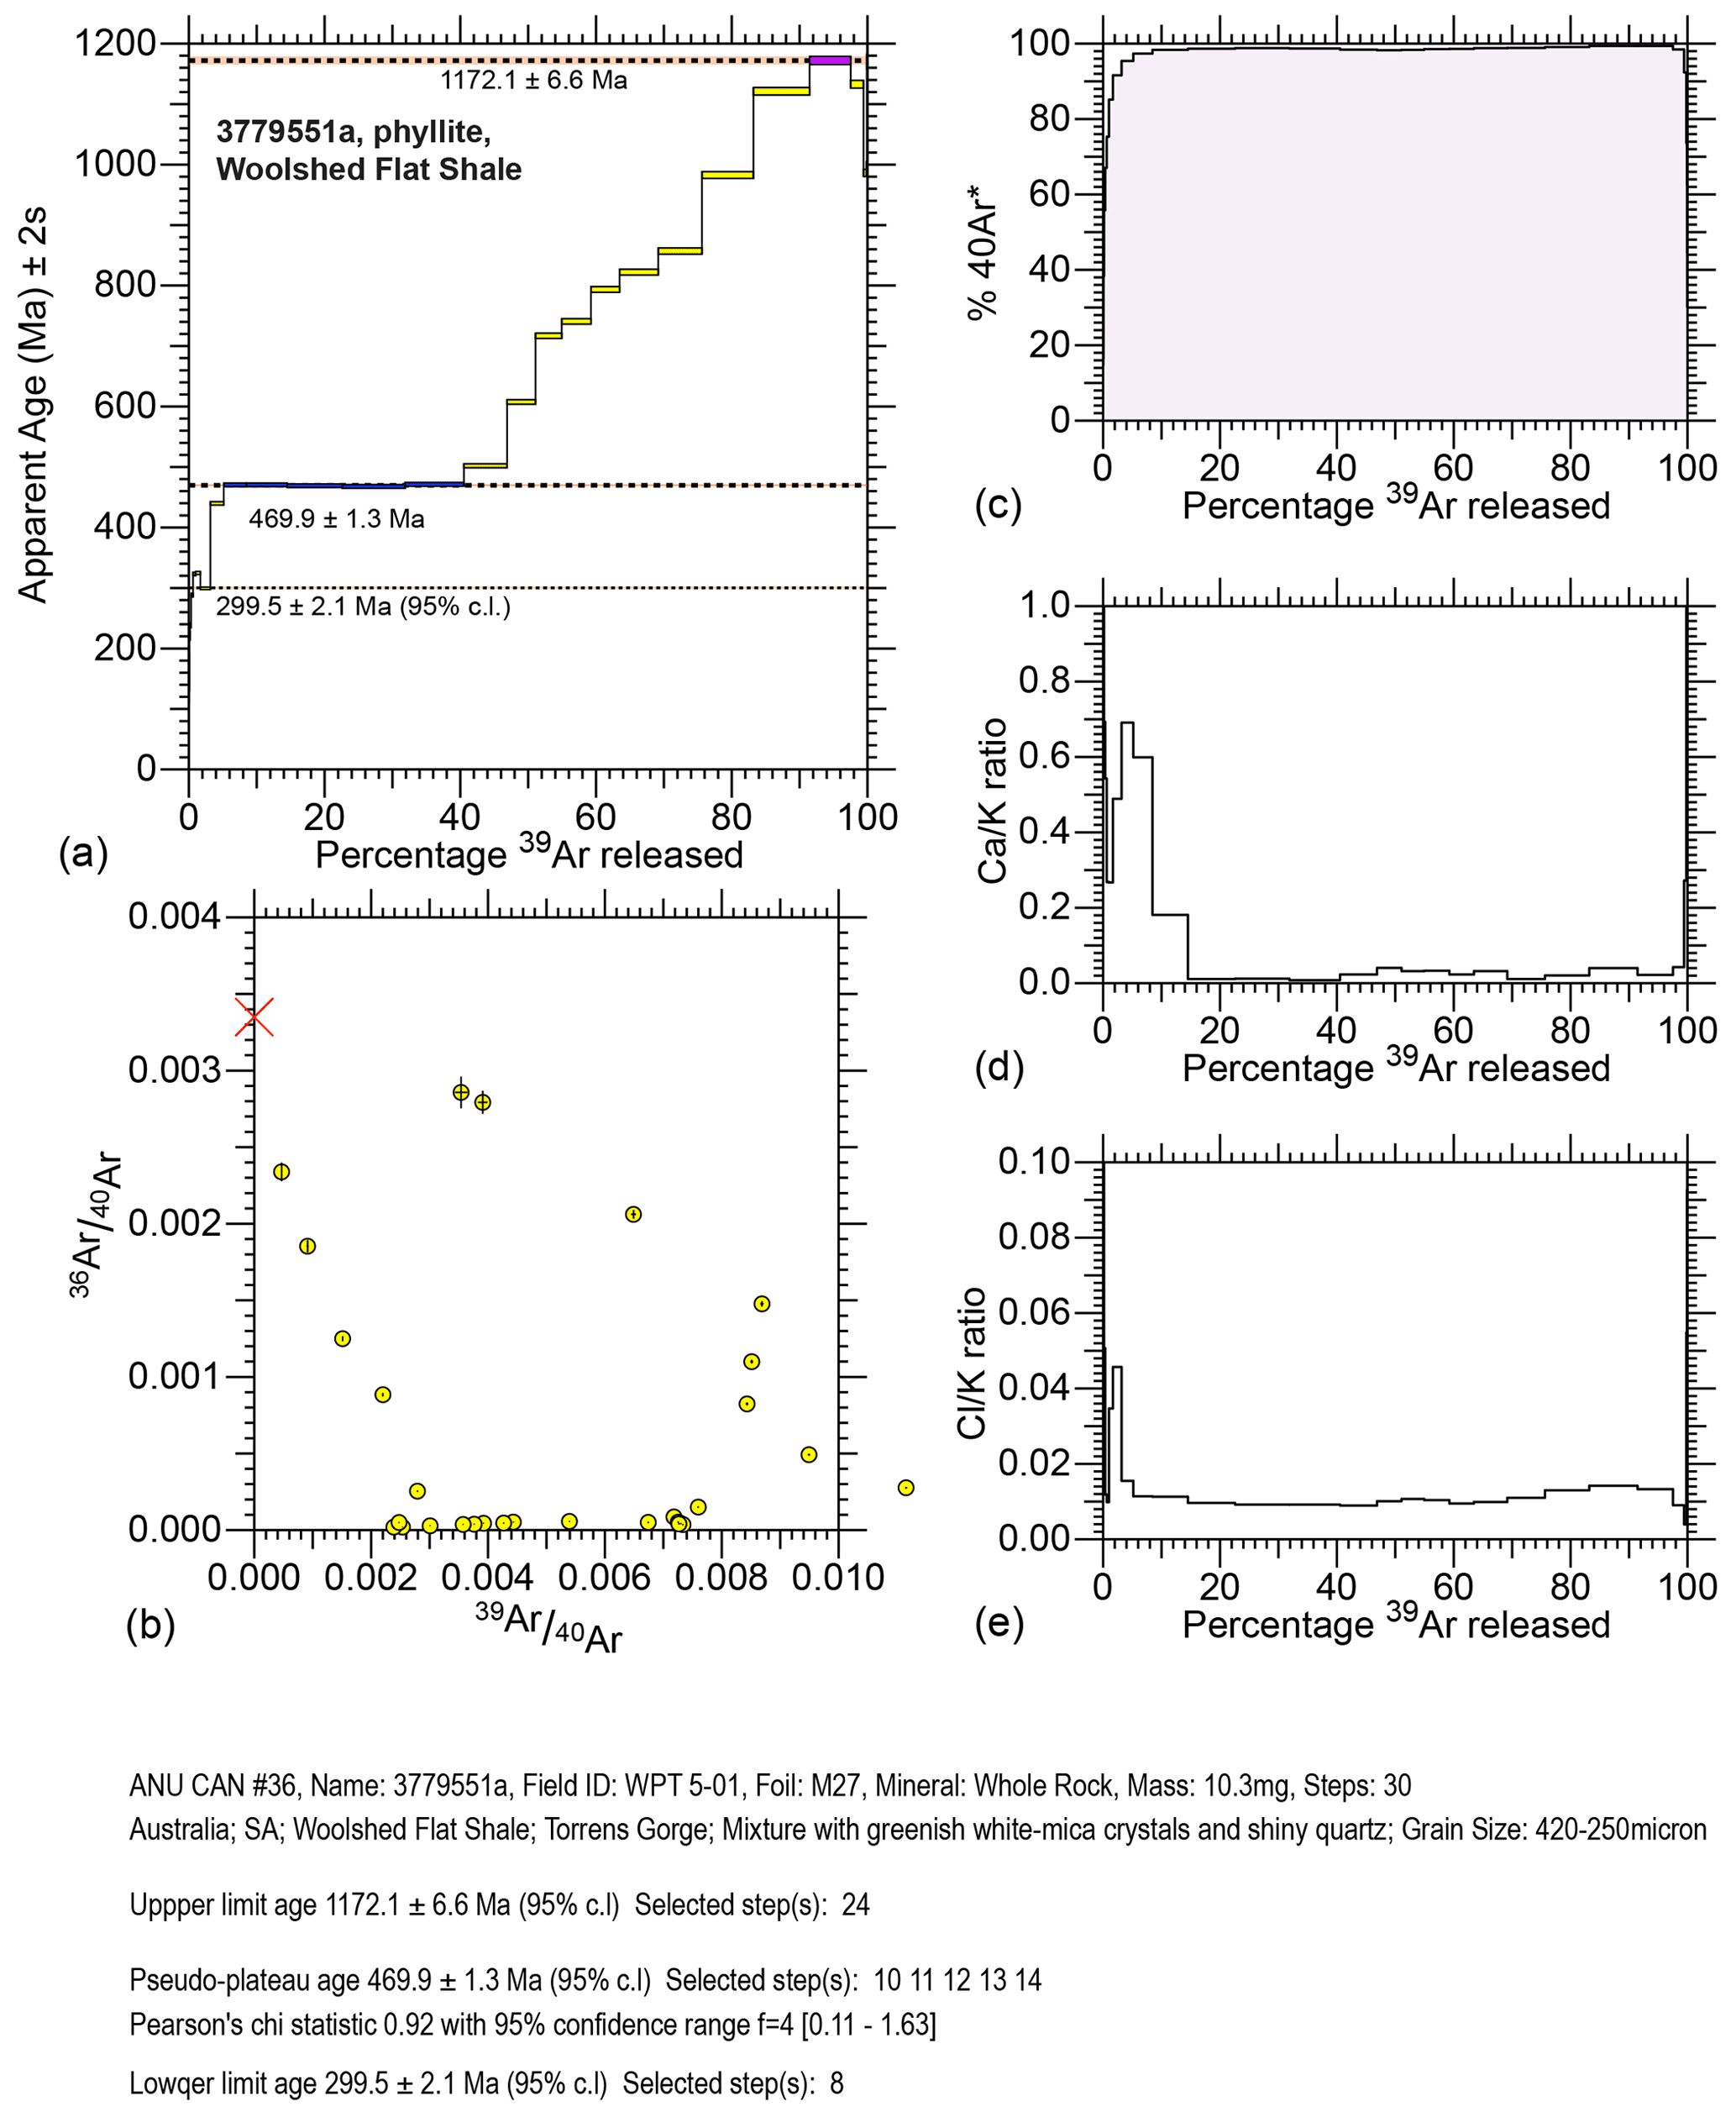
Figure C3Sample 3779551a (a) age spectrum, (b) isotope correlation diagram, (c) percentage radiogenic 40Ar (40Ar∗), (d) Ca K ratio, and (e) Cl K ratio.
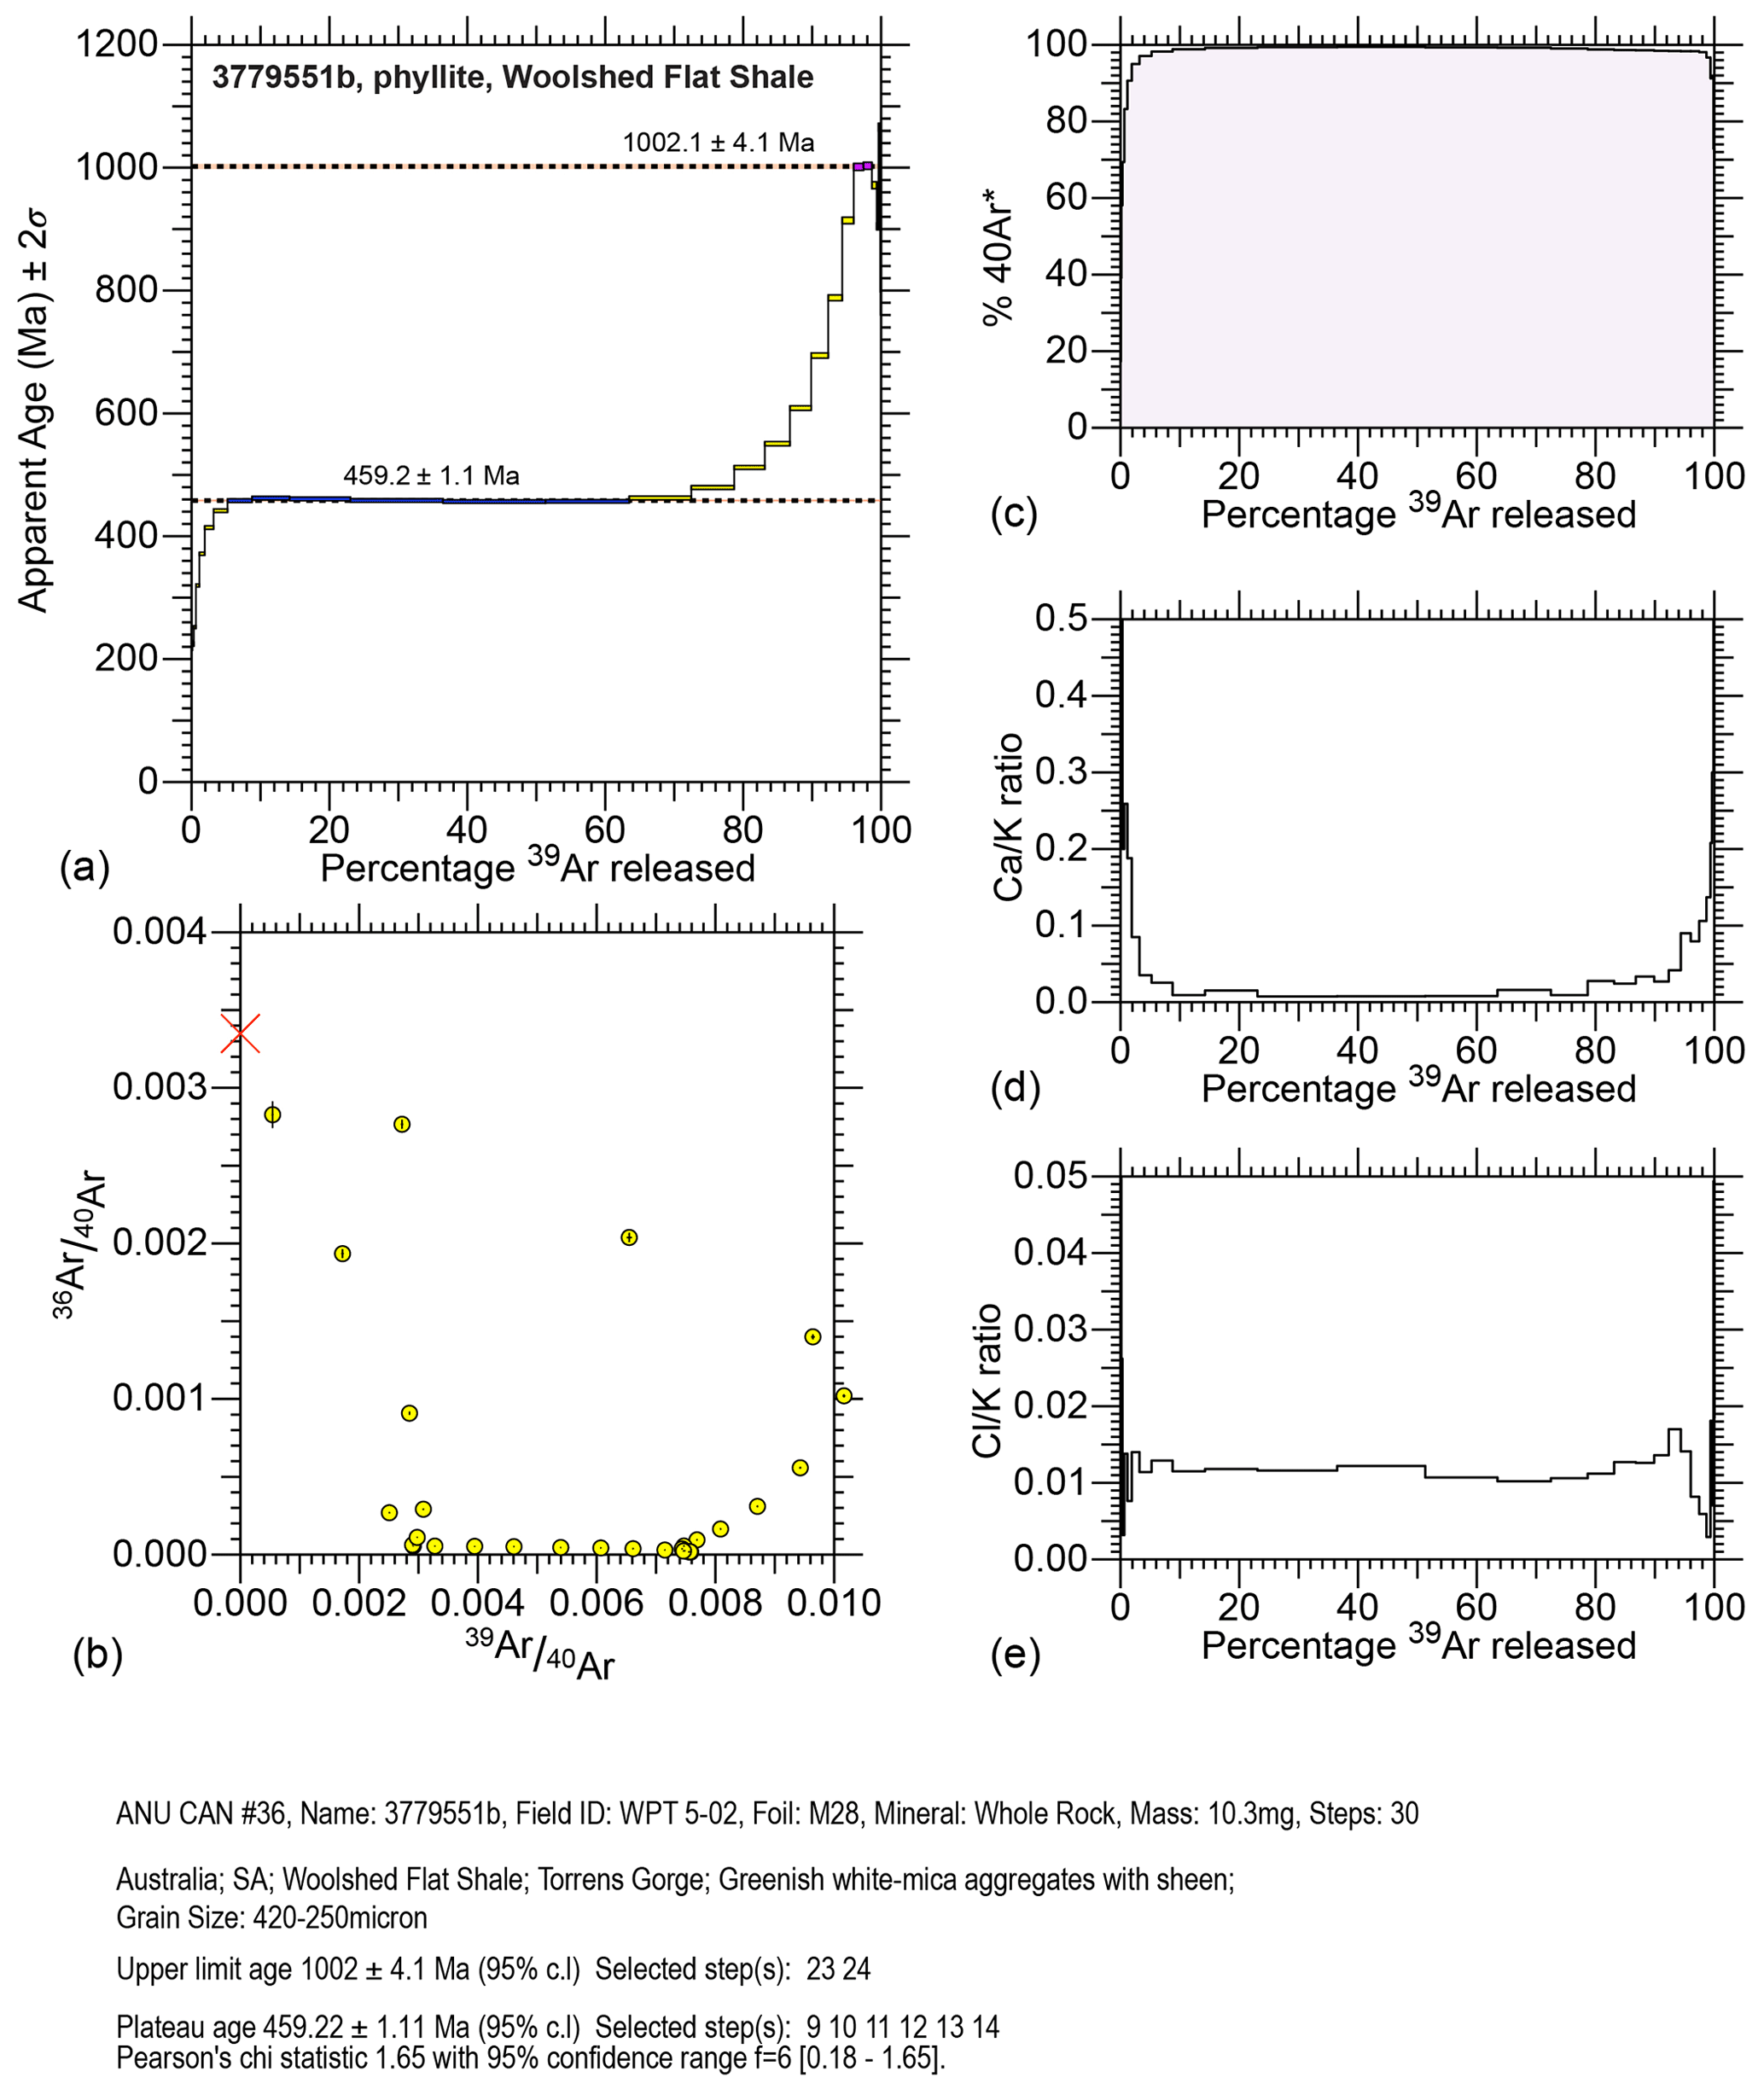
Figure C4Sample 3779551b (a) age spectrum, (b) isotope correlation diagram, (c) percentage radiogenic 40Ar (40Ar∗), (d) Ca K ratio, and (e) Cl K ratio.
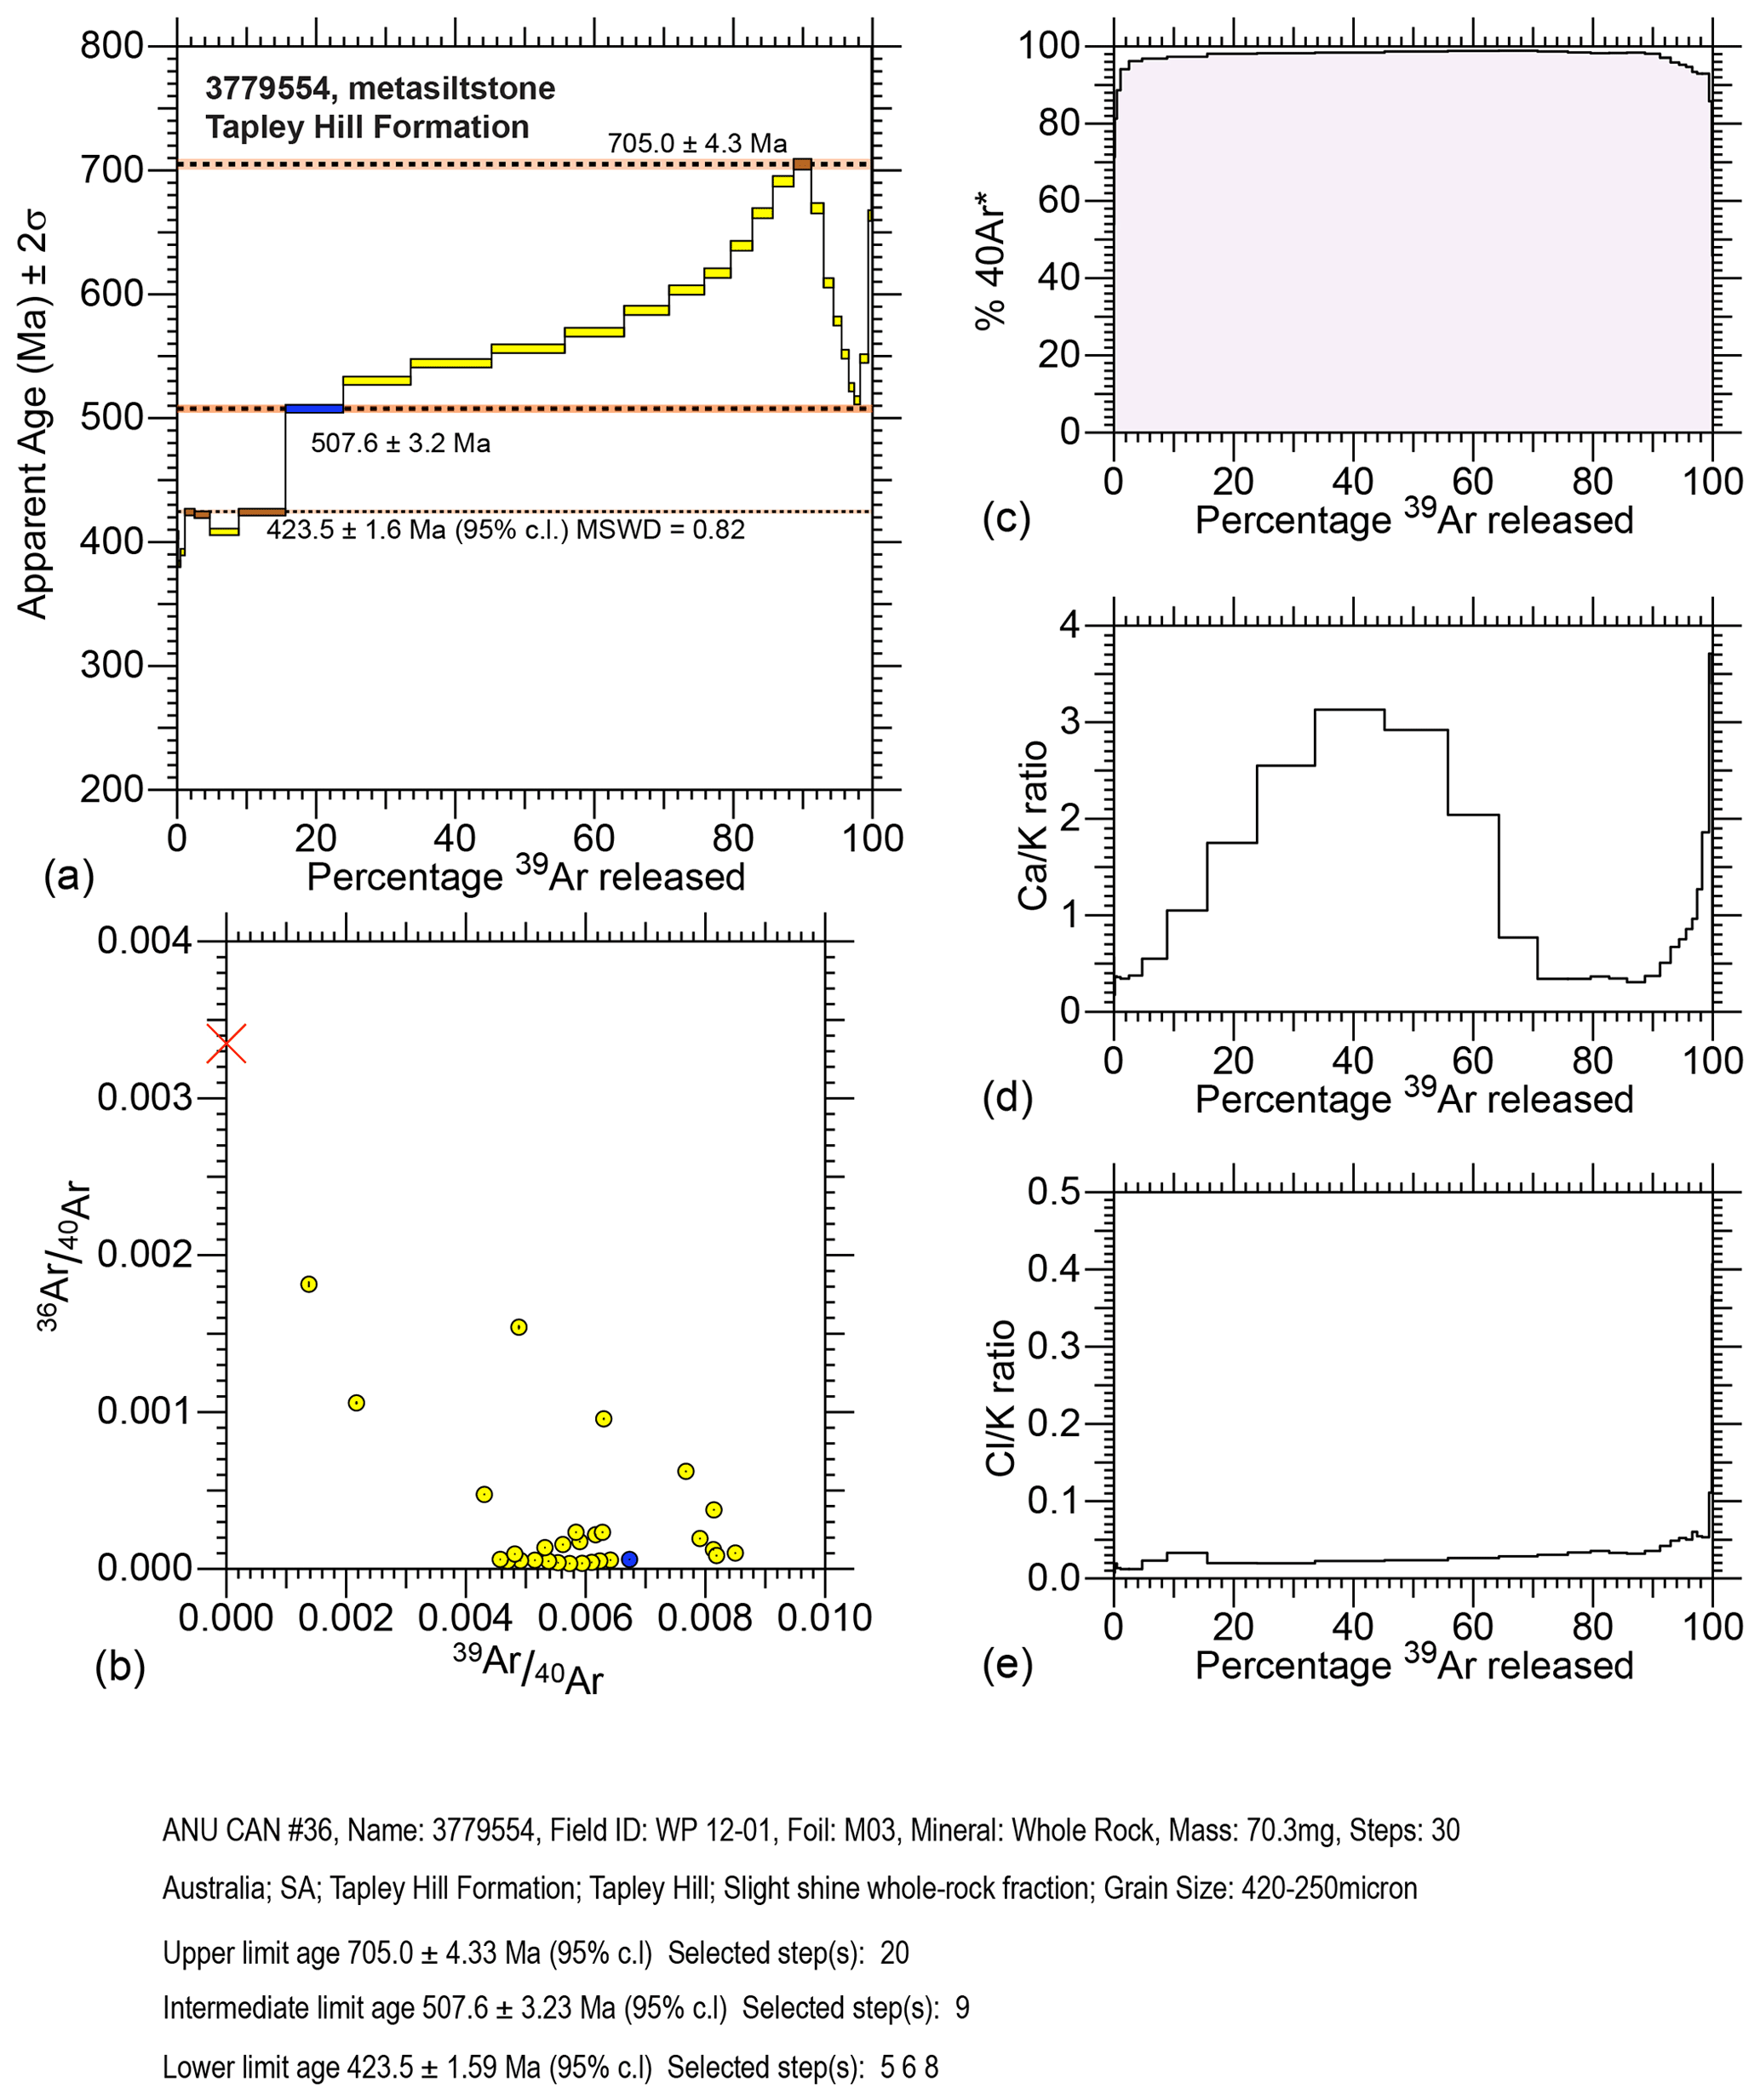
Figure C5Sample 3779554 (a) age spectrum, (b) isotope correlation diagram, (c) percentage radiogenic 40Ar (40Ar∗), (d) Ca K ratio, and (e) Cl K ratio.
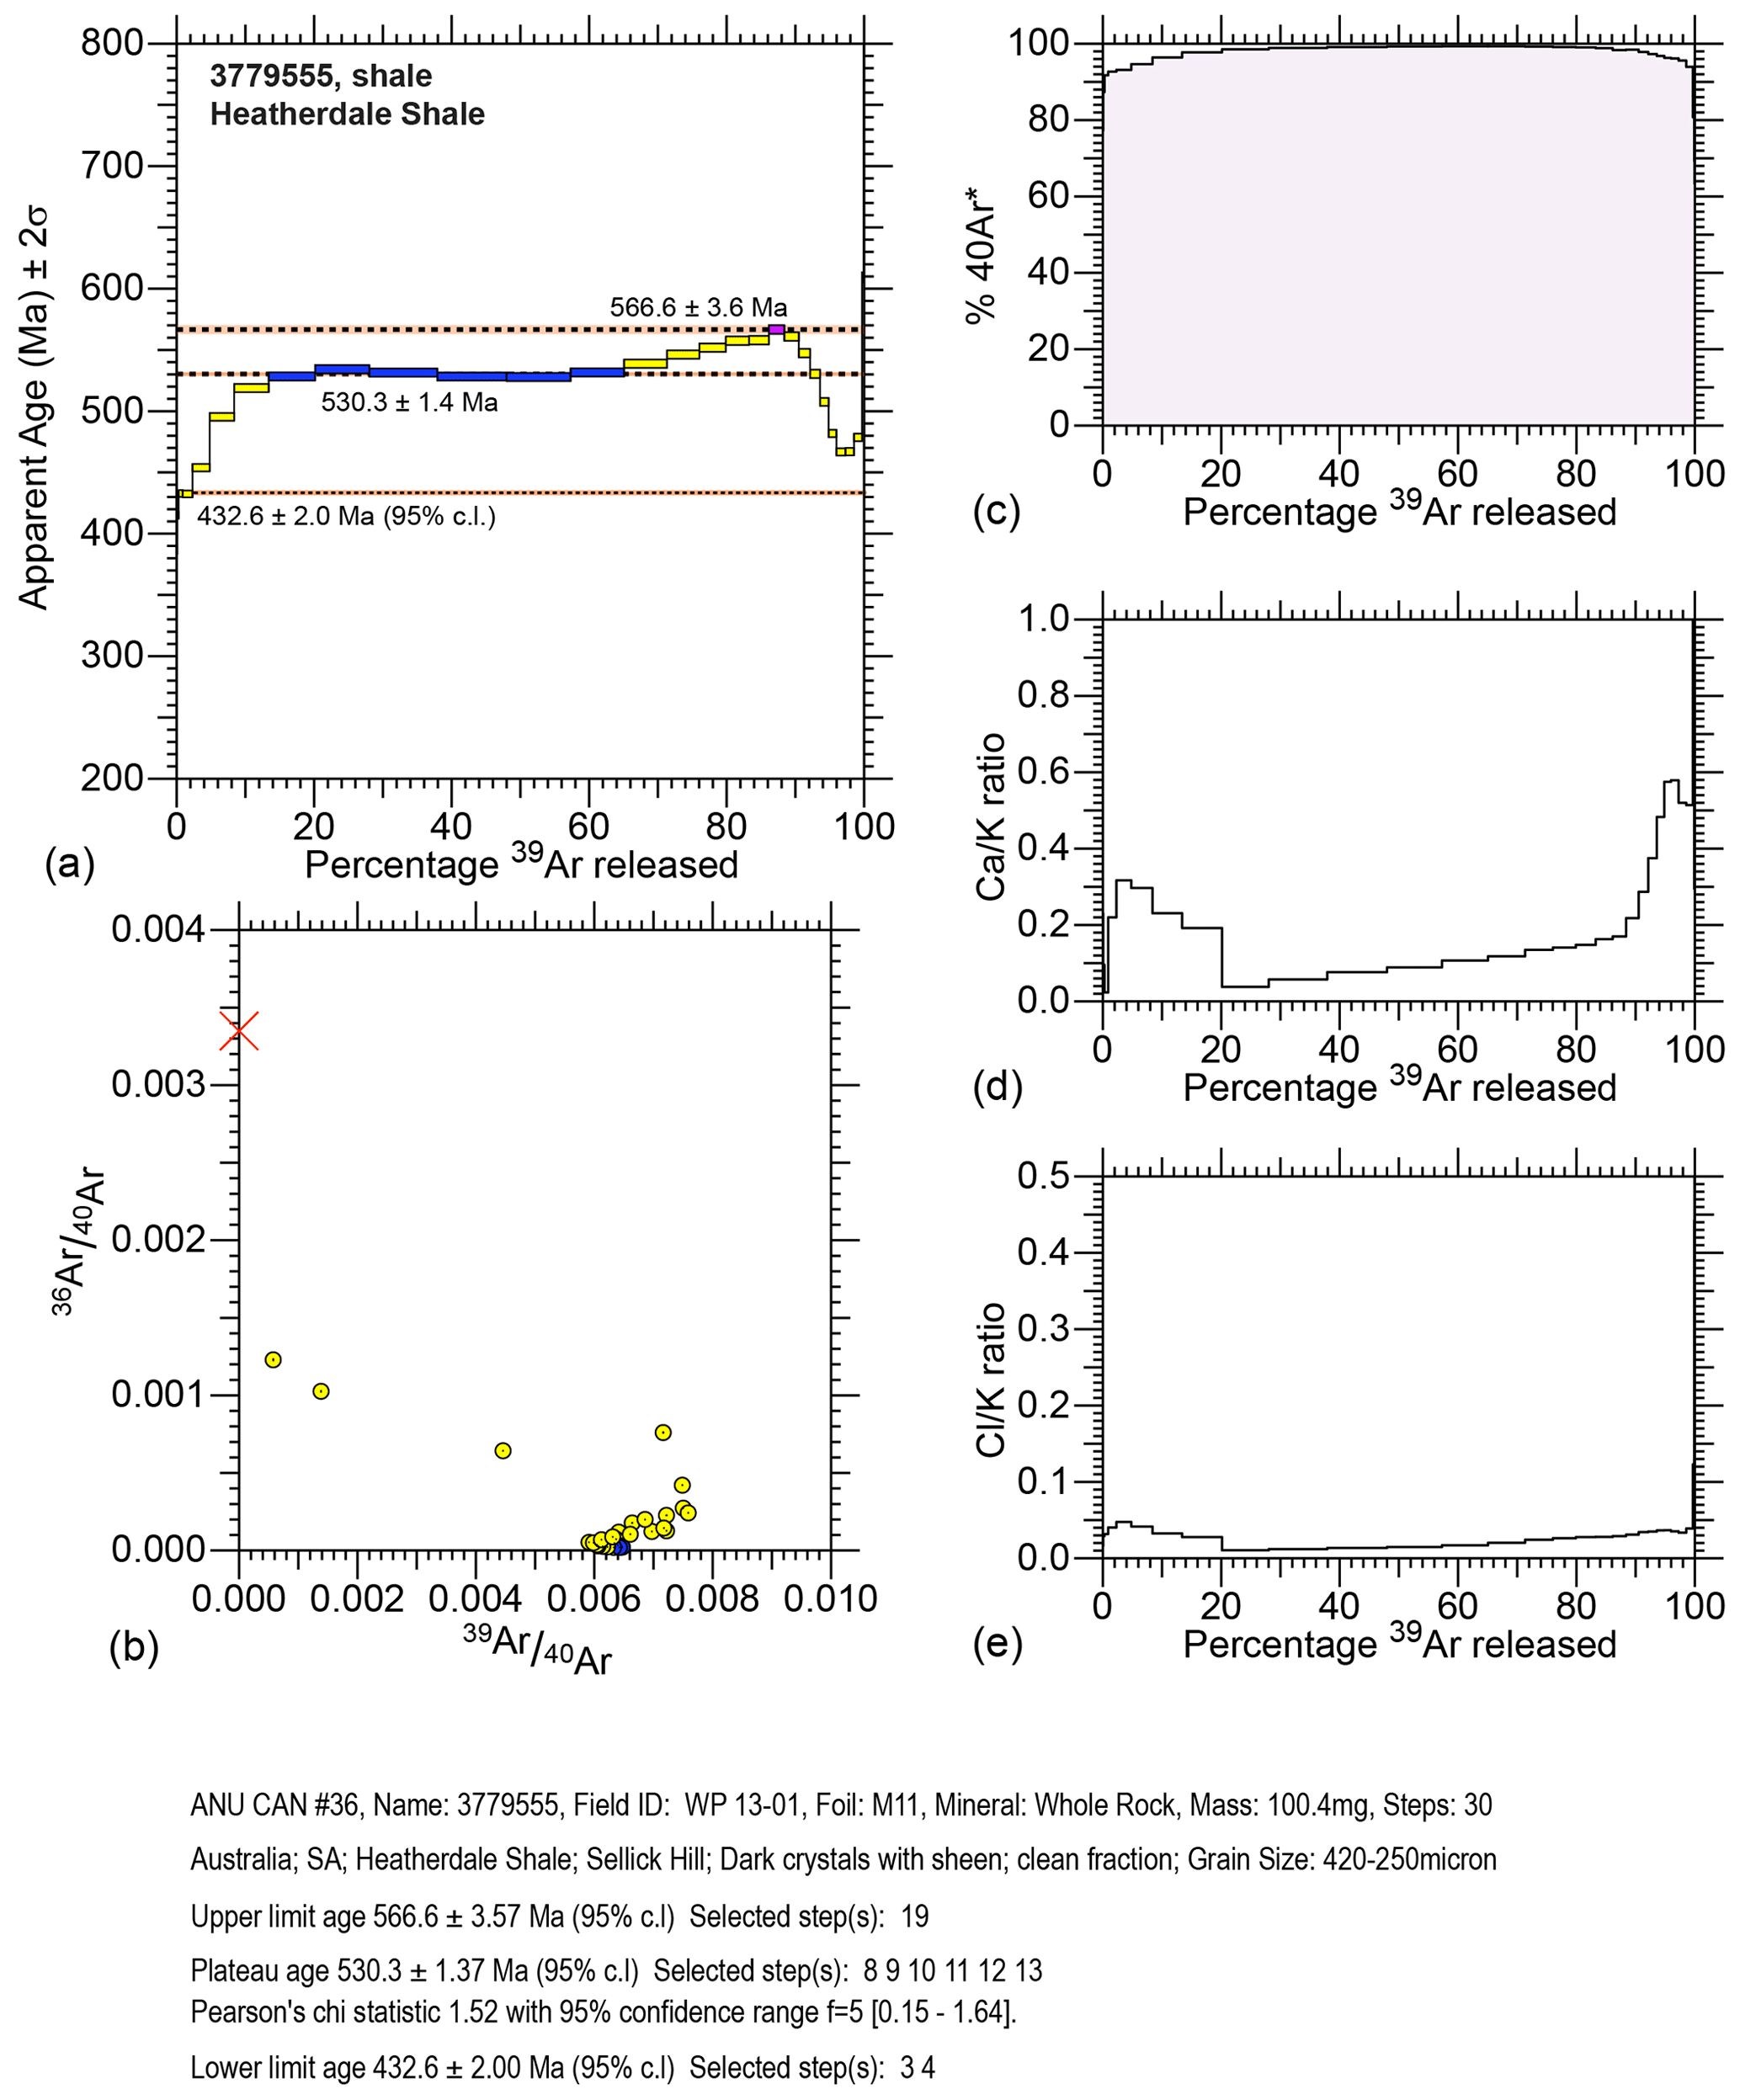
Figure C6Sample 3779555 (a) age spectrum, (b) isotope correlation diagram, (c) percentage radiogenic 40Ar (40Ar∗), (d) Ca K ratio, and (e) Cl K ratio.
All data from this study can be accessed via a data repository at https://doi.org/10.17632/g75hgmypbw.2 (Reid and Forster, 2022).
Study design and fieldwork was performed by AR, MF, WP, and SC. Sample preparation and analysis were done by MF, DV, GL, NG, and AC. Interpretation and data analysis were done by AR, MF, WP, AC, SC, TW, DV, NG and GL. AR prepared the manuscript with contributions from all co-authors.
The contact author has declared that neither they nor their co-authors have any competing interests.
Publisher's note: Copernicus Publications remains neutral with regard to jurisdictional claims in published maps and institutional affiliations.
This is MinEx CRC Document 2022/27. Georgina Gordon is thanked for assistance with HyLogger™ analysis at the Department for Energy and Mining's South Australian Drill Core Reference Library, Adelaide. This study has benefited greatly from insightful reviews by Jörg Pfänder and an anonymous reviewer.
This research has been supported by the Mineral Exploration Cooperative Research Centre, whose activities are funded by the Australian Government’s Cooperative Research Centre Program. The work is also supported by the Geological Survey of South Australia, Department for Energy and Mining.
This paper was edited by Klaus Mezger and reviewed by Jörg Pfänder and one anonymous referee.
Betts, M. J., Paterson, J. R., Jacquet, S. M., Andrew, A. S., Hall, P. A., Jago, J. B., Jagodzinski, E. A., Preiss, W. V., Crowley, J. L., Brougham, T., Mathewson, C. P., García-Bellido, D. C., Topper, T. P., Skovsted, C. B., and Brock, G. A.: Early Cambrian chronostratigraphy and geochronology of South Australia, Earth-Sci. Rev., 185, 498–543, https://doi.org/10.1016/j.earscirev.2018.06.005, 2018.
Blewett, S. C. J., Phillips, D., and Matchan, E. L.: Provenance of Cape Supergroup sediments and timing of Cape Fold Belt orogenesis: Constraints from high-precision 40Ar 39Ar dating of muscovite, Gondwana Res., 70, 201–221, https://doi.org/10.1016/j.gr.2019.01.009, 2019.
Burtt, A. C. and Phillips, D.: 40Ar 39Ar dating of muscovite from a pegmatite in Kinchina Quarry, near Murray Bridge, MESA Journal, 28, 50–52, 2003.
Cawood, P. A.: Terra Australis Orogen: Rodinia breakup and development of the Pacific and Iapetus margins of Gondwana during the Neoproterozoic and Paleozoic, Earth-Sci. Rev., 69, 249–279, https://doi.org/10.1016/j.earscirev.2004.09.001, 2005.
Cawood, P. A., Johnson, M. R. W., and Nemchin, A. A.: Early Palaeozoic orogenesis along the Indian margin of Gondwana: Tectonic response to Gondwana assembly, Earth Planet. Sci. Lett., 255, 70–84, https://doi.org/10.1016/j.epsl.2006.12.006, 2007.
Cayley, R. and Skladzien, P.: Structure, in: Regional geology and mineral systems of the Stavely Arc, western Victoria, edited by: Schofield, A., Record 2018/02, Geoscience Australia, Canberra, https://doi.org/10.11636/Record.2018.002, 2018.
Chan, Y.-C., Crespi, J. M., and Hodges, K. V.: Dating cleavage formation in slates and phyllites with the 40Ar 39Ar laser microprobe: an example from the western New England Appalachians, USA, Terra Nova, 12, 264–271, https://doi.org/10.1046/j.1365-3121.2000.00308.x, 2000.
Clauer, N.: The K-Ar and 40Ar 39Ar methods revisited for dating fine-grained K-bearing clay minerals, Chem. Geol., 354, 163–185, https://doi.org/10.1016/j.chemgeo.2013.05.030, 2013.
Collins, W. J.: Nature of extensional accretionary orogens, Tectonics, 21, 1–6, 2002.
Cosca, M. A., Hunziker, J. C., Huon, S., and Masson, H.: Radiometric age constraints on mineral growth, metamorphism, and tectonism of the Gummfluh Klippe, Briançonnais domain of the Préalpes, Switzerland, Contrib. Mineral. Petr., 112, 439–449, https://doi.org/10.1007/BF00310776, 1992.
Dallmeyer, R. D. and Takasu, A.: 40Ar 39Ar ages of detrital muscovite and whole-rock slate/phyllite, Narragansett Basin, RI-MA, USA: implications for rejuvenation during very low-grade metamorphism, Contrib. Mineral. Petr., 110, 515–527, https://doi.org/10.1007/BF00344085, 1992.
Dallmeyer, R. D., Mitchell, J. G., Pharaoh, T. C., Reuter, A., and Andresen, A.: K-Ar and 40Ar 39Ar whole-rock ages of slate/phyllite from allochthonous basement and cover in the tectonic windows of Finnmark, Norway: Evaluating the extent and timing of Caledonian tectonothermal activity, GSA Bulletin, 100, 1493–1501, https://doi.org/10.1130/0016-7606(1988)100<1493:Kaaaaw>2.3.Co;2, 1988.
Di Vincenzo, G., Viti, C., and Rocchi, S.: The effect of chlorite interlayering on 40Ar–39Ar biotite dating: an 40Ar–39Ar laser-probe and TEM investigations of variably chloritised biotites, Contrib. Mineral. Petr., 145, 643–658, https://doi.org/10.1007/s00410-003-0472-z, 2003.
Dunlap, W. J., Teyssier, C., McDougall, I., and Baldwin, S.: Ages of deformation from K/Ar and 40Ar 39Ar dating of white micas, Geology, 19, 1213–1216, https://doi.org/10.1130/0091-7613(1991)019<1213:Aodfka>2.3.Co;2, 1991.
Dymoke, P. and Sandiford, M.: Phase relationships in Buchan facies series pelitic assemblages: calculations with application to andalusite-staurolite parageneses in the Mount Lofty Ranges, South Australia, Contrib. Mineral. Petr., 110, 121–132, https://doi.org/10.1007/BF00310886, 1992.
Fergusson, C. L. and Phillips, D.: 40Ar 39Ar and K–Ar age constraints on the timing of regional deformation, south coast of New South Wales, Lachlan Fold Belt: Problems and implications, Aust. J. Earth Sci., 48, 395–408, https://doi.org/10.1046/j.1440-0952.2001.00866.x, 2001.
Flottmann, T. and James, P.: Influence of basin architecture on the style of inversion and fold-thrust belt tectonics – the southern Adelaide Fold-Thrust Belt, South Australia, J. Struct. Geol., 19, 1093–1110, https://doi.org/10.1016/S0191-8141(97)00033-3, 1997.
Flottmann, T., Haines, P., Jago, J., James, P., Belperio, A. P., and Gum, J.: Formation and reactivation of the Cambrian Kanmantoo Trough, SE Australia: implications for early Palaeozoic tectonics at eastern Gondwana's plate margin, J. Geol. Soc., 155, 525–539, 1998.
Foden, J., Sandiford, M., Dougherty-Page, J., and Williams, I.: Geochemistry and geochronology of the Rathjen Gneiss: Implications for the early tectonic evolution of the Delamerian Orogen, Aust. J. Earth Sci., 46, 377–389, https://doi.org/10.1046/j.1440-0952.1999.00712.x, 1999.
Foden, J., Elburg, M. A., Dougherty-Page, J., and Burtt, A.: The Timing and Duration of the Delamerian Orogeny: Correlation with the Ross Orogen and Implications for Gondwana Assembly, J. Geol., 114, 189–210, 2006.
Foden, J., Elburg, M., Turner, S., Clark, C., Blades, M. L., Cox, G., Collins, A. S., Wolff, K., and George, C.: Cambro-Ordovician magmatism in the Delamerian orogeny: Implications for tectonic development of the southern Gondwanan margin, Gondwana Res., 81, 490–521, https://doi.org/10.1016/j.gr.2019.12.006, 2020.
Foland, K. A., Hubacher, F. A., and Arehart, G. B.: 40Ar39Ar dating of very fine-grained samples: An encapsulated-vial procedure to overcome the problem of 39Ar recoil loss, Chem. Geol., 102, 269–276, https://doi.org/10.1016/0009-2541(92)90161-W, 1992.
Forster, M. and Lister, G.: Core-complex-related extension of the Aegean lithosphere initiated at the Eocene-Oligocene transition, J. Geophys. Res.-Sol. Ea., 114, B02401, https://doi.org/10.1029/2007JB005382, 2009.
Forster, M. A. and Lister, G. S.: The interpretation of 40Ar 39Ar apparent age spectra produced by mixing: application of the method of asymptotes and limits, J. Struct. Geol., 26, 287–305, https://doi.org/10.1016/j.jsg.2003.10.004, 2004.
Forster, M. A. and Lister, G. S.: Argon enters the retentive zone: reassessment of diffusion parameters for K-feldspar in the South Cyclades Shear Zone, Ios, Greece, in: Advances in Interpretation of Geological Processes: Refinement of Multi-scale Data and Integration in Numerical Modelling, edited by: Spalla, M. I., Marotta, A. M., and Gosso, G., Geological Society of London, https://doi.org/10.1144/sp332.2, 2010.
Glen, R. A.: Refining accretionary orogen models for the Tasmanides of eastern Australia, Aust. J. Earth Sci., 60, 315–370, https://doi.org/10.1080/08120099.2013.772537, 2013.
Glen, R. A. and Cooper, R. A.: Evolution of the East Gondwana convergent margin in Antarctica, southern Australia and New Zealand from the Neoproterozoic to latest Devonian, Earth-Sci. Rev., 220, 103687, https://doi.org/10.1016/j.earscirev.2021.103687, 2021.
Glen, R. A., Quinn, C. D., and Cooke, D. R.: The Macquarie Arc, Lachlan Orogen, New South Wales: its evolution, tectonic setting and mineral deposits, Episodes, 35, 177–186, https://doi.org/10.18814/epiiugs/2012/v35i1/017, 2012.
Haest, M., Cudahy, T., Laukamp, C., and Gregory, S.: Quantitative Mineralogy from Infrared Spectroscopic Data. I. Validation of Mineral Abundance and Composition Scripts at the Rocklea Channel Iron Deposit in Western Australia, Econ. Geol., 107, 209–228, https://doi.org/10.2113/econgeo.107.2.209, 2012.
Haines, P. W., Turner, S. P., Kelley, S. P., Wartho, J.-A., and Sherlock, S. C.: 40Ar–39Ar dating of detrital muscovite in provenance investigations: a case study from the Adelaide Rift Complex, South Australia, Earth Planet. Sci. Lett., 227, 297–311, https://doi.org/10.1016/j.epsl.2004.08.020, 2004.
Harrison, T. M., Célérier, J., Aikman, A. B., Hermann, J., and Heizler, M. T.: Diffusion of 40Ar in muscovite, Geochim. Cosmochim. Ac., 73, 1039–1051, https://doi.org/10.1016/j.gca.2008.09.038, 2009.
Ireland, T. R., Flottmann, T., Fanning, C. M., Gibson, G. M., and Preiss, W. V.: Development of the early Paleozoic Pacific margin of Gandwana from detrital-zircon ages across the Delamerian orogen, Geology, 26, 243–246, 1998.
Keeman, J., Turner, S., Haines, P. W., Belousova, E., Ireland, T., Brouwer, P., Foden, J., and Wörner, G.: New UPb, Hf and O isotope constraints on the provenance of sediments from the Adelaide Rift Complex – Documenting the key Neoproterozoic to early Cambrian succession, Gondwana Res., 83, 248–278, https://doi.org/10.1016/j.gr.2020.02.005, 2020.
Kemp, A. I. S., Hawkesworth, C. J., Collins, W. J., Gray, C. M., and Blevin, P. L.: Isotopic evidence for rapid continental growth in an extensional accretionary orogen: The Tasmanides, eastern Australia, Earth Planet. Sci. Lett., 284, 455–466, https://doi.org/10.1016/j.epsl.2009.05.011, 2009.
Kemp, A. I. S., Blevin, P. L., and Norman, M. D.: A SIMS U-Pb (zircon) and Re-Os (molybdenite) isotope study of the early Paleozoic Macquarie Arc, southeastern Australia: Implications for the tectono-magmatic evolution of the paleo-Pacific Gondwana margin, Gondwana Res., 82, 73–96, https://doi.org/10.1016/j.gr.2019.12.015, 2020.
Kendall, B., Creaser, R. A., and Selby, D.: Re-Os geochronology of postglacial black shales in Australia: Constraints on the timing of “Sturtian” glaciation, Geology, 34, 729–732, https://doi.org/10.1130/g22775.1, 2006.
Kirkland, C. L., Daly, J. S., Chew, D. M., and Page, L. M.: The Finnmarkian Orogeny revisited: An isotopic investigation in eastern Finnmark, Arctic Norway, Tectonophysics, 460, 158–177, https://doi.org/10.1016/j.tecto.2008.08.001, 2008.
Kirschner, D. L., Masson, H., and Cosca, M. A.: An 40Ar 39Ar, Rb Sr, and stable isotope study of micas in low-grade fold-and-thrust belt: an example from the Swiss Helvetic Alps, Contrib. Mineral. Petr., 145, 460–480, https://doi.org/10.1007/s00410-003-0461-2, 2003.
Lee, J.-Y., Marti, K., Severinghaus, J. P., Kawamura, K., Yoo, H.-S., Lee, J. B., and Kim, J. S.: A redetermination of the isotopic abundances of atmospheric Ar, Geochim. Cosmochim. Ac., 70, 4507–4512, https://doi.org/10.1016/j.gca.2006.06.1563, 2006.
Lewis, C., Huston, D., Schofield, A., Cayley, R. A., and Taylor, D.: New geochronology constraints on the development and duration of the Stavely Arc, in: Regional geology and mineral systems of the Stavely Arc, western Victoria, edited by: Schofield, A., Record 2018/02, Geoscience Australia, Canberra, https://doi.org/10.11636/Record.2018.002, 2018.
Lloyd, J. C., Blades, M. L., Counts, J. W., Collins, A. S., Amos, K. J., Wade, B. P., Hall, J. W., Hore, S., Ball, A. L., Shahin, S., and Drabsch, M.: Neoproterozoic geochronology and provenance of the Adelaide Superbasin, Precambrian Res., 350, 105849, https://doi.org/10.1016/j.precamres.2020.105849, 2020.
Lo, C.-H. and Onstott, T. C.: 39Ar recoil artifacts in chloritized biotite, Geochim. Cosmochim. Ac., 53, 2697–2711, https://doi.org/10.1016/0016-7037(89)90141-5, 1989.
Mancktelow, N. S.: The structure of the southern Adelaide Fold Belt, South Australia, in: The evolution of a late Precambrian-early Paleozoic rift complex: the Adelaide Geosyncline, edited by: Jago, J. B. and Moore, P. S., Geological Society of Australia Special Publication, 16, 369–395, ISBN 0909869715, 1990.
Mason, P., Berman, M., Guo, Y., Warren, P., Lagerstrom, R., Bischof, L., Huntington, J., and Rodger, A.: The Spectral Geologist (8.1.0.3), CSIRO, https://research.csiro.au/thespectralgeologist/support/downloads/ (last access: January 2021), 2020.
McDougall, I. and Harrison, T. M.: Geochronology and thermochronology by the 40Ar 39Ar method, 2nd edn., Oxford University Press, New York, 212 pp., ISBN 0195043022, 1999.
Muston, J., Forster, M., Vasegh, D., Alderton, C., Crispin, S., and Lister, G.: Direct dating of overprinting fluid systems in the Martabe epithermal gold deposit using highly retentive alunite, Geochronology Discuss. [preprint], https://doi.org/10.5194/gchron-2021-25, in review, 2021.
Najman, Y. M. R., Pringle, M. S., Johnson, M. R. W., Robertson, A. H. F., and Wijbrans, J. R.: Laser 40Ar 39Ar dating of single detrital muscovite grains from early foreland-basin sedimentary deposits in India: Implications for early Himalayan evolution, Geology, 25, 535–538, https://doi.org/10.1130/0091-7613(1997)025<0535:Laados>2.3.Co;2, 1997.
Nteme, J., Scaillet, S., Brault, P., and Tassan-Got, L.: Atomistic Simulations of 40Ar Diffusion in Muscovite, Geochim. Cosmochim. Ac., https://doi.org/10.1016/j.gca.2022.05.004, in press, 2022.
Offler, R. and Fleming, P. D.: A synthesis of folding and metamorphism in the Mt. Lofty Ranges, South Australia, J. Geol. Soc. Aust., 15, 245–266, https://doi.org/10.1080/00167616808728697, 1968.
Palin, R. M. and Dyck, B.: Metamorphism of Pelitic (Al-Rich) Rocks, in: Encyclopedia of Geology (Second Edition), edited by: Alderton, D. and Elias, S. A., Academic Press, Oxford, 445–456, https://doi.org/10.1016/B978-0-08-102908-4.00081-3, 2021.
Phillips, D., Fu, B., Wilson, C. J. L., Kendrick, M. A., Fairmaid, A. M., and Miller, J. M.: Timing of gold mineralisation in the western Lachlan Orogen, SE Australia: A critical overview, Aust. J. Earth Sci., 59, 495–525, https://doi.org/10.1080/08120099.2012.682738, 2012.
Popov, D. V., Brovchenko, V. D., Nekrylov, N. A., Plechov, P. Y., Spikings, R. A., Tyutyunnik, O. A., Krigman, L. V., Anosova, M. O., Kostitsyn, Y. A., and Soloviev, A. V.: Removing a mask of alteration: Geochemistry and age of the Karadag volcanic sequence in SE Crimea, Lithos, 324–325, 371–384, https://doi.org/10.1016/j.lithos.2018.11.024, 2019.
Preiss, W. V.: The Adelaide Geosyncline: Late Proterozoic stratigraphy, sedimentation, palaeontology and tectonics, Geological Survey of South Australia – Bulletin 53, Adelaide, 428 pp., ISBN 0724378456, 1987.
Preiss, W. V.: Delamerian Orogeny, in: The geology of South Australia; Volume 2, The Phanerozoic, edited by: Drexel, J. F., Preiss, W. V., and Parker, A. J., Geological Survey of South Australia – Bulletin 54 Adelaide, 45–59, ISBN 0730806219, 1995a.
Preiss, W. V.: Rb Sr dating of differentiated cleavage from the upper Adelaidean metasediments at Hallett Cove, southern Adelaide fold belt: Discussion, J. Struct. Geol., 17, 1797–1800, https://doi.org/10.1016/0191-8141(95)00094-T, 1995b.
Preiss, W. V.: The Adelaide Geosyncline of South Australia and its significance in Neoproterozoic continental reconstruction, Precambrian Res., 100, 21–63, 2000.
Preiss, W. V.: The tectonic history of Adelaide's scarp-forming faults, Aust. J. Earth Sci., 66, 305–365, https://doi.org/10.1080/08120099.2018.1546228, 2019.
Reid, A. and Forster, M.: Complex 40Ar 39Ar age spectra from low metamorphic grade rocks, Delamerian Orogen, Reid et al., Mendeley Data, V2 [data set], https://doi.org/10.17632/g75hgmypbw.2, 2022.
Renne, P. R., Balco, G., Ludwig, K. R., Mundil, R., and Min, K.: Response to the comment by W. H. Schwarz et al. on “Joint determination of 40K decay constants and 40Ar∗ 40K for the Fish Canyon sanidine standard, and improved accuracy for 40Ar 39Ar geochronology” by P. R. Renne et al. (2010), Geochim. Cosmochim. Ac., 75, 5097–5100, https://doi.org/10.1016/j.gca.2011.06.021, 2011.
Rosenbaum, G.: The Tasmanides: Phanerozoic Tectonic Evolution of Eastern Australia, Annu. Rev. Earth Pl. Sc., 46, 291–325, https://doi.org/10.1146/annurev-earth-082517-010146, 2018.
Schaen, A. J., Jicha, B. R., Hodges, K. V., Vermeesch, P., Stelten, M. E., Mercer, C. M., Phillips, D., Rivera, T. A., Jourdan, F., Matchan, E. L., Hemming, S. R., Morgan, L. E., Kelley, S. P., Cassata, W. S., Heizler, M. T., Vasconcelos, P. M., Benowitz, J. A., Koppers, A. A. P., Mark, D. F., Niespolo, E. M., Sprain, C. J., Hames, W. E., Kuiper, K. F., Turrin, B. D., Renne, P. R., Ross, J., Nomade, S., Guillou, H., Webb, L. E., Cohen, B. A., Calvert, A. T., Joyce, N., Ganerød, M., Wijbrans, J., Ishizuka, O., He, H., Ramirez, A., Pfänder, J. A., Lopez-Martínez, M., Qiu, H., and Singer, B. S.: Interpreting and reporting 40Ar 39Ar geochronologic data, GSA Bulletin, 133, 461–487, https://doi.org/10.1130/b35560.1, 2020.
Schodlok, M. C., Whitbourn, L., Huntington, J., Mason, P., Green, A., Berman, M., Coward, D., Connor, P., Wright, W., Jolivet, M., and Martinez, R.: HyLogger-3, a visible to shortwave and thermal infrared reflectance spectrometer system for drill core logging: functional description, Aust. J. Earth Sci., 63, 929–940, 2016.
Spell, T. L. and McDougall, I.: Characterization and calibration of 40Ar 39Ar dating standards, Chem. Geol., 198, 189–211, https://doi.org/10.1016/S0009-2541(03)00005-6, 2003.
Stuart, F. M.: The exhumation history of orogenic belts from 40Ar 39Ar ages of detrital micas, Mineral. Mag., 66, 121–135, https://doi.org/10.1180/0026461026610017, 2002.
Tetley, N., McDougall, I., and Heydegger, H. R.: Thermal neutron interferences in the 40Ar 39Ar dating technique, J. Geophys. Res.-Sol. Ea., 85, 7201–7205, https://doi.org/10.1029/JB085iB12p07201, 1980.
Turner, S., Sandiford, M., Flöttmann, T., and Foden, J.: Rb Sr dating of differentiated cleavage from the upper Adelaidean metasediments at Hallett Cove, southern Adelaide fold belt, J. Struct. Geol., 16, 1233–1241, https://doi.org/10.1016/0191-8141(94)90066-3, 1994.
Turner, S., Haines, P., Foster , D., Powell, R., Sandiford, M., and Offler, R.: Did the Delamerian Orogeny Start in the Neoproterozoic?, J. Geol., 117, 575–583, https://doi.org/10.1086/600866, 2009.
Turner, S. P., Kelley, S. P., VandenBerg, A. H. M., Foden, J. D., Sandiford, M., and Flöttmann, T.: Source of the Lachlan fold belt flysch linked to convective removal of the lithospheric mantle and rapid exhumation of the Delamerian-Ross fold belt, Geology, 24, 941–944, https://doi.org/10.1130/0091-7613(1996)024<0941:sotlfb>2.3.co;2, 1996.
Zack, T. and Hogmalm, K. J.: Laser ablation Rb Sr dating by online chemical separation of Rb and Sr in an oxygen-filled reaction cell, Chem. Geol., 437, 120–133, https://doi.org/10.1016/j.chemgeo.2016.05.027, 2016.
- Abstract
- Introduction
- Geological setting
- Sample descriptions
- The 40Ar 39Ar analytical methods
- The 40Ar 39Ar age spectra results
- Discussion
- Conclusion
- Appendix A: Hyperspectral mineralogical methods and results
- Appendix B: Details of 40Ar 39Ar analytical methods
- Appendix C: Isotopic data plots for samples of this study
- Data availability
- Author contributions
- Competing interests
- Disclaimer
- Acknowledgements
- Financial support
- Review statement
- References