the Creative Commons Attribution 4.0 License.
the Creative Commons Attribution 4.0 License.
 | 21 Jul 2022
Technical note: Rapid phase identification of apatite and zircon grains for geochronology using X-ray micro-computed tomography
Florian Hofmann
Ryley M. C. Tibbetts
Anahi Carrera
Aya Takase
Aaron J. Celestian
Apatite and zircon are among the best-studied and most widely used accessory minerals for geochronology and thermochronology. Given that apatite and zircon are often present in the same lithologies, distinguishing the two phases in crushed mineral separates is a common task for geochronology, thermochronology, and petrochronology studies. Here we present a method for efficient and accurate apatite and zircon mineral phase identification and verification using X-ray micro-computed tomography (microCT) of grain mounts that provides additional three-dimensional grain size, shape, and inclusion suite information. In this study, we analyze apatite and zircon grains from Fish Canyon Tuff samples that went through methylene iodide (MEI) and lithium heteropolytungstate (LST) heavy liquid density separations. We validate the microCT results using known standards and phase identification with Raman spectroscopy, demonstrating that apatite and zircon are distinguishable from each other and other common phases, e.g., titanite, based on microCT X-ray density. We present recommended microCT scanning protocols after systematically testing the effects of different scanning parameters and sample positions. This methodology can help to reduce time spent performing density separations with highly toxic chemicals and visually inspecting grains under a light microscope, and the improved mineral identification and characterization can make geochronologic data more robust.
- Article
(6491 KB) - Full-text XML
-
Supplement
(422 KB) - BibTeX
- EndNote


Apatite and zircon are mineral phases widely used for geochronology and thermochronology using the U-Pb (e.g., Bowring and Schmitz, 2003), (U-Th)/He (e.g., Farley, 2002), and fission track (e.g., Tagami and O'Sullivan, 2005) methods. Particularly for (U-Th)/He, correct identification of these phases (e.g., Guenthner et al., 2016), characterization of the crystal shape (Farley et al., 1996), and the absence of mineral and fluid inclusions (e.g., Lippolt et al., 1994; Vermeesch et al., 2007) are important factors in producing reliable high-quality geo- and thermochronologic data. The standard approach to selecting apatite and zircon grains for geo- and thermochronology is to (1) crush and grind rock samples into their mineral constituents; (2) perform magnetic and density separation which may include a Frantz isodynamic separator, water table, and heavy liquids to filter for the mineral of choice; and then (3) pick individual grains from these separates under a transmitted light microscope (e.g., Gautheron et al., 2021).
Different heavy liquid solutions used for density separation can either produce grain fractions that have apatite and zircon mixed together or separated (e.g., Dumitru and Stockli, 1998; Koroznikova et al., 2008). The density of apatite () is 3.10–3.25 g cm−3 and depends on the solid solution composition between fluorapatite, chlorapatite, and hydroxylapatite (Hughes et al., 1989). Zircon (ZrSiO4) can display densities between 3.9 and 4.7 g cm−3, depending on the degree of metamictization (Holland and Gottfried, 1955). Although density-separated apatite and zircon fractions make picking the correct mineral easier (Dumitru and Stockli, 1998), the process often includes the use of toxic halogenated organic solutions, such as bromoform (CHBr3) and diiodomethane (CH2l2, methylene iodide, commonly abbreviated as MEI, MI, or DIM; e.g., Hauff and Airey, 1980). Typically, bromoform (2.89 g cm−3) is used in a first step to separate quartz and feldspar and the resulting heavy fraction is then treated with MEI (3.32 g cm−3) to separate apatite and zircon (e.g., Dumitru and Stockli, 1998).
Both bromoform and MEI are known to be toxic. Specifically, MEI can cause acute symptoms through skin contact or inhalation, and acute toxicity and death have been documented for a case of ingestion (Weimerskirch et al., 1990). MEI has also been shown to be mutagenic, meaning that acute or long-term exposure may impact reproductive health, particularly in pregnant women (Van Bladeren et al., 1980; Osterman-Golkar et al., 1983; Buijs et al., 1984; Roldán-Arjona and Pueyo, 1993). In addition, samples separated with MEI are typically washed with acetone, and the mixture of these chemicals is highly flammable. Burning MEI has the potential to produce large amounts of free iodine, which also poses a significant health risk (Hauff and Airey, 1980). Due to its toxicity, MEI must be used in a vent hood with proper personal protective equipment (PPE) and requires special training in safe handling techniques (Dumitru and Stockli, 1998).
Safety precautions required for hazardous chemical handling may exclude workers or students with conditions that do not allow them to comply with the safety precautions. For example, personal protective equipment may only be available in restricted sizes, and fume hood design is often incompatible with the use of wheelchairs or other mobility devices. Thus, eliminating hazardous chemicals from laboratory procedures results in both a safer work environment and a more inclusive workplace.
Many labs elect to use lithium heteropolytungstate (LST), lithium metatungstate (LMT), and sodium polytungstate (SPT) because they are generally non-toxic and relatively inert (Munsterman and Kerstholt, 1996; Mounteney, 2011). Similar to bromoform (but less toxic), these heavy liquids can be used at densities of 2.8–3.0 g cm−3 to remove quartz and feldspar from the separate, but they do not separate apatite from zircon. Zircon and apatite crystals in natural samples exhibit a wide variety of morphologies depending on the lithology, sample history, or mineral separation methods used. In many cases, zircon and apatite crystals can be identified by eye under a binocular microscope based on crystal habit and relief. Optical methods such as crossed polarizers can be used in addition to crystal shape to distinguish these phases from each other as well as from other phases such as titanite, xenotime, monazite, allanite, rutile, baddeleyite, etc. However, it is not uncommon for a sample separate to include grains with sub-optimal morphologies, surface pitting, and broken surfaces, which make correct mineral identification a challenge even with the procedures described above. The challenge is greater in labs that include personnel inexperienced in picking and/or a suboptimal microscope setup.
Mistaken mineral identification can lead to significant issues in data analysis, quality, and interpretation. Depending on the geochronologic technique employed, this misidentification might be detected further along in the analytical procedures. In (U-Th)/He analysis, a mistake may be realized during degassing or dissolution. Due to their different diffusion behavior, zircon usually requires higher temperatures and longer laser heating times to fully extract He than for apatite (e.g., Farley, 2002). Apatite dissolves readily in a weak nitric acid, whereas zircon needs to be subjected to extensive Parr bomb pressure dissolution procedures using a mixture of nitric acid, hydrochloric acid, and hydrofluoric acid to be completely dissolved (Farley, 2002). As a result, a misidentified mineral may not be completely degassed or dissolved during the analytical procedure, leading to erroneous results. The presence of Ca or Zr in dissolved mineral solutions can be used during subsequent isotope-dilution inductively coupled plasma mass spectrometry (ICP-MS) analysis to test whether the correct phase was chosen for the analysis, as was demonstrated for (U-Th)/He by Guenthner et al. (2016).
Similar issues arise in other methods. In laser ablation analysis as part of U-Pb or (U-Th)/He dating, the ablation characteristics and the presence of Ca or Zr in the analyte can be used as diagnostic criteria. Etching parameters for fission track, such as the type and molarity of acids, etching time, and temperature conditions, are highly phase specific and need to be tightly controlled to yield reproducible and internally consistent data (Tagami and O'Sullivan, 2005). Applying zircon etching procedures to apatite grains might lead to the complete loss of a sample.
Given the amount of time and materials required by these analytical methods, misidentification of minerals can lead to significant monetary and time-effort losses. Many laboratories will use techniques to reduce mineral misidentification for challenging samples. These can include having a more experienced user look over selected grains, analyzing pre-selected grains under a scanning electron microscope (SEM) to measure elemental compositions with energy-dispersive spectroscopy (EDS), using Raman spectroscopy for phase identification, and others. Which of these techniques is employed at a given institution varies based on instrument availability, budget, and time allotted to this task.
Here we show that X-ray micro-computed tomography (microCT) scanning can be used as an effective pre-screening tool to distinguish between apatite and zircon and to detect misidentification of grains. MicroCT is growing in popularity in Earth science departments as benchtop systems make operations simpler and more affordable. Many universities already have microCT instruments available in engineering or health sciences departments.
The difference in apatite and zircon composition and densities (3.1–3.2 and 3.9–4.7 g cm−3, respectively) leads to differential X-ray absorption, which yields characteristic grayscale value contrast in microCT data (e.g., Ketcham and Carlson, 2001). In addition to phase identification, microCT data yields high-resolution three-dimensional grain shape measurements and reveals internal heterogeneities, such as fractures or inclusions (Evans et al., 2008; Glotzbach et al., 2019; Cooperdock et al., 2019). Resolution varies by instrument and depending on acquisition parameters; the instrument used in this study achieves a maximum voxel resolution of ∼2 µm/10 µm3. We explore different acquisition parameters to optimize the distinction between different minerals and minimize the scan time to yield a streamlined procedure for routine pre-screening of mineral grains for geochronologic applications.
2.1 Mineral separation
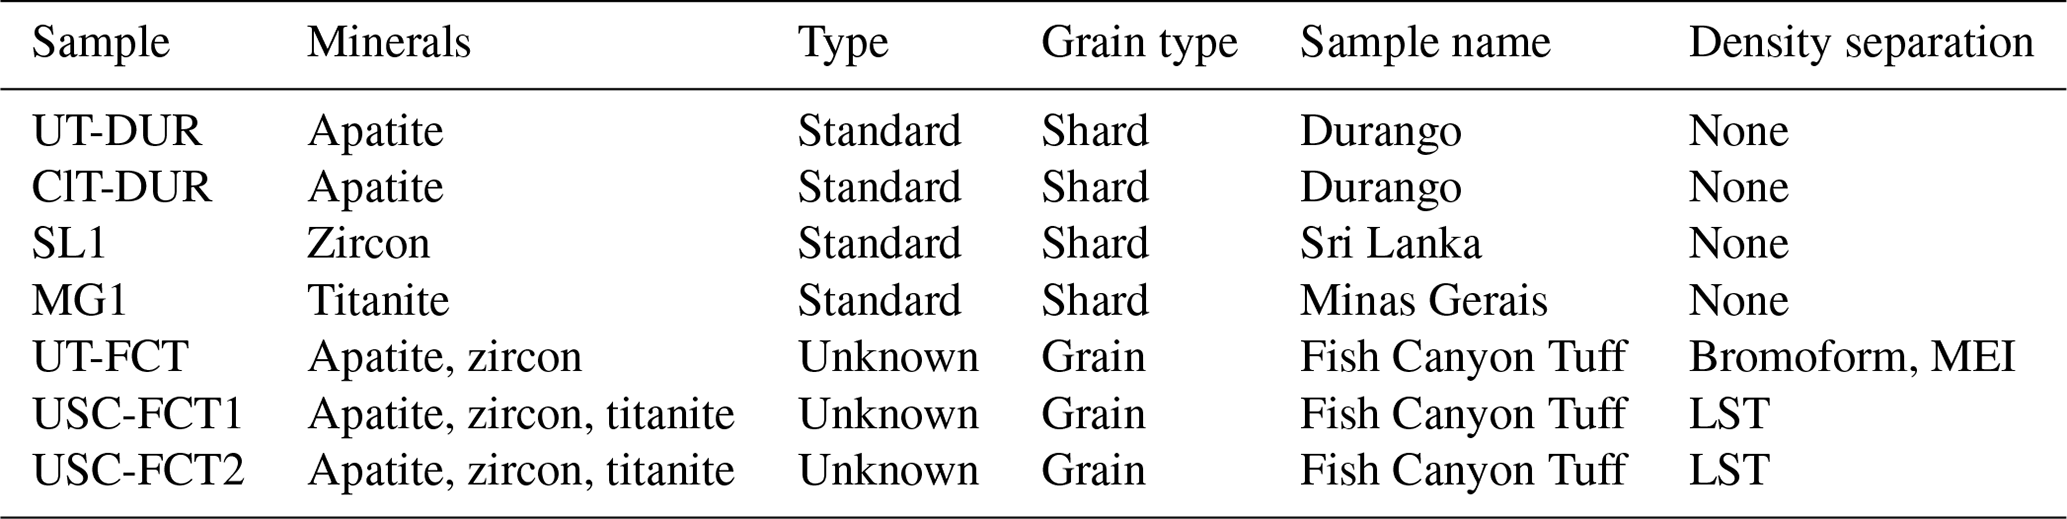
We selected Fish Canyon Tuff (FCT) as a test sample because it contains both apatite and zircon and is used as an age standard in many applications of geo- and thermochronology (McDowell et al., 2005; Donelick et al., 2005). We obtained three separate FCT samples: one mineral separate of an MEI heavy fraction given to us by the UTChron Laboratory at the University of Texas at Austin (UT-FCT), and two that we collected from two FCT localities near Monte Vista, CO (USC-FCT1: N, W; USC-FCT2: N, W). The two whole-rock samples were crushed on a jaw crusher and disk mill at the University of Southern California. Crushed samples were sieved and the 75–250 µm size fraction was washed before using a hand magnet and a Frantz isodynamic magnetic separator to remove magnetic fractions. Samples then underwent density separation using lithium heteropolytungstate (LST). This is a water-based, low-toxicity heavy liquid with a maximum density of 2.85 g cm−3 at room temperature that produces a heavy mineral separate with apatite and zircon (and other phases) mixed together. Sample types and names are summarized in Table 1.
The UT-FCT separate supplied by the University of Texas at Austin was processed using the same mineral separation procedures with the following exceptions: the samples were density separated on a Gemeni water table prior to magnetic separation, and the sample experienced a two-step heavy liquid separation using bromoform and MEI. These heavy liquids are more toxic than LST but have densities of 2.95 and 3.32 g cm−3, respectively, and should yield grain fractions that separate apatite from zircon. Only the MEI heavy fraction was used for this experiment.
As a reference for microCT imaging, we used mineral standards for apatite, zircon, and titanite from existing collections. Two Durango apatite standards from large apatite crystals were supplied by the UTChron laboratory at the University of Texas at Austin (UT-DUR) and Caltech (ClT-DUR). We used shards from large crystals of Sri Lankan zircon (SL1) from Caltech (Farley et al., 2020) and Minas Gerais titanite (MG1) from the Natural History Museum of Los Angeles County (more specific sample location information is not known). These standard crystals were gently hand crushed and sieved to <75, 75–250, and >250 µm size fractions.
Table 1Mineral standards and unknowns used in this study. Large standard crystals were crushed to obtain shards to be used as a reference for microCT analyses. Unknown grains were extracted from FCT whole-rock samples.
2.2 Making crystal mounts
Graduate students were tasked with picking mineral grains that looked like apatite or zircon and covered a range of grain sizes and morphologies from the three FCT samples using a Nikon SMZ25 optical microscope. It is notable that all samples, including the MEI separate, yielded both apatite and zircon. The selected grains were placed onto grain mounts for microCT analysis (see Sect. 2.3). Each mount also included known mineral standards for reference and normalization (Fig. 1a). Three grain mounts were constructed (Mounts A, B, and C; see Fig. 2). Mount A included 36 grains from UT-FCT “unknowns”, 10 shards of SL1 zircon, and 15 shards of ClT-DUR apatite. Mount B included 39 grains of USC-FCT1 unknowns, 32 grains of USC-FCT2 unknowns, 9 shards of SL1 zircon, and 24 shards of UT-DUR apatite. Mount C included 11 shards of SL1 zircon, 15 shards of CIT-DUR apatite, and 15 shards of MG1 titanite standards. We used the 75–250 µm size fraction and >250 µm size fractions of the mineral standards to test the impact of grain size on grayscale values in microCT data. On Mount C, individual shards from each mineral were distributed evenly across the mount to test whether there is any spatial variability in X-ray attenuation and grayscale.
We assembled grain mounts by cutting small plastic shapes (rectangles, squares, or circles) out of 1 mm thick plastic slides and placing double-sided adhesive tape on one side. Mounts for vertical scans (when the mount is standing upright on the top of the sample holder) were constructed by cutting ∼3 mm by 4 mm rectangles from plastic slides of 1 mm thickness, which were covered with double-sided adhesive tape. Grains were placed on the upper part of the rectangular mount (Fig. 1a), and the end without grains was inserted into dental wax to hold the mount in place, vertically, on top of the sample holder (Fig. 1b). We tested different brands of double-sided adhesive tape and found that some brands appear clear under a transmitted light microscope, while others have significant interference colors and visible fibers. Double-sided tape selection did not affect microCT data.
Prior to placing the grains, the plastic mounts were temporarily secured to a glass slide with double-sided tape to hold them in place. Individual crystals were selected from mineral separates and placed on the tape using tweezers and needles under a light microscope. Grains were spaced to avoid touching, with up to 104 crystals in total per mount. Optical micrographs of the mount and each individual crystal were taken with transmitted and reflected light as well as with crossed polarizers.
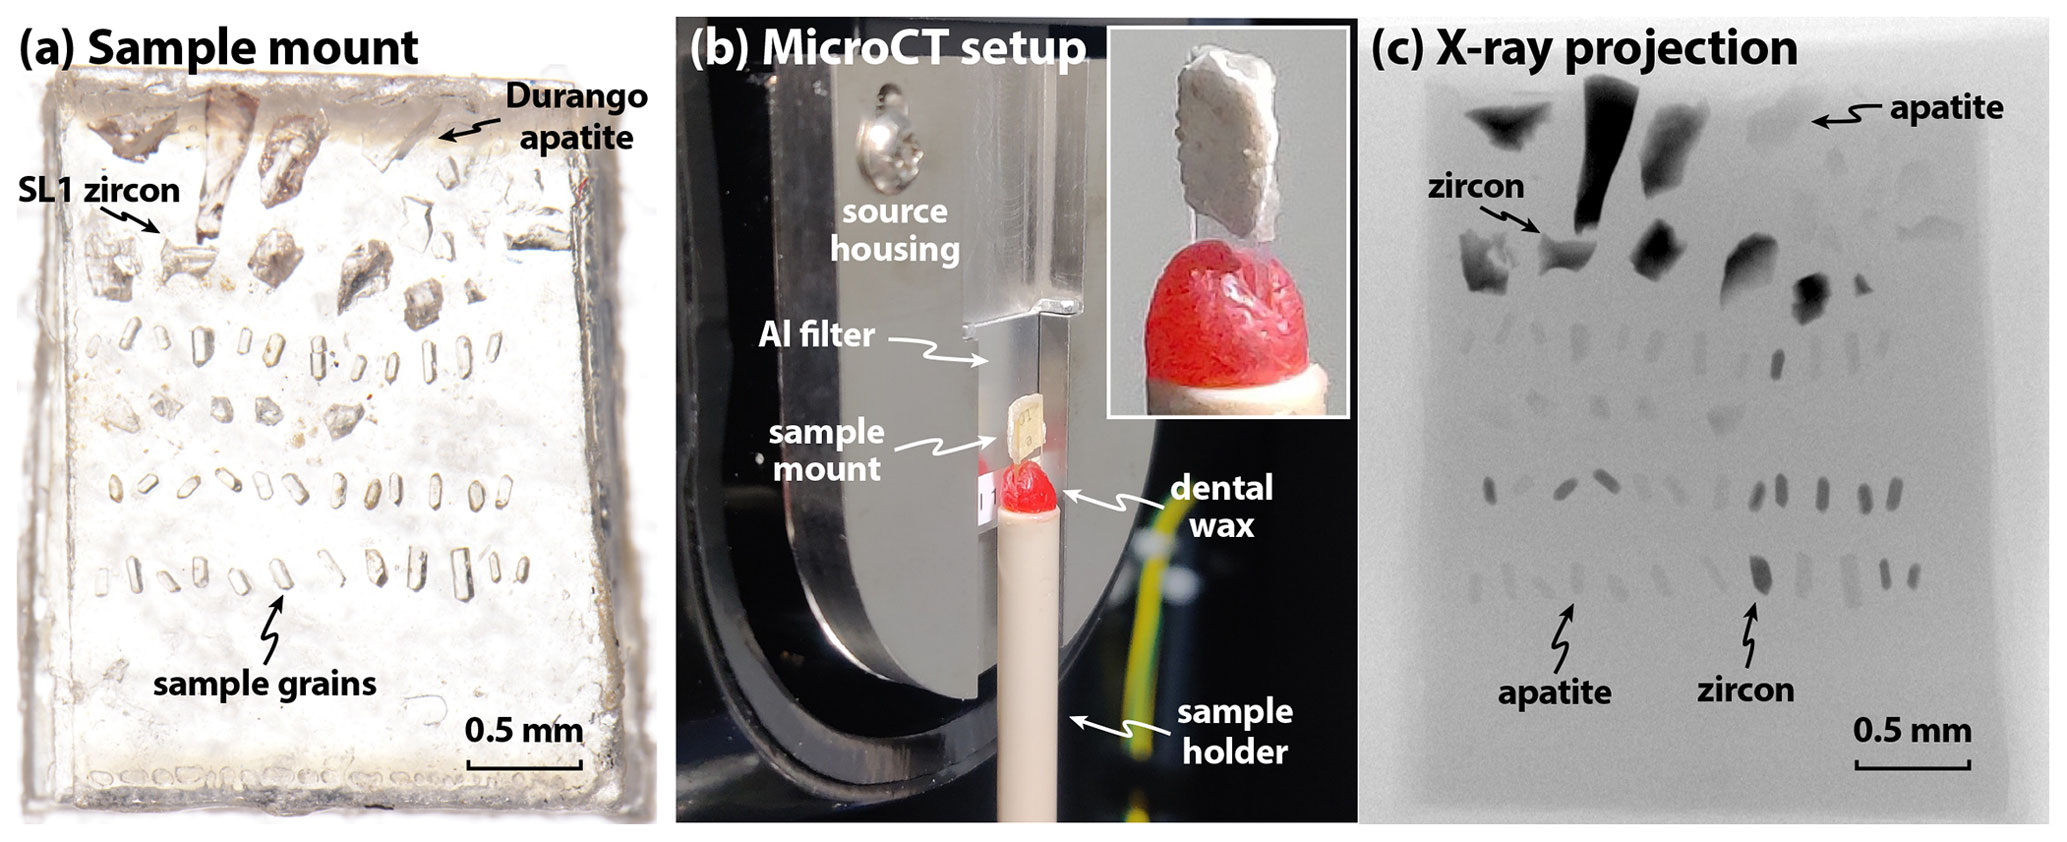
Figure 1(a) Transmitted light micrograph of a sample mount with known apatite and zircon standard shards and unknown sample grains made from a plastic slide and double-sided tape, about 3 mm in width. (b) Sample mount installed vertically in the microCT instrument secured on top of a sample holder with dental wax. Insert shows a closer view of the sample mount in measurement position. (c) X-ray projection of the same mount as in (a). Zircon grains show up as darker (more X-ray absorption) than apatite grains. The brightness in projections is controlled by the material-specific X-ray attenuation as well as by the integrated thickness of the traversed material.
2.3 MicroCT scanning
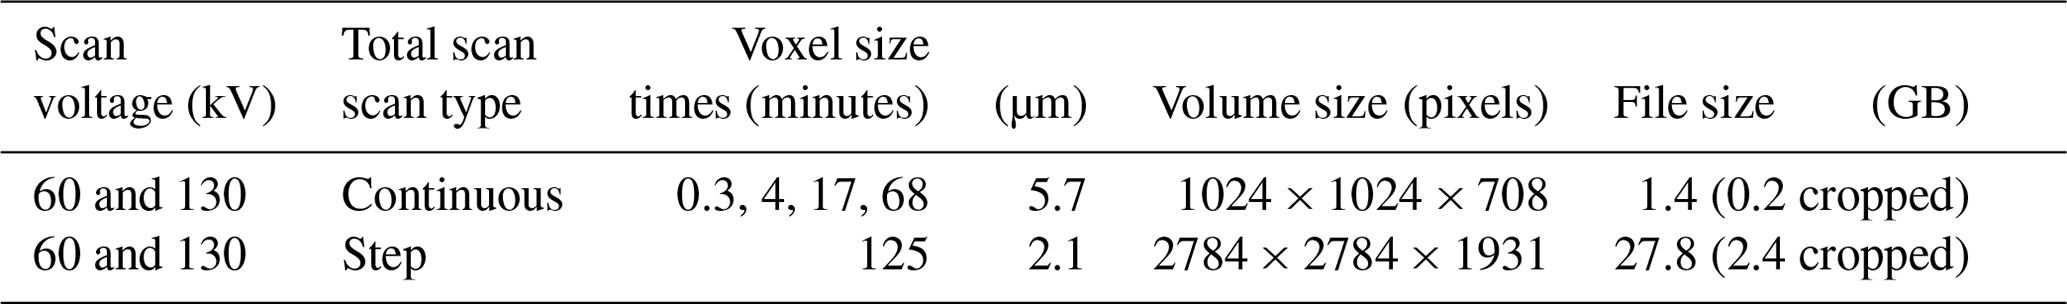
All microCT scans were acquired on a Rigaku CT Lab HX130 benchtop microCT instrument at the USCHelium Laboratory at the University of Southern California. Individual mounts were installed vertically (perpendicular to the X-ray beam direction, parallel to the detector plane; see Fig. 1b) in order to minimize the effect of interference from X-ray artifacts such as shadowing between individual grains due to beam hardening and photon starvation (see Sect. 3.2 and Fig. 7). Mounts were scanned at accelerating voltages of 130 and 60 kV, with currents of 61 and 133 µA, respectively. We used a 1.0 mm thick aluminum filter to selectively remove lower energies from the polychromatic beam in order to reduce the effect of beam hardening (see Hanna and Ketcham, 2017, for details). Total instrument run times were between 18 s and 125 min using continuous and step scanning with a field of view (FOV) of 5 mm diameter and 3.8 mm height (see Table 2). Continuous scans were done for 18 s, 4, 17, and 68 min. Over this time, the sample is rotated and X-rays are continuously counted on the detector. We also performed 125 min step scans (500 ms exposure time, 1500 projections, 4 integrations), in which the sample is rotated in steps and the detector moves between the steps to reduce ring artifacts. As a result, the 125 min scan time includes 50 min of actual X-ray exposure and 75 min of instrument adjustment. Note that in continuous scans, the scan time and exposure time are the same because there is no detector adjustment. We report the total instrument scan time in Table 2 and the total exposure time in Fig. 7. Reconstructions were computed using the Rigaku CT Reconstruction software. Continuous scans were reconstructed to yield volumes with a width and length of 1024 voxels. Step scans were integrated for longer times than the continuous scans and yielded enough data to be processed at full resolution (width/length of 2784 voxels) while maintaining a usable signal-to-noise ratio.
2.4 MicroCT data analysis
The reconstructed microCT data were processed with Dragonfly (Version 2021.1; Dragonfly 2021.1, 2021) by Object Research Systems. Reconstructed volumes of each mount with all different scan times and X-ray energies were loaded into Dragonfly. The volumes scanned at 60 kV for 68 min were used as a reference since they displayed the best signal-to-noise ratio of all the tested scan parameters. Volumes were registered relative to the 60 kV/68 min scans using the Image Registration tool, which translates and rotates volumes to align scans. Grains were segmented in the 60 kV/68 min scan volumes by creating regions of interest (ROI) using histographic segmentation, which delineates grains from their surroundings (air or adhesive tape) based on threshold grayscale values. The resulting volumes were filtered by applying a 3D opening operation (a combination of erosion and dilation which removes small objects, like dust, while not changing the geometry of large volumes) and eroded by one voxel to remove the effect of rapid changes in grayscale value near the grain boundary.
Each grain was separated into an “object” by creating a multi-ROI (an ROI that contains multiple objects) from continuous segments in which voxels are connected by at least one of their faces (6-connected). Each grain object consists of hundreds to thousands of voxels that can be used to calculate grayscale statistics. Small fragments separated from larger grains of less than 100 voxels were not used for further analysis to ensure the measurements have statistical significance. In this way, individual grains were mapped out and distinguished from other small objects in the scan (e.g., chipped pieces or detritus on the adhesive tape). The geometry of the segmented objects was resampled to fit each volume, and information on the position, size, surface area, and grayscale value distribution of each grain was extracted from the multi-ROIs.
Absolute grayscale values can change between scans since they are dependent on the scan geometry, acquisition parameters, arrangement of grains, and processing, with internal normalization and scaling being applied during reconstruction. To make scans comparable, we chose to normalize the grayscale values of all grains on a mount by the average grayscale value of the SL1 zircon grains in the same volume. We also computed the ratio of the grayscale values of the 60 and 130 kV scans with otherwise identical scan parameters to yield a dual-energy parameter (see Supplement for measured grayscale values and RSDs).
2.5 Phase validation by Raman spectroscopy
To validate the different phases observed in microCT data, we determined the mineral phase of 35 grains in Mount A and Mount B by Raman spectroscopy. This included a subset of 28 unknown grains from FCT samples and 7 shards of known mineral standards (Fig. 2). Representative grains were selected to encompass a range of grain sizes and morphologies, positions on the mount, and microCT grayscale contrast. After microCT scanning, the grain mounts were transferred to a glass slide, and grains were analyzed using a HORIBA XploRA PLUS spectrometer at the Natural History Museum of Los Angeles County. Apatite, zircon, and titanite were identified by matching baseline-corrected spectra with comparison spectra from the RRUFF database (Lafuente et al., 2015) using CrystalSleuth. Raman spectral analyses were conducted using a green 532 nm diode laser at 50 % laser power, a diffraction grating of 1880 gr mm−1, a 100× (0.9 NA) objective, 200 µm slit, and 300 µm pinhole for confocal optical geometry. Raman spectra were collected in the range of 100–1600 cm−1, with each grain analyzed with a 3 s exposure averaged from 10 acquisitions.
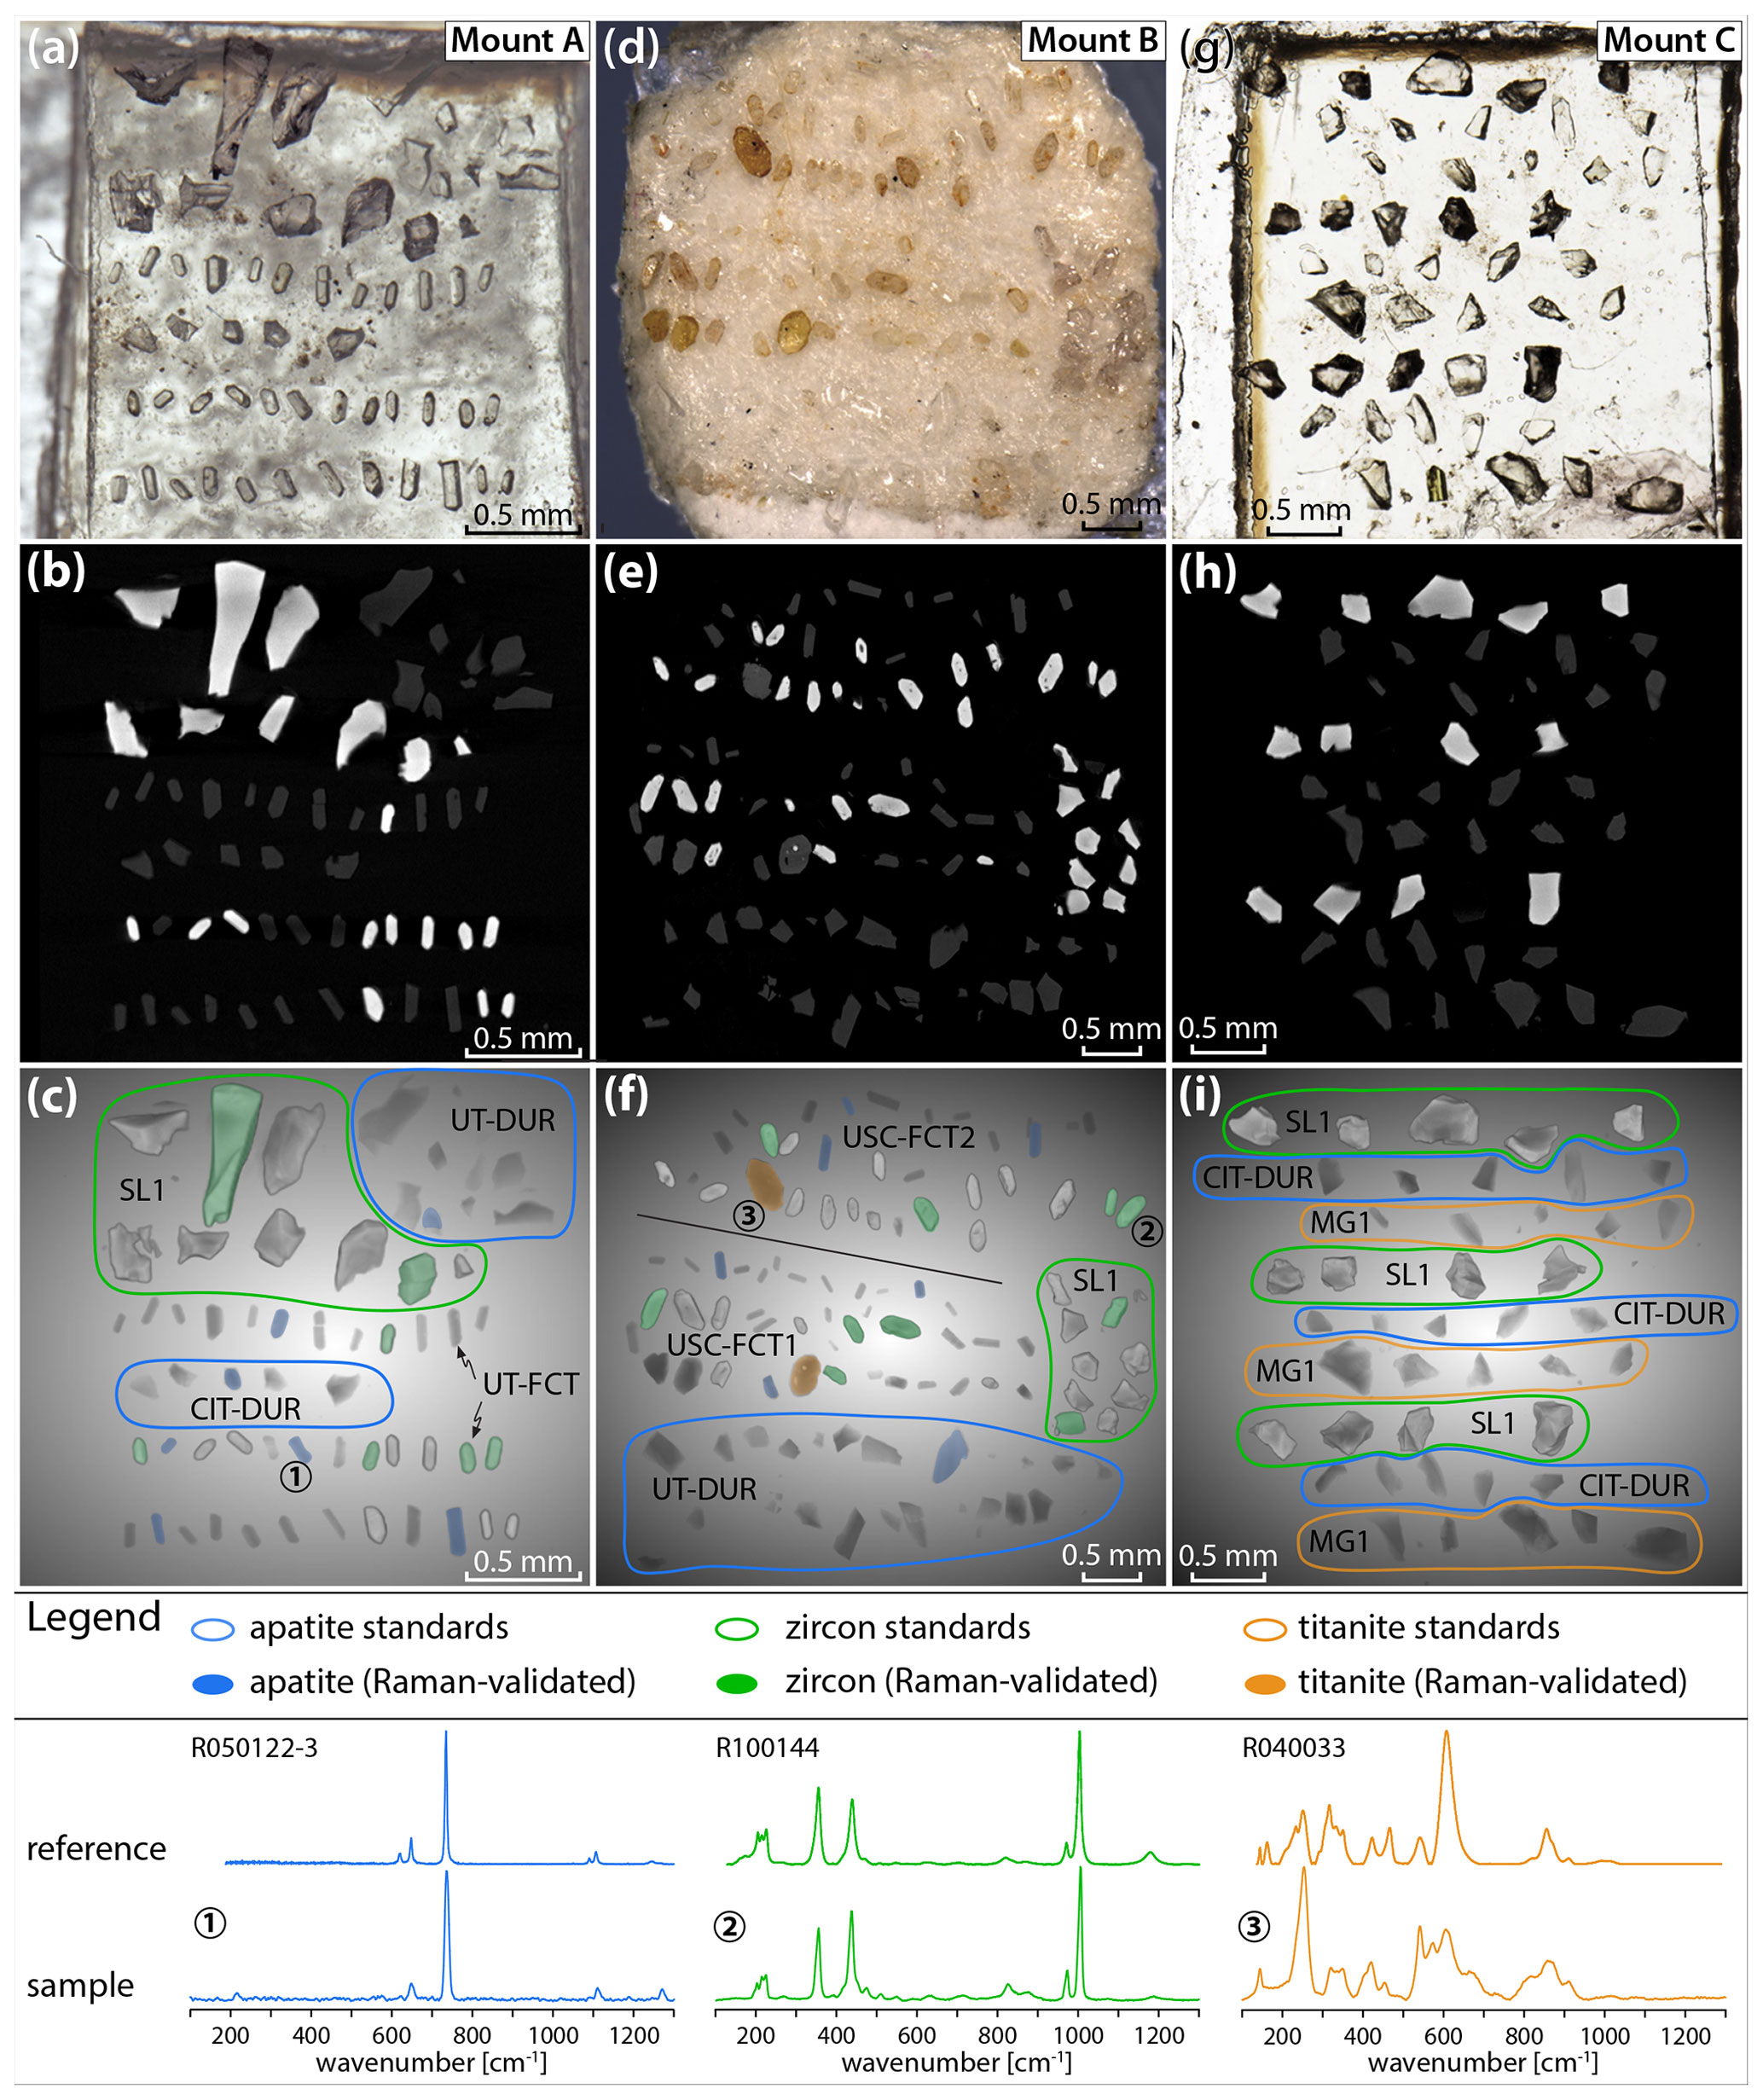
Figure 2Transmitted light micrographs (a, d, g), microCT slices (b, e, h), and microCT volume renderings (c, f, i) of Mount A, Mount B, and Mount C. MicroCT slices show a large contrast between zircon grains (brighter) and apatite and/or titanite grains (darker). Grayscale value and grain relief in 3D renderings are distinct for different mineral phases. The 3D renderings show Raman-validated grains highlighted and known standard shards circled in blue (apatite), green (zircon), and orange (titanite). Baseline-corrected Raman spectra of representative grains and reference spectra from the RRUFF database (including record numbers) are shown below the images. Numbers in circles indicate the grains in the volume renderings which correspond to the sample Raman spectra.
Different microCT scanning parameters were systematically tested on the same three grain mounts to determine the optimal scan conditions for distinguishing between mineral phases while minimizing cost, time, and data file sizes. Individual microCT data file sizes range from 2 to 28 GB, depending on acquisition and processing parameters. Reconstructing and manipulating large datasets can require specialized computers with demanding system requirements for data storage, memory, and processing power. The microCT data for single grain mounts, like the ones used in this study, can be cropped to produce manageable file sizes that can be viewed and analyzed without the need for specialized computers. We determined that for the instrument used here, a continuous scan time of 17 min at 60 kV (5.7 µm resolution) is sufficient for mineral identification between apatite and zircon. For phase identification plus high-resolution surface area and volume for 3D grain geometry measurements (as is typical for (U-Th)/He thermochronology), we recommend using a 125 min step scan at 60 kV (2.1 µm resolution). These parameters are optimized for apatite and zircon and can be modified for other minerals of interest. Below, we evaluate the effects of X-ray energy, grain size, and spatial distribution on quantitatively distinguishing zircon from apatite using microCT data.
3.1 Theoretical X-ray attenuation
We calculated the theoretical X-ray total attenuation coefficients of apatite, zircon, titanite, monazite, and rutile (Fig. 3a) for a range of X-ray energies commonly used for microCT (∼30–230 keV) using MuCalc (https://www.ctlab.geo.utexas.edu/software/mucalctool/, last access: 30 November 2021), a Microsoft Excel plugin which uses data from the NIST XCOM database of mineral-specific parameters (Hanna and Ketcham, 2017). The modeled attenuation coefficients predict how X-rays interact with different minerals. The greater the difference in attenuation coefficients, the more distinct two mineral phases will appear in microCT data.
Based on these calculations, zircon has a much higher attenuation coefficient than apatite across the energy spectrum. At lower energies, the difference between the attenuation coefficients of other minerals relative to zircon (Fig. 3b) is greater than at higher energies. The attenuation coefficients of apatite, zircon, titanite, and rutile converge around 200–300 keV. Thus, energies less than ∼200 keV should make zircon grayscale values distinguishable from apatite and other lower attenuation phases (i.e., zircon appears brighter in reconstructed microCT data, as seen in Fig. 2). The attenuation coefficients of apatite and titanite are similar at all energies, but display slightly more divergence <80 keV. The observed X-ray attenuation of actual mineral grains might differ from these predictions due to material inhomogeneity, compositional variation (such as endmember mixing and elemental substitution), crystal defects (e.g., metamictization), inclusions, and artifacts due to shadowing from neighboring grains (photon starvation) and beam hardening. In this study, we analyzed our mounts at the maximum achievable voltage on the Rigaku CT Lab HX130 of 130 kV as well as at a reduced voltage of 60 kV. These parameters may vary for other microCT instruments.
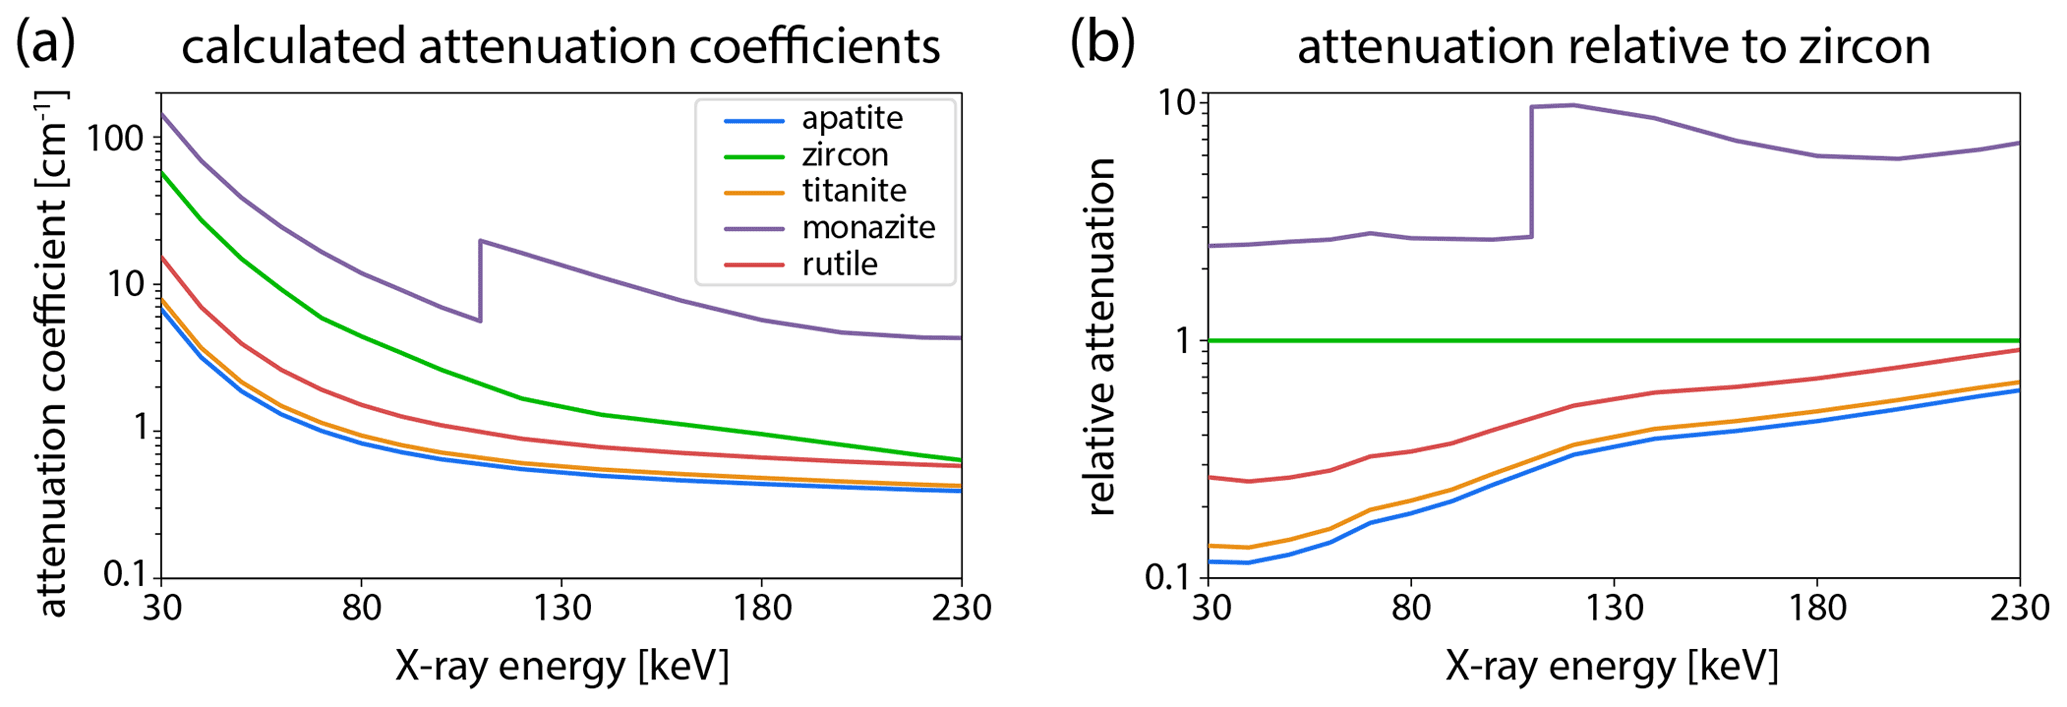
Figure 3(a) Attenuation coefficients for commonly dated minerals over a range of X-ray energies calculated with MuCalc. (b) The same modeled attenuation coefficient data normalized by zircon. Generally, higher attenuation coefficients mean brighter grayscale values in reconstructed microCT data. A greater difference in attenuation coefficients between mineral phases aids in mineral identification.
3.2 Normalized grayscale values of grains
We use the 68 min continuous scans to assess how grayscale values of individual grains (or shards) vary at different scan energies and for different mineral phases. Grayscale values for individual grains of unknowns and standards were normalized by the average value of the SL1 zircon shards on each mount for each set of scan parameters. The absolute grayscale value in the volumes depends on scanning conditions and reconstruction settings, thus internal normalization makes the results comparable and independent of these parameters.
We found that apatite grains have grayscale values of about 22 % and 27 % (at 60 and 130 kV, respectively) of those of zircon grains (Fig. 4). The distributions are broad due to intra-grain, inter-grain, and inter-sample variability, but the apatite and zircon populations are distinct from each other so that individual grains can be uniquely identified. This also confirms the theoretical modeling (Fig. 3) and the observations of different X-ray attenuation of apatite and zircon grains in the X-ray projections (Fig. 1). The grayscale value distribution of titanite overlaps partially with that of apatite and is sample dependent, making a phase distinction possible for some but not all grains. For example, the MG1 titanite mineral standard more closely overlaps the apatite grains than the “unknown” titanite crystals picked from USC-FCT1 and 2, which are systematically slightly brighter (Fig. 5).
The separation between all of the distributions is greater for 60 kV than for 130 kV, as predicted by the theoretical modeling above (Fig. 4). Therefore, volumes from scans at 60 kV can be used to resolve smaller differences in X-ray attenuation than at 130 kV, which does not have a pronounced effect on the apatite–zircon distinction but can be useful when trying to distinguish between apatite and titanite. However, lower-energy X-rays are less penetrating and lead to more artifacts and noise in the resulting reconstructed data (Hanna and Ketcham, 2017). Therefore, there is a trade-off between the absolute separation of phases in grayscale-value space and the signal-to-noise ratio, the latter of which can be improved by longer scan times.
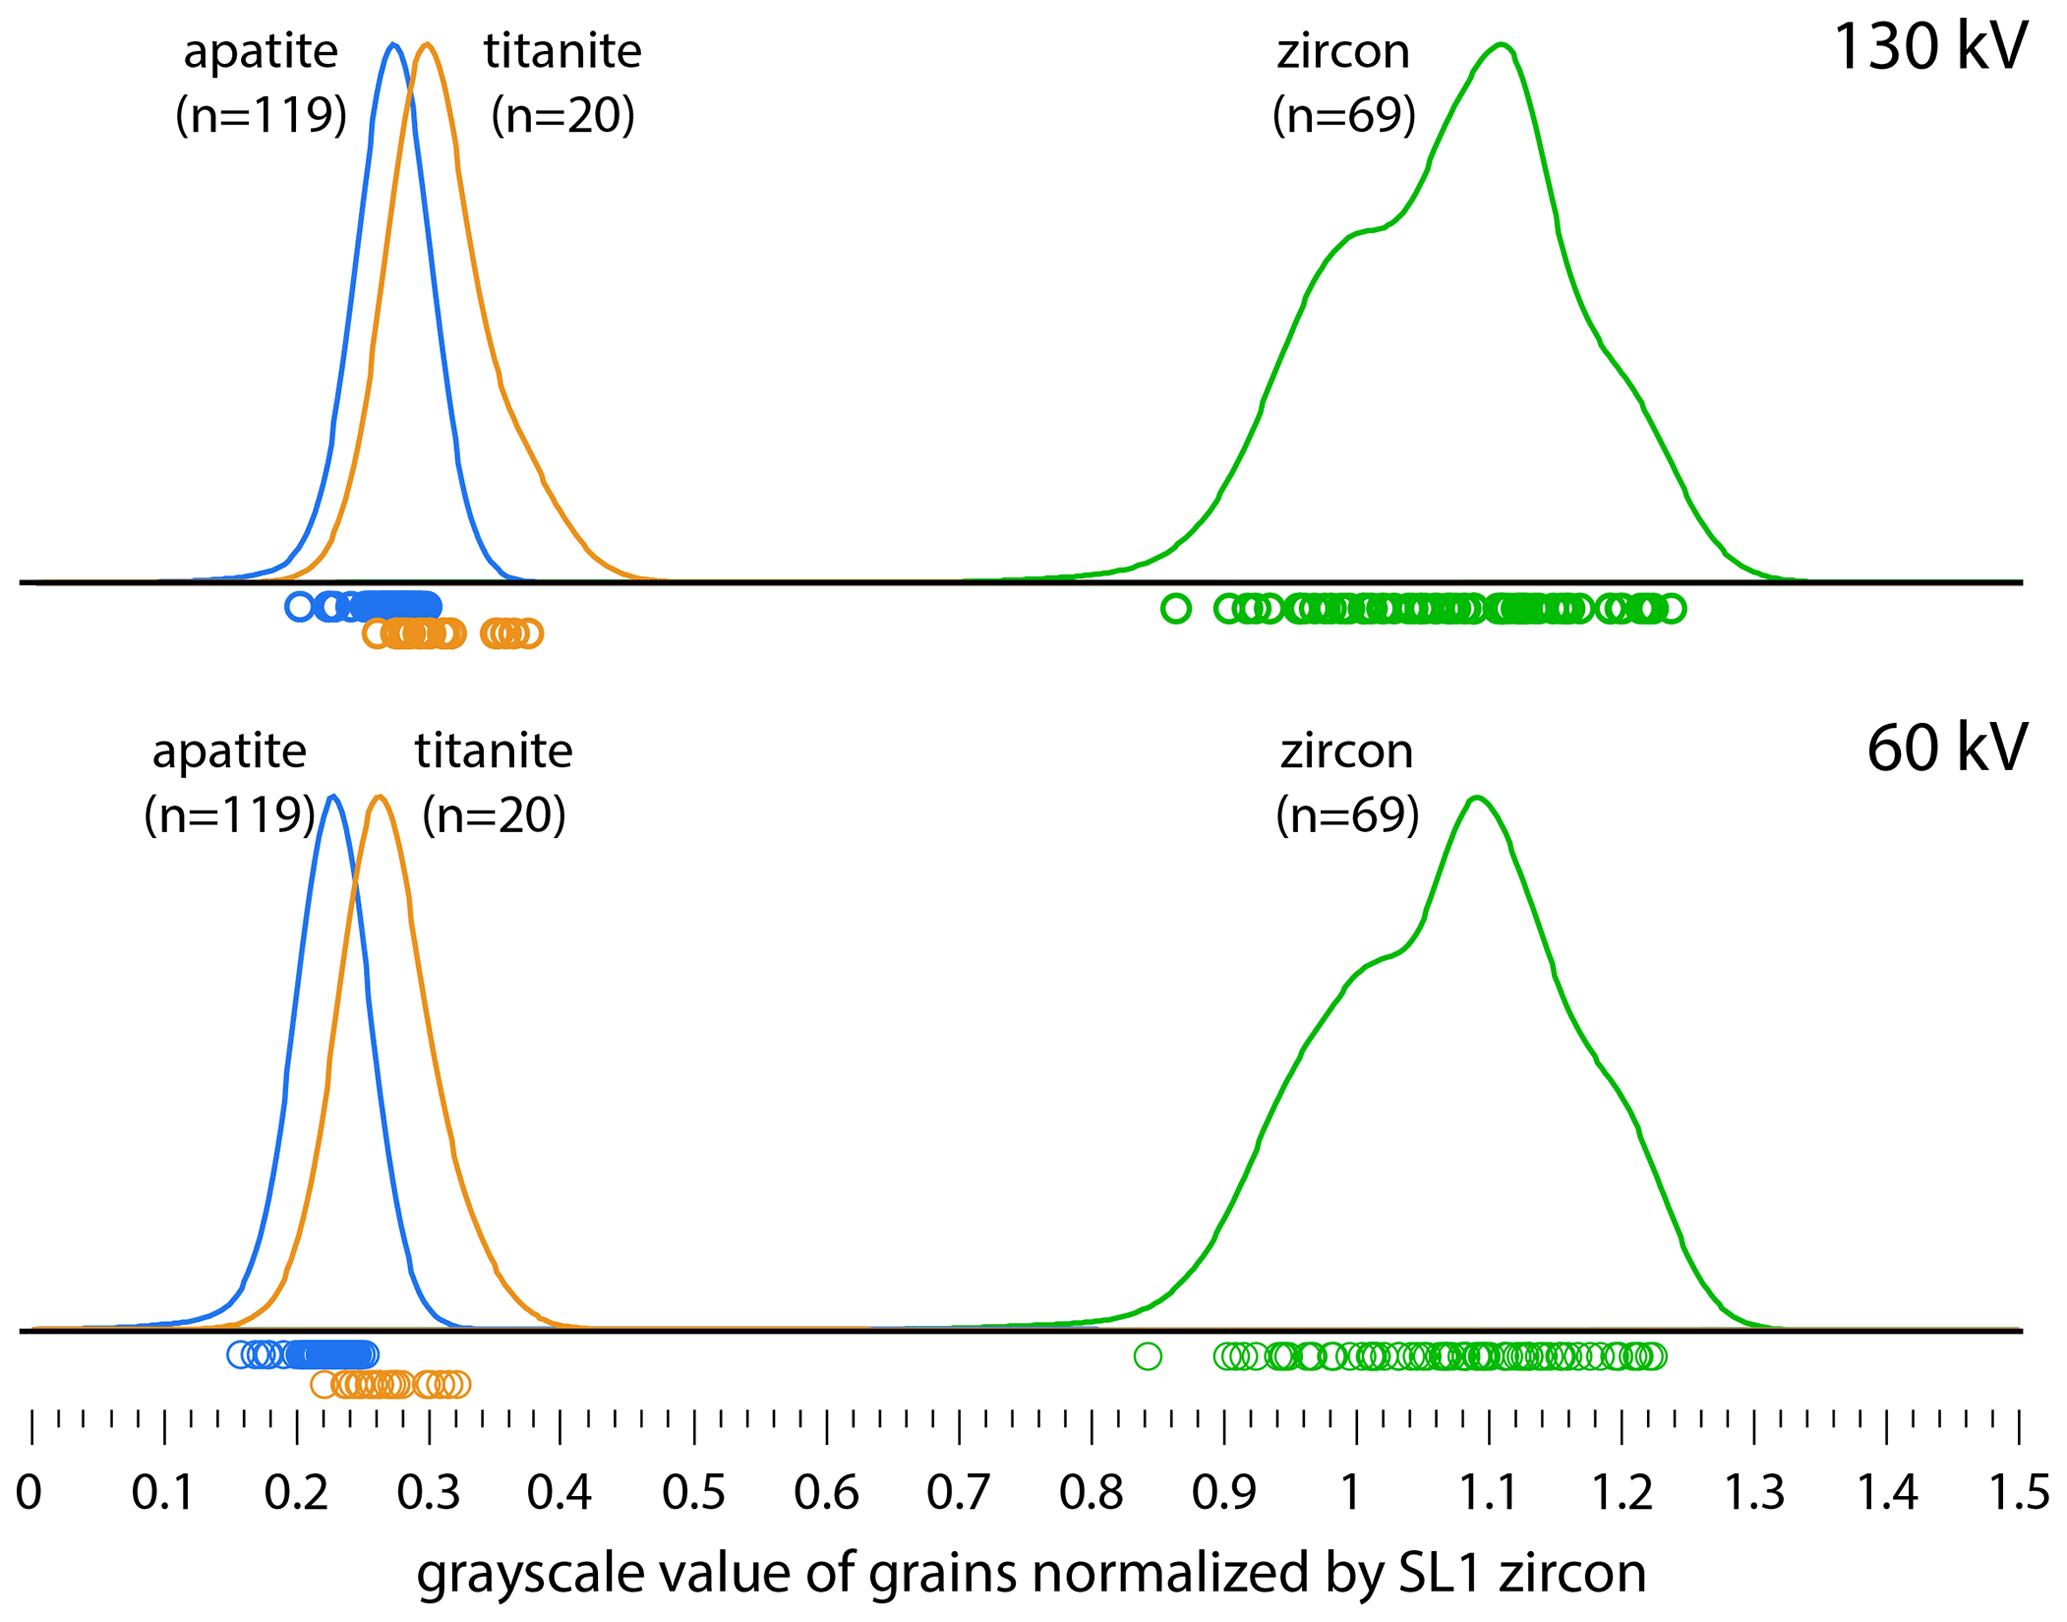
Figure 4Kernel density estimates (KDEs) of all apatite, zircon, and titanite grayscale value measurements (including standards) for 68 min scans calculated with an adaptive bandwidth equal to the standard deviation of grayscale variation within each grain. Each KDE is an aggregation of data from three different sample mounts and shows all individual data points. The grayscale value of each grain was normalized by the average grayscale value of SL1 zircon grains in the same volume. The difference between the attenuation of the three minerals is greater at 60 kV than at 130 kV, as theoretically predicted.
We observed good reproducibility for average normalized grayscale values of populations of the same sample across the three mounts (Fig. 5). For example, the average normalized grayscale values of Durango apatite shards (UT-DUR) are all within uncertainty at 0.255±0.046 (2σ) for Mount A, 0.267±0.016 for Mount B, and 0.272±0.014 for Mount C. Some of these average values are skewed by individual outliers, which are likely due to grain size effects (see Sect. 3.4).
Although average grayscale values across grain populations are reproducible, we observe a range of grayscale values for individual replicate grains from the same sample or of shards from the same crystal (Fig. 5). This may be due to differences in bulk composition and structure. For example, natural apatites are solid solutions of three different endmembers which have different densities. The exact composition of any apatite grain will have an impact on its X-ray absorption and hence the observed grayscale value. Zircon density is mainly controlled by radiation damage (Holland and Gottfried, 1955), which can cause different densities for different grains or of parts of the crystal in the case of pronounced zoning of radioactive elements. The effect of differing grayscale values between different samples is most pronounced between the titanite standard in Mount C and the titanite from FCT samples in Mount B (see Fig. 5). The density of titanite has also been shown to be a function of crystal damage (Vance and Metson, 1985).
We segmented grains based on their outer surface and calculated the average grayscale value of the material enclosed by that surface. It is necessary to exclude the outermost grain boundary, because it commonly appears falsely brighter due to beam hardening. However, if there is internal heterogeneity, such as inclusions with higher or lower grayscale values, the observed average grayscale value of any particular grain can be affected (expressed as RSDs). Grains with a large fraction of inclusions of a particular type can therefore change the average grayscale value and might lead to misidentification. One strategy to mitigate this would be to filter certain histographic ranges of values within the segmented grains to exclude inclusions and measure only the average grayscale value of the host grain. Alternatively, this could also be used as a tool to identify individual crystals with inclusions, which would display higher or lower average grayscale values than the rest of the population.
The grayscale value distribution within a particular mineral grain is dependent on the natural variation of density and composition (such as zoning) as well as measurement noise. The absolute 2σ variability of apatite and titanite grains is about 0.01–0.02 for apatite and 0.1–0.2 for 60 kV/68 min scans normalized by SL1 zircon (Fig. 5). In relative terms, this is a 5 %–10 % variation for apatite and titanite, and a 10 %–20 % variation for zircon. Measurement noise in the reconstructions is likely not the main factor contributing to this variation in the 68 min scans (see Sect. 3.4 and Fig. 7). The remaining variations can be due to changes in material parameters across a grain, inclusions of different densities to the host phase, and beam hardening. Overall, the normalized grayscale value can be used to distinguish apatite and zircon, and to some extent other phases such as titanite. Employing strategies to minimize noise and artifacts is important to make this distinction robust for every analyzed mineral grain.
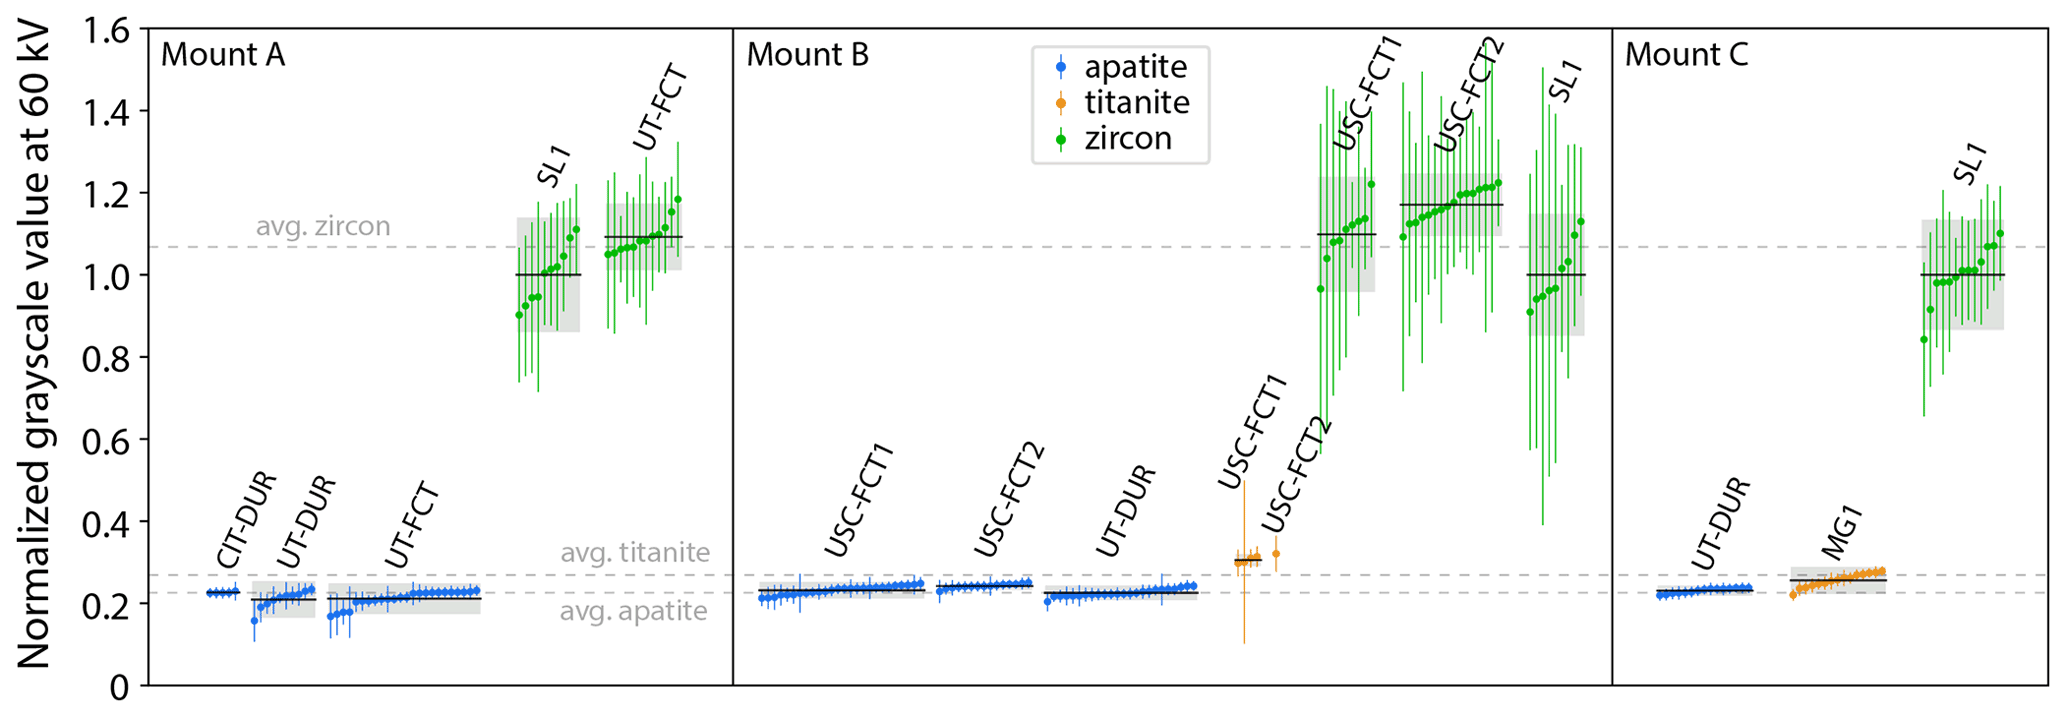
Figure 5Mean grayscale values (normalized by SL1 zircon) for all grains measured in 60 kV/68 min scans, given with 2σ variability and organized by mount and sample. Zircon is shown in green, apatite in blue, and titanite in orange, as in the other figures. The average for each sample is given as a black bar with the 2σ variability shaded in gray. Averages for the whole populations of apatites, zircons, and titanites are given as gray dashed lines. Zircon and apatite populations for all mounts are distinct, while apatite and titanite populations show some overlap. There is observable inter-sample variability in the mean normalized grayscale value of each mineral but values for the same samples (e.g., UT-DUR) are reproducible within error between mounts.
3.3 Use of dual-energy data
The change of the attenuation coefficient with X-ray energy is a function of material density and composition, and is characteristic for each mineral (Alves et al., 2014). Therefore, the ratio of the attenuation at two different X-ray energies can be used as an additional parameter to identify the mineral phase of a grain (e.g., Hanna and Ketcham, 2017). We observed a clear distinction between apatite and zircon in this parameter as well (Fig. 6a). Titanite again appears similar to apatite, but the separation between the two distributions is greater in dual-energy space than in the 60 or 130 kV data alone. Therefore, this dual-energy parameter can be used as an additional tool to distinguish phases that have similar absolute attenuation coefficients, and hence appear similar in terms of grayscale values. This necessitates two scans of the same mount at two different energies, as well as additional processing to align the two scans and compute average grayscale values for both scans. However, the resulting data can be used to map regions in dual-energy vs. single-energy plots (Fig. 6b), yielding a more robust phase identification for individual grains.
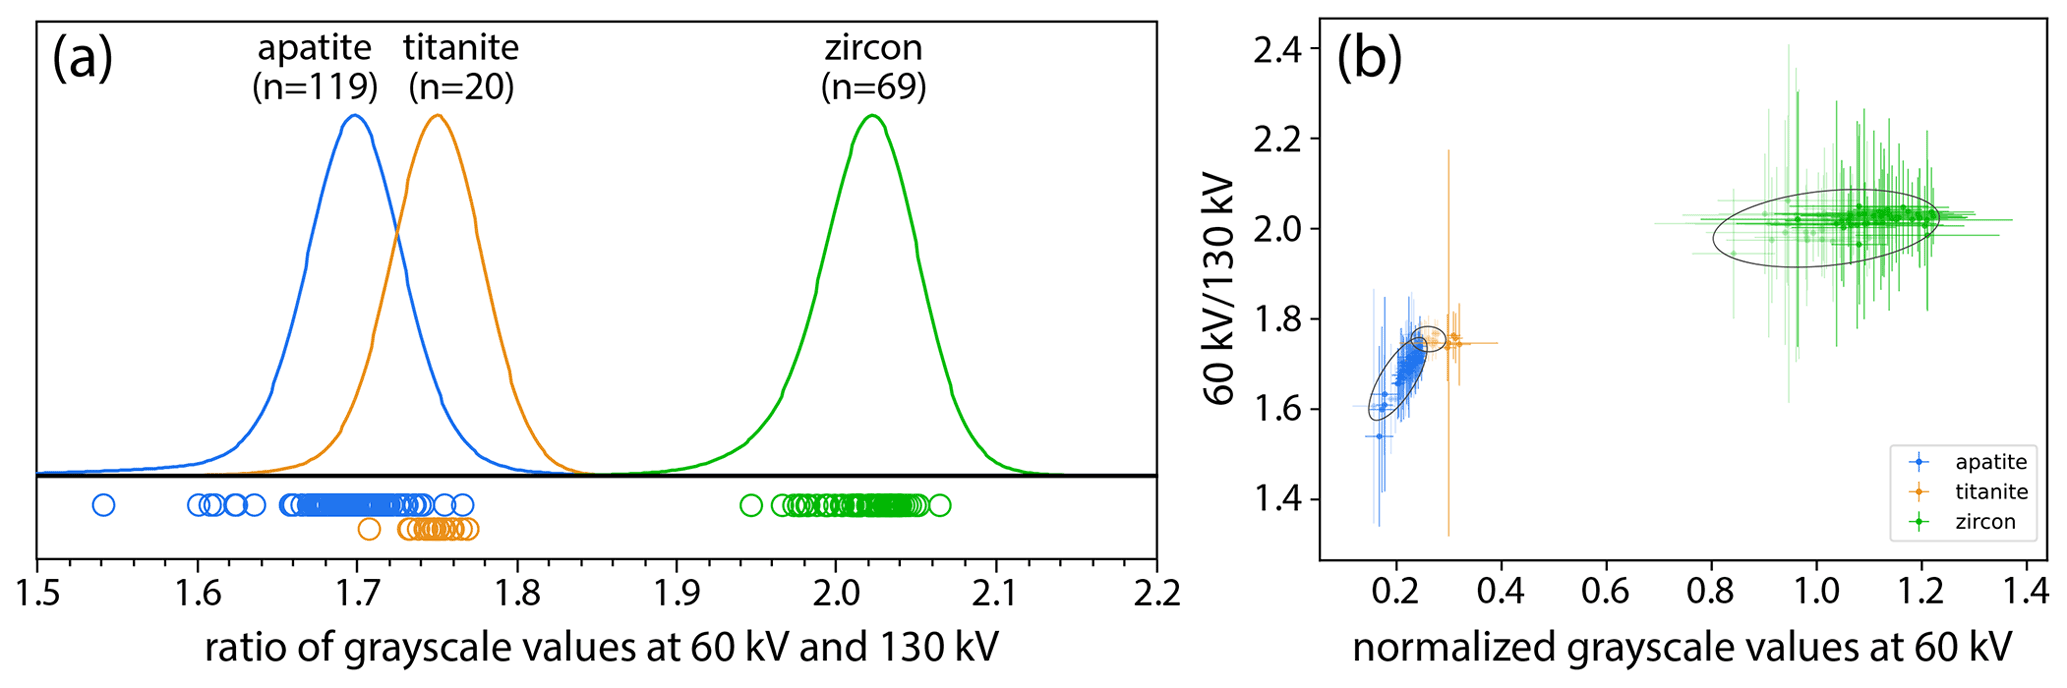
Figure 6(a) Kernel density estimates of the ratios of the grayscale values at 60 and 130 kV for grains from all three mounts. The mounts were scanned at 60 and 130 kV with otherwise identical scan parameters and the grayscale values were measured at the same positions. Zircon and apatite form very distinct distributions, and the populations of apatite and titanite overlap but show more separation than grayscale values from scans at a single energy. (b) Dual-energy parameters plotted against normalized grayscale values at 60 kV. Known standards are shown in lighter colors and black lines outline the field of values of standards. Unknown sample grains of apatites and zircons fall almost entirely within the field of standards. Titanite sample grains have a significantly different brightness (grayscale values) than sample grains but have the same dual-energy parameter.
3.4 Optimizing mount geometry and scan parameters
We tested the grayscale variability introduced by grain size, spatial distribution of the grains on a mount, and direction of the mount during microCT data acquisition. Each of these factors can affect the path that X-rays take through the grains and the preferential attenuation of parts of the X-ray spectrum of a polychromatic beam (beam hardening), which can result in artifacts that cause changes of the average grayscale for a given grain unrelated to the actual mineral-specific X-ray attenuation. We found that image quality and signal-to-noise ratio improved with increased scan time (Fig. 7), as is expected based on counting statistics. We quantified variability in our data by calculating the relative standard deviation (RSD) of grayscale value within each segmented grain, which is a measure of both natural variability of the material and any superimposed measurement noise.
A clear distinction between apatite and zircon can already be observed in the 18 s scans (Fig. 7), although the RSDs are high (0.2–0.3) for both apatite and zircon grains. The RSDs decline with increasing scan time for otherwise constant experimental conditions (Fig. 6), asymptotically approaching ∼0.04 for apatite and ∼0.08 for zircon. The remaining RSDs might reflect the true natural variability of material parameters (density, endmember mixing, crystal damage, elemental substitution, inclusions) within the mineral grains. For the particular instrument and experimental setup employed here, the signal-to-noise ratio did not improve significantly beyond a scan time of 17 min at a reduced resolution (voxel size of 5.7 µm). For full-resolution reconstructions, a 125 min scan time was sufficient to produce comparable RSDs, while also allowing for a smaller voxel size (2.1 µm) which is preferable for obtaining geometric parameters, such as crystal size and shape for FT corrections (Evans et al., 2008).
We also found that the orientation of the mount during data acquisition has a significant effect on the data quality. A vertical orientation, perpendicular to the source and parallel to the detector plane, produced much lower RSDs for the same scan conditions than a horizontal position (Fig. 8). Highly attenuating phases (such as zircon) produce artifacts such as shadowing and streaking (e.g., Hanna and Ketcham, 2017). When these artifacts overlap with other sample grains, they can significantly alter the observed grayscale value of parts of grains, which does not reflect their actual X-ray attenuation and leads to erroneous measurements with increased RSDs (Fig. 8). X-rays passing through a horizontal mount traverse several grains in most orientations and produce strongly expressed artifacts, whereas data acquisition in a vertical position significantly decreases the number of rays that pass through more than one grain. Therefore, particularly for samples with highly attenuating phases, we recommend scanning mounts in a vertical position to reduce noise and improve reproducibility. A tilted orientation can achieve similar results but makes data cropping more difficult. Scanning mounts horizontally is another, more common option that may be suitable depending on the phase of interest.
The size and arrangement of the grains on the mount also had an influence on the observed grayscale values and their RSDs. We tested these effects with a grain mount (Mount C) composed of only shards of known standards (apatite, zircon, and titanite). For a vertical scan, the horizontal position did not have an observable effect on the measured grayscale values of grains (Fig. 8a) but the vertical position did have a significant effect, with grayscale values decreasing downwards (Fig. 9b). This effect was observed for both apatite and zircon. Titanite showed an even greater dependence on the vertical position, but this trend was exaggerated by the predominance of smaller shards in the top row and larger ones in the bottom row of the mount. These spatial effects are likely caused by the inhomogeneity of the total X-ray attenuation at any height above the sample holder due to clustering of grains at certain heights. These spatial effects can be minimized by distributing known standards throughout the grain mount and normalizing sample grain measurements by the closest standard, and by avoiding lines or grid shapes when placing grains.
We observed a general trend of decreasing grayscale values with increasing grain size for the set of all grains of this mount (Fig. 9c). This trend can be explained by beam hardening (see Hanna and Ketcham, 2017), which results from the preferential attenuation of low-energy parts of the X-ray spectrum by highly attenuating material. This effect makes the center of highly attenuating regions appear darker. This artifact can lower the observed average grayscale value of a grain, producing measurements that are not solely related to the attenuation coefficient of a phase. This can be counteracted by choosing standard grains/shards that are matched in size to the unknown sample grains. If beam hardening occurs, it will affect all grains equally, thereby allowing for a direct, unbiased comparison of the average grayscale values of sample grains and standards.
The geometric effect discussed above can change the average observed grayscale values of grains by 5 %–10 %. Even with these effects, apatite can still be distinguished from zircon due to their large relative difference in X-ray attenuation. However, precautions should be taken when distinguishing apatite from titanite, which displays a much lower relative contrast (see Figs. 4, 5, 6), to ensure that data quality is high and phase identification is robust and unique.
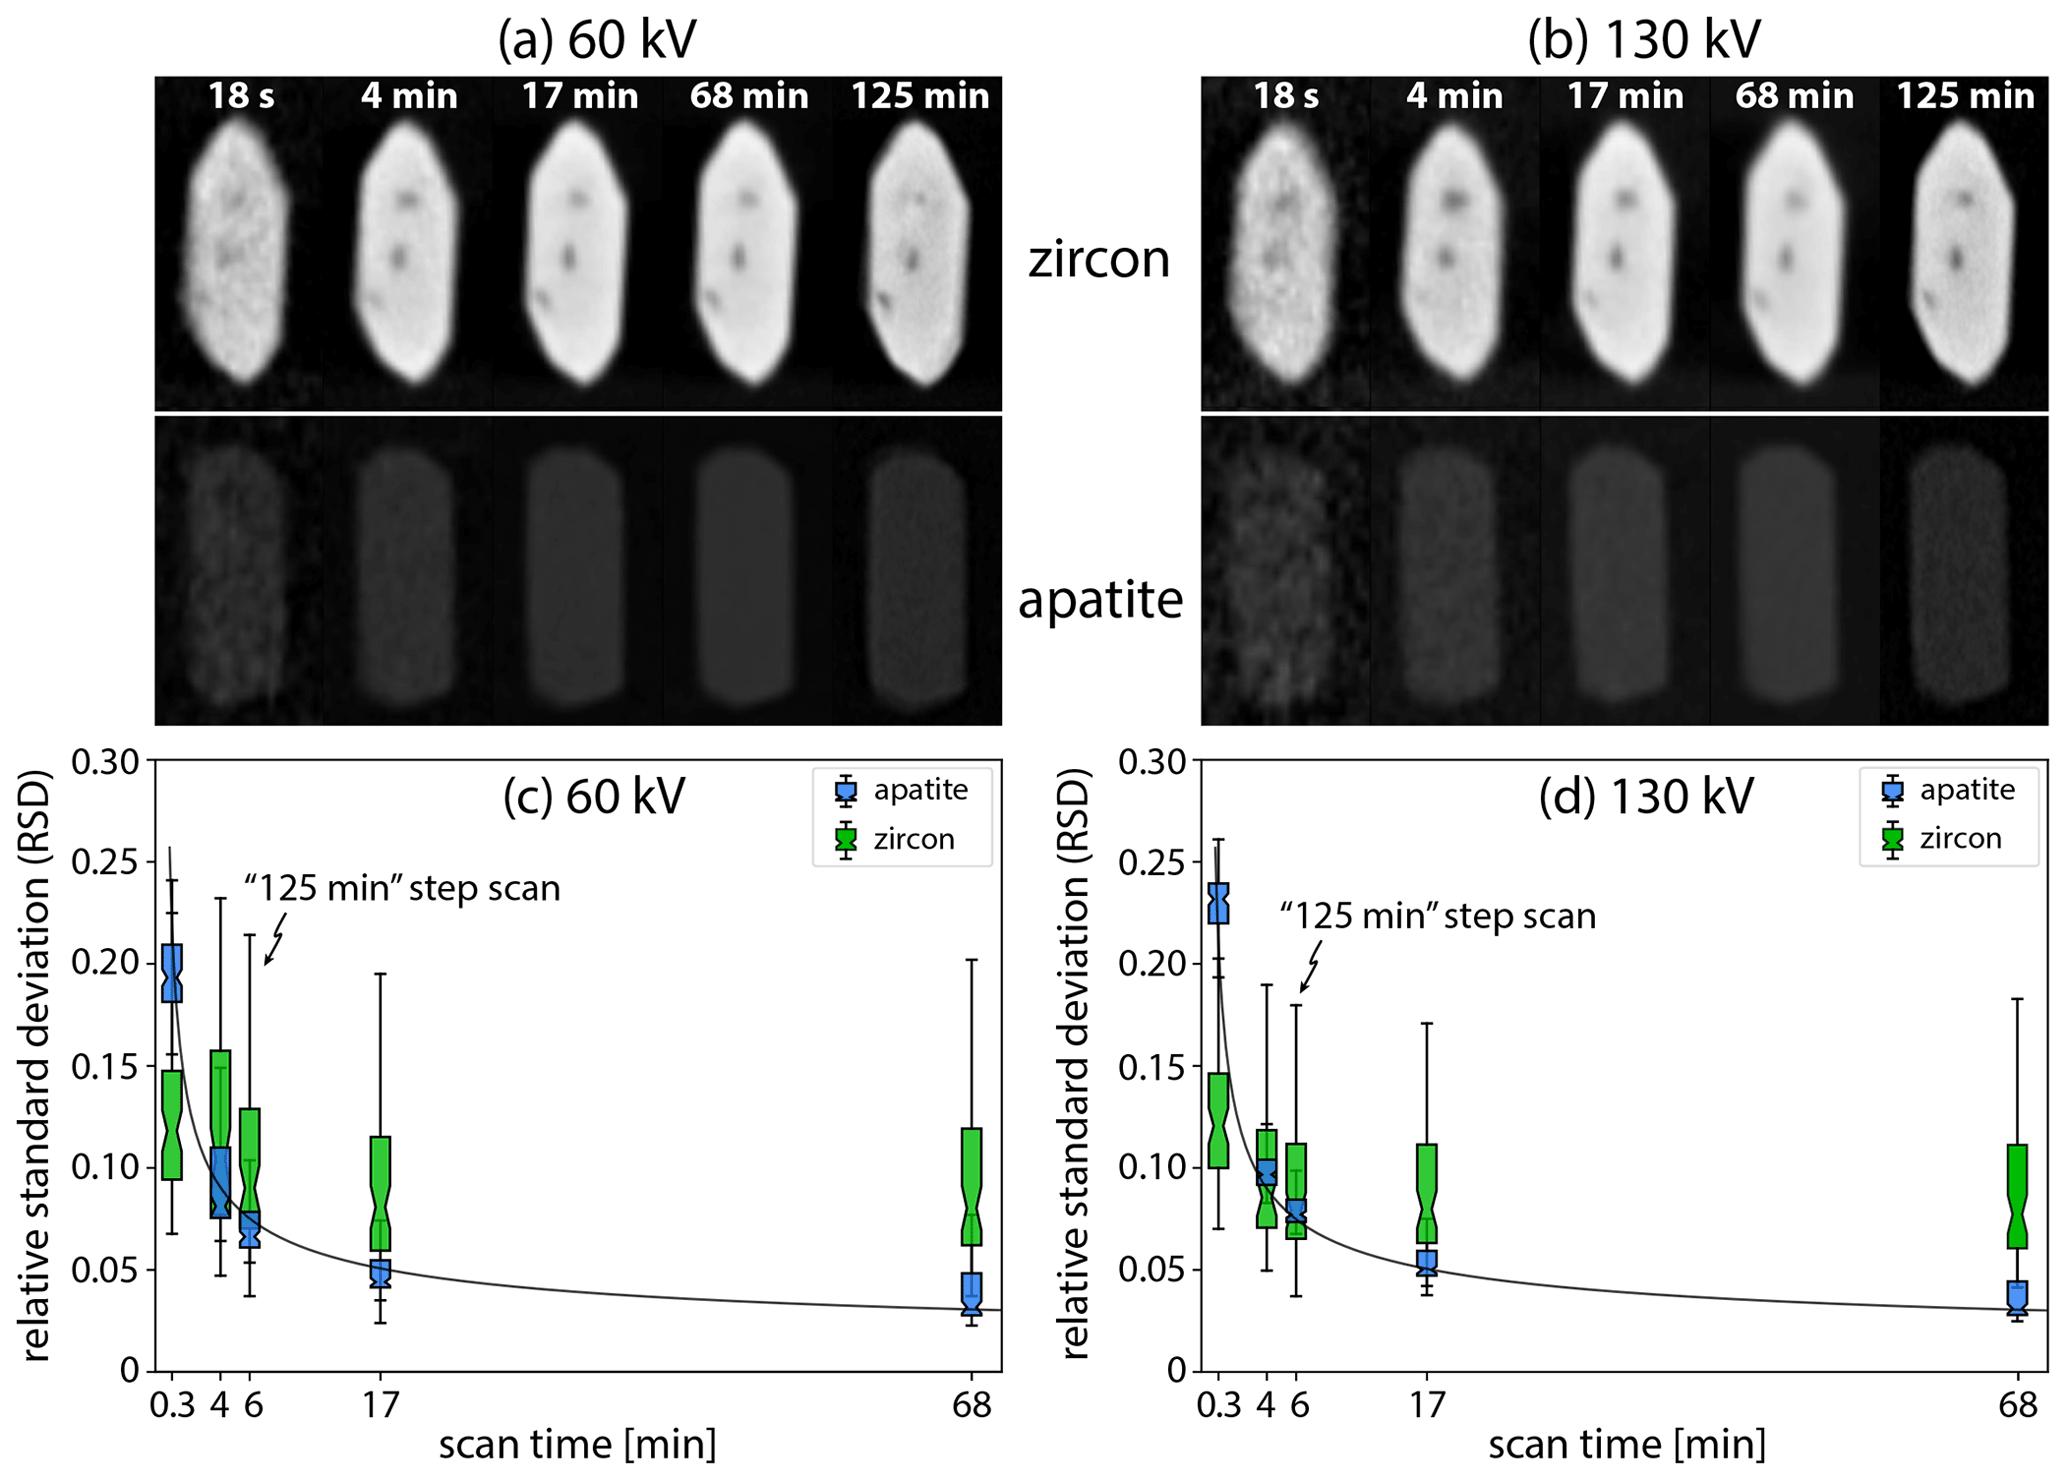
Figure 7Slices of selected grains (a, b) and grayscale relative standard deviations (RSDs) of all analyzed apatite and zircon grains (c, d) at different scan times for 60 and 130 kV scans. Slices are given at the same contrast settings, showing the difference in grayscale value between apatite and zircon. Scans of 18 s, 4, 17, and 68 min are processed at a reduced resolution (5.7 µm) whereas 125 min scans are processed at full resolution (2.1 µm). Image quality and signal-to-noise ratio improve with longer scan times, and graphs of -functions are given for reference (gray lines). For our instrumental and scan parameters, we did not see significant improvements in signal-to-noise ratio past 17 min.

Figure 8Slices of horizontal and vertical scans of the same grain mount show the reduction of artifacts for the vertical scan position relative to the horizontal scan position. Highly attenuating zircon (bright) grains produce shadowing artifacts that overlap with apatite (less bright) grains, altering the overall grayscale value measured in the apatite grains. Some shadowing still occurs in the vertical position but is much reduced relative to the horizontal position. This is reflected in the relative standard deviation (RSD) of the grayscale value within each set of grains. The arrangement of grains in a geometric pattern leads to amplification of artifacts. Note: photographs have increased contrast to highlight the differences in artifacts.
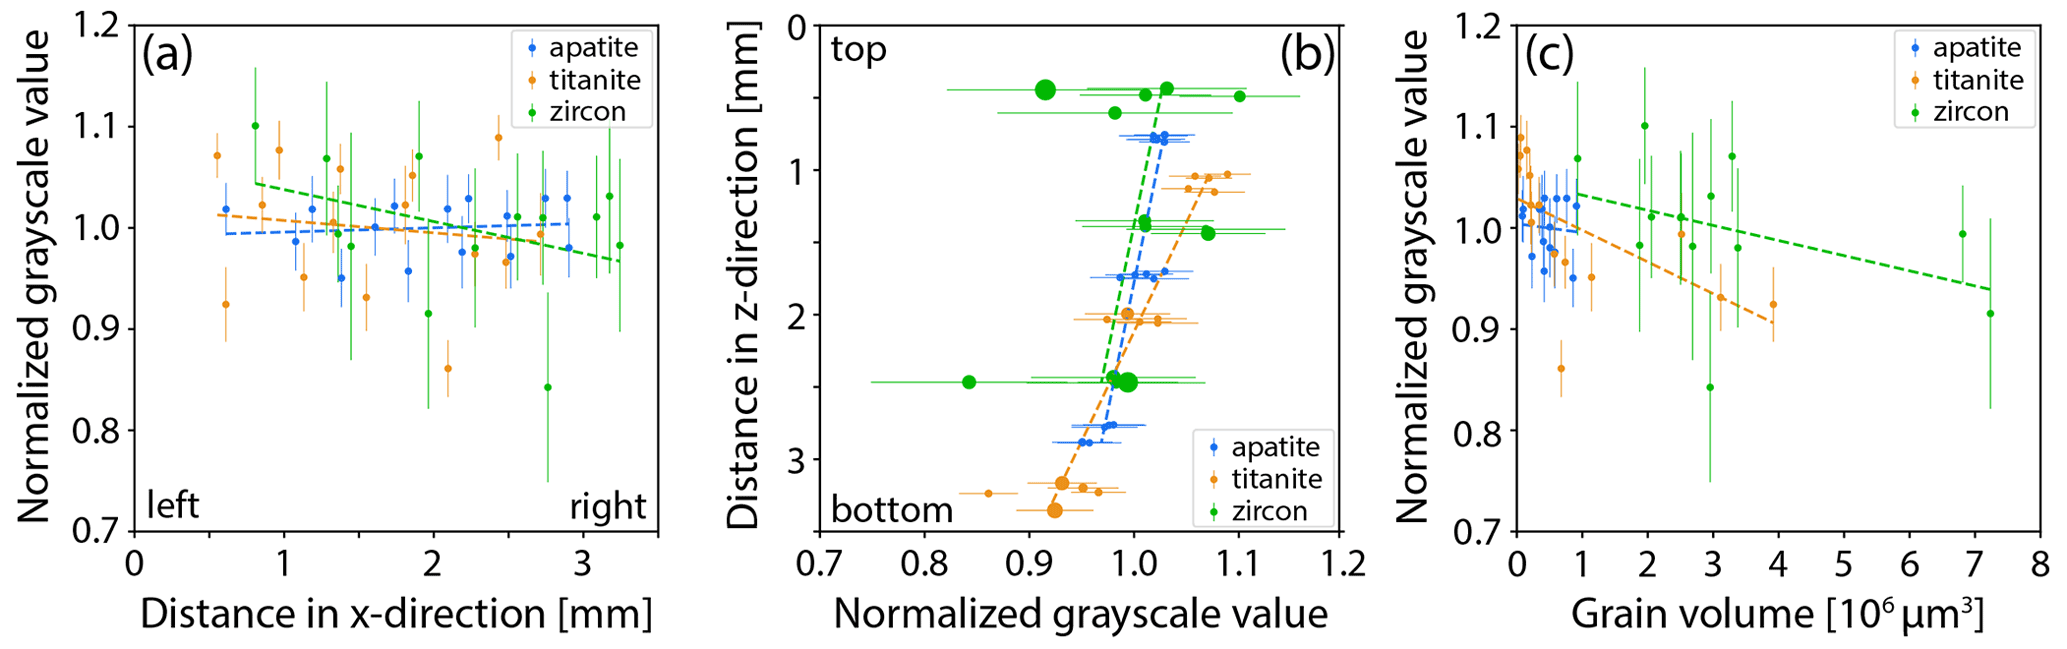
Figure 9Plots showing the effect of spatial parameters on the grayscale values of the grains on Mount C, which contains shards of known apatite, titanite, and zircon crystals (see Fig. 2). The measured grayscale values have been normalized by the average of all grains of that mineral. Linear regressions (dashed lines) show approximate trends. (a) There is no systematic variation of normalized grayscale values with horizontal distance (x-direction) of grain placement on the mount. (b) The normalized grayscale values of all mineral grains show a dependence on vertical distance (z-direction) on the mount. The trends of decreasing brightness from top to bottom are roughly parallel for apatite and zircon, with around 5 % total variation. Titanite shows larger grayscale variations (∼10 %), which are partly due to variations in the volume of grains (size of symbol correlates with volume). Larger grains are preferentially located at the bottom of the mount, thereby amplifying this trend. (c) Grains of larger volume have lower grayscale values, likely due to the effects of beam hardening.
3.5 Recommended procedures for microCT phase identification for geo- and thermochronology
Based on the calibrations above, we share a workflow that allows the identification of apatite and zircon grains in grain mounts for geo- and thermochronology using microCT. The same dataset can be used for grain-specific 3D inclusion mapping, surface area, and volume measurements. The methodology described here has the potential to eliminate the need for highly toxic heavy liquids (MEI and bromoform), reduce time spent picking grains, and curtail misidentification of apatite and zircon in geo- and thermochronological analyses. Instead, this method enables users to quickly pick suitable-looking grains without close visual inspection and appraisal of interference colors, crystal shape, etc. in mixed apatite and zircon separates after using less toxic heavy liquids (LST, LMT, SPT). This can reduce time spent on the microscope, particularly for “difficult-to-pick” samples, such as those with very challenging grain morphologies or large volume separates. Although not done in this study, it is conceivable to sprinkle a mineral separate onto adhesive tape and use microCT to scout (bright) zircon grains prior to more directed picking or LA-ICP-MS. This approach may also be preferable in cases in which microscope picking is not an accessible task (e.g., due to the physical setup, frequent migraines, etc.).
We found that using clear plastic slides (thickness ∼0.5 mm) as a base for grain mounts provided the necessary rigid support to hold the grain mounts in place while handling during microCT scanning. These plastic slides have a similar refractive index to glass and can be easily cut with scissors or other implements. Exact mount shapes (circles, squares, rectangles) depend on the scanner setup. Generally, the goal is to maximize the grain mount surface area to fit a large number of grains on a single mount. As mentioned, double-sided adhesive tape is strong enough to secure mineral grains, even in vertical scans, but different tapes can vary in terms of clarity and glue thickness.
Unknown mineral grains can be picked from a separate and placed directly onto the grain mount with tweezers or a needle. The grains should be placed onto the adhesive tape firmly enough to ensure that enough surface area of the grain is in contact with the tape, but not so firmly that the grain breaks. We recommend strategically distributing the unknown grains in such a way that any individual grain can be easily identified after microCT for further analysis. Grains should be spaced at least one grain length apart to minimize the effect of artifacts from highly attenuating phases. Forming lines or a grid of grains should be avoided, since these shapes tend to amplify artifacts. Known mineral standards of expected phases should be included on every grain mount. They can be shards of larger crystals or mineral grains that have been identified by an independent method, such as through micro-Raman spectroscopy. These standard grains should broadly match the grain sizes of the unknowns and be distributed throughout the grain mount in the same way as the unknowns, to account for any spatial variation in X-ray attenuation. In some cases, the mineral standard can also be used as the age standard for further analysis (e.g., Durango apatite).
Vertical grain mount scans produce better overall results by reducing microCT artifacts (see Fig. 7). However, horizontal scans are likely sufficient in many applications, such as distinguishing apatite and zircon, and allow multiple grain mounts to be stacked on top of the sample holder. This allows four times the number of grains in a single scan (up to 400 grains). The resulting file sizes will be bigger, but the scan time is the same.
Scan time will vary based on the instrument. Here we show that for simple mineral identification, rapidly acquired (<20 min on the Rigaku CT LAB HX) microCT data can be used to visually identify zircon from apatite or other phases. This can be done with little technical training by inspecting reconstructed grayscale photo slices using freely available software such as ImageJ (Schneider et al., 2012). For a more quantitative record or if the separation of phases with a small, weak density contrast (such as apatite and titanite) is required, grains can be segmented with more specialized software (such as Dragonfly), and average grayscale values can be extracted for each grain.
For some geo- and thermochronology applications it is necessary to detect inclusions or fractures and measure grain volume and surface area. For these applications, in addition to mineral verification, we recommend longer scan times (∼2 h with the Rigaku CT LAB HX), which yield a better spatial resolution. These data can be processed as described above, using, for example, ImageJ or Dragonfly, to yield grain-specific 3D volume and surface area measurements used to calculate FT and/or grain mass in (U-Th)/He thermochronology. Users may also use Blob3D (Ketcham, 2005), a free software package to directly calculate 3D FT correction factors.
3.6 Benefits of microCT in geo- and thermochronology
Herein, we present a rapid method for identifying or verifying apatite and/or zircon crystals in separates using microCT as a screening technique. This can serve several purposes depending on the goal of the research. First, it can reduce the misidentification of minerals prior to costly and time-intensive analyses. In the case of precious or low-yield samples, reducing human error is especially important.
The 3D grain-specific measurements acquired during the microCT scan provide added value to (U-Th)/He thermochronology research, where grain shapes are used to calculate FT corrections and directly impact age calculations. These corrections typically assume a mineral grain geometry and use a set of 2D microscope measurements by a lab member defining dimensions across a crystal using a computer image (e.g., Farley et al., 1996; Gautheron et al., 2021). The exact procedure for measuring individual crystals varies by laboratory (e.g., assumed grain geometries, number of 2D measurements made). Recent work has used microCT to calculate 3D FT and/or validate 2D FT measurements (Evans et al., 2008; Glotzbach et al., 2019; Cooperdock et al., 2019). The method presented here yields data that can be directly used with the Blob3D software for 3D FT calculation, or provide more precise grain-specific surface area and volume measurements for calculating FT by hand.
For detrital geochronology, the microCT pre-screening method described here can be used to identify mineral phases regardless of grain geometry, thereby enabling the use of grains with less-than-ideal geometries. Since apatite and zircon are mainly picked under a binocular microscope based on their grain shape, sub-euhedral or broken crystals, which typically represent the bulk of the crystals in a given separate, are often not chosen for further analysis. This can present a problem for samples with low yields or bias the results toward grains of specific morphologies (i.e., histories or age populations).
Furthermore, this method can be expanded beyond apatite, zircon, and titanite. For example, we did not analyze monazite or rutile in this study. However, based on MuCalc modeling and the characteristics of the microCT scans analyzed here, monazite and rutile should be distinguishable from apatite, zircon, and titanite at X-ray energies below ∼200 keV, with a greater distinction between these phases at lower X-ray energies. The separation of common detrital minerals, such as apatite, zircon, titanite, monazite, and rutile in a grain mount, crushed mineral separate, or rock sample, could also be used for detrital heavy mineral analysis.
In laboratories with ready access to a microCT instrument, this protocol can be incorporated into the primary workflow for (U-Th)/He analysis and reduce the amount of time spent at the picking microscope. Apatite and zircon grains can be placed directly onto a microCT mount without the need for careful identification or 2D measurements. A 2 h microCT scan would provide mineral ID verification, screen for inclusions or fractures, and provide 3D grain-specific volume and surface area measurements. Once data reduction and processing protocols are established and users are trained, data analysis can take anywhere from 15 min to a few hours, depending on the size of the dataset. More than 100 grains (including known mineral standards) can be placed onto a single mount and scanned vertically, or multiple mounts can be stacked horizontally, allowing for several hundred grains to be scanned and analyzed in a single session.
If microCT access is less available, the protocol may be used for particularly difficult-to-identify, precious, or low-yield samples. This technique can also be used for detrital zircon studies (U-Pb or (U-Th)/He) to reduce sampling bias toward more morphologically perfect crystals by pre-screening a large number of grains and using microCT to identify zircon grains for further analysis based on their density rather than grain shape.
We show that microCT pre-screening of grains picked from separates can be used to unequivocally distinguish apatite and zircon, and to distinguish apatite and zircon from other phases, such as titanite, with a degree of certainty. Normalizing grayscale values of grains from microCT volumes by the average value of a known zircon standard accounted for differences in experimental setup, instrument performance, and processing from one mount to the next. The remaining observed variation of grayscale values within and between grains is likely due to grain-specific natural variability of material parameters, such as crystal damage and elemental substitution.
We recommend the following best practices for future studies:
-
Mineral standards for normalization should be matched in size to the unknown samples to account for the effect of beam hardening.
-
Standards should be distributed throughout the mount, and sample grains should be normalized by the closest standard grain to minimize minor spatial effects.
-
The mount should be tilted vertically for microCT data acquisition to reduce the effect of shadowing from neighboring grains. MicroCT instrument geometries other than the one used here might require different mount orientations.
-
For the particular microCT instrument used here, the signal-to-noise ratio did not improve significantly past 17 min for continuous scans. A step scan of about 2 h (50 min counting time) was sufficient to produce high-resolution data with a usable signal-to-noise ratio.
MicroCT scans that are set up according to the recommendations represent a robust method for distinguishing between apatite and zircon in mounts of selected grains. This offers a possible alternative to separating apatite from zircon using highly toxic MEI. Grains can be picked directly from separates that have undergone density separation with non-toxic LST, LMT, or SPT, which is a less laborious and safer process. As an additional benefit, the data acquired in this process can also be used to screen the sample grains for fluid and mineral inclusions and to model alpha-ejection and alpha-implantation corrections for (U-Th)/He dating (Evans et al., 2008; Cooperdock et al., 2019).
Reconstructed microCT volumes for all mounts, X-ray energies, and scan times are stored at the USCHelium Lab and are available on request.
The supplement related to this article is available online at: https://doi.org/10.5194/gchron-4-501-2022-supplement.
EHGC and FH conceptualized the study and experimental design with input from AT; AC collected FCT samples; FH, RMCT, and AC prepared samples and collected data; all co-authors contributed to data interpretation; FH and RMCT prepared figures; EHGC and FH prepared and edited the manuscript draft with input from RMCT, AC, AT, and AJC.
Aya Takase is employed by Rigaku, which manufactures the micro-computed tomography instrument used in this study.
Publisher’s note: Copernicus Publications remains neutral with regard to jurisdictional claims in published maps and institutional affiliations.
We thank Justine Grabiec and Alexia Rojas for help with mineral separation; Danny Stockli and members of the UTChron laboratory for providing Fish Canyon Tuff and Durango samples; and Ken Farley for providing the Caltech Durango sample. We thank Kalin McDannell, Paul O'Sullivan, and Ryan Ickert for useful discussions about heavy liquid safety, and James Metcalf for FCT sampling information. We also thank Alan Gregorski and Aaron Alke for help sampling the FCT. We thank Greg Balco and two reviewers for improving the content and clarity of this manuscript. We thank Shigeru Sueoka for manuscript handling.
This research has been supported by the University of Southern California (Start-up and WiSE Major Support Funding grant).
This paper was edited by Shigeru Sueoka and reviewed by two anonymous referees.
Alves, H., Lima, I., and Lopes, R. T.: Methodology for attainment of density and effective atomic number through dual energy technique using microtomographic images, Appl. Radiat. Isot., 89, 6–12, https://doi.org/10.1016/j.apradiso.2014.01.018, 2014.
Buijs, W., Van Der Gen, A., Mohn, G. R., and Breimer, D. D.: The direct mutagenic activity of α, ω-dihalogenoalkanes in Salmonella typhimurium: Strong correlation between chemical properties and mutagenic activity, Mutat. Res. Lett., 141, 11–14, https://doi.org/10.1016/0165-7992(84)90029-0, 1984.
Bowring, S. A. and Schmitz, M. D.: High-precision U-Pb zircon geochronology and the stratigraphic record, Rev. Mineral. Geochem., 53, 305–326, https://doi.org/10.2113/0530305, 2003.
Cooperdock, E. H. G., Ketcham, R. A., and Stockli, D. F.: Resolving the effects of 2-D versus 3-D grain measurements on apatite (U–Th)/He age data and reproducibility, Geochronology, 1, 17–41, https://doi.org/10.5194/gchron-1-17-2019, 2019.
Dragonfly 2021.1: Object Research Systems (ORS) Inc, Montreal, Canada [computer software], 2021, http://www.theobjects.com/dragonfly, last access: 25 August 2021.
Donelick, R. A., O'Sullivan, P. B., and Ketcham, R. A.: Apatite fission-track analysis, Rev. Mineral. Geochem., 58, 49–94, https://doi.org/10.2138/rmg.2005.58.3, 2005.
Dumitru, T. A. and Stockli, D. F.: A better way to separate apatite from zircon using constriction tubes, Adv. Fiss.-Track Geochronol., 10, 325–330, 1998.
Evans, N. J., McInnes, B. I., Squelch, A. P., Austin, P. J., McDonald, B. J., and Wu, Q.: Application of X-ray micro-computed tomography in (U–Th)/He thermochronology, Chem. Geol., 257, 101–113, https://doi.org/10.1016/j.chemgeo.2008.08.021, 2008.
Farley, K. A.: (U-Th)/He Dating: Techniques, Calibrations, and Applications, Rev. Mineral. Geochem., 47, 819–844, https://doi.org/10.2138/rmg.2002.47.18, 2002.
Farley, K. A., Wolf, R. A., and Silver, L. T.: The effects of long alpha-stopping distances on (U-Th)/He ages, Geochim. Cosmochim. Acta, 60, 4223–4229, https://doi.org/10.1016/S0016-7037(96)00193-7, 1996.
Farley, K. A., Treffkorn, J., and Hamilton, D.: Isobar-free neon isotope measurements of flux- fused potential reference minerals on a Helix-MC-Plus10K mass spectrometer, Chem. Geol., 537, 119487, https://doi.org/10.1016/j.chemgeo.2020.119487, 2020.
Gautheron, C., Pinna-Jamme, R., Derycke, A., Ahadi, F., Sanchez, C., Haurine, F., Monvoisin, G., Barbosa, D., Delpech, G., Maltese, J., Sarda, P., and Tassan-Got, L.: Technical note: Analytical protocols and performance for apatite and zircon (U–Th)/He analysis on quadrupole and magnetic sector mass spectrometer systems between 2007 and 2020, Geochronology, 3, 351–370, https://doi.org/10.5194/gchron-3-351-2021, 2021.
Glotzbach, C., Lang, K. A., Avdievitch, N. N., and Ehlers, T. A.: Increasing the accuracy of (U-Th(-Sm))/He dating with 3D grain modelling, Chem. Geol., 506, 113–125, https://doi.org/10.1016/j.chemgeo.2018.12.032, 2019.
Guenthner, W. R., Reiners, P. W., and Chowdhury, U.: Isotope dilution analysis of Ca and Zr in apatite and zircon (U-Th)/He chronometry, Geochem., Geophys., Geosyst., 17, 1623–1640, https://doi.org/10.1002/2016GC006311, 2016.
Hanna, R. D. and Ketcham, R. A.: X-ray computed tomography of planetary materials: A primer and review of recent studies, Geochem., 77, 547–572, https://doi.org/10.1016/j.chemer.2017.01.006, 2017.
Hauff, P. L. and Airey, J.: The handling, hazards, and maintenance of heavy liquids in the geologic laboratory, USGS Circular, 827, https://doi.org/10.3133/cir827, 1980.
Holland, H. D. and Gottfried, D.: The effect of nuclear radiation on the structure of zircon, Acta Crystallogr., 8, 291–300, https://doi.org/10.1107/S0365110X55000947, 1955.
Hughes, J. M., Cameron, M., and Crowley, K. D.: Structural variations in natural F, OH, and Cl apatites, Am. Mineral., 74, 870–876, 1989.
Ketcham, R. A.: Computational methods for quantitative analysis of three-dimensional features in geological specimens, Geosphere, 1, 32–41, 2005.
Ketcham, R. A. and Carlson, W. D.: Acquisition, optimization and interpretation of X-ray computed tomographic imagery: applications to the geosciences, Comput. Geosci., 27, 381–400, https://doi.org/10.1016/S0098-3004(00)00116-3, 2001.
Koroznikova, L., Klutke, C., McKnight, S., and Hall, S.: The use of low-toxic heavy suspensions in mineral sands evaluation and zircon fractionation, J. South. Afr. Inst. Min. Metall., 108, 25–33, 2008.
Lafuente, B., Downs, R. T., Yang, H., and Stone, N.: The power of databases: the RRUFF project, in: Highlights in Mineralogical Crystallography, edited by: Armbruster, T., and Danisik, R. M., W. De Gruyter, Berlin, Germany, 1–30, https://doi.org/10.1515/9783110417104-003, 2015.
Lippolt, H. J., Leitz, M., Wernicke, R. S., and Hagedorn, B.: (Uranium + thorium)/helium dating of apatite: experience with samples from different geochemical environments, Chem. Geol., 112, 179–191, https://doi.org/10.1016/0009-2541(94)90113-9, 1994.
McDowell, F. W., McIntosh, W. C., and Farley, K. A.: A precise 40Ar–39Ar reference age for the Durango apatite (U–Th)/He and fission-track dating standard. Chem. Geol., 214, 249–263, https://doi.org/10.1016/j.chemgeo.2004.10.002, 2005.
Mounteney, I.: The use of lithium heteropolytungstate as an alternative to bromoform for heavy media separations, British Geological Survey IR/11/049, Nottingham, UK, 1–20, http://nora.nerc.ac.uk/id/eprint/519459 (last access: 18 January 2022), 2011.
Munsterman, D. and Kerstholt, S.: Sodium polytungstate, a new non-toxic alternative to bromoform in heavy liquid separation, Rev. Palaeobot. Palynol., 91, 417–422, https://doi.org/10.1016/0034-6667(95)00093-3, 1996.
Osterman-Golkar, S., Hussain, S., Walles, S., Anderstam, B., and Sigvardsson, K.: Chemical reactivity and mutagenicity of some dihalomethanes, Chem.-Biol. Interact., 46, 121–130, https://doi.org/10.1016/0009-2797(83)90011-x, 1983.
Roldán-Arjona, T., and Pueyo, C.: Mutagenic and lethal effects of halogenated methanes in the Ara test of Salmonella typhimurium: quantitative relationship with chemical reactivity, Mutagenesis, 8, 127–131, https://doi.org/10.1093/mutage/8.2.127, 1993.
Schneider, C. A., Rasband, W. S., and Eliceiri, K. W.: NIH Image to ImageJ: 25 years of image analysis, Nat. Method., 9, 671–675, https://doi.org/10.1038/nmeth.2089, 2012.
Tagami, T. and O'Sullivan, P. B.: Fundamentals of fission-track thermochronology, Rev. Mineral. Geochem., 58, 19–47, https://doi.org/10.2138/rmg.2005.58.2, 2005.
Van Bladeren, P. J., Breimer, D. D., Rotteveel-Smijs, G. M. T., and Mohn, G. R.: Mutagenic activation of dibromomethane and diiodomethane by mammalian microsomes and glutathione S-transferases, Mutat. Res., Environ. Mutagen. Relat. Subj., 74, 341–346, https://doi.org/10.1016/0165-1161(80)90192-2, 1980.
Vance, E. R. and Metson, J. B.: Radiation damage in natural titanites, Phys. Chem. Miner., 12, 255–260, https://doi.org/10.1007/BF00310337, 1985.
Vermeesch, P., Seward, D., Latkoczy, C., Wipf, M., Günther, D., and Baur, H.: α-Emitting mineral inclusions in apatite, their effect on (U–Th)/He ages, and how to reduce it, Geochim. Cosmochim. Acta, 71, 1737–1746, https://doi.org/10.1016/j.gca.2006.09.020, 2007.
Weimerskirch, P. J., Burkhart, K. K., Bono, M. J., Finch, A. B., and Montes, J. E.: Methylene iodide poisoning, Ann. Emerg. Med., 19, 1171–1176, https://doi.org/10.1016/S0196-0644(05)81524-0, 1990.