the Creative Commons Attribution 4.0 License.
the Creative Commons Attribution 4.0 License.
 | 22 Nov 2022
U and Th content in magnetite and Al spinel obtained by wet chemistry and laser ablation methods: implication for (U–Th) ∕ He thermochronometer
Marianna Corre
Arnaud Agranier
Martine Lanson
Cécile Gautheron
Fabrice Brunet
Stéphane Schwartz
Magnetite and spinel thermochronological (U–Th) He dates often display significantly dispersed values. In the present study, we investigated the contribution of analytical (and standardization) errors to this dispersion. U and Th content of magnetite (natural and synthetic) and natural Al spinel samples with U and Th concentrations between 0.02 and 116 µg g−1 were analyzed using both wet chemistry and in situ laser ablation sampling methods. New magnetite reference samples (NMA and NMB) were synthesized, consisting of U- and Th-doped nano-magnetite powders, whose U and Th concentrations were determined using a wet chemistry method (U and Th of NMA and NMB are ∼40 µg g−1 and ∼0.1 µg g−1, respectively). We show that, for both U and Th analyses, the reproducibility obtained with the wet chemistry protocol depends on the U and Th concentration. It is below 11 % for U–Th values higher than 0.4 µg g−1 and reaches 22 % for U–Th content lower than 0.1 µg g−1. This result implies that (U–Th) He thermochronological ages cannot be more reproducible than 24 % for magnetite containing less than 0.1 µg g−1 of U and Th, thus explaining part of the natural ages variability. U and Th data obtained by laser ablation ICP-MS on natural magnetite and Al spinel samples were calibrated using both silicate glass standards and synthetic magnetite samples. The U and Th contents determined using NMA are consistent with those obtained by means of the wet chemistry method, but they are overestimated by 30 % when using the glass standard samples only. These results highlight the impact of the matrix effect on the determination of the U–Th content in magnetite. We thus recommend the use of a well-characterized magnetite reference for the calibration of the U–Th signals obtained by laser ablation. The scatter in the (U–Th) He magnetite ages can be expected to be ∼20 % if the U and Th contents are determined by laser ablation. This level of precision is actually not significantly different from that obtained using the wet chemistry method, which paves the way for the use of laser ablation for determining (U–Th) He ages. In the absence of a spinel reference for U and Th calibration using LA-ICP-MS, silicate glass references, along with NMA, were used. U and Th contents were found to be ∼30 % lower than the values obtained using wet chemistry. This discrepancy underlines the importance of using a standard with a composition close to that of the mineral of interest. Although magnetite and Al spinel have related crystal structures, the magnetite standard is not appropriate for U and Th analysis in Al spinel using LA-ICP-MS.
Please read the corrigendum first before continuing.
-
Notice on corrigendum
The requested paper has a corresponding corrigendum published. Please read the corrigendum first before downloading the article.
-
Article
(3138 KB)
- Corrigendum
-
Supplement
(583 KB)
-
The requested paper has a corresponding corrigendum published. Please read the corrigendum first before downloading the article.
- Article
(3138 KB) - Full-text XML
- Corrigendum
-
Supplement
(583 KB) - BibTeX
- EndNote


In the last 15 years, the development of thermochronological (U–Th) He methods applied to both magnetite (MgHe) and spinel (SpHe) has opened up new avenues for dating the exhumation of mafic and ultramafic rocks (e.g., Blackburn et al., 2007; Cooperdock and Stockli, 2016, 2018; Schwartz et al., 2020) and for the chronology of aqueous fluid–ultramafic rock interactions that produce magnetite through “serpentinization” reactions (e.g., Cooperdock et al., 2020; Cooperdock and Ault, 2020). Ultramafic rocks are widely exposed in orogenic and ophiolitic contexts on continents as well as at slow-spreading centers, i.e., a couple of thousands of meters under the ocean. Accurate thermochronological data on ultramafic systems are thus essential to quantify the timing of the exhumation of mantle rocks in various geodynamic settings, like transform faulting in oceanic core complexes or upon the emplacement of ophiolitic units.
Both magnetite, Fe3O4, and spinel ss, (Mg,Fe)(Al,Cr,Fe)2O4, are iron-bearing oxides which crystallize in the spinel structure and often incorporate trace amounts of U, Th, and Sm (at the ng g−1 levels) during their crystallization. Helium is barely soluble in minerals (Gautheron and Zeitler, 2020), and only radioactive He produced during alpha decay of radiogenic isotopes contained in the mineral structure or from neighboring minerals can accumulate in the crystal structure (e.g., Gautheron et al., 2022). The (U–Th) He date acquisition requires the measurement of both radiogenic 4He on one hand and radioactive 235U, 238U, 232Th, and 147Sm concentrations on the other. MgHe and SpHe dates obtained for a variety of geological cases display quite dispersed values, typically in the 5 % to 70 % range. Such variability could be explained by heterogeneous crystallization timing, a variable He diffusion coefficient in those minerals, or alpha implantation from neighboring U–Th-rich minerals, or it could be associated with the very low U, Th, and Sm content in those minerals (e.g., Cooperdock and Stockli, 2016, 2018; Schwartz et al., 2020; Gautheron et al., 2022), which is, by implication, difficult to measure precisely. In addition, well-established magnetite and spinel samples as well as a collection of systematic analyses of U and Th precision and error for samples having different U and Th concentrations are lacking for the generalization of this emerging dating method. Precision in Sm content determination will not be discussed here, because data were not acquired in this study, even if Sm is routinely analyzed.
In this contribution, in order to evaluate the magnitude of analytical dispersion, we analyzed the concentrations of U and Th in samples of various origins, e.g., natural and U–Th-doped, homemade synthetic magnetite as well as natural Al spinel, which display a wide range of U and Th concentrations. Firstly, a wet chemistry analysis of U and Th with isotopic dilution using an inductively coupled plasma mass spectrometer (ICP-MS) has been performed. The latter is similar to the one proposed by Blackburn et al. (2007) and by Cooperdock and Stockli (2016). In parallel, we explored in situ quantification of U and Th concentrations in magnetite and Al spinel by means of laser ablation (LA) sampling coupled with the inductively coupled plasma mass spectrometer (LA-ICP-MS). The latter method, however, requires the use of appropriate solid standards, with matrix effects similar to those affecting the samples of interest (e.g., Steenstra et al., 2019; Koch et al., 2002). So far, the matrix effect in the case of spinel (Cr spinel) has only been investigated for elements with a much higher concentration (>10 µg g−1; Locmelis et al., 2011, and Colas et al., 2014) than the typical U and Th concentration encountered in spinel ( µg g−1). The LA-ICP-MS results obtained here were calibrated using silicate glass standards as well as a homemade synthetic U–Th magnetite. The reproducibility, accuracy, and applicability of both methods, along with their impact on the determination of (U–Th) He dates, are discussed.
2.1 Sample description and characterization
2.1.1 Natural sample
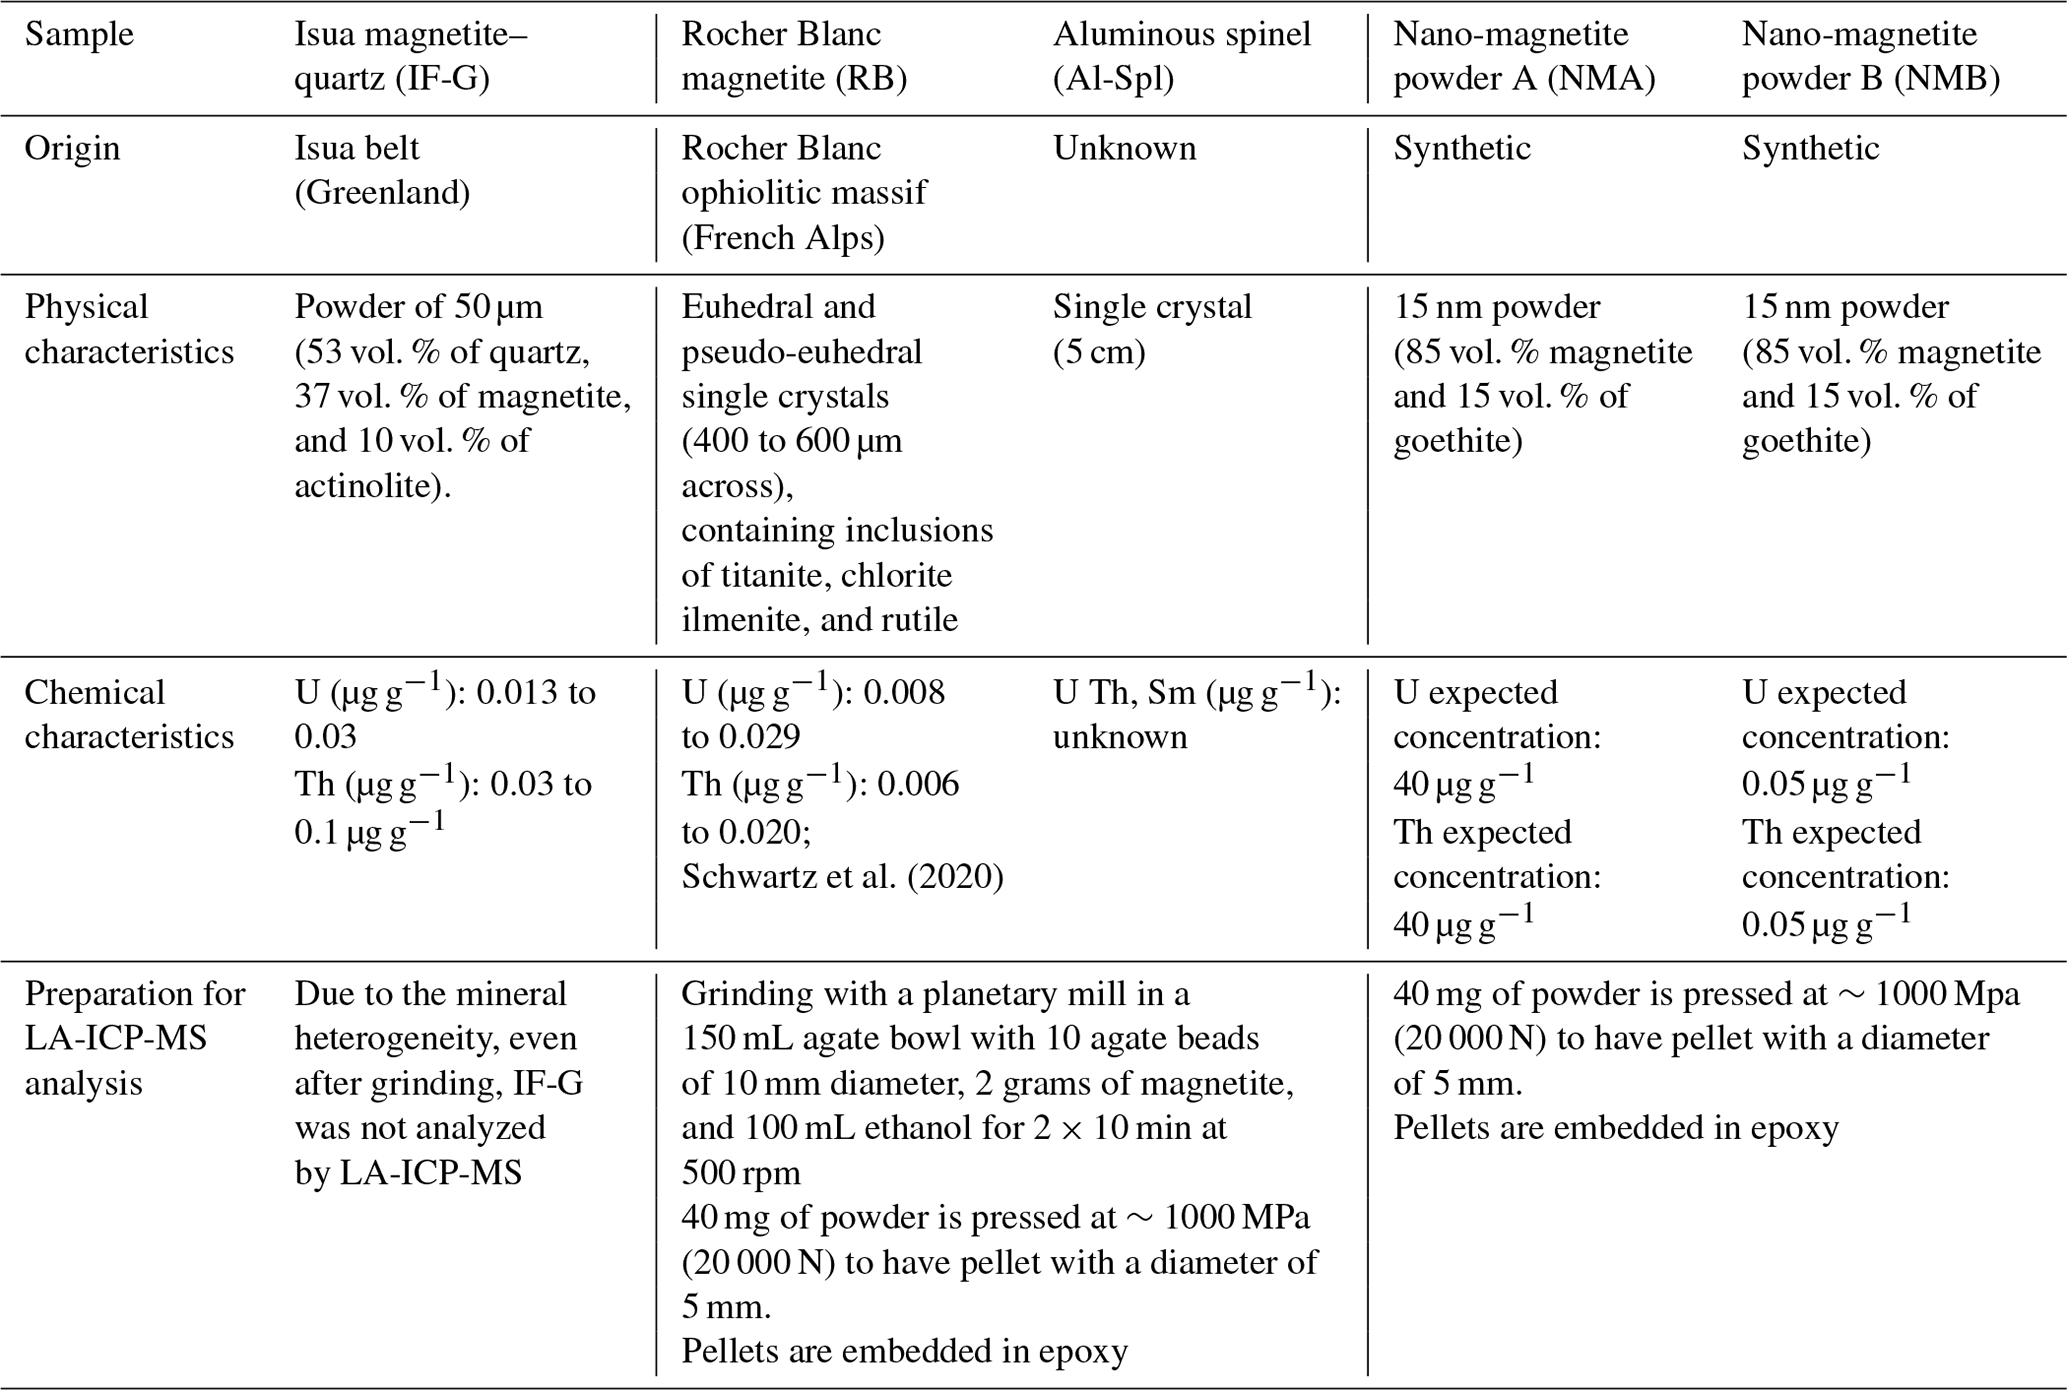
Three natural samples were selected for this study (Fig. 1, Table 1): a magnetite-bearing standard (IF-G), magnetite single crystals (RB) from an alpine ophiolite, and a purchased aluminous spinel crystal. Each sample was ground in order to get homogeneous powders, and XRD data were collected using a Bruker D8 Advance diffractometer at ISTerre (France). The IF-G sample is a mixture of magnetite, quartz, and actinolite (Govindaraju, 1995), sampled from a large iron ore deposit along the Isua supracrustal belt, West Greenland, that is used as a standard for major elements (Govindaraju, 1995). IF-G mineralogy is confirmed here by the XRD data (Fig. S1 in the Supplement). U and Th concentrations in this sample, as reported by eight independent studies, range from 0.01 to 0.03 and 0.03 to 0.1 µg g−1, respectively (Govindaraju, 1995; Dulski, 2001; Bolhar et al., 2004; Kamber et al., 2004; Guilmette et al., 2009; Parks, 2014; Bolhar et al., 2015; Viehmann et al., 2016; Table 1). The second sample (RB) is made of millimeter-sized euhedral magnetite crystals sampled in the Rocher Blanc ophiolite (western Alps, France; Tricart and Schwartz, 2006). Inclusion-free single crystals of RB magnetite were already studied for MgHe thermochronology by Schwartz et al. (2020). Two grams of RB magnetite were ground for the present study. The U and Th contents of the RB euhedral magnetite are in the range of 0.006–0.029 µg g−1 (Table 1). Finally, two grams of powder were obtained by grinding a 5 cm-large crystal of aluminous spinel (Al-Spl) of unknown origin, purchased in a jewelry store and selected because of its size and purity (Table 1). Al-Spl was analyzed by means of the SAMx EDS SDD (silicon drift detector) under a Vega3 Tescan scanning electron microscope (SEM) at the ISTerre (France), yielding a (Mg0.65Fe0.35)Al2O4 composition.
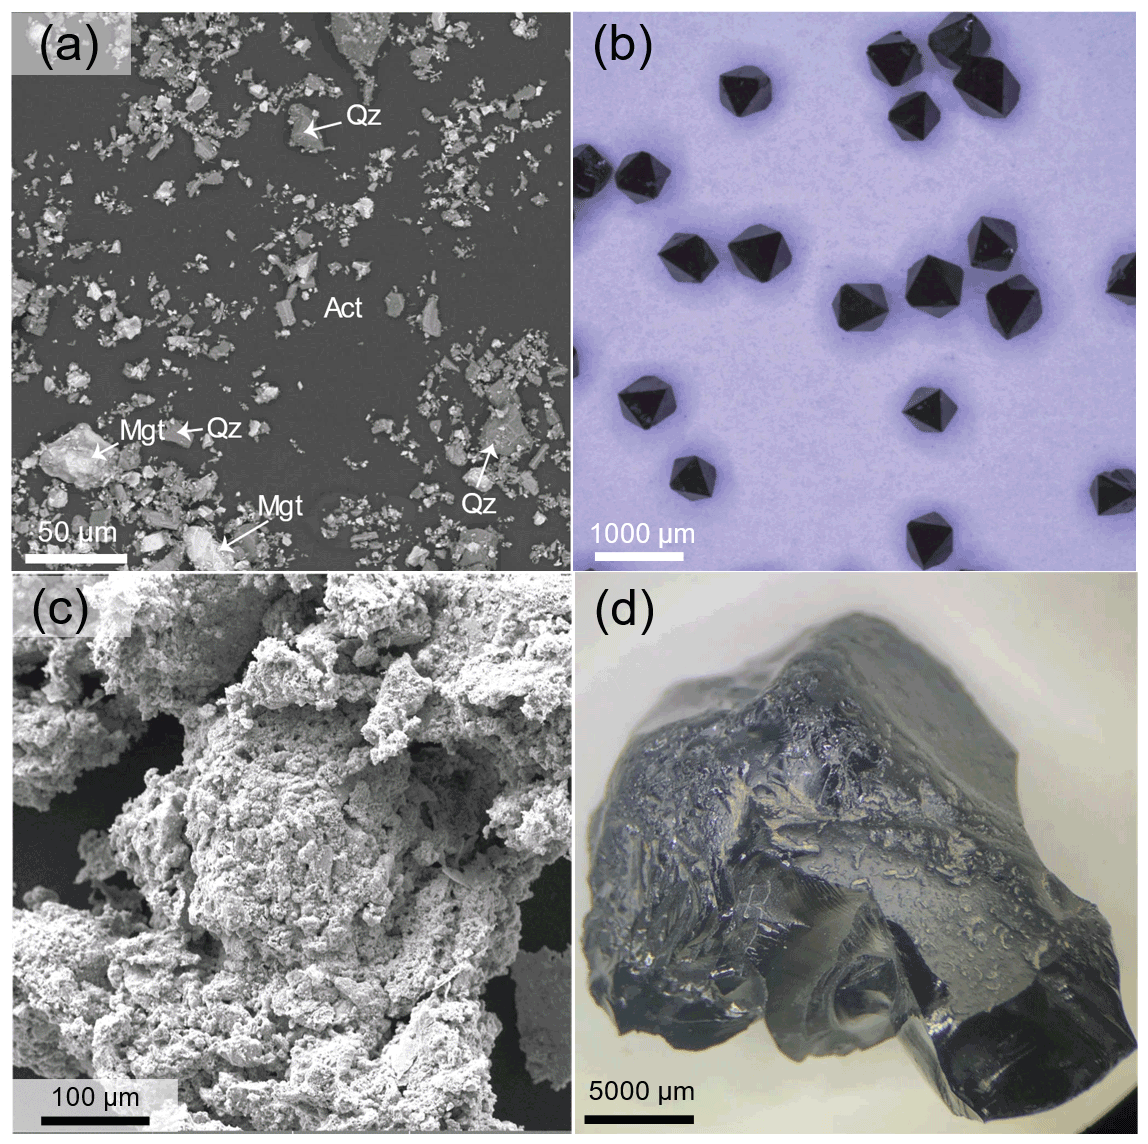
Figure 1Images of the studied samples before the grinding. (a) BSE image of IF-G; (b) photograph of magnetite crystals from Rocher Blanc (Alps, France); (c) BSE image of nano-magnetite particles (NMA sample); and (d) photograph of the fragment of Al-Spl macrocrystal used for this study.
2.1.2 U–Th-doped synthetic magnetite samples
Two batches of U–Th-doped nano-magnetite powder (named NMA and NMB) were synthesized by co-precipitation from FeCl2 and FeCl3 solutions (Martínez-Mera et al., 2007). Equal amounts of U and Th – ∼40 µg g−1 for NMA and ∼0.05 µg g−1 for NMB – were added to the acidified FeCl2 starting solution. All solutions were prepared using boiled, deionized water (MilliQ, 18.2 MOhms), deoxygenated by bubbling with N2 gas for 30 min. Instantaneous precipitation of magnetite was achieved at 45 ∘C by simultaneous addition of the 0.125 mol L−1 of FeCl2 and FeCl3 solutions to an ammonia solution at 0.2 mol L−1. The solid was then separated from the supernatant using a permanent magnet, and it was rinsed four times with oxygen-free MilliQ water to avoid oxidation. X-ray powder diffraction data obtained on the NMA sample indicated the production of 85 % of magnetite and 15 % of goethite and allowed for the estimation of the grain size of 15 nm from the diffraction peaks' width (see Fig. S4). The two mineral phases could not be separated. Complementary experiments were performed to determine the U and Th host phase(s) in the nano-magnetite product, which are presented in Appendix A.
2.2 Sample preparation for U and Th analysis
To compare the U and Th concentrations obtained with wet chemistry and laser ablation sampling methods, two grams of natural samples (RB and Al-Spl) were homogenized. The studied materials were ground separately in a planetary mill at 500 rpm for 10 min to obtain a grain size of ∼2 microns. Each sample was characterized by XRD (Figs. S1 to S4 in the Supplement). The RB powder contains calcite, titanite, chlorite (Fig. S2), whereas the Al-Spl sample is composed of pure aluminous spinel. Samples NMA and NMB, which already consisted of nanoparticles, did not necessitate grinding. The U and Th contents of these four samples were retrieved using wet chemistry and laser ablation and analyzed with ICP-MS. Pellets (5 mm diameter) obtained from 40 mg of powder under a pressure of ∼1000 MPa (20 000 N) were embedded in epoxy resin. The IF-G sample could not be pelletized due to the heterogeneous size of the minerals forming the mixture after grinding. This size heterogeneity can also lead to a nugget effect on LA-ICP-MS analysis.
2.3 Wet chemistry
2.3.1 Sample digestion
Every step of the sample preparation is conducted in a Class 10 000 clean laboratory at Institut Universitaire Européen de la Mer (IUEM, France), using deionized water obtained on a Millipore® Milli-Q system, set at resistivity of 18.2 MΩ, and sub-boiled acids. Sample digestions and purification are performed for magnetite and spinel in 2 mL Savilex® Teflon microbombs. Vials are pre-washed using a sequence of purified nitric acid (HNO3) and fluoridric acid (HF)–nitric acid (HNO3)–perchloric acid (HClO4) mixtures at 120 ∘C.
About 0.005 to 0.1 g of IF-G, RB, Al-Spl, and synthetic nano-magnetite NMA and NMB powder samples are dissolved with ∼10 µL of a 4.49 and 3.67 ng g−1 in-house 235U- and 230Th-mixed spike (Gautheron et al., 2021) in 2 mL Savilex® microbombs. For both magnetite and aluminous spinel, we use a mixture of 1.5 mL aqua regia (one volume of 10.5 N HCl + three volumes of 18 N HNO3)+0.5 mL of 29 N HF + two drops of concentrated HClO4. Even though aqua regia is, by itself, sufficient to ensure the total dissolution of magnetite (Blackburn et al., 2007), HF was added in order to get rid of possible silicate inclusions. The purpose of HClO4 (evaporation temperature above 180 ∘C) is to inhibit the trapping of rare earth elements in fluoride crystals during evaporation (e.g., Li and Lee, 2006; Inglis et al., 2018; Ilyinichna et al., 2020). For magnetite, the acid digestion at 130 ∘C takes only a couple of hours, while for aluminous spinel, which is a more refractory mineral, the acid digestion at 130 ∘C takes at least 48 h. Furthermore, in order to increase the pressure inside the vial, Ultem® sockets are added around the lids, as proposed by Inglis et al. (2018), for zircon digestion.
After complete dissolution, the remaining solutions are evaporated following two steps: (1) 130 ∘C until HCl, HNO3, and HF are evaporated; and (2) 180 ∘C to evaporate HClO4. At the end, we obtained a solid residue, and we added 0.5 mL of 1 N HNO3 before closing the microbombs and placing them on a hot plate at 100 ∘C.
2.3.2 U and Th purification
U and Th contained in the IF-G sample were purified (mostly by removing Al and Fe) using 1.5 mL of Eichrom© UTEVA B resin ion exchange resin columns, as in Douville et al. (2010). Resins are washed using 10 mL of deionized water and conditioned with 1 mL of 3 N HNO3. U and Th are eluted with 6 mL of 3 N HNO3 and recovered with 4 mL of 3 N HCl (Th) and 4 mL of 1 N HCl (U).
2.3.3 U and Th dilution
After digestion, 15 IF-G, 17 RB, 14 Al_Spl, 14 NMA, and 12 NMB solutions were diluted to reach suitable concentrations of Fe (<1500 µg g−1) for HR-ICP-MS analysis. As U and Th contents in magnetite and spinel natural samples are low (<500 ng g−1; Cooperdock et al., 2016; Cooperdock and Stockli, 2018, and Schwartz et al., 2020), the quantitative determination of U–Th abundances can hardly be performed on solutions with dilution factors higher than 3000, as routinely proposed for silicate rocks and minerals, (e.g., Li and Lee, 2006). However, magnetite is made of >75 wt % Fe, and aluminous spinel contain ∼25 wt % Fe and up to ∼50 % Al. The direct analysis of undiluted magnetite and spinel solutions, loaded with these two elements by ICP-MS, is known to induce strong non-spectroscopic (or “matrix”) effects on both introduction and ionization (Koch et al., 2002; Steenstra et al., 2019).
2.4 Analytical conditions
2.4.1 Analysis of U and Th by wet chemistry
The U and Th analyses for purified or diluted solutions were performed using an ICP-MS Thermo® Element XR at IUEM, associated to either a PFA nebulizer connected to a standard quartz cyclonic chamber or a nitrogen-supplied desolvating nebulizer (ESI® apex Q Elemental Scientific) introduction system (Potin et al., 2020; Costa et al., 2020), depending on the required level of sensitivity. Isotope dilution analyses are made possible by the 235U- and 230Th-mixed spike additions operated before the sample digestion. In addition to the U–Th elements, the Mn content (54Mn isotope) was additionally measured. Acidic conditions in the analysis solution (addition of HF) prevented Th loss. Four procedural blanks were run, and the blank levels for these measurements were 13 picograms of U and 47 picograms of Th. Between two analyses, a 4 min wash sequence was performed using a mixture of HNO3+ HF, avoiding inter-sample contamination.
2.4.2 In situ laser ablation sampling and U and Th analysis
In situ LA-ICP-MS analyses were performed on pellets using a Coherent Compex Pro102 laser ablation system coupled to an ICP-MS Thermo® Element XR at IUEM (e.g., Van Kooten et al., 2019; Kubik et al., 2021) operated at a low resolution. The laser has a directional power maintained at 1200 V; it emits at a wavelength of 193 nm (Ar-F type) and has a pulse duration in the nanosecond range. The energy output was set at 20 J cm−2, with a laser frequency of 10 Hz. The spot diameters at 160 µm were adapted on the U and Th contents of the targeted pellets (RB, NMA, Al_Spl). Gas blanks were systematically checked by running 10 cycles of measurements before igniting the laser. The whole surface of pellets was covered by 10 LA-ICP-MS analyses, each one of them consisting of 30 measurements. In addition, the Mn content (54Mn isotope) was measured with the wet chemistry method by ICP-MS, to be used as an internal standard for the ablated mass. The calibration was originally operated using silicate international glass standards, BHVO-2g (OIB basalt), BIR1g (tholeiitic basalt), and BCR2g (basalt; Gao et al., 2002) and complemented with the NMA nano-magnetite sample. LA-ICP-MS analytical parameters are summarized in Table 2.
Table 2LA-ICP-MS analytical parameters
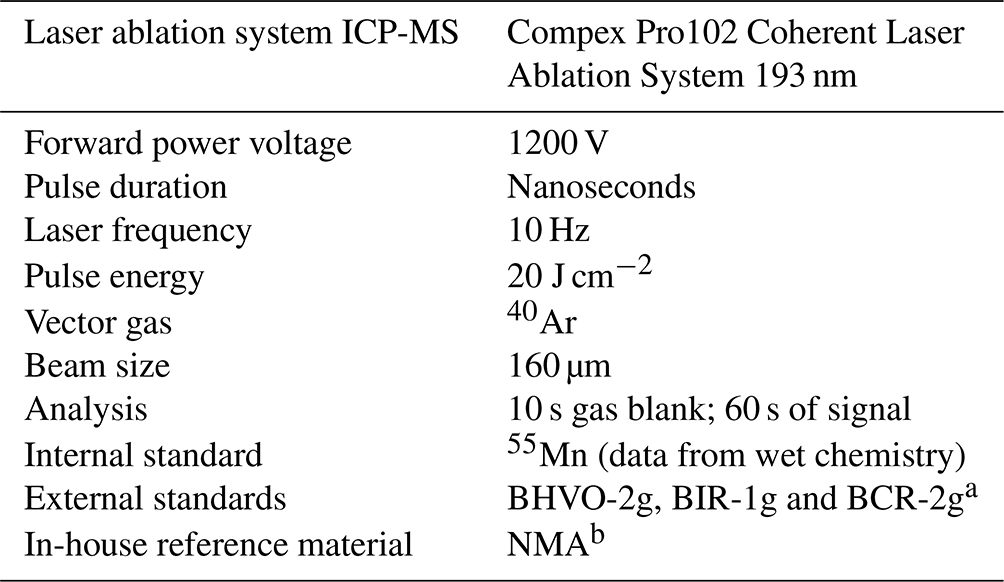
a See description in main text. b Nano-magnetite A.
3.1 Wet chemistry U and Th concentration results
The purification protocol was used only on the IF-G sample, and U and Th concentrations results (0.02±0.01 and 0.1±0.08 µg g−1, respectively) are reported in Table 3 and Fig. 2. While the measured U content present values that are similar to previously published estimates, Th concentrations display more scattered results, distinct from those of previous studies (Govindaraju, 1995; Dulski, 2001; Bolhar et al., 2004, 2015; Kamber et al., 2004; Guilmette et al., 2009; Parks, 2014; Viehmann et al., 2016).
Table 3U and Th concentration results obtained by purification.
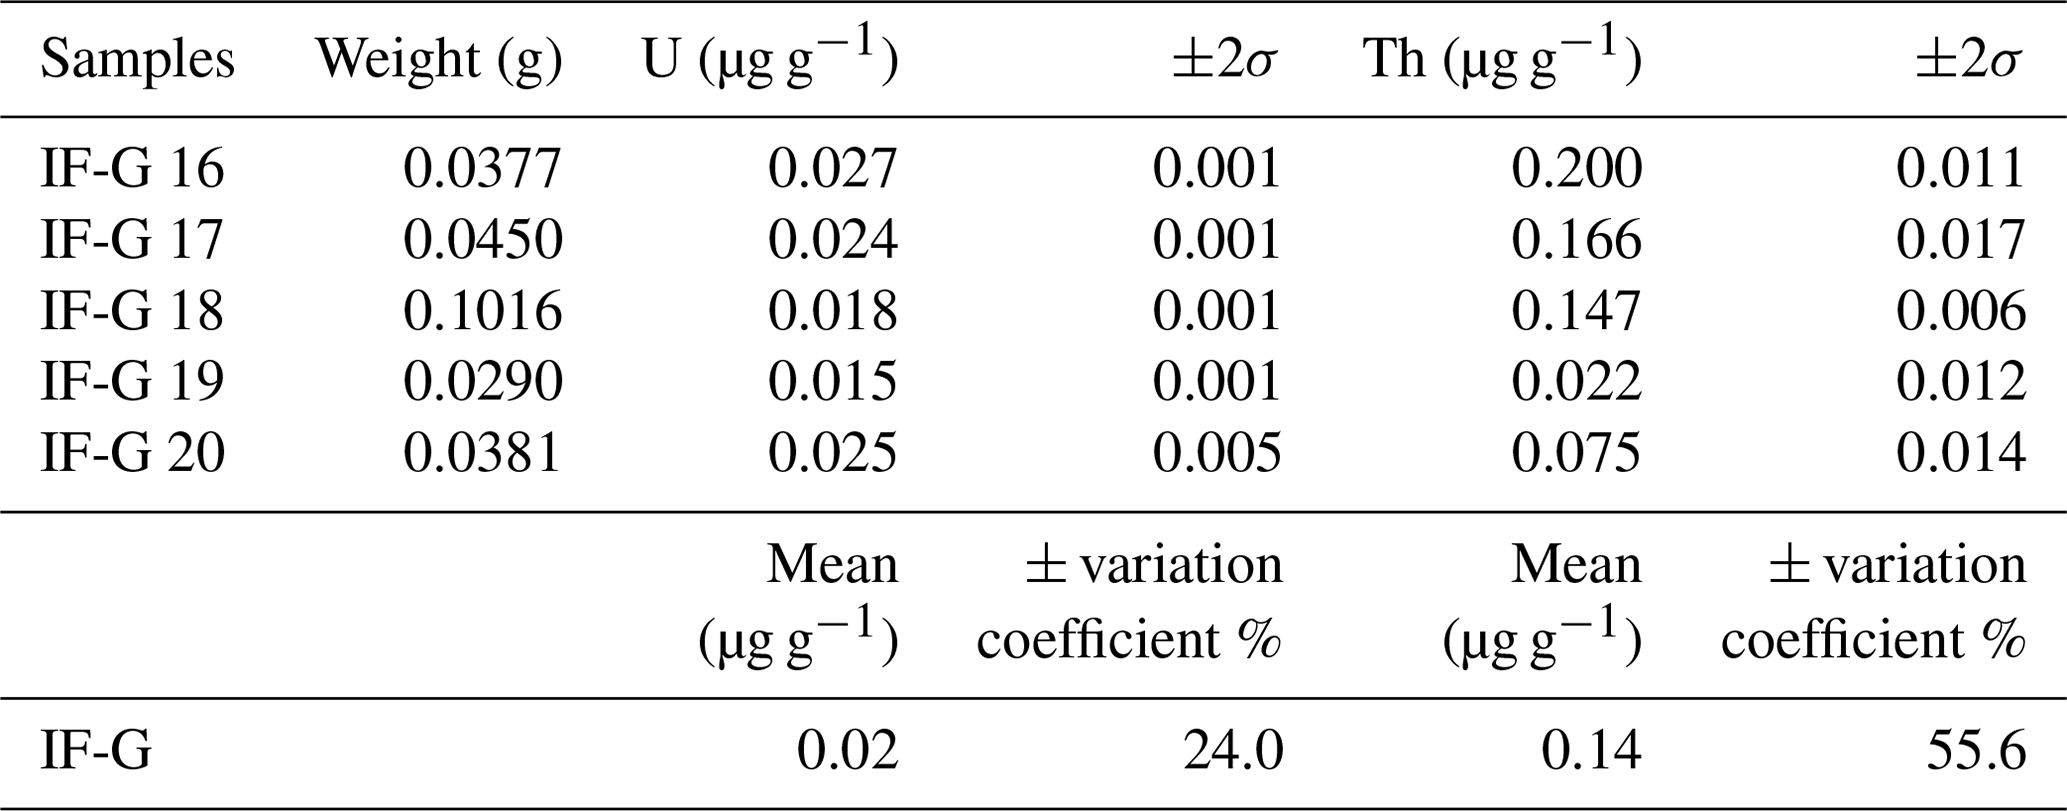
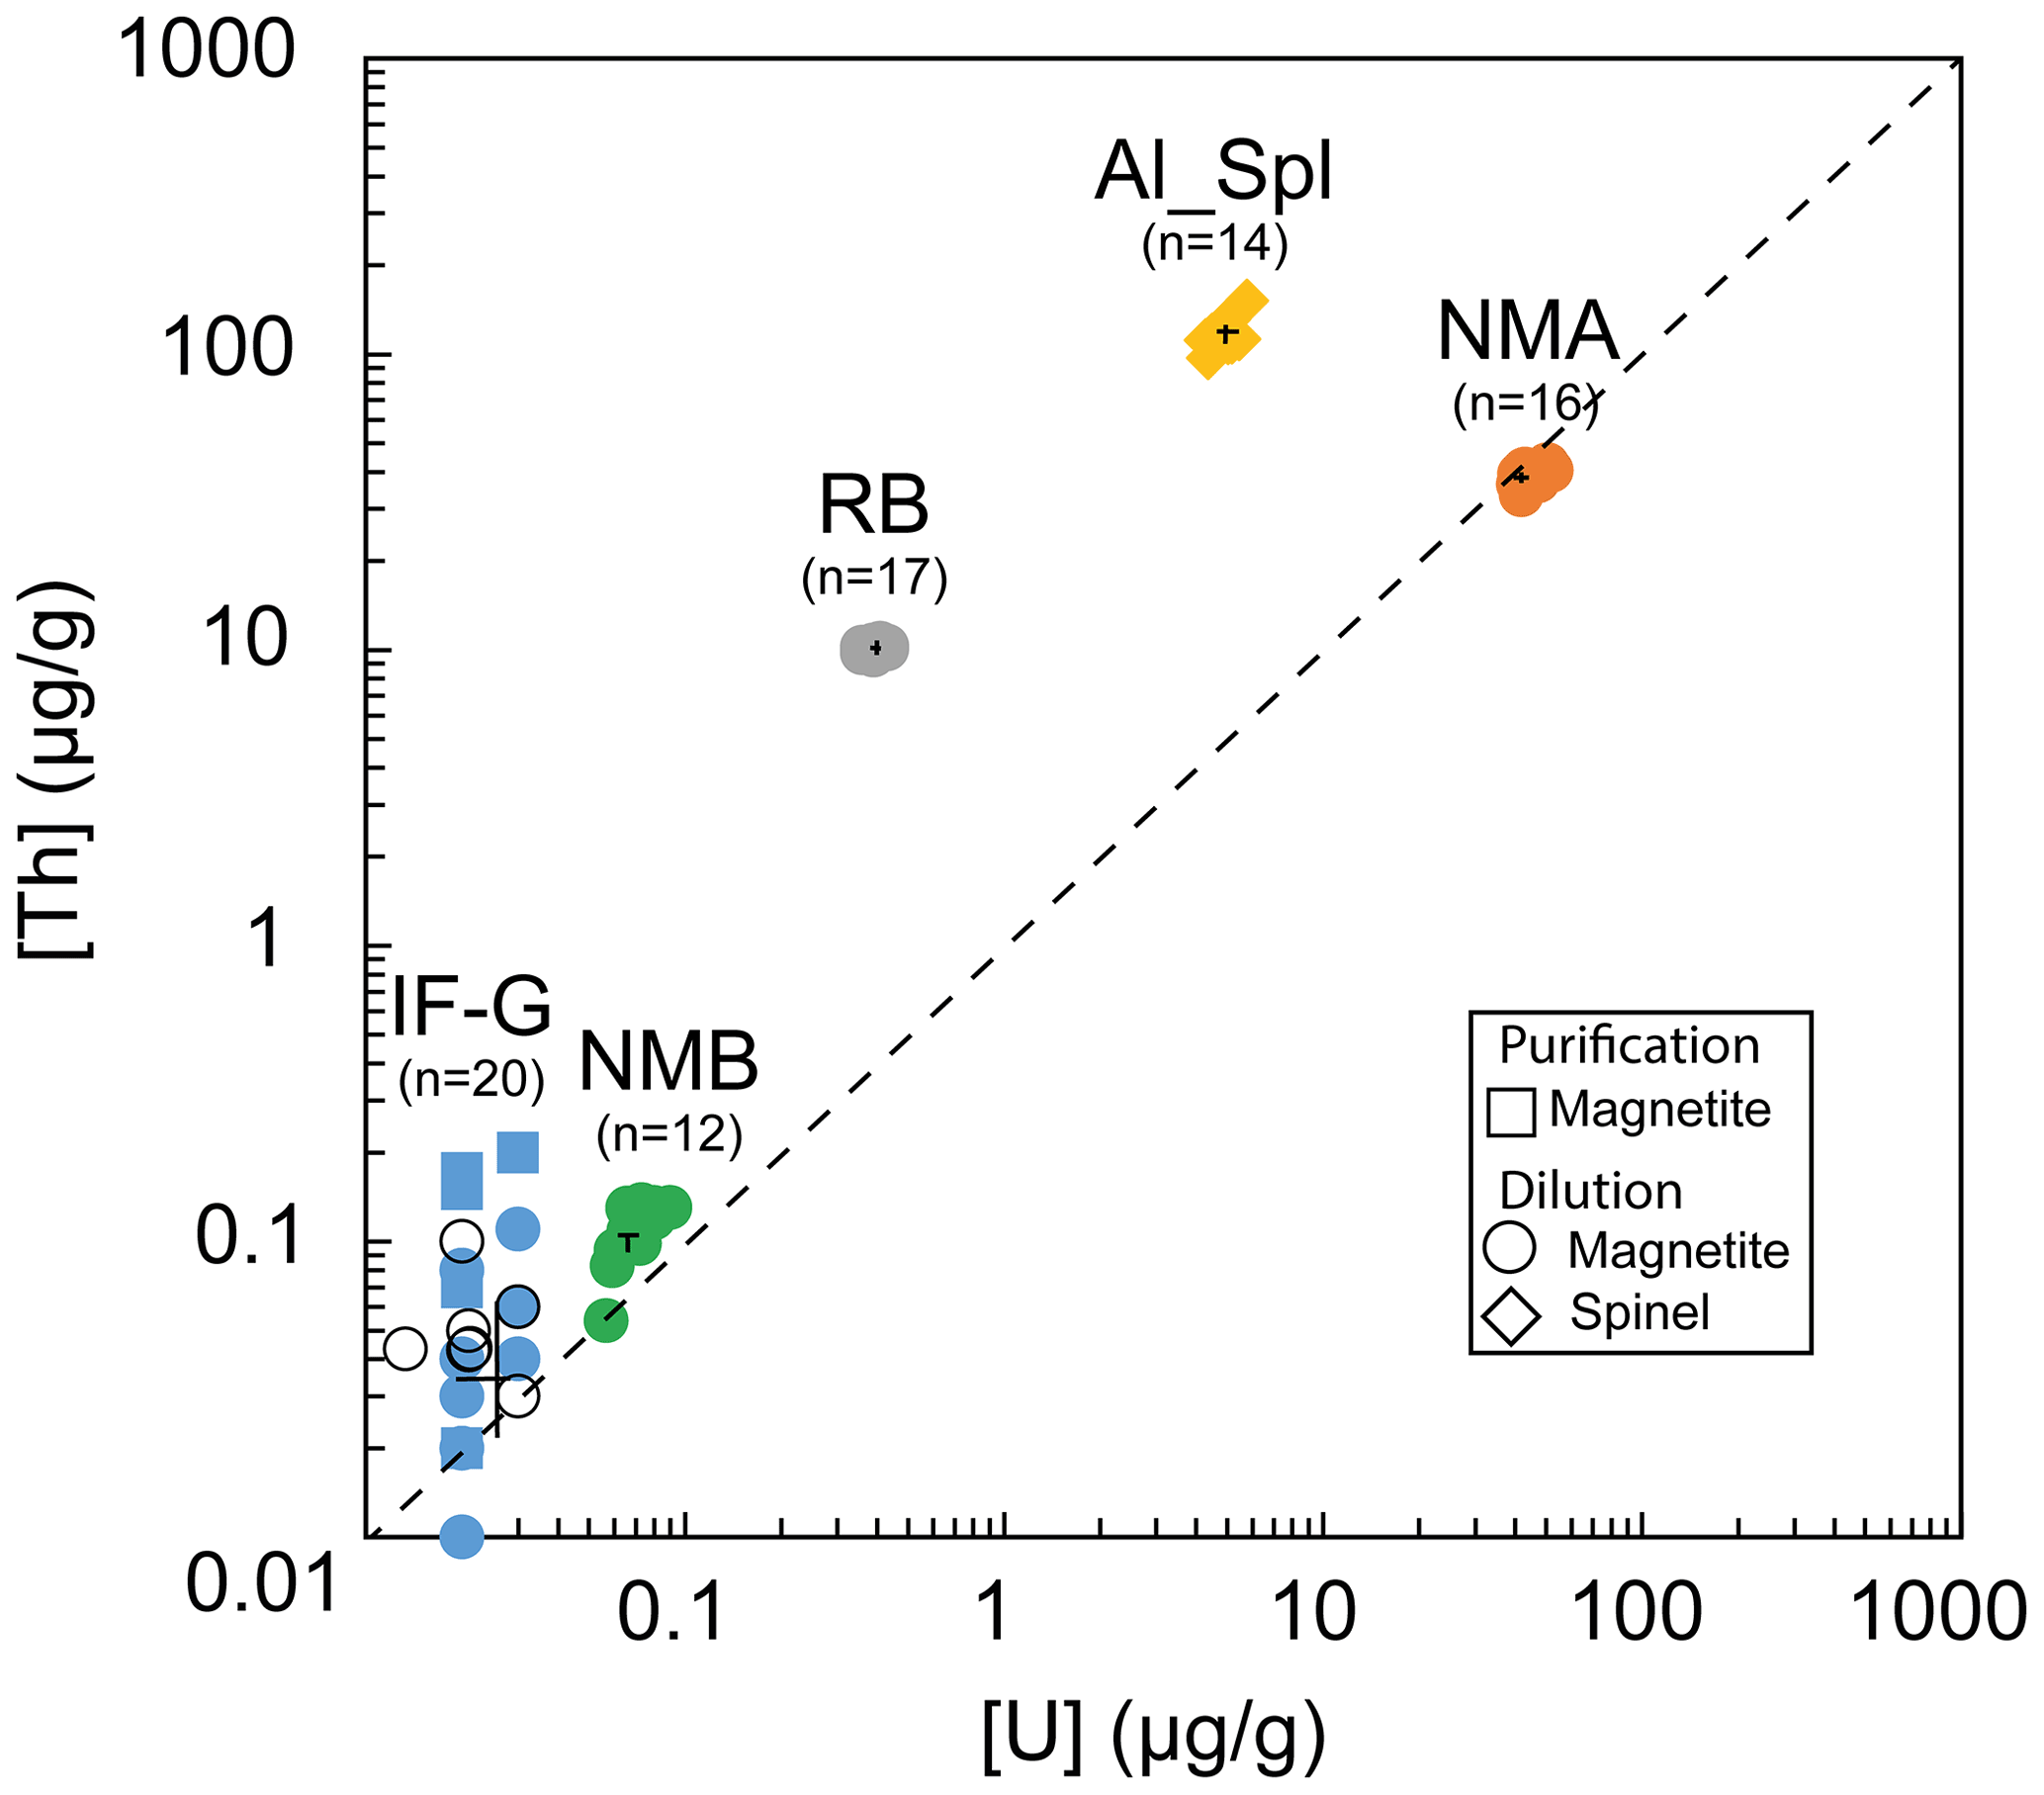
Figure 2U and Th content obtained by wet chemistry and associated mean value and standard deviation (black cross); black empty circles represent IF-G results from the literature (Govindaraju, 1995; Dulski, 2001; Bolhar et al., 2004, 2015; Kamber et al., 2004; Guilmette et al., 2009; Parks et al., 2014; Viehnmann et al., 2016).
The range of the U and Th concentrations obtained by the wet chemistry method on diluted solutions are reported in Fig. 2 and Table 4. U and Th concentrations range from 0.02±0.01 to 45.62±3.40 µg g−1 and from 0.04±0.03 to 116.01±12.60 µg g−1, respectively. One can notice that the U and Th contents measured in this study for the RB sample differ by a factor of ∼100 from the one obtained by Schwartz et al. (2020) in Table 4. This might be explained by the presence of calcite (4 %) and titanite (2 %) in our RB powder (Fig. S2), which can contain significant U and Th. Calcite and titanite might have been present initially as inclusions in the selected RB magnetite grains. Indeed, Schwartz et al. (2020) selected inclusion-free magnetite grains after X-ray tomography inspection of each grain. The RB powder has been further used as a reference in this study for their homogeneous U and Th contents.
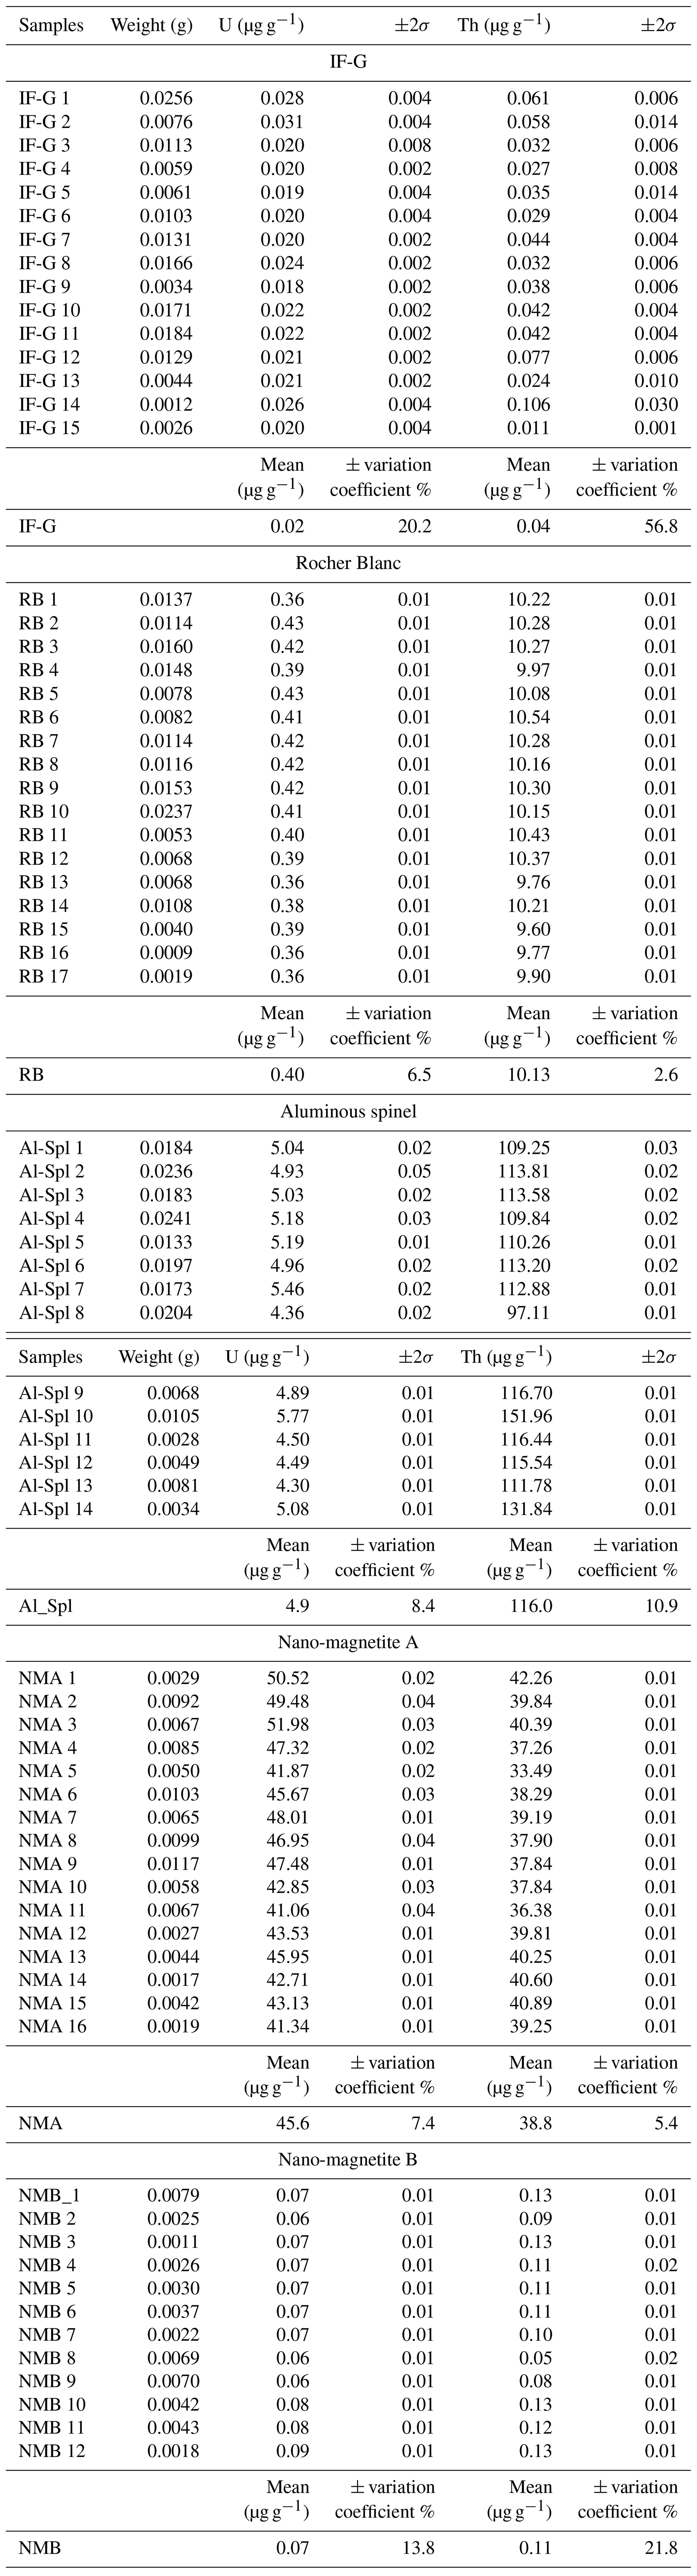
Figure 3a represents the dispersion on Th concentrations (expressed as a percentage of these values) as a function of that on U concentrations for each sample. Dispersion magnitude depends on the concentration. The dispersion is larger for Th than for U, whatever the sample. The two samples showing the lower U and Th concentrations – i.e., IF-G and NMB – are those that have the most scattered values: 20.2 % and 13.8 % for U, respectively, and 56.8 % and 21.8 % for Th, respectively (Fig. 3a–c). The U and Th content obtained for the IF-G sample is similar to the one obtained in former studies: U concentration ranges from 0.01 to 0.03 µg g−1, and Th concentration ranges from 0.03 to 0.1 µg g−1 (Govindaraju, 1995; Dulski, 2001; Bolhar et al., 2004, 2015; Kamber et al., 2004; Guilmette et al., 2009; Parks et al., 2014; Viehmann et al., 2016; Fig. 2). The dispersion by 20 % and 57 % for U and Th, respectively, in IF-G is comparable with dispersion obtained in the literature data. For the RB, Al-Spl, and NMA samples, the dispersion of U content is similar and ranges between 7 % and 8 %, while the dispersion of the Th content is higher for NMA and Al-Spl than for RB, even if the latter has a lower concentration (i.e., NMA: 5 %; Al-Spl: 11 %; and RB: 3 %).
3.2 In situ U and Th concentrations measured in natural magnetite and spinel using two different calibrations
The calibration of the LA-ICP-MS data used for the data reduction of RB and of Al-Spl samples was performed using silicate glass standards (BCR-2g, BHVO-2g, BIR-1g) together with the NMA in-house reference sample, whose U and Th concentrations were verified by the wet chemistry method.
To calculate the U and Th concentration from the LA-ICP-MS signal, we used the UMn and ThMn ratios given for silicate glass standards and the mean value obtained using wet chemistry for the NMA sample and the LA-ICP-MS signal i(238U)Mn) and i(232Th)Mn) for the silicate glasses and NMA samples. Thus, for the NMA sample, we assumed that the mean U and Th concentrations obtained by the wet chemistry method were accurate enough to be used. The UMn and i(238U)Mn) data or the ThMn and i(232Th)Mn) data for each silicate glass sample are well aligned, as shown on Fig. 4 (dotted red line). The results for the NMA sample are slightly shifted from the silicate glass calibration lines, and a second calibration was performed using all results (silicate glass and NMA) that are reported in Fig. 4 (blue line).
Using this calibration, we calculated the U and Th concentrations for the RB sample using silicate glass standards (U and Th µg g−1) and using silicate glasses and NMA samples (U and Th µg g−1; Table 5). Similarly, U and Th concentrations in Al-Spl were determined by LA-ICP-MS using silicate glass standards, yielding U and Th concentrations of, respectively, 4.1±0.5 and 88.8±8.6 µg g−1 (Table 5). When NMA is added, derived concentrations are 4.0±0.5 for U and 79.2±7.7 µg g−1 for Th (Table 5). Dispersion, whatever the calibration line, remains below 16 %, which is comparable with trace element concentration dispersion obtained by Dare et al. (2014) with LA-ICP-MS on magnetite with silicate glass standards (RSD <15 % for concentration ranging between 10 and 100 µg g−1).
Table 5U and Th concentration determined using LA-ICP-MS method with two types of calibration (silicate glasses only and silicate glasses plus NMA sample).
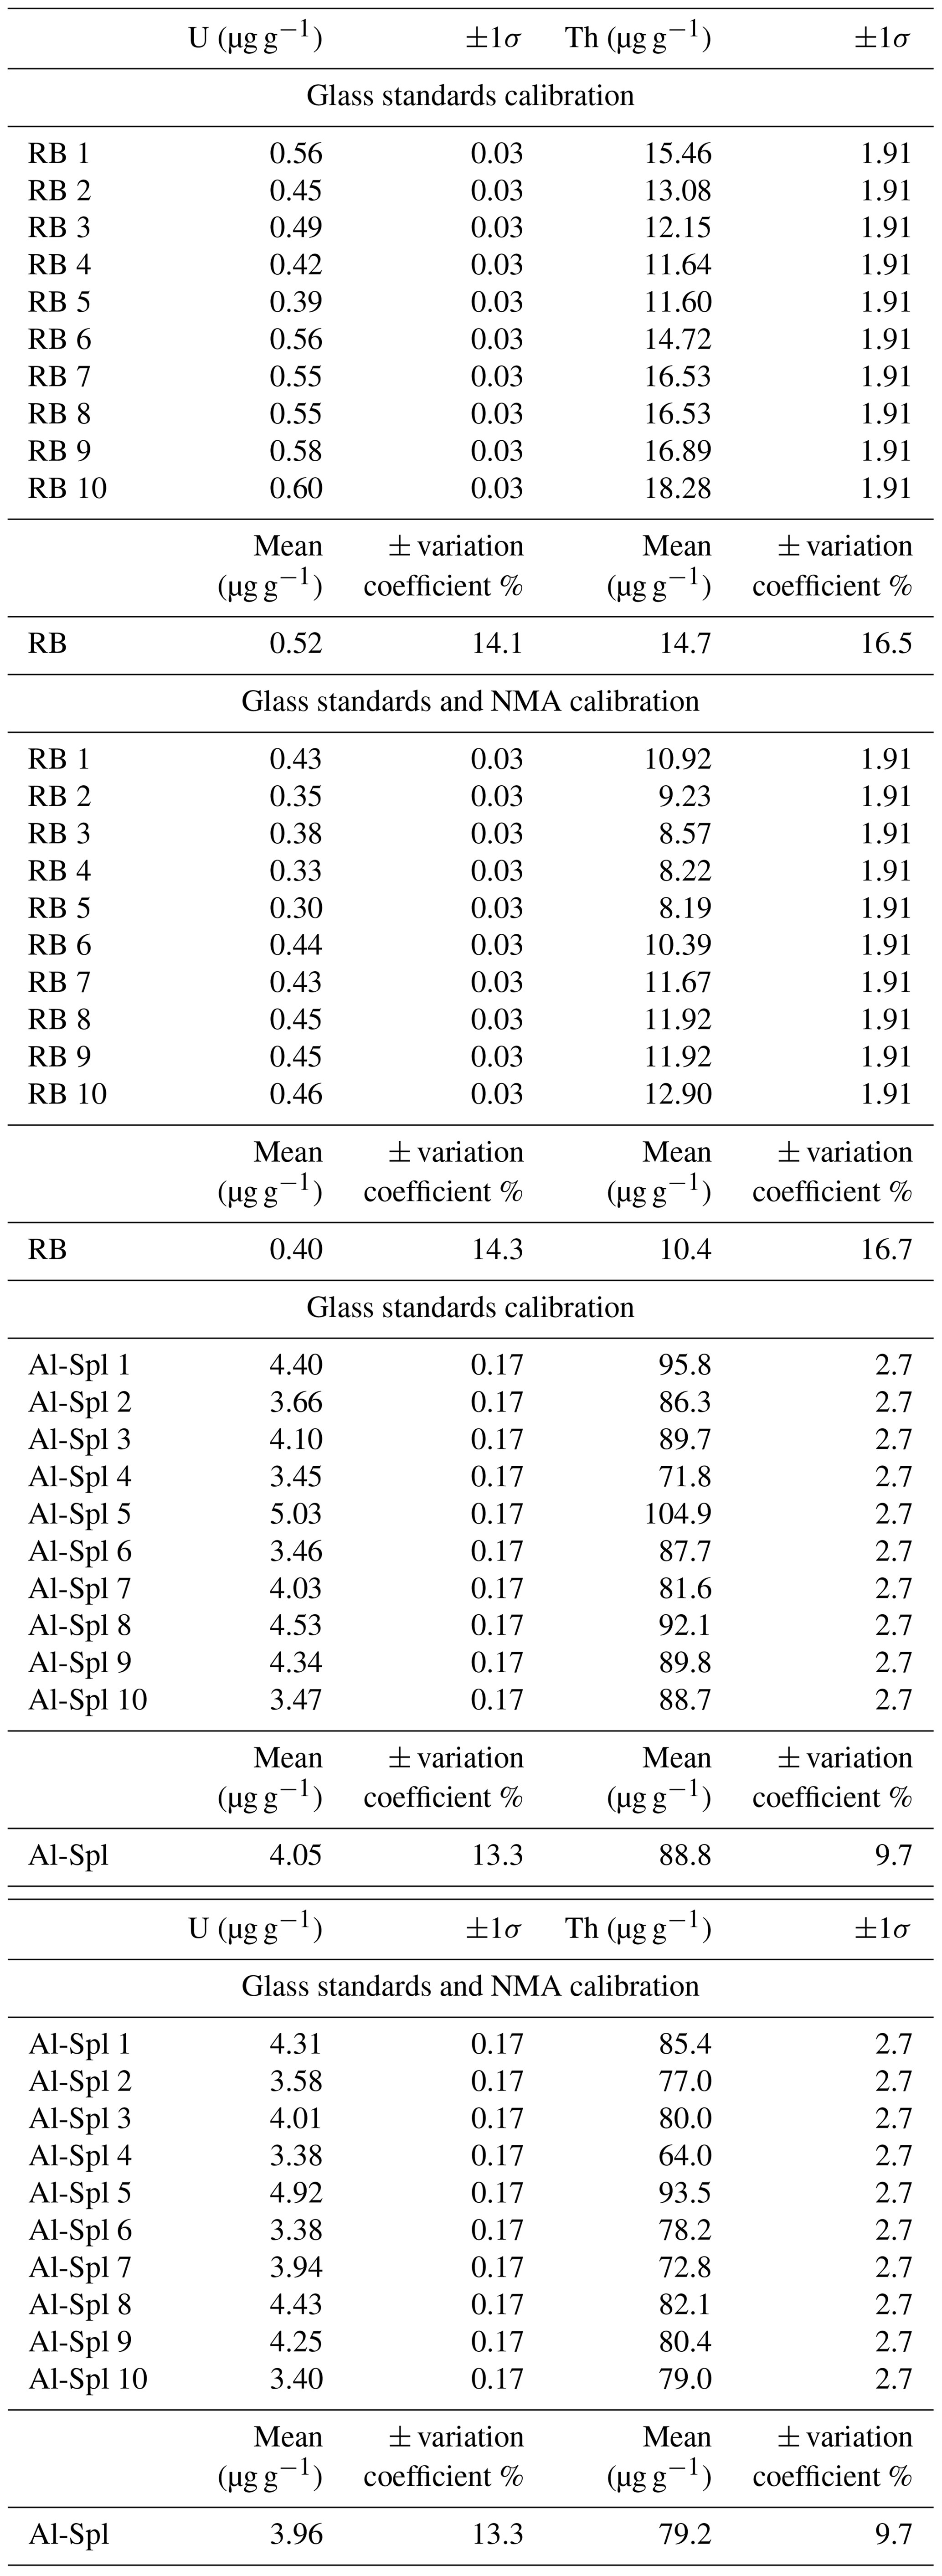
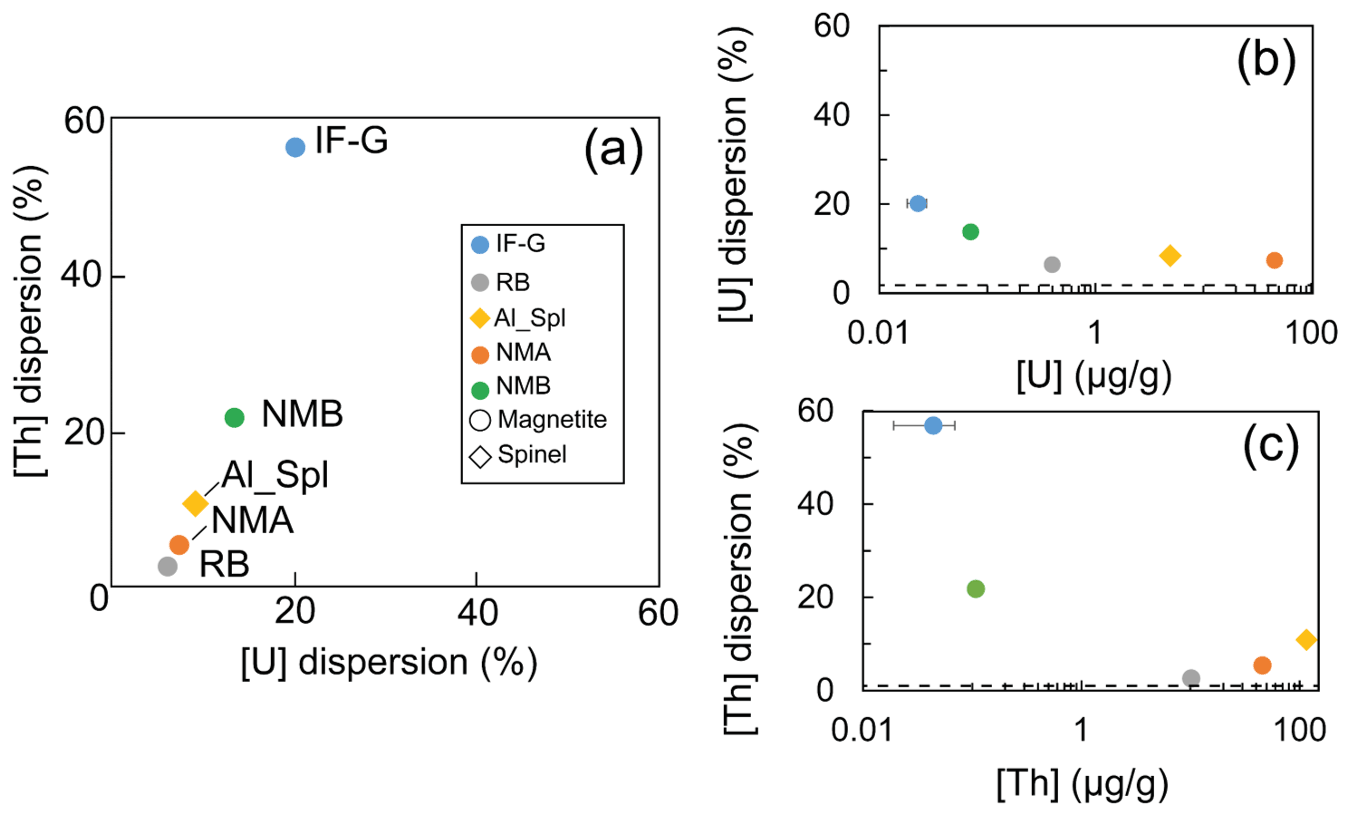
Figure 3(a) Dispersion of the U and Th concentrations obtained by wet chemistry sampling. (b, c) Mean U and Th concentrations as a function of the associated dispersion, respectively. Dash lines are the minimum uncertainty of U and Th derived from counting statistics.
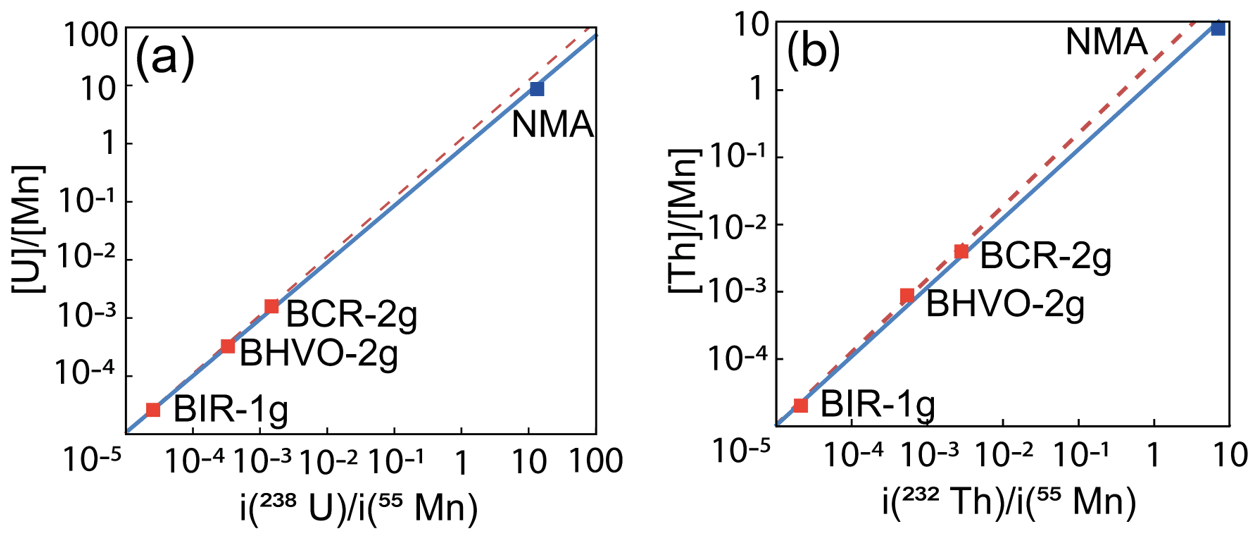
Figure 4Calibration lines used for the calibration of the LA-ICP-MS signal. (a) UMn-calibration lines using silicate glass standards (dotted red line) and NMA nano-magnetite sample (blue line). (b) ThMn calibration lines with silicate glass standards (dotted red line) and NMA nano-magnetite sample (blue line).
4.1 Dispersion of wet chemistry U–Th concentration values
The U and Th concentrations measured for the four magnetite (IF-G, RB, NMA, and NMB) and the aluminous spinel (Al-Spl) samples using wet chemistry show scattered values with different levels of dispersion (Figs. 2 and 3). The dispersion of U and Th concentrations could be linked to various parameters. Among them, we identified (i) the influence of the aliquot sample mass, (ii) an over-dilution of the sample during preparation, leading to U–Th concentrations close to the quantification limit, or (iii) heterogeneity of the U and Th distribution within the sample. Firstly, the possible impact of the aliquot mass on U and Th dispersion has been investigated by comparing the dispersion as a function of the sample mass, as reported in Fig. 5. Although a slight dependency of U and Th concentrations on aliquot mass can be observed for some of the samples, statistically, there is no obvious correlation between U–Th concentrations and aliquot mass.
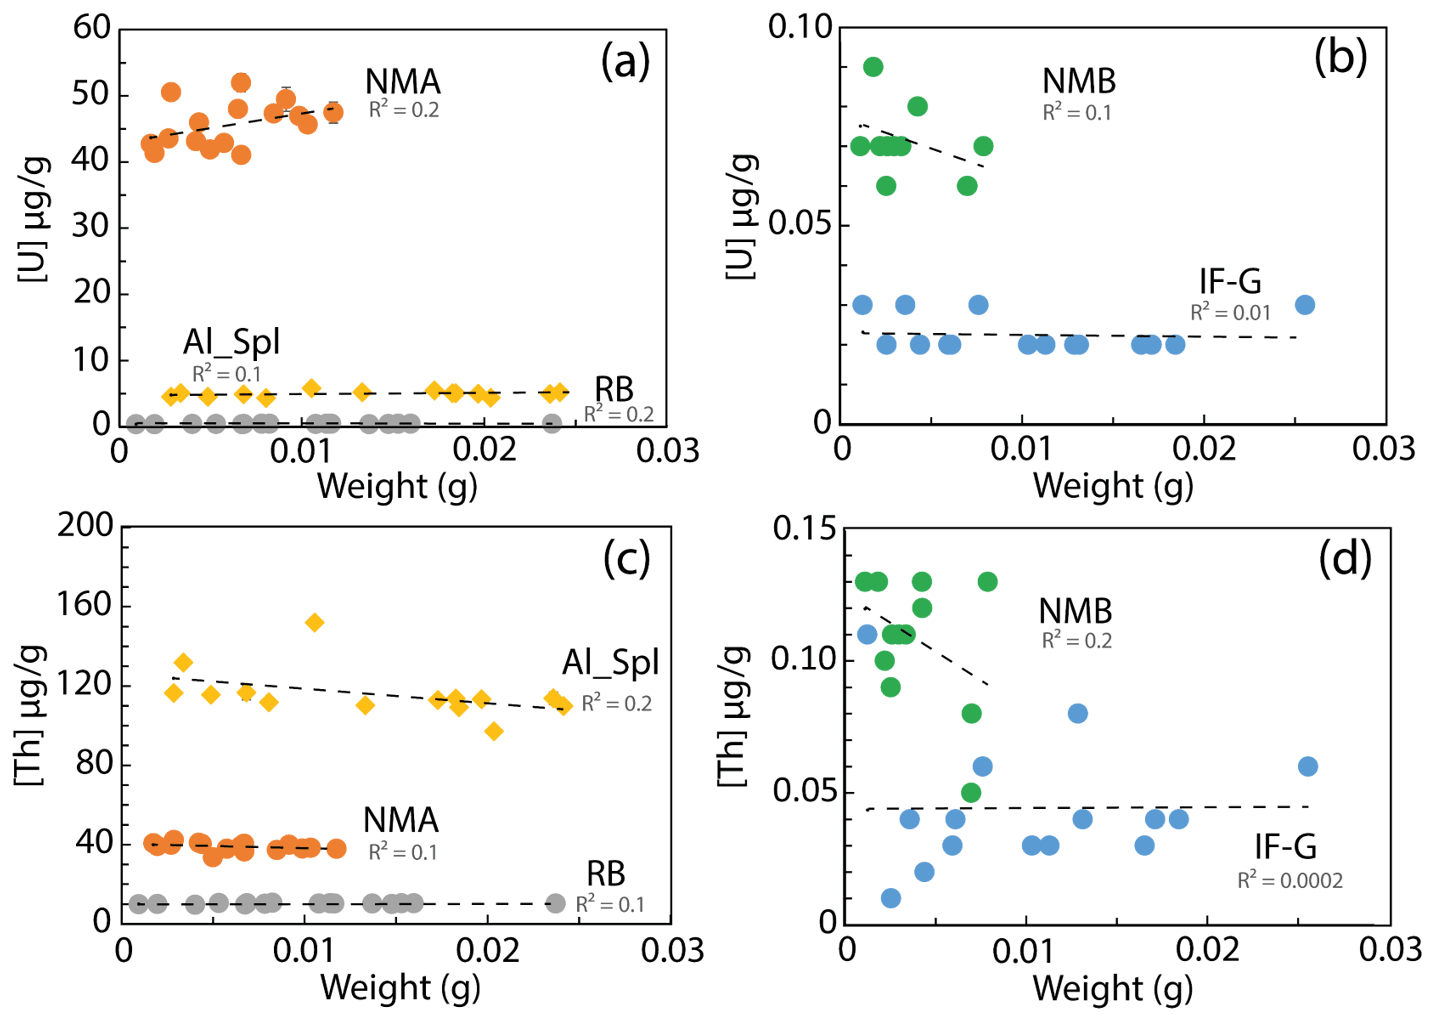
Figure 5U and Th concentration evolution with the mass of the dissolved sample. U concentration for (a) NMA, Al-Spl, and RB samples and (b) NMB and IF-G samples; Th concentration for (c) NMA, Al-Spl and (d) NMB and IF-G samples.
The impact of sample dilution and, thus, the effect of Fe concentration on the ICP-MS plasma were examined. U and Th contents are plotted against the Fe concentration in the analyzed solution on Fig. 6. From one sample to another, the Fe content in the solution varies from 62 to 1240 µg g−1, corresponding to a dilution factor between 400 and 5000. The effect of dilution (iron content) on the U and Th analysis precision, if any, cannot account for the dispersion of U and Th concentration. The dilution was sufficient to prevent matrix effect. Moreover, under the analytical conditions indicated in Sect. 2.4.1., the limit of quantification was estimated to be 0.05 ng g−1. This implies that, for a sample containing 0.1 µg g−1 of U and Th (as for samples IF-G and NMB) and for dilution factors higher than 5000, the signal will be close to the quantification limit. Thus, when measuring magnetite or Al spinel samples with a low concentration of U and Th, even if the dilution has no statistical effect on the dispersion results, the possibility of reaching a concentration below the quantification limit should be questioned.
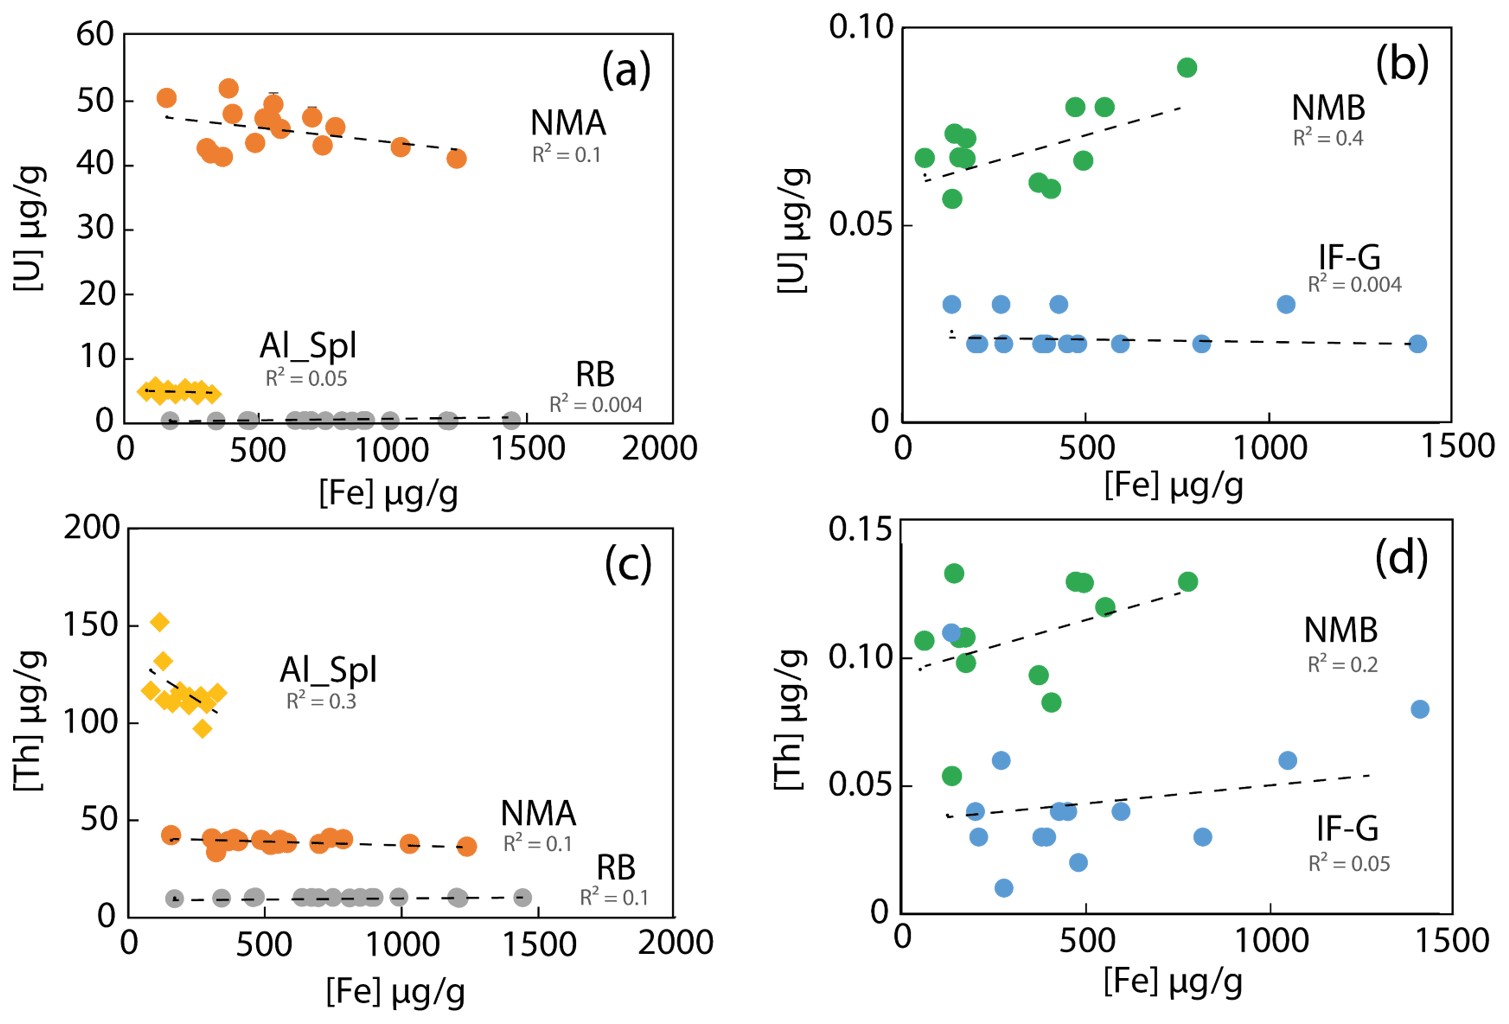
Figure 6U and Th concentrations as a function of iron concentration in the analyzed solution. (a) NMA, Al-Spl, and RB and (b) NMB and IF-G samples. (c) NMA and Al-Spl and (d) NMB and IF-G samples.
Finally, dispersion of U and Th contents could be associated with the chemical heterogeneity of the sample itself. The highest U and Th dispersion is encountered for samples IF-G and NMB, which bear the lowest U and Th contents (<0.07 and 0.11 µg g−1 for U and Th, respectively). Such a high U and Th dispersion for the IF-G sample (20 % and 57 %, respectively) has been already reported in the literature, as shown in Fig. 2, and could be associated with the mineralogical heterogeneity of this sample leading to a nugget effect. Nevertheless, the NMB sample also yielded high dispersion (14 % and 22 % for U and Th, respectively) compared to the NMA sample (7 % and 5 % for U and Th, respectively), even if the two samples have been prepared using exactly the same protocol. The only difference between these samples is the U and Th content. We thus propose that the dispersion of NMB is merely due to concentration effect and the impossibility to measure U and Th content precisely for a low value (<0.1 µg g−1) better than 20 %. Finally, despite the identification by XRD of impurities in the RB powder and in the nano-magnetite samples (NMA), they are the samples for which the U–Th dispersion is the lowest (7 % and 5 % for U and Th, respectively). For RB, grinding revealed to be efficient at homogenizing mineral phases as well as U and Th over the whole powder. For NMA, the low dispersion of U–Th analyses confirms that nano-powders pressed into pellets are suitable for use as reference material and/or standard (Garbe-Schönberg and Müller, 2014).
4.2 Accuracy of in situ laser ablation U and Th data
For magnetite samples, the U and Th concentrations obtained using the laser ablation sampling method depend on the reference samples used for calibration (only glass standards or with NMA in addition as external reference material). For the RB sample, the U and Th concentrations obtained using the silicate glass standards are higher by 30 % (reference deviation, RD =30 %) than the one obtained with the wet chemistry method, as shown on Fig. 7a. However, with the addition of the NMA sample to the calibration as a reference material, the U and Th concentrations show almost identical results (uranium, RD =0 %; thorium, RD =2 %) to the wet chemistry method (U µg g−1 and Th µg g−1, Fig. 7b). For comparison, Dare et al. (2014) obtained a RD ∼15 % for the LA-ICP-MS analyses of various trace elements (0.07 to 88 000 µg g−1) in natural magnetite using silicate glasses (NIST-361, MASS-1, BCR-2g) as standards.

Figure 7Comparison between results obtained by LA-ICP-MS for the two calibrations and by wet chemistry for the RB magnetite sample. (a) Calibration with silicate glasses as mean value and dispersion reported with the orange crosses; (b) calibration with addition of NMA sample with mean value and associated dispersion (blue crosses). U and Th contents obtained using wet chemistry protocol are represented by the black dots.
A cross-calibration by other laboratories will be the next step in certifying the synthetic NMA sample as a standard for U and Th concentrations in magnetite. Furthermore, our synthesis protocol was successful in obtaining nano-magnetite with low U and Th concentrations (NMB: U–Th <0.13 µg g−1). It will be possible to extend the range of U–Th concentrations of the synthetic nano-magnetite material if needed.
Similarly, for the Al-Spl sample, the U and Th concentrations obtained using different standard samples for calibration are plotted in Fig. 8a and b and are compared to the wet chemistry results. NMA addition to the calibration has no significant effect on the obtained U, which actually differs by more than 19 % from the wet chemistry data (4.0±0.5 µg g−1 using laser ablation and 4.9±0.4 µg g−1 using wet chemistry, Fig. 8). The Th concentrations obtained with LA-ICP-MS are systematically lower than the concentration obtained by wet chemistry (116.0±12.6 µg g−1), whatever the set of used standards (79.2±7.7 µg g−1 or 88.8±8.6 µg g−1; Fig. 8). We propose that it is likely due to matrix effects and suggest that, even if magnetite and spinel ss are from the same structural group (spinel), it is necessary to use a standard that is as close as possible in terms of mineral chemistry to avoid systematic biases in the obtained results. However, it must be noted that the precision of U and Th concentration measurement in the Al-Spl sample with LA-ICP-MS is comparable to that achieved with the wet chemistry method. This is very encouraging for the use of LA-ICP-MS for the analysis of the U–Th content of spinel. Provided that appropriate standards are used, it is expected that comparable precision and accuracy can be achieved with the two methods (laser ablation and wet chemistry), keeping in mind that LA-ICP-MS data are much easier to collect in terms of time and cost. The next step is therefore the production of appropriate U and Th Al spinel standard materials.

Figure 8U and Th content obtained by wet chemistry and laser ablation methods. (a) Results obtained with silicate glass standards (orange crosses) and (b) with addition of NMA as standard materials (blue crosses). Wet chemistry data are represented by the black dots.
4.3 Implication for magnetite and spinel (U–Th) He thermochronology
In the literature, MgHe dates dispersion ranges from 13 % to 70 % for crystals containing U and Th below 0.1 µg g−1 (e.g., Cooperdock and Stockli 2016, Schwartz et al., 2020; Cooperdock et al., 2020) and is less than 5 % for magnetite containing U and Th above 0.1 µg g−1 (Blackburn et al., 2007). Such dispersion includes the analytical errors on the He, U, Th, and Sm measurement. Interestingly, the highest dates dispersion determined on natural magnetite with low U–Th content (<0.1 µg g−1) is higher than the analytical one that can be estimated with the results of this study. For spinel, only one study exists with SpHe date dispersion of <9 % (Cooperdock and Stockli, 2018). Indeed, dispersion of (U–Th) He dates includes the analytical errors on He, U, and Th concentrations. If the amount of 4He is sufficient for a proper analysis with a noble gas mass spectrometer, the analytical error is <2 % (e.g., Gautheron et al., 2021). In this study, we can estimate a dispersion on the MgHe date of ∼24 % for crystals containing U and Th <0.1 µg g−1 and of 4 % to 10 % for crystals with U and Th content >0.4 µg g−1. We simply propagate the error with a <2 % for the He measurement and dispersion on U and Th content, knowing that they contribute at a different level to the He budget, where U and Th could be combined with the effective uranium (eU) content, with eU = U Th Sm (Cooperdock et al., 2019). The dispersion estimated here for MgHe ages, which is based on the analytical errors, is consistent with published dispersions associated with MgHe dating (Cooperdock and Stockli, 2016; Schwartz et al., 2020; Cooperdock et al., 2020). For Al spinel, we do not have enough samples to give a statistical estimate, but a minimum error of 10 % on the SpHe date for the determination of U and Th content >5 µg g−1 is anticipated, which is commensurable to the uncertainties of spinel ages obtained by Cooperdock and Stockli (2018).
This study confirms that the error on the MgHe and SpHe ages are, for the most part, due to the difficulty of measuring U and Th concentrations lower than 0.01 µg g−1. However, some published MgHe and SpHe data show an age dispersion that is higher than expected compared to the present study, which could be associated with alpha implantation from neighbor minerals, mineral inclusions (Schwartz et al., 2020; Hofmann et al., 2021), U–Th zoning, secondary growth of younger magnetite, or different He diffusion behavior. This study could not include the effect of heterogeneity due to U or Th mineral zonation, which were erased upon grinding of the samples. However, grinding samples is not best suited to (U–Th) He geochronology on oxide crystal grain because of possible loss of material during the crushing. Cooperdock and Stockli (2016) proposed a protocol to avoid the impact of alpha implantation from neighbor minerals and mineral inclusions by means of removing the outer crystal shell. Bassal et al. (2022) showed that He diffusion in magnetite is strongly affected by radiation damage induced by U and Th decay, with typical closure temperatures ranging from 200 to 280 ∘C, depending on the damage dose and crystal size. As the U and Th content in magnetite crystals from the same geological case present similar values, poor MgHe date dispersion (<10 %) associated with He diffusion changes is expected (Bassal et al., 2022). For spinel, no quantitative He diffusion coefficient is available, limiting the interpretation of the origin of SpHe age dispersion.
In this study, the successful use of LA-ICP-MS with well-suited standards (NMA) opens the possibility of directly accessing the U and Th distribution across the whole grain for magnetite and spinel. As He content is determined on the bulk grain, if preliminary LA-ICP-MS data show that U and Th are homogeneously distributed within a magnetite grain, then the MgHe will be estimated with dispersion at 20 % if the U and Th content >0.4 µg g−1. More generally, in situ determination of U and Th in magnetite or spinel crystals would allow one to address the impact of U–Th zoning or secondary growing of hydrothermal magnetite. Finally, compared to wet chemistry methods, acquisition of precise (U–Th) He dates by LA-ICP-MS may prove to be easier and more time efficient, provided that certified and appropriate U–Th standard of magnetite and spinel are used.
U and Th concentrations ranging from 0.02 to 116 µg g−1 have been determined in natural magnetite, synthetic U–Th-doped magnetite and natural aluminous spinel for the purpose of (U–Th) He thermochronology. This analytical investigation was based on the comparison of wet chemistry and in situ laser ablation sampling methods, considering their respective advantages and drawbacks. Firstly, we demonstrated that the highest U–Th dispersion is found for the samples with the lowest concentrations. This high dispersion shows the difficulty of measuring with HR-ICP-MS to better than 20 % U and Th concentrations below 0.1 µg g−1. This implies that magnetite and spinel (U–Th) He thermochronological dating will yield data dispersion ranging from a few percents for U- and/or Th-rich (>0.4 µg g−1) crystals and up to 20 % for U–Th-poor (<0.1 µg g−1) crystals. Moreover, this study highlights the importance of having new, suitable magnetite and spinel reference material to be confident in terms of the analysis of U and Th in oxides in wet chemistry and new external standards to ensure accurate analysis of U in situ laser-ablation sampling. We show that the synthesis of minerals containing U and Th in controlled concentrations can be a way to produce homogeneous and suitable standards for wet chemistry and in situ analyses.
The use of LA-ICP-MS with synthetic minerals is a promising tool for the acquisition of precise (U–Th) He dates. Indeed, it allows for the investigation of the distribution of U and Th within a given crystal and the evidencing of possible growth zones. However, dating where U and Th concentration is determined by LA-ICP-MS remains limited by the fact that He is measured on the whole grain or even on multiple grains. Those data can thus be used for dating only if the U–Th distribution is homogeneous in the studied crystals. The synthesis and characterization of U–Th-doped spinel standards is obviously a perspective of this work to enable access of reliable U and Th measurements by wet chemistry and/or laser ablation methods.
Synthetic nano-magnetite NMA and NMB samples are enriched by U–Th in the desired concentration range, as predicted by our theoretical calculations. The synthesis protocol is presented in Sect. 2.1.2. The absence of U and Th in the remaining solutions was verified by analyzing these solutions with HR-ICP-MS at IUEM laboratory to ensure that all U and Th are incorporated into the nano-magnetite. In addition, two experiments were done with (i) a desorption experiment to quantify the amount of U and Th sorbed on the surface, and (ii) a pH steps dissolution experiment to calculate how much U–Th are sorbed on the surface or incorporated in the structure of the nano-magnetite. These two experiments allow one to understand where U and Th are placed: sorbed at the surface or present in the structure of the nano-magnetite.
A1 Desorption of U–Th experiments
A first set of U–Th desorption experiments was performed on the NMA sample. In a first step, U and Th are desorbed and kept in a solution. In a second step, U–Th in the solution are complexed in order to measure the complexes that are UV visible. In detail, according to Stopa and Yamaura (2010), U desorption can be achieved using Na2CO3, and Th can be desorbed using EDTA (Hunter et al., 1988). Two aliquots of NMA (180 mg each) were therefore dipped in, respectively, 2 mL of 1.1 g L−1 Na2CO3 solution and 2 mL of 2.10−4 mol L−1 EDTA solution for 40 min, with shaking. Samples with U and Th in the solution were subsequently centrifuged at 13.4 rpm for 15 min. Then, the concentrations of uranium or thorium in each supernatant were determined by complexing the U and Th by the Arsenazo III method at 650 nm using a UV-Vis spectrophotometer with a detection limit measured at 0.1 µg L−1 (Yamaura et al., 2002).
The UV-vis result did not detect U-Arsenazo and Th-Arsenazo complexes. According to this experiment, there are no U and Th sorbed on the surface of nano-magnetites. The U and Th seem to be incorporated in the structure of nanoparticles.
A2 Dissolution of U-enriched nano-magnetites during pH changes
A different experiment was set up to verify the results obtained by the complexation method (Sect. A1). This time, about two grams of nano-magnetite enriched with only 50 µg g−1 of U were synthesized. After the rinsing step with oxygen-free MilliQ water, the U-doped magnetite was immediately suspended in a reactor containing 300 mL of 0.001 mol L−1 NaCl solution, previously deoxygenated for 30 min and kept under N2 bubbling. The suspension was then subjected to decreasing pH steps (8.5, 5.5, 4, 3, 2.3, 1.2, and 1) by the addition of 0.1 and 1.5 mol L−1 HCl. At each step, the pH was kept constant for 3 h by automatic addition of HCl using a Titrino Metrohm 716 DMS instrument running Tiamo software. At the end of each pH step, the suspension was sampled and centrifuged, and the supernatant was filtered at 0.20 µm. The Fe and U contents of the different pH solutions were analyzed by ICP-MS at the Institut de Physique du Globe (France). This allows one to follow the dissolution of uranium and iron according to the pH.
The expected pH of U sorption and desorption was modeled using PHREEQC version 3 (Parkhurst and Appelo, 2013), using the surface complexation model of Missana et al. (2003) for a specific surface area approximated at 100 m2 g−1. This pH, according to this model, is >4. If U is sorbed on the magnetite surface, solutions of pH 8.5 to 4 are expected to contain U. On the other hand, the expected pH of a magnetite dissolution is less than 4. Thus, if U is contained in the magnetite structure, solutions at pH 4 to 1 are expected to contain U. Based on the distribution of U in the solutions for each pH step, we can know the content of sorbed U and the content of U that is in the structure. According to our results, in solutions with pH >5, there is no U in the solutions. In solutions with pH 5.5 and 4, there is 5 % U and 2 % Fe. From pH 3 to 1.2, there is 40 % U and 20 % Fe in the solution, and at pH 1, 55 % U and 75 % Fe are in solution. Thus, there is 5 % of U sorbed on the surface of the nano-magnetite. The majority (95 %) of the U is incorporated in the structure of the nano-magnetite. We assume that Th behaves in a similar way.
All data we discuss are presented in the tables in this main article.
The supplement related to this article is available online at: https://doi.org/10.5194/gchron-4-665-2022-supplement.
MC collected and processed data, made figures, and contributed to the writing of the paper. SS, FB, AA, and CG initiated the study, processed data, and contributed to the writing of the paper. ML contributed to the synthetizing the mineral process and contributed to the writing of the paper.
At least one of the (co-)authors is a member of the editorial board of Geochronology. The peer-review process was guided by an independent editor, and the authors also have no other competing interests to declare.
Publisher's note: Copernicus Publications remains neutral with regard to jurisdictional claims in published maps and institutional affiliations.
We thank Marie-Laure Rouget for helping in the calibrations of the ICP-MS and the LA-ICP-MS of IUEM. Rosella Pinna-Jamme (GEOPS) and Pierre Burkel (IPGP) are thanked for their help in the measurements of the U and Th content analysis of NMA. We thank Nathaniel Findling for helping in the characterization of our samples (SEM, XRD). We thank Bruno Lanson for his help in the interpretation of one of the XRD diffractograms. The associate editor (Daniela Rubatto) and reviewers (Emilie Cooperdock and Florian Hofmann) are warmly thanked for their constructive comments and reviews.
This research has been supported by the Direction de l'Industrie, des Mines et de l'Environnement de Nouvelle Calédonie (DIMENC, grant no. 19-A03/DAT-AM/IST/CE).
This paper was edited by Daniela Rubatto and reviewed by Florian Hofmann and Emily Cooperdock.
Bassal, F., Roques J., Corre, M., Brunet, F., Ketcham, R., Schwartz, S., Tassan-Got, L., and Gautheron, C.: Role of defects and radiation damage on He diffusion in magnetite: implication for (U–Th) He thermochronology, Minerals, 12, 590, https://doi.org/10.3390/min12050590, 2022.
Blackburn, T. J., Stockli, D. F., and Walker, J. D.: Magnetite (U–Th) He dating and its application to the geochronology of intermediate to mafic volcanic rocks, Earth Planet. Sci. Lett., 259, 360–371, https://doi.org/10.1016/j.epsl.2007.04.044, 2007.
Bolhar, R., Kamber, B. S., Moorbath, S., Fedo, C. M., and Whitehouse, M. J.: Characterisation of early Archaean chemical sediments by trace element signatures, Earth Planet. Sci. Lett., 222, 43–60, https://doi.org/10.1016/j.epsl.2004.02.016, 2004.
Bolhar, R., Hofmann, A., Siahi, M., Feng, Y., and Delvigne, C.: A trace element and Pb isotopic investigation into the provenance and deposition of stromatolitic carbonates, ironstones and associated shales of the ∼3.0 Ga Pongola Supergroup, Kaapvaal Craton, Geochim. Cosmochim. Acta, 158, 57–78, https://doi.org/10.1016/j.gca.2015.02.026, 2015.
Colás, V., González-Jiménez, J. M., Griffin, W. L., Fanlo, I., Gervilla, F., O'Reilly, S., Pearson, N. J., Kerestedjian, T., and Proenza, J. A.: Fingerprints of metamorphism in chromite: New insights from minor and trace elements, Chem. Geol., 389, 137–152, https://doi.org/10.1016/j.chemgeo.2014.10.001, 2014.
Cooperdock, E. H. G. and Ault, A. K.: Iron Oxide (U–Th) He Thermochronology: New Perspectives on Faults, Fluids, and Heat, Elements, 16, 319–324, https://doi.org/10.2138/gselements.16.5.319, 2020.
Cooperdock, E. H. G. and Stockli, D. F.: Unraveling alteration histories in serpentinites and associated ultramafic rocks with magnetite (U–Th) He geochronology, Geology, 44, 967–970, https://doi.org/10.1130/G38587.1, 2016.
Cooperdock, E. H. G. and Stockli, D. F.: Dating exhumed peridotite with spinel (U–Th) He chronometry, Earth Planet. Sci. Lett., 489, 219–227, https://doi.org/10.1016/j.epsl.2018.02.041, 2018.
Cooperdock, E. H. G., Ketcham, R. A., and Stockli, D. F.: Resolving the effects of 2-D versus 3-D grain measurements on apatite (U–Th) He age data and reproducibility, Geochronology, 1, 17–41, https://doi.org/10.5194/gchron-1-17-2019, 2019.
Cooperdock, E. H. G., Stockli, D. F., Kelemen, P. B., and Obeso, J. C.: Timing of Magnetite Growth Associated With Peridotite-Hosted Carbonate Veins in the SE Samail Ophiolite, Wadi Fins, Oman, J. Geophys. Res.-Solid Ea., 125, e2019JB018632, https://doi.org/10.1029/2019JB018632, 2020.
Costa, M. M., Jensen, N. K., Bouvier, L. C., Connelly, J. N., Mikouchi, T., Horstwood, M. S. A., Suuronen, J. P., Moynier, F., Deng, Z., Agranier, A., Martin, L. A. J., Johnson, T. E., Nemchinh, A. A., and Bizzarro, M.:.The internal structure and geodynamics of Mars inferred from a 4.2-Gyr zircon record, P. Natl. Acad. Sci. USA, 117, 30973–30979, https://doi.org/10.1073/pnas.2016326117, 2020.
Dare, S. A. S., Barnes, S.-J., Beaudoin, G., Méric, J., Boutroy, E., and Potvin-Doucet, C.: Trace elements in magnetite as petrogenetic indicators, Miner. Deposita, 49, 785–796, https://doi.org/10.1007/s00126-014-0529-0, 2014
Douville, E., Sallé, E., Frank, N., Eisele, M., Pons-Branchu, E., and Ayrault, S.: Rapid and accurate U–Th dating of ancient carbonates using inductively coupled plasma-quadrupole mass spectrometry, Chem. Geol., 272, 1–11, https://doi.org/10.1016/j.chemgeo.2010.01.007, 2010.
Dulski, P.: Reference Materials for Geochemical Studies: New Analytical Data by ICP-MS and Critical Discussion of Reference Values, Geostand. Geoanalytical Res., 25, 87–125, https://doi.org/10.1111/j.1751-908X.2001.tb00790.x, 2001.
Gao, S., Liu, X., Yuan, H., Hattendorf, B., Günther, D., Chen, L., and Hu, S.: Determination of Forty Two Major and Trace Elements in USGS and NIST SRM Glasses by Laser Ablation-Inductively Coupled Plasma-Mass Spectrometry, Geostandard. Newslett., 26, 181–196, https://doi.org/10.1111/j.1751-908X.2002.tb00886.x, 2002.
Garbe-Schönberg, D. and Müller, S.: Nano-particulate pressed powder tablets for LA-ICP-MS, J. Anal. Atom. Spectrom., 29, 990–1000, https://doi.org/10.1039/C4JA00007B, 2014.
Gautheron, C. and Zeitler, P. K.: Noble Gases Deliver Cool Dates from Hot Rocks, Elements, 16, 303–309, https://doi.org/10.2138/gselements.16.5.303, 2020.
Gautheron, C., Pinna-Jamme, R., Derycke, A., Ahadi, F., Sanchez, C., Haurine, F., Monvoisin, G., Barbosa, D., Delpech, G., Maltese, J., Sarda, P., and Tassan-Got, L.: Technical note: Analytical protocols and performance for apatite and zircon (U–Th) He analysis on quadrupole and magnetic sector mass spectrometer systems between 2007 and 2020, Geochronology, 3, 351–370, https://doi.org/10.5194/gchron-3-351-2021, 2021.
Gautheron, C., Hueck, M., Ternois, S., Heller, B., Schwartz, S., Sarda, P. and Tassan-Got, L.: Investigating the Shallow to Mid-Depth (>100–300 ∘C) Continental Crust Evolution with (U–Th) He Thermochronology: A Review, Minerals 12, 563, https://doi.org/10.3390/min12050563, 2022.
Govindaraju, K.: UPDATE (1984–1995) On Two Git – Iwg Geochemical Reference Samples: Albite From Italy, Al-I and iron formation sample from Greenland, IF-G, Geostand. Geoanalytical Res., 19, 55–96, https://doi.org/10.1111/j.1751-908X.1995.tb00152.x, 1995.
Guilmette, C., Hébert, R., Wang, C., and Villeneuve, M.: Geochemistry and geochronology of the metamorphic sole underlying the Xigaze Ophiolite, Yarlung Zangbo Suture Zone, South Tibet, Lithos, 112, 149–162, https://doi.org/10.1016/j.lithos.2009.05.027, 2009.
Hofmann, F., Cooperdock, E. H. G., West, A. J., Hildebrandt, D., Strößner, K., and Farley, K. A.: Exposure dating of detrital magnetite using 3He enabled by microCT and calibration of the cosmogenic 3He production rate in magnetite, Geochronology, 3, 395–414, https://doi.org/10.5194/gchron-3-395-2021, 2021.
Hunter, K. A., Hawke, D. J., and Lee, K. C.: Equilibrium adsorption of thorium by metal oxides in marine electrolytes, Geochim. Cosmochim. Acta, 52, 627–636, https://doi.org/10.1016/0016-7037(88)90324-9, 1988.
Inglis, E. C., Creech, J. B., Deng, Z., and Moynier, F.: High-precision zirconium stable isotope measurements of geological reference materials as measured by double-spike MC-ICPMS, Chem. Geol., 493, 544–552, https://doi.org/10.1016/j.chemgeo.2018.07.007, 2018.
Ilyinichna, O. O., Michailovich, L. S., Sergeevich, D. A., and Gennadievna, E. K.: An investigation of trace elements' behavior during chemical preparation of ultramafic matrix rock samples using bomb digestion for analysis by ICP-MS, J. Anal. Atom. Spectrom., 35, 2627, https://doi.org/10.1039/D0JA00255K, 2020.
Kamber, B. S., Bolhar, R., and Webb, G. E.: Geochemistry of late Archaean stromatolites from Zimbabwe: evidence for microbial life in restricted epicontinental seas, Precambrian Res., 132, 379–399, https://doi.org/10.1016/j.precamres.2004.03.006, 2004.
Koch, J., Feldmann, I., Jakubowski, N., and Niemax, K.: Elemental composition of laser ablation aerosol particles deposited in the transport tube to an ICP, Spectrochim. Acta B, 57, 975–985, https://doi.org/10.1016/S0584-8547(02)00021-6, 2002.
Kubik, E., Siebert, J., Blanchard, I., Agranier, A., Mahan, B., and Moynier, F.: Earth's volatile accretion as told by Cd, Bi, Sb and Tl core–mantle distribution, Geochim. Cosmochim. Acta, 306, 263–280, https://doi.org/10.1016/j.gca.2021.02.017, 2021.
Locmelis, M., Pearson, N. J., Barnes, S. J., and Fiorentini, M. L.: Ruthenium in komatiitic chromite, Geochimi. Cosmochim. Acta, 75, 3645–3661, https://doi.org/10.1016/j.gca.2011.03.041, 2011.
Li, Z.-X. A. and Lee, C. T. A.: Geochemical investigation of serpentinized oceanic lithospheric mantle in the Feather River Ophiolite, California: Implications for the recycling rate of water by subduction, Chem. Geol., 235, 161–185, https://doi.org/10.1016/j.chemgeo.2006.06.011, 2006.
Martínez-Mera, I., Espinosa-Pesqueira, M. E., Pérez-Hernández, R., and Arenas-Alatorre, J.: Synthesis of magnetite (Fe3O4) nanoparticles without surfactants at room temperature, Mater. Lett., 61, 4447–4451, https://doi.org/10.1016/j.matlet.2007.02.018, 2007.
Missana, T., Maffiotte, C., and Garcıìa-Gutiérrez, M.: Surface reactions kinetics between nanocrystalline magnetite and uranyl, J. Colloid Interface Sci., 261, 154–160, https://doi.org/10.1016/S0021-9797(02)00227-8, 2003.
Parkhurst, D. L. and Appelo, C. A. J.: Description of Input and Examples for PHREEQC Version 3 – A Computer Program for Speciation, Batch-Reaction, One-Dimensional Transport, and Inverse Geochemical Calculations, US Geological Survey, book 6, chap. A43, 497 pp., https://pubs.usgs.gov/tm/06/a43/ (last access: 10 March 2021), 2013.
Parks, J., Lin, S., Davis, D. W., Yang, X.-M., Creaser, R. A., and Corkery, M. T.: Meso- and Neoarchean evolution of the Island Lake greenstone belt and the northwestern Superior Province: Evidence from lithogeochemistry, Nd isotope data, and U–Pb zircon geochronology, Precambrian Res., 246, 160–179, https://doi.org/10.1016/j.precamres.2014.02.016, 2014.
Potin, S., Beck, P., Bonal, L., Schmitt, B., Garenne, A., Moynier, F., Agranier, A., Schmitt-Kopplin P., Malik, A. K., and Quirico, E.: Mineralogy, chemistry, and composition of organic compounds in the fresh carbonaceous chondrite Mukundpura: CM1 or CM2?, Meteorit. Planet. Sci., 55, 1681–1696, https://doi.org/10.1111/maps.13540, 2020.
Schwartz, S., Gautheron C., Ketcham R. A., Brunet F., Corre M., Agranier A., Pinna-Jamme R., Haurine F., Guéguen B., Monvoin G., and Riel N.: Unraveling the exhumation history of high-pressure ophiolites using magnetite (U–Th–Sm) He thermochronometry, Earth Planet. Sci. Lett., 543, 116359, https://doi.org/10.1016/j.epsl.2020.116359, 2020.
Steenstra, E. S., Berndt, J., Klemme, S., and van Westrenen, W.: LA-ICP-MS analyses of Fe-rich alloys: quantification of matrix effects for 193 nm excimer laser systems, J. Anal. At. Spectrom., 34, 222–231, https://doi.org/10.1039/C8JA00291F, 2019.
Stopa, L. C. B. and Yamaura, M.: Uranium removal by chitosan impregnated with magnetite nanoparticles: adsorption and desorption, Int. J. Nuclear Energy Science and Technology, 5, 283, https://doi.org/10.1504/IJNEST.2010.035538, 2010.
Tricart, P. and Schwartz, S.: A north-south section across the Queyras Schistes lustrés (Piedmont zone, Western Alps): Syn-collision refolding of a subduction wedge, Eclogae Geol. Helv., 99, 429–442, https://doi.org/10.1007/s00015-006-1197-6, 2006.
Van Kooten, E. M. M. E., Moynier, F., and Agranier, A.: A unifying model for the accretion of chondrules and matrix, P. Natl. Acad. Sci. USA, 116, 18860–18866, https://doi.org/10.1073/pnas.1907592116, 2019.
Viehmann, S., Bau, M., Bühn, B., Dantas, E. L., Andrade, F. R. D., and Walde, D. H. G.: Geochemical characterisation of Neoproterozoic marine habitats: Evidence from trace elements and Nd isotopes in the Urucum iron and manganese formations, Brazil, Precambrian Res., 282, 74–96, https://doi.org/10.1016/j.precamres.2016.07.006, 2016.
Yamaura, M., Wada, L. Y., and Ribeiro, F. C.: Spectrophotometric determination of uranium (VI) with arsenazo III in a nitric medium; Determinacao espectrofotometrica de uranio (VI) com arsenazo III, em meio nitrico, Associacao Brasileira de Energia Nuclear, Rio de Janeiro, RJ, Brazil, 5 pp., 2002.
The requested paper has a corresponding corrigendum published. Please read the corrigendum first before downloading the article.
- Article
(3138 KB) - Full-text XML
- Corrigendum
-
Supplement
(583 KB) - BibTeX
- EndNote