the Creative Commons Attribution 4.0 License.
the Creative Commons Attribution 4.0 License.
 | 19 Jan 2024
Modeling apparent Pb loss in zircon U–Pb geochronology
Matthew A. Malkowski
The loss of radiogenic Pb from zircon is known to be a major factor that can cause inaccuracy in the U–Pb geochronological system; hence, there is a need to better characterize the distribution of Pb loss in natural samples. Treatment of zircon by chemical abrasion (CA) has become standard practice in isotope dilution–thermal ionization mass spectrometry (ID-TIMS), but CA is much less commonly employed prior to in situ analysis via laser ablation–inductively coupled plasma–mass spectrometry (LA-ICP-MS) or secondary ionization mass spectrometry (SIMS). Differentiating the effects of low levels of Pb loss in Phanerozoic zircon with relatively low-precision in situ U–Pb dates, where the degree of Pb loss is insufficient to cause discernible discordance, is challenging. We show that U–Pb isotopic ratios that have been perturbed by Pb loss may be modeled by convolving a Gaussian distribution that represents random variations from the true isotopic value stemming from analytical uncertainty with a distribution that characterizes Pb loss. We apply this mathematical framework to model the distribution of apparent Pb loss in 10 igneous samples that have both non-CA LA-ICP-MS or SIMS U–Pb dates and an estimate of the crystallization age, either through CA U–Pb or geochronology. All but one sample showed negative age offsets that were unlikely to have been drawn from an unperturbed U–Pb date distribution. Modeling apparent Pb loss using the logit–normal distribution produced good fits with all 10 samples and showed two contrasting patterns in apparent Pb loss; samples where most zircon U–Pb dates undergo a bulk shift and samples where most zircon U–Pb dates exhibited a low age offset but fewer dates had more significant offset. Our modeling framework allows comparison of relative degrees of apparent Pb loss between samples of different age, with the first and second Wasserstein distances providing useful estimates of the total magnitude of apparent Pb loss. Given that the large majority of in situ U–Pb dates are acquired without the CA treatment, this study highlights a pressing need for improved characterization of apparent Pb-loss distributions in natural samples to aid in interpreting non-CA in situ U–Pb data and to guide future data collection strategies.
- Article
(5116 KB) - Full-text XML
- BibTeX
- EndNote


Zircon U–Pb geochronology is arguably one of the most important radiometric dating approaches used by geoscientists, with widespread application to constraining the age of Pleistocene and older geologic materials (Davis et al., 2003; Schoene, 2013; Gehrels, 2014). We rely on zircon U–Pb dates for calibrating the geological timescale (e.g., Compston, 2000a, b; Bowring and Schmitz, 2003; Gradstein et al., 2004; Kaufmann, 2006), constraining the timing of important Earth history events (Froude et al., 1983; Burgess et al., 2014), and determining the rates of Earth processes (Rioux et al., 2012; Johnstone et al., 2019). The zircon U–Pb geochronometer is particularly powerful due to the ability to assess agreement between the 238U → 206Pb and 235U → 207Pb decay chains, with and dates in agreement plotting on the concordia line, where ∗ indicates radiogenic Pb (Wetherill, 1956).
The causes and complications of open-system behavior (e.g., radiogenic Pb loss) in zircon have long been a topic of study (Tilton et al., 1955; Pidgeon et al., 1966). Although Pb-loss events may be discerned on U–Pb concordia diagrams in some circumstances and can provide useful geologic information about the thermal and/or fluid flow history of a region (Silver and Deutsch, 1963; Blackburn et al., 2011; Morris et al., 2015; Kirkland et al., 2017), recognizing that Pb loss remains a challenge when it occurs within several hundreds of millions of years of crystallization (Fig. 1; Andersen et al., 2019). For example, due to the shape of the versus concordia line, Pb loss in Phanerozoic zircon results in a “sliding along concordia” effect that can make Pb loss difficult to discern, particularly in relatively low-precision in situ (i.e., LA-ICP-MS or SIMS) datasets when the Pb loss produces concordant or only modestly discordant analyses (e.g., <10 %; Ashwal et al., 1999; Bowring and Schmitz, 2003; Ireland and Williams, 2003; Reimink et al., 2016; Spencer et al., 2016; Watts et al., 2016; Andersen et al., 2019). Such low levels of Pb loss have been termed “cryptic” and may be associated with spatial heterogeneities, including radiation-damaged U-rich zones and microstructures (Nasdala et al., 2005; Kryza et al., 2012; Watts et al., 2016). Although there are many potential causes of Pb loss in zircon, open-system behavior is often associated with elevated α-dose and associated metamictization (Silver and Deutsch, 1963; Pidgeon et al., 1966; Mezger and Krogstad, 1997; Cherniak and Watson, 2001; Marsellos and Garver, 2010). Mechanisms for Pb loss include recrystallization of metamict zircon during metamorphism (Kröner et al., 1994; Mezger and Krogstad, 1997; Orejana et al., 2015; Zeh et al., 2016) and leaching of Pb from metamict zones by hydrothermal or diagenetic fluids (Geisler et al., 2002, 2003; Willner et al., 2003; Morris et al., 2015; Kirkland et al., 2020) or during chemical weathering (Stern et al., 1966; Black, 1987; Balan et al., 2001; Pidgeon et al., 2017; Andersen and Elburg, 2022). Pb loss is thought to primarily occur at temperatures <250 ∘C in which radiation damage in zircon is unable to be annealed over geologic timescales (Schoene, 2013).
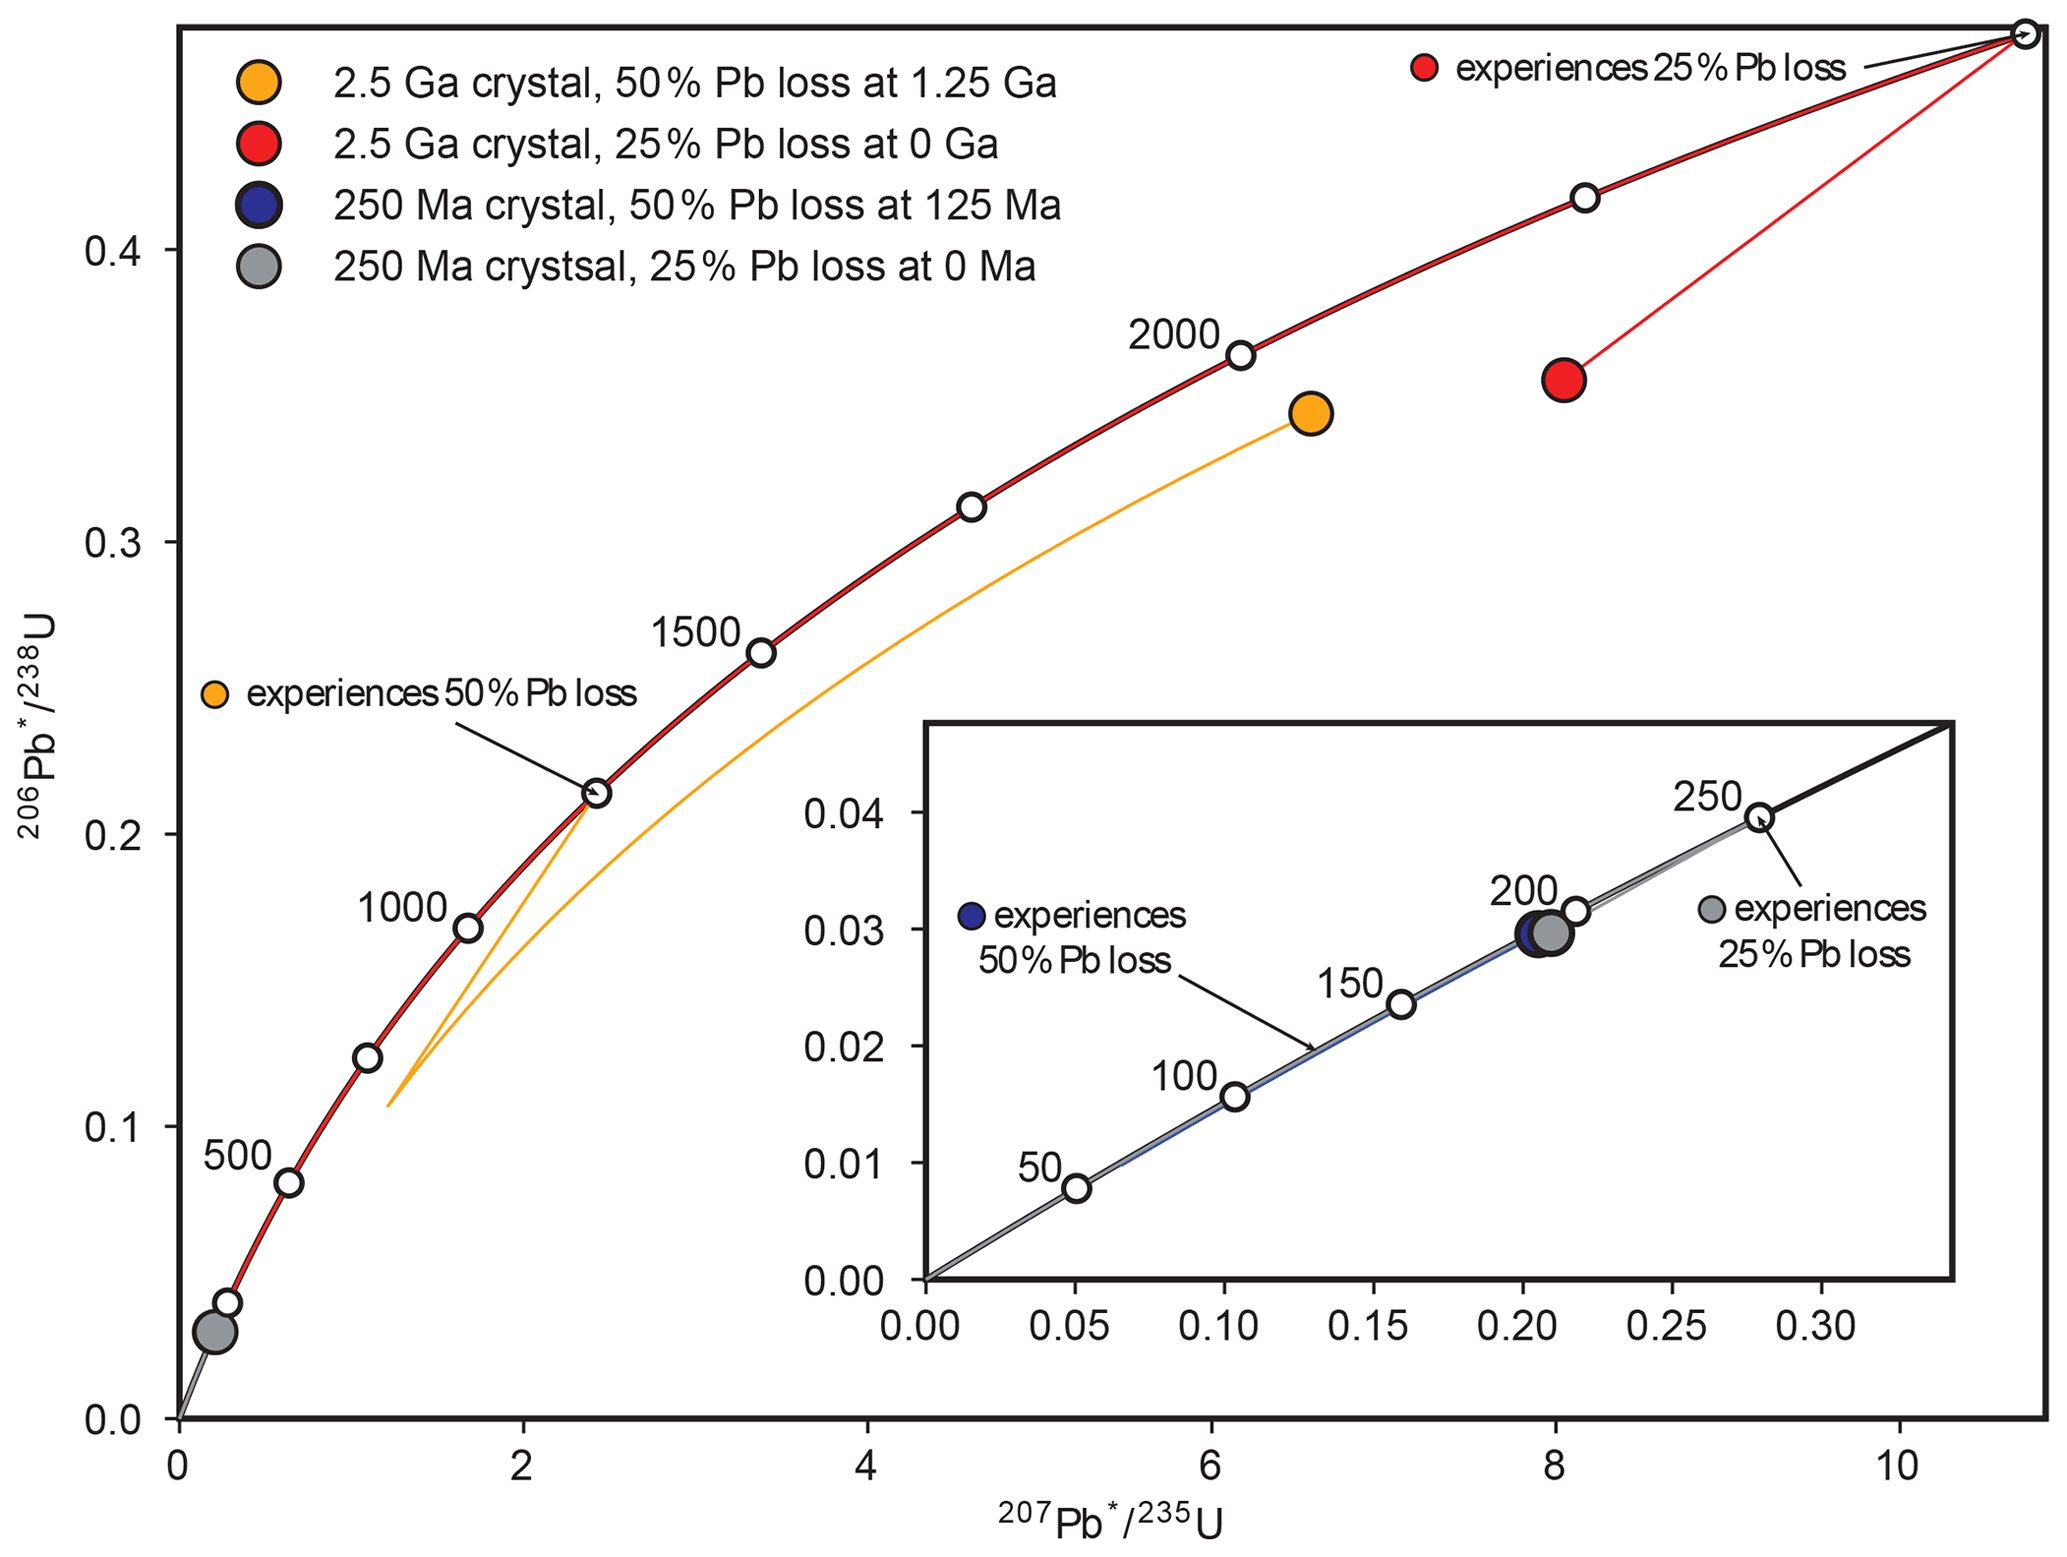
Figure 1Illustration of the influence of Pb loss on 250 Ma and 2.5 Ga zircon. Two Pb-loss scenarios are shown, with 25 % loss at half the age of the zircon and 50 % loss at present day (0 Ma). The approximately linear nature of the vs. concordia line near the origin results in Pb loss producing limited discordance if the Pb loss occurs within several hundreds of millions of years of crystallization. Note that a greater amount of ancient Pb loss is required to produce the same shift in relative to recent Pb loss. Thin, colored lines represent the path of each zircon.
Zircon domains that have lost Pb may be preferentially removed by first thermally annealing the zircon at high temperature (e.g., 800–1100 ∘C) and then partially dissolving the zircon in a heated hydrofluoric acid (HF) solution in a technique called chemical abrasion (CA) (Mattinson, 2005). The CA treatment is now routinely applied in isotope dilution–thermal ionization mass spectrometry (ID-TIMS) analysis and has contributed to both the improved precision and accuracy of CA-ID-TIMS U–Pb data (Schoene, 2013). Although some in situ U–Pb laboratories practice thermal annealing routinely (e.g., Allen and Campbell, 2012; Solari et al., 2015), CA has been applied much less frequently (Crowley et al., 2014; von Quadt et al., 2014; Watts et al., 2016; Ver Hoeve et al., 2018; Ruiz et al., 2022). Several studies that have conducted paired analysis of non-CA and CA of the same samples via in situ U–Pb geochronology have found the non-CA U–Pb dates to skew younger than the CA U–Pb dates (Crowley et al., 2014; von Quadt et al., 2014; Watts et al., 2016). A growing number of maximum depositional age studies with tandem non-CA laser ablation–inductively coupled plasma–mass spectrometry (LA-ICP-MS) and CA-ID-TIMS dating have shown that the youngest non-CA U–Pb dates tend to be younger than expected relative to CA U–Pb dates or other geologic constraints, even when considering measurement uncertainty (e.g., Herriott et al., 2019; Schwartz et al., 2022; Howard et al., 2022; Sharman et al., 2023). However, there is a lack of quantitative constraints on the relative importance of Pb loss in influencing non-CA U–Pb date distributions acquired via in situ mass spectrometry, particularly as related to influencing depositional age constraints (Copeland, 2020).
This study builds upon past research on open-system behavior in zircon by presenting a mathematical framework for characterizing the distribution of apparent Pb loss on untreated (i.e., non-CA) U–Pb date distributions. We first suggest that U–Pb isotopic ratios that have been perturbed by Pb loss may be viewed as the convolution of two signals: a Gaussian distribution that reflects the measurement uncertainty about the true isotopic ratio and the distribution that characterizes Pb loss. We then apply this mathematical framework to model the distribution of apparent Pb loss that has affected 10 igneous samples of Miocene to Carboniferous age. Our results highlight the importance of quantifying distributions of apparent Pb-loss magnitude to better understand the potential influence on non-CA zircon U–Pb date distributions.
A series of n measurements that have undergone Pb loss, Z, may be modeled as the sum of the corresponding unperturbed values, X, and the amount that changed due to Pb loss for each date, Y,
where Z, X, and Y are all 1-D arrays with n values and units of percentage offset from the true isotopic value (Fig. 2). Because Pb loss produces a lower ratio, the values of Y must be negative in our formulation of Eq. (1). If X is drawn from a Gaussian distribution f(t), whose mean (μ) approximates the true isotopic value and whose standard deviation (σ) reflects dispersion from the true value related to measurement uncertainty (e.g., Schoene, 2013), and if Y is drawn from a distribution that reflects Pb loss, g(t), then Z may be viewed as being drawn from the convolution of f(t) and g(t)
provided that X and Y are independent (Fig. 2; Video S1 in Sharman and Malkowski, 2023). Convolution simply represents the summation of two random variables, in this case one related to analytical precision (i.e., random variation around the true isotopic value stemming from the measurement process) and the other related to the geologic process of Pb loss. We model Pb loss as percentage offset from the true value rather than deviation in absolute time (i.e., Myr) to promote a comparison of samples of different age (Fig. 2).
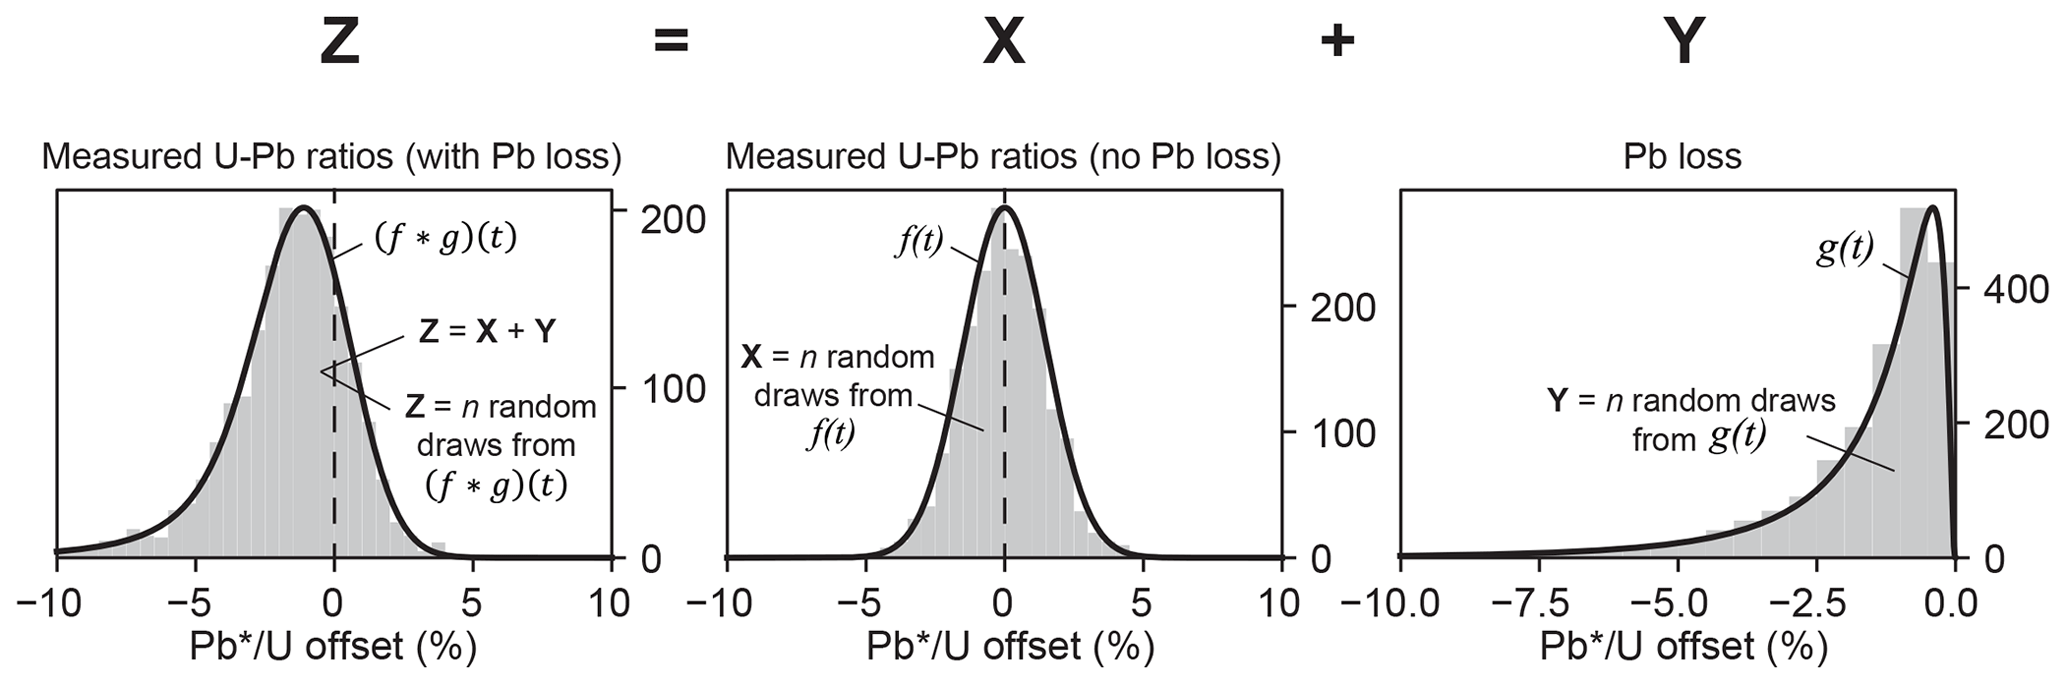
Figure 2Illustration of how isotopic ratios from n zircon analyses that have been perturbed by Pb loss (Z) may be modeled as the summation of n non-perturbed ratios (X) and the amount of Pb loss encountered by each (Y). X is drawn from f(t) that reflects the Gaussian distribution of ratios that are unperturbed by Pb loss, and Y is drawn from g(t) that represents the distribution of Pb loss in the sample. The distribution that characterizes Z may be found by convolving f(t) and g(t). Although we assume that f(t) is a Gaussian distribution, the distribution type of Pb loss, g(t), shown in this example as a logit–normal distribution (; σ=1.0), could take a number of discrete or continuous forms (Fig. 3). Note that in our modeling framework, values of X, Y, and Z are normalized as percentage deviation from the true isotopic ratio (i.e., the mean of f(t)), where negative values indicate that measured is lower than the true ratio. See Video S1 (Sharman and Malkowski, 2023) for an animation that illustrates the process of convolution and Video S2 (Sharman and Malkowski, 2023) for an exploration of the logit–normal distribution in μ and σ parameter space.
Equation (2) may be solved analytically for some forms of f(t) and g(t). For example, the convolution of Gaussian and exponential distributions is known as the exponentially modified Gaussian distribution (Grushka, 1972). However, (f∗g)(t) may also be solved numerically, which has the advantage of allowing both f(t) and g(t) to take any form.
3.1 Modeling approach
We use the mathematical framework described above to model both the distribution of apparent Pb loss, g(t), experienced by a group of cogenetic crystals and their unperturbed U–Pb date distribution, f(t). Because Pb loss is isotopically indiscriminate, Eq. (2) may be equally applied to and . However, we model ratios, as these have much lower analytical uncertainty for the Carboniferous and younger samples analyzed in this study.
To model g(t), we allow the μ of f(t) to vary within the 95 % confidence interval associated with an independent estimate of the crystallization age. We then estimate both g(t) and σ of f(t) by iteratively solving for the combination of parameters that minimize the misfit between the measured values and the modeled distribution (f∗g)(t), using the Python scipy.optimize.minimize() function. We define the misfit as the sum of squared residuals between the empirical cumulative distribution function (ECDF) of the measured values and the cumulative density function (CDF) of the modeled distribution.
If both non-CA and CA analyses are available from the same sample, then the distribution of CA U–Pb dates may be used to constrain the parameters of f(t). For such samples, we modify the approach described above by first finding the Gaussian distribution f(t) that most closely approximates the treated distribution. We then use this best-fitting f(t) in estimating g(t), using the minimization-of-misfit technique described above. Such datasets have the advantage of providing constraints on σ of f(t), which is otherwise treated as an unknown parameter during modeling if only non-CA U–Pb dates are available.
In order to estimate g(t) as described above, we must choose one or more reasonable parametric models that are appropriate for describing distributions of Pb loss. One possibility is that all zircon crystals in the sample experienced the same amount of Pb loss, which could shift from 0 % to −100 % of its value. Such a scenario of constant Pb loss may be modeled by a discrete form of g(t) where a single parameter specifies the percentage of Pb lost. Convolution of such a discrete form of g(t) simply produces a negative shift in the values (i.e., Fig. 3b).
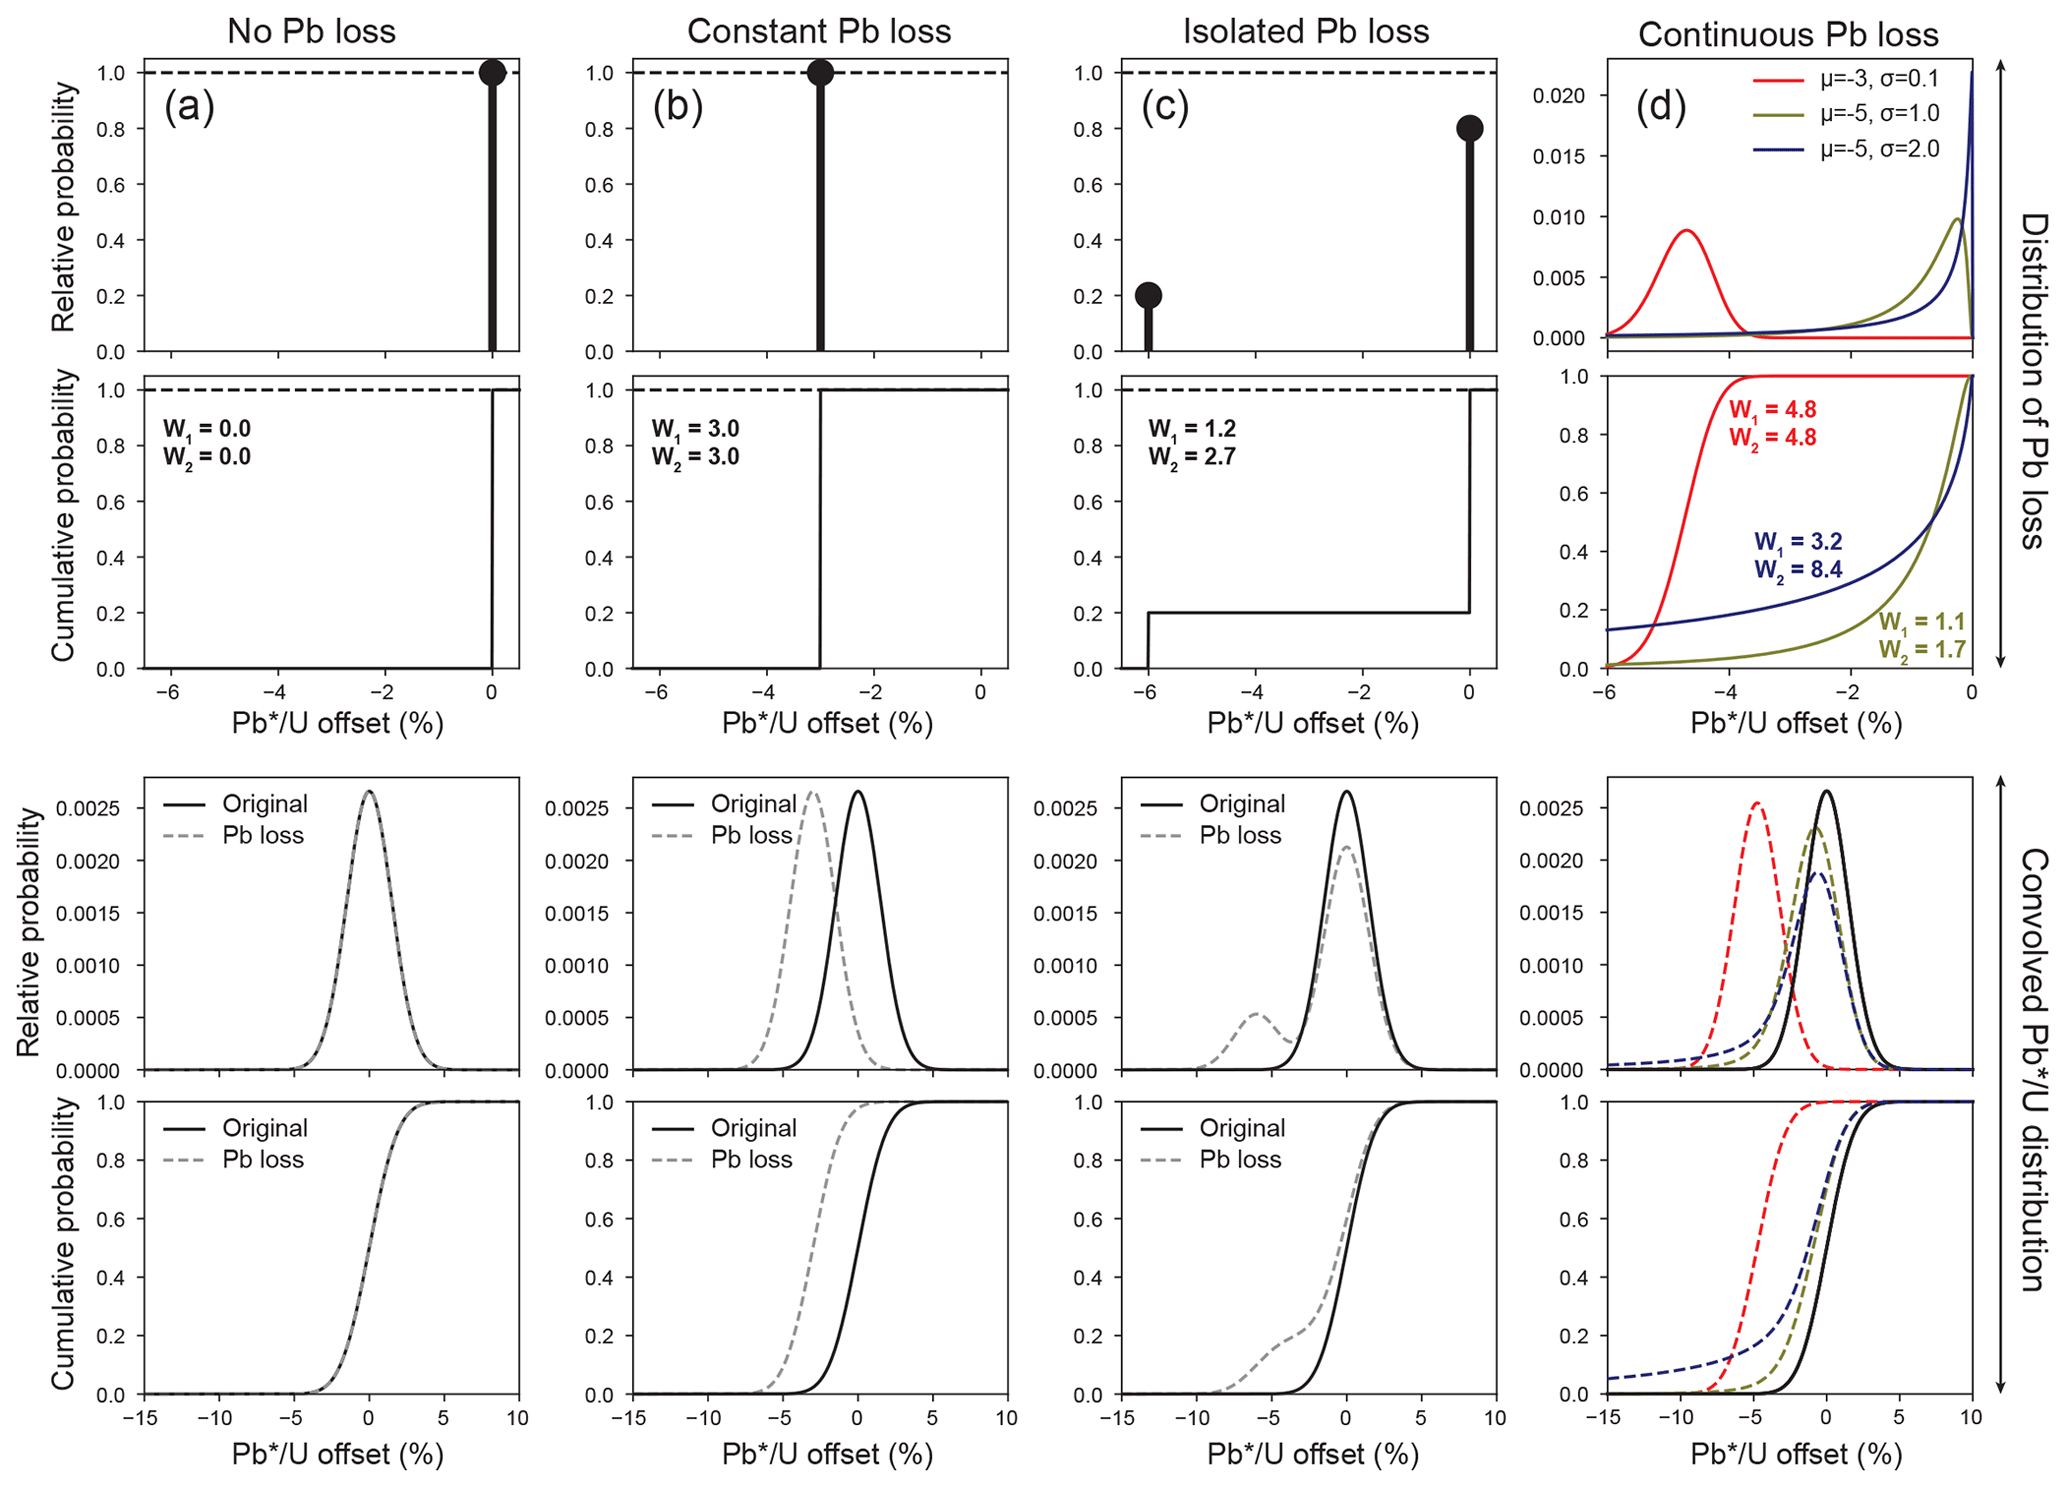
Figure 3Illustration of how normally distributed zircon values may be perturbed by discrete (a–c) or continuous (d) distributions of Pb loss. The top row represents the distribution of Pb loss in the sample expressed as a percentage of the true isotopic ratio (e.g., or ) at the time of Pb loss, where the height of the black bar and ball indicates the relative probability of the specified offset. Three discrete scenarios are shown: (a) no Pb loss, (b) constant Pb loss, and (c) isolated Pb loss. A logit–normal distribution is shown as an example of continuous Pb loss in panel (d). Additional examples of continuous Pb-loss distributions are shown in Fig. A1 in Sharman and Malkowski (2023). The bottom row shows both the relative (above) and cumulative (below) probabilities of the unperturbed (solid black line) and Pb-loss-perturbed (dashed line) distributions.
Another possibility is that Pb loss was experienced by only a subset of crystals (i.e., isolated Pb loss). This scenario may also be modeled by assigning g(t) to a discrete distribution with two parameters, with one that indicates the fraction of Pb lost and one that specifies the proportion of crystals that underwent Pb loss (Fig. 3c). This parameterization of g(t) will produce a bimodal pattern in U–Pb values, particularly if the degree of Pb loss is significant relative to measurement uncertainty (Fig. 3c).
Instead of modeling g(t) as a discrete distribution where Pb loss is restricted to certain values, we may also consider a continuous probability distribution, where values of Pb loss can take on any value between 0 % and 100 % (Fig. 3d). Rather than assume a priori the form(s) that g(t) might take, we considered a wide range of one- or two-parameter distributions for the purposes of exploratory modeling (Appendix A in Sharman and Malkowski, 2023). Of the distribution types considered, we identified the logit–normal distribution, also known as the logistic–normal distribution, as perhaps the most reasonable for modeling Pb loss. The logit–normal distribution has the property of having a logit (i.e., the quantile function of the logistic distribution) that is normally distributed with a geometric mean of μ and standard deviation of σ (Aitchison and Shen, 1980; Mead, 1965)
for . The logit–normal distribution is well-suited for modeling constrained data types (e.g., compositional data; Aitchison and Bacon-Shone, 1999; Vermeesch, 2018b), in part due to it being defined over . We invert and scale the distribution to extend from −100 % < x < 0 % to match the sign and units of offset due to Pb loss when expressed as a percentage (Fig. 3d).
Figure 4 explores the relationship of the logit–normal distribution to its two parameters (μ and σ) (see also Video S2 in Sharman and Malkowski, 2023). The distribution has a “spiky” character when σ is a very small number (e.g., 0.001; Fig. 4a), which would be a reasonable approximation for samples that underwent an approximately constant amount of Pb loss (e.g., Fig. 3a and b). Although the logit–normal distribution cannot model 0 % or 100 % Pb loss, these values may be approximated by making μ a large negative or positive number, respectively. A sample where most zircon exhibit very little Pb loss but with fewer zircon experiencing significant Pb loss could be produced by μ = −4 and σ=1.0 (Fig. 4c). Alternatively, a sample with a peak probability of offset <0 % may be modeled using moderate values of σ (e.g., 0.25–1; Fig. 4b and c). The logit–normal distribution produces bimodal distributions, where most probability is close to 0 % and −100 % when σ values are high (e.g., ≫1; Fig. 4d).
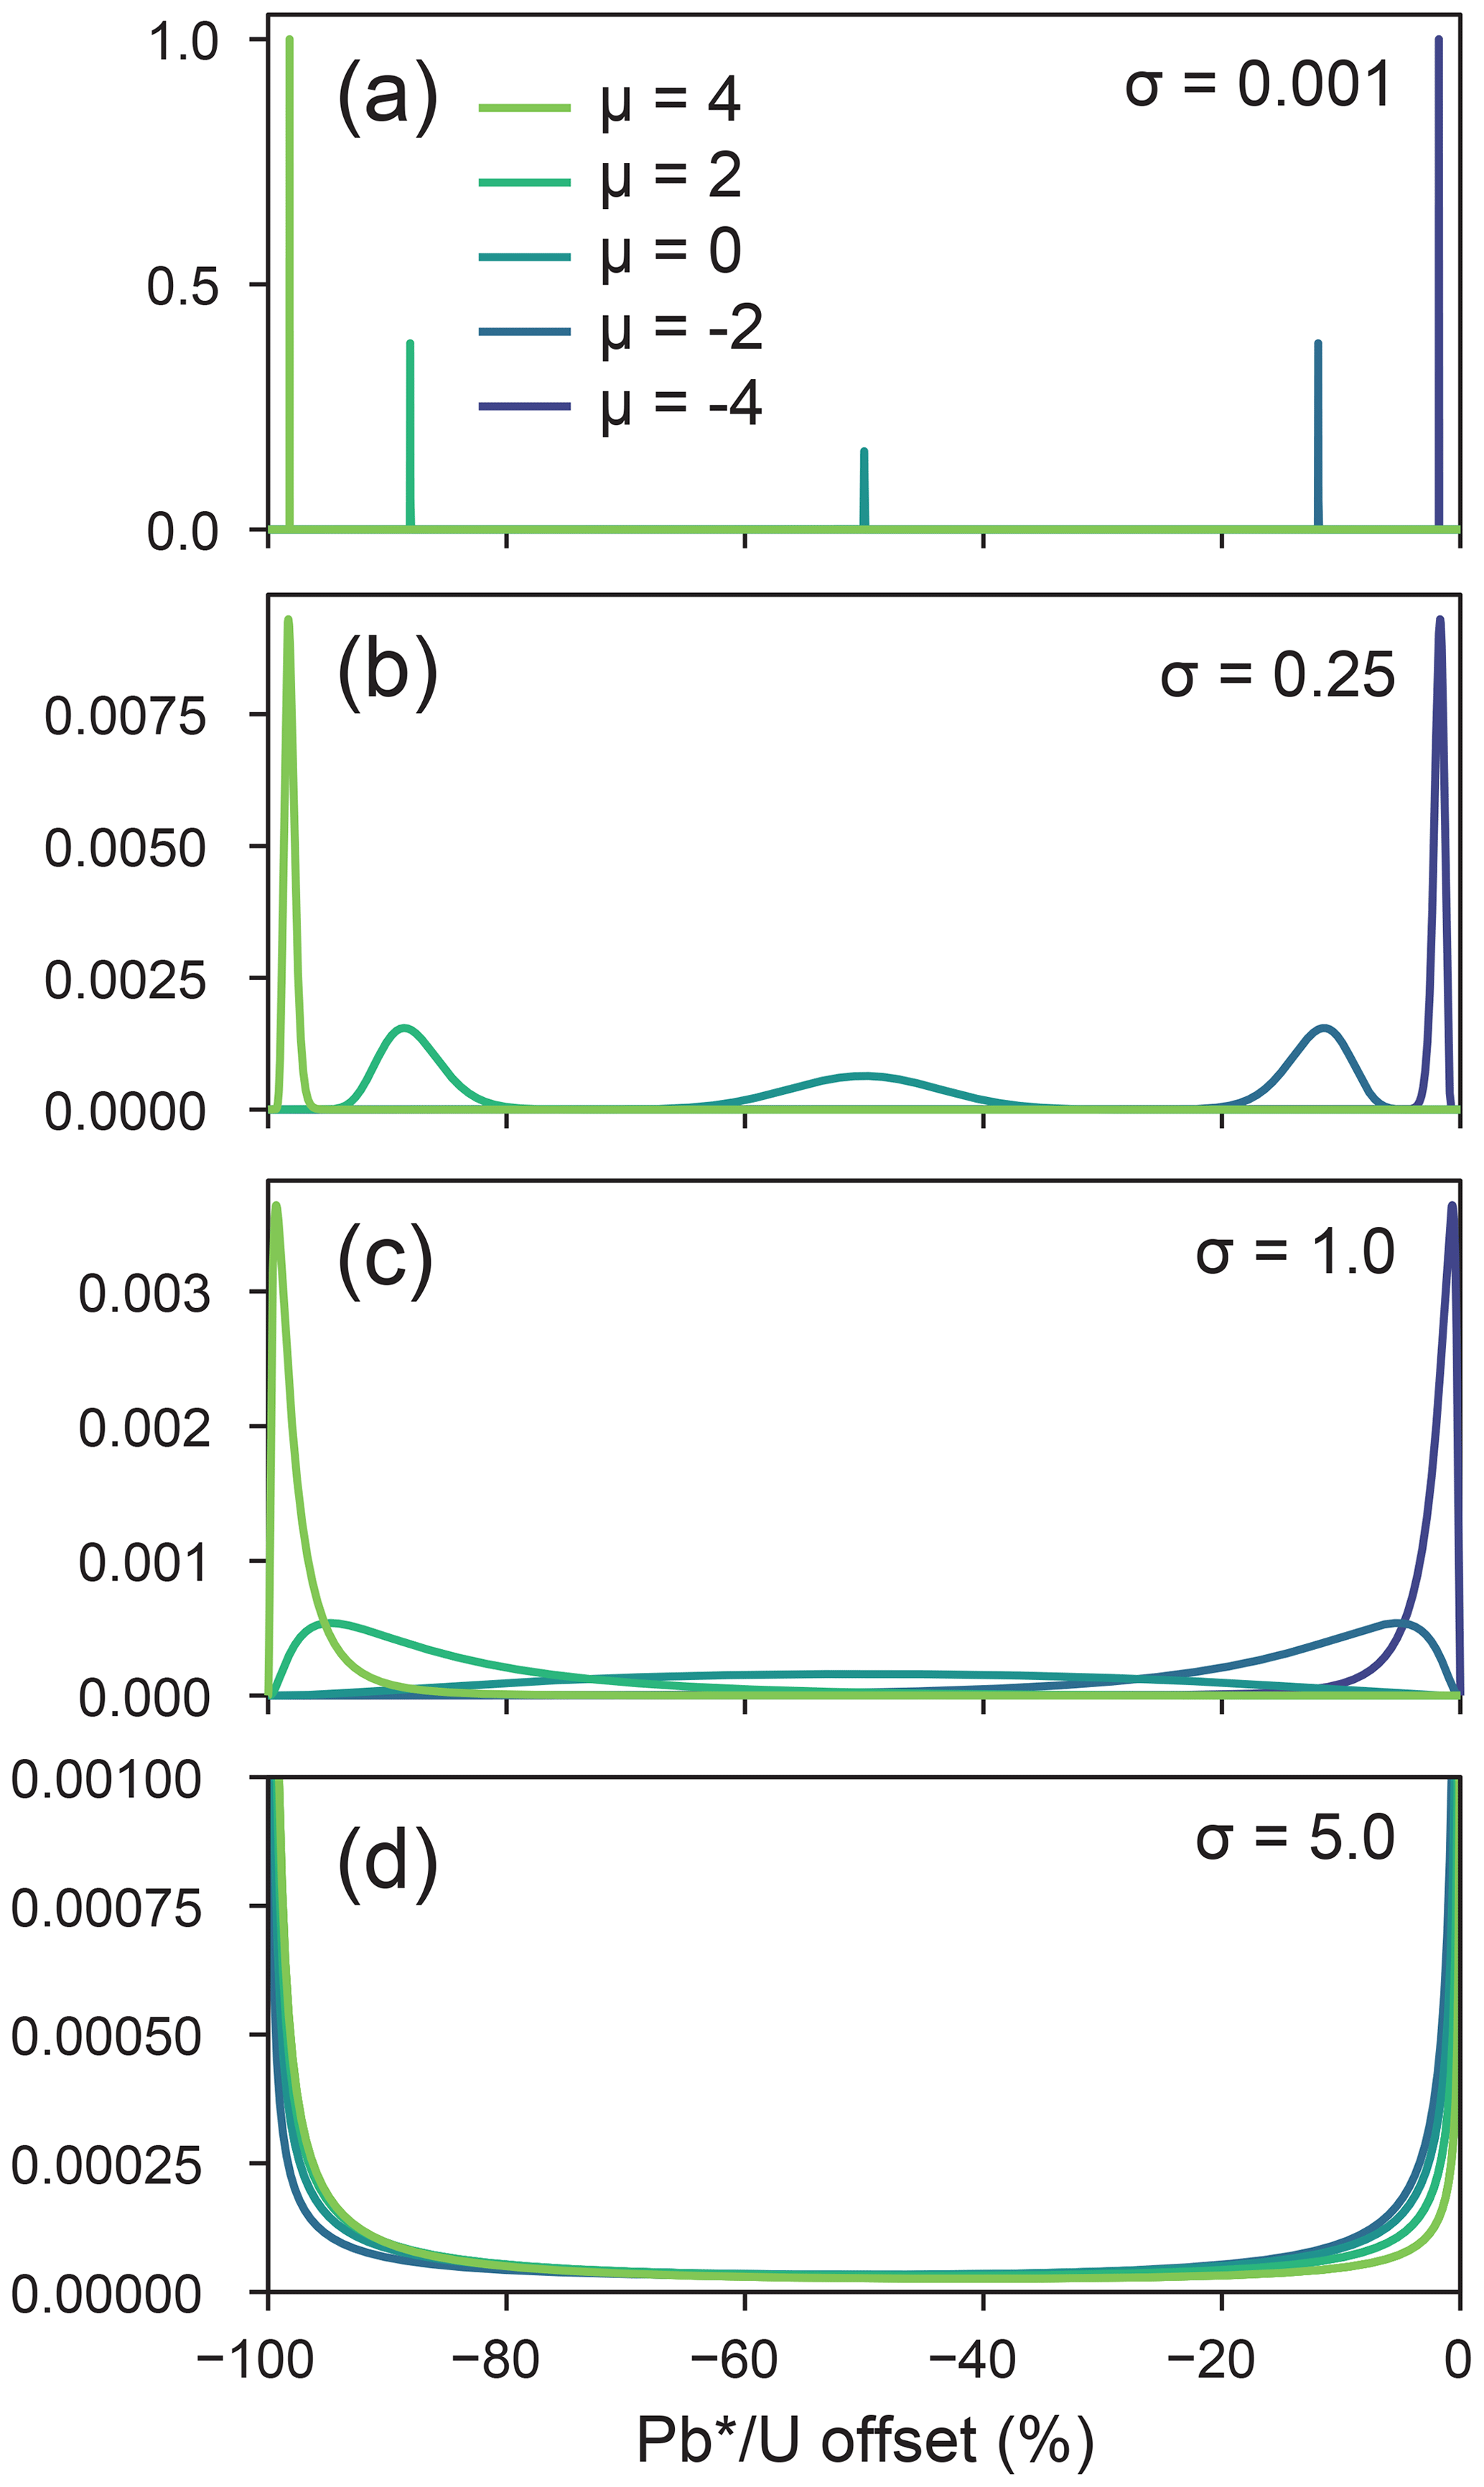
Figure 4Exploration of the logit–normal distribution's parameter space. Note that we have rescaled the x axis of the logit–normal distribution, such that .
3.2 Samples
We apply the mathematical and modeling framework presented above to estimate the distribution of apparent Pb loss in 10 igneous samples that range in age from Carboniferous to Miocene, 9 of which have been published previously (Table 1). Samples CTU, RCP, and SRF are all from upper Eocene rhyolites of the Caetano caldera system of the western United States (Watts et al., 2016). These samples were split into non-CA and CA aliquots prior to analysis via secondary ionization mass spectrometry (SIMS) (Watts et al., 2016). We used the error-weighted mean age of the CA U–Pb dates as an estimate of the true crystallization age for each sample, with weighted means approximately 0.4–0.6 Myr older than the corresponding sanidine ages (Watts et al., 2016). The number of analyses per aliquot (non-CA or CA) ranges from 17 to 34 for these three samples (Table 1).
Table 1Sample summary.
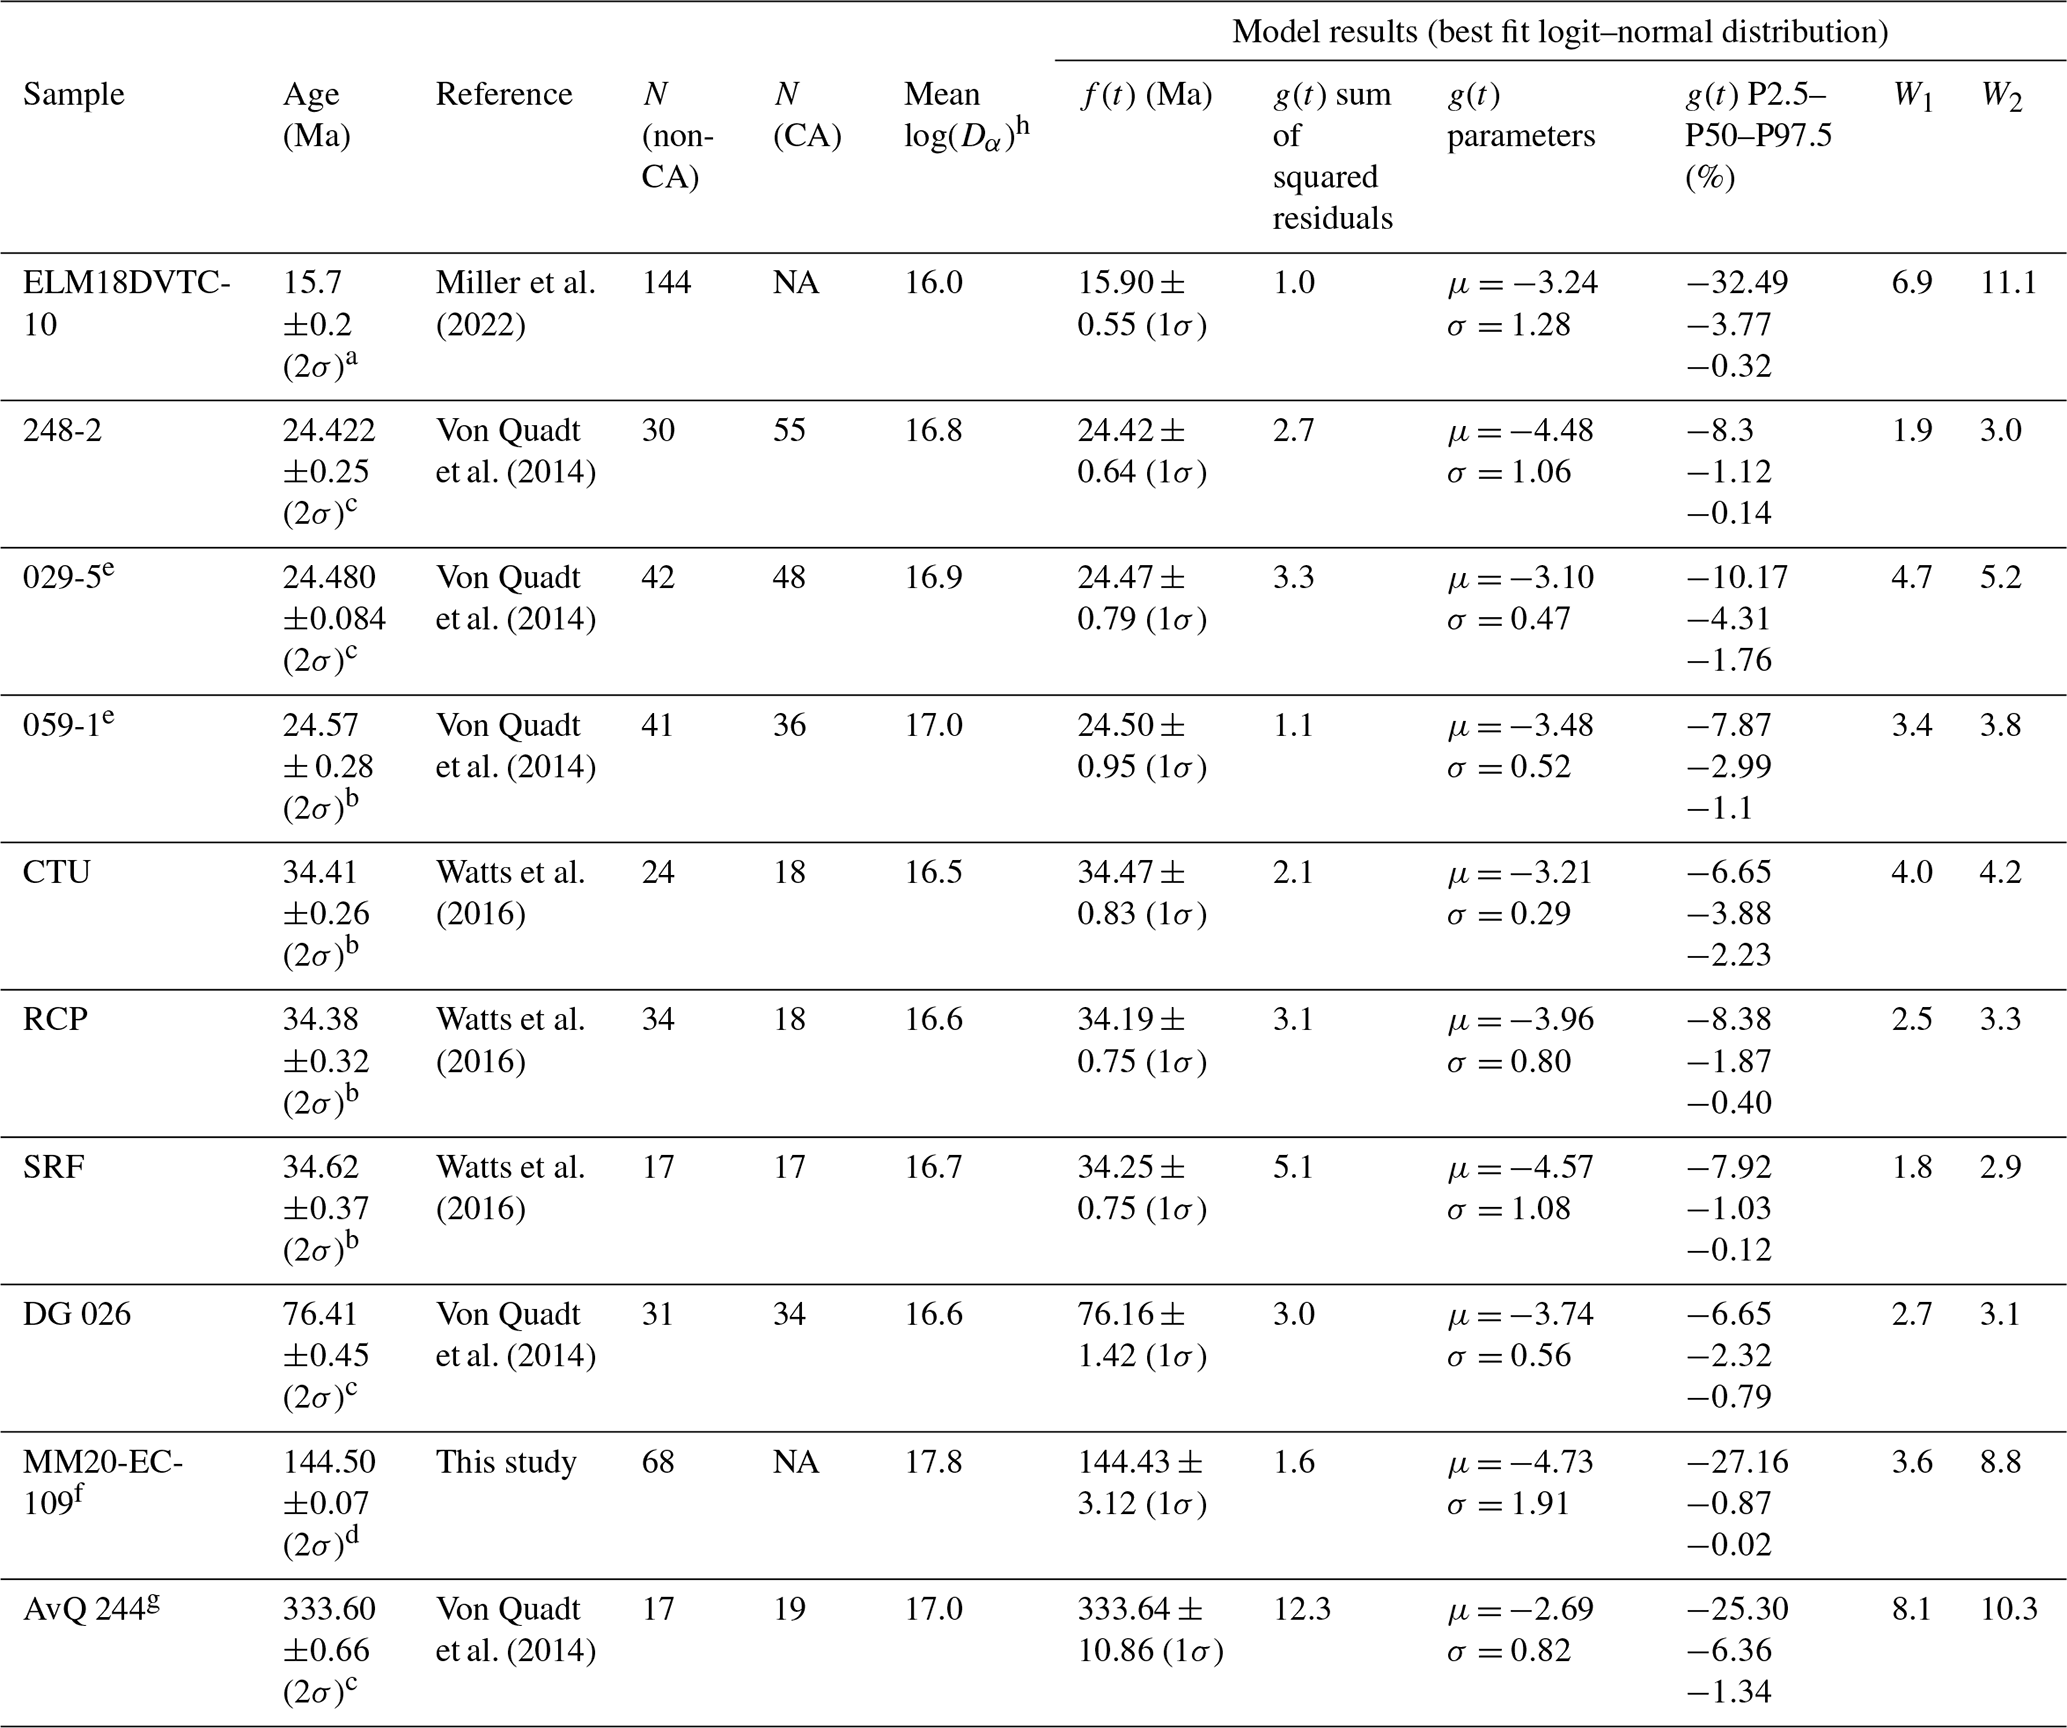
a Sanidine age (Snow and Lux, 1999). b Error-weighted mean of chemically abraded U–Pb dates. c Concordia age (CA-ID-TIMS). d Error-weighted mean five of five zircon crystals analyzed via CA-ID-TIMS. e U–Pb dates older than 28 Ma are excluded from analysis. fU–Pb dates older than 158 Ma are excluded from analysis. g U–Pb dates older than 360 Ma are excluded from analysis. h Dα is the alpha dose (events g−1). N is for the number of analyses. NA is for not available. W1 is for the first Wasserstein distance. W2 is for the second Wasserstein distance.
We present analysis of five samples reported in von Quadt et al. (2014), including upper Oligocene andesite to trachyandesite from Macedonia (248-2, 029-5, and 059-1), upper Cretaceous dolerite from Romania (DG 026), and middle Carboniferous granite from west Bulgaria (AvQ 244). These samples were also split into non-CA and CA aliquots prior to analysis via LA-ICP-MS. For samples other than 059-1 we use concordia ages from CA-ID-TIMS analyses of between three and six crystals for the crystallization age of each sample (von Quadt et al., 2014; Table 1). For sample 059-1, we used the weighted mean of the CA U–Pb dates. The number of analyses per sample (non-CA or CA) ranged from 17–55 for this dataset (Table 1).
Sample ELM18DVTC-10 is from a Miocene ash-flow tuff from the Panuga Formation in the western United States that has 144 U–Pb dates acquired via LA-ICP-MS (Miller et al., 2022). We use a weighted mean age of 15.7 ± 0.2 Ma (2σ) from the same unit as an estimate of the crystallization age of this sample (sample 592-GV1 of Snow and Lux, 1999). Sample ELM18DVTC-10 was highlighted by Schwartz et al. (2022), who noted the youngest zircon U–Pb dates to be much younger than the accepted age of this unit. Miller et al. (2022) also noted the presence of these young zircon and suggested that they may be a consequence of surface contamination from units higher in the section.
Sample MM20-EC-109 is a Lower Cretaceous intermediate ash interbedded within marine carbonaceous mudstone from the Rio Mayer Formation of Argentina with 68 zircon U–Pb dates acquired via LA-ICP-MS (Table A3 in Sharman and Malkowski, 2023). Laser ablation spot locations were selected on the rim and/or core of the zircon guided by cathodoluminescence (CL) images (Fig. A3 in Sharman and Malkowski, 2023), with 59 zircon crystals analyzed in total. We use a crystallization age of 144.43 ± 0.07 Ma (2σ) derived from a weighted mean of five zircon crystals analyzed via CA-ID-TIMS at the Boise State University Isotope Geology Laboratory (Table A4 in Sharman and Malkowski, 2023). This sample exhibits U–Pb dates acquired via LA-ICP-MS that are up to ∼ 60 % younger than the CA-ID-TIMS weighted mean.
3.3 Statistical analysis
To evaluate the likelihood that the measured distribution could have been drawn from the modeled (f∗g)(t), we apply the nonparametric, one-sided Kolmogorov–Smirnov (K–S) and Kuiper statistical tests that compare the ECDF with the cumulative CDF of (f∗g)(t) (Press et al., 2007). The Kuiper statistic is relatively more sensitive in differences in the tails of the distributions versus the K–S statistic (Vermeesch, 2018a). We reject the null hypothesis that the non-CA U–Pb dates were drawn from (f∗g)(t) if the K–S or Kuiper p value is <0.05 (i.e., 95 % confidence level). We thus interpret p values > 0.05 to indicate that the non-CA U–Pb dates could have been plausibly drawn from (f∗g)(t) at a 95 % confidence level (Press et al., 2007). However, it should be noted that Saylor and Sundell (2016) found that both K–S and Kuiper p values more frequently reject the null hypothesis than expected. We thus use p values as a general guideline to model the goodness of fit.
The Wasserstein distance has been recently proposed as a metric for quantifying the dissimilarity between detrital zircon U–Pb age distributions (Lipp and Vermeesch, 2023). We consider the first and second Wasserstein distances, W1 and W2, to be useful approximations for the total degree of negative perturbation that a set of analyses has experienced,
where M−1 and N−1 are the inverses of the CDFs M and N. Because values of Pb loss are restricted to between 0 % and 100 %, both W1 and W2 yield maximum possible values of 100 (i.e., 100 % of analyses have −100 % offset, or the U–Pb system is completely reset). The W1 simply equates to the area beneath the cumulative probability distribution of g(t) (e.g., Fig. 3). Because the W2 distance involves a squaring of the distance between the quantile functions, it imparts a higher cost penalty for the part of the distribution with strongly offset values. For example, the W1 and W2 distances are equal for a Pb-loss function characterized by constant Pb loss (e.g., 3 % Pb loss produces W1 and W2 values of 3; Fig. 3b). However, the W2 distance is often much larger than W1 for Pb-loss distributions with a heavy tail (Fig. 3d). As such, the ratio provides an approximation of Pb-loss distribution asymmetry, with values of 1 indicating constant Pb loss and values ≫1 indicating highly asymmetric Pb loss.
Of the four primary types of Pb-loss distributions considered (Fig. 3), the logit–normal distribution yielded the lowest average misfit with a value of 3.5, followed by the isolated Pb-loss scenario (average of 4.5) and the constant Pb-loss scenario (average of 10.5) (Table A2 in Sharman and Malkowski, 2023). The scenario of no Pb loss performed the worst of any scenario that we considered, with an average misfit of 101.3 (Table A2). Correspondingly, both K–S and Kuiper p values for the no-Pb-loss scenario are ≪0.05 for all samples, except SRF, suggesting that the untreated LA-ICP-MS or SIMS U–Pb dates are unlikely to have been drawn from an unperturbed U–Pb date distribution.
Figure 5 presents a comparison of actual versus modeled U–Pb date distributions for each sample, with the best-fitting logit–normal distribution shown (Table 1; see Fig. A1 in Sharman and Malkowski, 2023, for individual plots that show the fit for each sample and distribution type). We chose to not consider discrete distributions of g(t) for the “best” fit because we consider it unlikely that Pb loss (or other processes that cause negative age offsets) would be limited to discrete values (e.g., Fig. 3). Values of μ for g(t) ranged from −2.69 to −4.73, with corresponding values of σ spanning 0.29 to 1.91. W1 distances ranged between 1.8 (sample SRF) and 8.1 (sample AvQ 244) and W2 distances between 2.9 and 11.1 (Table 1; Fig. 5).
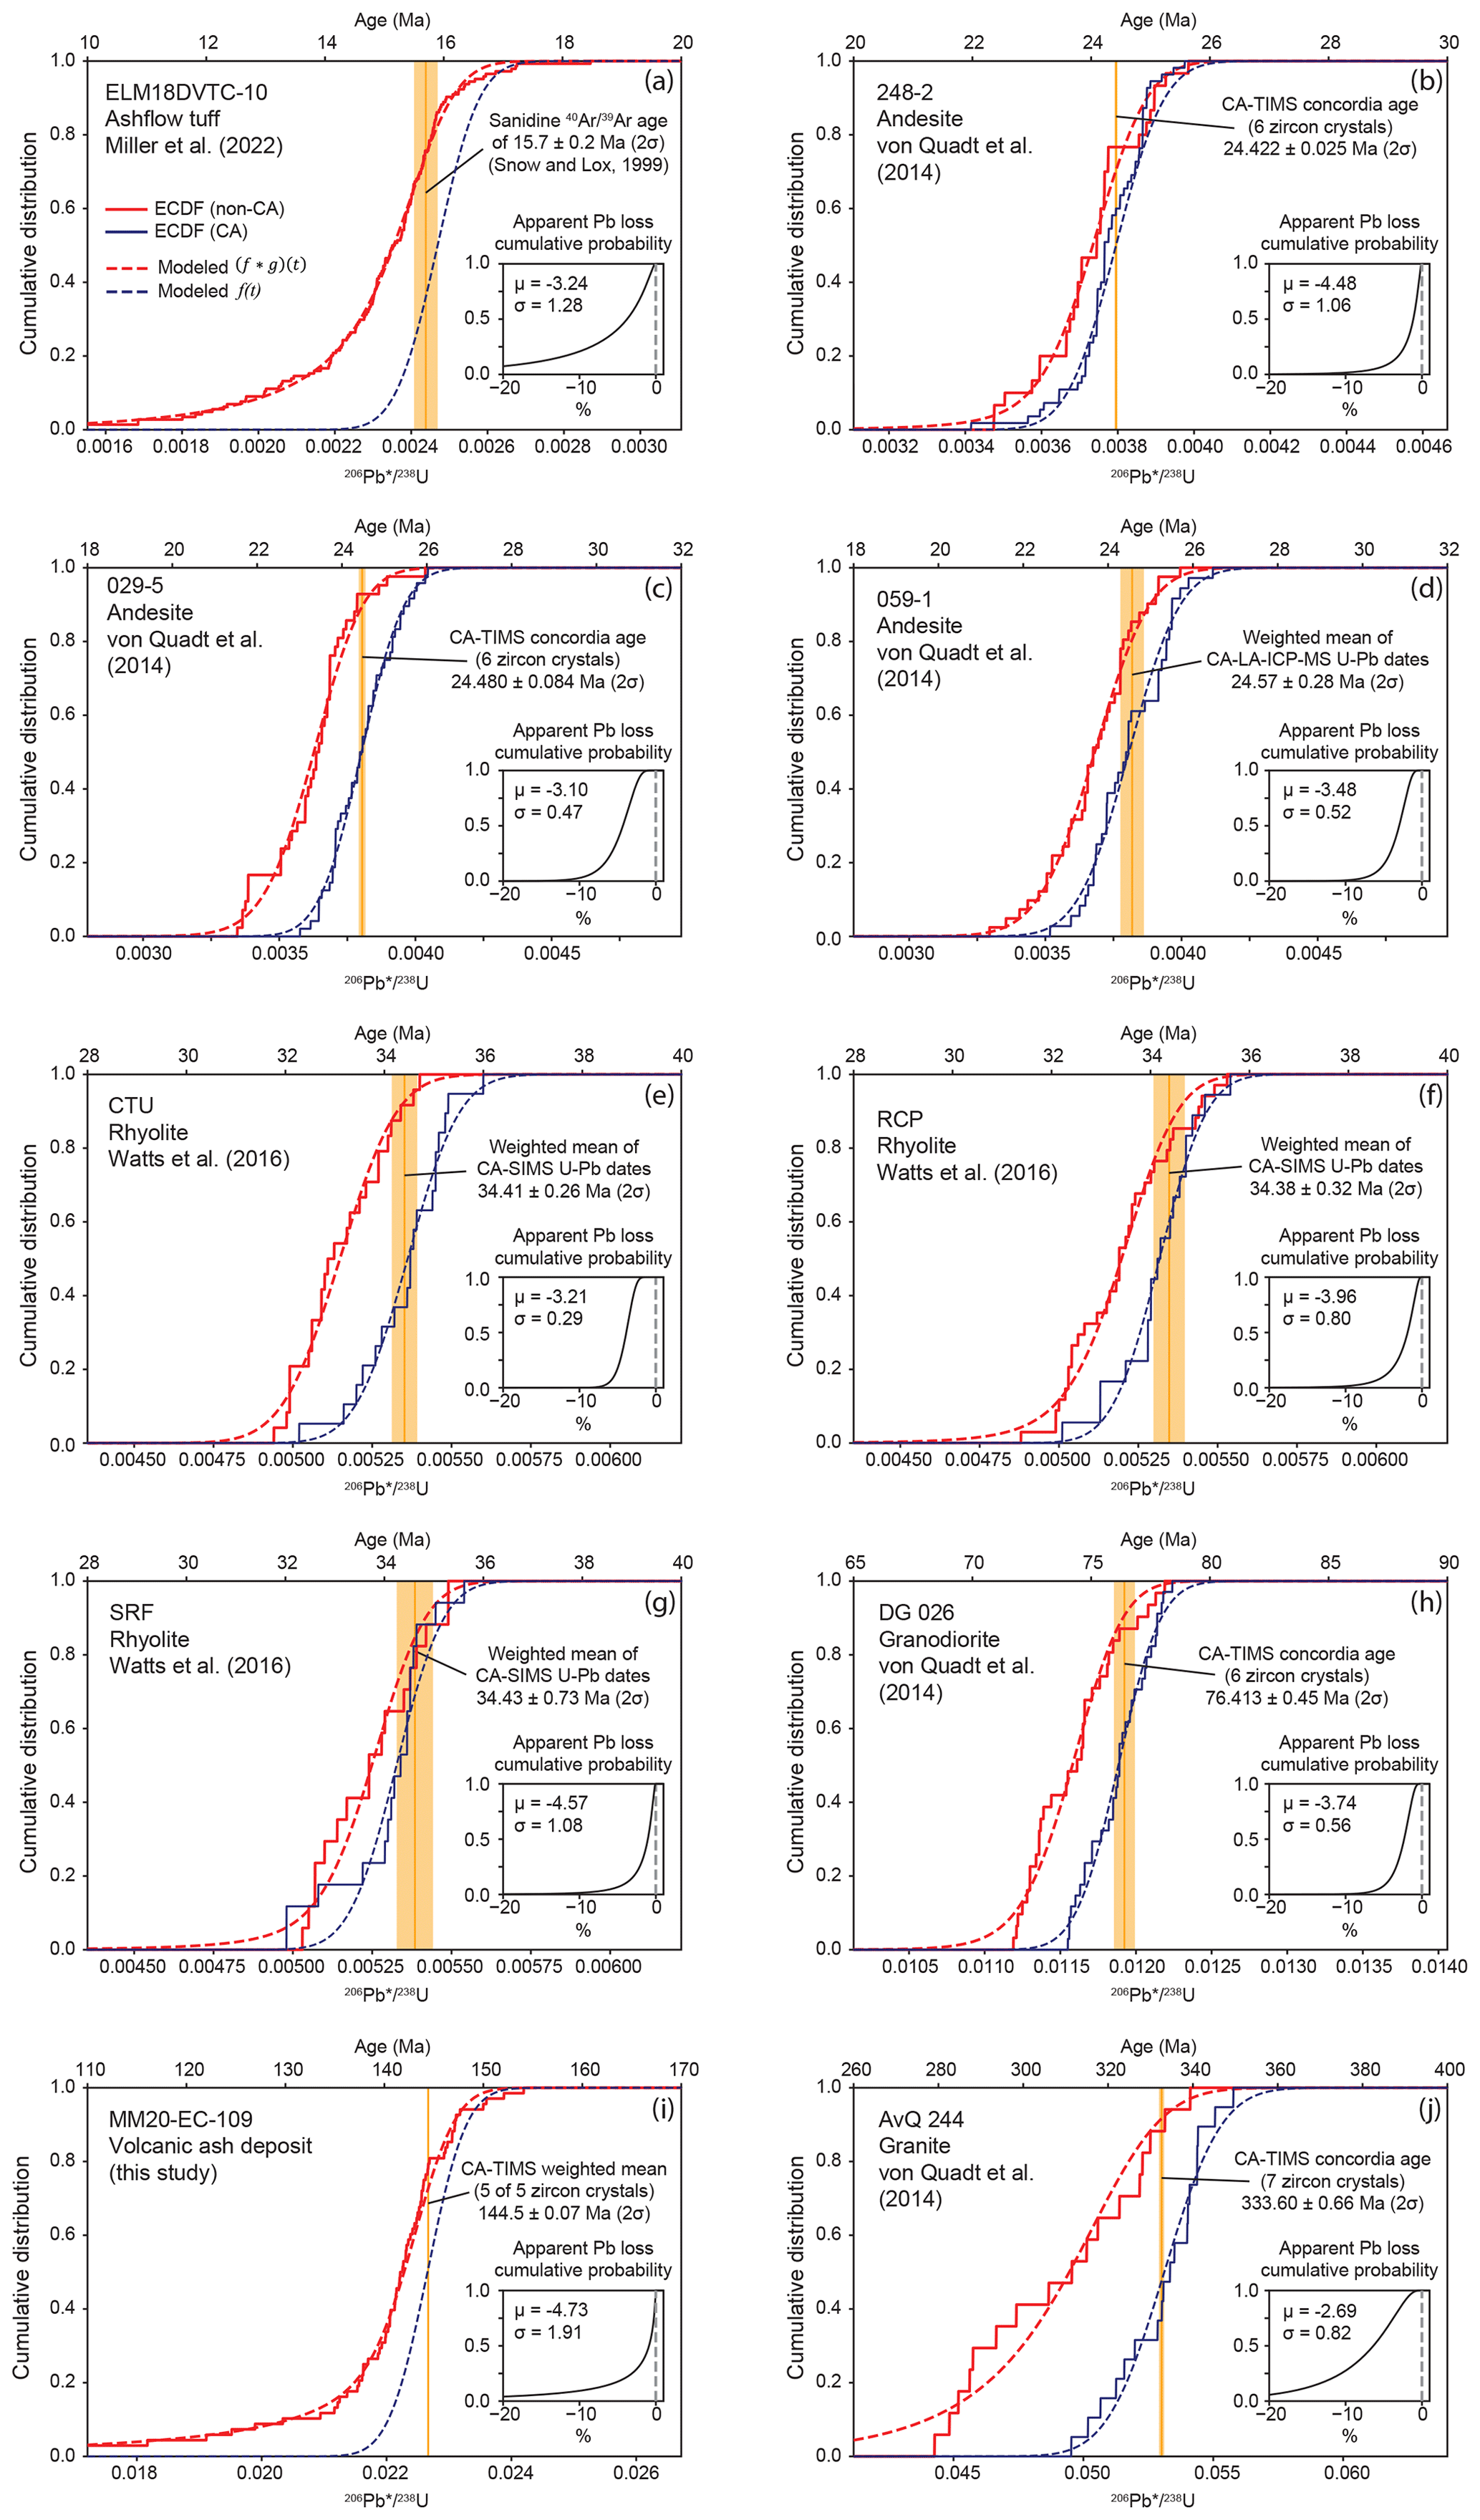
Figure 5Modeling of apparent Pb loss in zircon U–Pb dates acquired via LA-ICP-MS or SIMS. The best-fitting logit–normal distribution of apparent Pb loss is shown (Table 1; see Fig. A1 in Sharman and Malkowski, 2023, for plots of all samples and apparent Pb-loss-distribution types modeled). Empirical cumulative distribution functions (ECDFs) are shown as solid lines, while model results are shown as dashed lines. See text for further discussion of model results.
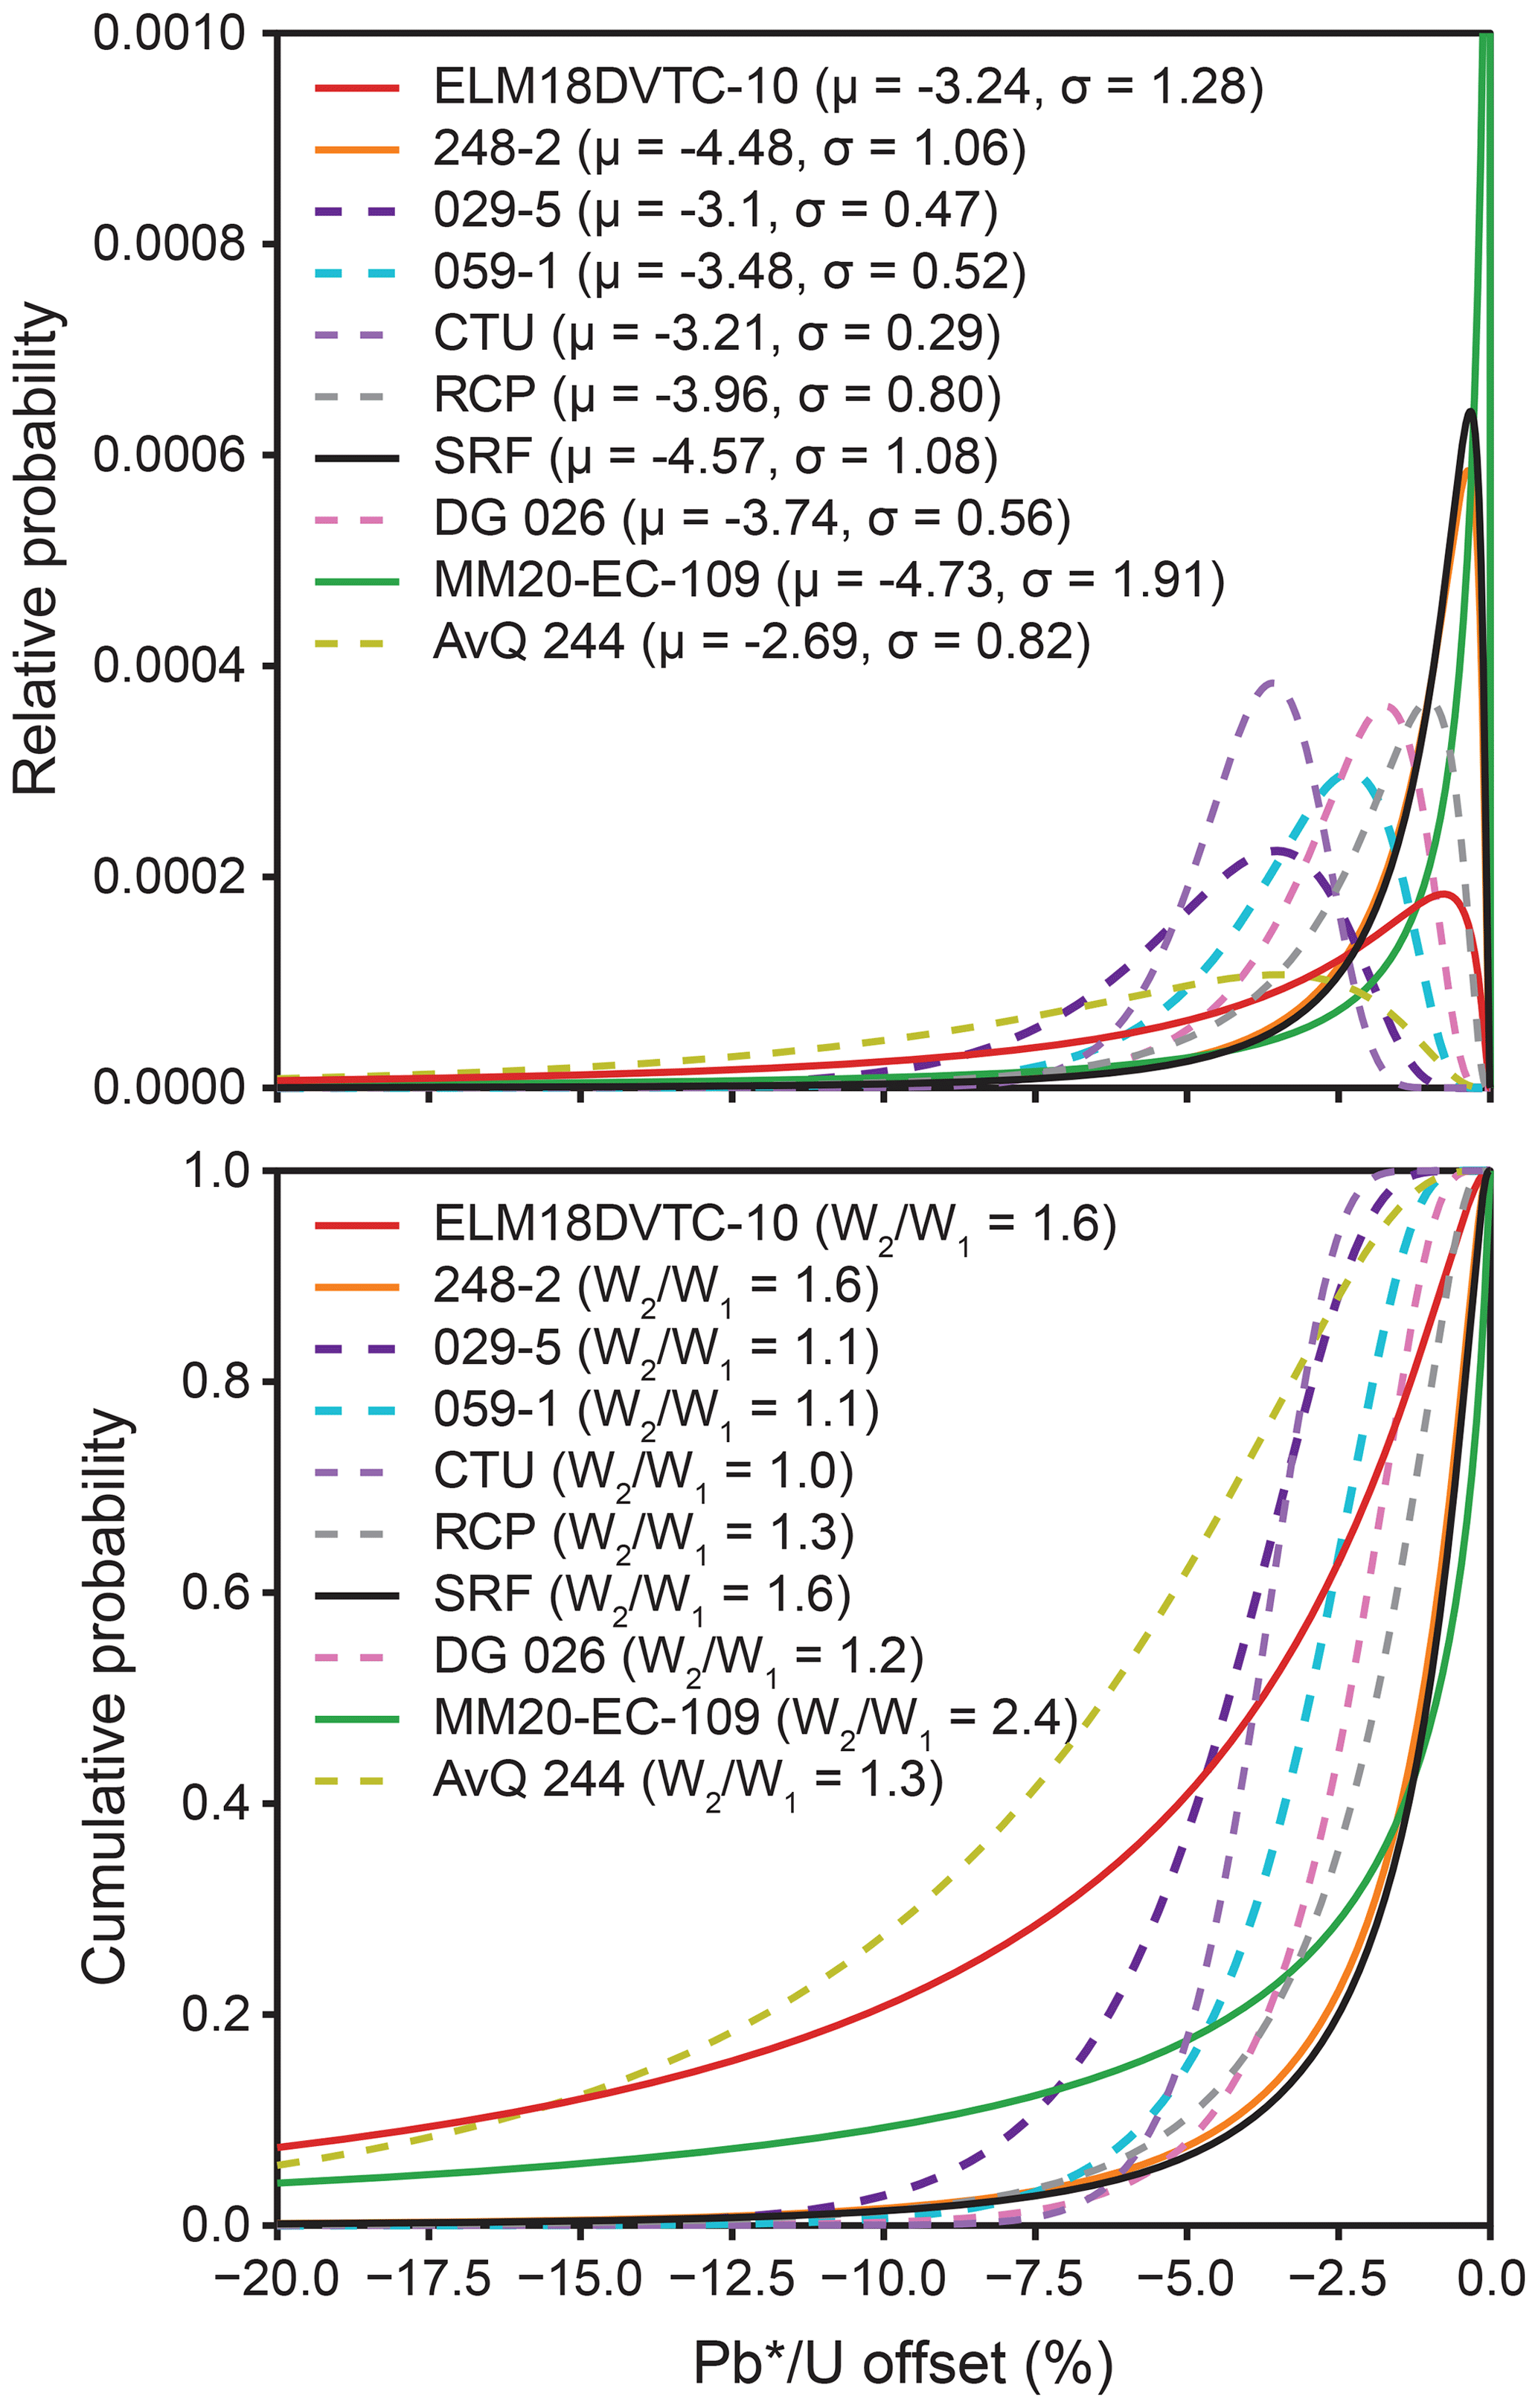
Figure 6Distributions of apparent Pb loss when modeled as a logit–normal distribution. Samples with σ<1 are shown as a dashed line.
A plot of the best-fitting logit–normal distributions displays two distinct behaviors of g(t) (Fig. 6). (1) Four samples with and σ>1 and have a g(t) maximum relative probability close to 0 %, suggesting a strongly decaying rate of offset (i.e., most zircon experienced very little Pb loss, while a few have more significant offset). These samples also displayed . (2) The remaining six samples that yielded σ<1 and generally higher μ values () displayed a tendency for the mode of g(t) to be >0 %, representing more of a bulk shift in age (e.g., most U–Pb dates have some offset, while relatively few have very little or very much age offset). These samples produced .
5.1 Assumptions and limitations
The mathematical and modeling framework that we present includes several underlying assumptions and limitations that should be considered.
-
Because g(t) could represent any geological or analytical process that introduces negative age offsets, we use the phrase “apparent Pb loss” when describing our modeled estimates of g(t). For instance, matrix-related systematic errors (Allen and Campbell, 2012), addition of U–Th during weathering (Pidgeon et al., 2019), and even sample contamination from younger minerals could introduce negative age shifts exclusive of loss of radiogenic Pb. Common Pb corrections, particularly the 207Pb correction, may also introduce a bias in values (Andersen, 2002; Andersen et al., 2019). We recommend that these additional complexities in the U–Pb system be considered when interpreting modeled estimates of g(t) as representing distributions of Pb loss.
-
Our approach of parameterizing g(t) for the purpose of exploratory modeling has the advantage of yielding results that are interpretable, while also being suitable for the relatively low-n datasets available. However, any parametric model is likely a simplification of the true g(t), and thus we consider our modeled estimates of g(t) to be first-order approximations. Analyzing a greater range of samples with a greater number of ± CA in situ U–Pb analyses, with ideal datasets having hundreds or even thousands of analyses per sample (e.g., Pullen et al., 2014; Sundell et al., 2021), would likely improve our ability to constrain the form(s) of g(t) and evaluate whether the logit–normal distribution or other forms of g(t) are appropriate. Such datasets would also be more amenable to nonparametric solutions of estimating g(t).
-
For g(t) to represent the true distribution of Pb loss, the process of convolution must be applied to ratios at the time of Pb loss. Because Pb* is progressively added to the crystal over time, a greater amount of ancient Pb loss is required to achieve the same reduction in relative to recent Pb loss. This point is illustrated in Fig. 1, where a 50 % reduction in Pb* at 125 Myr after crystallization produces a similar reduction in when compared to zircon of the same age that lost 25 % of its Pb* at present day. For this reason, g(t) can be viewed as a minimum estimate in the case of ancient Pb loss. If the timing of Pb loss is known or can be estimated (e.g., Morris et al., 2015), the input ratios can be adjusted prior to analysis, such that g(t) more accurately reflects the true magnitude of Pb loss.
-
The modeling framework presented above is designed for a group of cogenetic crystals with a shared crystallization age (e.g., autocrystic zircon from the same magmatic episode; Miller et al., 2007). This requirement stems from our definition of apparent Pb loss as a relative shift or percentage deviation from the true isotopic value (Fig. 2). The assumption that all zircon are coeval is a simplification, as even autocrystic zircon crystallize over a period of time, typically at 103–104-year timescales (Miller et al., 2007; Rossignol et al., 2019). Multimodal detrital samples or igneous samples with xenocrystic or inherited zircon are not easily modeled because these samples would violate our assumption of a shared crystallization age. Failure to recognize the true heterogeneity in crystallization age in such a sample could cause an incorrect interpretation of the apparent Pb-loss distribution.
-
For datasets with paired non-CA and CA measurements, our modeling approach assumes that the relative precision of the analyses is similar. This is because the Gaussian distribution that best approximates the CA U–Pb date distribution, f(t), is convolved with the apparent Pb-loss distribution g(t) to fit the non-CA U–Pb date distribution. The Watts et al. (2016) SIMS dataset shows similar relative precision, regardless of the treatment approach (non-CA versus CA). Some samples from the von Quadt et al. (2014) LA-ICP-MS dataset exhibit slightly lower relative precision for non-CA versus CA, with sample AvQ 244 yielding the largest difference with an average relative precision of 1.1 % (1σ) for non-CA dates and 0.8 % (1σ) for CA dates. We suggest that for the purposes of modeling apparent Pb loss, paired non-CA and CA U–Pb datasets should be collected on the same instrument, using similar acquisition parameters to avoid introducing large changes in measurement precision. Alternatively, the CA U–Pb dates may be used to only constrain the μ of f(t) in the model, with σ treated as an unknown parameter (e.g., for paired non-CA LA-ICP-MS and CA-ID-TIMS datasets; Fig. 5a and i).
-
For datasets with paired non-CA and CA measurements, we do not consider any imperfections of the chemical abrasion process. For example, although the CA treatment aims to completely remove all radiation damaged zones of the crystal (Mattinson, 2005), it is possible to have remaining residual zones of Pb loss following treatment (e.g., Schoene et al., 2010). Any such remaining compromised domains of the crystal will yield at least some apparent Pb loss when analyzed. For instance, Watts et al. (2016) interpreted three zircon U–Pb analyses from SRF to have some residual Pb loss that was not fully accounted for by the CA process (Fig. 5g). Incorporation of Pb-loss-perturbed U–Pb dates when modeling f(t) would likely produce an underestimate of the true magnitude of the apparent Pb loss.
5.2 Distributions of apparent Pb loss
What distribution type(s) characterize apparent Pb loss in natural samples? Our results strongly suggest that at least 9 of the 10 samples modeled have at least some systematic negative offset in that cannot be explained by random measurement uncertainties alone. This is because the K–S and Kuiper statistical tests are unable to reject the null hypothesis for many of the apparent Pb-loss-distribution types considered (Table A1 in Sharman and Malkowski, 2023). For example, only the no-Pb-loss scenario produced a p value < 0.05 for sample MM20-EC-109, suggesting that any of the other modeled distributions of apparent Pb loss may be statistically plausible for this sample. These results suggest that we cannot confidently distinguish between discrete (constant or isolated) or continuous distributions of apparent Pb loss in the datasets modeled. Except for ELM18DVTC-10, which has 144 non-CA LA-ICP-MS analyses, the samples we analyzed have relatively low numbers of analyses (between 17 and 68; average of 32) for a given sample and treatment category (non-CA or CA) (Table 1). We suspect that the collection of larger n datasets would allow a better resolution of which parameterizations of g(t) might be most appropriate.
Even if the specific distribution type(s) that characterizes g(t) cannot be uniquely identified, our analysis suggests two contrasting behaviors in apparent Pb loss (Fig. 6). We speculate that U–Pb dates that undergo a bulk shift (i.e., ) may reflect a population of zircon crystals with relatively homogenous characteristics (size, U content, etc.) that have all experienced a similar post-crystallization history. Correspondingly, the population of zircon that produces U–Pb dates with a highly asymmetric distribution of age offset (i.e., ) may reflect heterogeneity between crystals, with variable characteristics. For example, Pb loss is thought to be promoted in small zircon crystals and in zircon with elevated U (Ashwal et al., 1999; Gehrels et al., 2020), and thus distributions of particle size and/or trace element geochemistry may influence asymmetric patterns in g(t). Collection of size measurements and trace element concentrations from zircon, in addition to measurement of the U–Pb date (e.g., Watts et al., 2016), would likely help evaluate hypotheses about the underlying factors that influence apparent Pb-loss distributions. Furthermore, given the relatively small number of samples modeled in this study, we suggest that there is a need for more samples to undergo paired non-CA and CA characterization to improve our understanding of the range of behaviors that may be typical. For example, it is presently unclear whether it is more common for samples to have their U–Pb dates bulk shifted (e.g., samples 029-5, 059-1, CTU, and DG 026) versus having relatively few U–Pb dates highly offset (e.g., samples MM20-EC-109 and ELM18DVTC-10; Fig. 5).
Why do some samples experience more overall apparent Pb loss than others? Although we anticipated that apparent Pb loss would be greater for samples with greater radiation damage due to U and Th decay, our analysis shows no clear trend by alpha dose (Table 1). However, we acknowledge that the relatively high degree of apparent Pb loss modeled in the youngest sample, ELM18DVTC-10, may be a consequence of contamination from overlying units instead of true Pb loss (Miller et al., 2022). Even the three samples from the same Eocene caldera system (CTU, RCP, and SRF) showed contrasting amounts of apparent Pb loss (W2 ranges from 2.9 to 4.2; Table 1), as noted by Watts et al. (2016). Characterizing the overall magnitude of apparent Pb loss in a wider range of samples would likely help elucidate predictive factors (if any).
5.3 Importance of quantifying the distribution of apparent Pb loss in in situ U–Pb geochronology
The overwhelming majority of published in situ U–Pb dates from zircon, minimally > 600 000 and likely in the millions of analyses (Puetz et al., 2021), have not been treated using CA. In contrast, CA is now practiced routinely in the ID-TIMS community, which has contributed to growing precision and accuracy over the past 2 decades (Schoene, 2013). However, the strategy of mitigating Pb loss through avoidance is perhaps less easily adopted to routine in situ U–Pb geochronology. For instance, there may be practical limitations with chemically abrading large numbers of zircon crystals, including the potential loss of certain age modes that would be detrimental to provenance analysis. We thus suggest that there is a pressing need to improve quantitative characterization of apparent Pb-loss distributions in non-CA in situ U–Pb datasets to aid in interpreting these datasets and to guide strategies for future data collection.
It is somewhat concerning that 9 of the 10 samples analyzed in this study exhibited statistically significant amounts of negative age offset from the estimated true crystallization age. Even a small age offset of a few percent, or cryptic Pb loss (Kryza et al., 2012; Watts et al., 2016), has potentially important repercussions for interpreting the age and rates of geologic events and processes. For example, there is a growing awareness in the detrital geochronological community that the youngest zircon U–Pb dates often skew unexpectedly young relative to the plausible crystallization age (e.g., Herriot et al., 2019; Gehrels et al., 2020; Schwartz et al., 2022). Presently, there is no consensus on the importance of post-depositional Pb loss on influencing depositional age interpretations (e.g., Herriott et al., 2019; Copeland, 2020; Schwartz et al., 2022). Sample MM20-EC-109 illustrates the risk well; we initially interpreted the young tail on the U–Pb date distribution to suggest a depositional age of ∼ 125 Ma, based on the youngest cluster of overlapping U–Pb dates. The youngest single analysis was a 60.5 ± 2.4 Ma rim on a 135.3 ± 3.0 Ma core, with the second-youngest analysis being a 79 ± 1.2 Ma date measured from the core of a zircon crystal, with the corresponding rim yielding an older 129.8 ± 3.6 Ma date (Table A2 in Sharman and Malkowski, 2023). Interpretation of the youngest single U–Pb date or dates as the depositional age of this sample would have produced a highly erroneous estimate, off by up to −58 % of the true eruption age of 144.50 ± 0.07 (2σ) Ma, as determined by CA-ID-TIMS. Because this ash is interbedded within a sequence of organic-rich marine mudstone in the Austral Basin of Argentina, the misinterpretation in this case could have led to an erroneous depositional age model, with implications for interpreting the paleoclimatic and geodynamic context of these sediments.
Although modeling detrital samples was outside of the scope of this study, we believe that our results bear upon maximum depositional age analysis. The tendency for the youngest U–Pb dates in a sample to be affected by Pb loss (or other similar process) complicates even conservative estimates of the maximum depositional age (Dickinson and Gehrels, 2009; Coutts et al., 2019; Schwartz et al., 2022). If apparent Pb loss follows a continuous distribution (e.g., Fig. 3d), then it is ill-advised to assume that outlying U–Pb dates may be rejected, while the rest are considered unperturbed (see also discussion in Copeland, 2020). Even an interpretation based on the peak age probability of the youngest age mode is likely to be too young because the process of convolution produces a young shift in the mode of the distribution, in addition to creating a young tail (Fig. 3d and Fig. A1 in Sharman and Malkowski, 2023). Because existing methods of calculating the maximum depositional age (Dickinson and Gehrels, 2009; Coutts et al., 2019; Vermeesch, 2021) do not account for systematic negative age offsets, our analysis suggests that there is a higher probability for erroneous estimates of the maximum depositional age if (1) there are a large number of zircon crystals with crystallization ages that are close to the age of deposition, (2) the overall number of measured U–Pb analyses is very high, and/or (3) the magnitude of apparent Pb loss is high. In addition, a heavy-tailed distribution of apparent Pb loss (i.e., ) will result in a greater probability of finding extremely offset values.
This study presents a mathematical framework for quantifying the distribution of apparent Pb loss on U–Pb date distributions, which could include true loss of radiogenic Pb or other processes that also produce a systematically negative age offset. We show that a Pb-loss-perturbed U–Pb date distribution from a set of zircon crystals with a shared crystallization age can be represented by the convolution of a Gaussian distribution that reflects measurement uncertainty in , with a distribution that characterizes Pb loss, g(t). Our approach relies on analyzing differences between the untreated distribution from in situ U–Pb geochronology (i.e., LA-ICP-MS or SIMS) and an independent estimate of the true crystallization age, which could include U–Pb dates from a thermally annealed and chemically abraded aliquot of the same sample or from another geochronometer (e.g., ). We suggest that the first and second Wasserstein distances (W1 and W2) of the apparent Pb-loss distribution can be used to quantify the total degree of apparent Pb loss that a set of zircon analyses has undergone, with maximum possible W1 and W2 values of 100.
We apply this modeling framework to 10 igneous samples (Miocene to Carboniferous) analyzed with LA-ICP-MS or SIMS. All but one of the samples showed a high probability that the untreated U–Pb date distribution has been perturbed by Pb loss or other equivalent process. Although our analysis shows that multiple parameterizations of g(t) can achieve statistically acceptable fits (i.e., K–S or Kuiper p value > 0.05), we suggest that the logit–normal distribution may be a reasonable choice for exploratory modeling of apparent Pb-loss distributions. However, we caution that the number of analyses in the samples we analyzed was generally low (17–144; average of 39); future efforts to characterize g(t) may be promoted by collection of larger n datasets and through development of nonparametric methods of estimating g(t). Furthermore, our estimates of g(t) should be viewed as minimum estimates of the true amount of Pb lost, as we assumed present-day Pb loss in our analysis. These caveats aside, we noted two behaviors of apparent Pb loss: samples with a bulk shift in U–Pb date distributions () and samples where most analyses had very little offset but fewer had much larger offsets (). The overall magnitude of decrease was also found to be variable, with median values varying from −0.9 % to −6.4 %.
Given the widespread application of in situ U–Pb geochronology of untreated zircon across many disciplines of geosciences, improved characterization of both the distribution type(s) and magnitude of apparent Pb loss is warranted, particularly for Phanerozoic zircon, where cryptic Pb loss is difficult to identify. We highlight a need for increased sampling and high-n characterization of paired non-CA and CA in situ U–Pb datasets. In addition, we recommend simultaneous collection of parameters such as zircon size and trace elemental concentrations to aid in future efforts to understand the mechanisms of negative age offsets. Ultimately, we anticipate that improved characterization of the magnitude of apparent Pb loss will aid in interpreting non-CA in situ U–Pb datasets and guide strategies for future data collection.
Code used in this research is available on GitHub (https://github.com/grsharman/Pb_loss_modeling, last access: 9 January 2024) with v2.0.0 archived under https://doi.org/10.5281/zenodo.8302313 (Sharman, 2023).
Data are archived under https://doi.org/10.5281/zenodo.8302521 (Sharman and Malkowski, 2023). Appendix A in Sharman and Malkowski (2023) provides a description of exploratory modeling of different parameterizations of g(t). Figure A1 in Sharman and Malkowski (2023) includes examples of eight continuous distribution types not explored in the main text. Table A1 and Fig. A2 in Sharman and Malkowski (2023) include summaries of all model results. Table A2 in Sharman and Malkowski (2023) presents a summary of model fit for each sample and distribution type considered. Tables A3 and A4 in Sharman and Malkowski (2023) provide U–Pb analytical results for sample MM20-EC-109 from the University of Arizona LaserChron Center (LA-ICP-MS) and Boise State University Isotope Geology Laboratory (CA-ID-TIMS), respectively. Figure A3 in Sharman and Malkowski (2023) includes CL images from the University of Arizona LaserChron Center. Video S1 in Sharman and Malkowski (2023) provides an example of convolution. Video S2 in Sharman and Malkowski (2023) presents an exploration of the parameter space for the logit–normal distribution.
Video S1 is available at https://doi.org/10.5281/zenodo.8302521 (Sharman and Malkowski, 2023). This animation provides an illustration of how a Gaussian distribution of U–Pb dates (solid; blue line), f(t), may be perturbed by logit–normal Pb loss, g(t) (solid; red line). The Pb-loss distribution is first reflected about the y axis and then iteratively shifted by small values of t, g(t−τ) (dashed; red line). The convolution of f(t) and g(t) at any given value of t equals the summed area underneath the product of f(t) and g(t−τ). Video S2 is also available at https://doi.org/10.5281/zenodo.8302521 (Sharman and Malkowski, 2023) and illustrates how the logit–normal distribution varies with respect to its two parameters μ and σ. Note that we have rescaled the x axis of the logit–normal distribution such that .
GRS and MAM co-designed the study. GRS developed the code. MAM produced the U–Pb data from sample MM20-EC-109. GRS and MAM wrote the paper.
The contact author has declared that neither of the authors has any competing interests.
Publisher’s note: Copernicus Publications remains neutral with regard to jurisdictional claims made in the text, published maps, institutional affiliations, or any other geographical representation in this paper. While Copernicus Publications makes every effort to include appropriate place names, the final responsibility lies with the authors.
That authors thank Mark Pecha, George Gehrels, and staff at the University of Arizona LaserChron (supported by the National Science Foundation Division of Earth Sciences awards; grant nos. 1649254 and 2050246), as well as Jim Crowley and Mark Schmitz at the Isotope Geology Laboratory at Boise State University. We thank Kevin Befus for coding advice. This work benefitted from discussions with Alex Lipp and Greg Dumond. Comments and suggestions from two anonymous reviewers and associate editor Pieter Vermeesch resulted in substantial improvements to the paper.
The project is supported in part by a National Science Foundation Division of Earth Sciences (grant no. 2243685), an American Chemical Society Petroleum Research Fund award (grant no. 66408-DNI8), and the industrial affiliate members of the Detrital Geochronological Laboratory.
This paper was edited by Pieter Vermeesch and reviewed by two anonymous referees.
Aitchison, J. and Bacon-Shone, J.: Convex linear combinations of compositions, Biometrika, 86, 351–364, https://www.jstor.org/stable/2673517 (last access: 19 August 2023), 1999.
Aitchison, J. and Shen, S. M.: Logistic-normal distributions: Some properties and uses, Biometrika, 67, 261–272, https://www.jstor.org/stable/2335470 (last access: 19 August 2023), 1980.
Allen, C. M. and Campbell, I. H.: Identification and elimination of a matrix-induced systematic error in LA–ICP–MS dating of zircon, Chem. Geol., 332, 157–165, 2012.
Andersen, T.: Correction of common lead in U–Pb analyses that do not report 204Pb, Chem. Geol., 192, 59–79, 2002.
Andersen, T. and Elburg, M. A.: Open-system behaviour of detrital zircon during weathering: an example from the Palaeoproterozoic Pretoria Group, South Africa, Geol. Mag., 159, 561–576, 2022.
Andersen, T., Elburg, M. A. and Magwaza, B. N.: Sources of bias in detrital zircon geochronology: Discordance, concealed lead loss and common lead correction, Earth-Sci. Rev., 197, 102899, https://doi.org/10.1016/j.earscirev.2019.102899, 2019.
Ashwal, L. D., Tucker, R. D., and Zinner, E. K.: Slow cooling of deep crustal granulites and Pb-loss in zircon, Geochim. Cosmochim. Ac., 63, 2839–2851, 1999.
Balan, E., Neuville, D. R., Trocellier, P., Fritsch, E., Muller, J. P., and Calas, G.: Metamictization and chemical durability of detrital zircon, Am. Mineral., 86, 1025–1033, 2001.
Black, L. P.: Recent Pb loss in zircon: A natural or laboratory induced phenomenon?, Chem. Geol. Isotope Geoscience section, 65, 25–33, 1987.
Blackburn, T., Bowring, S. A., Schoene, B., Mahan, K., and Dudas, F.: U–Pb thermochronology: creating a temporal record of lithosphere thermal evolution, Contrib. Mineral. Petr., 162, 479–500, https://doi.org/10.1007/s00410-011-0607-6, 2011.
Bowring, S. A. and Schmitz, M. D.: High-precision U–Pb zircon geochronology and the stratigraphic record, Rev. Mineral. Geochem., 53, 305–326, 2003.
Burgess, S. D., Bowring, S., and Shen, S. Z.: High-precision timeline for Earth's most severe extinction, P. Natl. Acad. Sci. USA, 111, 3316–3321, 2014.
Cherniak, D. J. and Watson, E. B.: Pb diffusion in zircon, Chem. Geol., 172, 5–24, 2001.
Copeland, P.: On the use of geochronology of detrital grains in determining the time of deposition of clastic sedimentary strata, Basin Res., 32, 1532–1546, 2020.
Compston, W.: Interpretations of SHRIMP and isotope dilution zircon ages for the geological time-scale: I. The early Ordovician and late Cambrian, Mineral. Mag., 64, 43–57, 2000a.
Compston, W.: Interpretation of SHRIMP and isotope dilution zircon ages for the Palaeozoic time-scale: II. Silurian to Devonian, Mineral. Mag., 64, 1127–1171, 2000b.
Coutts, D. S., Matthews, W. A., and Hubbard, S. M.: Assessment of widely used methods to derive depositional ages from detrital zircon populations, Geosci. Front., 34, 1421–1435, 2019.
Crowley, Q. G., Heron, K., Riggs, N., Kamber, B., Chew, D., McConnell, B., and Benn, K.: Chemical abrasion applied to LA-ICP-MS U–Pb zircon, Geochronology, 4, 503–518, 2014.
Davis, D. W., Williams, I. S., and Krogh, T. E.: Historical development of zircon geochronology, Rev. Mineral. Geochem., 53, 145–181, https://doi.org/10.2113/0530145, 2003.
Dickinson, W. R. and Gehrels, G. E.: Use of U–Pb ages of detrital zircons to infer maximum depositional ages of strata: A test against a Colorado Plateau Mesozoic database, Earth Planet. Sc. Lett., 288, 115–125, 2009.
Froude, D. O., Ireland, T. R., Kinny, P. D., Williams, I. S., Compston, W., Williams, I. R., and Myers, J. S.: Ion microprobe identification of 4,100–4,200 Myr-old terrestrial zircons, Nature, 304, 616–618, 1983.
Geisler, T., Pidgeon, R. T., Van Bronswijk, W., and Kurtz, R.: Transport of uranium, thorium, and lead in metamict zircon under low-temperature hydrothermal conditions, Chem. Geol., 191, 141–154, 2002.
Geisler, T., Pidgeon, R. T., Kurtz, R., van Bronswijk, W., and Schleicher, H.: Experimental hydrothermal alteration of partially metamict zircon, Am. Mineral., 88, 1496–1513, 2003.
Gehrels, G. E.: Detrital Zircon U–Pb Geochronology Applied to Tectonics, Annu. Rev. Earth Pl. Sc., 42, 127–149, 2014.
Gehrels, G., Giesler, D., Olsen, P., Kent, D., Marsh, A., Parker, W., Rasmussen, C., Mundil, R., Irmis, R., Geissman, J., and Lepre, C.: LA-ICPMS U–Pb geochronology of detrital zircon grains from the Coconino, Moenkopi, and Chinle formations in the Petrified Forest National Park (Arizona), Geochronology, 2, 257–282, https://doi.org/10.5194/gchron-2-257-2020, 2020.
Gradstein, F. M., Ogg, J. G., Smith, A. G., Bleeker, W., and Lourens, L. J.: A new Geologic Time Scale, with special reference to Precambrian and Neogene, Episodes, 27, 83–100, 2004.
Grushka, E.: Characterization of Exponentially Modified Gaussian Peaks in Chromatography, Anal. Chem., 44, 1733–1738, 1972.
Herriott, T. M., Crowley, J. L., Schmitz, M. D., Wartes, M. A., and Gillis, R. J.: Exploring the law of detrital zircon: LA-ICP-MS and CA-TIMS geochronology of Jurassic forearc strata, Cook Inlet, Alaska, USA, Geology, 47, 1044–1048, 2019.
Howard, B., Sharman, G., Crowley, J. L., and Wersan, E. R.: The instrumentation dilemma: A comparison of paired LA-ICP-MS and ID-TIMS U–Pb dates from zircon, Geological Society of America Abstracts with Programs, 54, https://doi.org/10.1130/abs/2022AM-381174, 2022.
Ireland, T. R. and Williams, I. S.: Considerations in zircon geochronology by SIMS, Rev. Mineral. Geochem., 53, 215–241, 2003.
Johnstone, S. A., Schwartz, T. M., and Holm-Denoma, C. S.: A Stratigraphic Approach to Inferring Depositional Ages From Detrital Geochronology Data, Front. Earth Sci., 7, 57, https://doi.org/10.3389/feart.2019.00057, 2019.
Kaufmann, B.: Calibrating the Devonian Time Scale: A synthesis of U–Pb ID-TIMS ages and conodont stratigraphy, Earth-Sci. Rev., 76, 175–190, 2006.
Kirkland, C. L., Abello, F., Danišík, M., Gardiner, N. J., and Spencer, C.: Mapping temporal and spatial patterns of zircon U–Pb disturbance: A Yilgarn Craton case study, Gondwana Res., 52, 39–47, https://doi.org/10.1016/j.gr.2017.08.004, 2017.
Kirkland, C. L., Barnham, M., and Danišík, M.: Find a match with triple-dating: Antarctic sub-ice zircon detritus on the modern shore of Western Australia, Earth Planet. Sc. Lett., 531, 115953, https://doi.org/10.1016/j.epsl.2019.115953, 2020.
Kröner, A., Jaeckel, P., and Williams, I. S.: Pb-loss patterns in zircons from a high-grade metamorphic terrain as revealed by different dating methods: U–Pb and Pb-Pb ages for igneous and metamorphic zircons from northern Sri Lanka, Precambrian Res., 66, 151–181, 1994.
Kryza, R., Crowley, Q. G., Larionov, A., Pin, C., Oberc-Dziedzic, T., and Mochnacka, K.: Chemical abrasion applied to SHRIMP zircon geochronology: An example from the Variscan Karkonosze Granite (Sudetes, SW Poland), Gondwana Res., 21, 757–767, 2012.
Lipp, A. G. and Vermeesch, P.: Short communication: The Wasserstein distance as a dissimilarity metric for comparing detrital age spectra and other geological distributions, Geochronology, 5, 263–270, https://doi.org/10.5194/gchron-5-263-2023, 2023.
Marsellos, A. E. and Garver, J. I.: Radiation damage and uranium concentration in zircon as assessed by Raman spectroscopy and neutron irradiation, Am. Mineral., 95, 1192–1201, 2010.
Mattinson, J. M.: Zircon U–Pb chemical abrasion (“CA-TIMS”) method: Combined annealing and multi-step partial dissolution analysis for improved precision and accuracy of zircon ages, Chem. Geol., 220, 47–66, 2005.
Mead, R.: A generalized logit-normal distribution, Biometrics, 21, 721–732, https://www.jstor.org/stable/2528553 (last access: 19 August 2023), 1965.
Mezger, K. and Krogstad, J. E.: Interpretation of discordant U–Pb zircon ages: An evaluation, J. Metamorph. Geol., 15, 127–140, 1997.
Miller, J. S., Matzel, J. E. P., Miller, C. F., Burgess, S. D., and Miller, R. B.: Zircon growth and recycling during the assembly of large, composite arc plutons, J. Volcanol. Geoth. Res., 167, 282–299, 2007.
Miller, E. L., Raftrey, M. E., and Lund Snee, J.-E.: Downhill from Austin and Ely to Las Vegas: U–Pb detrital zircon suites from the Eocene–Oligocene Titus Canyon Formation and associated strata, Death Valley, California, Geol. Soc. Am. Spec. Pap., 555, 359–378, 2022.
Morris, G. A., Kirkland, C. L., and Pease, V.: Orogenic paleofluid flow recorded by discordant detrital zircons in the Caledonian foreland basin of northern Greenland, Lithosphere, 7, 138–143, 2015.
Nasdala, L., Hanchar, J. M., Kronz, A., and Whitehouse, M. J.: Long-term stability of alpha particle damage in natural zircon, Chem. Geol., 220, 83–103, 2005.
Orejana, D., Merino Martínez, E., Villaseca, C., and Andersen, T.: Ediacaran-Cambrian paleogeography and geodynamic setting of the Central Iberian Zone: Constraints from coupled U–Pb-Hf isotopes of detrital zircons, Precambrian Res., 261, 234–251, 2015.
Pidgeon, R. T., O'Neil, J. R., and Silver, L. T.: Uranium and lead isotopic stability in metamict zircon under experimental hydrothermal conditions, Science, 154, 1538–1540, https://www.jstor.org/stable/1720453 (last access: 8 November 2022), 1966.
Pidgeon, R. T., Nemchin, A. A., and Whitehouse, M. J.: The effect of weathering on U-Th-Pb and oxygen isotope systems of ancient zircons from the Jack Hills, Western Australia, Geochim. Cosmochim. Ac., 197, 142–166, 2017.
Pidgeon, R. T., Nemchin, A. A., Roberts, M. P., Whitehouse, M. J., and Bellucci, J. J.: The accumulation of non-formula elements in zircons during weathering: Ancient zircons from the Jack Hills, Western Australia, Chem. Geol., 530, 119310, https://doi.org/10.1016/j.chemgeo.2019.119310, 2019.
Press, W. H., Teukolsky, S. A., Vetterling, W. T., and Flannery, B. P.: Numerical Recipes: The Art of Scientific Computing, 3rd Edn., Cambridge University Press, 1235 pp., ISBN 978-0521880688, 2007.
Puetz, S. J., Spencer, C. J., and Ganade, C. E.: Analyses from a validated global U–Pb detrital zircon database: Enhanced methods for filtering discordant U–Pb zircon analyses and optimizing crystallization age estimates, Earth-Sci. Rev., 220, 103745, https://doi.org/10.1016/j.earscirev.2021.103745, 2021.
Pullen, A., Ibáñez-Mejía, M., Gehrels, G. E., Ibáñez-Mejía, J. C., and Pecha, M.: What happens when n=1000? Creating large-n geochronological datasets with LA-ICP-MS for geologic investigations, J. Anal. Atom. Spectrom., 29, 971–980, 2014.
Reimink, J. R., Davies, J. H. F. L., Waldron, J. W. F., and Rojas, X.: Dealing with discordance: A novel approach for analysing U–Pb detrital zircon datasets, J. Geol. Soc. Lond., 173, 577–585, 2016.
Rioux, M., Bowring, S., Kelemen, P., Gordon, S., Dudás, F., and Miller, R.: Rapid crustal accretion and magma assimilation in the Oman-U.A.E. ophiolite: High precision U–Pb zircon geochronology of the gabbroic crust, J. Geophys. Res.-Sol. Ea., 117, B07201, https://doi.org/10.1029/2012JB009273, 2012.
Rossignol, C., Hallot, E., Bourquin, S., Poujol, M., Jolivet, M., Pellenard, P., Ducassou, C., Nalpas, T., Heilbronn, G., Yu, J., and Dabard, M. P.: Using volcaniclastic rocks to constrain sedimentation ages: To what extent are volcanism and sedimentation synchronous?, Sediment. Geol., 381, 46–64, 2019.
Ruiz, M., Schaltegger, U., Gaynor, S. P., Chiaradia, M., Abrecht, J., Gisler, C., Giovanoli, F., and Wiederkehr, M.: Reassessing the intrusive tempo and magma genesis of the late Variscan Aar batholith: U–Pb geochronology, trace element and initial Hf isotope composition of zircon, Swiss J. Geosci., 115, 1–24, 2022.
Saylor, J. E. and Sundell, K. E.: Quantifying comparison of large detrital geochronology data sets, Geosphere, 12, 203–220, https://doi.org/10.1130/GES01237.1, 2016.
Schoene, B.: U-Th-Pb Geochronology, Treatise on Geochemistry, edited by: Turekian, K. K. and Holland, H. D., 2nd Edn., Elsevier, 341–378, https://doi.org/10.1016/B978-0-08-095975-7.00310-7, 2013.
Schoene, B., Guex, J., Bartolini, A., Schaltegger, U., and Blackburn, T. J.: Correlating the end-Triassic mass extinction and flood basalt volcanism at the 100 ka level, Geology, 38, 387–390, https://doi.org/10.1130/G30683.1, 2010.
Schwartz, T. M., Souders, A. K., Lundstern, J.-E., Gilmer, A. K., and Thompson, R. A.: Revised age and regional correlations of Cenozoic strata on Bat Mountain, Death Valley region, California, USA, from zircon U–Pb geochronology of sandstones and ash-fall tuffs, Geosphere, 19, 235–257, 2022.
Sharman, G. R.: Pb_loss_modeling (GitHub), Zenodo [code], https://doi.org/10.5281/zenodo.8302313, 2023.
Sharman, G. R. and Malkowski, M. A.: Supplemental materials for “Modeling apparent Pb loss in zircon U-Pb geochronology”, Zenodo [data set], https://doi.org/10.5281/zenodo.8302521, 2023.
Sharman, G. R., Covault, J. A., Flaig, P. P., Dunn, R., Fussee-Durham, P., Larson, T. E., Shanahan, T. M., Dubois, K., Shaw, J. B., Crowley, J. L., and Shaulis, B.: Coastal reponse to global warming during the Paleocene-Eocene Thermal Maximum, Palaeogeogr. Palaeocl., 625, 111664, https://doi.org/10.1016/j.palaeo.2023.111664, 2023.
Silver, L. T. and Deutsch, S.: Uranium-Lead Isotopic Variations in Zircons: A Case Study, J. Geol., 71, 721–758, 1963.
Snow, J. K. and Lux, D. R.: Tectono-sequence stratigraphy of Tertiary rocks in the Cottonwood Mountains and northern Death Valley area, California and Nevada, Geol. Soc. Am. Spec. Pap., 333, 17–64, 1999.
Solari, L. A., Ortega-Obregón, C., and Bernal, J. P.: U–Pb zircon geochronology by LAICPMS combined with thermal annealing: Achievements in precision and accuracy on dating standard and unknown samples, Chem. Geol., 414, 109–123, https://doi.org/10.1016/j.chemgeo.2015.09.008, 2015.
Spencer, C. J., Kirkland, C. L., and Taylor, R. J. M.: Strategies towards statistically robust interpretations of in situ U–Pb zircon geochronology, Geosci. Front., 7, 581–589, 2016.
Stern, T. W., Goldich, S. S., and Newell, M. F.: Effects of weathering on the U–Pb ages of zircon from the Morton Gneiss, Minnesota, Earth Planet. Sc. Lett., 1, 369–371, 1966.
Sundell, K. E., Gehrels, G. E., and Pecha, M. E.: Rapid U–Pb Geochronology by Laser Ablation Multi-Collector ICP-MS, Geostand. Geoanal. Res., 45, 37–57, 2021.
Tilton, G. R., Patterson, C., Brown, H., Ingham, M., Hayden, R., Hess, D., and Larsen, E. J.: Isotopic composition and distribution of lead, uranium, and thorium in a Precambrian granite, B. Geol. Soc. Am., 66, 1131–1148, 1955.
Ver Hoeve, T. J., Scoates, J. S., Wall, C. J., Weis, D., and Amini, M.: Evaluating downhole fractionation corrections in LA-ICP-MS U–Pb zircon geochronology, Chem. Geol., 483, 201–217, 2018.
Vermeesch, P.: Dissimilarity measures in detrital geochronology, Earth-Sci. Rev., 178, 310–321, 2018a.
Vermeesch, P.: Statistical models for point-counting data, Earth-Sci. Rev., 501, 112–118, 2018b.
Vermeesch, P.: Maximum depositional age estimation revisited, Geosci. Front., 12, 843–850, 2021.
von Quadt, A., Gallhofer, D., Guillong, M., Peytcheva, I., Waelle, M., and Sakata, S.: U–Pb dating of CA/non-CA treated zircons obtained by LA-ICP-MS and CA-TIMS techniques: Impact for their geological interpretation, J. Anal. Atom. Spectrom., 29, 1618–1629, 2014.
Watts, K. E., Coble, M. A., Vazquez, J. A., Henry, C. D., Colgan, J. P., and John, D. A.: Chemical abrasion-SIMS (CA-SIMS) U–Pb dating of zircon from the late Eocene Caetano caldera, Nevada, Chem. Geol., 439, 139–151, 2016.
Wetherill, G. W.: Discordant Uranium-Lead Ages, 1, T. Am. Geophys. Un., 37, 320–326, 1956.
Willner, A. P., Sindern, S., Metzger, R., Ermolaeva, T., Kramm, U., Puchkov, V., and Kronz, A.: Typology and single grain ages of detrital zircons from Proterozoic sandstones in the SW Urals (Russia): Early time marks at the eastern margin of Baltica, Precambrian Res., 124, 1–20, 2003.
Zeh, A., Wilson, A. H., and Ovtcharova, M.: Source and age of upper Transvaal Supergroup, South Africa: Age-Hf isotope record of zircons in Magaliesberg quartzite and Dullstroom lava, and implications for Paleoproterozoic (2.5–2.0 Ga) continent reconstruction, Precambrian Res., 278, 1–21, 2016.