the Creative Commons Attribution 4.0 License.
the Creative Commons Attribution 4.0 License.
 | 10 Mar 2025
A direct comparison of single-grain and multi-grain aliquot luminescence dating of feldspars from colluvial deposits in KwaZulu-Natal, South Africa
Guillaume Guérin
Kristina J. Thomsen
Mariana Sontag-González
Matthias Blessing
Greg A. Botha
Max Hellers
Gunther Möller
Andreas Peffeköver
Christian Sommer
Anja Zander
Manuel Will
The erosional landscape of the Jojosi dongas in KwaZulu-Natal, South Africa, exposes accretionary slope deposits that preserve important geological and archaeological information. This landscape was occupied by modern humans during the Stone Age for many thousands of years, as evidenced by the presence of numerous stone artefacts on the surface and interbedded within at least three phases of gully cut-and-fill deposits. A contextualisation of the artefacts and their role for human evolution in southern Africa, along with developing an understanding of the environmental conditions that shaped this inhabited landscape, is only made possible by establishing a robust chronological framework.
Here, we use luminescence dating of feldspars to constrain the geochronological framework for the sequence of accretionary hillslope deposition at Jojosi at three sampling locations. Measurements of feldspar single grains show low luminescence sensitivity of the individual grains and a variable proportion of grains in saturation. Summing the luminescence signal of individual grains and creating synthetic aliquots enables us to study the effect of signal averaging on the luminescence sensitivity, signal saturation, and dose distributions. We then compare the results from individual grain measurements and synthetic aliquots to true multi-grain aliquots. To allow a quantification of the results, we apply four different dose models, including the Central Age Model (CAM), the Average Dose Model (ADM), BayLum, and a standardised growth curve (SGC) approach, using an averaged value interpolated onto the SGC. Doses calculated for the different samples range from ∼ 80 to ∼ 800 Gy and contain 6 % to 67 % saturated grains. We evaluate the performance of the different dose models over this range in equivalent doses and relative number of saturated grains.
On average, we find good agreement between the results obtained using the different dose models but observe that samples with a large number of saturated grains impact the consistency of the result. Overall, all dose models and data sets give consistent results below a saturated grain threshold of ∼ 15 %, corresponding to a dose of ∼ 120 Gy in this study.
Finally, we favour BayLum for age calculations of the single-grain and multi-grain aliquot data sets, representing the opportunity to refine the chronology by including stratigraphic information in the age calculations. We are able to establish a chronology for the three sampled sections within the Jojosi dongas, constraining erosional and depositional processes from ∼ 100 to ∼ 700 ka, and human occupation of the area spanning from early marine isotope stage (MIS) 5 to late MIS 6.
- Article
(4973 KB) - Full-text XML
-
Supplement
(7927 KB) - BibTeX
- EndNote


Optically stimulated luminescence (OSL) dating is a widely used geochronological technique to determine the last exposure to sunlight of sediment prior to its deposition and burial, and it is thus able to provide chronologies in archaeological and geological contexts (Huntley et al., 1985; Murray et al., 2021). We applied luminescence dating to stratified sheetwash hillslope sediments exposed by “donga” incision, which is an isiZulu name for gully erosion features in South Africa. Due to their widespread occurrence in central KwaZulu-Natal and deep incision of the hillslope regolith mantle, dongas are of geological and archaeological interest within southern Africa (Poesen et al., 2003; Mararakanye and Le Roux, 2012; Olivier et al., 2023). The Jojosi dongas located north of Nqutu in northern central KwaZulu-Natal, South Africa (Fig. 1a, b), contain important geological and archaeological archives (Botha, 1996). The complex erosional landscape evolved through an accretionary succession of gully cut-and-fill deposits that likely reflects variation in landscape stability during the Late Pleistocene (Botha et al., 1994; Botha, 1996; Will et al., 2024; see Fig. 1c). The Jojosi catchment is dominated by distinctive dolerite-derived colluvium and interbedded palaeosols that have precluded direct correlation with the sequence of colluvial sedimentary units and palaeosols described from the Masotcheni Formation in the surrounding region (Botha et al., 1994; Botha, 1996). The temporal range of colluvial slope processes in the surrounding region has been constrained to the Late Pleistocene and Holocene using luminescence dating by Li (1992), Li and Wintle (1992), Clarke et al. (2003), Temme et al. (2008), Lyons et al. (2013), and Colarossi et al. (2020).
The presence of numerous stone artefacts on the bases and sidewalls of the gullies, along with rarer archaeological material interbedded within colluvial sediments and palaeosols exposed by the gully sidewalls, demonstrates the occupation of this landscape by humans during the Stone Age for many thousands of years (Will et al., 2024). The majority of the surface material and the stratified stone artefacts derive from the Middle Stone Age, the period during which Homo sapiens evolved on the African continent. Relating these stone tools to long-term hillslope processes, placing these occupations in the regional cultural stratigraphy and evaluating their relevance for human evolution in southern Africa is only possible within a robust chronometric framework. A detailed introduction to the geological and archaeological context of the Jojosi dongas is published elsewhere (see Will et al., 2024).
OSL dating is the ideal technique to constrain the depositional age of the hillslope deposits at Jojosi, as it directly dates the last exposure to sunlight of sheetwash-transported sediment prior to burial, along with stone artefacts created on the hillslope surface. Furthermore, by comparing different luminescence signals and dose distributions for different aliquot sizes, information can be gained on the nature of the sediment studied (e.g. Duller, 2008). Quartz and feldspar act as natural luminescence dosimeters and are ubiquitous in most environments, with quartz often being preferred over feldspar. Firstly, the quartz OSL signal resets faster during exposure to sunlight (e.g. Godfrey-Smith et al., 1988), and, secondly, feldspar luminescence signals exhibit an anomalous loss of signal over time (fading; Wintle, 1973; Spooner, 1994), which leads to age underestimation if uncorrected. However, methods exist which either allow correction for fading (Huntley and Lamothe, 2001; Huntley, 2006; Kars et al., 2008) or which circumvent fading (e.g. Thomsen et al., 2008; Li and Li, 2011). Despite its advantages, quartz OSL has limitations, i.e. earlier signal saturation limiting the age range (e.g. Wintle and Murray, 2006; Buylaert et al., 2012) or insufficient luminescence sensitivity (e.g. Rhodes, 2007; Duller, 2008; Mineli et al., 2021). Feldspar, on the contrary, has been shown to mostly exhibit bright luminescence signals (e.g. Baril and Huntley, 2003; Lamothe et al., 2012), allowing its use in various geological contexts (e.g. Gliganic et al., 2017; Sawakuchi et al., 2018) and for dating even very young (tens of years to a few hundreds of years) samples (e.g. Reimann et al., 2012; Riedesel et al., 2018; Buckland et al., 2019). Combining both quartz and feldspar luminescence enables cross-validation of the luminescence ages and provide additional insights into signal resetting (e.g. Murray et al., 2012; Colarossi et al., 2015, 2020). However, not all geological settings allow such an inter-method comparison, e.g. when the quartz OSL signal is saturated or when it has insufficient luminescence sensitivity.
Here at this study site, we explore a situation where, (i) due to source rock mineralogy (dolerite), quartz is scarce and (ii) where the lack of any other datable material, such as volcanic ashes, charcoal, bone, or teeth, prevents us from establishing a chronology independent of luminescence ages. We thus employ post-infrared infrared stimulated luminescence (post-IR IRSL) dating of feldspars to establish a chronology of the succession of colluvial deposits exposed at Jojosi. We use means provided by the feldspar post-IR IRSL measurements to enable an internal validation. (1) The post-IR50 IRSL225 protocol (Thomsen et al., 2008; Buylaert et al., 2009) measures two consecutive luminescence signals, i.e. the lower-temperature IRSL50 signal, and the elevated-temperature post-IR IRSL225 signal. These two signals recorded using a single protocol enable us to explore two luminescence signals with different properties: the IRSL50 signal is reset more rapidly by sunlight (e.g. Buylaert et al., 2012; Colarossi et al., 2015) but has also been shown to exhibit larger fading rates compared to the post-IR IRSL225 signal (e.g. Thomsen et al., 2008). We use this to our advantage to check for signs of incomplete resetting of the post-IR IRSL225 signal (cf. Buylaert et al., 2013). (2) The sediments at the Jojosi donga originate from erosion of weathered dolerite saprolite exposed upslope of the mid- to lower hillslope sediment deposits that have been subject to polyphase erosion and sedimentation after transport over short distances of ∼ 50 to ∼ 300 m prior to burial. Consequently, it is assumed that the luminescence signal in some of the sediment grains at Jojosi might not have been fully reset prior to deposition and burial. We thus decide to measure single grains of feldspar. Besides revealing the level of bleaching, the single-grain equivalent dose distributions might also inform us about potential influences from beta dose rate heterogeneity (e.g. Nathan et al., 2003; Jankowski and Jacobs, 2018; Smedley et al., 2020). However, due to the low sensitivity of the feldspar luminescence signal of our samples, it is necessary to measure many single-grain discs to obtain a sufficiently large data set for our single-grain analysis. Whilst this is time-consuming, it also enables us to directly compare equivalent dose distributions based on single grains to those obtained from synthetic aliquots created from these single grains using the Analyst software (see Duller, 2015). (3) Furthermore, we measure small multi-grain aliquots of all our samples to follow a more conventional approach. (4) Finally, we estimate the absorbed dose by applying four different dose models: (i) the Central Age Model (CAM; Galbraith et al., 1999), (ii) the Average Dose Model (ADM; Guérin et al., 2017), (iii) BayLum (Philippe et al., 2019), and (iv) a standardised growth curve (SGC; Roberts and Duller, 2004) approach utilising the LnTn method (Li et al., 2017, 2020) combined with the CAM. Comparing results obtained from applying these different dose models will inform us about (i) the impact of scatter in the dose distributions and (ii) the effect of saturated grains on burial dose and age calculations.
2.1 Sample collection and preparation
The samples were collected during field campaigns in 2022 and 2023 in the Jojosi donga system (Fig. 1) near Nqutu, KwaZulu-Natal, South Africa, within the framework of a combined geographical and archaeological study investigating Middle Stone Age open-air sites and the dynamics between changing landscapes and human activities (see Will et al., 2024). The samples were either collected in opaque luminescence sampling tubes by hammering the tubes into the sediment sections exposed in donga sidewalls or by carving out blocks from the exposed sections. Samples for dosimetry were taken within the sediment surrounding the sampling tubes, which account for variations in the sediment (i.e. grain size) which might influence the gamma dose rate delivered to the samples. Nine samples from three different sections were selected for this study to address sites of palaeo-gully cut-and-fill stratigraphic complexity (“Jojosi Triple Junction”) and specific sites of archaeological interest (“Jojosi 1”, “Jojosi 5”) (Fig. 1).
The samples were prepared under subdued red-light conditions in the Cologne Luminescence Laboratory (CLL; University of Cologne). Hydrochloric acid (HCl; 10 %) and hydrogen peroxide (H2O2; 10 %) were used to remove carbonates and organic material, respectively. Sodium oxalate (Na2C2O4; 0.01 N) was used to disperse the sediment particles. After chemical treatment, the samples were sieved to obtain the 200–250 µm grain size fraction. From this fraction, K-feldspar-rich extracts were separated using a sodium polytungstate solution at a density of 2.58 g cm−3.
For pre-tests, performed to determine the appropriate measurement protocol, multi-grain aliquots (4 mm in diameter) of the isolated K-feldspar fraction were mounted on stainless-steel discs using silicone oil. For single-grain equivalent dose determination, individual grains were brushed into 300 µm holes of single-grain discs. To obtain multi-grain equivalent dose distributions, feldspars were mounted as 1 mm multi-grain aliquots (1 mm diameter, resulting in approximately <30 grains on a single disc; Duller, 2008) on stainless-steel discs using silicone oil.
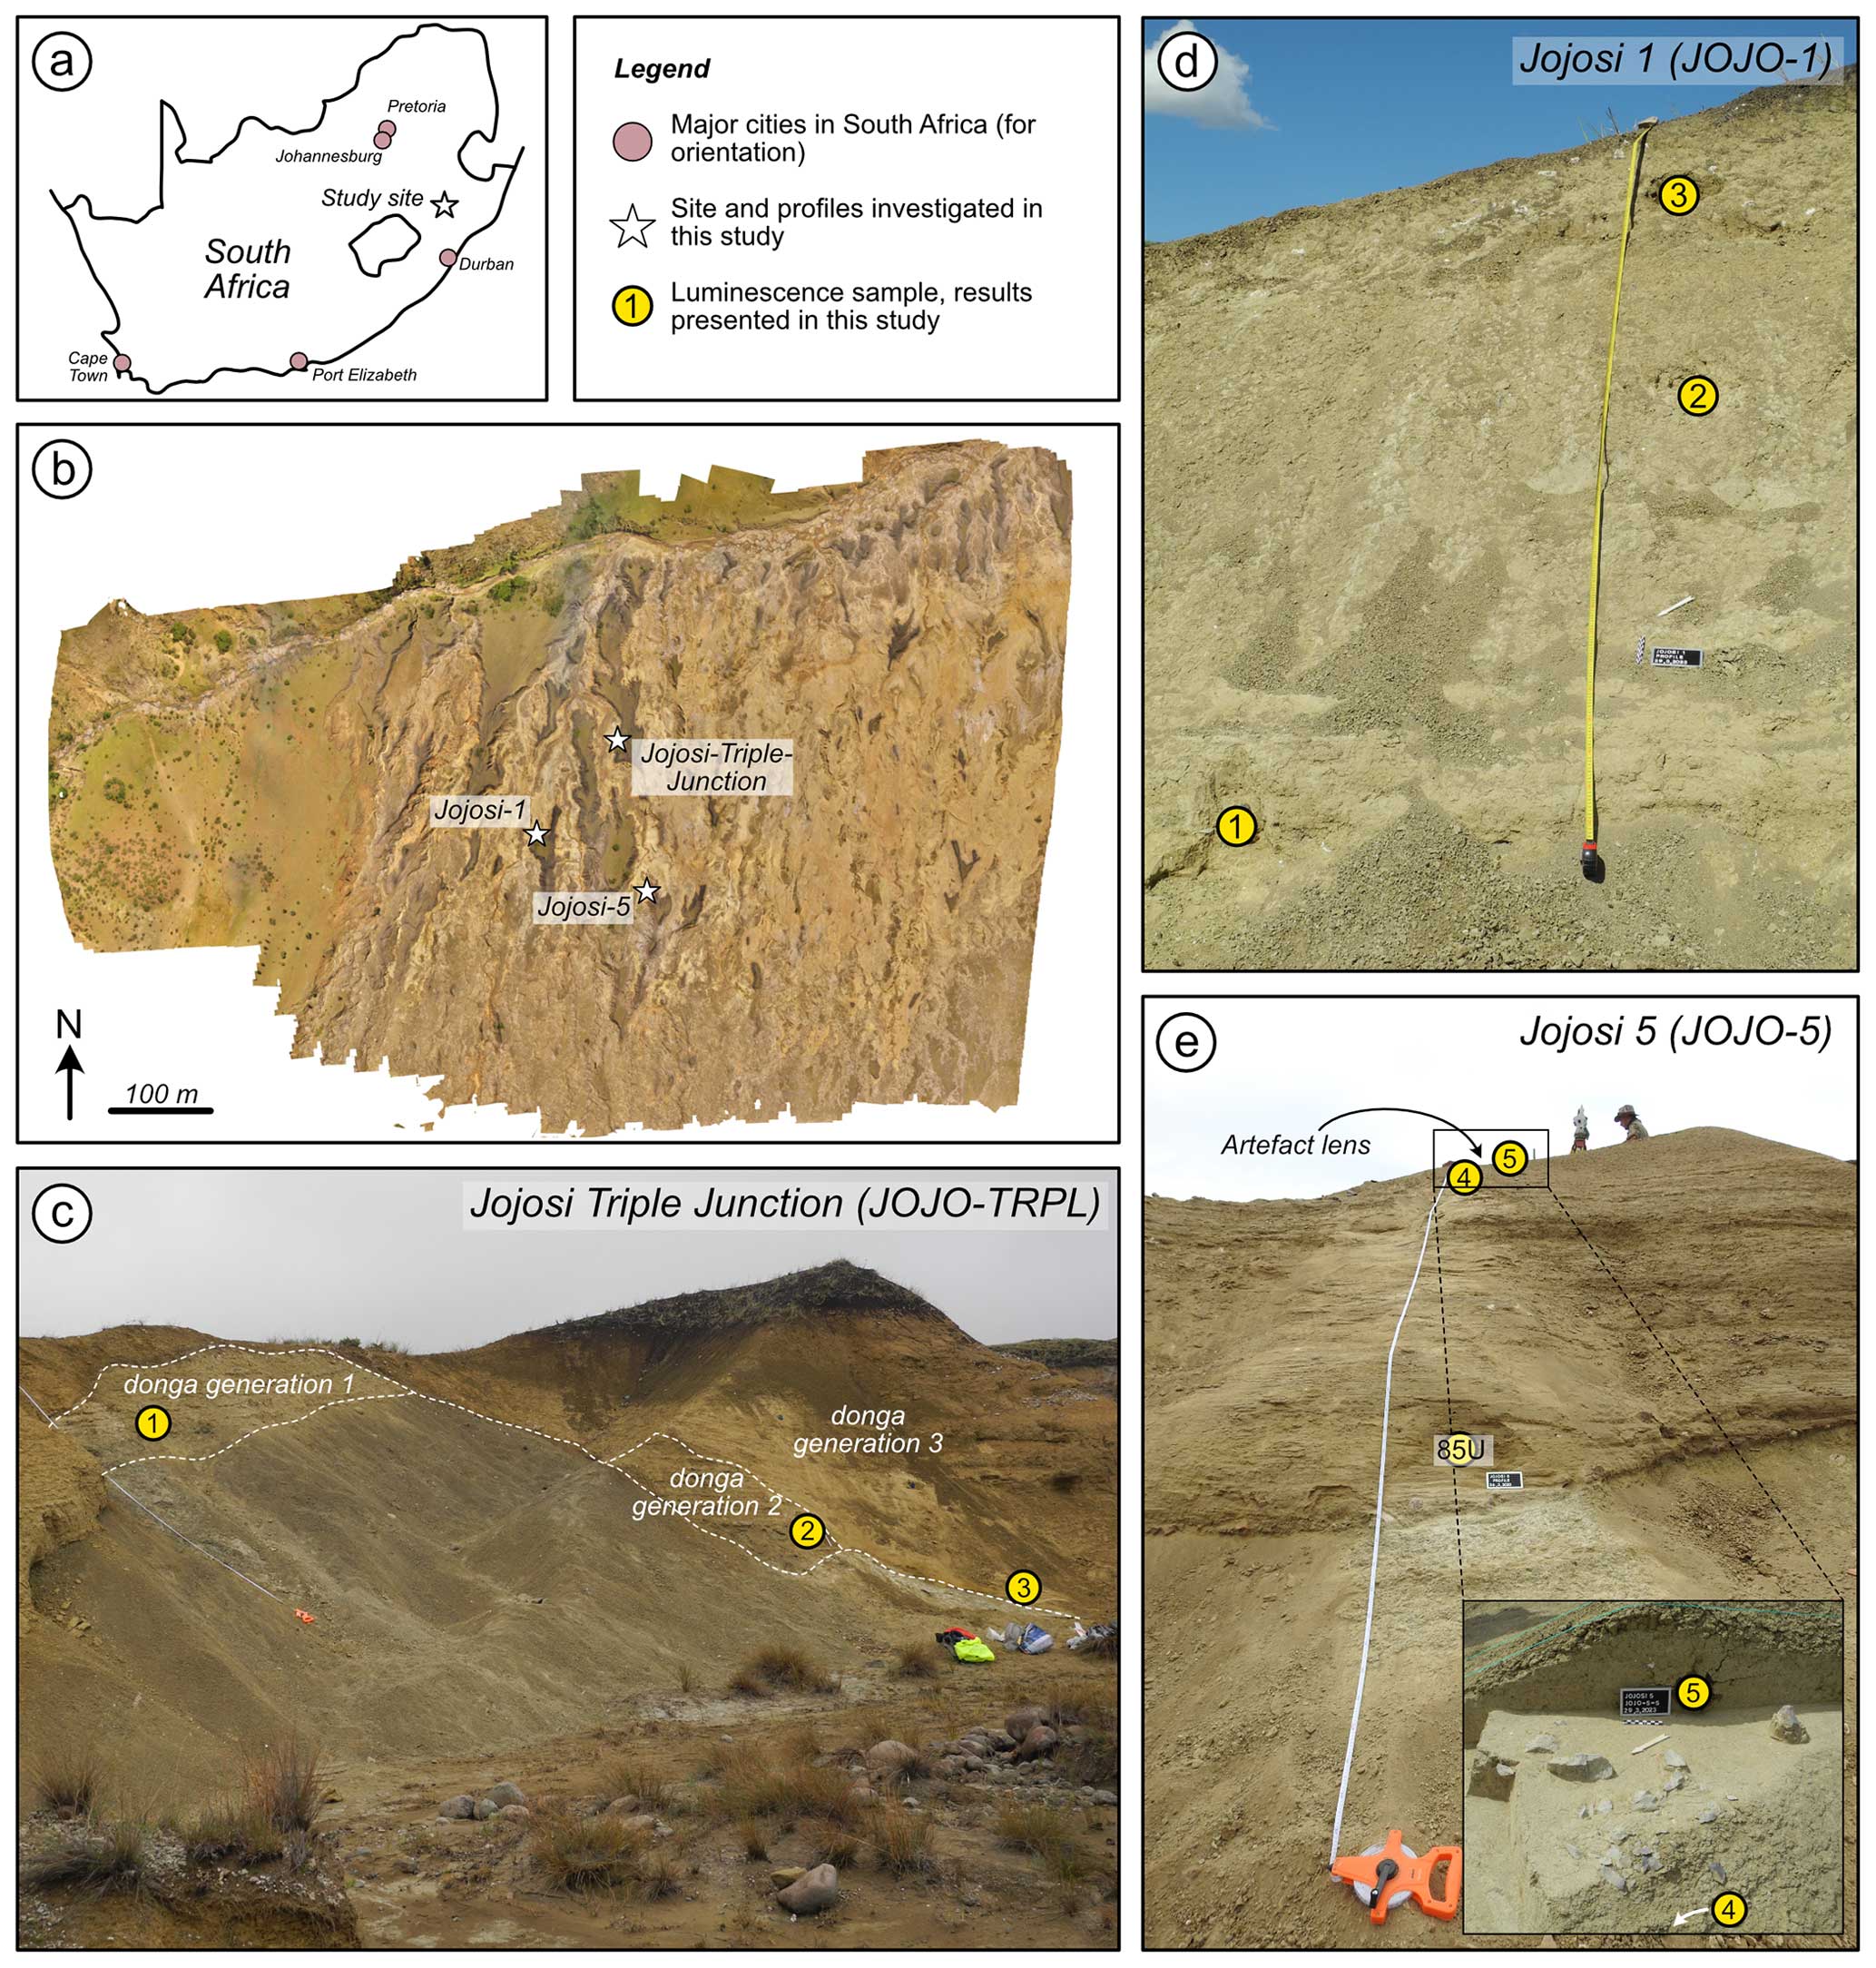
Figure 1(a) Location of the study area in South Africa. (b) A map created from aerial photographs of the study area. (c–e) Photographs of the sampled sediment sections: Jojosi Triple Junction (c), Jojosi 1 (d), and Jojosi 5 (e).
2.2 Luminescence instrumentation and measurement conditions
2.2.1 Multi-grain measurements
Luminescence measurements were performed using several Risø TL/OSL DA-20 readers (Bøtter-Jensen et al., 2010), each equipped with a beta source and IR LEDs operating at 90 % power (∼ 145 mW cm−2 for classic head at 100 %; ∼ 300 mW cm−2 for DASH at 100 %) at the CLL and at Risø (Technical University of Denmark, DTU). The beta sources were calibrated using Risø calibration quartz. The CLL calculates the dose rate of the instruments by fitting a regression line through multiple calibrations, with the instruments being calibrated every 6 months. The dose rate of the instruments at Risø are estimated by averaging the dose rate over the past six calibrations, with a calibration performed each month.
For multi-grain measurements, the feldspar luminescence signal was detected through a combination of a 2 mm thick Schott BG39 filter and a 3 mm thick Corning 7-59 filter or BG3 filter, depending on the reader, allowing the transmission of the blue emission (∼ 410 nm; Huntley et al., 1991). The single-aliquot regenerative (SAR) dose protocol (Murray and Wintle, 2000) was adapted for feldspars as post-IR IRSL protocol (Thomsen et al., 2008). To decide on an appropriate measurement protocol, a dose recovery preheat plateau test, a residual preheat plateau test, and a fading preheat plateau test were performed on samples JOJO-85U and JOJO-1-2 (Fig. 2). For these plateau tests, six different preheat and post-IR IRSL stimulation temperature combinations (post-IR IRSL temperature 25–30 °C < preheat temperature; see Table S2 for details) were tested, using three aliquots per combination. For the dose recovery test and the residual dose measurements, the multi-grain aliquots were bleached in a Hönle Sol2 solar simulator for 24 h. The multi-grain aliquots used in the dose recovery test were given a dose of 100 Gy. For dose recovery ratio calculations, the average residual dose obtained for each temperature combination was subtracted from the dose measured in the dose recovery test. The dose recovery ratio was then calculated by dividing the measured dose (residual-corrected) by the given dose. Based on the results, the measurement protocol described in Table 1 was selected and used for equivalent dose measurements. The chosen protocol was validated for all samples using a dose recovery test, and all samples showed dose recovery ratios within 10 % of unity. Fading was also measured for all samples using the protocol outlined in Table 1 and following the procedure by Auclair et al. (2003), with pauses of 0, 1000, 10 000, and 100 000 s inserted between steps 2 and 3. The pauses of 0 and 10 000 s were repeated at the end of the fading sequence to check for changes in sensitivity. The measurements were reproducible to ±10 %. Obtained fading rates are displayed in Fig. S3 for both luminescence signals investigated. The IRSL50 signal shows fading rates (g2 d) ranging from 0.3 ± 1.5 % per decade to 6.2 ± 1.1 % per decade with an average (± standard error) fading rate of 2.9 ± 0.3 % per decade (n=27). The post-IR IRSL225 signal exhibits low fading rates overall, ranging from −0.6 ± 1.9 % per decade to 3 ± 2 % per decade, with an average (± standard error) fading rate of 1.6 ± 0.2 % per decade (n=27). Obtained post-IR IRSL225 ages were not corrected for fading (see Roberts, 2012).
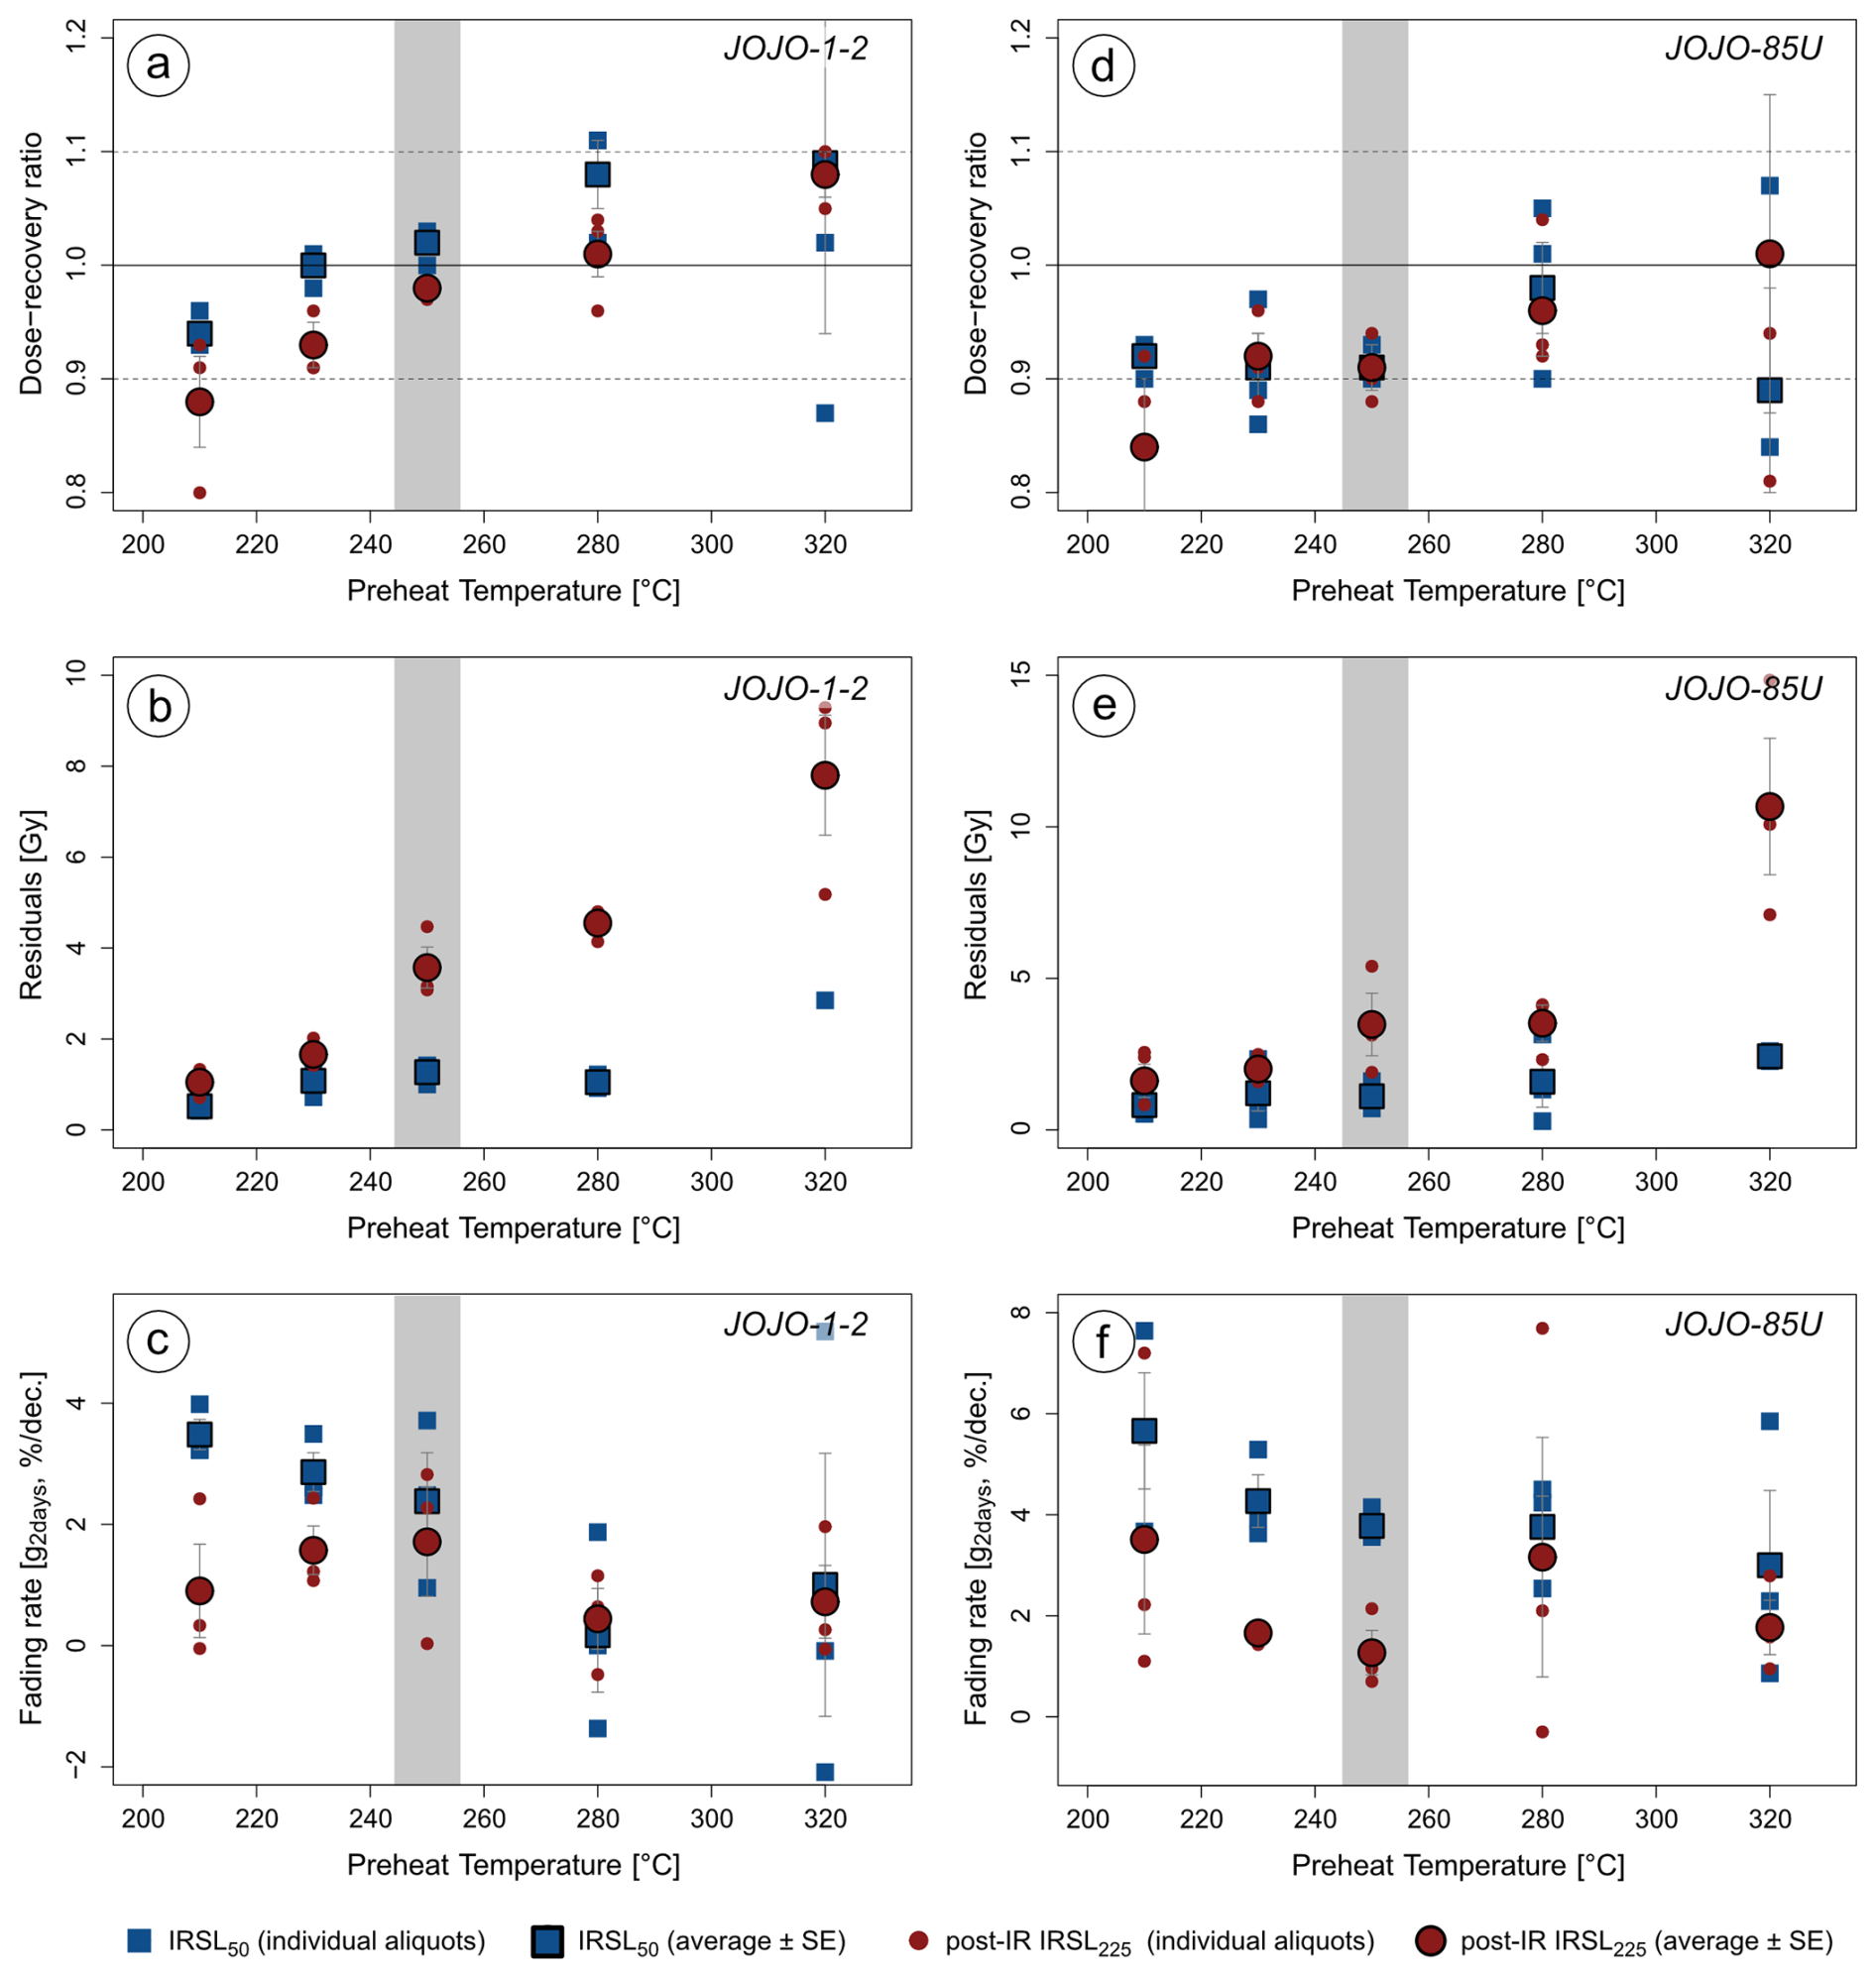
Figure 2Results of preheat plateau tests performed on samples JOJO-1-2 and JOJO-85U using multi-grain aliquots. Panels (a) and (d) show the results of the dose recovery preheat plateau test (given dose: 100 Gy; sample-specific average residuals subtracted), panels (b) and (e) show the results of the residual preheat plateau test, and panels (c) and (f) show the results of the fading preheat plateau test. Five temperatures were tested, with the preheat temperatures of 20 °C, 25 °C, or 30 °C > the post-IR IRSL temperature (see details in Table S2). The selected temperature combination is highlighted in grey, and the protocol is given in Table 1.
Multi-grain aliquot De measurements were made for all samples, and at least 36 aliquots were measured for each sample. To obtain a De from the luminescence signal, we integrated the initial 10 s of the signal and subtracted the last 20 s as a background. Dose response curves were fitted using a single saturating exponential function, (1 – exp (), where is the normalised OSL signal, D is the laboratory dose, and D0 is a curvature parameter), and single-aliquot equivalent doses were accepted with recycling ratios within 20 % of unity, with the relative test dose error smaller than 20 %, and with a Tn signal 3 standard deviations above the background. Using curve fitting and following earlier studies (e.g. Heydari and Guérin, 2018; Chapot et al., 2022; Arce-Chamorro and Guérin, 2024), we regard multi-grain aliquots as saturated when the ratio and/or the sum of this ratio plus its uncertainty does not intercept the dose response curve and thus lies above Imax. All multi-grain aliquots which yield a finite dose ± finite uncertainties are regarded as not saturated in this study. For SGC determination, in addition to these acceptance criteria, only aliquots which exhibited dose response curves with a reduced chi-square value of the fit below 5 and a figure of merit of the fit below 15 % were accepted (see Li et al., 2018).
Table 1Post-IR IRSL225 measurement protocol used for feldspar measurements. Stimulation times were adjusted for SG measurements (given in parentheses) due to the increased power density of the stimulation light at the sample position (see text for details).
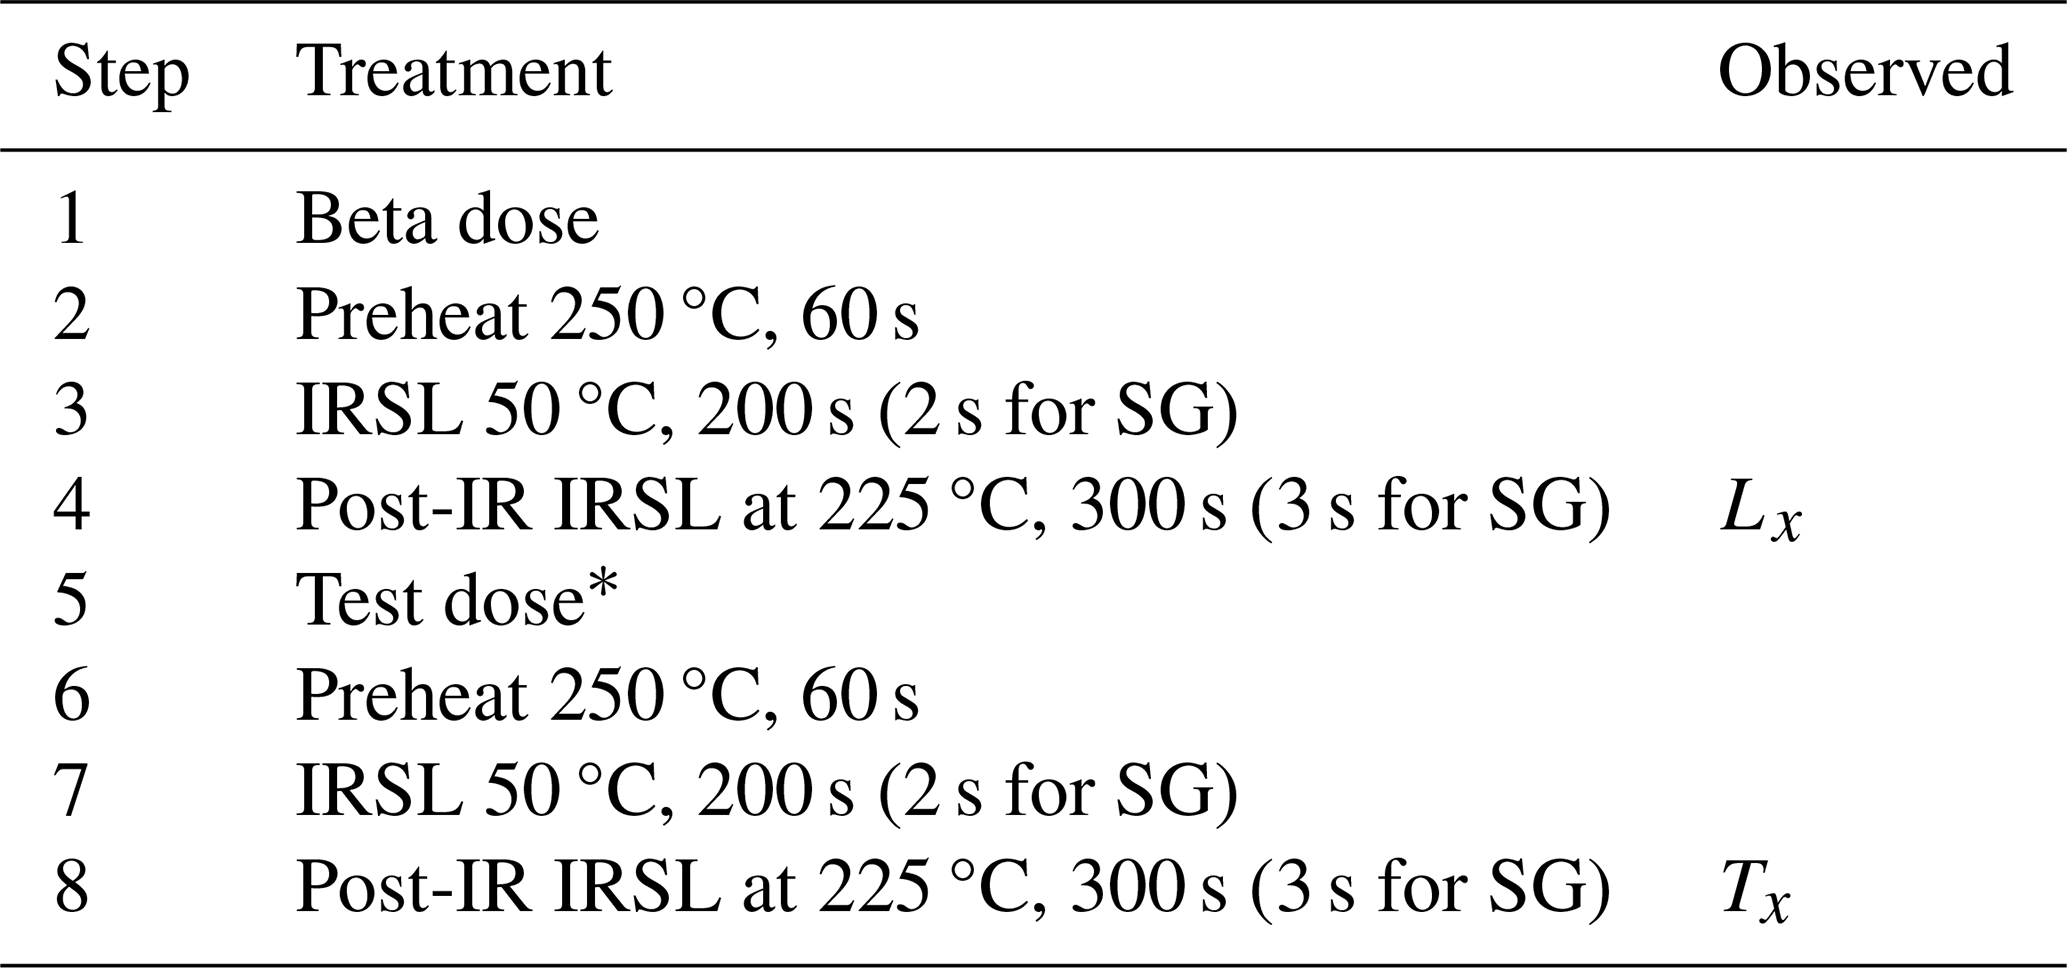
* For De measurements a test dose of 40 Gy was used for all samples, except for the two oldest samples (JOJO-TRPL-1 and JOJO-TRPL-2), where a test dose of 75 Gy was used.
2.2.2 Single-grain measurements
All single-grain measurements were performed on the same Risø luminescence reader at the CLL, with the source delivering a dose rate of ∼ 0.074 Gy s−1. For single-grain De determination, 12 to 25 single-grain discs (1200–2500 grains) were measured for each sample following the protocol outlined in Table 1 and by stimulating the individual grains using an IR (830 nm) 140 mW transistor–transistor logic modulated laser (Bøtter-Jensen et al., 2003; Duller et al., 2003). The stimulation time was adjusted for the single-grain measurements (see Table 1). From the obtained single-grain luminescence signal, the initial 0.2 s was used as a signal for further analysis. It was background-corrected using the last 0.4 s. The feldspar luminescence signal was detected through a combination of a 2 mm thick Schott BG39 filter and a 3 mm thick Corning 7-59 filter, transmitting at ∼ 410 nm (Huntley et al., 1991). For De determination, the initial 0.2 s was used as signal and the last 0.4 s was subtracted as background.
A single saturating exponential function (similar to that used for multi-grain aliquots; see previous paragraph) was used to fit values obtained for single grains. The definition of saturation follows the one described for multi-grain aliquots; thus we regard grains as saturated when the ratio and/or the sum of this ratio plus its uncertainty lies above Imax. All grains which yield a finite dose ± finite uncertainties are regarded as not saturated. Single grains were accepted when the relative test dose error was smaller than 20 % and their Tn signal was 3 standard deviations above background. No recycling ratio could be obtained due to the spatial dose non-uniformity of the beta source and the resulting uneven delivery of beta radiation to the single-grain discs, with a coefficient of variation in dose across the disc of 11.5 %. The doses administered were corrected for this spatial dose non-uniformity of the beta source following Lapp et al. (2012) by using correction factors based on GAFChronomic Dosimetry Medium measurements and the correction software (CorrSGbin) provided by Risø. For the SGC, additional rejection criteria (reduced chi-square below 5 and figure of merit below 15 %; Li et al., 2018) were used.
2.3 Dose rate determination
To estimate the external dose rate, uranium (U), thorium (Th), and potassium (K) contents were determined by high-resolution gamma spectrometry. Approximately 200 g of dried, homogenised sediment was stored in an airtight box, filled to maximum capacity, for at least 4 weeks to compensate for radon loss induced by sample preparation, before measurement with an Ortec Profile MSeries GEM Coaxial P-type high-precision Germanium Gamma-Ray detector. The gamma spectrometers at the CLL are calibrated at least every 3 months. 60Co and 152Eu standards are used for the energy calibration, and a Nussi sediment standard (Preusser and Kasper, 2001) is used for efficiency calibrations, with the measurement results being compared to the updated concentrations determined by Murray et al. (2018). The gamma samples in this study were measured for 200 000 s. Peak selection for activity calculations included the following peaks: 232Th decay series of 338, 911, 969, 239, and 583 keV; 238U decay series of 295, 352, 609, and 1765 keV; and 40K of 1461 keV.
The internal K-concentration was determined using a Risø GM beta multicounter system (Bøtter-Jensen and Mejdahl, 1985). The counting rates (48 h) of two subsamples of the K-feldspar separates from all nine samples were compared to the counting rates obtained for a K-feldspar standard (FK-N; Govindaraju, 1995) as the basis for the K-concentration determination. The average ± standard deviation of the two measurements per sample (see Table 2) was used for internal dose rate calculations. Since the obtained values are surprisingly low (<2 % K2O), we performed additional single-grain K2O-concentration measurements using a JEOL JXA-8900RL electron microprobe housed at the Institute of Geology and Mineralogy (University of Cologne). To determine the K2O-concentration of individual grains and link it to the luminescence emitted, the grains from a single-grain disc were embedded in epoxy and polished following the procedure outlined by Maßon et al. (2024). A total of 45 grains were analysed for their mineral chemistry, the results of which are provided in Supplement Table S1a and b. The internal K2O-concentration of the luminescent grains (divided into grains emitting IRSL50 only, post-IR IRSL225 only, and both signals) can be found in Fig. S1 in the Supplement. Theoretically and based on weight percentage calculation following stoichiometry, for alkali feldspars, one would expect to see K2O contents ranging from 0 wt % to 16.9 wt %. Measurements of the K2O-concentration of feldspar single grains from Jojosi sediments revealed a low average (± standard error, ndatapoints=135, ngrains=45) of 2.1 ± 0.4 wt %, despite this entire range being present in the data (min = 0, max = 16.2 wt %). Figure S1a also shows that IRSL50, post-IR IRSL225, and non-emitting grains exhibit this range. From the 45 grains measured, 35 grains did not have a single measurement point with K2O-concentration >3 wt %. Thus, despite the wide range of K2O-concentrations found, the microprobe results support the low bulk K-contents determined using a beta counter, so the results obtained through beta counting are used for dose rate calculations.
Dose rate and age calculations were performed using DRAC (Durcan et al., 2015). For samples JOJO-TRPL-2 and JOJO-TRPL-3, a user-defined gamma dose rate was calculated using the scale_GammaDose function (Riedesel et al., 2023) available in the R Luminescence package to account for variations in gamma dose rate between layers influencing these two luminescence samples. To convert U, Th, and K contents into dose rates, dose rate conversion factors of Guérin et al. (2011) were used. Alpha and beta grain size attenuation factors were applied, following Bell (1980) and Guérin et al. (2012), respectively. For coarse-grained feldspars, an alpha efficiency of 0.11 ± 0.03 (Balescu and Lamothe, 1993) was assumed. The cosmic dose rate was calculated according to Prescott and Hutton (1994). For all luminescence and dosimetry samples, the water content was determined by weighing the freshly collected wet sample and comparing this weight to its weight after drying the sediment for 2 d at 45 °C. The average water content ± standard error of all measurements is 15 % ± 2 %. However, to account for unknown but realistic fluctuations in water content in the past, a water content of 15 % ± 5 % was used for all samples. Information on U, Th, and K contents and total dose rates are given in Table 2.
Table 2Details regarding the samples, the measured radionuclide concentrations determined using gamma spectrometry, the internal K content measured using beta counting (see Bøtter-Jensen and Mejdahl, 1985), and the calculated environmental dose rates. A water content of 15 % ± 5 % was used for all samples. The environmental dose rates were calculated using DRAC (Durcan et al., 2015). Depths are given as vertical depth from the surface of the gully walls, measured with a laser distometer.
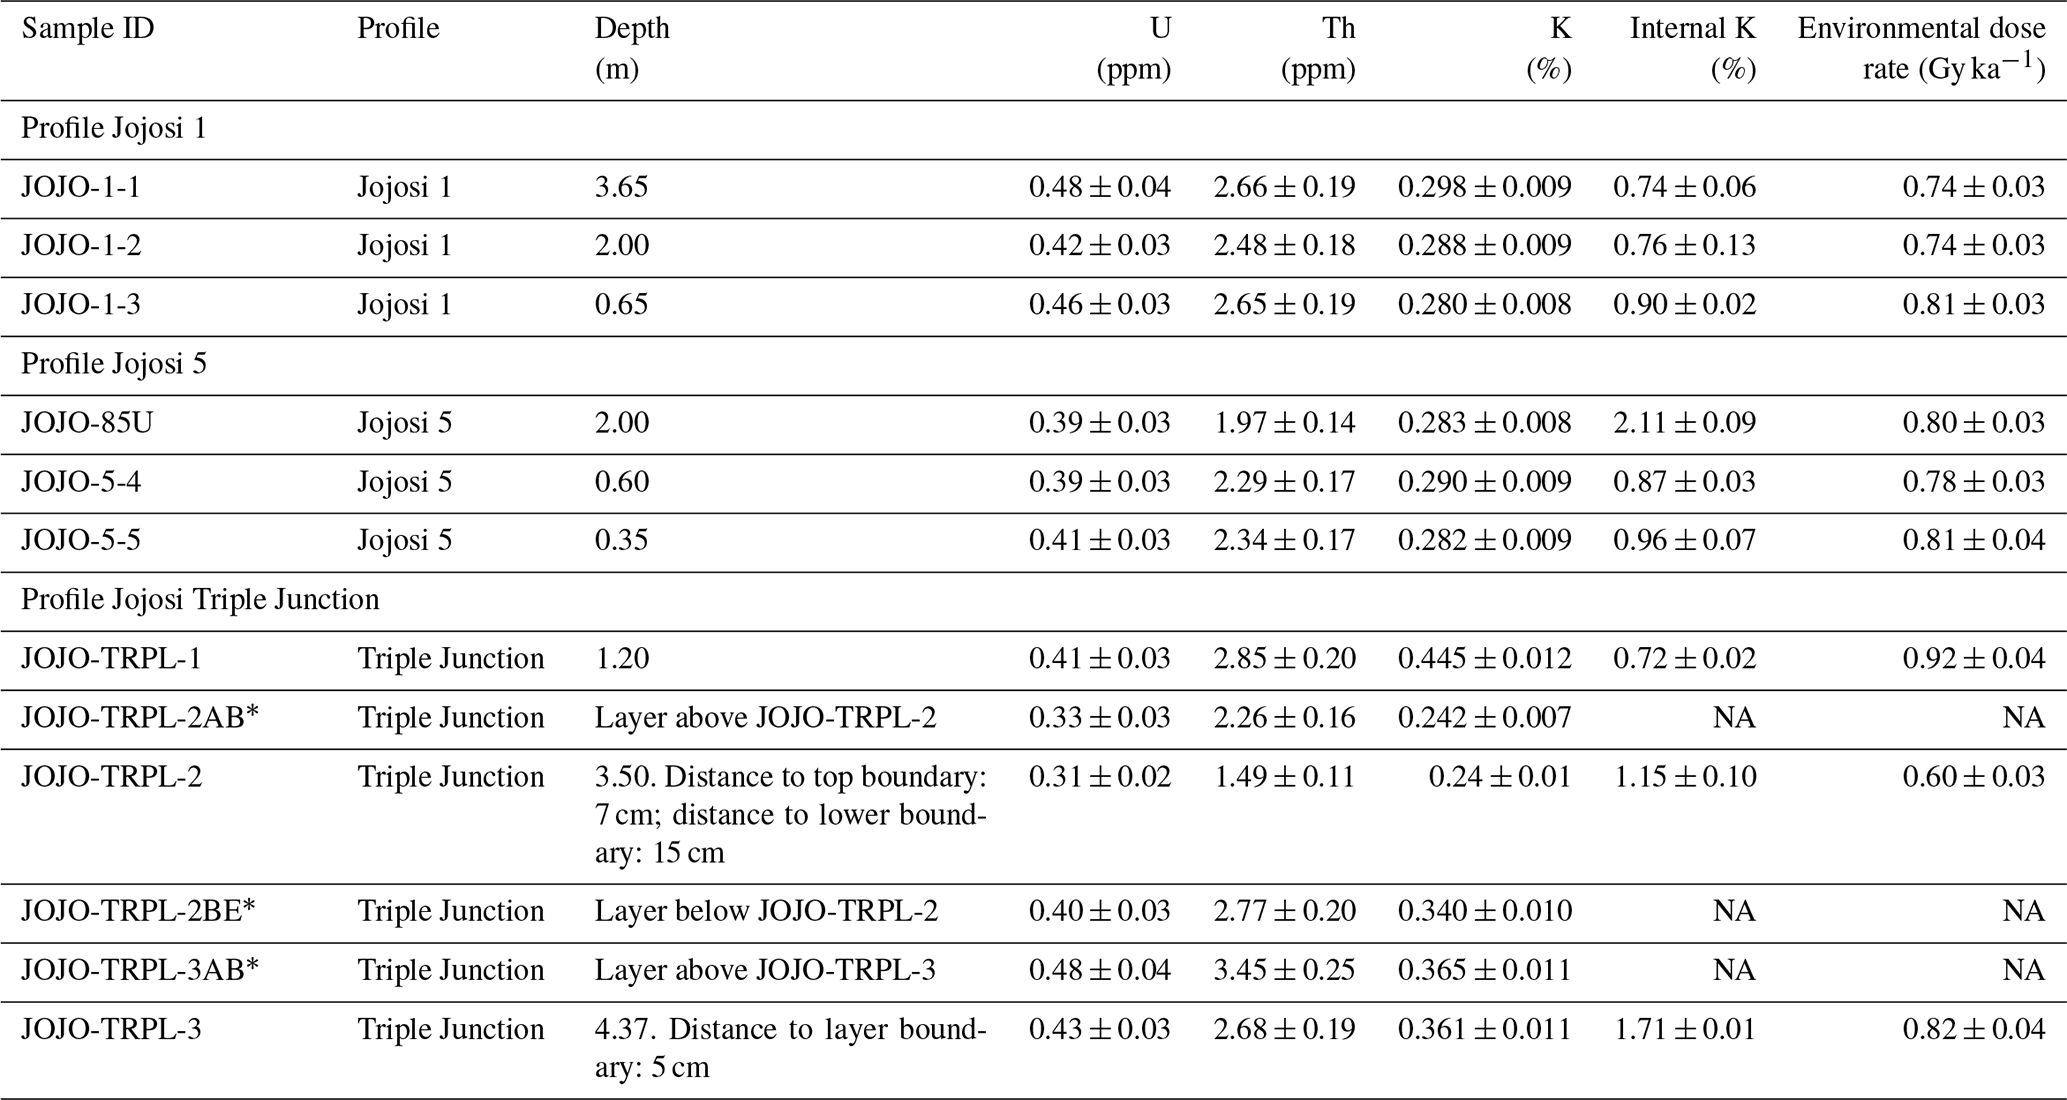
* The samples JOJO-TRPL-2AB, JOJO-TRPL-2BE, and JOJO-TRPL-3AB were only used to calculate the gamma dose rate delivered to luminescence samples JOJO-TRPL-2 and JOJO-TRPL-3; thus no environmental dose rate was calculated for these samples. This is indicated in the table as NA.
Over the past 3 decades, different statistical models have been developed or were adapted for application to De distributions (e.g. Galbraith et al., 1999; Bailey and Arnold, 2006; Arnold et al., 2009; Guérin et al., 2017). The De distribution measured for a sample is affected by multiple of factors, for example, remnant doses in the grains, due to incomplete resetting during previous transport and at deposition, or post-depositional factors, such as beta dose heterogeneity. Depending on the shape of the obtained equivalent dose distribution, different dose models can and should be selected for dose calculations. Various attempts have been made to assist in deciding on the appropriate dose model for the obtained De distribution (e.g. Bailey and Arnold, 2006; Galbraith and Roberts, 2012; Thomsen et al., 2016). However, the choice of an appropriate dose model remains challenging and complex, further complicated by the development of new statistical approaches for evaluating luminescence dose information (e.g. Philippe et al., 2019; Li et al., 2024).
Different dose models exist, which can be grouped as follows: (i) dose models which do not account for uncertainties on individual equivalent doses when calculating the burial dose of the sample (e.g. Clarke, 1996; Fuchs and Lang, 2001); (ii) dose models which incorporate the uncertainties (e.g. Galbraith et al., 1999; Guérin et al., 2017); and (iii) Bayesian models, which may include information beyond individual dose values and their uncertainties (e.g. Philippe et al., 2019; Li et al., 2024).
In the following, we will focus on the description and application of selected models from groups (ii) and (iii); we will refer to the models selected from group (ii) as frequentist approaches, and we will refer to those from group (iii) as Bayesian hierarchical approaches (following the terminology introduced by Philippe et al., 2019).
There are many differences between these two approaches; however, regarding the focus of this work, the crucial difference is that frequentist approaches require the distribution to contain parameterised De values in the form x ± y, where both x and y are finite values. Conversely, the Bayesian hierarchical approaches mentioned above allow the presence of non-parameterised De values within the measured populations.
Here we compare the results obtained by applying the CAM (Galbraith et al., 1999) and the ADM (Guérin et al., 2017), both frequentist approaches, to our data sets. Guérin et al. (2017) detail the differences between the CAM and the ADM, and here we highlight some main differences between the two models: (i) the CAM calculates the most representative dose for a given distribution by taking the median of a lognormal distribution (which is calculated as the weighted geometric mean), whereas the ADM calculates the weighted arithmetic mean of the same lognormal distribution; (ii) the CAM treats the overdispersion of a sample as measurement uncertainty (so that it is included in the weighting of each estimate), whereas, in contrast, the ADM only treats the intrinsic overdispersion (i.e. the dispersion arising in a dose recovery test) as measurement uncertainty (so that extrinsic overdispersion is not included in the weight of De estimates). The rationale behind the ADM is that extrinsic overdispersion is modelled as arising from dose rate variability, rather than an experimental factor. To be able to use frequentist approaches, single grains or multi-grain aliquots with normalised luminescence signals ( values) and/or their uncertainties not intercepting the dose response curve need to be excluded because no finite dose and/or uncertainty values can be provided.
There is a possibility of using frequentist approaches, such as the CAM, despite having values and/or their uncertainties above the maximum asymptote of the dose response curve (Imax): a standardised growth curve (SGC; Roberts and Duller, 2004; Li et al., 2015a, b), combined with a frequentist approach applied to a distribution of values (Li et al., 2017, 2020) instead of a distribution of De values, might be a possibility. The SGC LnTn approach is based on the establishment of an SGC. The CAM is then applied to all values (renormalised according to the SGC) of grains/multi-grain aliquots that passed the acceptance criteria, and the obtained central (with uncertainties) is projected onto the SGC. The corresponding x values inform us about the dose of the sample. This makes it possible to include all values in the calculation, even those of saturated grains. However, this can only be used if a sufficient part of the distribution is below Imax. Otherwise, the resulting dose is either infinite or has an infinite upper uncertainty.
Bayesian hierarchical approaches, such as BayLum, have been developed to enable a more holistic view on luminescence dose and age calculations, and they enable the inclusion of grains/multi-grain aliquots for dose calculations, which have values above Imax. For such aliquots, despite not resulting in finite De values, their inclusion in the population has been shown to greatly extend the knowledge one can gain for a given luminescence sample by further extending the range of measurable doses (e.g. Heydari and Guérin, 2018; Arce-Chamorro and Guérin, 2024). Indeed, in BayLum, all aliquots from one sample belong to one population with a common central dose, so even poorly informative aliquots elicit information.
For this study, we decided to evaluate and compare the use of two frequentist approaches (CAM and ADM), the SGC LnTn method combined with the CAM, and one Bayesian hierarchical model (BayLum).
4.1 Single-grain dose distributions
The geomorphological environment at Jojosi was expected to result in partial bleaching of the luminescence signals, likely due to short sheetwash transport distances between source and sink and because of rapid erosion and transport. We thus regarded single-grain measurements as the most appropriate means of measurement for the luminescence samples presented in this study.
Contrary to quartz, a large number (∼ 30 %–60 %) of individual grains of K-rich feldspar usually give detectable luminescence signals (e.g. Li et al., 2011, Reimann et al., 2012). Unfortunately, at Jojosi, only 6 ± 1 % (nmeasured=16 700) of the grains measured gave detectable luminescence signals in the case of the post-IR IRSL225 signal and 20 ± 3 % in the case of the IRSL50 signal (measured as part of the post-IR IRSL225 protocol; see Table 1). Table 3 shows the total number of grains measured, the number of accepted grains, and the number of grains where the natural signal appeared to be in saturation for the IRSL50 and post-IR IRSL225 signals, respectively.
We determined single-grain equivalent doses for all nine samples. To assess the appropriateness of our measurement protocol, we also performed two single-grain dose recovery tests (samples JOJO-1-3 and JOJO-85U) with a given dose of 100 Gy (see Fig. S7). The single-grain dose recovery test dose distributions exhibit overdispersion values of 20 ± 2 % (naccepted=221) and 12 ± 4 % (naccepted=350) for the IRSL50 signal and of 21 ± 4 % (naccepted=58) and 11 ± 3 % (naccepted=74) for the post-IR IRSL225 signal for JOJO-1-3 and JOJO-85U, respectively. The relative overdispersion determined in these single-grain dose recovery tests is lower than that obtained for the natural De distributions, where the overdispersion ranges from 34 ± 2 % (JOJO-TRPL-1, CAM De=418.8 ± 10.6 Gy, based on n=263) to 57 ± 3 % (JOJO-5-5, CAM De=79.3 ± 3.3 Gy, based on n=220) for the IRSL50 and from 26 ± 7 % (JOJO-TRPL-2, CAM De=181.9 ±12.7 Gy, based on n=31) to 74 ± 8 % (JOJO-5-5, CAM De=88.1 ± 9.5 Gy, based on n=54) in the case of the post-IR IRSL225 signal (see Table 4). However, the natural dose distributions all appear log-normally distributed and do not show a prominent leading edge, as is expected for partially bleached samples (e.g. Reimann et al., 2012). Examples of the dose distributions obtained for one of the younger samples (JOJO-1-1) and the oldest sample (JOJO-TRPL-1) are shown in Fig. S6.
Table 3Overview of single grains measured (nmeasured), those accepted for equivalent dose calculations (naccepted), and the number of saturated grains (nsat). Grains were accepted when the uncertainty on the natural test dose response (Tn) was less than 20 % and the Tn signal was 3 standard deviations above background. The relative number of accepted grains is calculated in relation to the total number of grains measured and is given in parenthesis behind the absolute numbers. Saturated grains are all included in the accepted grains, and their percentage is calculated from the total number of accepted grains.
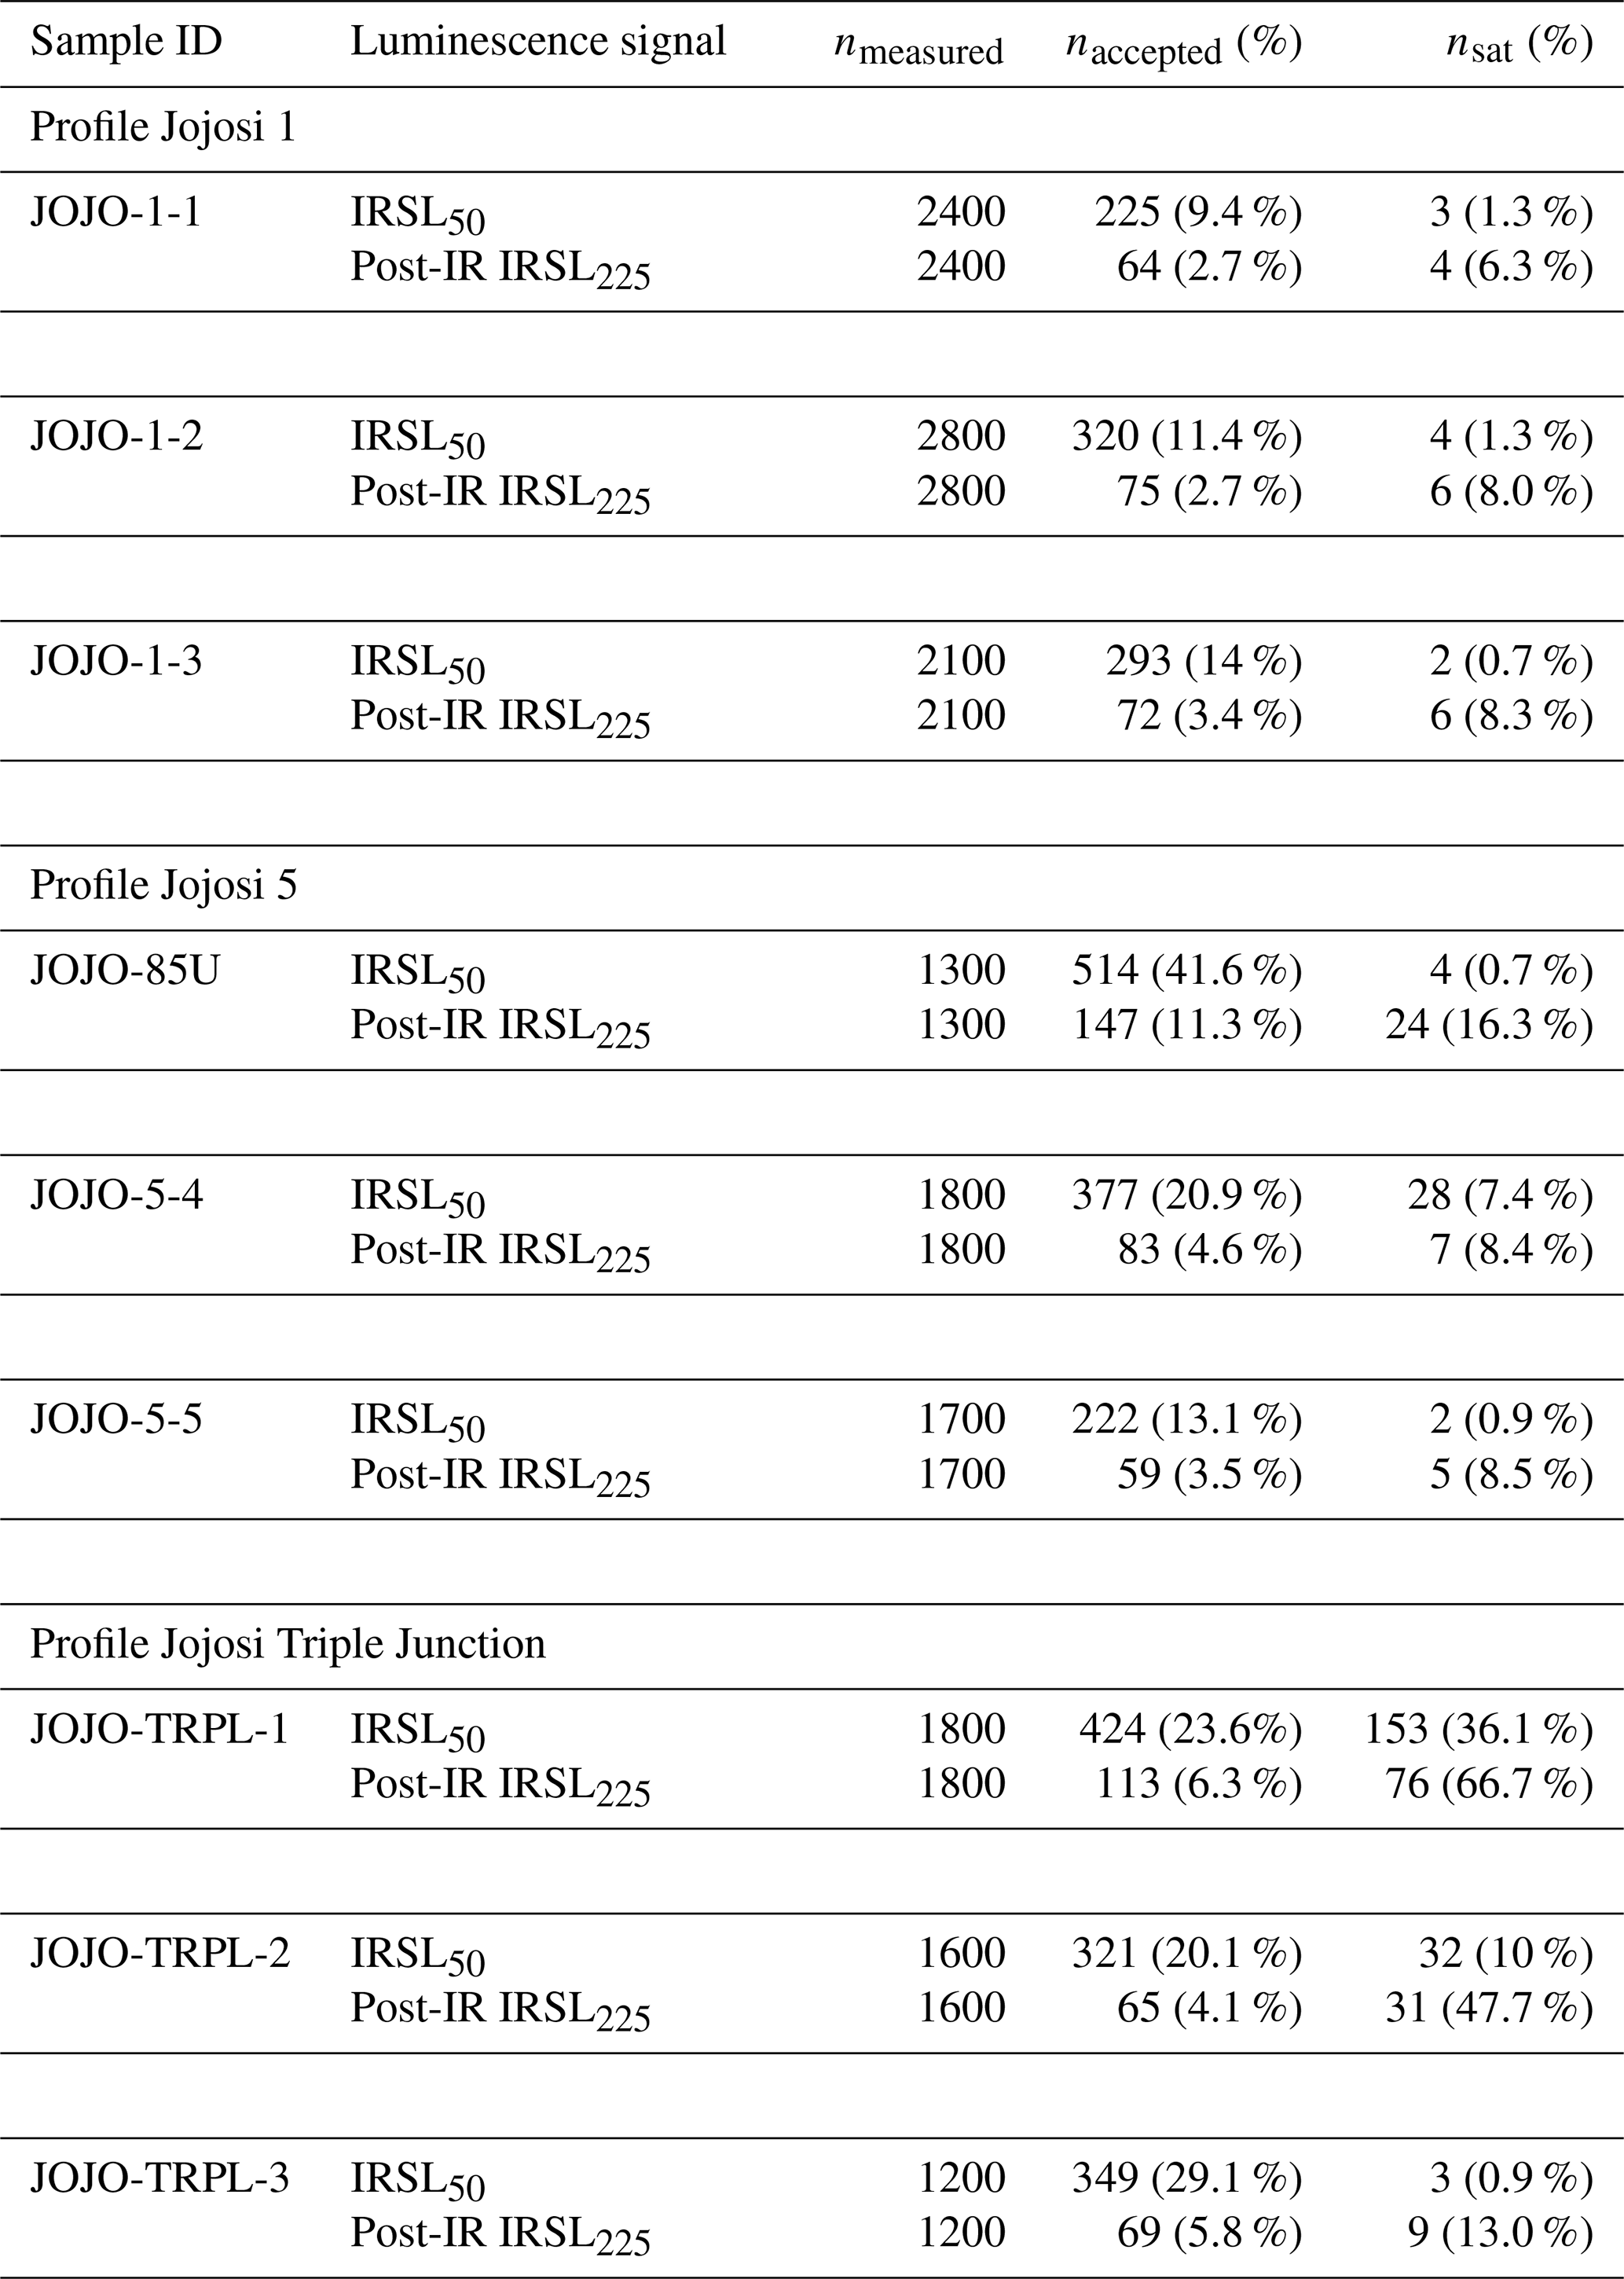
The single-grain measurements of all samples show differences in the relative number of saturated grains. In Table 3, the relative proportion of saturated grains is given as the percentage of the total number of accepted grains and is denoted as nsat. nsat ranges from 0.7 % to 36 % for the IRSL50 signal and from 6.3 % to 67 % for the post-IR IRSL225 signal (see Table 3). The relative number of saturated grains systematically increases with the size of the single-grain CAM dose, except for sample JOJO-TRPL-3, where the number of saturated grains is too low to fit the trend of the other samples (Fig. S13). Neither the geomorphological setting of the sample (see Fig. 1c) nor the luminescence characteristics, such as the fading rate (Fig. S3b) or the curvature (expressed as D0) of the dose response curve (Fig. S8a), indicate any differences to the other samples. The two oldest samples, JOJO-TRPL-1 and JOJO-TRPL-2, exhibit the largest relative number of saturated grains for the post-IR IRSL225 signal, with 67 % and 48 % of the grains in saturation, respectively. This indicates that both samples are close to or possibly beyond the upper limit of feldspar luminescence dating in this area.
Buylaert et al. (2013) used the differential bleaching rates between the first and second IRSL measurement in the post-IR IRSL measurement protocol to identify samples suffering from significant incomplete bleaching. We use the same approach in Fig. 3a and b, where we plot the single-grain IRSL50 doses against the corresponding post-IR IRSL225 doses. Due to higher fading of the IRSL50 signal, compared to the post-IR IRSL225 signal, we expect to see a curving relationship below the 1:1 line. However, Fig. 3a shows scattering of the doses around the 1:1 line, with an average IRSLpost-IR IRSL225 De ratio of 0.89 ± 0.02. To show a clearer picture of the IRSLpost-IR IRSL225 ratio, we plotted this for the most precise grains (grain with uncertainties on the De values <20 %) in Fig. 3c. The ratio for these grains is 0.85 ± 0.03. From fading tests performed on all samples (see Fig. S3b), we know that the IRSL50 fades more compared to the post-IR IRSL225 signal. Fading-correcting the individual equivalent doses in Fig. 3c following the relationship presented by Thomsen et al. (2008) results in a fading-corrected IRSL50 to post-IR IRSL225 ratio of 1.16 ± 0.04. We thus interpret the underestimation of the IRSL50 doses as being caused by increased fading of the IRSL50 signal, rather than incomplete bleaching of the post-IR IRSL225 signal.
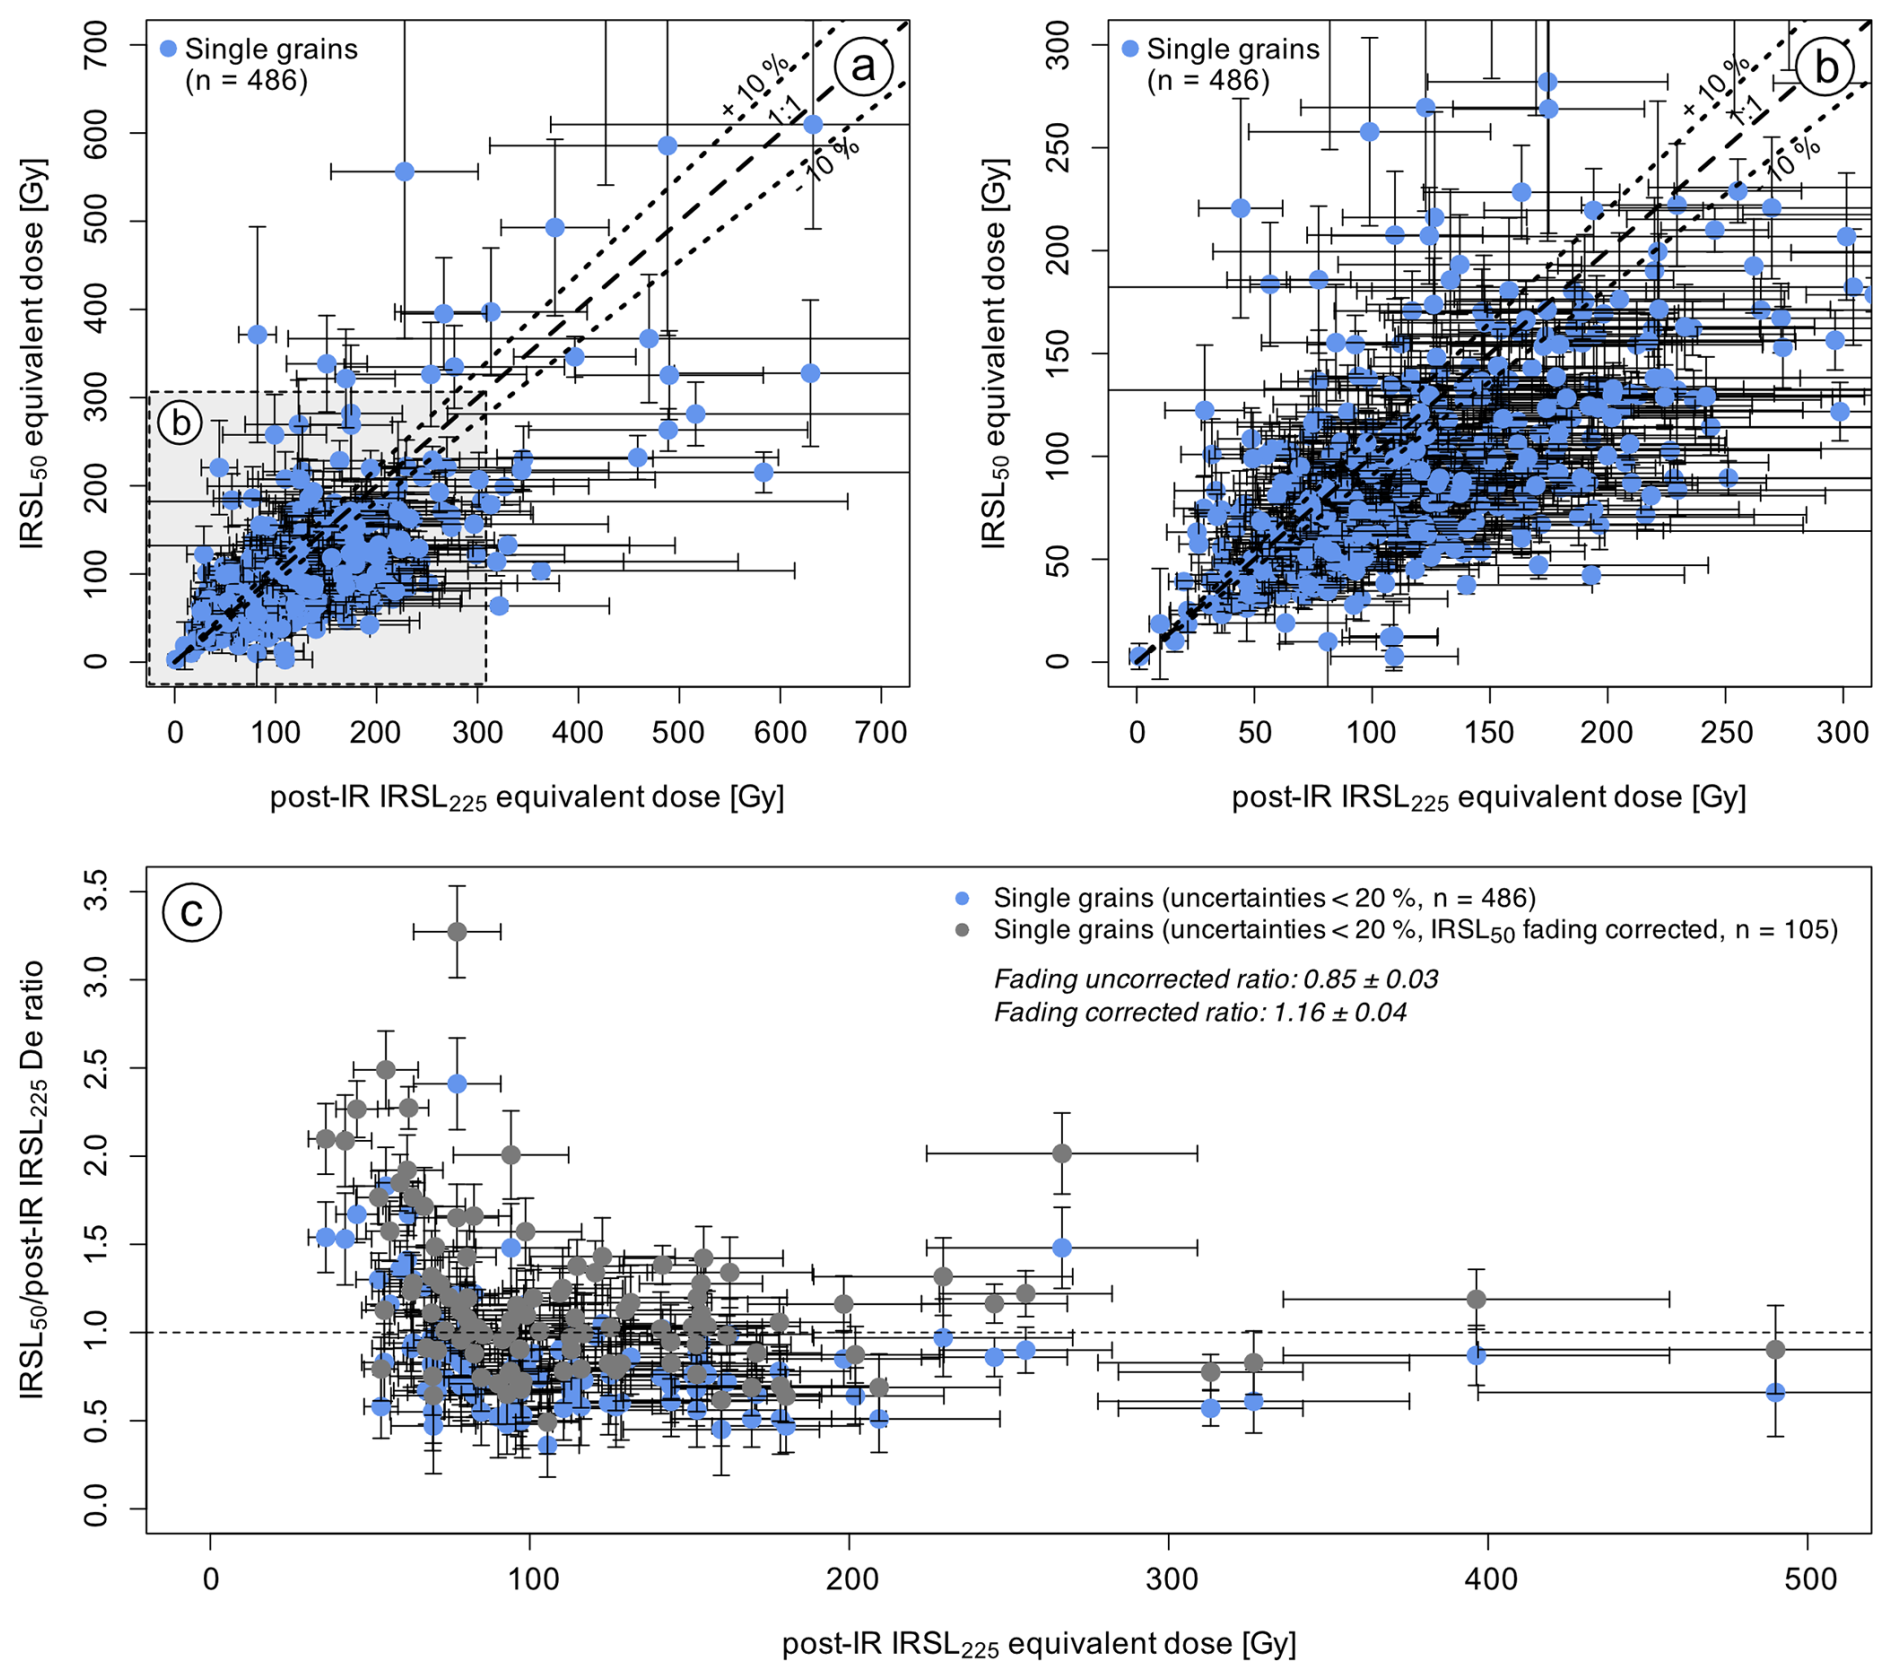
Figure 3(a) Scatter plot of post-IR IRSL225 doses compared to IRSL50 doses obtained for single grains of all samples. Here the results of single grains of all samples are shown, which passed the acceptance criteria in case of both signals and which yielded finite equivalent doses. The shaded rectangle shows the region of the plot highlighted in panel (b). (c) Ratios of IRSL50 doses divided by post-IR IRSL225 doses dependent on the size of the post-IR IRSL225 dose calculated for data points displayed in panel (a), which have individual equivalent dose uncertainties <20 %. We chose to limit the display to those grains with the most accurate equivalent doses. The grey points show ratios obtained by dividing the fading-corrected IRSL50 De values by the post-IR IRSL225 De values (following Thomsen et al., 2008).
4.2 Multi-grain aliquot dose distributions
The low yield of luminescent single grains (Table 3) makes single-grain measurements very time- and labour-intensive. Since no incomplete resetting could be detected on the single-grain level, we tested the applicability of measuring multi-grain aliquots of all nine samples. Measuring multi-grain aliquots should decrease the time needed to acquire a sufficiently large data set. Multi-grain De distributions are shown alongside single-grain De distributions in Fig. S6 for samples JOJO-1-1 and JOJO-TRPL-1 for the IRSL50 and post-IR IRSL225 signal, respectively.
Similarly to the distributions obtained for single grains, the multi-grain distributions appear to be log-normal distributed, with a few outliers and no prominent leading edge. The relative overdispersion ranges from 12 ± 2 % (JOJO-1-2, CAM De=73.7 ± 1.6 Gy, based on n=37) to 47 ± 6 % (JOJO-TRPL-2, CAM De=125.9 ± 9.8 Gy, based on n=36) for the IRSL50 signal of multi-grain aliquots and from 14 ± 5 % (JOJO-85U, CAM De=142.6 ± 14.8 Gy, based on n=33) to 40 ± 8 % (JOJO-5-5, CAM De=117.4 ±5.4 Gy, based on n=28) for the post-IR IRSL225 signal (see Table 4). As expected, the multi-grain data show less scatter compared to the single-grain data sets, indicating the effect of averaging of the luminescence signals. Interestingly, only four of the nine samples measured exhibited saturated multi-grain aliquots for the post-IR IRSL225 signal (JOJO-85U, JOJO-TRPL-1, JOJO-TRPL-2, JOJO-TRPL-3), whilst the single-grain data sets of all samples contained saturated grains.
4.3 Synthetic aliquot dose distributions
To further investigate the differences in relative saturation of the single-grain and multi-grain aliquot data, we summed the luminescence of all single grains on a given single-grain disc to create so-called synthetic aliquots. This was done by using the “sum all grains” function available in the Analyst program (Duller, 2015). We accumulated synthetic aliquot data for 12 to 28 discs, with the exact number of measured discs per sample given in Table 3 and results given in Table 4. It should be noted that the stimulation time and intensity differ for these measurements, compared to multi-grain aliquot measurements. Furthermore, here we summed the luminescence signal of potentially 100 grains, whereas, for small multi-grain aliquots, we roughly summed the signal of approximately 30 grains, as suggested by Duller (2008). The results are displayed for two samples in Fig. S6. Relative overdispersion values range from 13 ± 3 % (JOJO-1-3, CAM De = 80.6 ± 2.6 Gy, based on n=20) to 24 ± 5 % (JOJO-85U, CAM De=97.5 ± 6.7 Gy, based on n=13) for the IRSL50 signal and from 14 ± 5 % (JOJO-85U, CAM De=114.6 ± 4.5 Gy, based on n=10) to 40 ± 8 % (JOJO-5-5, CAM De=88.07 ± 9.46 Gy, based on n=10) for the post-IR IRSL225 signal. Note: no synthetic aliquot data are available for the post-IR IRSL225 signal of sample JOJO-TRPL-1 because only a single synthetic aliquot passed the acceptance criteria while also giving a finite value and dose. Due to the difference in number of samples exhibiting saturation on the single-grain level compared to the multi-grain level, we also checked the synthetic aliquot data sets for saturation. Here, five samples contained saturated aliquots. This includes sample JOJO-5-4 and all four samples which also showed saturated multi-grain aliquots. As with single grains, JOJO-TRPL-1 contains the most saturated multi-grain and synthetic aliquots. For four samples (JOJO-1-1, JOJO-1-2, JOJO-1-3, and JOJO-5-5), it is interesting to note that, despite containing saturated grains, all synthetic aliquots gave finite equivalent doses.
4.4 Equivalent dose calculations
Due to the large range of equivalent doses and various amounts of saturated grains/multi-grain aliquots obtained for the different samples, we tested up to four different dose models on the different data sets (single grains, synthetic aliquots, and multi-grain aliquots). In the following, we focus on the post-IR IRSL225 signal only. The different dose models will not be evaluated for the IRSL50 signal, primarily because the IRSL50 signal exhibits a larger signal loss due to fading; thus we considered the dose model evaluation to be more robust for a low-fading exhibiting luminescence signal. Furthermore, our comparison of IRSL50 and post-IR IRSL225 doses revealed that the post-IR IRSL225 signal had been reset sufficiently prior to burial. However, IRSL50 ages are calculated using BayLum, and the results are presented in the Supplement (see Fig. S15).
Details regarding the use of the four selected dose models are given in the Supplement (i.e. the size of the intrinsic over-dispersion σm used in ADM calculations, convergence criteria for BayLum, and SGC validation). For the synthetic aliquots, only the frequentist approaches (CAM and ADM) were tested. We also tested the Minimum Age Model (Galbraith et al., 1999; the logged three-parameter version) on the single-grain data sets. However, the shape of the dose distributions already indicated that minimum age modelling might be inappropriate. Furthermore, tests revealed that p0 values (an indicator of the percentage of grains of the full distribution included in the MAM calculation) were low (<2 %), indicating the model as unsuitable for our samples. Thus, the MAM results are not discussed further. The results of the different dose model calculations for the three data sets investigated are given in Table 4. Figure 4 visualises the comparison of the different dose models applied to the three data sets.
Comparing CAM and ADM for multi-grain and single-grain data sets, as well as for synthetic aliquots, reveals good agreement between these two frequentist approaches for the entire dose range from ∼ 80 to ∼ 800 Gy (Fig. 4a). For the multi-grain data set, the ratio of is 0.96 ± 0.02 (n=9), for synthetic aliquots it is 0.97 ± 0.010 (n=8), and for single grains it is 0.92 ± 0.02 (n=9), with JOJO-5-5 (0.77 ± 0.11) causing the underestimation of this ratio due to a few grains with very high doses. These ratios indicate smaller CAM doses compared to ADM doses, with the ratio being smallest for the single-grain data set. If the outlier (JOJO-5-5) is excluded from the single-grain ratio calculations, then the ratio of is 0.94 ± 0.010. This systematic difference is expected because the average of a lognormal distribution is always greater than (or equal to) its median, and the difference between these values increases when the dispersion increases.
If we compare the single-grain ADM doses with multi-grain ADM doses, we find that the single-grain doses underestimate the multi-grain doses by about 15 % (ratio of 0.83 ± 0.07, n=9). Similar underestimations have been reported for quartz measurements (e.g. Guérin et al., 2015; Thomsen et al., 2016; Singh et al., 2017). For quartz, it has been shown that this underestimation can at least partly be caused by saturation effects and can be significantly reduced by excluding grains not able to measure the absorbed dose accurately (i.e. grains with D0 values smaller than the absorbed dose, e.g. Thomsen et al., 2016). Thus, we tested if excluding grains of certain D0 thresholds affects the CAM and ADM doses for the single-grain data set of all samples, but we could not find any effect on the doses calculated. D0 threshold filtering results in the exclusion of some of the saturated grains, indicating that saturation of individual grains results from early saturation of the corresponding dose response curves (Figs. S10–S12). Nevertheless, since the D0 filter had no effect on the CAM and ADM doses, we did not apply this additional rejection criterion. The ratio between the synthetic aliquot ADM doses and the multi-grain ADM doses is 0.95 ± 0.05 (n=8; no synthetic aliquot data could be generated for sample JOJO-TRPL-1; Table 4)
Comparing ADM doses to BayLum doses shows that, when using multi-grain aliquots, BayLum and ADM results agree on average ( ratio = 0.99 ± 0.03, n=9), despite a large deviation in the ratio in the case of the oldest sample, JOJO-TRPL-1 (0.75 ± 0.04). For single grains, ADM doses systematically underestimate BayLum doses (1.23 ± 0.10, n=9), with ADM and BayLum doses being consistent until the proportion of saturated grains exceeds ∼ 9 %. If we use the SGC LnTn approach on the multi-grain data set and compare it to the ADM results, the ratio to ADM doses is 0.89 ± 0.03 (n=9). For single grains, the SGC LnTn to ADM ratio is 1.15 ± 0.13 (n=9). Especially large deviations are visible for samples JOJO-TRPL-1 and JOJO-TRPL-2.
BayLum and the SGC LnTn approach both allow the inclusion of saturated grains. Comparing these two models (Fig. 4g, h) reveals SGC BayLum ratios of 1.11 ± 0.06 (n=9) and 1.01 ± 0.05 (n=9) for single grains and multi-grain aliquots, respectively. The deviation is larger for single grains, largely because of sample JOJO-TRPL-1. For this sample, no uncertainties could be calculated for the SGC LnTn approach due to the CAM LnTn uncertainties not intercepting the SGC. For multi-grain aliquots, these two models yield relatively consistent results, with JOJO-TRPL-1 showing the largest deviation with a ratio of 0.72 ± 0.07.
On average, for multi-grain aliquots, all dose models result in burial doses in agreement with each other, indicating the suitability of all dose models tested. For single grains, however, the different dose models predict very different burial doses as the relative number of saturated grains increases. The higher the relative number of saturated grains (i.e. the larger the burial dose), the larger the deviations (see e.g. JOJO-TRPL-1, which has 67 % of its accepted grains in saturation).
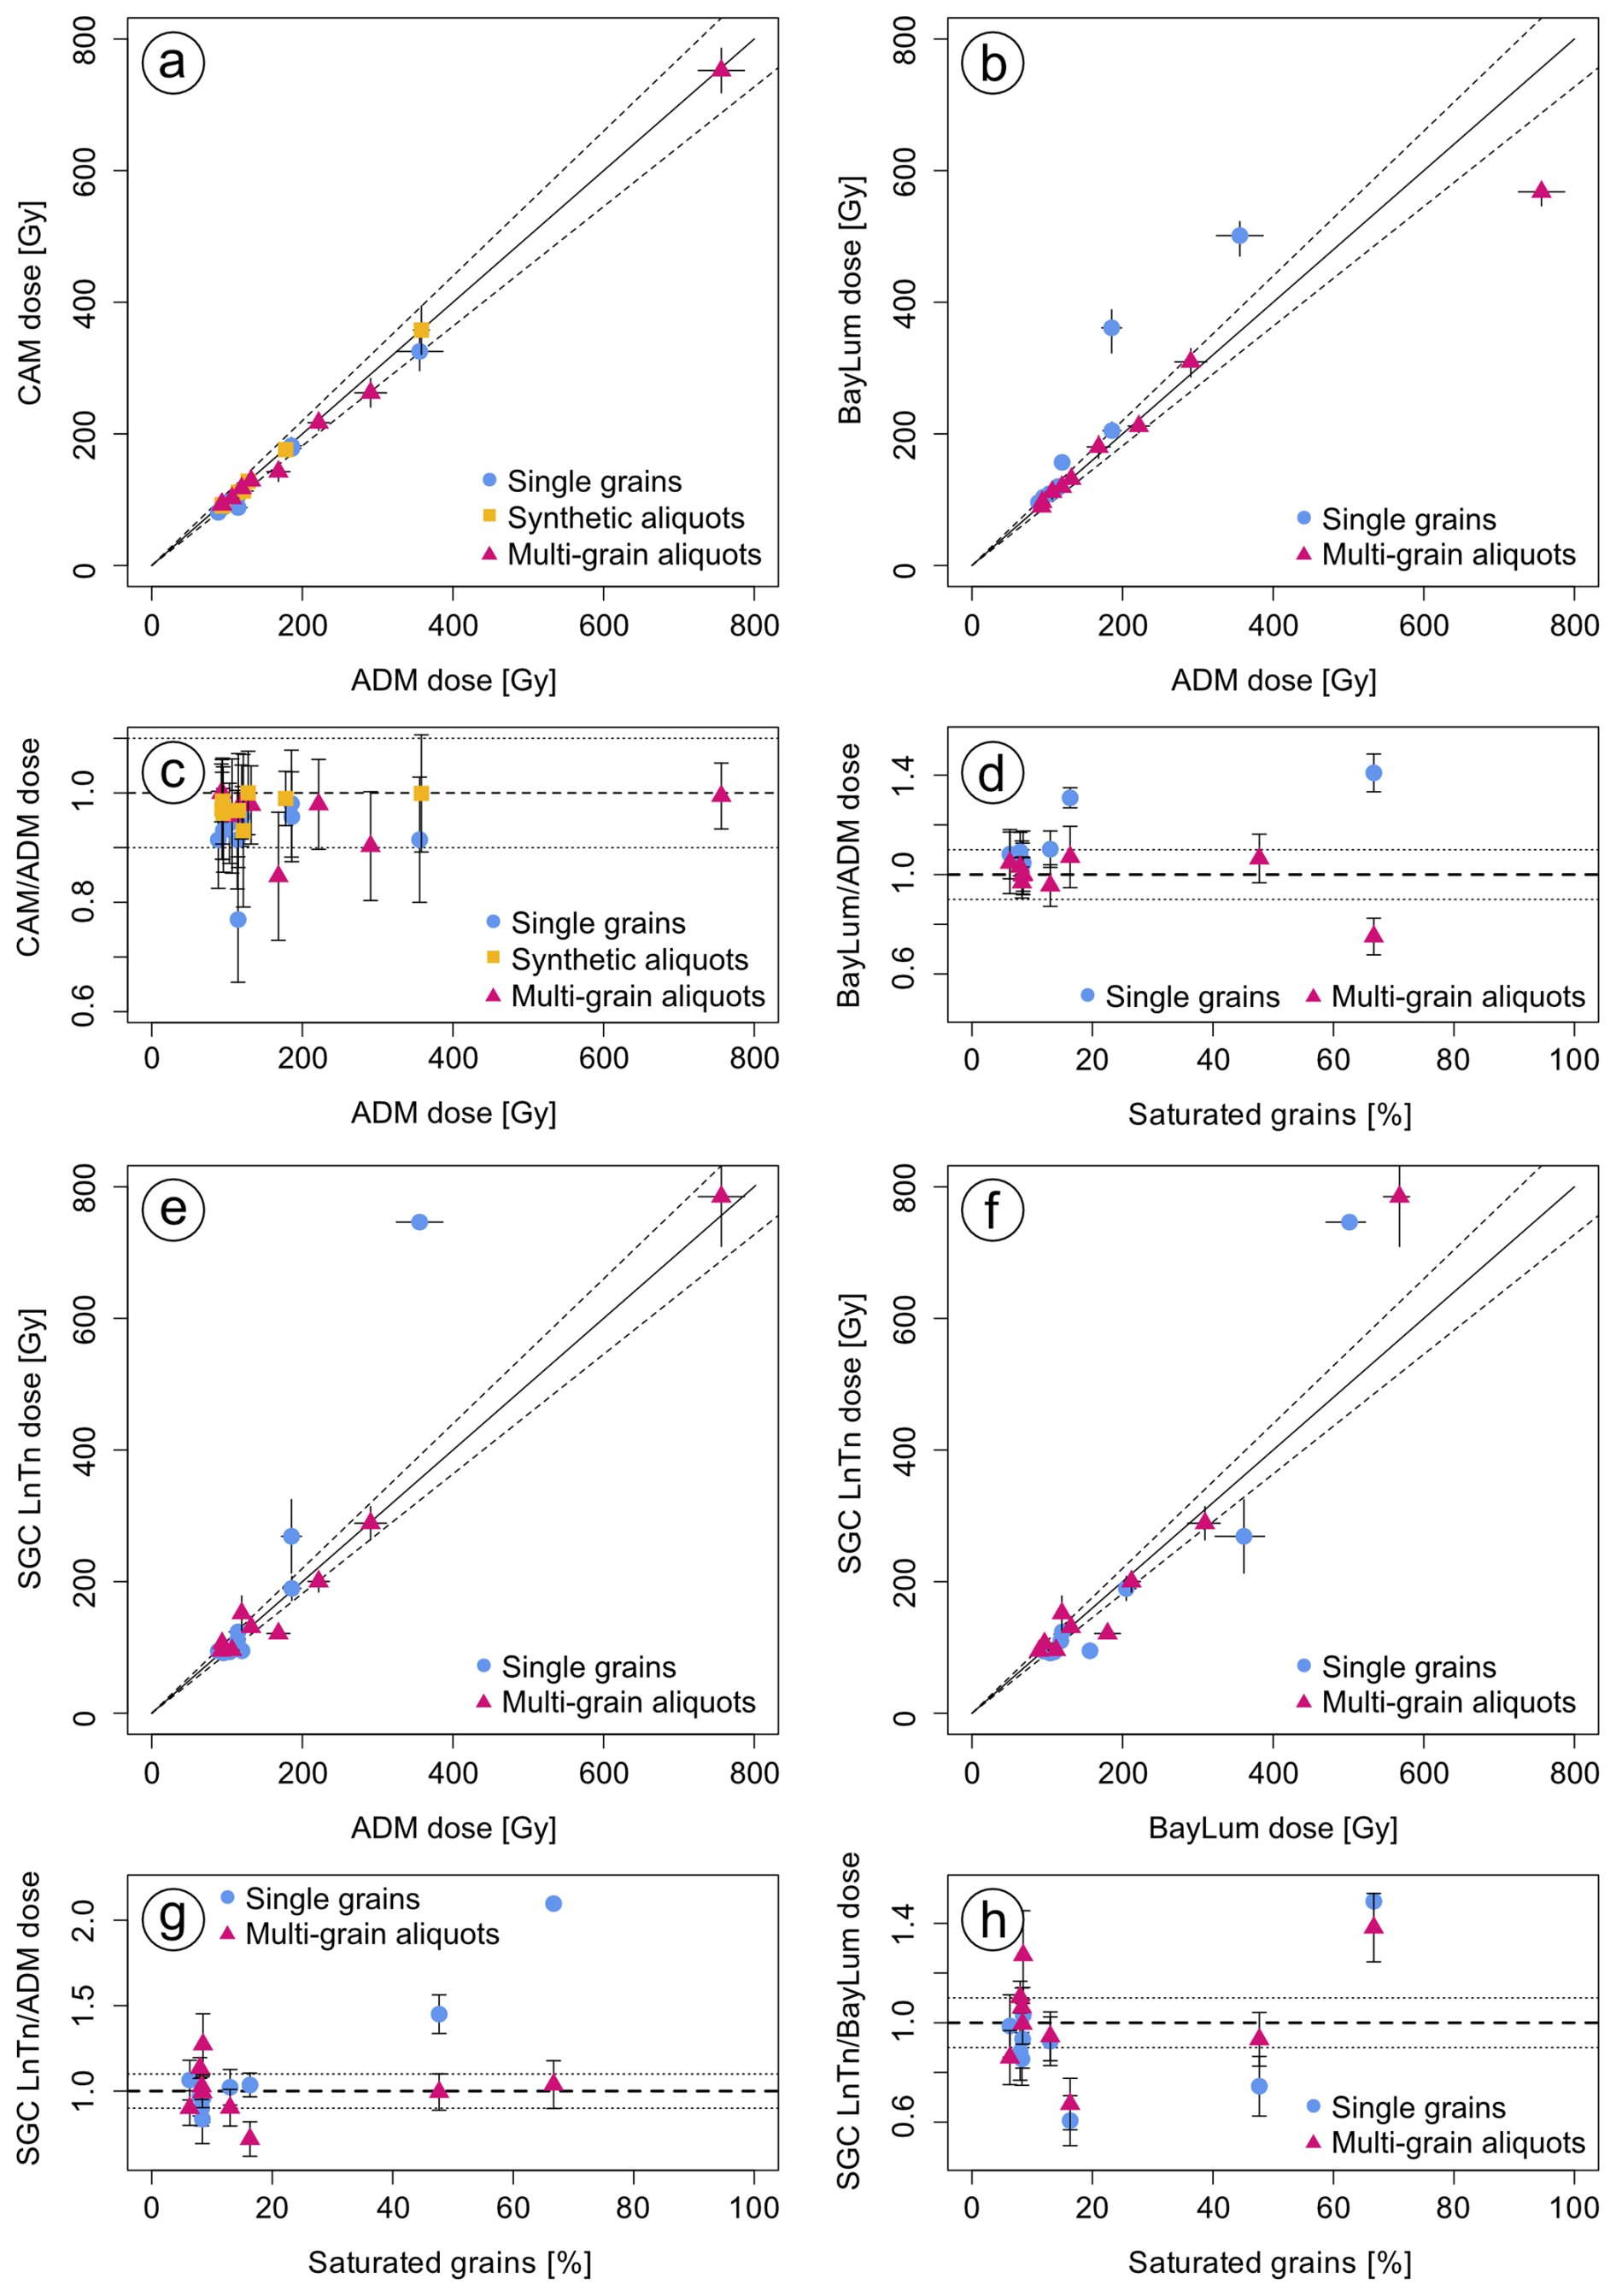
Figure 4Comparison of equivalent doses derived using the four dose models for single grains, multi-grain aliquots, and synthetic aliquots. Subfigures (a), (b), and (e) show a comparison of ADM doses and doses obtained using CAM, BayLum, and the SGC LnTn method. Subfigure (f) compares BayLum doses to doses calculated using the SGC LnTn method. For each dose model comparison, the doses resulting from the calculations are visualised as a scatter plot of the doses and as ratios dependent on the ADM dose (c) or the percentage of grains in saturation (d, g, h).
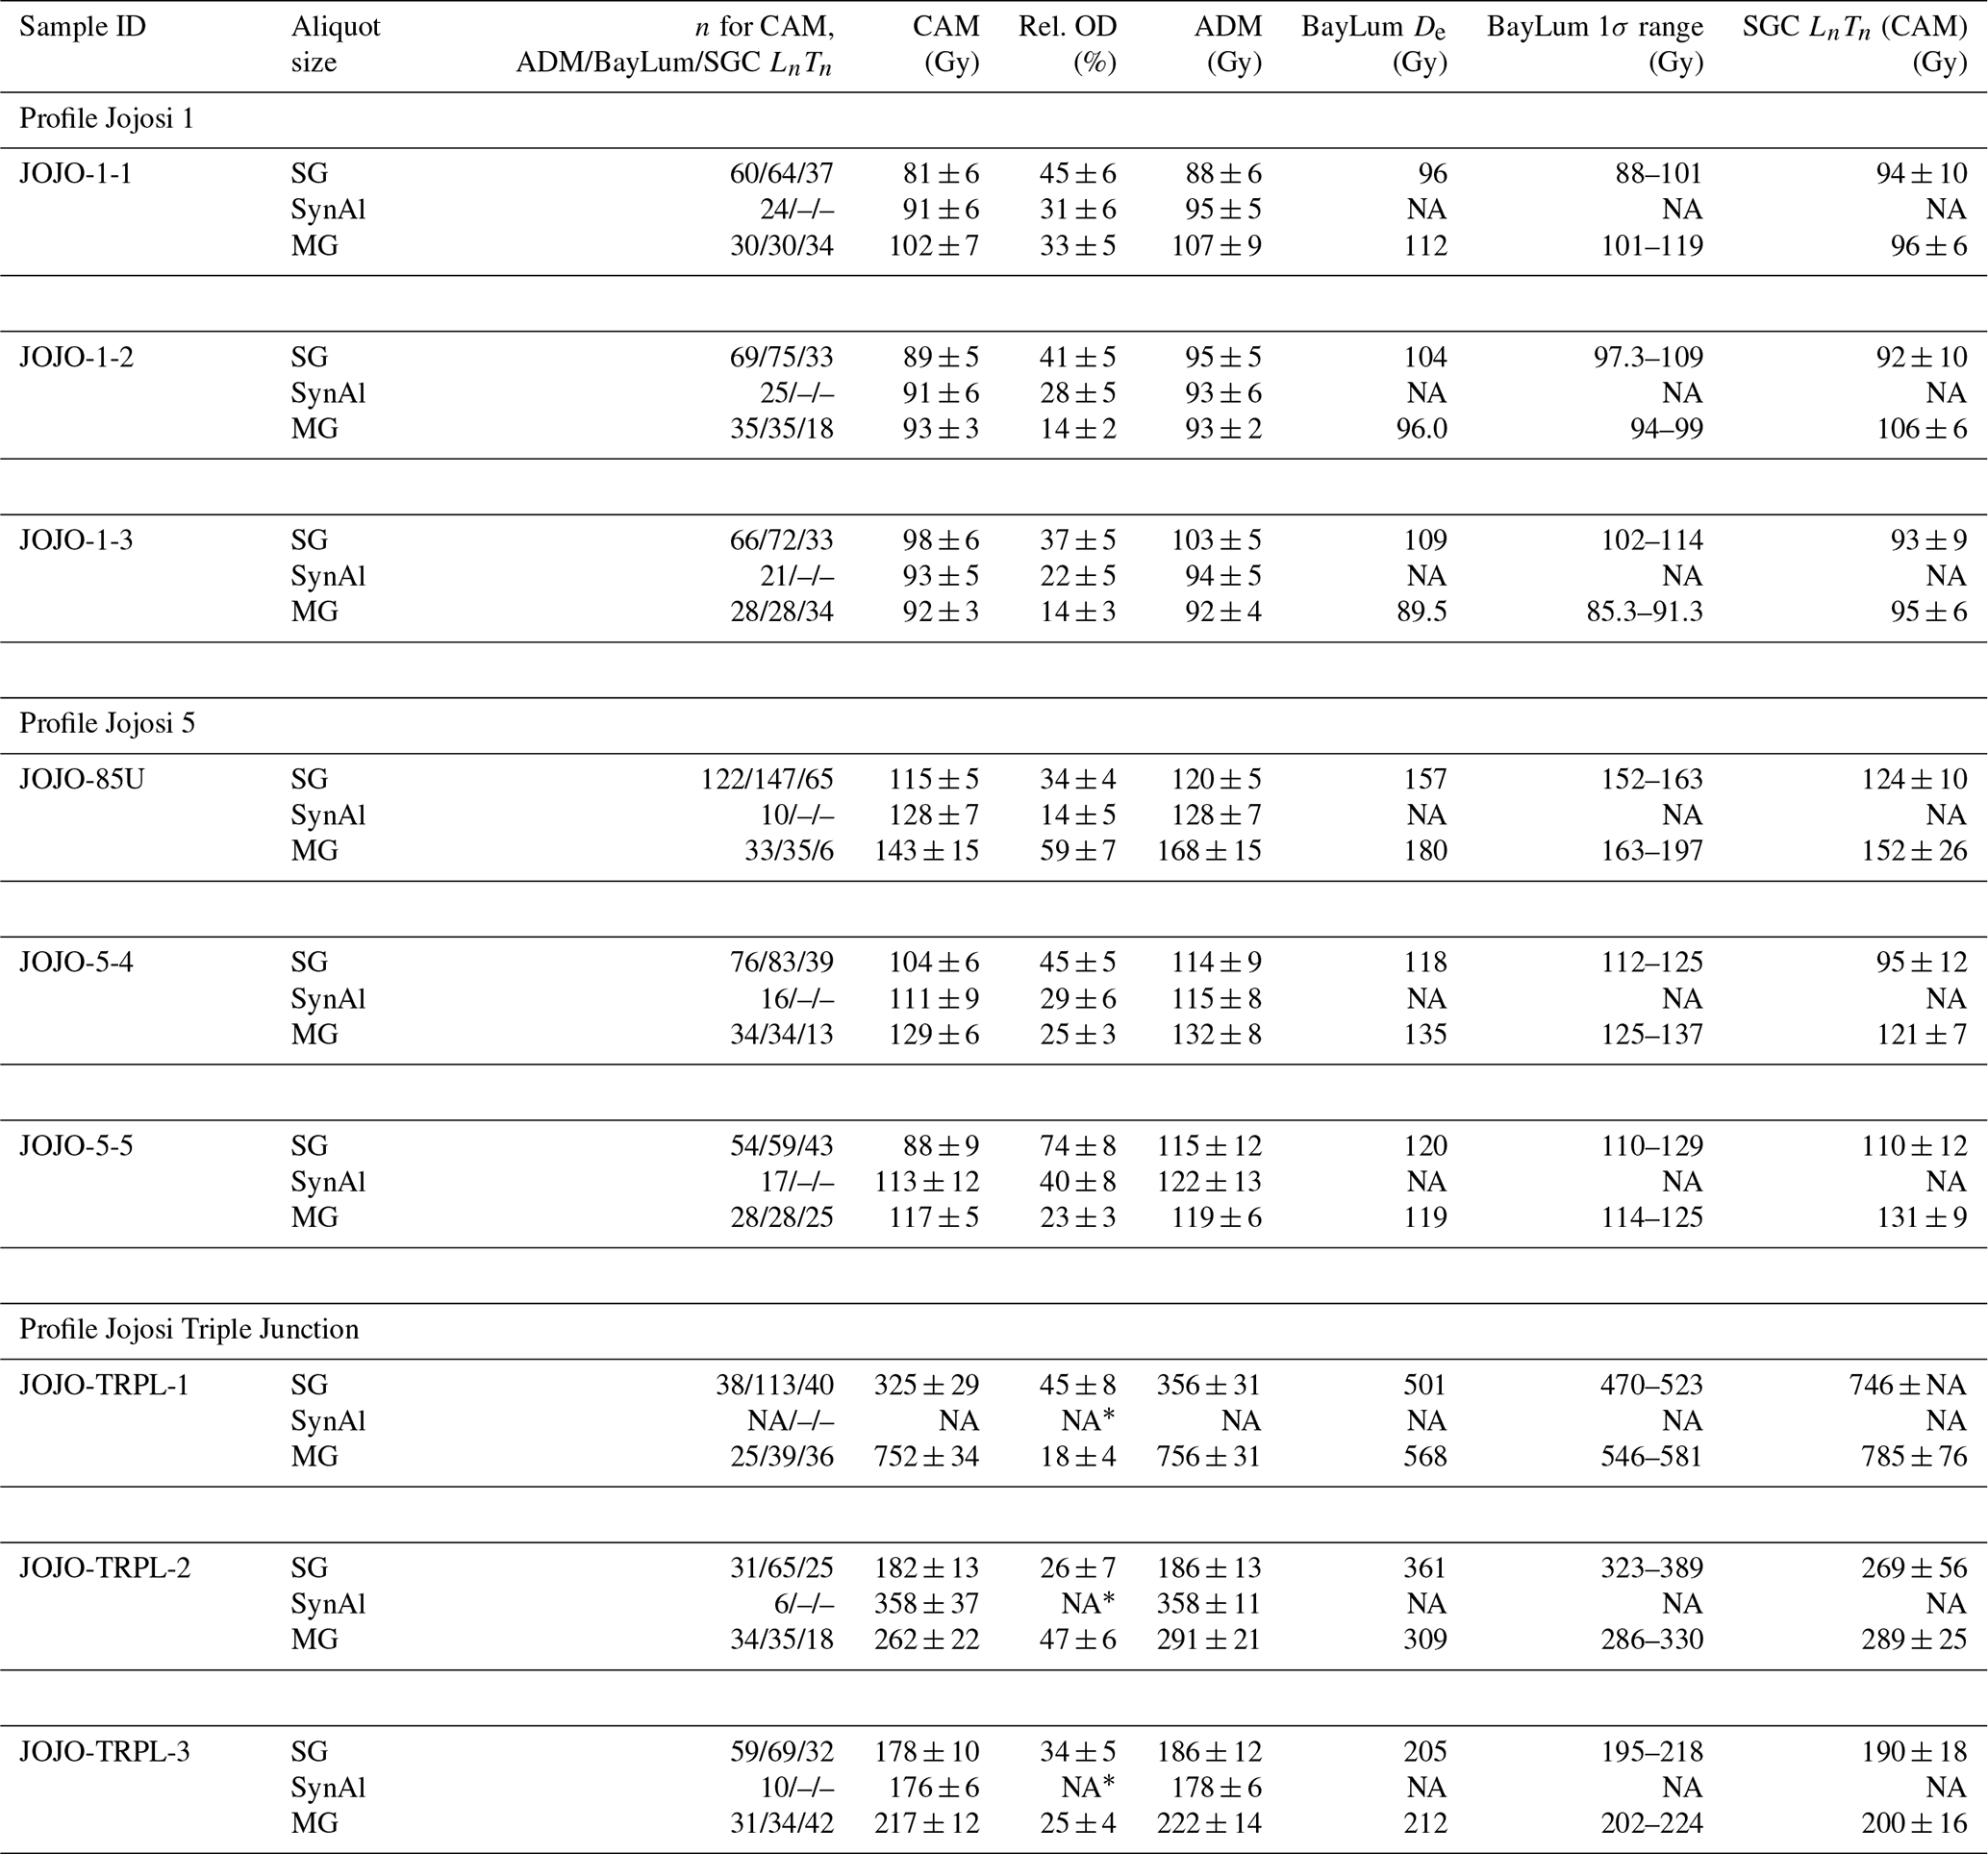
Table 4Results of post-IR IRSL225 De determination and dose modelling for single grains (SG), synthetic aliquots (SynAl), and multi-grain aliquots (MG). OD is overdispersion. * No reliable overdispersion could be calculated using the calc_CentralDose() function in the RLuminescence package due to the low number of accepted finite synthetic aliquots. Besides information on the calculated dose (a confidence interval of 68 % or a credible interval at 68 %), the table also lists relative overdispersion values and the number of grains and multi-grain aliquots, as well as synthetic aliquots included in the calculation (n). Please note that n is mostly smaller for the SGC LnTn approach due to the stricter rejection criteria applied. BayLum could not be applied to the synthetic aliquot data set. This is indicated as NA in the table.
The present study aims at constraining the depositional ages of sediment accretion exposed in the Jojosi dongas. These findings are important, as they provide a robust chronology for further archaeological interpretation of the stratigraphic context of artefacts found at Jojosi and contextualise the geomorphological and palaeoclimatic conditions under which successive phases of gully cut-and-fill occurred, leading to the sheetwash colluvium-palaeosol succession exposed in today's dendritic donga landscape. To ensure the establishment of a robust luminescence-based chronology for Jojosi, the performance of the data sets generated for the post-IR IRSL225 signal is evaluated, including the luminescence signal saturation level, the dose model used for burial dose calculations (Sect. 5.1), and the derived ages (Sect. 5.2).
5.1 Luminescence signal saturation and dose model evaluation
When comparing the single-grain-based data set to the multi-grain data set, two interesting observations can been made. (1) Whilst the post-IR IRSL225 single-grain data sets contains 6 % to 67 % saturated grains (see Table 3, Sect. 4.1), the multi-grain aliquot data sets only show saturated aliquots for four (samples JOJO-85U, JOJO-TRPL-1, JOJO-TRPL-2, JOJO-TRPL-3) out of the nine samples. The number of saturated aliquots is greater in the case of synthetic aliquots than for multi-grain aliquots, with five out of nine samples showing saturated synthetic aliquots. (2) Despite some (systematic) differences, on average, a comparison of burial doses calculated using the different models for single grains, multi-grain aliquots, and synthetic aliquots revealed good agreement between the dose models tested and between the single-grain- and multi-grain-aliquot-based data, except for the two oldest samples, which also show the highest relative number of saturated grains.
Measuring single grains is more time- and labour-consuming, especially for samples with a low yield of luminescent grains, as is the case here in such a scenario. In this case, measuring single grains instead of multi-grain aliquots would only be advantageous if it increased the accuracy and precision of the luminescence ages calculated. The question of whether it is truly necessary to measure single grains has been asked for quartz-based luminescence measurements, and discussions have sprouted from this (see Thomsen et al., 2016; Feathers, 2017; Thomsen et al., 2017). Different studies have evaluated the use of single grains compared to multi-grain aliquots for quartz (e.g. Thomsen et al., 2016; Colarossi et al., 2020) and feldspars (e.g. Sutikna et al., 2016; Guo et al., 2020), respectively. Nevertheless, this remains a challenging discussion, particularly complicated due to site-specific sample characteristics, such as incomplete bleaching or post-depositional mixing (e.g. Jacobs et al., 2008; van der Meij et al., 2025). Furthermore, methodical questions remain, for example, regarding the high scatter in single-grain data sets (e.g. Thomsen et al., 2005; Autzen et al., 2017; Hansen et al., 2018). To investigate why the multi-grain data are less affected by saturation than the single-grain (and the synthetic aliquot) data, we compared the dose response curves of all single grains, multi-grain aliquots, and synthetic aliquots measured, including their D0 values, which are a measure of the curvature of the dose response curve. Wintle and Murray (2006) proposed the use of 2×D0 as a maximum reliability threshold for quartz OSL dating. Although we did not apply this criterion to our data set, comparing D0 values for the different dose response curves of individual multi-grain aliquots and grains can give information on the curvature and thus saturation dose of the different curves. Figure S8a shows the D0 values of the post-IR IRSL225 signal for the three data sets for all nine samples as boxplots, and Fig. S8b shows the fitted dose response curves. In Fig. S8a, it becomes evident that, despite large apparent scatter in D0 values for single-grain dose response curves, D0 tends to be lower for single grains and synthetic aliquots compared to the multi-grain aliquots, with the medians of 200 Gy for single grains (n=742), 185 Gy for synthetic aliquots (n=160), and 266 Gy for multi-grain aliquots (n=263). Similarities in D0 between single grains and synthetic aliquots could arise from the same signals being used for dose response curve construction. In case of synthetic aliquots, the luminescence emitted by single grains (placed in holes on single-grain discs) in response to IR laser stimulation is summed. Contrastingly, the multi-grain aliquot data were obtained by using infrared LEDs, and the multi-grain aliquots were stimulated for 300 s in the case of the post-IR IRSL225 signal (compared to 3 s for single grains). Further explanations could be (i) differences in wavelength and power density of the excitation light sources (classic head: 870 ± 40 nm, ∼ 145 mW cm−2; DASH: 850 ± 33 nm > 300 mW cm−2) and laser stimulation (830 nm, 140 mW), (ii) the contribution of weakly luminescent grains to multi-grain aliquots, and (iii) differences in signal integration and potential effects of this on growth curve shape.
Although we cannot explain the observed differences in D0 values for the different data sets, we identify the difference in D0 for the different data sets as a plausible explanation for the difference in saturated grains and multi-grain aliquots between the different data sets. Higher D0 values, in combination with a greater number of finite values, result in the inclusion of these values (and their finite equivalent doses) in frequentist approaches such as the ADM and CAM; i.e. the average ratio for all samples of single-grain ADM to multi-grain aliquot ADM is 0.83 ± 0.07 (n=9), and it decreases with increasing dose (i.e. the ratio is 0.71 ± 0.07, n=5, when only including samples with multi-grain aliquot doses greater than 120 Gy). However, the BayLum and the SGC LnTn methods include the saturated grains and multi-grain aliquots, thus causing BayLum and SGC LnTn burial doses to be more consistent; i.e. the ratio of single-grain BayLum to multi-grain ADM doses is 0.98 ± 0.06 (n=9), and that of the single-grain SGC LnTn to multi-grain ADM doses is 0.89 ± 0.03 (n=9). Note that, in the case of BayLum, the saturated grains and multi-grain aliquots are not treated as finite values but as an indication of the presence of a population with dose values greater than the maximum asymptote of the dose response curve (Heydari and Guérin, 2018; Arce-Chamorro and Guérin, 2024; see also their supplementary material).
When comparing equivalent doses calculated using frequentist approaches (ADM and CAM) to doses obtained using BayLum (see Fig. 4b), a good agreement was found for most samples investigated in the case of single grains and multi-grain aliquots. However, for some samples in the single-grain data sets, BayLum yields significantly larger doses compared to the ADM. Calculating a ratio of ADM dose and BayLum dose and plotting it against the relative proportion of saturated grains (see Fig. 4d) reveals that the proportion of saturated grains seems to dictate the consistency between the two dose models for the single-grain data set. If less than 15 % of the total grains measured are saturated, then ADM doses underestimate BayLum doses by a maximum of 10 %. However, if more than 15 % of the grains are saturated, then ADM doses underestimate BayLum doses for the respective samples by 25 % to 50 % (see Fig. 4d). More than 15 % saturated grains can be found in samples with ADM doses >120 Gy and BayLum doses >160 Gy. Interestingly, while, for single grains, BayLum doses are consistently higher than ADM doses for samples with more than 15 % saturated grains, for multi-grain aliquots, the only sample showing a deviation between these two models is JOJO-TRPL-1. In the case of this sample, the ADM dose is larger than the BayLum dose (an ADM dose of 756 ± 31 Gy compared to a BayLum dose of 546–581 Gy). A cause of this underestimation of the BayLum dose compared to the ADM dose could be that the model used in BayLum for dose and age calculation (function Model_Age in the R package BayLum; Philippe et al., 2019) is based on quartz data sets and uses a D0 value of 50 Gy as a starting point. As shown in Fig. S8a, multi-grain aliquots of feldspars from Jojosi have a median D0 of 266 Gy, thus much higher than D0 values usually obtained for quartz. This indicates that BayLum might need to be adjusted for its use on high-dose and near-saturation feldspar samples.
When comparing equivalent doses calculated using the ADM and the SGC LnTn method (Fig. 4e), large deviations can be found for single-grain results of the two samples with the highest doses and the largest relative number of saturated grains (JOJO-TRPL-1 and JOJO-TRPL-2), again indicating an effect of the number of saturated grains on the calculated single-grain burial doses. For the multi-grain data set, the SGC ADM ratios fall within the range of the 1:1 line (±10 %) for the two high-dose samples (Fig. 4e, f). Interestingly, two of the samples with doses <200 Gy deviate from the 1:1 line. When applied to single-grain data sets, the SGC LnTn method can constrain higher equivalent doses compared to the frequentist approaches. However, for the multi-grain data set, unexplained deviations from the 1:1 line characterise the results.
5.2 Age calculation and implications
Due to the large number of saturated grains present in some of the samples, we need to include the information they provide in our age calculations. Both BayLum and the SGC LnTn approach allow us to do so, and we have shown that both methods yield consistent results. We chose to base our age calculations on the equivalent doses estimated using BayLum because BayLum allows us to include stratigraphic information and because the SGC LnTn method did not provide bonded dose estimates for all samples. However, we acknowledge that the BayLum dose for JOJO-TRPL-1 may be underestimated.
Table 5Results of age calculations using BayLum for single grains and multi-grain aliquots. The results were obtained using the post-IR IRSL225 protocol.
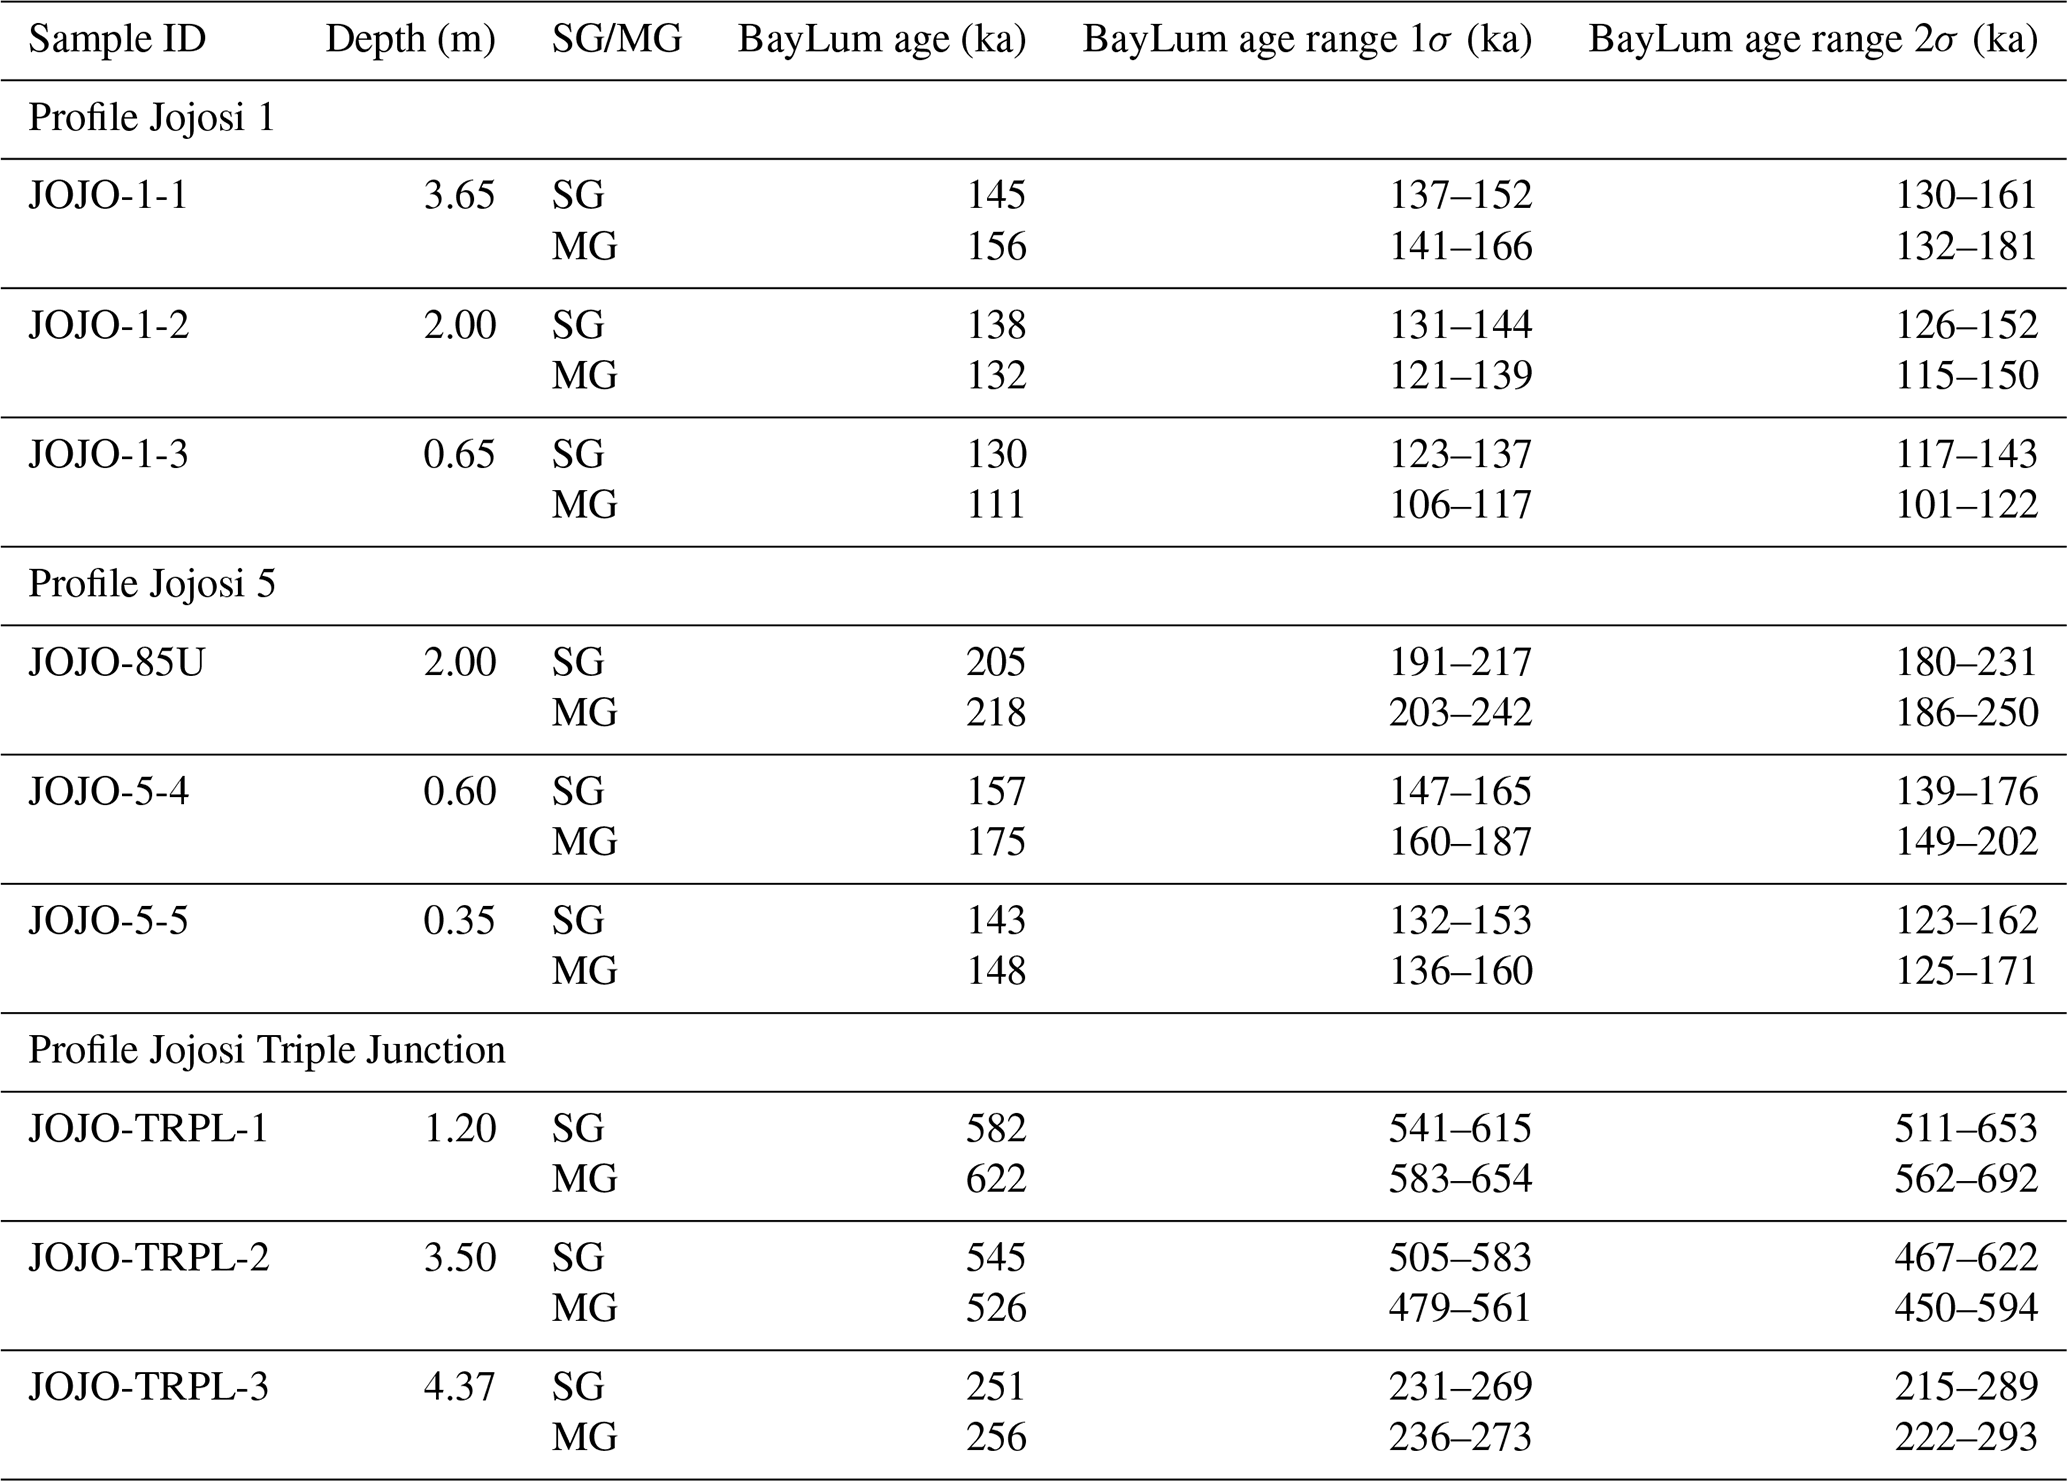
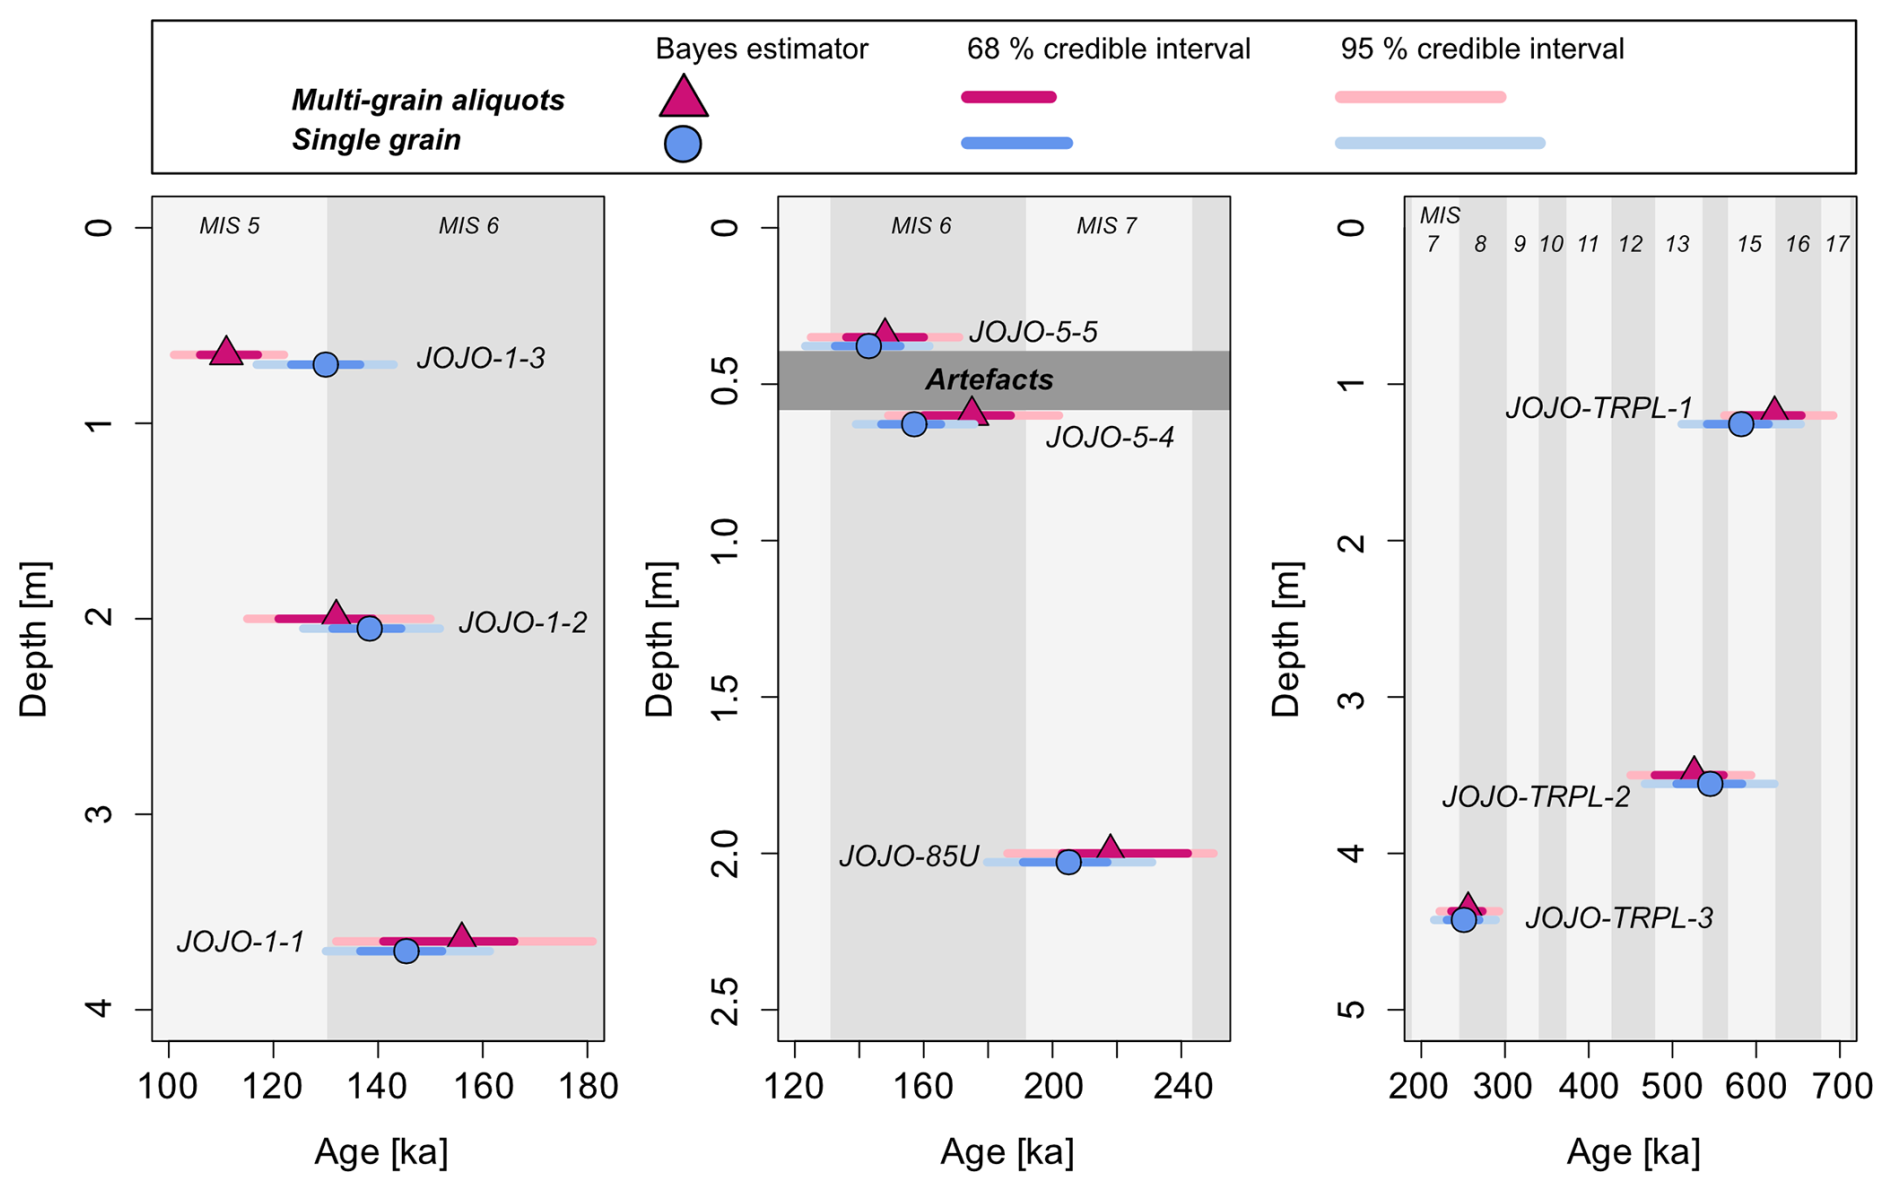
Figure 5Age depth plot of the three sediment profiles measured (profiles Jojosi 1, Jojosi 5, and Jojosi Triple Junction, from left to right). The ages displayed were obtained using BayLum with stratigraphic constraints. Note: JOJO-TRPL is a cut-and-fill profile, meaning that the depth is not meaningful in terms of stratigraphic order; see Fig. 1. The shaded areas indicate marine isotope stages (MISs).
Using BayLum with stratigraphic constraints, we were able to calculate the depositional ages of all nine sediment samples from Jojosi, using both single grains and multi-grain aliquots. The results of the age calculations are given in Table 5 and are displayed as age–depth plots in Fig. 5. Please note that the ages presented here have not been corrected for fading due to their on average low g value of 1.6 ± 0.2 % per decade (n=27) constrained for all samples.
Single-grain and multi-grain aliquots based on post-IR IRSL225 BayLum ages give consistent results within 1σ (68 % credible interval), except for JOJO-1-3, where single-grain and multi-grain aliquot results are consistent within 2σ (95 % credible interval). From a practical point of view, multi-grain measurements are favoured for future work at Jojosi due to greater time efficiency of the measurements, the higher intensity of the luminescence signals, and the larger saturation threshold.
The youngest age, ranging from 106 to 117 ka (1σ, 68 % credible interval), was derived for the multi-grain aliquot data of JOJO-1-3. JOJO-TRPL-1 was identified as the oldest sample with the multi-grain aliquot age range spanning from 583 to 654 ka (1σ). Our post-IR IRSL225 ages show that erosional and depositional processes, leading to donga formation at Jojosi, took place at least from MIS 15 to MIS 5, thus spanning more than 500 000 years of Quaternary history in South Africa.
The post-IR IRSL225 chronology of donga formation is the first of its kind for this area of South Africa, indicating donga formation already during the Middle Pleistocene. Clarke et al. (2003) combined IRSL50 measurements with radiocarbon and found good agreement between these two chronometers, constraining colluvial sedimentation at Voordrag in KwaZulu-Natal over the past 100 ka. There are no older, reliably dated hillslope colluvial or gully infill alluvial deposits in KwaZulu-Natal and, Clarke et al. (2003) interpreted the absence of older donga deposits with a widespread erosional episode during MIS 5e. The Riverton Formation alluvial terrace deposits along the lower Harts, Vaal, Riet, and middle Orange rivers in the Northern Cape province contain Middle and Late Stone Age artefacts that indicate an age in the Late Pleistocene–Holocene range (Claassen, 2018). The eroded alluvium of the Modder River at Erfkroon in the Free State province reveals an ∼ 15 m thick succession in which fossil fauna and archaeological artefact assemblages and palaeosol characteristics, dated using luminescence techniques, indicate sediment accumulation over at least the last 42 ka (Tooth et al., 2013).
Colarossi et al. (2020) used paired quartz and feldspar single-grain and multi-grain dating, revised the chronology of Clarke et al. (2003), and showed that the IRSL50 ages by Clarke et al. (2003) suffered from underestimation due to fading. The chronology of the Voordrag site by Colarossi et al. (2020) shows single-grain quartz and feldspar ages in agreement, up to ∼ 40 ka. Above this threshold, the quartz ages underestimate feldspar ages due to saturation of the quartz OSL signal, but the single-grain post-IR IRSL225 ages constrain donga deposition up to ∼ 110 ka. Similar time spans for colluvial deposition were constrained by Wintle et al. (1993, 1995). These earlier studies used a combination of TL and IRSL measurements, both methods having disadvantages over modern post-IR IRSL measurements (i.e. signal and fading that are hard to bleach ), but, interestingly, these studies also constrained colluvial sedimentation over the Late Pleistocene. The sediments at Jojosi thus seem to be an exception for the preservation of deeply weathered dolerite bedrock saprolite and colluvial sediments older than 100 ka, offering rare insights into the Middle Pleistocene geomorphological processes.
The luminescence ages presented here constrain the temporal context of the buried archaeological sites interbedded within sections Jojosi 1 (excavated during the early 1990s; see Möller et al., 2025) and Jojosi 5 (excavated in 2023; see Will et al., 2024) that was previously unknown. Whilst it is straightforward to bracket the artefact lens in Jojosi 5, due to luminescence sampling taking place at the same time as the archaeological excavation, no exact artefact horizon could be determined and bracketed for Jojosi 1 due to the artefacts having been excavated in the early 1990s. For Jojosi 5, we can constrain modern human activities between 136 to 187 ka (1σ, multi-grain aliquots), so at the end of the Middle Pleistocene and well within MIS 6. Occupations from this period of the Middle Stone Age in South Africa are rare in general and even less common from open-air contexts. For Jojosi 1, although no absolute depth can be obtained, the artefact lens was likely once located between the samples JOJO-1-2 and JOJO-1-3 based on past photographic evidence and site reconnaissance in 2023 and thus to approximately 106 to 139 ka (Möller et al., 2025). Comparing the luminescence ages for the samples bracketing the artefact horizon in Jojosi 1 and Jojosi 5 reveals diachronous human activities associated with discrete sedimentary and gully cut-and-fill contexts at these sites only separated by tens of metres within the Jojosi dongas. The robust chronological framework for Jojosi 1 and 5 provides the necessary basis for further-reaching interpretations on the site function and occupational history of this landscape in conjunction with future analyses of the stone artefacts and sediments. Additional buried archaeological sites have been discovered, and more research, including luminescence dating, will reveal the full chronological extent of past human activities at Jojosi.
This study explored the applicability of different dose models to feldspar single-grain, synthetic aliquot, and multi-grain aliquot data sets for samples with a burial dose ranging from ∼ 80 to ∼ 800 Gy and containing various relative numbers of saturated grains. We applied the Central Age Model (CAM), the Average Dose Model (ADM), BayLum, and a standardised growth curve (SGC) approach using the interpolation of averaged values onto the SGC to the different data sets. We show that the relative number of saturated grains influences the applicability of some of these dose models. CAM and ADM dose models, summarised as frequentist approaches, are unable to include information from saturated grains in their calculation. Excluding these grains biases the data sets. In contrast, BayLum and the CAM SGC LnTn approach allow the inclusion of saturated grains. Despite this, samples with a large number of saturated grains impact the consistency of the results. For single grains, all dose models tested give consistent results within 1 standard error when less than 15 % of the grains are in saturation, corresponding to a dose of ∼ 120 Gy (ADM) in this study.
We used BayLum to derive luminescence ages using single-grain and multi-grain aliquot data sets and by using stratigraphic constraints on the age calculations. In doing so, we were able to establish an internally consistent single-grain- and multi-grain-aliquot-based chronology for the three sampled sections at Jojosi, constraining erosional and depositional processes from ∼ 100 to ∼ 700 ka and placing the human occupation of the area within early MIS 5 and late MIS 6.
The data have been uploaded to Zenodo and are available at https://doi.org/10.5281/zenodo.12759293 (Riedesel et al., 2024).
The supplement related to this article is available online at https://doi.org/10.5194/gchron-7-59-2025-supplement.
SR: conceptualisation, methodology, formal analysis, investigation, visualisation, and writing (original draft). GG: conceptualisation, methodology, investigation, software, and writing (review and editing). KJT: conceptualisation, investigation, and writing (review and editing). MSG: conceptualisation, software, and writing (review and editing). MB: investigation and writing (review and editing). GAB: conceptualisation and writing (review and editing). MH: investigation and writing (review and editing). GM: investigation and writing (review and editing). AP: investigation and writing (review and editing). CS: conceptualisation, investigation, and writing (review and editing). AZ: investigation and writing (review and editing). MW: conceptualisation, resources, funding acquisition, project administration, and writing (review and editing).
The contact author has declared that none of the authors has any competing interests.
Publisher’s note: Copernicus Publications remains neutral with regard to jurisdictional claims made in the text, published maps, institutional affiliations, or any other geographical representation in this paper. While Copernicus Publications makes every effort to include appropriate place names, the final responsibility lies with the authors.
The research at Jojosi is funded by the Deutsche Forschungsgemeinschaft (DFG; grant no. 467042592, awarded to Manuel Will). Svenja Riedesel's research is funded by the European Union's Horizon Europe research and innovation programme (RECREATE; grant no. 101103587). We would like to express our gratitude towards Morena Molefe of Batlokoa Ba Molefe and the Tribal Council for granting us permission to do the research in their traditional authority area and for their ongoing support of our work. We would like to thank Lawrence Msimanga and Hanna Pehnert for their support in the field. Vicki Hansen (Technical University of Denmark) is thanked for her help performing the multi-grain aliquot measurements at Risø. Svenja Riedesel would like to thank Kathrin Jung for preparing the epoxy pucks for electron microprobe analyses and Sebastian Kreutzer (Heidelberg University) for rewriting the BayLum code to help with complications which occurred during data analysis. We would like to thank the two anonymous reviewers and Barbara Mauz (community comment) for providing constructive feedback, which improved the article.
This research has been supported by the Deutsche Forschungsgemeinschaft (grant no. 467042592) and the EU HORIZON EUROPE Marie Skłodowska-Curie Actions (grant no. 101103587).
This open-access publication was funded by Universität zu Köln.
This paper was edited by Julie Durcan and reviewed by two anonymous referees.
Arce-Chamorro, C. and Guérin, G.: Comparison of De values from Late Pleistocene alluvial deposits on the coast of Galicia (NW Spain) using BayLum or Analyst-based procedures, Quat. Geochronol., 82, 101540, https://doi.org/10.1016/j.quageo.2024.101540, 2024.
Arnold, L. J., Roberts, R. G., and Galbraith, R. F., and DeLong, S. B.: A revised burial dose estimation procedure for optical dating of young and modern-age sediments, Quat. Geochronol., 4, 306–325, https://doi.org/10.1016/j.quageo.2009.02.017, 2009.
Auclair, M., Lamothe, M., and Huot, S.: Measurement of anomalous fading for feldspar IRSL using SAR, Radiat. Meas., 37, 487–492, https://doi.org/10.1016/S1350-4487(03)00018-0, 2003.
Autzen, M., Guérin, G., Murray, A. S., Thomsen, K. J., Buylaert, J.-P., and Jain, M.: The effect of backscattering on the beta dose absorbed by individual quartz grains, Radiat. Meas., 106, 491–496, https://doi.org/10.1016/j.radmeas.2017.05.004, 2017.
Bailey, R. M. and Arnold, L. J.: Statistical modelling of single grain quartz De distributions and an assessment of procedures for estimating burial dose, Quat. Sci. Rev., 25, 2475–2502, https://doi.org/10.1016/j.quascirev.2005.09.012, 2006.
Balescu, S. and Lamothe, M.: Thermoluminescence dating of the Holsteinian marine formation of Herzeele, northern France, J. Quat. Sci., 8, 117–124, https://doi.org/10.1002/jqs.3390080204, 1993.
Baril, M. R. and Huntley, D. J.: Infrared stimulated luminescence and phosphorescence spectra of irradiated feldspars, J. Phys.: Condens. Matter, 15, 8029–8048, 2003.
Bell, W. T.: Alpha attenuation in Quartz grains for Thermoluminescence Dating, Ancient TL, 12, 4–8, 1980.
Bøtter-Jensen, L. and Mejdahl, V.: Determination of potassium in feldspars by beta counting using a GM multicounter system, Nucl. Tracks, 10, 663–666, https://doi.org/10.1016/0735-245X(85)90073-0, 1985.
Bøtter-Jensen, L., Andersen, C. E., Duller, G. A. T., and Murray, A. S.: Developments in radiation, stimulation and observation facilities in luminescence measurements, Radiat. Meas., 37, 535–541, https://doi.org/10.1016/S1350-4487(03)00020-9, 2003.
Botha, G. A., Wintle, A. G., and Vogel, J. C.: Episodic late quaternary palaeogully erosion in northern KwaZulu-natal, South Africa, Catena 23, 327–340, https://doi.org/10.1016/0341-8162(94)90076-0, 1994.
Botha, G. A.: The Geoology and Palaeopedology of Late Quaternary Colluvial Sediments in Northern KwaZulu/Natal, Counc. Geosci. Mem. 83, 165 pp., 1996.
Bøtter-Jensen, L., Thomsen, K. J., and Jain, M.: Review of optically stimulated luminescence (OSL) instrumental developments for retrospective dosimetry, Radiat. Meas., 45, 253–257, https://doi.org/10.1016/j.radmeas.2009.11.030, 2010.
Buckland, C. E., Bailey, R. M., and Thomas, D. S. G.: Using post-IR IRSL and OSL to date young (<200 yrs) dryland aeolian dune deposits, Radiat. Meas., 126, 106131, https://doi.org/10.1016/j.radmeas.2019.106131, 2019.
Buylaert, J. P., Murray, A. S., Thomsen, K. J., and Jain, M.: Testing the potential of an elevated temperature IRSL signal from K-feldspar, Radiat. Meas., 44, 560–565, https://doi.org/10.1016/j.radmeas.2009.02.007, 2009.
Buylaert, J.-P., Jain, M., Murray, A. S., Thomsen, K. J., Thiel, C., and Sohbati, R.: A robust feldspar luminescence dating method for Middle and Late Pleistocene sediments, Boreas, 41, 435–451, https://doi.org/10.1111/j.1502-3885.2012.00248.x, 2012.
Buylaert, J. P., Murray, A. S., Gebhardt, A. C., Sohbati, R., Ohlendorf, C., Thiel, C., Westegard, S., Zolitschka, B., and the PASADO Science Team: Luminescence dating of the PASADO core 5022-1D from Laguna Potrok Aike (Argentina) using IRSL signals from feldspar, Quat. Sci. Rev., 71, 70–80, https://doi.org/10.1016/j.quascirev.2013.03.018, 2013.
Chapot, M. S., Duller, G. A. T., and Barham, L. S.: Challenges of dating quartz OSL samples with saturated grains: Lessons from single-grain analyses of low dose-rate samples from Victoria Falls, Zambia, Quat. Geochronol., 72, 101344, https://doi.org/10.1016/j.quageo.2022.101344, 2022.
Claassen, D.: The lithostratigraphy of the Riverton Formation, South Africa, S. Afr. J. Geol., 121.3, 327–335, https://doi.org/10.25131/sajg.121.0028, 2018.
Clarke, M. L.: IRSL dating of sands: Bleaching characteristics at deposition inferred from the use of single aliquots, Radiat. Meas., 26, 611–620, 1996.
Clarke, M. L., Vogel, J. C., Botha, G. A., and Wintle, A. G.: Late Quaternary hillslope evolution recorded in eastern South African colluvial Badlands, Palaeogeogr. Palaeoclimatol. Palaeoecol., 197, 199–212, https://doi.org/10.1016/S0031-0182(03)00461-9, 2003.
Colarossi, D., Duller, G. A. T., Roberts, H. M., Tooth, S., and Lyons, R.: Comparison of paired quartz OSL and feldspar post-IR IRSL dose distributions in poorly bleached fluvial sediments from South Africa, Quat. Geochronol., 30, 233–238, https://doi.org/10.1016/j.quageo.2015.02.015, 2015.
Colarossi, D., Duller, G. A. T., Roberts, H. M., Tooth, S., and Botha, G. A.: A comparison of multiple luminescence chronometers at Voordrag, South Africa, Quat. Geochronol., 60, 101094, https://doi.org/10.1016/j.quageo.2020.101094, 2020.
Duller, G. A. T.: Single-grain optical dating of Quaternary sediments: why aliquot size matters in luminescence dating, Boreas, 37, 589–612, https://doi.org/10.1111/j.1502-3885.2008.00051.x, 2008.
Duller, G. A. T.: The Analyst software package for luminescence data: overview and recent improvements, Ancient TL, 33, 35–42, 2015.
Duller, G. A. T., Bøtter-Jensen, L., and Murray, A. S.: Combining infrared- and green-laser stimulation sources in single-grain luminescence measurements of feldspar and quartz, Radiat. Meas., 37, 543–550, https://doi.org/10.1016/S1350-4487(03)00050-7, 2003.
Durcan, J. A., King, G. E., and Duller, G. A. T.: DRAC: Dose rate and age calculator for trapped charge dating, Quat. Geochronol., 28, 54–61, https://doi.org/10.1016/j.quageo.2015.03.012, 2015.
Feathers, J.: A response to some unwarranted criticism of single-grain dating: Comments on Thomsen et al., Quaternary Geochronology 31 (2016), 77–96, Quat. Geochronol., 37, 108–115, https://doi.org/10.1016/j.quageo.2016.11.005, 2017.
Fuchs, M. and Lang, A.: OSL dating of coarse-grain fluvial quartz using single-aliquot protocols on sediments from NE Peloponnese, Greece, Quat. Sci. Rev., 20, 783–787, 2001.
Galbraith, R. F. and Roberts, R. G.: Statistical aspects of equivalent dose and error calculation and display in OSL dating: An overview and some recommendations, Quat. Geochronol., 11, 1–27, https://doi.org/10.1016/j.quageo.2012.04.020, 2012.
Galbraith, R. F., Roberts, R. G., Laslett, G. M., Yoshida, H., and Olley, J. M.: Optical dating of single and multiple grains of quartz from Jinmium rock shelter, Northern Australia: Part I, experimental design and statistical modelling, Archaeometry, 41, 339–364, 1999.
Gliganic, L. A., Cohen, T. J., Meyer, M., and Molenaar, A.: Variations in luminescence properties of quartz and feldspar from modern fluvial sediments in three rivers, Quat. Geochronol., 41, 70–82, https://doi.org/10.1016/j.quageo.2017.06.005, 2017.
Godfrey-Smith, D. I., Huntley, D. J., and Chen, W.-H.: Optical dating studies of quartz and feldspar sediment extracts, Quat. Sci. Rev., 7, 373–380, 1988.
Govindaraju, K.: 1995 working values with confidence limits for twenty-six CRPG, ANRT and IWG-GIT geostandards, Geostand. Newsl., 19, 1–32, https://doi.org/10.1111/j.1751-908x.1995.tb00164.x, 1995.
Guérin, G., Mercier, N., and Adamiec, G.: Dose-rate conversion factors: update, Ancient TL, 29, 5–8, 2011.
Guérin, G., Mercier, N., Nathan, R., Adamiec, G., and Lefrais, Y.: On the use of the infinite matrix assumption and associated concepts: A critical review, Radiat. Meas., 47, 778–785, https://doi.org/10.1016/j.radmeas.2012.04.004, 2012.
Guérin, G., Jain, M., Thomsen, K. J., Murray, A. S., and Mercier, N.: Modelling dose rate to single grains of quartz in well-sorted sand samples: The dispersion arising from the presence of potassium feldspars and implications for single grain OSL dating, Quat. Geochronol., 27, 52–65, https://doi.org/10.1016/j.quageo.2014.12.006, 2015.
Guérin, G., Christophe, C., Philippe, A., Murray, A. S., Thomsen, K. J., Tribolo, C., Urbanova, P., Jain, M., Guibert, P., Mercier, N., Kreutzer, S., and Lahaye, C.: Absorbed dose, equivalent dose, measured dose rates, and implications for OSL age estimates: Introducing the Average Dose Model, Quat. Geochronol., 41, 163–173, https://doi.org/10.1016/j.quageo.2017.04.002, 2017.
Guo, Y., Li, B., and Zhao, H.: Comparison of single-aliquot and single-grain MET-pIRIR De results for potassium feldspar samples from the Nihewan Basin, northern China, Quat. Geochronol., 56, 101040, https://doi.org/10.1016/j.quageo.2019.101040, 2020.
Hansen, V., Murray, A. S., Thomsen, K., Jain, M., Autzen, M., and Buylaert, J.-P.: Towards the origins of over-dispersion in beta source calibration, Radiat. Meas., 120, 157–162, https://doi.org/10.1016/j.radmeas.2018.05.014, 2018.
Heydari, M. and Guérin, G.: OSL signal saturation and dose rate variability: Investigating the behaviour of different statistical models, Radiat. Meas., 120, 96–103, https://doi.org/10.1016/j.radmeas.2018.05.005, 2018.
Huntley, D. J.: An explanation of the power-law decay of luminescence, J. Phys.: Condensed Matter, 18, 1359, https://doi.org/10.1088/0953-8984/18/4/020, 2006.
Huntley, D. J. and Lamothe, M.: Ubiquity of anomalous fading in K-feldspars and the measurement and correction for it in optical dating, Can. J. Earth Sci., 38, 1093–1106, https://doi.org/10.1139/cjes-38-7-1093, 2001.
Huntley, D. J., Godfrey-Smith, D. I., and Thewalt, M. L. W.: Optical dating of sediments, Nature, 313, 105–107, 1985.
Huntley, D. J., Godfrey-Smith, D. I., and Haskell, E. H.: Light-induced emission spectra from some quartz and feldspars, Nucl. Tracks Radiat. Meas., 18, 127–131, 1991.
Jacobs, Z., Wintle, A. G., Roberts, R. G., and Duller, G. A. T.: Equivalent dose distributions from single grains of quartz at Sibudu, South Africa: context, causes and consequences for optical dating of archaeological deposits, J. Archaeol. Sci., 35, 1808–1820, https://doi.org/10.1016/j.jas.2007.11.027, 2008.
Jankowski, N. and Jacobs, Z.: Beta dose variability and its spatial contextualisation in samples used for optical dating: An empirical approach to examining beta microdosimetry, Quat. Geochronol., 44, 23–37, https://doi.org/10.1016/j.quageo.2017.08.005, 2018.
Kars, R. H., Wallinga, J., and Cohen, K. M.,: A new approach towards anomalous fading correction for feldspar IRSL dating – tests on samples in field saturation, Radiat. Meas., 43, 786–790, 2008.
Lamothe, M., Barré, M., Huot, S., and Ouimet, S.: Natural luminescence and anomalous fading in K-feldspar, Radiat. Meas., 47, 682–687, https://doi.org/10.1016/j.radmeas.2012.04.018, 2012.
Lapp, T., Jain, M., Thomsen, K. J., Murray, A. S., and Buylaert, J.-P.: New luminescence measurement facilities in retrospective dosimetry, Radiat. Meas., 47, 803–808, https://doi.org/10.1016/j.radmeas.2012.02.006, 2012.
Li, B. and Li, S.-H.: Luminescence dating of K-feldspar from sediment: A protocol without anomalous fading correction, Quat. Geochronol., 6, 468–479, https://doi.org/10.1016/j.quageo.2011.05.001, 2011.
Li, B., Li, S.-H., Duller, G. A. T., and Wintle, A. G.: Infrared stimulated luminescence of single grains of K-rich feldspar, Quat. Geochronol., 6, 71–81, https://doi.org/10.1016/j.quageo.2010.02.003, 2011.
Li, B., Roberts, R. G., Jacobs, Z., and Li, S.-H.: Potential of establishing a `global standardised growth curve' (gSGC) for optical dating of quartz from sediments, Quat. Geochronol., 27, 94–104, https://doi.org/10.1016/j.quageo.2015.02.011, 2015a.
Li, B., Roberts, R. G., Jacobs, Z., Li, S.-H., and Guo, Y.-J.: Construction of a `global standardised growth curve' (gSGC) for infrared stimulated luminescence dating of K-feldspar, Quat. Geochronol., 27, 119–130, https://doi.org/10.1016/j.quageo.2015.02.010, 2015b.
Li, B., Jacobs, Z., Roberts, R. G., Galbraith, R., and Peng, J.: Variability in quartz OSL signals caused by measurement uncertainties: problems and solutions, Quat. Geochronol., 41, 11–25, https://doi.org/10.1016/j.quageo.2017.05.006, 2017.
Li, B., Jacobs, Z., Roberts, R. G., and Li, S.-H.: Single-grain dating of potassium-rich feldspar grains: Towards a global standardised growth curve for the post-IR IRSL signal, Quat. Geochronol., 45, 23–36, https://doi.org/10.1016/j.quageo.2018.02.001, 2018.
Li, B., Jacobs, Z., and Roberts, R. G.,: Validation of the LnTn method for De determination in optical darting of K-feldspar and quartz, Quat. Geochronol., 58, 101066, https://doi.org/10.1016/j.quageo.2020.101066, 2020.
Li, B., Jacobs, Z., Sontag-Gonzalez, M., and O'Gorman, K.: A Bayesian hierarchical age model for single-grain optical dating of feldspars, Quat. Geochronol., 81, 101515, https://doi.org/10.1016/j.quageo.2024.101515, 2024.
Li, S.-H.: Development and application of stimulated luminescence dating methods for sediments, unpublished PhD thesis, University of Wales, Aberystwyth, 171 pp., 1992.
Li, S.-H. and Wintle, A. G.: Luminescence sensitivity change due to bleaching of sediments, Nucl. Tracks Radiat. Meas., 20, 567–573, 1992.
Lyons, R., Tooth, S., and Duller, G. A. T.: Chronology and controls of donga (gully) formation in the upper Blood River catchment, KwaZulu-Natal, South Africa: Evidence for a climatic driver of erosion, The Holocene 23, 1875–1887, https://doi.org/10.1177/0959683613508157, 2013.
Mararakanye, N. and Le Roux, J. J.: Gully location mapping at a national scale for South Africa, S. Afr. Geogr. J., 94, 208–218, https://doi.org/10.1080/03736245.2012.742786, 2012.
Maßon, L. A. E., Riedesel, S., Zander, A., Sontag-González, M., and Reimann, T.: Testing the applicability of standardised growth curves (SGC) for chemically heterogeneous single-grain feldspars from the Atacama Desert, Chile, Quat. Geochronol., 83, 101585, https://doi.org/10.1016/j.quageo.2024.101585, 2024.
Mineli, T. D., Sawakuchi, A. O., Guralnik, B., Lambert, R., Jain, M., Pupim, F. N., del Rio, I., Guedes, C. C. F., and Nogueira, L.: Variation of luminescence sensitivity, characteristic dose and trap parameters of quartz from rocks and sediments, Radiat. Meas., 144, 106583, https://doi.org/10.1016/j.radmeas.2021.106583, 2021.
Möller, G. H., Mazel, A. D., Sommer, C., Botha, G. A., Conard, N. J., Riedesel, S., and Will, M.: Revisited and revalorized: Technological and refitting studies at the Middle Stone Age open-air knapping site Jojosi 1 (KwaZulu-Natal, 85 South Africa), Journal of Paleolithic Archaeology 8, 5, https://doi.org/10.1007/s41982-024-00205-y, 2025.
Murray, A. S. and Wintle, A. G.: Luminescence dating of quartz using an improved single-aliquot regenerative-dose protocol, Radiat. Meas., 32, 57–73, https://doi.org/10.1016/S1350-4487(99)00253-X, 2000.
Murray, A. S., Thomsen, K. J., Masuda, N., Buylaert, J. P., and Jain, M.: Identifying well-bleached quartz using the different bleaching rates of quartz and feldspar luminescence signals, Radiat. Meas., 47, 688–695, https://doi.org/10.1016/j.radmeas.2012.05.006, 2012.
Murray, A. S., Helsted, L. M., Autzen, M., Jain, M., and Buylaert, J. P.: Measurement of natural radioactivity: Calibration and performance of a high-resolution gamma spectrometer facility, Radiat. Meas., 120, 215–220, https://doi.org/10.1016/j.radmeas.2018.04.006, 2018.
Murray, A. S., Arnold, L., Buylaert, J.-P., Guérin, G., Qin, J., Singhvi, A. K., Smedley, R., and Thomsen, K. J.: Optically stimulated luminescence dating using quartz, Nature Reviews Methods Primers, 1, 72, https://doi.org/10.1038/s43586-021-00068-5, 2021.
Nathan, R. P., Thomas, P. J., Jain, M., Murray, A. S., and Rhodes, E. J.: Environmental dose rate heterogeneity of beta radiation and its implications for luminescence dating. Monte Carlo modelling and experimental validation, Radiat. Meas., 37, 305–313, https://doi.org/10.1016/S1350-4487(03)00008-8, 2003.
Olivier, G., van de Wiel, M. J., and Clercq, W. P.: Intersecting views of gully erosion in South Africa, Earth Surf. Proc. Land., 48, 119–142, https://doi.org/10.1002/esp.5525, 2023.
Philippe, A., Guerin, G., and Kreutzer, S.: BayLum – An R package for Bayesian analysis of OSL ages: An introduction, Quat. Geochronol., 49, 16–24, https://doi.org/10.1016/j.quageo.2018.05.009, 2019.
Poesen, J., Nachtergaele, J., and Verstraeten, G., and Valentin, C.: Gully erosion and environmental change: Importance and research needs, Catena, 50, 91–133, https://doi.org/10.1016/S0341-8162(02)00143-1, 2003.
Prescott, J. R. and Hutton, J. T.: Cosmic ray contributions to dose rates for luminescence and ESR dating: Large depths and long-term time variations, Radiat. Meas., 23, 497–500, https://doi.org/10.1016/1350-4487(94)90086-8, 1994.
Preusser, F. and Kasper, H. U.: Comparison of dose rate determination using high-resolution gamma spectrometry and inductively coupled plasma-mass spectrometry, Ancient TL, 19, 19–23, 2001.
Reimann, T., Thomsen, K. J., Jain, M., Murray, A. S., and Frechen, M.: Single-grain dating of young sediments using the pIRIR signal from feldspar, Quat. Geochronol., 11, 28–41, https://doi.org/10.1016/j.quageo.2012.04.016, 2012.
Rhodes, E.: Quartz Single Grain OSL Sensitivity Distributions: Implications for Multiple Grain Single Aliquot Dating, Geochronometria 26, 19–29, https://doi.org/10.2478/v10003-007-0002-5, 2007.
Riedesel, S., Brill, D., Roberts, H. M., Duller, G. A. T., Garrett, E., Zander, A. M., King, G. E., Tamura, T., Burow, C., Cunningham, A., Seeliger, M., De Batist, M., Heyvaert, V. M. A., Fujiwara, O., Brückner, H., and the QuakeRecNankai Team: Single-grain luminescence chronology of historical extreme-wave event deposits recorded in a coastal lowland, Pacific coast of central Japan, Quat. Geochronol., 45, 37–49, https://doi.org/10.1016/j.quageo.2018.01.006, 2018.
Riedesel, S., Autzen, M., and Burow, C.: scale_GammaDose(): Calculate the gamma dose deposited within a sample taking layer-to-layer variations in radioactivity into account (according to Aitken, 1985). Function version 0.1.2, in: Luminescence: Comprehensive Luminescence Dating Data Analysis, R package version 0.9.22, edited by: Kreutzer, S., Burow, C., Dietze, M., Fuchs, M. C., Schmidt, C., Fischer, M., Friedrich, J., Mercier, N., Philippe, A., Riedesel, S., Autzen, M., Mittelstrass, D., Gray, H. J., and Galharret, J., https://CRAN.R-project.org/package=Luminescence (last access: 16 May 2024), 2024.
Riedesel, S., Guérin, G., Thomsen, K. J., Sontag-González, M., Blessing, M. A., Botha, G. A., Heller, M., Möller, G. H., Peffeköver, A., Sommer, C., Zander, A. M., and Will, M.: A direct comparison of single grain and multi-grain aliquot measurements of feldspars from colluvial deposits in KwaZulu-Natal, South Africa, Zenodo [data set], https://doi.org/10.5281/zenodo.12759293, 2024.
Roberts, H. M.: Testing post-IR IRSL protocols for minimising fading in feldspars, using Alaskan loess with independent chronological control, Radiat. Meas., 47, 716–724, https://doi.org/10.1016/j.radmeas.2012.03.022, 2012.
Roberts, H. M. and Duller, G. A. T.: Standardised growth curves for optical dating of sediments using multiple-grain aliquots, Radiat. Meas., 38, 241–252, https://doi.org/10.1016/j.radmeas.2003.10.001, 2004.
Sawakuchi, A. O., Jain, M., Mineli, T. D., Nogueira, L., Bertassoli, D. J., Häggi, C., Sawakuchi, H. O., Pupmin, F. N., Grohmann, C. H., Chiessi, C. M., Zable, M., Mulitza, S., Mazoca, C. E. M., and Cunha, D. F.: Luminescence of quartz and feldspar fingerprints provenance and correlates with the source area denudation in the Amazon River basin, Earth Planet. Sci. Lett., 492, 152–162, https://doi.org/10.1016/j.epsl.2018.04.006, 2018.
Singh, A., Thomsen, K. J., Sinha, R., Buylaert, J.-P., Carter, A., Mark, D. F., Mason, P. J., Densmore, A. L., Murray, A. S., Jain, M., Paul, D., and Gupta, S.: Counter-intuitive influence of Himalayan river morphodynamics on Indus Civilisation urban settlements, Nat. Commun., 8, 1617, https://doi.org/10.1038/s41467-017-01643-9, 2017.
Smedley, R. K., Duller, G. A. T., Rufer, D., and Utley, J. E. P.: Empirical assessment of beta dose heterogeneity in sediments: Implications for luminescence dating, Quat. Geochronol., 56, 10152, https://doi.org/10.1016/j.quageo.2020.101052, 2020.
Spooner, N. A.: The anomalous fading of infrared-stimulated luminescence rom feldspars, Radiat. Meas., 23, 625–632, 1994.
Sutikna, T., Tocheri, M. W., Morwood, M. J., Saptomo, E. W., Jatmiko, Awe, R. D., Wasisto, S., Westaway, K. E., Aubert, M., Li, B., Zhao, J.-X., Storey, M., Alloway, B. V., Morley, M. W., Meijer, H. J. M., van den Bergh, G. D., Grün, R., Dosseto, A., Brumm, A., Jungers, W. L., and Roberts, R. G.: Revised stratigraphy and chronology for Homo floresiensis at Liang Bua in Indonesia, Nature, 532, 366–369, https://doi.org/10.1038/nature17179, 2016.
Temme, A. J. A. M., Baartman, J. E. M., Botha, G. A., Jongmans, A. G., and Wallinga, J.: Climate controls on late Pleistocene evolution of the Pkhombe valley, KwaZulu-Natal, South Africa, Geomorphology, 99, 280–295, https://doi.org/10.1016/j.geomorph.2007.11.006, 2008.
Thomsen, K. J., Murray, A. S., and Bøtter-Jensen, L.: Sources of variability in OSL dose measurements using single grains of quartz, Radiat. Meas., 39, 47–61, https://doi.org/10.1016/j.radmeas.2004.01.039, 2005.
Thomsen, K. J., Murray, A. S., Jain, M., and Bøtter-Jensen, L.: Laboratory fading rates of various luminescence signals from feldspar-rich sediment extracts, Radiat. Meas., 43, 1474–1486, https://doi.org/10.1016/j.radmeas.2008.06.002, 2008.
Thomsen, K. J., Murray, A. S., Buylaert, J.-P., Jain, M., Hansen, J. H., and Aubry, T.: Testing single-grain quartz OSL methods using sediment samples with independent age control from the Bordes-Fitte rockshelter (Roches d'Abilly site, Central France), Quat. Geochronol., 31, 77–96, https://doi.org/10.1016/j.quageo.2015.11.002, 2016.
Thomsen, K. J., Murray, A. S., Buylaert, J.-P., Jain, M., Hansen, J. H., Aubry, T., and Guérin, G.: Reply to: “A response to some unwarranted criticisms of single-grain dating” by J. K. Feathers, Quat. Geochronol., 37, 8–14, https://doi.org/10.1016/j.quageo.2016.10.007, 2017.
Tooth, S., Hancox, J. P., Brandt, D., McCarthy, T. S., Jacobs, Z., and Woodborne, S.: Controls On the Genesis, Sedimentary Architecture, and Preservation Potential of Dryland Alluvial Successions In Stable Continental Interiors: Insights from the Incising Modder River, South Africa, J. Sediment. Res., 83, 541–561, 2013.
van der Meij, W. M., Riedesel, S., and Reimann, T.: Mixed Signals: interpreting mixing patterns of different soil bioturbation processes through luminescence and numerical modelling, SOIL, 11, 51–66, https://doi.org/10.5194/soil-11-51-2025, 2025.
Will, M., Blessing, M., Möller, G. H. D., Msimanga, L., Pehnert, H., Riedesel, S., Botha, G. A., and Sommer, C.: The Jojosi dongas: An interdisciplinary project to study the evolution of human behavior and landscapes in open-air contexts, S. Afr. Field Archaeol., 19, 3010, https://doi.org/10.36615/safa.19.3010.2024, 2024.
Wintle, A. G.: Anomalous fading of thermoluminescence in mineral samples, Nature, 245, 143–144, 1973.
Wintle, A. G. and Murray, A. S.: A review of quartz optically stimulated luminescence characteristics and their relevance in single-aliquot regeneration dating protocols, Radiat. Meas., 41, 369–391, https://doi.org/10.1016/j.radmeas.2005.11.001, 2006.
Wintle, A. G., Li, S.-H., and Botha, G. A.: Luminescence dating of colluvial deposits from Natal, South Africa, S. Afr. J. Sci., 89, 77–82, 1993.
Wintle, A. G., Botha, G. A., Li, S.-H., and Vogel, J. C.: A chronological framework for colluviation during the last 110 kyr in KwaZulu/Natal, S. Afr. J. Sci., 91, 134–139, 1995.